controllable atomistic graphene oxide model and its application in hydrogen sulfide removal
TRANSCRIPT

Controllable atomistic graphene oxide model and its application in hydrogen sulfideremovalLiangliang Huang, Mykola Seredych, Teresa J. Bandosz, Adri C. T. van Duin, Xiaohua Lu, and Keith E. Gubbins Citation: The Journal of Chemical Physics 139, 194707 (2013); doi: 10.1063/1.4832039 View online: http://dx.doi.org/10.1063/1.4832039 View Table of Contents: http://scitation.aip.org/content/aip/journal/jcp/139/19?ver=pdfcov Published by the AIP Publishing
This article is copyrighted as indicated in the article. Reuse of AIP content is subject to the terms at: http://scitation.aip.org/termsconditions. Downloaded to IP:
134.99.128.41 On: Mon, 23 Dec 2013 12:00:17
THE JOURNAL OF CHEMICAL PHYSICS 139, 194707 (2013)
Controllable atomistic graphene oxide model and its applicationin hydrogen sulfide removal
Liangliang Huang,1 Mykola Seredych,2 Teresa J. Bandosz,2 Adri C. T. van Duin,3
Xiaohua Lu,4 and Keith E. Gubbins1,a)
1Department of Chemical and Biomolecular Engineering, North Carolina State University,Raleigh, North Carolina 27695, USA2Department of Chemistry, The City College of New York and the Graduate School of the City Universityof New York, New York 10031, USA3Department of Mechanical and Nuclear Engineering, Pennsylvania State University,University Park, Pennsylvania 16801, USA4State Key Laboratory of Materials-Oriented Chemical Engineering, Nanjing University of Technology,Nanjing 210009, China
(Received 13 July 2013; accepted 4 November 2013; published online 21 November 2013)
The determination of an atomistic graphene oxide (GO) model has been challenging due to the struc-tural dependence on different synthesis methods. In this work we combine temperature-programmedmolecular dynamics simulation techniques and the ReaxFF reactive force field to generate realisticatomistic GO structures. By grafting a mixture of epoxy and hydroxyl groups to the basal graphenesurface and fine-tuning their initial concentrations, we produce in a controllable manner the GOstructures with different functional groups and defects. The models agree with structural experimen-tal data and with other ab initio quantum calculations. Using the generated atomistic models, weperform reactive adsorption calculations for H2S and H2O/H2S mixtures on GO materials and com-pare the results with experiment. We find that H2S molecules dissociate on the carbonyl functionalgroups, and H2O, CO2, and CO molecules are released as reaction products from the GO surface.The calculation reveals that for the H2O/H2S mixtures, H2O molecules are preferentially adsorbed tothe carbonyl sites and block the potential active sites for H2S decomposition. The calculation agreeswell with the experiments. The methodology and the procedure applied in this work open a new doorto the theoretical studies of GO and can be extended to the research on other amorphous materials.© 2013 AIP Publishing LLC. [http://dx.doi.org/10.1063/1.4832039]
I. INTRODUCTION
Graphene oxide (GO) has attracted much researchinterest. It exhibits exceptional electrochemical, mechan-ical, and optoelectronic properties, which makes it apromising candidate in batteries,1–3 field-effect transistors,4
nanocomposites,5, 6 biomedical,7, 8 and drug deliveryapplications.9 It is also known that GO possesses potentialas a catalyst.10, 11 For example, GO is reported to displaya very high turnover frequency in Suzuki-Miyaura cou-pling reactions when it is impregnated with palladiumnanoparticles.12 Bielawski and co-workers report using GOas a heterogeneous catalyst to oxidize benzyl alcohol intobenzoic acid.13 Bandosz and co-workers have performeddynamic adsorption experiments to study dissociations ofammonia,14 hydrogen sulfide,15 and nitrogen dioxide16 onoxygen-containing functional groups on GO materials.
Despite the experimental efforts, the potential of GO hasnot yet been extensively explored by molecular modeling.This is mainly due to the lack of an atomistic GO modelfor theoretical calculations. Formed by treating graphene withvery strong oxidizing agents (e.g., KClO3/HNO3), the chem-istry of GO depends strongly on the synthesis process and
a)Author to whom correspondence should be addressed. Electronic mail:[email protected]
the level of oxidation. As a result, the amorphous featureof GO structure imposes challenges in determining a uniqueatomic model. Considerable efforts have been undertaken inthe past decade to determine atomistic GO structures. Dif-ferent models have been proposed and have gained successto some extent in explaining experimental and theoreticalobservations.17–21 The understanding of GO structures in-cludes the possible functional groups and the range of theirconcentrations. For instance, it is accepted that the hydroxyland epoxy groups are distributed on the basal plane, whilethe carboxyl and alkyl groups are normally located at theedges.17 The existences of Stone-Wales defects, adatoms, andvacancy defects have also been identified on GO.20, 22 Despitethese findings, other key information, such as the combina-tion of the type, concentration and the distribution of func-tional groups with respect to a specific GO synthesis method,remains unclear. Previous theoretical studies of GO usuallyfocus on the local structure where only one or two types offunctional groups are considered and a handful of basal car-bon atoms are investigated. This is inadequate to understandthe structure-property relationship of GO and can hinder thedesign and optimization of GO material towards different ap-plications.
In this work we report the controllable generation ofatomistic GO models by a temperature-programmed reactive
0021-9606/2013/139(19)/194707/9/$30.00 © 2013 AIP Publishing LLC139, 194707-1
This article is copyrighted as indicated in the article. Reuse of AIP content is subject to the terms at: http://scitation.aip.org/termsconditions. Downloaded to IP:
134.99.128.41 On: Mon, 23 Dec 2013 12:00:17
194707-2 Huang et al. J. Chem. Phys. 139, 194707 (2013)
molecular dynamics (RMD) simulation. A pristine graphenestructure is randomly functionalized by a mixture of epoxyand hydroxyl groups. By controlling the density (the frac-tion of functionalized basal carbon atoms) and the ratio ofepoxy/hydroxyl groups, we generate realistic GO models withdifferent functional groups and different concentrations. Wenote that the motivation of this work is not to mimic the exper-imental synthesis conditions and thus generate the GO struc-tures, but to provide a general routine to generate a realisticatomistic GO model, with a proper carbon/oxygen ratio, ge-ometric curvatures, defects and oxygen-containing functionalgroups. We further calculate hydrogen sulfide and H2O/H2Smixture adsorption on the as-generated atomistic GO struc-tures and compare the simulation results with the availableexperimental data.
The paper is organized as follows: Sec. II contains a briefintroduction to the ReaxFF reactive force field, the prepara-tion of initial GO models and the calculation setup, and thedynamic adsorption experiment setup. In Sec. III, we dis-cuss the structural evolution of GO models at different tem-peratures and the effects of using different concentrations ofepoxy/hydroxyl functional groups. Having obtained the atom-istic GO structures, we report the temperature-programmedRMD simulations to calculate the reactive adsorption of H2Sand H2S/H2O mixtures on the GO structures at ambient con-dition. The conclusion is finally provided.
II. METHODS
A. ReaxFF reactive force field
ReaxFF is a first principles-based general bond-order de-pendent force field that provides a description of bond break-ing and bond forming. The fundamental difference betweenReaxFF and other force fields is that ReaxFF does not needany connectivity input for the chemical bonds, but instead cal-culates the bond order directly from instantaneous interatomicdistances which are updated continuously. Other features ofReaxFF have been summarized both in publications23–29 andon the website of one of the authors.30 We also provide inthe supplementary material a brief overview of the develop-ment and the implementation of ReaxFF into other simulationpackages. The ReaxFF used in this work has been appliedin the study of both graphene oxide and graphite oxide ma-terials. For example, it has been demonstrated that, throughan annealing process of GO, hydroxyl and epoxy groups onGO can be transformed into carbonyl, ether, pyran, furan, andother oxygen-containing groups as well as vacancies and car-bon ring defects.31 The full set of ReaxFF parameters is pro-vided in the supplementary material.32 The development ofthe parameters28, 29 and other force field development detailsare available from publications.23–27
B. The initial GO model
We use a 4.3 nm × 4 nm zigzag graphene sheet as thebasal surface of GO, and apply a Monte Carlo algorithm torandomly attach epoxy and hydroxyl groups to both sides ofthe graphene sheet. A geometry overlap criterion of 3.0 Å is
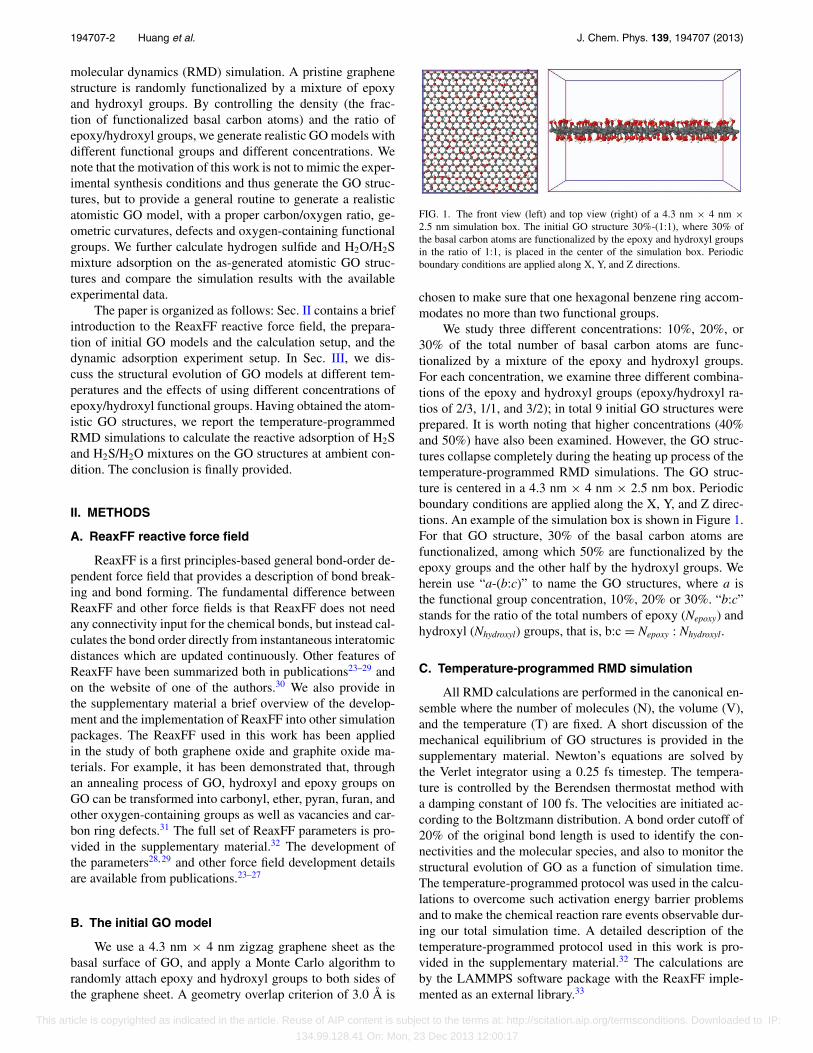
FIG. 1. The front view (left) and top view (right) of a 4.3 nm × 4 nm ×2.5 nm simulation box. The initial GO structure 30%-(1:1), where 30% ofthe basal carbon atoms are functionalized by the epoxy and hydroxyl groupsin the ratio of 1:1, is placed in the center of the simulation box. Periodicboundary conditions are applied along X, Y, and Z directions.
chosen to make sure that one hexagonal benzene ring accom-modates no more than two functional groups.
We study three different concentrations: 10%, 20%, or30% of the total number of basal carbon atoms are func-tionalized by a mixture of the epoxy and hydroxyl groups.For each concentration, we examine three different combina-tions of the epoxy and hydroxyl groups (epoxy/hydroxyl ra-tios of 2/3, 1/1, and 3/2); in total 9 initial GO structures wereprepared. It is worth noting that higher concentrations (40%and 50%) have also been examined. However, the GO struc-tures collapse completely during the heating up process of thetemperature-programmed RMD simulations. The GO struc-ture is centered in a 4.3 nm × 4 nm × 2.5 nm box. Periodicboundary conditions are applied along the X, Y, and Z direc-tions. An example of the simulation box is shown in Figure 1.For that GO structure, 30% of the basal carbon atoms arefunctionalized, among which 50% are functionalized by theepoxy groups and the other half by the hydroxyl groups. Weherein use “a-(b:c)” to name the GO structures, where a isthe functional group concentration, 10%, 20% or 30%. “b:c”stands for the ratio of the total numbers of epoxy (Nepoxy) andhydroxyl (Nhydroxyl) groups, that is, b:c = Nepoxy : Nhydroxyl.
C. Temperature-programmed RMD simulation
All RMD calculations are performed in the canonical en-semble where the number of molecules (N), the volume (V),and the temperature (T) are fixed. A short discussion of themechanical equilibrium of GO structures is provided in thesupplementary material. Newton’s equations are solved bythe Verlet integrator using a 0.25 fs timestep. The tempera-ture is controlled by the Berendsen thermostat method witha damping constant of 100 fs. The velocities are initiated ac-cording to the Boltzmann distribution. A bond order cutoff of20% of the original bond length is used to identify the con-nectivities and the molecular species, and also to monitor thestructural evolution of GO as a function of simulation time.The temperature-programmed protocol was used in the calcu-lations to overcome such activation energy barrier problemsand to make the chemical reaction rare events observable dur-ing our total simulation time. A detailed description of thetemperature-programmed protocol used in this work is pro-vided in the supplementary material.32 The calculations areby the LAMMPS software package with the ReaxFF imple-mented as an external library.33
This article is copyrighted as indicated in the article. Reuse of AIP content is subject to the terms at: http://scitation.aip.org/termsconditions. Downloaded to IP:
134.99.128.41 On: Mon, 23 Dec 2013 12:00:17
194707-3 Huang et al. J. Chem. Phys. 139, 194707 (2013)
D. Dynamic H2S adsorption experiment
We use two different methods proposed by Hummers andOffeman34 and Brodie35 to synthesis GO samples for the ad-sorption experiments. The GO sample by Hummers and Of-feman’s method (referred to as GO-H) has a higher concen-tration of carbonyl and carboxyl groups than the GO sampleby Brodie’s method (GO-B). The H2S adsorption at dynamicconditions is studied by thermal analysis. About 45 mg ofthe GO adsorbent was placed in a small pan, heated up at arate of 3 K/min from room temperature to 440 K and 500 Kfor GO-H and GO-B, respectively. The choice of tempera-ture is based on the temperature stability, which is reportedto be around 459 K for GO-H and 523 K for GO-B. The sys-tem was placed isothermally under N2 flow (100 ml/min) for3 h until there was no weight change. After this, the tempera-ture was brought back to 300 K. The GO sample was exposedisothermally to a H2S flow (flow rate 50 ml/min) for 4 h. Theelements present in the two GOs studied as well as their chem-ical state were identified by XPS analyses. These analyseswere performed by Evans Analytical Group laboratories witha PHI 5701 LSci instrument, a monochrome AlKalfa source(1486.6 eV) and an analysis area of about 2.0 mm × 0.8 mm.We also measure the weight gain due to the adsorption ofH2S. It is worth noting that we do not perform H2S/H2O mix-ture adsorption on the two GO samples. Our previous exper-iments have reported that H2O has a strong tendency to ad-sorb on GO materials and can block the adsorption of othermolecules.14, 15, 36
III. RESULTS AND DISCUSSION
A. Structural evolution of GO model
The local arrangement of epoxy and hydroxyl groupson the GO surface has been a subject of discussion for along time. The preferential alignment of the epoxy groupsalong a zigzag direction of the graphene lattice has been ob-served from first principles calculations.37 That structure waslater confirmed by the non-contact atomic force microscopic(NC-AFM) experiments of Fujii and Enoki.38 Using densityfunctional theory (DFT) calculations, Lahaye and co-workersfind that a hydroxyl group accompanies an epoxy group atthe opposite side of the same hexagonal ring.19 The resultagrees well with the experiments of Cai et al.39 However,DFT calculations are computationally expensive and can onlyeffectively deal with tens of atoms of the GO structure. Itis thus not practical to use the DFT method to study real-istic GO structures with all possible functional groups anddefects.
The GO models in this work are the optimized structures(F) that are generated by the temperature-programmed RMDsimulations, as discussed in Sec. II of the supplementary ma-terial. The pristine graphene (I) is functionalized by a mix-ture of epoxy and hydroxyl groups. Along the heat-up pathA-B, when the temperature is above 1000 K, most hydroxylgroups are released from the GO surface in the form of H2Omolecules. Epoxy groups are the dominant groups on the finalGO structure (F). They can also react with the saturated sp3
basal carbon atoms at high temperatures (>1500 K) to pro-
duce vacancies and release, at the same time, other reactionproducts (CO2 and CO) from the GO surface. Such reaction isonly observed when the initial functional group concentrationis 20% or 30%. There is no vacancy formed on the other threeGO structures, namely, 10%-(1:1), 10%-(2:3), and 10%-(3:2),where only 10% of the basal carbon atoms are initially func-tionalized. On the other hand, for one functional group con-centration (10%, 20%, or 30%), the different combinations(1:1, 2:3, or 3:2 for the ratio of epoxy and hydroxyl groups) donot result in major structural differences in the final structure(F). It is also worth pointing out that we did not study the caseswhere only epoxy or hydroxyl groups are attached to the pris-tine graphene surface. This is because during the temperature-programmed RMD simulations, epoxy groups serve as the ox-idants and hydroxyl groups are responsible for the products ofH2O molecules and carboxyl groups. Both functional groupsare needed in order to generate a realistic GO model with dif-ferent functional groups and defects.
The structural evolution of three final GO structures (F),namely, 10%-(1:1), 20%-(1:1), and 30%-(1:1), is discussedin Figure 2, and the three structures are also provided in thesupplementary material. Figure 2 also provides a list of somenew functional patterns we observe from the temperature-programmed simulation process, such as different arrange-ments of epoxy and hydroxyl groups (Figures 2(a-1), 2(a-4),2(a-5), 2(b-1), 2(b-2), and 2(b-3)), vacancies (Figure 2(b-5)),large carbon rings (Figures 2(c-1) and 2(c-3)), carboxyl group(Figure 2(c-2)), and the preferential alignment of epoxygroups along the zigzag direction (Figure 2(c-3)). For the10%-(1:1) GO structure, besides the remaining hydroxyl andepoxy groups, we find new functional groups, for example,the pair of meta-epoxy groups (a-1) and the pair of carbonyls(a-2). There is not any vacancy formed in this GO structure.However, we observe a local curvature change and the re-sulting rearrangement of the epoxy group. For example, theepoxy group in Figure 2(a-4) is on the same plane of the ben-zene ring.
When the initial functional concentration is increasedto 20%, there are more new functionalizaiton patterns thatcan be identified in the final GO structure. For example,the relative distributions of epoxy and hydroxyl groups inFigures 2(a-5), 2(b-1), 2(b-2), and 2(b-3) agree with previ-ous DFT calculations that (a) two ortho- or meta-functionalgroups are not stable on the same benzene ring unless theypoint to the up and down directions of the basal surface;(b) two para-, or further-separated functional groups are sta-ble, and they tend to align in the zigzag direction. On the 20%-(1:1) structure, the epoxy and hydroxyl are closer to eachother, and they can easily react to form vacancies or largecarbon-oxygen ring structures, as shown in Figures 2(b-4)and 2(b-5).
For the 30%-(1:1) GO structure, besides the previouslydiscussed functional patterns, we observe larger carbon-oxygen ring structures (Figure 2(c-1)), the formation of thecarboxyl group (Figure 2(c-2)), the preferential alignment ofthe epoxy groups along the zigzag direction (Figure 2(c-3)),and also the furan structure (Figure 2(c-4)). It is obvious thatthere are more vacancies and we see a dramatic curvaturechange on the 30%-(1:1) structure.
This article is copyrighted as indicated in the article. Reuse of AIP content is subject to the terms at: http://scitation.aip.org/termsconditions. Downloaded to IP:
134.99.128.41 On: Mon, 23 Dec 2013 12:00:17

194707-4 Huang et al. J. Chem. Phys. 139, 194707 (2013)
(a): 10%-(1:1) (a-1) (a-2) (a-3) (a-4) (a-5)
(b) 20%-(1:1) (b-1) (b-2) (b-3) (b-4) (b-5)
(c) 30%-(1:1) (c-1) (c-2) (c-3) (C-4)
(a): 10%-(1:1) ( ) ( )
(b) 20% (1 1) (b 1(b) 20%-(1:1) (b-1
(c) 3
5) (a 5)
1) (c-2) 30%-(1:1) (c-1
(a-5(a 5
(b-2) (b-3) 1) 1)
( 4)
(b 3)
(a-4) (a 4) (a-( (a-2) -1) (a-3) (a-3)
) (c-2)
(b-5)
(c-3) (C-4)
(b 5) (b-4) (b 4)
(c-3
FIG. 2. Configurations of GO structures with the functional groups and local defects: (a), (b), and (c) are the final configurations of GO where 10%, 20%, and30% of the basal carbon atoms are functionalized by the hydroxyl and epoxy groups in the ratio of 1:1, respectively. Functional groups and carbon arrangementsformed in the configurations of (a) a pair of meta-epoxy groups (a-1), a pair of carbonyls (a-2), a hydroxyl group (a-3), an epoxy group parallel to the surface(a-4), and a pair of ortho-hydroxyl groups on different plane directions (a-5); (b) a pair of ortho-epoxy-hydroxyl functionalizaiton pattern (b-1), a pair of para-hydroxyl groups (b-2), a zigzag alignment of hydroxyl groups (b-3), a pair of epoxy, carbonyl and hydroxyl groups (b-4), and a single vacancy and a pair ofcarbonyls (b-5); (c) a furan (c-1), a carboxyl group (c-2), a preferential alignment of epoxy groups along the zigzag direction (c-3), and a Stone-Wales defectwith an oxygen substitution (c-4). The color codes are: carbon-grey, oxygen-red, and hydrogen-white.
It is accepted that the transformation of the functionalgroups requires high concentrations of the functional groupsand high temperatures.31 This can be explained by the popu-lation analysis in Figure 3. For the 30%-(1:1) GO structure,the transformations of the functional groups and the releaseof reaction products start at around 1000 K. But it requires ahigher temperature (∼1200 K) to observe the transformationsand chemical reactions for the 10%-(1:1) and 20%-(1:1) GOstructures.
Figure 3 also shows that, for the 30%-(1:1) GO struc-ture, the total number of molecules is increasing along thehigh temperature relaxation path B-C. Thus more reactionproducts are being released from the GO structure. We donot observe the same phenomena for the 10%-(1:1) or 20%-(1:1) GO structures. Such phenomena agree with the results inFigure 2 that a higher concentration of functional groups canresult in a more dramatic atomic rearrangement and createmore new functional patterns or defects. A close examinationof the reaction products reveals that the formation of carboxylgroups and the release of O2, CO2, and CO molecules are onlyobserved for the 30%-(1:1) GO structure, where hydroxyl andepoxy sites are in close proximity and can react with eachother. The results shown in Figure 3 for B-C path were fora simulation run of 25 ps of real time. We continued to re-lax the 30%-(1:1) GO at 2010 K for another 100 ps. The new
final GO structure showed no significant difference from theone generated after 25 ps relaxation at 2010 K. Also we didnot observe any new defects or new types of functional groupafter the longer relaxation at 2010 K.
Tr ~ 1000 K
Tr ~ 1200 K
FIG. 3. Population analysis of the GO structures: the number of moleculesalong the heat-up path (A-B) and high temperature relaxation path (B-C) fordifferent functional group concentrations: 10% (black line); 20% (blue line);and 30% (red line). The black dashed line is the targeted temperature of thetemperature-programmed RMD simulations. “Tr” represents the temperaturewhen reaction products start to be released from the surface.
This article is copyrighted as indicated in the article. Reuse of AIP content is subject to the terms at: http://scitation.aip.org/termsconditions. Downloaded to IP:
134.99.128.41 On: Mon, 23 Dec 2013 12:00:17
194707-5 Huang et al. J. Chem. Phys. 139, 194707 (2013)
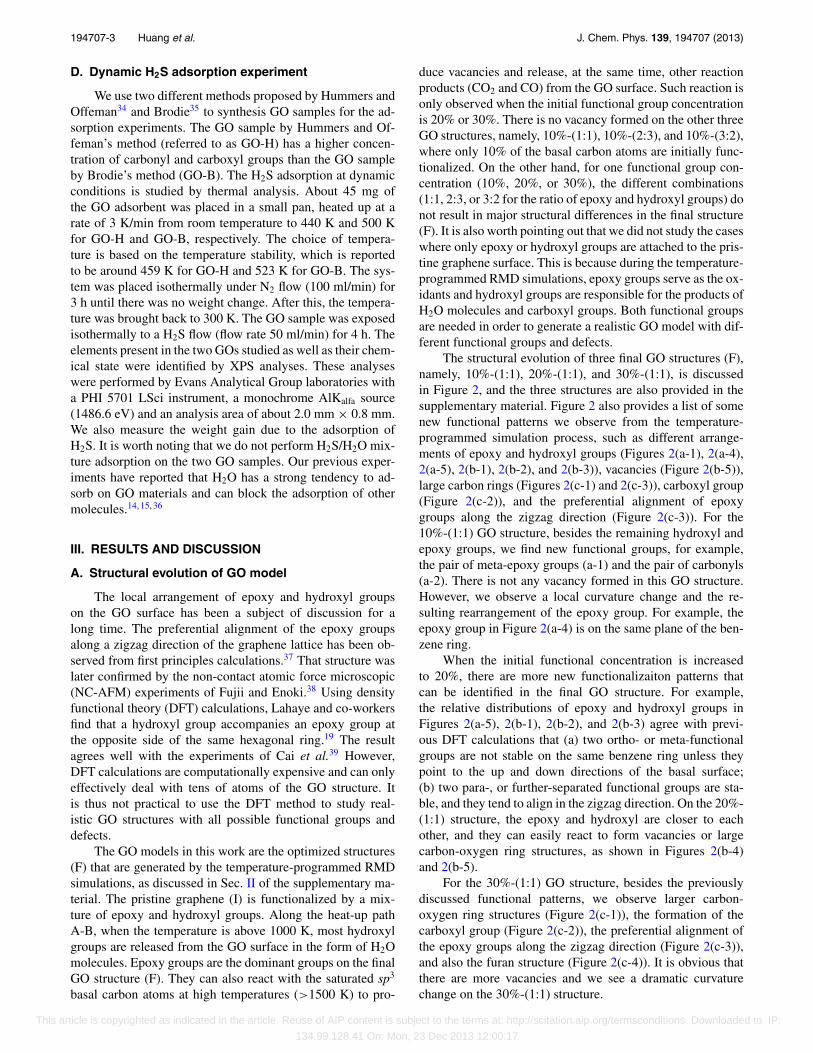
FIG. 4. The population analysis of H2S chemisorption and dissociation onthe 30%-(1:1) GO structure. The color codes are: temperature-red, HS-black,chemisorbed H2S-green, CO-blue, CO2-magenta, and H2O-purple. The boxcontains 100 H2S molecules at the beginning of the calculation.
B. Reactive adsorption of H2S on GO
The reactive adsorption of hydrogen sulfide was fur-ther investigated on the realistic 30%-(1:1) GO model. The30%-(1:1) GO structure is chosen because, as discussed inSec. III A, a higher concentration of the initial epoxy and hy-droxyl functional groups can result in a more dramatic atomicrearrangement. On the 30%-(1:1) GO structure, the vacancydefects, the epoxy, carbonyl, carboxyl, and other oxygen-containing functional groups provide active sites for the de-composition of molecules. For example, the dissociations ofH2O40 and CH4
41 molecules on vacancies in carbon substrate
have been reported by DFT calculations, where the release ofreaction products of H2, and CO/CO2 molecules are observed,respectively. The catalytic role of the oxygen-containing func-tional groups on toxic gas decomposition has also been theresearch focus of Bandosz and co-workers.16, 36, 42–46
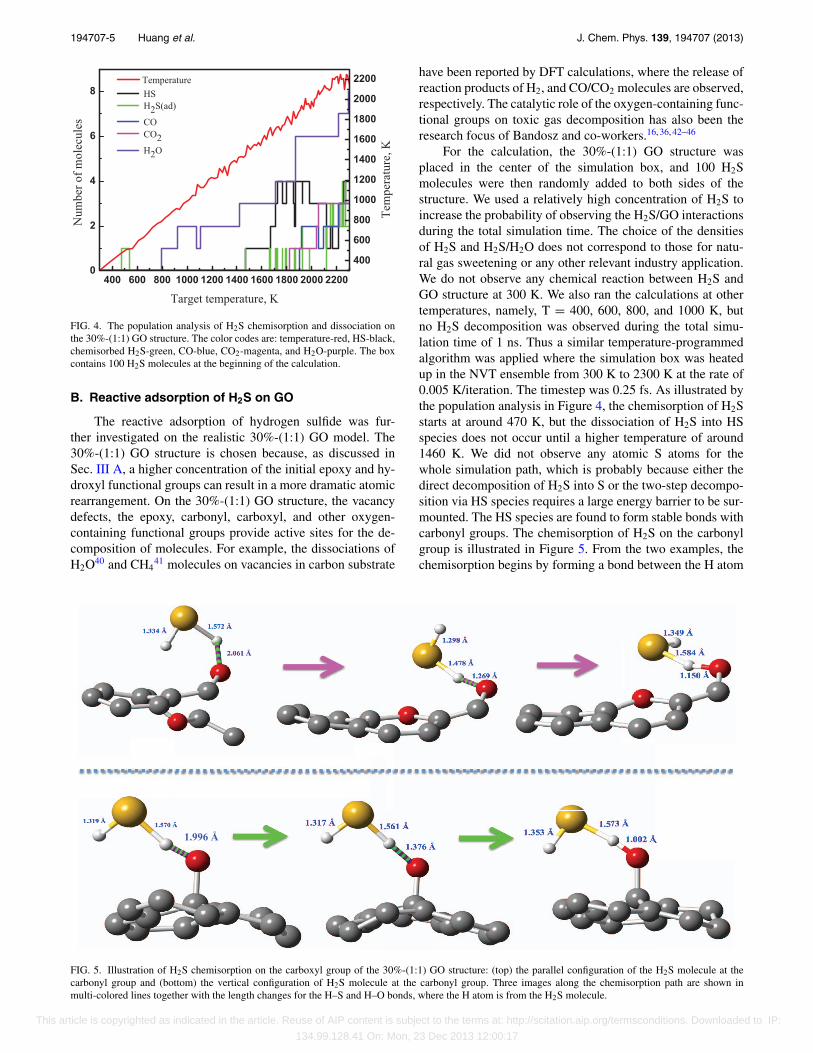
For the calculation, the 30%-(1:1) GO structure wasplaced in the center of the simulation box, and 100 H2Smolecules were then randomly added to both sides of thestructure. We used a relatively high concentration of H2S toincrease the probability of observing the H2S/GO interactionsduring the total simulation time. The choice of the densitiesof H2S and H2S/H2O does not correspond to those for natu-ral gas sweetening or any other relevant industry application.We do not observe any chemical reaction between H2S andGO structure at 300 K. We also ran the calculations at othertemperatures, namely, T = 400, 600, 800, and 1000 K, butno H2S decomposition was observed during the total simu-lation time of 1 ns. Thus a similar temperature-programmedalgorithm was applied where the simulation box was heatedup in the NVT ensemble from 300 K to 2300 K at the rate of0.005 K/iteration. The timestep was 0.25 fs. As illustrated bythe population analysis in Figure 4, the chemisorption of H2Sstarts at around 470 K, but the dissociation of H2S into HSspecies does not occur until a higher temperature of around1460 K. We did not observe any atomic S atoms for thewhole simulation path, which is probably because either thedirect decomposition of H2S into S or the two-step decompo-sition via HS species requires a large energy barrier to be sur-mounted. The HS species are found to form stable bonds withcarbonyl groups. The chemisorption of H2S on the carbonylgroup is illustrated in Figure 5. From the two examples, thechemisorption begins by forming a bond between the H atom
1.996 Å
FIG. 5. Illustration of H2S chemisorption on the carboxyl group of the 30%-(1:1) GO structure: (top) the parallel configuration of the H2S molecule at thecarbonyl group and (bottom) the vertical configuration of H2S molecule at the carbonyl group. Three images along the chemisorption path are shown inmulti-colored lines together with the length changes for the H–S and H–O bonds, where the H atom is from the H2S molecule.
This article is copyrighted as indicated in the article. Reuse of AIP content is subject to the terms at: http://scitation.aip.org/termsconditions. Downloaded to IP:
134.99.128.41 On: Mon, 23 Dec 2013 12:00:17
194707-6 Huang et al. J. Chem. Phys. 139, 194707 (2013)
GO-H-30 GO-B-30GO-B-120GO-H-120
GO-H-170 GO-B-170
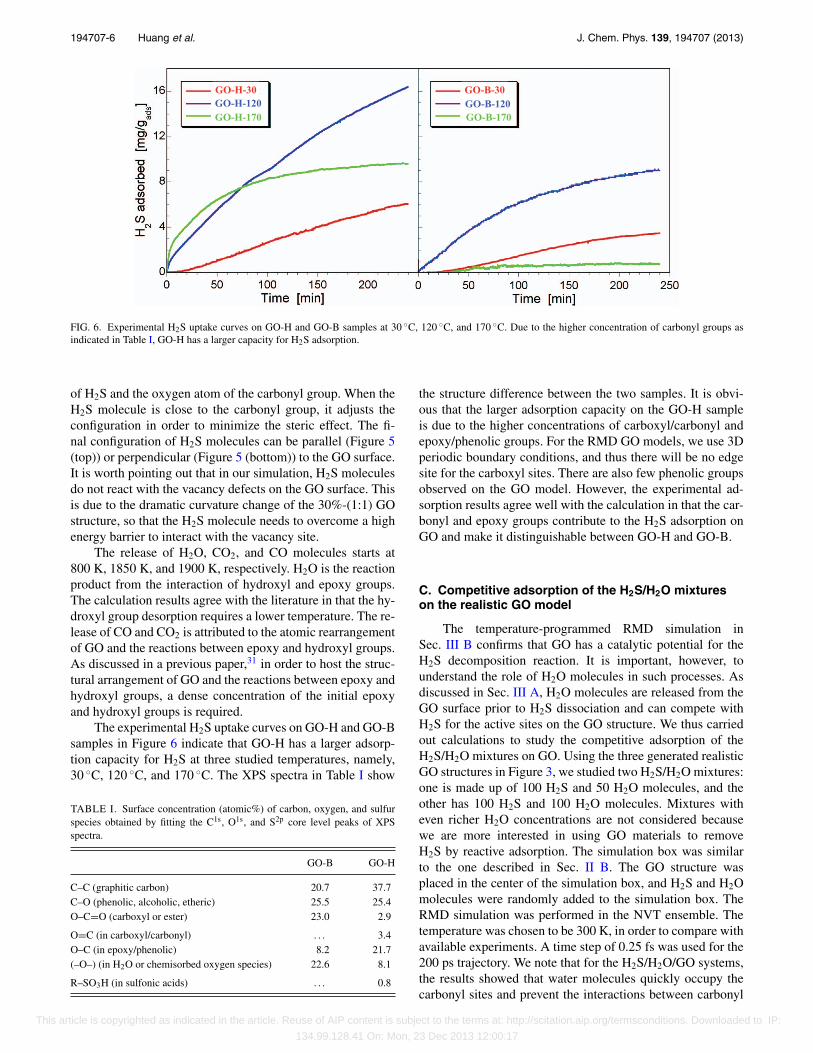
FIG. 6. Experimental H2S uptake curves on GO-H and GO-B samples at 30 ◦C, 120 ◦C, and 170 ◦C. Due to the higher concentration of carbonyl groups asindicated in Table I, GO-H has a larger capacity for H2S adsorption.
of H2S and the oxygen atom of the carbonyl group. When theH2S molecule is close to the carbonyl group, it adjusts theconfiguration in order to minimize the steric effect. The fi-nal configuration of H2S molecules can be parallel (Figure 5(top)) or perpendicular (Figure 5 (bottom)) to the GO surface.It is worth pointing out that in our simulation, H2S moleculesdo not react with the vacancy defects on the GO surface. Thisis due to the dramatic curvature change of the 30%-(1:1) GOstructure, so that the H2S molecule needs to overcome a highenergy barrier to interact with the vacancy site.
The release of H2O, CO2, and CO molecules starts at800 K, 1850 K, and 1900 K, respectively. H2O is the reactionproduct from the interaction of hydroxyl and epoxy groups.The calculation results agree with the literature in that the hy-droxyl group desorption requires a lower temperature. The re-lease of CO and CO2 is attributed to the atomic rearrangementof GO and the reactions between epoxy and hydroxyl groups.As discussed in a previous paper,31 in order to host the struc-tural arrangement of GO and the reactions between epoxy andhydroxyl groups, a dense concentration of the initial epoxyand hydroxyl groups is required.
The experimental H2S uptake curves on GO-H and GO-Bsamples in Figure 6 indicate that GO-H has a larger adsorp-tion capacity for H2S at three studied temperatures, namely,30 ◦C, 120 ◦C, and 170 ◦C. The XPS spectra in Table I show
TABLE I. Surface concentration (atomic%) of carbon, oxygen, and sulfurspecies obtained by fitting the C1s, O1s, and S2p core level peaks of XPSspectra.
GO-B GO-H
C–C (graphitic carbon) 20.7 37.7C–O (phenolic, alcoholic, etheric) 25.5 25.4O–C=O (carboxyl or ester) 23.0 2.9
O=C (in carboxyl/carbonyl) . . . 3.4O–C (in epoxy/phenolic) 8.2 21.7(–O–) (in H2O or chemisorbed oxygen species) 22.6 8.1
R–SO3H (in sulfonic acids) . . . 0.8
the structure difference between the two samples. It is obvi-ous that the larger adsorption capacity on the GO-H sampleis due to the higher concentrations of carboxyl/carbonyl andepoxy/phenolic groups. For the RMD GO models, we use 3Dperiodic boundary conditions, and thus there will be no edgesite for the carboxyl sites. There are also few phenolic groupsobserved on the GO model. However, the experimental ad-sorption results agree well with the calculation in that the car-bonyl and epoxy groups contribute to the H2S adsorption onGO and make it distinguishable between GO-H and GO-B.
C. Competitive adsorption of the H2S/H2O mixtureson the realistic GO model
The temperature-programmed RMD simulation inSec. III B confirms that GO has a catalytic potential for theH2S decomposition reaction. It is important, however, tounderstand the role of H2O molecules in such processes. Asdiscussed in Sec. III A, H2O molecules are released from theGO surface prior to H2S dissociation and can compete withH2S for the active sites on the GO structure. We thus carriedout calculations to study the competitive adsorption of theH2S/H2O mixtures on GO. Using the three generated realisticGO structures in Figure 3, we studied two H2S/H2O mixtures:one is made up of 100 H2S and 50 H2O molecules, and theother has 100 H2S and 100 H2O molecules. Mixtures witheven richer H2O concentrations are not considered becausewe are more interested in using GO materials to removeH2S by reactive adsorption. The simulation box was similarto the one described in Sec. II B. The GO structure wasplaced in the center of the simulation box, and H2S and H2Omolecules were randomly added to the simulation box. TheRMD simulation was performed in the NVT ensemble. Thetemperature was chosen to be 300 K, in order to compare withavailable experiments. A time step of 0.25 fs was used for the200 ps trajectory. We note that for the H2S/H2O/GO systems,the results showed that water molecules quickly occupy thecarbonyl sites and prevent the interactions between carbonyl
This article is copyrighted as indicated in the article. Reuse of AIP content is subject to the terms at: http://scitation.aip.org/termsconditions. Downloaded to IP:
134.99.128.41 On: Mon, 23 Dec 2013 12:00:17
194707-7 Huang et al. J. Chem. Phys. 139, 194707 (2013)
TABLE II. The number of molecules for the 12 RMD simulation systems.
H2O/H2S H2S
10%-(1:1) 50/100 100/100 50 10020%-(1:1) 50/100 100/100 50 10030%-(1:1) 50/100 100/100 50 100
sites and water molecules. This is why we reported here thefirst 200 ps calculation results for the H2S/H2O/GO systems.For comparison, we also study two systems where pure H2Sis used as the adsorbate. Table II summarizes the 12 systemsinvestigated by RMD simulations.
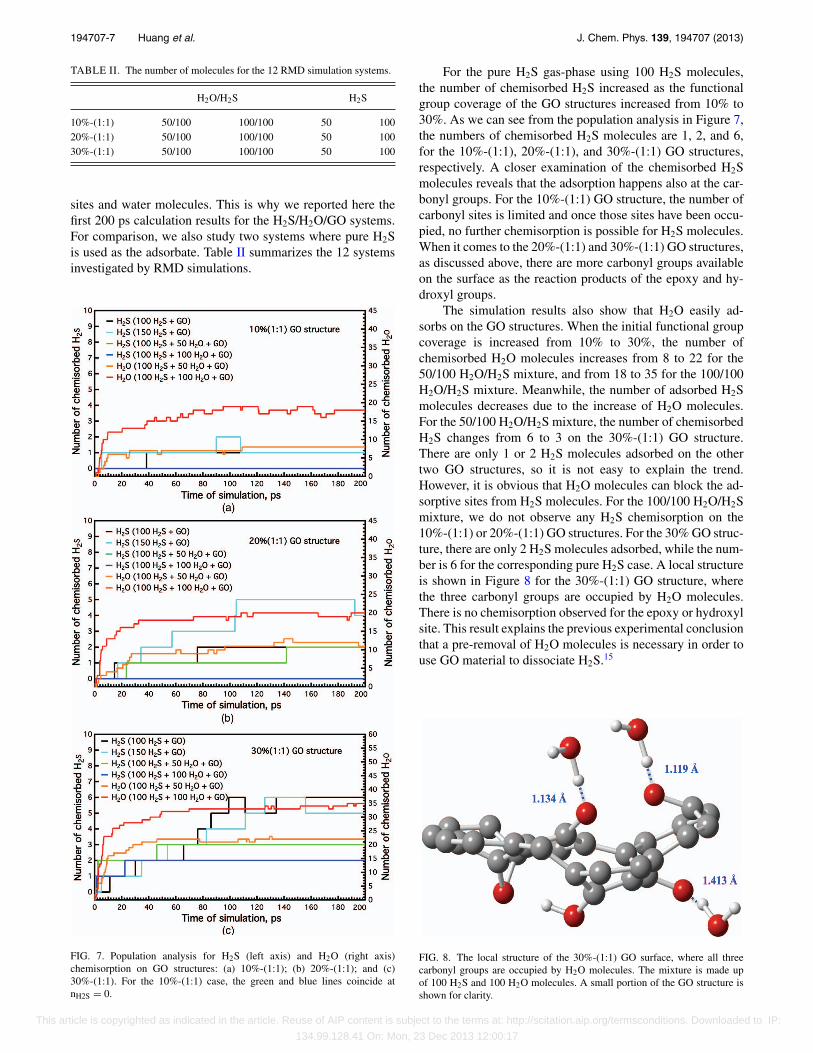
FIG. 7. Population analysis for H2S (left axis) and H2O (right axis)chemisorption on GO structures: (a) 10%-(1:1); (b) 20%-(1:1); and (c)30%-(1:1). For the 10%-(1:1) case, the green and blue lines coincide atnH2S = 0.
For the pure H2S gas-phase using 100 H2S molecules,the number of chemisorbed H2S increased as the functionalgroup coverage of the GO structures increased from 10% to30%. As we can see from the population analysis in Figure 7,the numbers of chemisorbed H2S molecules are 1, 2, and 6,for the 10%-(1:1), 20%-(1:1), and 30%-(1:1) GO structures,respectively. A closer examination of the chemisorbed H2Smolecules reveals that the adsorption happens also at the car-bonyl groups. For the 10%-(1:1) GO structure, the number ofcarbonyl sites is limited and once those sites have been occu-pied, no further chemisorption is possible for H2S molecules.When it comes to the 20%-(1:1) and 30%-(1:1) GO structures,as discussed above, there are more carbonyl groups availableon the surface as the reaction products of the epoxy and hy-droxyl groups.
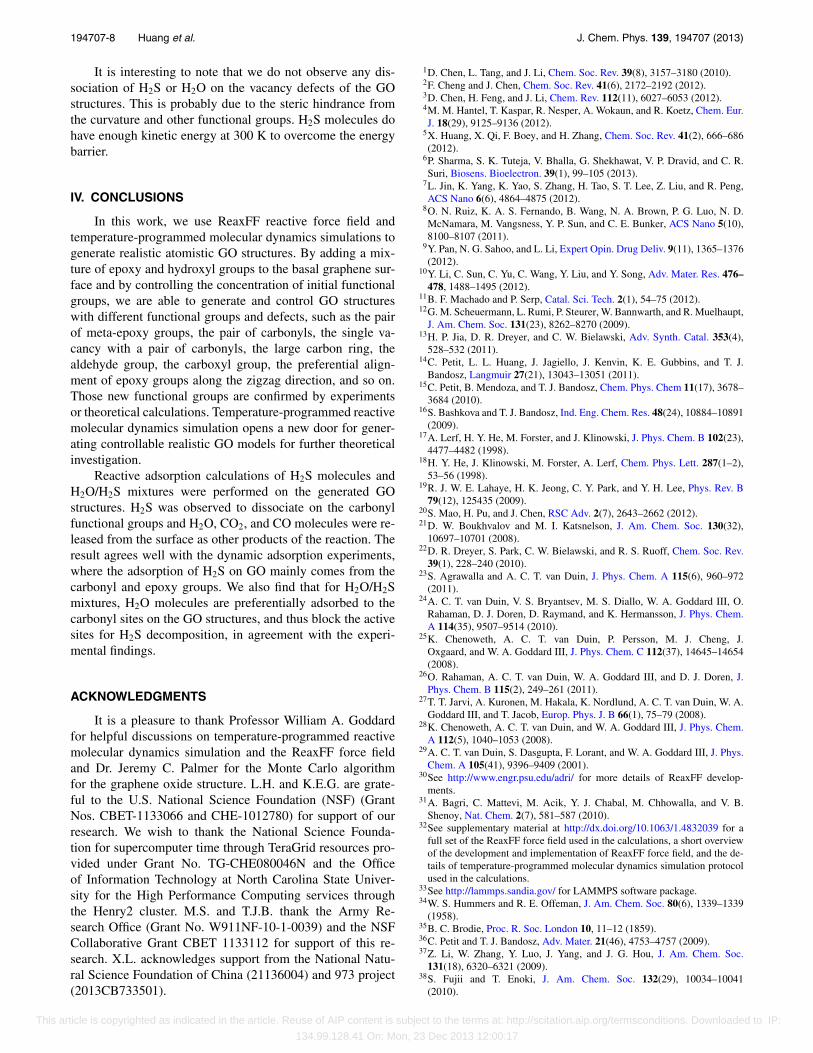
The simulation results also show that H2O easily ad-sorbs on the GO structures. When the initial functional groupcoverage is increased from 10% to 30%, the number ofchemisorbed H2O molecules increases from 8 to 22 for the50/100 H2O/H2S mixture, and from 18 to 35 for the 100/100H2O/H2S mixture. Meanwhile, the number of adsorbed H2Smolecules decreases due to the increase of H2O molecules.For the 50/100 H2O/H2S mixture, the number of chemisorbedH2S changes from 6 to 3 on the 30%-(1:1) GO structure.There are only 1 or 2 H2S molecules adsorbed on the othertwo GO structures, so it is not easy to explain the trend.However, it is obvious that H2O molecules can block the ad-sorptive sites from H2S molecules. For the 100/100 H2O/H2Smixture, we do not observe any H2S chemisorption on the10%-(1:1) or 20%-(1:1) GO structures. For the 30% GO struc-ture, there are only 2 H2S molecules adsorbed, while the num-ber is 6 for the corresponding pure H2S case. A local structureis shown in Figure 8 for the 30%-(1:1) GO structure, wherethe three carbonyl groups are occupied by H2O molecules.There is no chemisorption observed for the epoxy or hydroxylsite. This result explains the previous experimental conclusionthat a pre-removal of H2O molecules is necessary in order touse GO material to dissociate H2S.15
FIG. 8. The local structure of the 30%-(1:1) GO surface, where all threecarbonyl groups are occupied by H2O molecules. The mixture is made upof 100 H2S and 100 H2O molecules. A small portion of the GO structure isshown for clarity.
This article is copyrighted as indicated in the article. Reuse of AIP content is subject to the terms at: http://scitation.aip.org/termsconditions. Downloaded to IP:
134.99.128.41 On: Mon, 23 Dec 2013 12:00:17
194707-8 Huang et al. J. Chem. Phys. 139, 194707 (2013)
It is interesting to note that we do not observe any dis-sociation of H2S or H2O on the vacancy defects of the GOstructures. This is probably due to the steric hindrance fromthe curvature and other functional groups. H2S molecules dohave enough kinetic energy at 300 K to overcome the energybarrier.
IV. CONCLUSIONS
In this work, we use ReaxFF reactive force field andtemperature-programmed molecular dynamics simulations togenerate realistic atomistic GO structures. By adding a mix-ture of epoxy and hydroxyl groups to the basal graphene sur-face and by controlling the concentration of initial functionalgroups, we are able to generate and control GO structureswith different functional groups and defects, such as the pairof meta-epoxy groups, the pair of carbonyls, the single va-cancy with a pair of carbonyls, the large carbon ring, thealdehyde group, the carboxyl group, the preferential align-ment of epoxy groups along the zigzag direction, and so on.Those new functional groups are confirmed by experimentsor theoretical calculations. Temperature-programmed reactivemolecular dynamics simulation opens a new door for gener-ating controllable realistic GO models for further theoreticalinvestigation.
Reactive adsorption calculations of H2S molecules andH2O/H2S mixtures were performed on the generated GOstructures. H2S was observed to dissociate on the carbonylfunctional groups and H2O, CO2, and CO molecules were re-leased from the surface as other products of the reaction. Theresult agrees well with the dynamic adsorption experiments,where the adsorption of H2S on GO mainly comes from thecarbonyl and epoxy groups. We also find that for H2O/H2Smixtures, H2O molecules are preferentially adsorbed to thecarbonyl sites on the GO structures, and thus block the activesites for H2S decomposition, in agreement with the experi-mental findings.
ACKNOWLEDGMENTS
It is a pleasure to thank Professor William A. Goddardfor helpful discussions on temperature-programmed reactivemolecular dynamics simulation and the ReaxFF force fieldand Dr. Jeremy C. Palmer for the Monte Carlo algorithmfor the graphene oxide structure. L.H. and K.E.G. are grate-ful to the U.S. National Science Foundation (NSF) (GrantNos. CBET-1133066 and CHE-1012780) for support of ourresearch. We wish to thank the National Science Founda-tion for supercomputer time through TeraGrid resources pro-vided under Grant No. TG-CHE080046N and the Officeof Information Technology at North Carolina State Univer-sity for the High Performance Computing services throughthe Henry2 cluster. M.S. and T.J.B. thank the Army Re-search Office (Grant No. W911NF-10-1-0039) and the NSFCollaborative Grant CBET 1133112 for support of this re-search. X.L. acknowledges support from the National Natu-ral Science Foundation of China (21136004) and 973 project(2013CB733501).
1D. Chen, L. Tang, and J. Li, Chem. Soc. Rev. 39(8), 3157–3180 (2010).2F. Cheng and J. Chen, Chem. Soc. Rev. 41(6), 2172–2192 (2012).3D. Chen, H. Feng, and J. Li, Chem. Rev. 112(11), 6027–6053 (2012).4M. M. Hantel, T. Kaspar, R. Nesper, A. Wokaun, and R. Koetz, Chem. Eur.J. 18(29), 9125–9136 (2012).
5X. Huang, X. Qi, F. Boey, and H. Zhang, Chem. Soc. Rev. 41(2), 666–686(2012).
6P. Sharma, S. K. Tuteja, V. Bhalla, G. Shekhawat, V. P. Dravid, and C. R.Suri, Biosens. Bioelectron. 39(1), 99–105 (2013).
7L. Jin, K. Yang, K. Yao, S. Zhang, H. Tao, S. T. Lee, Z. Liu, and R. Peng,ACS Nano 6(6), 4864–4875 (2012).
8O. N. Ruiz, K. A. S. Fernando, B. Wang, N. A. Brown, P. G. Luo, N. D.McNamara, M. Vangsness, Y. P. Sun, and C. E. Bunker, ACS Nano 5(10),8100–8107 (2011).
9Y. Pan, N. G. Sahoo, and L. Li, Expert Opin. Drug Deliv. 9(11), 1365–1376(2012).
10Y. Li, C. Sun, C. Yu, C. Wang, Y. Liu, and Y. Song, Adv. Mater. Res. 476–478, 1488–1495 (2012).
11B. F. Machado and P. Serp, Catal. Sci. Tech. 2(1), 54–75 (2012).12G. M. Scheuermann, L. Rumi, P. Steurer, W. Bannwarth, and R. Muelhaupt,
J. Am. Chem. Soc. 131(23), 8262–8270 (2009).13H. P. Jia, D. R. Dreyer, and C. W. Bielawski, Adv. Synth. Catal. 353(4),
528–532 (2011).14C. Petit, L. L. Huang, J. Jagiello, J. Kenvin, K. E. Gubbins, and T. J.
Bandosz, Langmuir 27(21), 13043–13051 (2011).15C. Petit, B. Mendoza, and T. J. Bandosz, Chem. Phys. Chem 11(17), 3678–
3684 (2010).16S. Bashkova and T. J. Bandosz, Ind. Eng. Chem. Res. 48(24), 10884–10891
(2009).17A. Lerf, H. Y. He, M. Forster, and J. Klinowski, J. Phys. Chem. B 102(23),
4477–4482 (1998).18H. Y. He, J. Klinowski, M. Forster, A. Lerf, Chem. Phys. Lett. 287(1–2),
53–56 (1998).19R. J. W. E. Lahaye, H. K. Jeong, C. Y. Park, and Y. H. Lee, Phys. Rev. B
79(12), 125435 (2009).20S. Mao, H. Pu, and J. Chen, RSC Adv. 2(7), 2643–2662 (2012).21D. W. Boukhvalov and M. I. Katsnelson, J. Am. Chem. Soc. 130(32),
10697–10701 (2008).22D. R. Dreyer, S. Park, C. W. Bielawski, and R. S. Ruoff, Chem. Soc. Rev.
39(1), 228–240 (2010).23S. Agrawalla and A. C. T. van Duin, J. Phys. Chem. A 115(6), 960–972
(2011).24A. C. T. van Duin, V. S. Bryantsev, M. S. Diallo, W. A. Goddard III, O.
Rahaman, D. J. Doren, D. Raymand, and K. Hermansson, J. Phys. Chem.A 114(35), 9507–9514 (2010).
25K. Chenoweth, A. C. T. van Duin, P. Persson, M. J. Cheng, J.Oxgaard, and W. A. Goddard III, J. Phys. Chem. C 112(37), 14645–14654(2008).
26O. Rahaman, A. C. T. van Duin, W. A. Goddard III, and D. J. Doren, J.Phys. Chem. B 115(2), 249–261 (2011).
27T. T. Jarvi, A. Kuronen, M. Hakala, K. Nordlund, A. C. T. van Duin, W. A.Goddard III, and T. Jacob, Europ. Phys. J. B 66(1), 75–79 (2008).
28K. Chenoweth, A. C. T. van Duin, and W. A. Goddard III, J. Phys. Chem.A 112(5), 1040–1053 (2008).
29A. C. T. van Duin, S. Dasgupta, F. Lorant, and W. A. Goddard III, J. Phys.Chem. A 105(41), 9396–9409 (2001).
30See http://www.engr.psu.edu/adri/ for more details of ReaxFF develop-ments.
31A. Bagri, C. Mattevi, M. Acik, Y. J. Chabal, M. Chhowalla, and V. B.Shenoy, Nat. Chem. 2(7), 581–587 (2010).
32See supplementary material at http://dx.doi.org/10.1063/1.4832039 for afull set of the ReaxFF force field used in the calculations, a short overviewof the development and implementation of ReaxFF force field, and the de-tails of temperature-programmed molecular dynamics simulation protocolused in the calculations.
33See http://lammps.sandia.gov/ for LAMMPS software package.34W. S. Hummers and R. E. Offeman, J. Am. Chem. Soc. 80(6), 1339–1339
(1958).35B. C. Brodie, Proc. R. Soc. London 10, 11–12 (1859).36C. Petit and T. J. Bandosz, Adv. Mater. 21(46), 4753–4757 (2009).37Z. Li, W. Zhang, Y. Luo, J. Yang, and J. G. Hou, J. Am. Chem. Soc.
131(18), 6320–6321 (2009).38S. Fujii and T. Enoki, J. Am. Chem. Soc. 132(29), 10034–10041
(2010).
This article is copyrighted as indicated in the article. Reuse of AIP content is subject to the terms at: http://scitation.aip.org/termsconditions. Downloaded to IP:
134.99.128.41 On: Mon, 23 Dec 2013 12:00:17

194707-9 Huang et al. J. Chem. Phys. 139, 194707 (2013)
39W. Cai, R. D. Piner, F. J. Stadermann, S. Park, M. A. Shaibat, Y. Ishii, D.Yang, A. Velamakanni, S. J. An, and M. Stoller, Science 321(5897), 1815–1817 (2008).
40M. K. Kostov, E. E. Santiso, A. M. George, K. E. Gubbins, and M. B.Nardelli, Phys. Rev. Lett. 95(13), 136105 (2005).
41L. P. Huang, E. E. Santiso, M. B. Nardelli, and K. E. Gubbins, J. Chem.Phys. 128(21), 214702 (2008).
42T. J. Bandosz, Catal. Today 186(1), 20–28 (2012).43C. Petit, B. Levasseur, B. Mendoza, T. J. Bandosz, Micropor. Mesopor.
Mater. 154, 107–112 (2012).44C. Petit and T. J. Bandosz, J. Phys. Chem. C 113(9), 3800–3809 (2009).45M. Seredych, J. A. Rossin, and T. J. Bandosz, Carbon 49(13), 4392–4402
(2011).46M. Seredych and T. J. Bandosz, Colloids Surf., A 353(1), 30–36 (2010).
This article is copyrighted as indicated in the article. Reuse of AIP content is subject to the terms at: http://scitation.aip.org/termsconditions. Downloaded to IP:
134.99.128.41 On: Mon, 23 Dec 2013 12:00:17