contribution of geophysics to outlining the foundation structure of the islamic museum, cairo, egypt
TRANSCRIPT

Archaeological ProspectionArchaeol. Prospect. 12, 167–176 (2005)Published online 17 June 2005 in Wiley InterScience (www.interscience.wiley.com). DOI: 10.1002/arp.255
ContributionofGeophysicstoOutliningtheFoundationStructureofthe IslamicMuseum,Cairo,Egypt
A.M. ABBAS,3* H.KAMEI1, A.HELAL,2 M.A. ATYA3 AND F. A.SHAABAN3
1 Department of Computer Science,Tokyo Institute ofTechnology, 2-12-1O-okayama,Meguro-Ku,152-8552 Tokyo, Japan2 AinShamsUniversity, Abbassia, Cairo, Egypt3 NationalResearch Institute ofAstronomyandGeophysics,11421Helwan, Cairo, Egypt
ABSTRACT The Islamicmuseumwaserectedin1896.ThebuildingissituatedintheheartofCairo (capitalofEgypt)andholdsmarvellous Islamicantiquitiesandpricelessancienthand-writingandrarebooks.Recently,a restoration schemehasbeenplanned to secure the oldbuildingwhich suffers fromweakened foun-dations.Inaddition, thewoodenroofswillbereplacedbyconcrete onesandanextra floor willbe inte-grated into thebuilding.Unfortunately, thearchitecture constructionchartswereneitheravailablenorobtainable.Therefore, the structureof the foundationsand thebasewallsof thebuildinghad tobeout-lined. At the time of construction, three major fundamental wall designswere dominant andwere tobeconsideredduring theworkapproach.
Ground-penetrating radar (GPR) and dipole^dipole resistivity imaging have been integrated to(define thestructureof the foundationwallsof thebuilding.ARamac2 systemconnected toa 500MHzantenna has been utilized for conducting the GPR survey. In addition, aTerrameter SAS1000 singlechannel device has been used for performing the resistivity profiles. At accessible spaces aroundthe building GPR and resistivity profiles were obtained.The GPR analysis has revealed the depth ofthe foundationwalls tobeabout 0.9 m fromthegroundsurfacewithawidth close to 0.6 m.Thewallde-signisclose toastraight wallstyle.Furthermore, theanalysisof thedipole^dipoleresistivitymeasure-ments has matched the geology of the area, where subsoil anomalies may be due to the scatteredlimestoneblocks that occur in thearea.Moreover, the foundationwallshave resistivity values that fallinto therangeof fracturedlimestone or limestoneblocks.A step-wise or inclined foundationwall stylehasnotbeenindicatedthroughtheparallelresistivityprofiles.Copyright�2005JohnWiley&Sons,Ltd.
Keywords: GPR; resistivity imaging; velocityanalysis; foundationwalls; Egypt
Introduction
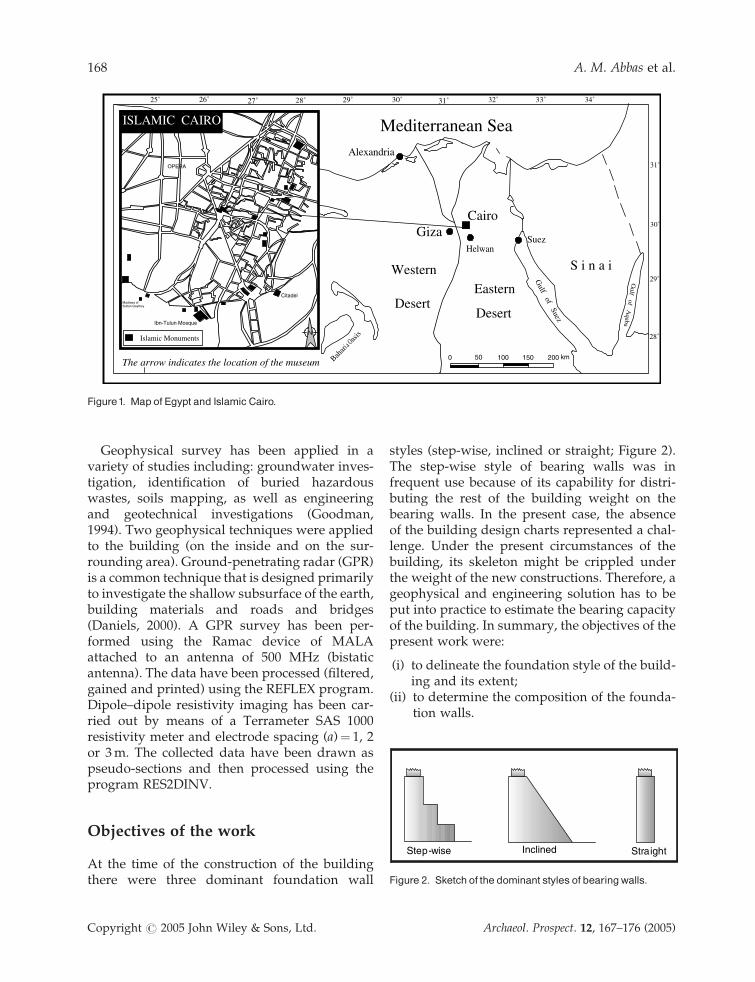
Owing to underground water ingress, the base-ment of the Islamic museum (Figure 1) has beengreatly affected. Restoration processes wereplanned for the valuable building and it was aprime goal to estimate the capabilities of thefoundation walls, particularly with respect to
new additional loads caused by further construc-tion. Accordingly, it was necessary to identify theform, depths, width and materials of the founda-tion walls. Geologically, Salem (1976) hasreported that the area where the building standsis composed of a combination of limestoneblocks and fill material. This could comprise aproblem to differentiate between the buildingwalls and the limestone blocks when using engi-neering tools. Geophysical survey was thereforeconsidered as means of determining the proper-ties of the building foundations.
Copyright # 2005 John Wiley & Sons, Ltd. Received 28 April 2003Accepted 5 November 2004
* Correspondence to: A. M. Abbas, National Research Insti-tute of Astronomy and Geophysics, 11421 Helwan, Cairo,Egypt. E-mail: [email protected]
Geophysical survey has been applied in avariety of studies including: groundwater inves-tigation, identification of buried hazardouswastes, soils mapping, as well as engineeringand geotechnical investigations (Goodman,1994). Two geophysical techniques were appliedto the building (on the inside and on the sur-rounding area). Ground-penetrating radar (GPR)is a common technique that is designed primarilyto investigate the shallow subsurface of the earth,building materials and roads and bridges(Daniels, 2000). A GPR survey has been per-formed using the Ramac device of MALAattached to an antenna of 500 MHz (bistaticantenna). The data have been processed (filtered,gained and printed) using the REFLEX program.Dipole–dipole resistivity imaging has been car-ried out by means of a Terrameter SAS 1000resistivity meter and electrode spacing (a)¼ 1, 2or 3m. The collected data have been drawn aspseudo-sections and then processed using theprogram RES2DINV.
Objectives of the work
At the time of the construction of the buildingthere were three dominant foundation wall
styles (step-wise, inclined or straight; Figure 2).The step-wise style of bearing walls was infrequent use because of its capability for distri-buting the rest of the building weight on thebearing walls. In the present case, the absenceof the building design charts represented a chal-lenge. Under the present circumstances of thebuilding, its skeleton might be crippled underthe weight of the new constructions. Therefore, ageophysical and engineering solution has to beput into practice to estimate the bearing capacityof the building. In summary, the objectives of thepresent work were:
(i) to delineate the foundation style of the build-ing and its extent;
(ii) to determine the composition of the founda-tion walls.
31˚
30˚
29˚
28˚
34˚33˚30˚29˚28˚27˚25˚ 31˚ 32˚26˚
CairoGiza
S i n a i
Suez
Gulf
ofSuez
Gulf
ofA
qaba
Western
DesertEastern
Desert
Alexandria
Mediterranean SeaLi
bya
Qatta
ra D
epre
ssion
Bahari
a Oas
is
Helwan
0 50 100 150 200 kmThe arrow indicates the location of the museum
Citadel
Ibn-Tulun Mosque
Madrasa ofSultan Qaytbey
OPERA
ISLAMIC CAIRO
Islamic Monuments
Figure1. Mapof Egypt and Islamic Cairo.
Step-wise Inclined Straight
Figure 2. Sketch of the dominant styles of bearingwalls.
168 A. M. Abbas et al.
Copyright # 2005 John Wiley & Sons, Ltd. Archaeol. Prospect. 12, 167–176 (2005)

Data acquisition
In the summer of 2002 two geophysical techni-ques (GPR and resistivity imaging) were used inone campaign to achieve the above objectives.The outcome of the survey was 23 GPR lines and11 dipole–dipole imaging profiles (Figure 3).
Ground-penetrating radar
A MALA Ramac-2 system coupled to a bistaticantenna of 500MHz central frequency was usedto accomplish the survey. The profiles were con-ducted parallel and perpendicular to the walls ofthe building. The profiles had an offset of 1 to 3mand were located in the accessible positions. Theprofiles lengths ranged between 3m (perpendi-cular to the walls) and 20 to 40m (parallel to thewalls). Also, some profiles were surveyed in thecellar of the museum. The acquisition time rangewas 80 ns. The sampling rate was 1024 scan�1
and 50 scansm�1.
Resistivity imaging
A Terrameter SAS 1000 (a single channel device)was utilized for the survey. The multi-electrodesfield procedure using the dipole–dipole electro-des arrangement was applied to fulfill the resis-tivity measurements. The electrode separations(a distance) ranged between 1, 2 or 3m. Theprofiles were spread out parallel to the sides ofthe building. A parallel band of measured lines(two or three profiles) was conducted at the samelocation. The parallel profiling procedure wasutilized in GPR and in the resistivity survey tomonitor the lateral gradual changes away fromthe buildings walls.
Data processing
The measured data were subjected to severalprocessing steps. The first step was to make aquality control (QC) review for the whole set in
Figure 3. The location of GPRandresistivity surveyprofiles.
Foundation Structure of the Islamic Museum 169
Copyright # 2005 John Wiley & Sons, Ltd. Archaeol. Prospect. 12, 167–176 (2005)
order to cancel or repeat any distorted data dueto high noise interference. The various data setshave been processed using several computerprograms. The processing was an essential itemto cancel out the embedded noise and to inves-tigate the different possibilities, which couldapproach the real foundation structure of thebuilding. Furthermore, several ways of represen-tation were utilized.
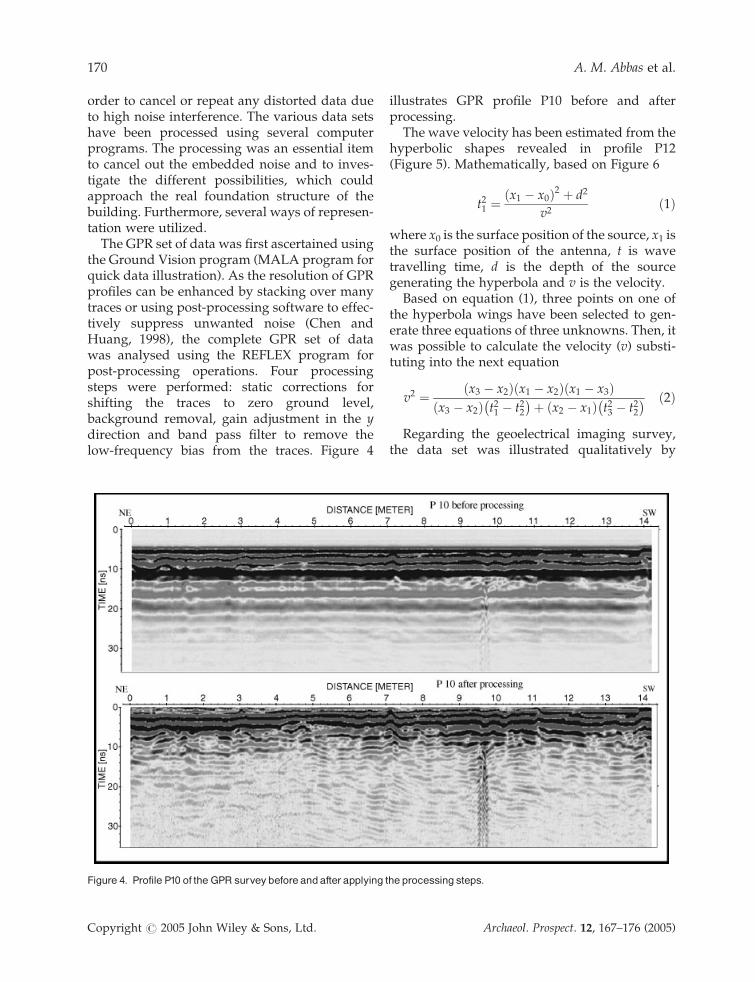
The GPR set of data was first ascertained usingthe Ground Vision program (MALA program forquick data illustration). As the resolution of GPRprofiles can be enhanced by stacking over manytraces or using post-processing software to effec-tively suppress unwanted noise (Chen andHuang, 1998), the complete GPR set of datawas analysed using the REFLEX program forpost-processing operations. Four processingsteps were performed: static corrections forshifting the traces to zero ground level,background removal, gain adjustment in the ydirection and band pass filter to remove thelow-frequency bias from the traces. Figure 4
illustrates GPR profile P10 before and afterprocessing.
The wave velocity has been estimated from thehyperbolic shapes revealed in profile P12(Figure 5). Mathematically, based on Figure 6
t21 ¼x1 � x0ð Þ2 þ d2
v2ð1Þ
where x0 is the surface position of the source, x1 isthe surface position of the antenna, t is wavetravelling time, d is the depth of the sourcegenerating the hyperbola and v is the velocity.
Based on equation (1), three points on one ofthe hyperbola wings have been selected to gen-erate three equations of three unknowns. Then, itwas possible to calculate the velocity (v) substi-tuting into the next equation
v2 ¼ x3 � x2ð Þ x1 � x2ð Þ x1 � x3ð Þx3 � x2ð Þ t21 � t22
� �þ x2 � x1ð Þ t23 � t22� � ð2Þ
Regarding the geoelectrical imaging survey,the data set was illustrated qualitatively by
Figure 4. Profile P10 of the GPR surveybefore andafterapplying theprocessing steps.
170 A. M. Abbas et al.
Copyright # 2005 John Wiley & Sons, Ltd. Archaeol. Prospect. 12, 167–176 (2005)

drawing several pseudosections. These pseudo-sections were constructed for the apparent resis-tivity (�a) and pseudodepth related to theelectrode spacing (a). Then the data were refor-matted to be appropriate for the analysis throughRES2DINV program. This program can automa-tically determine a two-dimensional resistivitymodel for the subsurface for the data obtained
from electrical imaging survey (Griffiths andBarker, 1993). The software uses a quasi-Newtontechnique to reduce the numerical calculations(Loke and Barker, 1996). It produces a two-dimensional resistivity model satisfying mea-sured data in the form of a pseudosection. Ahomogeneous resistivity model is used as theinitial model, which is iteratively adjusted to fitthe data (Sumanovac and Weisser, 2001). Therock types have been deduced from the resultingsections and they varied from clays to subsoilintercalations and limestone blocks. The lime-stone blocks were of clear anomalous shape inthe processed resistivity sections (Figure 7).
Discussion
The GPR profiles at the surroundings of thebuilding have shown normal soil successionwith some interference of infrastructures anoma-lies (electrical cables or pipes, Figure 8). Therewere common indications for limestone blocksand/or some massive concrete pieces due to oldrestoration or construction. Evidence of lateralextension of the foundation wall footings outsidethe edges of the building has not been revealed.
The GPR profiles (P11, P12 and P13) in thecellar of the building have given support for the
Figure 5. Thebearingwalls as shown in GPRprofile P12, indicatedby thearrows.
Hyperbola Source Point
Ground Surface
d
t1t 2t3
X0X1X2X3
Figure 6. Estimation of rockvelocity fromhyperbolic shape.
Foundation Structure of the Islamic Museum 171
Copyright # 2005 John Wiley & Sons, Ltd. Archaeol. Prospect. 12, 167–176 (2005)

suggestion of straight bearing walls. Two succes-sive hyperbolae of times 14 and 19 ns have beenobserved at two different surface locations onFigure 5. The tops of the hyperbolae mark thebearing wall locations. Moreover, the hyperbolicshape itself could be considered as a good indi-cator for the edges of the bearing wall. The lowerhyperbola could appear as a result of a pointsource located between two altered materials,whereas the upper one might be the result of asmall rim or some sort of irregularity whichledged out from the lower part of the wall.
Based on equation (2) the average velocities ofthe surrounding subsoil have been calculated.The velocities were 0.11 and 0.095mns�1, whichprovide values of dielectric permittivity about7.3 and 9.8 respectively, derived from theformula
ffiffiffik
p¼ c=v ð3Þ
where k is the relative dielectric permittivity, c isthe velocity of light (0.298mns�1) and v thevelocity (0.11 and 0.095mns�1). The estimateddepths for each hyperbola are about 0.77 and0.90m.
It is important to mention that the estimatedvalues of the velocities and relative dielectricpermittivity are their cumulative average up toits generating discontinuity. The groundwater
content in the subsoil changes gradually (from0.5 to 1.2m) and the calculated accumulativeaverage velocities and relative dielectric permit-tivity reflect this variation at two different depthpoints (Figure 9). It was possible to calculate therelative dielectric permittivity for the lower partof the subsoil applying the equation (Ueda, 2001)
ffiffiffik
pavr ¼ d1
ffiffiffiffiffik1
p þ d2ffiffiffiffiffik2
pd1 þ d2
ð4Þ
This equation has yielded a value of k2 equal to33, which signifies high water content. Thishigher water contents in the lower part couldhave a harmful effect on the bearing wallstability.
Regarding the upper hyperbola, it is importantto state that the gradual change in the ground-water might not be sufficient to generate a hyper-bolic shape. So the appearance of the hyperbolahas been ascribed to some outer rim irregularitieson the lower part of the bearing walls rocks.
On the other hand, the resistivity pseudosec-tions have shown scattered anomalies, whichaccording to their resistivities and the geologicalbackground could be recognized as blocks oflimestone surrounding the site of the building(Figure 10). Also, the profiles in the basement ofthe building have given results that are in har-mony with the GPR interpretation. The inversion
Figure 7. Two-dimensional inversion for resistivity profile P3.
172 A. M. Abbas et al.
Copyright # 2005 John Wiley & Sons, Ltd. Archaeol. Prospect. 12, 167–176 (2005)

of resistivity section P12 (Figure 11) shows twomain anomalies that could be attributed to thebearing walls. The resistivity range of theseanomalies indicates a limestone rock type.
Moreover, if the step-wise fundamental wallstyle were present, it could be expected that thehigh anomalies revealed in the resistivity profilesshould be steeply deepened as the profiles getfarther from the building walls, but the succes-sive profiles in Figure 12 do not show this beha-viour. On the contrary, the high anomalies havebeen detected at shallower depths as the resis-tivity profiles get further from the building walls.
Again, the high resistivity anomalies could bereferred to limestone blocks naturally surround-ing the building according to the geology of thearea or they have been planted to support the soilinstead of being integrated into the foundation.
Conclusion
Figure 13 is a schematic diagram for the com-bined results from the GPR and the resistivityprofiling analysis. In summary, the bearing walldesign is close to a straight walls style because
Figure 8. Anexample of the appearance ofelectric cable in GPRprofiles.
Foundation Structure of the Islamic Museum 173
Copyright # 2005 John Wiley & Sons, Ltd. Archaeol. Prospect. 12, 167–176 (2005)

step-wise or tilted wall styles could not be dis-tinguished.
The bearing walls have been constructed offractured limestone or limestone bricks to adepth of 0.9m. The lower part of the wall isabout 13 cm wide and surrounded by high watercontent subsoil. The water level in the area has
increased owing to seepage from broken pipes ofthe neighbourhood sanitary system (the domes-tic water pipes) or to recharge from closed waterchannels, which are connected to the River Nile.This ingress could cause further damage to thefoundation walls. Consequently, special care hasto be taken against the ingress of water.
Figure 9. The distribution of the velocities and the relative dielectric permittivity in the subsoil surrounding the building bearingwalls.
51 151 251 351 451
Electrode Position
Ohm-m
0 3 6 9 12 15 18 21 24 27 30Distance (m)
-6
-4
-2
0
App
. Dep
th (
m)
N E S W
P 10
a = 3 m
Figure10. Resistivity pseudosection showing an anomalous object that could be one of the limestone blocks that surround thebuilding.
174 A. M. Abbas et al.
Copyright # 2005 John Wiley & Sons, Ltd. Archaeol. Prospect. 12, 167–176 (2005)

Figure11. The two-dimensional inversionof the resistivity profile P12.
High resistivity anomaly is sha lolwer away from
the building
2 8 14 20 26 32 38
P 4
P 5
P 6
SENW
0.5 m
0.5 m
Ohm-m
Figure12. Successivepseudosectionsindicate theabsence of step-wise style rootedbearingwalls.
Foundation Structure of the Islamic Museum 175
Copyright # 2005 John Wiley & Sons, Ltd. Archaeol. Prospect. 12, 167–176 (2005)

Engineering solutions for dewatering and con-crete injection processes for enforcing the foun-dation would be appropriate.
Acknowledgement
The authors would like to acknowledge theJapanese Society for the Promotion of Scienceand the Supreme Council of Antiquities—Isla-mic Sector for their support in the undertaking ofthis work.
References
Chen HW, Huang TM. 1998. Finite-difference time-domain simulation of GPR data. Journal of AppliedGeophysics 40: 139–163.
Daniels JJ. 2000. Ground Penetrating Radar forimaging archaeological objects in the subsurface.Proceedings of the New Millennium InternationalForum on Conservation of Cultural Property, Insti-
tute of Conservation Science for Cultural Heri-tage, Kongju National University, Kongju, Korea;247–265.
Goodman D. 1994. Ground-penetrating radar simu-lations in engineering and archaeology. Geophy-sics 59: 224–232.
Griffiths DH, Barker RD. 1993. Two-dimensionalresistivity imaging and modelling in areas ofcomplex geology. Journal of Applied Geophysics29: 211–226.
Loke MH, Barker RD. 1996. Rapid least-squareinversion of apparent resistivity pseudosectionby a quasi-Newton method. Geophysical Prospec-tion 44(1): 131–152.
Salem R. 1976. Evaluation of Eocene-Miocene sedi-mentation pattern in part of Northern Egypt.American Association of Petroleum Geologists Bulle-tin 60: 34–64.
Sumanovac F, Weisser M. 2001. Evaluation of re-sistivity and seismic methods for hydrogeologicalmapping in karst terrains. Journal of Applied Geo-physics 47: 13–28.
Ueda Y. 2001. A study on estimation of dielectricconstant of soil and migration processing ofground penetrating radar signals. Master of En-gineering Thesis, Institute of Technology, Tokyo.
Figure13. Schematic representation of the GPRandresistivity results.
176 A. M. Abbas et al.
Copyright # 2005 John Wiley & Sons, Ltd. Archaeol. Prospect. 12, 167–176 (2005)