contrasts and basis functions hugo spiers adam liston
TRANSCRIPT
Contrasts and Basis Functions
Hugo Spiers
Adam Liston

Overview• Contrasts - Hugo
– What are they for?
– What do I need for a contrast?
– What types of model can I use?
– What is the best model to use?
• Basis Functions – Adam

What is a contrast used for?
• The GLM characterises postulated relationships between our experimental manipulations and the data
• Contrasts allow us to statistically test a set of possible hypothesis about this modelled data
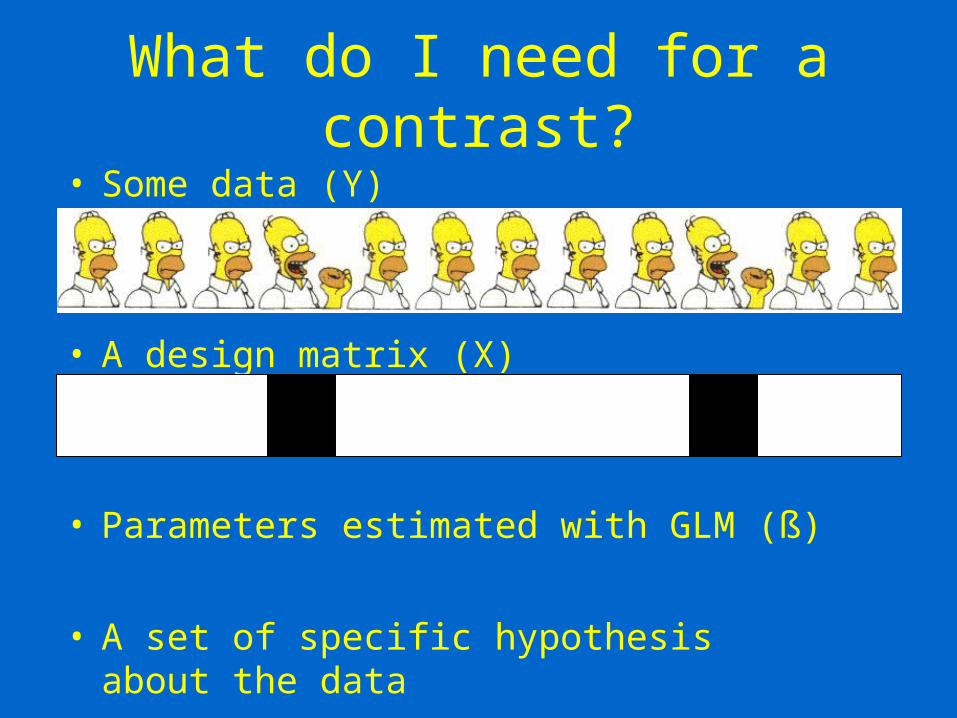
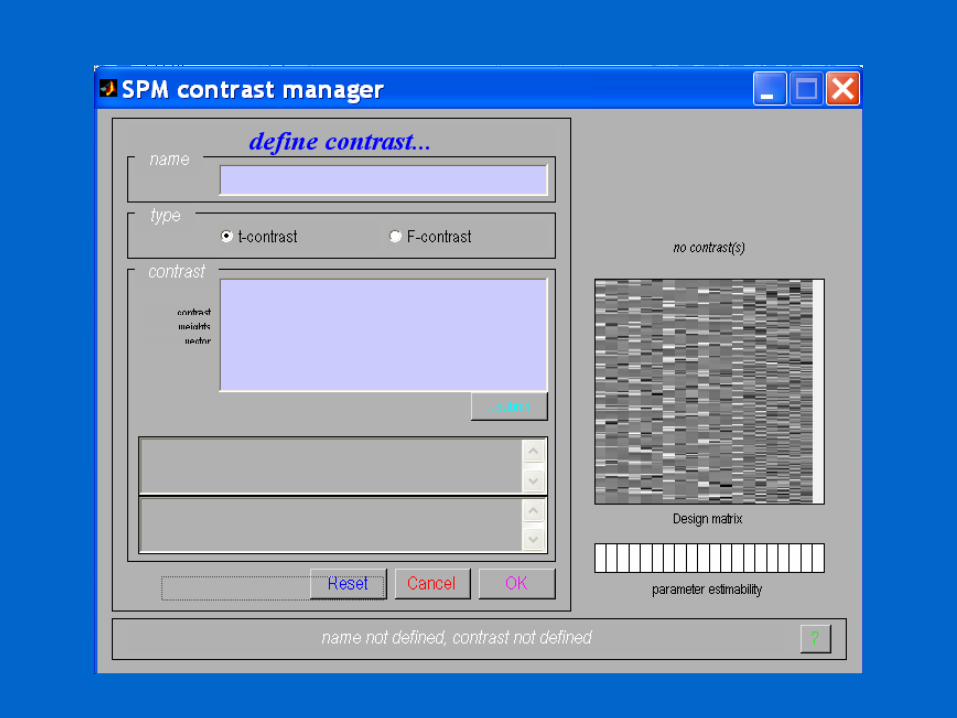
What do I need for a contrast?
• Some data (Y)
• A design matrix (X)
• Parameters estimated with GLM (ß)
• A set of specific hypothesis about the data

Simple Example Human Brain Function 2: Chapter 8
• Investigation of motor cortex
• Subject presses a device then rests 4 times
• Increasing the amount of force exerted with each press
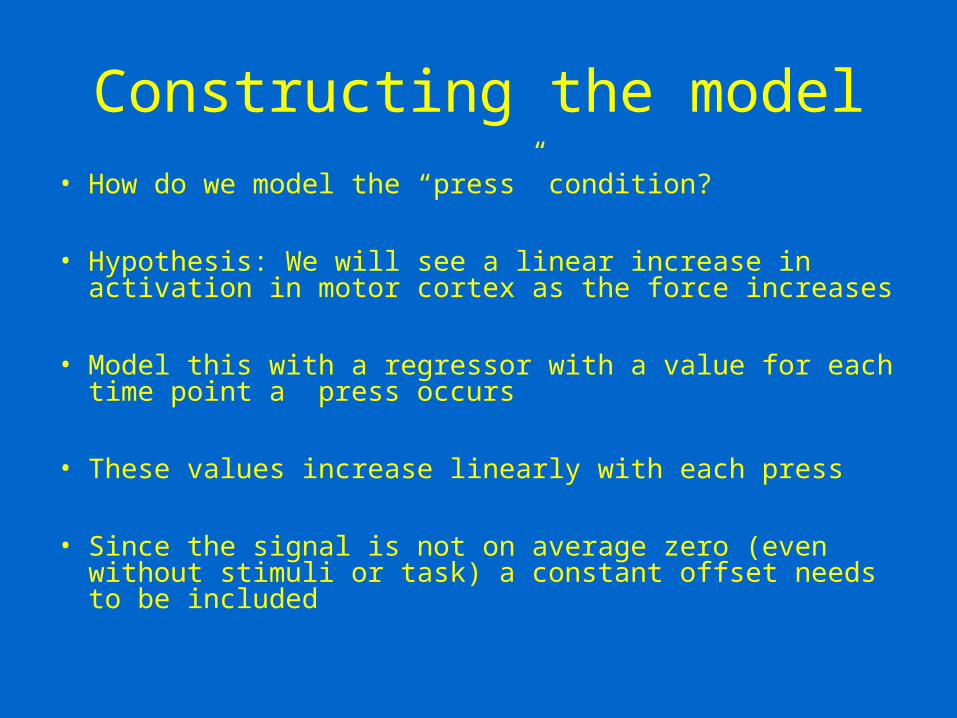
Constructing the model
• How do we model the “press” condition?
• Hypothesis: We will see a linear increase in activation in motor cortex as the force increases
• Model this with a regressor with a value for each time point a press occurs
• These values increase linearly with each press
• Since the signal is not on average zero (even without stimuli or task) a constant offset needs to be included
Constructing the model
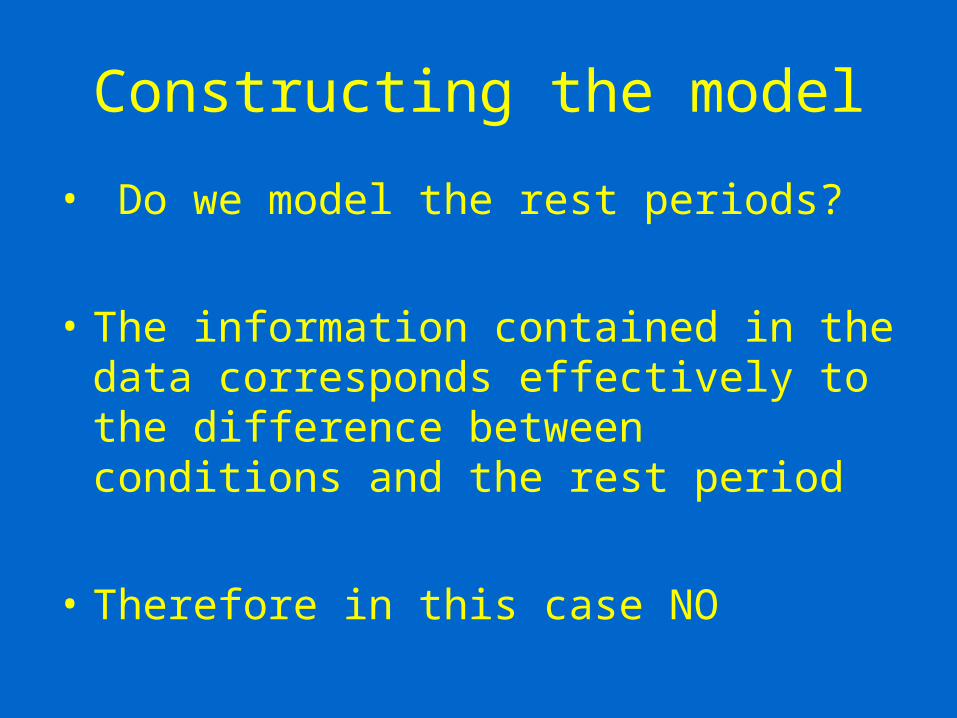
• Do we model the rest periods?
• The information contained in the data corresponds effectively to the difference between conditions and the rest period
• Therefore in this case NO

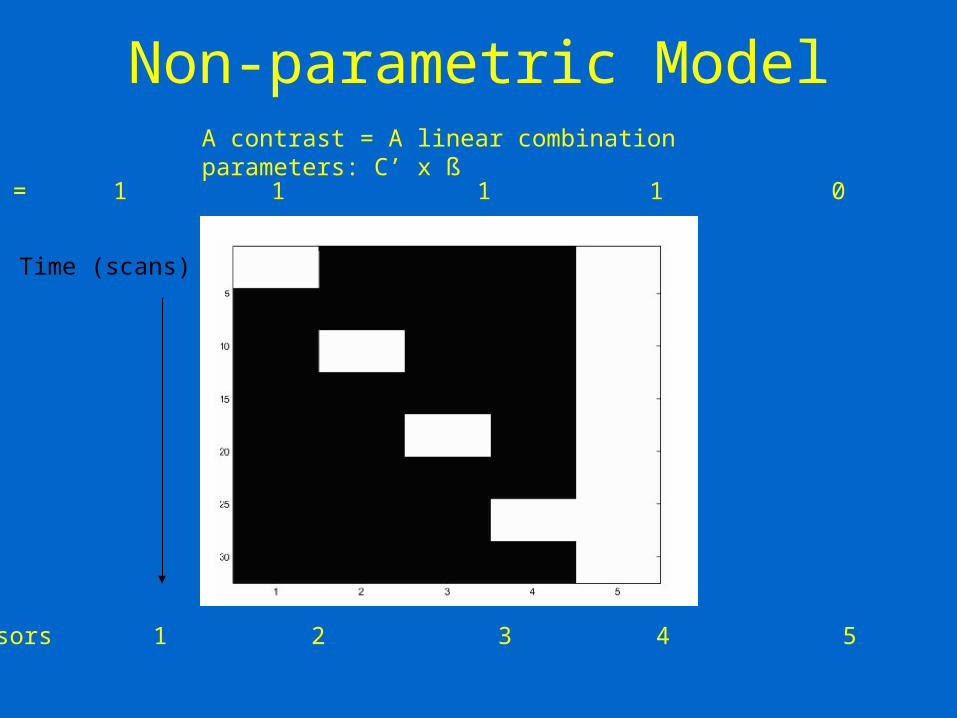
Non-parametric Model
Time (scans)
Regressors 1 2 3 4 5
Non-parametric Model
Time (scans)
A contrast = A linear combination parameters: C’ x ß
Example c’ = 1 1 1 1 0
Regressors 1 2 3 4 5

Statistical Tests
• T-test– Tells you whether there is a significant
increase or decrease in the contrast specified
• F-test– Tells you whether there is a significant
difference between the conditions in the contrast
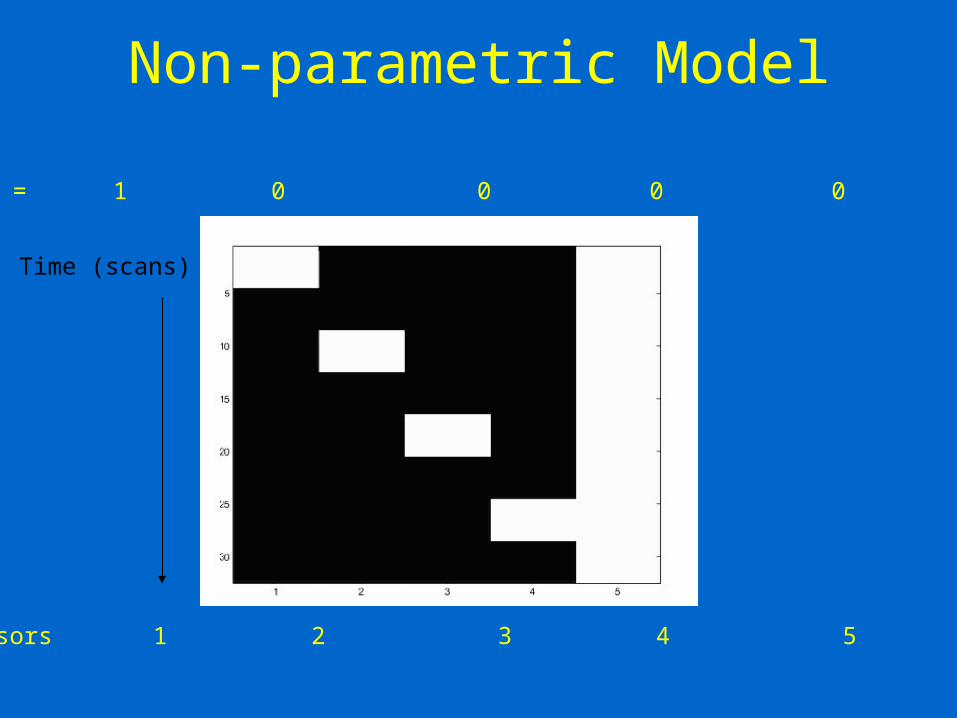
Non-parametric Model
Time (scans)
Example c’ = 1 0 0 0 0
Regressors 1 2 3 4 5

Non-parametric Model
Time (scans)
Example c’ = -1 1 0 0 0
Regressors 1 2 3 4 5

T-tests in Contrasts
• A one dimensional contrast
T =
contrast ofestimated
parameters
varianceestimate
T =
ss22c’(X’X)c’(X’X)++cc
c’bc’b
So, for a contrast in our model of 1 0 0 0 0:
T = (ß1x1 + ß2x0 + ß3x 0 + ß4x0 + ß5x0) Estimated variance

Non-parametric Model
Time (scans)
Search for a linear increase
Example c’ = 1 2 3 4 0
Regressors 1 2 3 4 5

Non-parametric Model
Time (scans)
Better to 0 centre the contrast
Example c’ = -3 -1 1 3 0
Regressors 1 2 3 4 5

F-test
• To test a hypothesis about general effects, independent of the direction of the contrast
F = error
varianceestimate
additionalvariance
accounted forby tested
effects

Non-parametric Model
Time (scans)
Example Ftest c’ = 1 0 0 0 0 0 1 0 0 0
0 0 1 0 0 0 0 0 1 0
Regressors 1 2 3 4 5
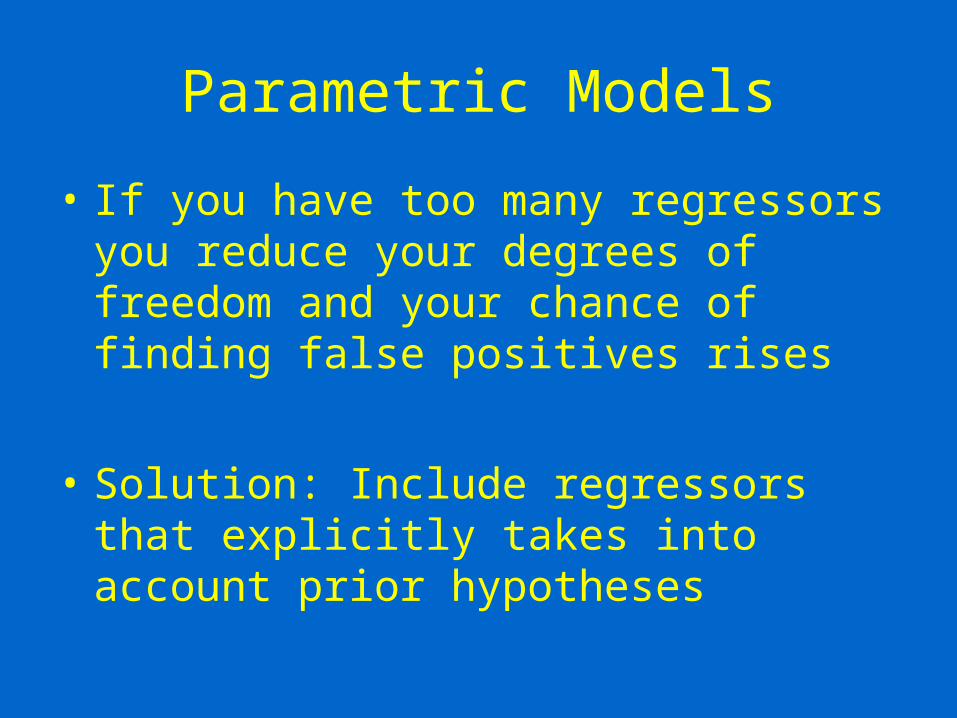
Parametric Models
• If you have too many regressors you reduce your degrees of freedom and your chance of finding false positives rises
• Solution: Include regressors that explicitly takes into account prior hypotheses

Linear Parametric Model
LINEARPARAMETRIC
ALLPRESS
MEAN
TimeTime

1:
2:
3:
Regressors NEW REGRESSORS
Main effect of pressing Removed
0
0
Linear Parametric Model

Non-linear models
1. Linear
2. Log
3. All press
4. mean
Regressors

T-test Contrasts with our model
1. Linear
2. Log
3. Press
4. Mean
Contrasts
Regressors
1 0 0 0 - T1
0 1 0 0 - T2
0 0 1 0 - T3
0 0 0 1 - T4
-1 0 0 0 - T5
0 -1 0 0 - T6
0 0 -1 0 - T7
0 0 0 -1 - T8
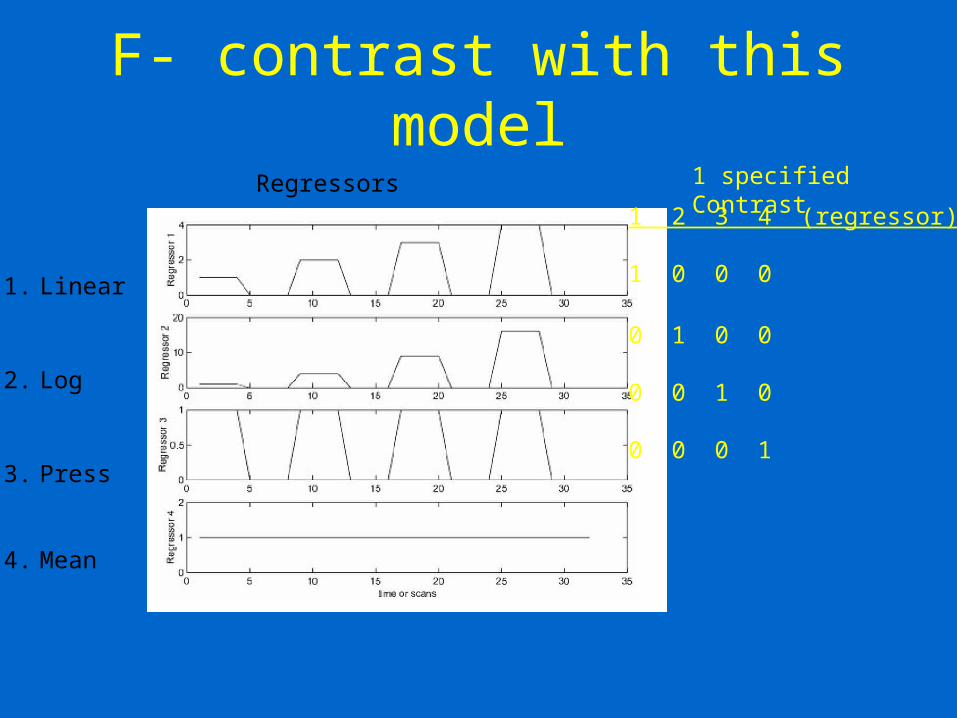
F- contrast with this model
1. Linear
2. Log
3. Press
4. Mean
1 specified ContrastRegressors1 2 3 4 (regressor)
1 0 0 0
0 1 0 0
0 0 1 0
0 0 0 1

Practical Example

Practical Example

Practical Example


Summary• Contrasts are statistical (F or T) tests of specific hypotheses
• Non-modelled information is taken into account implicitly in contrasts
• F-Contrasts look for the effects of a group of regressors • T-contrasts look for increases or decreases
• Non-parametric models can give fine grained information about the variables in the contrast
• But, parametric regressors help reduce the number of regressors and test specific hypotheses directly
• Parametric increases should be zero centred to specifically test for their effect rather than general increases or decreases relative to the baseline
• Using linear and non-linear regressors can help to model parametric data more effectively
Switching gears… basis functions
• Once we have the design, how do we relate it to our data?
Switching gears… basis functions
• Once we have the design, how do we relate it to our data?
• Time series of haemodynamic responses

Switching gears… basis functions
• Once we have the design, how do we relate it to our data?
• Time series of haemodynamic responses
• Fit these using some shape…

A bad model ...A bad model ...

A « better » model ...A « better » model ...

Basis functions
• Can be used in combination to describe any point in space.
• For instance, the (x, y, z) axes of a graph are basis functions which combine to describe points on the graph
• Orthogonality?? (x, y, z, ?)

Temporal basis functions
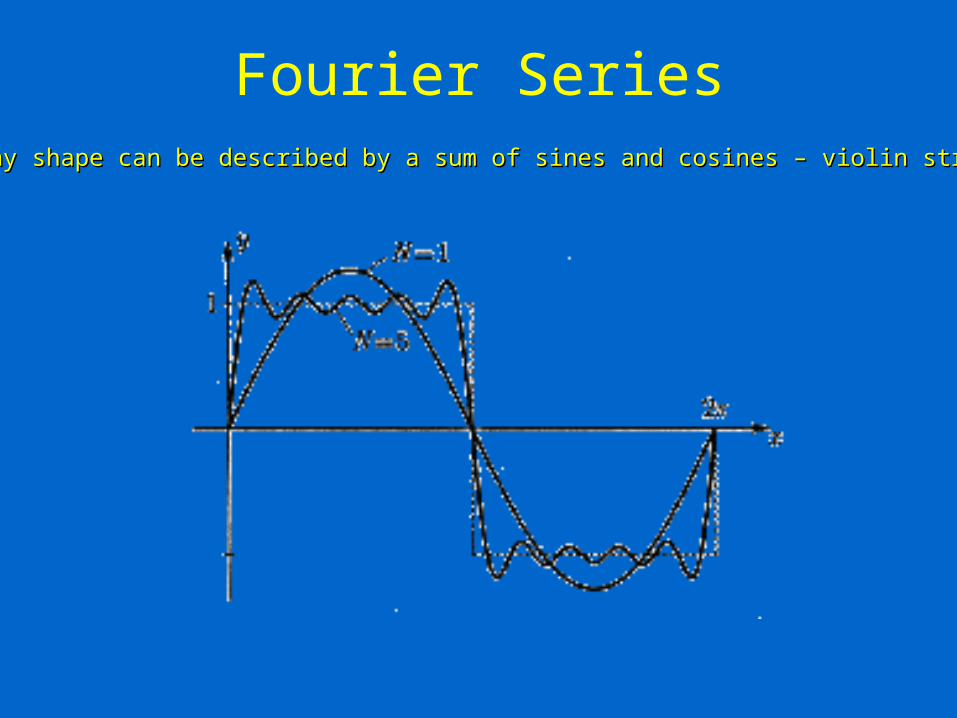
Fourier Series Any shape can be described by a sum of sines and cosines – violin stringAny shape can be described by a sum of sines and cosines – violin string

Temporal basis functions
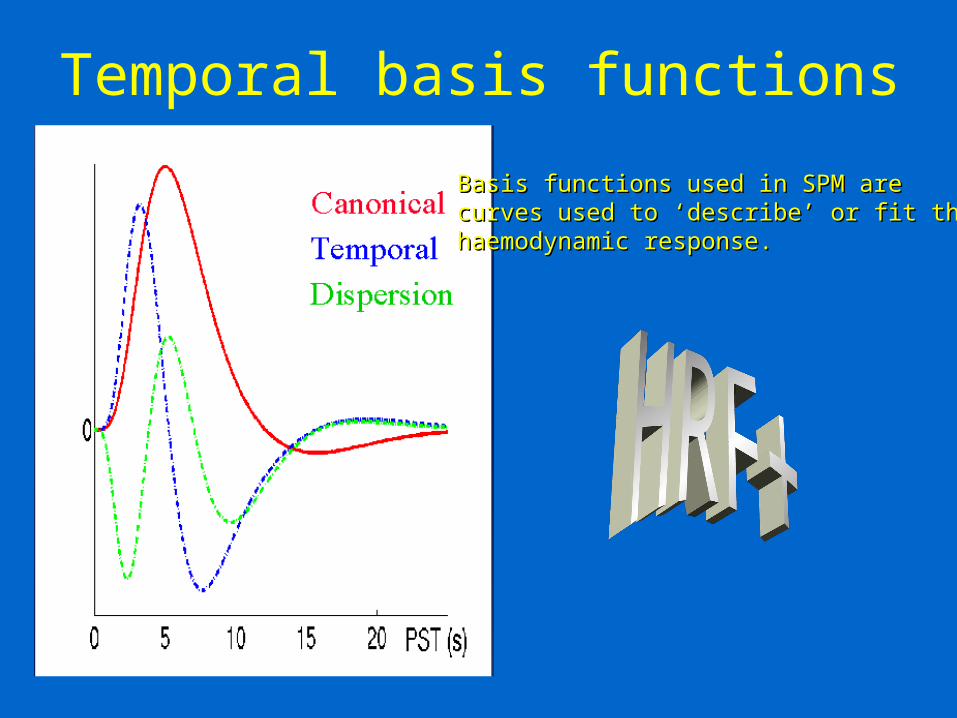
Temporal basis functions
Basis functions used in SPM are Basis functions used in SPM are curves used to ‘describe’ or fit the curves used to ‘describe’ or fit the haemodynamic response.haemodynamic response.

Temporal basis functions

Summary
• The same question can be modelled in multiple ways, but these are not always equally good, and there are many trade-offs.
• T tests examine specific one-way questions
• F tests can look significance within any of several questions (like an ANOVA)
• Basis functions combine to describe the haemodynamic response
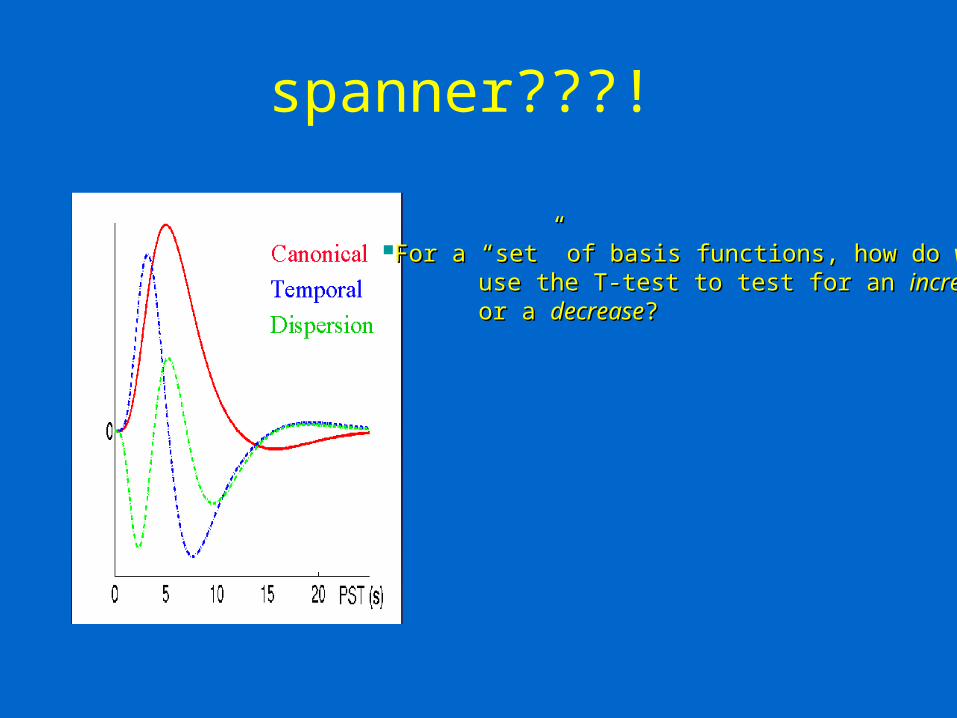
spanner???!
For a “set” of basis functions, how do weFor a “set” of basis functions, how do weuse the T-test to test for an use the T-test to test for an increaseincreaseor a or a decreasedecrease??