continuous biohydrogen production using cheese whey: improving the hydrogen production rate
TRANSCRIPT
i n t e r n a t i o n a l j o u r n a l o f h y d r o g e n e n e r g y 3 4 ( 2 0 0 9 ) 4 2 9 6 – 4 3 0 4
Avai lab le at www.sc iencedi rect .com
journa l homepage : www.e lsev ie r . com/ loca te /he
Continuous biohydrogen production using cheese whey:Improving the hydrogen production rate
Gustavo Davila-Vazqueza,1, Ciria Berenice Cota-Navarroa, Luis Manuel Rosales-Colungab,Antonio de Leon-Rodrıguezb, Elıas Razo-Floresa,*aDivision de Ciencias Ambientales, Instituto Potosino de Investigacion Cientıfica y Tecnologica, Camino a la Presa San Jose 2055,
Lomas 4a seccion, C.P. 78216, San Luis Potosı, S.L.P, MexicobDivision de Biologıa Molecular, Instituto Potosino de Investigacion Cientıfica y Tecnologica, Camino a la Presa San Jose 2055,
Lomas 4a seccion, C.P. 78216, San Luis Potosı, S.L.P, Mexico
a r t i c l e i n f o
Article history:
Received 15 January 2009
Received in revised form
25 February 2009
Accepted 25 February 2009
Available online 10 April 2009
Keywords:
Biohydrogen
Dark fermentation
CSTR
Lactose
Organic loading rate
PCR–DGGE
* Corresponding author. Tel.: þ52 444 834 20E-mail addresses: [email protected] (G. D
1 Current address: Unidad de Tecnologıa AAv. Normalistas 800, Colinas de la Normal, C0360-3199/$ – see front matter ª 2009 Interndoi:10.1016/j.ijhydene.2009.02.063
a b s t r a c t
Due to the renewed interest in finding sustainable fuels or energy carriers, biohydrogen
(Bio-H2) from biomass is a promising alternative. Fermentative Bio-H2 production was
studied in a continuous stirred tank reactor (CSTR) operated during 65.6 d with cheese
whey (CW) as substrate. Three hydraulic retention times (HRTs) were tested (10, 6 and 4 h)
and the highest volumetric hydrogen production rate (VHPR) was attained with HRT of 6 h.
Therefore, four organic loading rates (OLRs) at a fixed HRT of 6 h were tested thereafter,
being: 92.4, 115.5, 138.6 and 184.4 g lactose/L/d. The highest VHPR (46.61 mmol H2/L/h) and
hydrogen molar yield (HMY) of 2.8 mol H2/mol lactose were found at an OLR of
138.6 g lactose/L/d; a sharp fall in VHPR occurred at an OLR of 184.4 g lactose/L/d. Butyric,
propionic and acetic acids were the main soluble metabolites found, with butyric-to-acetic
ratios ranging from 1.0 to 2.4. Bacterial community was identified by partial sequence
analysis of the 16S rRNA and polymerase chain reaction–denaturing gradient gel electro-
phoresis (PCR–DGGE). The results showed that at HRT of 10 h and 6 h were dominated by
the Clostridium genus. The VHPR attained in this study is the highest reported value for
a CSTR system using CW as substrate with anaerobic sludge as inoculum and represents
a 33-fold increase compared to a previous study. Thus, it was demonstrated that contin-
uous fermentative Bio-H2 production from CW can be significantly enhanced by an
appropriate selection of parameters such as HRT and OLR. Enhancements in VHPR are
significant because it is a critical parameter to determine the full-scale practical application
of fermentation technologies that will be used for sustainable and clean energy generation.
ª 2009 International Association for Hydrogen Energy. Published by Elsevier Ltd. All rights
reserved.
1. Introduction replacing them gradually with sustainable and carbon-neutral
The negative impacts on the global environment due to the
intensive use of fossil fuels need to be reduced and reversed by
00x2026; fax: þ52 444 834avila-Vazquez), erazo@i
mbiental, Centro de Inves.P. 44270, Guadalajara, Jaational Association for H
energy carriers. There is an agreement that the use of bio-
logically produced energy from biomass fulfills the require-
ments of being a non-polluting and sustainable process [1,2].
2010.picyt.edu.mx (E. Razo-Flores).tigacion y Asistencia en Tecnologıa y Diseno del Estado de Jalisco,l., Mexico.ydrogen Energy. Published by Elsevier Ltd. All rights reserved.
i n t e r n a t i o n a l j o u r n a l o f h y d r o g e n e n e r g y 3 4 ( 2 0 0 9 ) 4 2 9 6 – 4 3 0 4 4297
Therefore, some options have been exploited such as the
production of biodiesel, bioethanol and biohydrogen. The
latter has very attractive features such as being the gas with
the highest energy content per unit weight (143 GJ/ton), and
a carbon-free fuel which only generates water when com-
busted or used in conventional fuel cells for electricity
generation. Besides, biohydrogen is a low-solubility gas that
can be easily separated from water, purified and used as
energy carrier [3]. One approach used for biohydrogen
production is by fermenting biomass (e.g. carbohydrates,
wastewater, waste by-products, etc.) and the biochemical
routes are known as dark fermentation or fermentative
hydrogen production. Among the microorganisms present in
fermentative systems for hydrogen production are mainly
Clostridium, Bacillus and Enterobacter, either in pure or mixed
cultures [4]. As stressed by Kapdan and Kargi [5], wastewaters
from the food industry, and specially the dairy industry, have
high potential to be used as raw materials for biohydrogen
production. Around 108 tons/year of cheese whey are
produced worldwide, with the risk of being a pollutant due to
its high organic content (60–80 g COD/L) together with an
inadequate disposal [6,7]. In spite of the great availability of
lactose-rich wastes or by-products from the dairy industry,
few reports in biohydrogen production from these substrates
exist [8]. Ferchichi et al. [9] used diluted cheese whey (ca.
41.1 g lactose/L) to study the influence of initial pH on bio-
hydrogen production in batch experiments with a pure Clos-
tridium culture. Another study with a pure culture reported the
use of lactose (10 g/L) in a continuous regime at different pH
and dilution rates [10]. The use of mixed anaerobic cultures for
continuous biohydrogen production from CW was first
reported by Yang et al. [11]. The authors tested different
organic loading rates (OLRs) at a fixed hydraulic retention time
(HRT) and observed microorganisms related to the Lactoba-
cillus genus and to lesser extent clostridia were detected by
16S rRNA gene analysis. Recently, a fed-batch process was
operated by Calli et al. [8] to produce hydrogen from xylose
and lactose at thermophilic conditions with inocula from
compost slurry.
Although in several published reports authors are
primarily concerned about improving hydrogen molar yields
(HMYs: mol H2/mol substrate consumed), it is important to
highlight that due to the fermentation barrier imposed by
thermodynamics in native microbial cultures, more attention
should be paid to raise volumetric hydrogen production rates
(VHPRs). Mainly because this is a critical parameter to deter-
mine full-scale practical application of fermentation
processes for electricity generation, also because the higher
the substrate concentration or OLR, the smaller the size and
therefore the cost of the reactor needed [12,13]. From what is
so far published in the literature using CW or lactose in
continuous cultures one can consider that hydrogen produc-
tion rates could be improved by an appropriate selection of
inocula and parameters such as OLR and HRT. Particularly, it
can be hypothesized that shorter HRT and higher OLR than
reported to date could raise VHPR. It should be noted that for
the scaling-up of fermentation process the highest allowable
OLR would be desirable to minimize the size of the reactor but
also trade-offs between HMY and reactor size could be
important [14].
Therefore, in this work the effect of different HRT and OLR
with cheese whey powder solution as a synthetic dairy
wastewater was studied in order to improve the reported
VHPR and the hydrogen yields if possible. The microbial
communities enriched at each culture condition were
analyzed using polymerase chain reaction–denaturing
gradient gel electrophoresis (PCR–DGGE) and the main
metabolites produced were analyzed as well.
2. Materials and methods
2.1. Inoculum and substrate
Anaerobic granular sludge from a full-scale up-flow anaerobic
sludge blanket (UASB) reactor was used as inoculum for bio-
hydrogen production at a final concentration of 4.5 g of vola-
tile suspended solids (VSS)/L. The UASB reactor treats
wastewater from a confectionery factory at San Luis Potosı,
Mexico. Prior to use, the granular sludge was washed with
three volumes of tap water and then boiled for 40 min to
inactivate hydrogen consuming microorganisms. The inoc-
ulum was stored at 4 �C. Cheese whey powder (CWP) was
purchased from Land O’Lakes Inc, (Minnesota, USA). The
soluble lactose content of CWP was 77% with 11% protein (w/
w). Medium was supplemented with the following minerals
(mg/L): Na2HPO4, 11,900; NH4H2PO4, 4500; K2HPO4, 125;
MgCl2$6H2O, 100; ZnCl2, 75; FeSO4$6H2O, 25; MnSO4$7H2O, 15;
Na2MoO4$2H2O, 12.5; CuSO4$5H2O, 5; CoCl2$8H2O, 3.
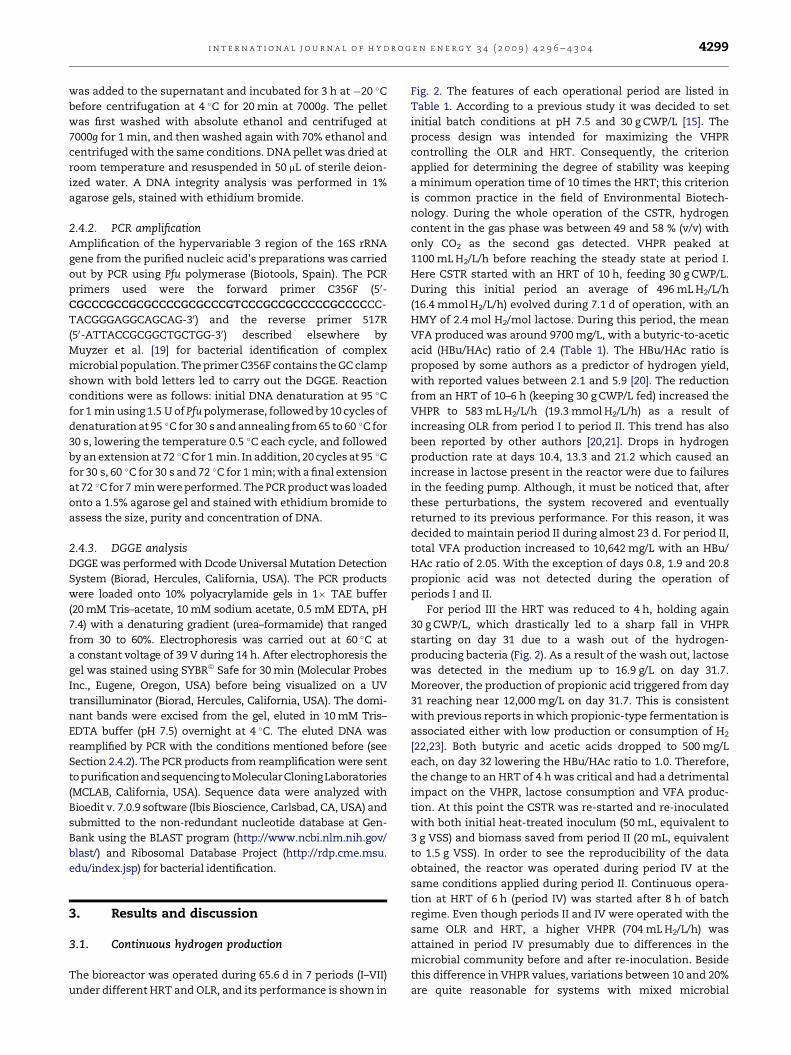
2.2. Experimental set-up
Continuous culture was performed in a 3-L bioreactor equip-
ped with an ADI 1030 system controller and BioXpert 1.3 data-
acquisition software (Applikon Biotechnology, Schiedam, The
Netherlands). Mixing at 250 rpm was performed with two
Rushton turbines; pH was monitored online (AppliSens,
Schiedam, The Netherlands) and automatically controlled at
5.9 during continuous operation dosing 10 M NaOH with
a peristaltic pump (Masterflex, Barnant, Illinois, USA).
Temperature was kept at 37 �C using an electric jacket. The
bioreactor was fed and drained using a peristaltic pump
(Masterflex, Barnant, Illinois, USA). Operation started in batch
mode and continuous regime began 12 h after. During the first
three periods (I, II and III; Table 1) continuous operation was
performed at a fixed CWP feed concentration of 30 g/L but HRT
was reduced from 10 h to 4 h stepwise, keeping a minimum
operation time of 10 times the HRT for each period (I–VII).
From periods IV to VII, a fixed HRT of 6 h was selected and
then, the OLR was increased by raising the CWP concentration
in the feed stepwise. The OLRs tested ranged from 92.4 to
184.4 g lactose/L/d (Table 1). Foam production was controlled
by addition of silicone antifoam (0.1%, AF Emulsion, Dow
Corning, Midland, MI, USA). Gas production was measured
using a liquid-displacement device filled with water (pH¼ 2;
Fig. 1). All gas volumes are reported as measured (0.81 atm and
25 �C).
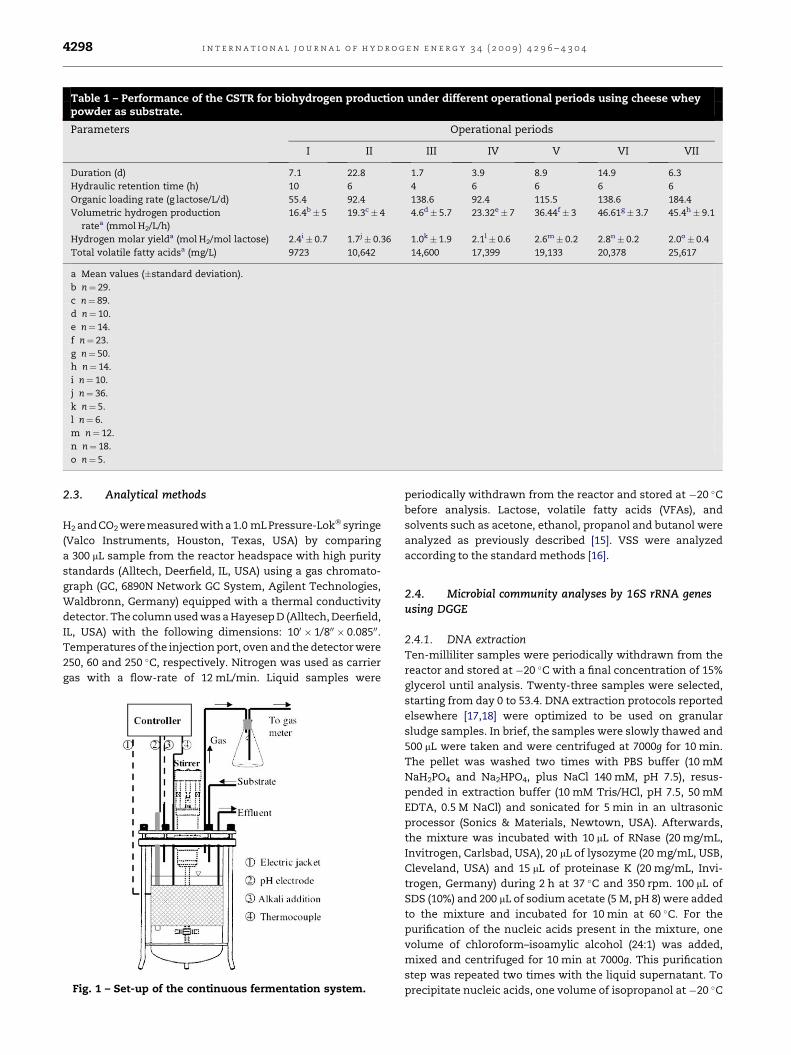
Table 1 – Performance of the CSTR for biohydrogen production under different operational periods using cheese wheypowder as substrate.
Parameters Operational periods
I II III IV V VI VII
Duration (d) 7.1 22.8 1.7 3.9 8.9 14.9 6.3
Hydraulic retention time (h) 10 6 4 6 6 6 6
Organic loading rate (g lactose/L/d) 55.4 92.4 138.6 92.4 115.5 138.6 184.4
Volumetric hydrogen production
ratea (mmol H2/L/h)
16.4b� 5 19.3c� 4 4.6d� 5.7 23.32e� 7 36.44f� 3 46.61g� 3.7 45.4h� 9.1
Hydrogen molar yielda (mol H2/mol lactose) 2.4i� 0.7 1.7j� 0.36 1.0k� 1.9 2.1l� 0.6 2.6m� 0.2 2.8n� 0.2 2.0o� 0.4
Total volatile fatty acidsa (mg/L) 9723 10,642 14,600 17,399 19,133 20,378 25,617
a Mean values (�standard deviation).
b n¼ 29.
c n¼ 89.
d n¼ 10.
e n¼ 14.
f n¼ 23.
g n¼ 50.
h n¼ 14.
i n¼ 10.
j n¼ 36.
k n¼ 5.
l n¼ 6.
m n¼ 12.
n n¼ 18.
o n¼ 5.
i n t e r n a t i o n a l j o u r n a l o f h y d r o g e n e n e r g y 3 4 ( 2 0 0 9 ) 4 2 9 6 – 4 3 0 44298
2.3. Analytical methods
H2 and CO2 were measured with a 1.0 mL Pressure-Lok� syringe
(Valco Instruments, Houston, Texas, USA) by comparing
a 300 mL sample from the reactor headspace with high purity
standards (Alltech, Deerfield, IL, USA) using a gas chromato-
graph (GC, 6890N Network GC System, Agilent Technologies,
Waldbronn, Germany) equipped with a thermal conductivity
detector. The column used was a Hayesep D (Alltech, Deerfield,
IL, USA) with the following dimensions: 100 � 1/800 � 0.08500.
Temperatures of the injection port, oven and the detector were
250, 60 and 250 �C, respectively. Nitrogen was used as carrier
gas with a flow-rate of 12 mL/min. Liquid samples were
Fig. 1 – Set-up of the continuous fermentation system.
periodically withdrawn from the reactor and stored at �20 �C
before analysis. Lactose, volatile fatty acids (VFAs), and
solvents such as acetone, ethanol, propanol and butanol were
analyzed as previously described [15]. VSS were analyzed
according to the standard methods [16].
2.4. Microbial community analyses by 16S rRNA genesusing DGGE
2.4.1. DNA extractionTen-milliliter samples were periodically withdrawn from the
reactor and stored at �20 �C with a final concentration of 15%
glycerol until analysis. Twenty-three samples were selected,
starting from day 0 to 53.4. DNA extraction protocols reported
elsewhere [17,18] were optimized to be used on granular
sludge samples. In brief, the samples were slowly thawed and
500 mL were taken and were centrifuged at 7000g for 10 min.
The pellet was washed two times with PBS buffer (10 mM
NaH2PO4 and Na2HPO4, plus NaCl 140 mM, pH 7.5), resus-
pended in extraction buffer (10 mM Tris/HCl, pH 7.5, 50 mM
EDTA, 0.5 M NaCl) and sonicated for 5 min in an ultrasonic
processor (Sonics & Materials, Newtown, USA). Afterwards,
the mixture was incubated with 10 mL of RNase (20 mg/mL,
Invitrogen, Carlsbad, USA), 20 mL of lysozyme (20 mg/mL, USB,
Cleveland, USA) and 15 mL of proteinase K (20 mg/mL, Invi-
trogen, Germany) during 2 h at 37 �C and 350 rpm. 100 mL of
SDS (10%) and 200 mL of sodium acetate (5 M, pH 8) were added
to the mixture and incubated for 10 min at 60 �C. For the
purification of the nucleic acids present in the mixture, one
volume of chloroform–isoamylic alcohol (24:1) was added,
mixed and centrifuged for 10 min at 7000g. This purification
step was repeated two times with the liquid supernatant. To
precipitate nucleic acids, one volume of isopropanol at �20 �C
i n t e r n a t i o n a l j o u r n a l o f h y d r o g e n e n e r g y 3 4 ( 2 0 0 9 ) 4 2 9 6 – 4 3 0 4 4299
was added to the supernatant and incubated for 3 h at �20 �C
before centrifugation at 4 �C for 20 min at 7000g. The pellet
was first washed with absolute ethanol and centrifuged at
7000g for 1 min, and then washed again with 70% ethanol and
centrifuged with the same conditions. DNA pellet was dried at
room temperature and resuspended in 50 mL of sterile deion-
ized water. A DNA integrity analysis was performed in 1%
agarose gels, stained with ethidium bromide.
2.4.2. PCR amplificationAmplification of the hypervariable 3 region of the 16S rRNA
gene from the purified nucleic acid’s preparations was carried
out by PCR using Pfu polymerase (Biotools, Spain). The PCR
primers used were the forward primer C356F (50-
CGCCCGCCGCGCCCCGCGCCCGTCCCGCCGCCCCCGCCCCCC-
TACGGGAGGCAGCAG-30) and the reverse primer 517R
(50-ATTACCGCGGCTGCTGG-30) described elsewhere by
Muyzer et al. [19] for bacterial identification of complex
microbial population. The primer C356F contains the GC clamp
shown with bold letters led to carry out the DGGE. Reaction
conditions were as follows: initial DNA denaturation at 95 �C
for 1 min using 1.5 U of Pfu polymerase, followed by 10 cycles of
denaturation at 95 �C for 30 s and annealing from 65 to 60 �C for
30 s, lowering the temperature 0.5 �C each cycle, and followed
by an extension at 72 �C for 1 min. In addition, 20 cycles at 95 �C
for 30 s, 60 �C for 30 s and 72 �C for 1 min; with a final extension
at 72 �C for 7 min were performed. The PCR product was loaded
onto a 1.5% agarose gel and stained with ethidium bromide to
assess the size, purity and concentration of DNA.
2.4.3. DGGE analysisDGGE was performed with Dcode Universal Mutation Detection
System (Biorad, Hercules, California, USA). The PCR products
were loaded onto 10% polyacrylamide gels in 1� TAE buffer
(20 mM Tris–acetate, 10 mM sodium acetate, 0.5 mM EDTA, pH
7.4) with a denaturing gradient (urea–formamide) that ranged
from 30 to 60%. Electrophoresis was carried out at 60 �C at
a constant voltage of 39 V during 14 h. After electrophoresis the
gel was stained using SYBRª Safe for 30 min (Molecular Probes
Inc., Eugene, Oregon, USA) before being visualized on a UV
transilluminator (Biorad, Hercules, California, USA). The domi-
nant bands were excised from the gel, eluted in 10 mM Tris–
EDTA buffer (pH 7.5) overnight at 4 �C. The eluted DNA was
reamplified by PCR with the conditions mentioned before (see
Section 2.4.2). The PCR products from reamplification were sent
topurificationandsequencingtoMolecularCloningLaboratories
(MCLAB, California, USA). Sequence data were analyzed with
Bioedit v. 7.0.9 software (Ibis Bioscience, Carlsbad, CA, USA) and
submitted to the non-redundant nucleotide database at Gen-
Bank using the BLAST program (http://www.ncbi.nlm.nih.gov/
blast/) and Ribosomal Database Project (http://rdp.cme.msu.
edu/index.jsp) for bacterial identification.
3. Results and discussion
3.1. Continuous hydrogen production
The bioreactor was operated during 65.6 d in 7 periods (I–VII)
under different HRT and OLR, and its performance is shown in
Fig. 2. The features of each operational period are listed in
Table 1. According to a previous study it was decided to set
initial batch conditions at pH 7.5 and 30 g CWP/L [15]. The
process design was intended for maximizing the VHPR
controlling the OLR and HRT. Consequently, the criterion
applied for determining the degree of stability was keeping
a minimum operation time of 10 times the HRT; this criterion
is common practice in the field of Environmental Biotech-
nology. During the whole operation of the CSTR, hydrogen
content in the gas phase was between 49 and 58 % (v/v) with
only CO2 as the second gas detected. VHPR peaked at
1100 mL H2/L/h before reaching the steady state at period I.
Here CSTR started with an HRT of 10 h, feeding 30 g CWP/L.
During this initial period an average of 496 mL H2/L/h
(16.4 mmol H2/L/h) evolved during 7.1 d of operation, with an
HMY of 2.4 mol H2/mol lactose. During this period, the mean
VFA produced was around 9700 mg/L, with a butyric-to-acetic
acid (HBu/HAc) ratio of 2.4 (Table 1). The HBu/HAc ratio is
proposed by some authors as a predictor of hydrogen yield,
with reported values between 2.1 and 5.9 [20]. The reduction
from an HRT of 10–6 h (keeping 30 g CWP/L fed) increased the
VHPR to 583 mL H2/L/h (19.3 mmol H2/L/h) as a result of
increasing OLR from period I to period II. This trend has also
been reported by other authors [20,21]. Drops in hydrogen
production rate at days 10.4, 13.3 and 21.2 which caused an
increase in lactose present in the reactor were due to failures
in the feeding pump. Although, it must be noticed that, after
these perturbations, the system recovered and eventually
returned to its previous performance. For this reason, it was
decided to maintain period II during almost 23 d. For period II,
total VFA production increased to 10,642 mg/L with an HBu/
HAc ratio of 2.05. With the exception of days 0.8, 1.9 and 20.8
propionic acid was not detected during the operation of
periods I and II.
For period III the HRT was reduced to 4 h, holding again
30 g CWP/L, which drastically led to a sharp fall in VHPR
starting on day 31 due to a wash out of the hydrogen-
producing bacteria (Fig. 2). As a result of the wash out, lactose
was detected in the medium up to 16.9 g/L on day 31.7.
Moreover, the production of propionic acid triggered from day
31 reaching near 12,000 mg/L on day 31.7. This is consistent
with previous reports in which propionic-type fermentation is
associated either with low production or consumption of H2
[22,23]. Both butyric and acetic acids dropped to 500 mg/L
each, on day 32 lowering the HBu/HAc ratio to 1.0. Therefore,
the change to an HRT of 4 h was critical and had a detrimental
impact on the VHPR, lactose consumption and VFA produc-
tion. At this point the CSTR was re-started and re-inoculated
with both initial heat-treated inoculum (50 mL, equivalent to
3 g VSS) and biomass saved from period II (20 mL, equivalent
to 1.5 g VSS). In order to see the reproducibility of the data
obtained, the reactor was operated during period IV at the
same conditions applied during period II. Continuous opera-
tion at HRT of 6 h (period IV) was started after 8 h of batch
regime. Even though periods II and IV were operated with the
same OLR and HRT, a higher VHPR (704 mL H2/L/h) was
attained in period IV presumably due to differences in the
microbial community before and after re-inoculation. Beside
this difference in VHPR values, variations between 10 and 20%
are quite reasonable for systems with mixed microbial
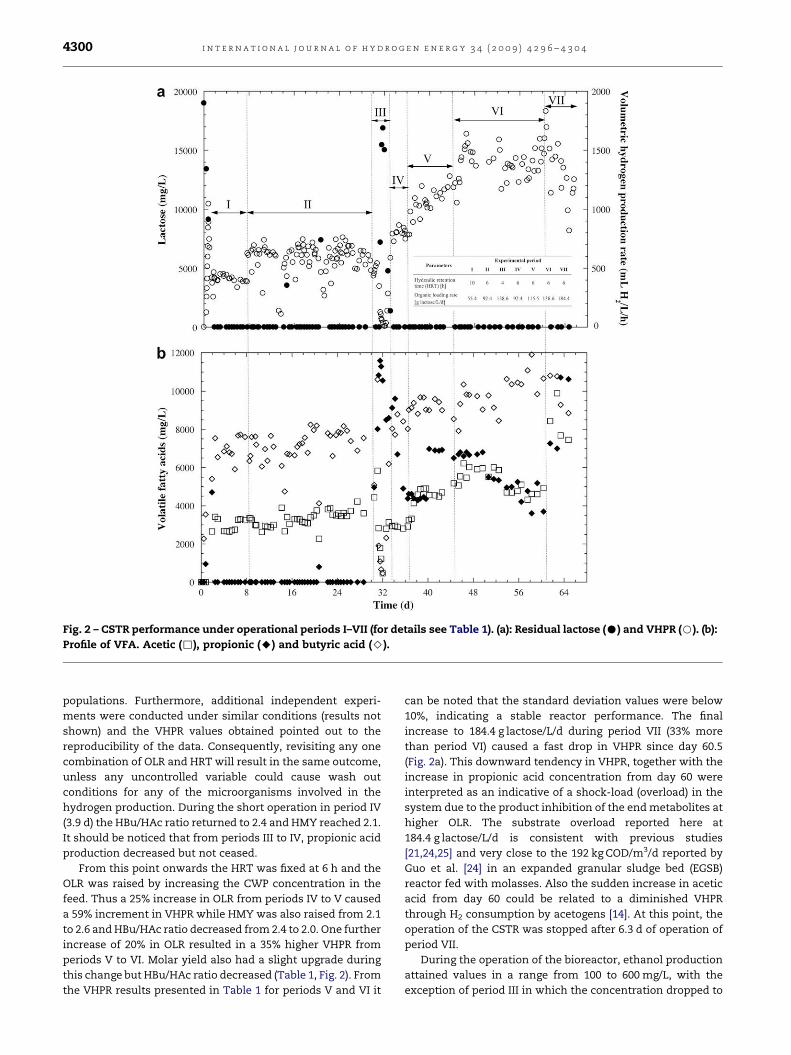
Fig. 2 – CSTR performance under operational periods I–VII (for details see Table 1). (a): Residual lactose (C) and VHPR (B). (b):
Profile of VFA. Acetic (,), propionic (A) and butyric acid (>).
i n t e r n a t i o n a l j o u r n a l o f h y d r o g e n e n e r g y 3 4 ( 2 0 0 9 ) 4 2 9 6 – 4 3 0 44300
populations. Furthermore, additional independent experi-
ments were conducted under similar conditions (results not
shown) and the VHPR values obtained pointed out to the
reproducibility of the data. Consequently, revisiting any one
combination of OLR and HRT will result in the same outcome,
unless any uncontrolled variable could cause wash out
conditions for any of the microorganisms involved in the
hydrogen production. During the short operation in period IV
(3.9 d) the HBu/HAc ratio returned to 2.4 and HMY reached 2.1.
It should be noticed that from periods III to IV, propionic acid
production decreased but not ceased.
From this point onwards the HRT was fixed at 6 h and the
OLR was raised by increasing the CWP concentration in the
feed. Thus a 25% increase in OLR from periods IV to V caused
a 59% increment in VHPR while HMY was also raised from 2.1
to 2.6 and HBu/HAc ratio decreased from 2.4 to 2.0. One further
increase of 20% in OLR resulted in a 35% higher VHPR from
periods V to VI. Molar yield also had a slight upgrade during
this change but HBu/HAc ratio decreased (Table 1, Fig. 2). From
the VHPR results presented in Table 1 for periods V and VI it
can be noted that the standard deviation values were below
10%, indicating a stable reactor performance. The final
increase to 184.4 g lactose/L/d during period VII (33% more
than period VI) caused a fast drop in VHPR since day 60.5
(Fig. 2a). This downward tendency in VHPR, together with the
increase in propionic acid concentration from day 60 were
interpreted as an indicative of a shock-load (overload) in the
system due to the product inhibition of the end metabolites at
higher OLR. The substrate overload reported here at
184.4 g lactose/L/d is consistent with previous studies
[21,24,25] and very close to the 192 kg COD/m3/d reported by
Guo et al. [24] in an expanded granular sludge bed (EGSB)
reactor fed with molasses. Also the sudden increase in acetic
acid from day 60 could be related to a diminished VHPR
through H2 consumption by acetogens [14]. At this point, the
operation of the CSTR was stopped after 6.3 d of operation of
period VII.
During the operation of the bioreactor, ethanol production
attained values in a range from 100 to 600 mg/L, with the
exception of period III in which the concentration dropped to
Ta
ble
2–
So
me
rep
ort
ed
VH
PR
an
dH
MY
un
der
con
tin
uo
us
or
sem
i-co
nti
nu
ou
sp
roce
sses
wit
hla
cto
seo
rch
eese
wh
ey
as
sub
stra
tes.
Ino
culu
mC
arb
on
sub
stra
teV
olu
metr
icH
2
pro
du
ctio
nra
te(m
mo
lH2/L
/h)
H2
yie
ld(m
olH
2/m
ol
lact
ose
)C
ult
ure
con
dit
ion
sR
efe
ren
ce
HR
T(h
)p
HT
em
per
atu
re(�
C)
OLR
(gla
cto
se/L
/d)
Clo
stri
diu
m
ther
mol
act
icu
m
La
cto
se(1
0g/L
)2.5
83
17.2
758
13.9
5[1
0]
An
aero
bic
slu
dge
Ch
eese
wh
ey
po
wd
er
solu
tio
n
1000
mL
H2/L
/d1.9
8m
M/g
CO
D24
4–5
35–3
814
[11]
Co
mp
ost
(Fed
-ba
tch
pro
cess
)
La
cto
se(2
g/L
)1.6
1,
2.5
53.7
,3.2
22,
22
5,
5.3
55,
55
2.2
,2.2
[8]
An
aero
bic
gra
nu
lar
slu
dge
Ch
eese
wh
ey
po
wd
er
solu
tio
n
23.3
2,
36.4
4,
46.6
12.1
,2.6
,2.8
6,
6,
65.9
,5.9
,5.9
37,
37,
37
92.4
,115.5
,138.6
Th
isst
ud
y
i n t e r n a t i o n a l j o u r n a l o f h y d r o g e n e n e r g y 3 4 ( 2 0 0 9 ) 4 2 9 6 – 4 3 0 4 4301
50 mg/L. Acetone, propanol and butanol were not detected.
The same trend was observed for VSS with an average of
5000 mg/L, which decreased to 2000 mg/L during wash out of
the reactor (data not shown).
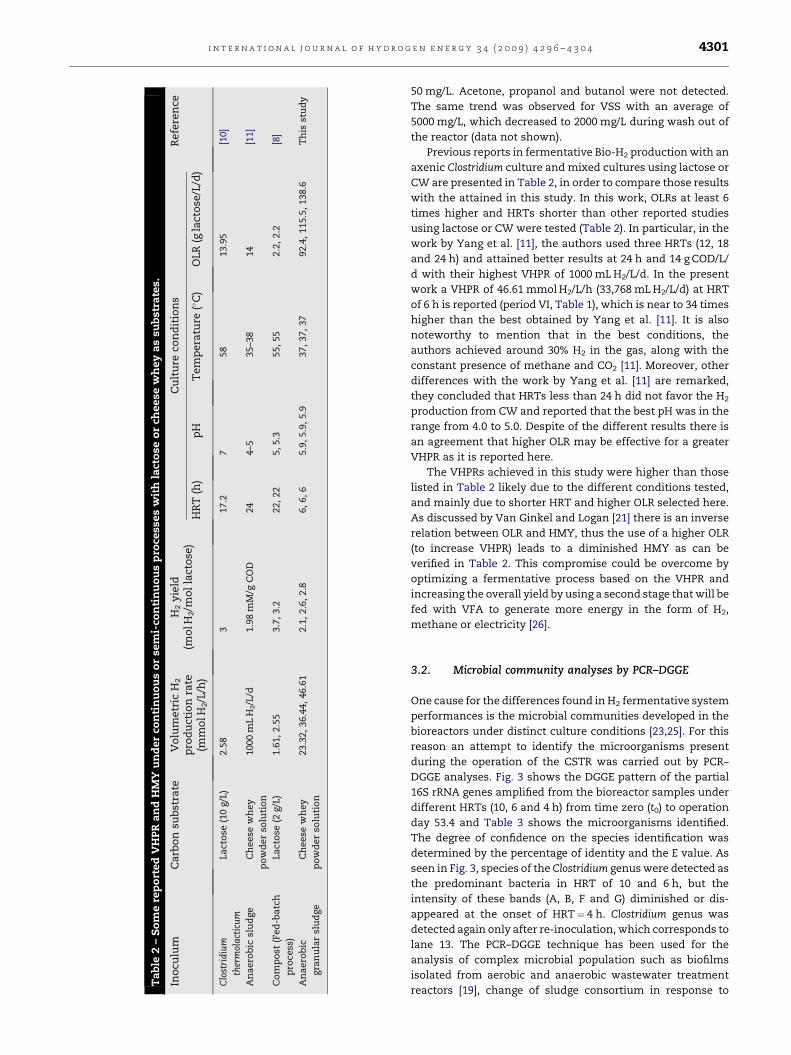
Previous reports in fermentative Bio-H2 production with an
axenic Clostridium culture and mixed cultures using lactose or
CW are presented in Table 2, in order to compare those results
with the attained in this study. In this work, OLRs at least 6
times higher and HRTs shorter than other reported studies
using lactose or CW were tested (Table 2). In particular, in the
work by Yang et al. [11], the authors used three HRTs (12, 18
and 24 h) and attained better results at 24 h and 14 g COD/L/
d with their highest VHPR of 1000 mL H2/L/d. In the present
work a VHPR of 46.61 mmol H2/L/h (33,768 mL H2/L/d) at HRT
of 6 h is reported (period VI, Table 1), which is near to 34 times
higher than the best obtained by Yang et al. [11]. It is also
noteworthy to mention that in the best conditions, the
authors achieved around 30% H2 in the gas, along with the
constant presence of methane and CO2 [11]. Moreover, other
differences with the work by Yang et al. [11] are remarked,
they concluded that HRTs less than 24 h did not favor the H2
production from CW and reported that the best pH was in the
range from 4.0 to 5.0. Despite of the different results there is
an agreement that higher OLR may be effective for a greater
VHPR as it is reported here.
The VHPRs achieved in this study were higher than those
listed in Table 2 likely due to the different conditions tested,
and mainly due to shorter HRT and higher OLR selected here.
As discussed by Van Ginkel and Logan [21] there is an inverse
relation between OLR and HMY, thus the use of a higher OLR
(to increase VHPR) leads to a diminished HMY as can be
verified in Table 2. This compromise could be overcome by
optimizing a fermentative process based on the VHPR and
increasing the overall yield by using a second stage that will be
fed with VFA to generate more energy in the form of H2,
methane or electricity [26].
3.2. Microbial community analyses by PCR–DGGE
One cause for the differences found in H2 fermentative system
performances is the microbial communities developed in the
bioreactors under distinct culture conditions [23,25]. For this
reason an attempt to identify the microorganisms present
during the operation of the CSTR was carried out by PCR–
DGGE analyses. Fig. 3 shows the DGGE pattern of the partial
16S rRNA genes amplified from the bioreactor samples under
different HRTs (10, 6 and 4 h) from time zero (t0) to operation
day 53.4 and Table 3 shows the microorganisms identified.
The degree of confidence on the species identification was
determined by the percentage of identity and the E value. As
seen in Fig. 3, species of the Clostridium genus were detected as
the predominant bacteria in HRT of 10 and 6 h, but the
intensity of these bands (A, B, F and G) diminished or dis-
appeared at the onset of HRT¼ 4 h. Clostridium genus was
detected again only after re-inoculation, which corresponds to
lane 13. The PCR–DGGE technique has been used for the
analysis of complex microbial population such as biofilms
isolated from aerobic and anaerobic wastewater treatment
reactors [19], change of sludge consortium in response to
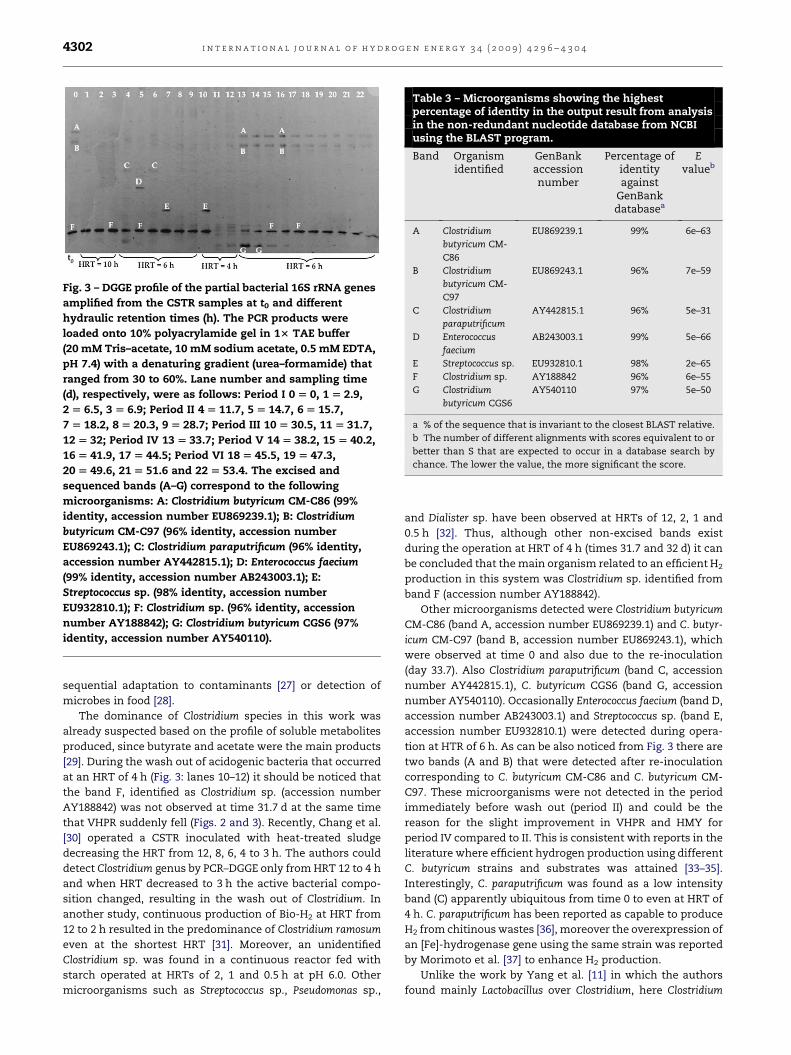
Fig. 3 – DGGE profile of the partial bacterial 16S rRNA genes
amplified from the CSTR samples at t0 and different
hydraulic retention times (h). The PCR products were
loaded onto 10% polyacrylamide gel in 13 TAE buffer
(20 mM Tris–acetate, 10 mM sodium acetate, 0.5 mM EDTA,
pH 7.4) with a denaturing gradient (urea–formamide) that
ranged from 30 to 60%. Lane number and sampling time
(d), respectively, were as follows: Period I 0 [ 0, 1 [ 2.9,
2 [ 6.5, 3 [ 6.9; Period II 4 [ 11.7, 5 [ 14.7, 6 [ 15.7,
7 [ 18.2, 8 [ 20.3, 9 [ 28.7; Period III 10 [ 30.5, 11 [ 31.7,
12 [ 32; Period IV 13 [ 33.7; Period V 14 [ 38.2, 15 [ 40.2,
16 [ 41.9, 17 [ 44.5; Period VI 18 [ 45.5, 19 [ 47.3,
20 [ 49.6, 21 [ 51.6 and 22 [ 53.4. The excised and
sequenced bands (A–G) correspond to the following
microorganisms: A: Clostridium butyricum CM-C86 (99%
identity, accession number EU869239.1); B: Clostridium
butyricum CM-C97 (96% identity, accession number
EU869243.1); C: Clostridium paraputrificum (96% identity,
accession number AY442815.1); D: Enterococcus faecium
(99% identity, accession number AB243003.1); E:
Streptococcus sp. (98% identity, accession number
EU932810.1); F: Clostridium sp. (96% identity, accession
number AY188842); G: Clostridium butyricum CGS6 (97%
identity, accession number AY540110).
Table 3 – Microorganisms showing the highestpercentage of identity in the output result from analysisin the non-redundant nucleotide database from NCBIusing the BLAST program.
Band Organismidentified
GenBankaccessionnumber
Percentage ofidentityagainst
GenBankdatabasea
Evalueb
A Clostridium
butyricum CM-
C86
EU869239.1 99% 6e–63
B Clostridium
butyricum CM-
C97
EU869243.1 96% 7e–59
C Clostridium
paraputrificum
AY442815.1 96% 5e–31
D Enterococcus
faecium
AB243003.1 99% 5e–66
E Streptococcus sp. EU932810.1 98% 2e–65
F Clostridium sp. AY188842 96% 6e–55
G Clostridium
butyricum CGS6
AY540110 97% 5e–50
a % of the sequence that is invariant to the closest BLAST relative.
b The number of different alignments with scores equivalent to or
better than S that are expected to occur in a database search by
chance. The lower the value, the more significant the score.
i n t e r n a t i o n a l j o u r n a l o f h y d r o g e n e n e r g y 3 4 ( 2 0 0 9 ) 4 2 9 6 – 4 3 0 44302
sequential adaptation to contaminants [27] or detection of
microbes in food [28].
The dominance of Clostridium species in this work was
already suspected based on the profile of soluble metabolites
produced, since butyrate and acetate were the main products
[29]. During the wash out of acidogenic bacteria that occurred
at an HRT of 4 h (Fig. 3: lanes 10–12) it should be noticed that
the band F, identified as Clostridium sp. (accession number
AY188842) was not observed at time 31.7 d at the same time
that VHPR suddenly fell (Figs. 2 and 3). Recently, Chang et al.
[30] operated a CSTR inoculated with heat-treated sludge
decreasing the HRT from 12, 8, 6, 4 to 3 h. The authors could
detect Clostridium genus by PCR–DGGE only from HRT 12 to 4 h
and when HRT decreased to 3 h the active bacterial compo-
sition changed, resulting in the wash out of Clostridium. In
another study, continuous production of Bio-H2 at HRT from
12 to 2 h resulted in the predominance of Clostridium ramosum
even at the shortest HRT [31]. Moreover, an unidentified
Clostridium sp. was found in a continuous reactor fed with
starch operated at HRTs of 2, 1 and 0.5 h at pH 6.0. Other
microorganisms such as Streptococcus sp., Pseudomonas sp.,
and Dialister sp. have been observed at HRTs of 12, 2, 1 and
0.5 h [32]. Thus, although other non-excised bands exist
during the operation at HRT of 4 h (times 31.7 and 32 d) it can
be concluded that the main organism related to an efficient H2
production in this system was Clostridium sp. identified from
band F (accession number AY188842).
Other microorganisms detected were Clostridium butyricum
CM-C86 (band A, accession number EU869239.1) and C. butyr-
icum CM-C97 (band B, accession number EU869243.1), which
were observed at time 0 and also due to the re-inoculation
(day 33.7). Also Clostridium paraputrificum (band C, accession
number AY442815.1), C. butyricum CGS6 (band G, accession
number AY540110). Occasionally Enterococcus faecium (band D,
accession number AB243003.1) and Streptococcus sp. (band E,
accession number EU932810.1) were detected during opera-
tion at HTR of 6 h. As can be also noticed from Fig. 3 there are
two bands (A and B) that were detected after re-inoculation
corresponding to C. butyricum CM-C86 and C. butyricum CM-
C97. These microorganisms were not detected in the period
immediately before wash out (period II) and could be the
reason for the slight improvement in VHPR and HMY for
period IV compared to II. This is consistent with reports in the
literature where efficient hydrogen production using different
C. butyricum strains and substrates was attained [33–35].
Interestingly, C. paraputrificum was found as a low intensity
band (C) apparently ubiquitous from time 0 to even at HRT of
4 h. C. paraputrificum has been reported as capable to produce
H2 from chitinous wastes [36], moreover the overexpression of
an [Fe]-hydrogenase gene using the same strain was reported
by Morimoto et al. [37] to enhance H2 production.
Unlike the work by Yang et al. [11] in which the authors
found mainly Lactobacillus over Clostridium, here Clostridium
i n t e r n a t i o n a l j o u r n a l o f h y d r o g e n e n e r g y 3 4 ( 2 0 0 9 ) 4 2 9 6 – 4 3 0 4 4303
genus was detected during the operation of the CSTR at HRTs
of 10 and 6 h, shorter than the 24 h used by those authors. It
has been reported that Lactobacillus could be related to low H2
production rates [38], then this feature could also explain the
aforementioned differences in VHPR between this work and
the reported by Yang et al. [11]. It must be remarked that
although a very similar substrate (CWP) was used in both
works, the selection of a suitable inoculum could also play an
important role. In that work [11], the authors used a seed
inoculum from an anaerobic digester with an HRT of 24 d,
while for this work a granular sludge from a full-scale meth-
anogenic reactor that has been operated for over 10 years with
frequent periods of acidification was selected. Therefore, it
was hypothesized that the inoculum used here could be
naturally enriched toward acidogenic bacteria.
4. Conclusions
The results from this study have shown that an enhancement
of VHPR by increasing OLR using CW and mixed microbial
community was feasible. It was demonstrated that shorter
HRTs than previously reported with the use of CW, are rec-
ommended for better hydrogen production performance
including both higher VHPR and H2% in the gas phase. It was
shown that HRT had a strong effect on the microbial commu-
nity detected by DGGE. Because wash out of acidogenic bacteria
was observed at an HRT of 4 h, an HRT of 6 h is recommended.
Clostridium sp. (accession number AY188842) was the dominant
of the microbial community in the bioreactor and was related
to the best performance achieved in the CSTR. Moreover, it was
shown that the OLR had an effect on the hydrogen production
performance with a substrate overload similar to other pub-
lished works. This suggests that regardless the fermentation
system used, there is an OLR threshold for bacteria which
directs metabolic routes away from Bio-H2 production. Thus, in
order to enhance VHPR, it is relevant to work with both
appropriate conditions such as HRT and OLR and to select
initial inocula that could be enriched toward efficient
hydrogen-producing microorganisms.
Finally, an enhancement in VHPR is significant because
this is a critical parameter in the assessment of the full-scale
practical application of fermentation technologies. Because
the higher the VHPRs, the smaller the size and consequently
the cost of the reactor needed for sustainable and clean energy
generation from Bio-H2 in the near future.
Acknowledgements
This work was supported by the Fondo Mixto San Luis Potosı –
Consejo Nacional de Ciencia y Tecnologıa, project FMSLP-
2005-C01-23. The authors acknowledge the technical
assistance of Erika Nahomy Marino-Marmolejo, Leandro G.
Ordonez-Acevedo, Dulce Partida Gutierrez and Guillermo
Vidriales Escobar. Insightful comments from Dr. Felipe Ala-
triste-Mondragon helped to improve the manuscript. A. de
Leon-Rodrıguez acknowledges the sabbatical fellowship 79973
from CONACyT.
r e f e r e n c e s
[1] Manish S, Banerjee R. Comparison of biohydrogenproduction processes. Int J Hydrogen Energy 2008;33:279–86.
[2] Hawkes FR, Hussy I, Kyazze G, Dinsdale R, Hawkes DL.Continuous dark fermentative hydrogen production bymesophilic microflora: principles and progress. Int JHydrogen Energy 2007;32:172–84.
[3] Rittmann BE. Opportunities for renewable bioenergy usingmicroorganisms. Biotechnol Bioeng 2008;100:203–12.
[4] Davila-Vazquez G, Arriaga S, Alatriste-Mondragon F, deLeon-Rodrıguez A, Rosales-Colunga LM, Razo-Flores E.Fermentative biohydrogen production: trends andperspectives. Rev Environ Sci Biotechnol 2008;7:27–45.
[5] Kapdan IK, Kargi F. Bio-hydrogen production from wastematerials. Enzyme Microb Technol 2006;38:569–82.
[6] Ozmihci S, Kargi F. Continuous ethanol fermentation ofcheese whey powder solution: effects of hydraulic residencetime. Bioprocess Biosyst Eng 2007;30:79–86.
[7] Gannoun H, Khelifi E, Bouallagui H, Touhami Y, Hamdi M.Ecological clarification of cheese whey prior to anaerobicdigestion in upflow anaerobic filter. Bioresour Technol 2008;99:6105–11.
[8] Calli B, Schoenmaekers K, Vanbroekhoven K, Diels L. Darkfermentative H2 production from xylose and lactose-effectsof on-line pH control. Int J Hydrogen Energy 2008;33:522–30.
[9] Ferchichi M, Crabbe E, Gil GH, Hintz W, Almadidy A.Influence of initial pH on hydrogen production from cheesewhey. J Biotechnol 2005;120:402–9.
[10] Collet C, Adler N, Schwitzguebel JP, Peringer P. Hydrogenproduction by Clostridium thermolacticum during continuousfermentation of lactose. Int J Hydrogen Energy 2004;29:1479–85.
[11] Yang P, Zhang R, McGarvey JA, Benemann JR. Biohydrogenproduction from cheese processing wastewater by anaerobicfermentation using mixed microbial communities. Int JHydrogen Energy 2007;32:4761–71.
[12] Levin DB, Pitt L, Love M. Biohydrogen production: prospectsand limitations to practical application. Int J HydrogenEnergy 2004;29:173–85.
[13] Kyazze G, Dinsdale R, Guwy AJ, Hawkes FR, Premier GC,Hawkes DL. Performance characteristics of a two-stage darkfermentative system producing hydrogen and methanecontinuously. Biotechnol Bioeng 2007;97:759–70.
[14] Kraemer JT, Bagley DM. Improving the yield fromfermentative hydrogen production. Biotechnol Lett 2007;29:685–95.
[15] Davila-Vazquez G, Alatriste-Mondragon F, de Leon-Rodriguez A, Razo-Flores E. Fermentative hydrogenproduction in batch experiments using lactose, cheese wheyand glucose: influence of initial substrate concentration andpH. Int J Hydrogen Energy 2008;33:4989–97.
[16] APHA, AWWA, WEF. Standard methods for the examination ofwater and wastewater. Washington, DC, USA: American PublicHealth Association (APHA), American Water Works Association(AWWA), Water Environment Federation (WEF); 1998.
[17] Sekiguchi Y, Kamagata Y, Syutsubo K, Ohashi A, Harada H,Nakamura K. Phylogenetic diversity of mesophilic andthermophilic granular sludges determined by 16S rRNA geneanalysis. Microbiol SGM 1998;144:2655–65.
[18] Wisotzkey JD, Jurtshuk Jr P, Fox GE. PCR amplification of 16SrDNA from lyophilized cell cultures facilitates studies inmolecular systematics. Curr Microbiol 1990;21:325–7.
[19] Muyzer G, de Waal EC, Uitterlinden AG. Profiling of complexmicrobial populations by denaturing gradient gelelectrophoresis analysis of polymerase chain reaction–amplified genes coding for 16S rRNA. Appl Environ Microbiol1993;59:695–700.
i n t e r n a t i o n a l j o u r n a l o f h y d r o g e n e n e r g y 3 4 ( 2 0 0 9 ) 4 2 9 6 – 4 3 0 44304
[20] Show K-Y, Zhang Z-P, Tay J-H, Tee Liang D, Lee D-J, Jiang W-J.Production of hydrogen in a granular sludge-based anaerobiccontinuous stirred tank reactor. Int J Hydrogen Energy 2007;32:4744–53.
[21] Van Ginkel SW, Logan B. Increased biological hydrogenproduction with reduced organic loading. Water Res 2005;39:3819–26.
[22] Hussy I, Hawkes FR, Dinsdale R, Hawkes DL. Continuousfermentative hydrogen production from a wheat starchco-product by mixed microflora. Biotechnol Bioeng 2003;84:619–26.
[23] Koskinen PEP, Kaksonen AH, Puhakka JA. The relationshipbetween instability of H2 production and compositions ofbacterial communities within a dark fermentation fluidised-bed bioreactor. Biotechnol Bioeng 2007;97:742–58.
[24] Guo W-Q, Ren N-Q, Wang X-J, Xiang W-S, Meng Z-H, Ding J,et al. Biohydrogen production from ethanol-typefermentation of molasses in an expanded granular sludgebed (EGSB) reactor. Int J Hydrogen Energy 2008;33:4981–8.
[25] Kim S-H, Han S-K, Shin H-S. Effect of substrate concentrationon hydrogen production and 16S rDNA-based analysis of themicrobial community in a continuous fermenter. ProcessBiochem 2006;41:199–207.
[26] Redwood MD, Paterson-Beedle M, Macaskie LE. Integratingdark and light biohydrogen production strategies: towardsthe hydrogen economy. Rev Environ Sci Biotechnol, in pressdoi: 10.1007/s11157-008-9144-9.
[27] Park JY, Sang BI. Change of sludge consortium in response tosequential adaptation to benzene, toluene, and o-xylene.J Microbiol Biotechnol 2007;17:1772–81.
[28] Ercolini D. PCR–DGGE fingerprinting: novel strategies fordetection of microbes in food. J Microbiol Methods 2004;56:297–314.
[29] Chen X, Sun YQ, Xiu ZL, Li XH, Zhang DJ. Stoichiometricanalysis of biological hydrogen production by fermentativebacteria. Int J Hydrogen Energy 2006;31:539–49.
[30] Chang J-J, Wu J-H, Wen F-S, Hung K-Y, Chen Y-T, Hsiao C-L,et al. Molecular monitoring of microbes in a continuoushydrogen-producing system with different hydraulicretention time. Int J Hydrogen Energy 2008;33:1579–85.
[31] Lin CY, Lee CY, Tseng IC, Shiao IZ. Biohydrogen productionfrom sucrose using base-enriched anaerobic mixedmicroflora. Process Biochem 2006;41:915–9.
[32] Cheng C-H, Hung C-H, Lee K-S, Liau P-Y, Liang C-M,Yang L-H, et al. Microbial community structure of a starch-feeding fermentative hydrogen production reactor operatedunder different incubation conditions. Int J Hydrogen Energy2008;33:5242–9.
[33] Chen WM, Tseng ZJ, Lee KS, Chang JS. Fermentativehydrogen production with Clostridium butyricum CGS5isolated from anaerobic sewage sludge. Int J HydrogenEnergy 2005;30:1063–70.
[34] Chen S-D, Lee K-S, Lo Y-C, Chen W-M, Wu J-F, Lin C-Y, et al.Batch and continuous biohydrogen production from starchhydrolysate by Clostridium species. Int J Hydrogen Energy2008;33:1803–12.
[35] Wang X, Jin B, Mulcahy D. Impact of carbon and nitrogensources on hydrogen production by a newly isolatedClostridium butyricum W5. Int J Hydrogen Energy 2008;33:4998–5005.
[36] Evvyernie D, Morimoto K, Karita S, Kimura T, Sakka K,Ohmiya K. Conversion of chitinous wastes to hydrogen gasby Clostridium paraputrificum M-21. J Bioscience Bioeng 2001;91:339–43.
[37] Morimoto K, Kimura T, Sakka K, Ohmiya K. Overexpressionof a hydrogenase gene in Clostridium paraputrificum toenhance hydrogen gas production. FEMS Microbiol Lett 2005;246:229–34.
[38] Jo JH, Jeon CO, Lee DS, Park JM. Process stability andmicrobial community structure in anaerobic hydrogen-producing microflora from food waste containing kimchi.J Biotechnol 2007;131:300–8.