continuing in mathematics: a longitudinal study of the attitudes of high school girls
TRANSCRIPT

Continuing in Mathematics: A Longitudinal Study of the
Attitudes of High School Girls
Julia Sherman
WRI of Wisconsin, Inc.
The mathematics attitudes (determined by ratings on the Fennema-Sher- man Mathematics Attitudes Scales) of ninth grade girls of similar intellect who subsequently took one to four years of college preparatory math were compared in 1975 and 1978 (n = 84). Math enrollment groups differed significantly on the following scales: Usefulness of Mathematics, Confidence in Learning Mathemat- ics, Teacher (perceived attitude toward the student as a learner of mathematics), and Effectance Motivation in Mathematics as assessed both in Grades 9 and 12, and on the Math as a Male Domain Scale as assessed in Grade 12. From Grade 9 to 12, scores on the Attitude toward Success in Math Scale became significantly more positive.
Maccoby and Jacklin (1974) concluded that “boys excel in mathe- matical ability.” However, controlling for mathematics background, Fen- nema and Sherman (1977) found no statistically significant difference between the sexes in mathematics achievement at two high schools and small differences at two other high schools. The differences in math achievement, when found, were accompanied by less favorable attitudes toward mathematics on the part of girls. These data support the view that the crucial factor is not “ability,” per se, but differences between the sexes in their pursuit of mathematics. Given the importance of mathe- matics to the development of girls’career potential (Astin, 1968; Astin &
This research was supported in part by a grant from the National Institute of Educa- tion. The opinions herein do not necessarily reflect the position or policy of the National Institute of Education and no official endorsement should be inferred.
Requests for reprints should be sent to Julia A. Sherman, WRI of Wisconsin, fnc., 3917 Plymouth Circle, Madison, WI 53705.
132 Psychology of Women Quarterly, Vol. 7(2) Winter 1982 0361-6843/82/1600-0132/$02.75 0 1982 Human Sciences Press
133
SHEKMANICONTINUING I N MATHEMATICS
Myint, 197 1 ; Carnegie Commission, 1973), girls’ mathematics attitudes and enrollment behaviors become matters of interest.
The present study deals with two questions: (a) Are attitudes toward mathematics behavior a causal factor affecting girls’ enrollment in math- ematics classes? (b) What changes occur in girls’ attitudes toward mathe- matics over the high school years, particularly in those attitudes most related to sex role?’
Previous research has established a correlational relationship be- tween attitudes and pursuit of mathematics. A study of the attitudes differentiating tenth and eleventh grade students (n = 7 16) who did and did not intend to take another year of math showed that, controlling for cognitive factors, students intending to take another year of math had significantly more favorable attitudes toward mathematics on seven out of eight of the Fennema-Sherman Mathematics Attitudes Scales (Sher- man & Fennema, 1977). The present study provides data regarding actual enrollment behavior and compares attitudes toward mathematics of cognitively equated groups of girls who subsequently elected 1 or 2 , 3 , or 4 years of the college preparatory mathematics sequence. (Actual courses described in next section.) Attitudes were assessed before enroll- ment behavior occurred, creating conditions in which a logical inference of a causal relationship can be made (Heise, 1975).
Little is known about developmental changes in attitudes toward mathematics, though some cross-sectional longitudinal data are available for Grades 6-1 1 (Fennema & Sherman, 1978). During those years the tendency to stereotype Math as a Male Domain decreased for both girls and boys. There was no significant change on the Attitude toward Suc- cess in Mathematics Scale from sixth to eighth grade, but Attitude to- ward Success became more positive from ninth to eleventh grade. Data reported here assess longitudinal changes in attitudes toward mathemat- ics from the first to the last year of high school.
METHOD
Subject Selection
The subjects were a relatively unbiased and carefully selected group. The subject pool consisted of girls previously tested in 1975 when they were in the
‘Because of its widespread use, the term “sex role” was used, but I do not find it con- ceptually satisfactory.
134
PSYCHOLOGY OF WOMEN QUARTERLY
ninth grade (Fennema & Sherman, 1977). The girls (along with the boys) had been representatively selected by Algebra class from all four public high schools in a medium sized midwestern city. Nearly all subjects were white; socioeconomic status ranged from lower class to upper middle class. In the 1977-78 school year, an attempt was made to locate these students at the same high schools. Of the original 219 girls, 177 were located and 172 agreed to participate in the study. Cognitive scores of the original group and the remaining group were similar (see Fennema & Sherman, 1977).
Of the 172 girls, 31 were enrolled in ;i fourth year of college preparatory math (Group 4). Subjects were selected from among the girls who took one (n =
14), two (n = 59) or three (n = 68) years of the college preparatory math sequence such that as groups they were cognitively similar to Group 4. Girls with one or two years of math were combined in one group (Group 2) in order to have a sufficient number of subjects. The groups were equated on the basis of their ninth grade scores on vocabulary (Borgatta 8c Corsini, 1964) and spatial visualization (Bennett, Seashore, & Wesman, 1973). Vocabulary and spatial visu- alization were used as a basis for equating the groups since both these factors correlated moderately (.49, .45 respectively for girls) with mathematics achieve- ment (Fennema & Sherman, 1977). The groups were not equated for mathemat- ics achievement per se since this factor appeared too confounded with the vari- able being investigated, the study of mathematics. However, as it happened, Groups 3 and 4 were not significantly different in mathematics achievement (Scannell, 1972) as assessed in the ninth grade. Also, Groups 2 and 3, though matched only to Group 4, were also equivalent to each other on vocabulary and spatial visualization. (For results from final sample, see Table 1).
In this way a total of 93 subjects, approximately equal numbers in each group, were selected. Of these, it was possible to retest 84 girls. (Severe weather, illness, and other scheduling difficulties made it impossible to test the rest.) In Group 2, 23 subjects had taken Algebra 1 and Geometry while 3 subjects had taken only Algebra 1. In Group 3, the 29 subjects had taken Algebra 1 and Geometry as well as Algebra-Trig or Precalculus. In Group 4, the 29 subjects had taken the preceding math courses plus either Advanced Algebra, Calculus, or Advanced Math (a fourth- year level course of selected topics). These groupings represented the typical college preparatory math sequence of the city’s school system although students could deviate from this sequence.
Materials
Vocabulary was used as the best quick index of general intelligence and verbal skill and was measured by the Quick Word Test (possible range 0-100). This test correlated .85 with Full Scale Wechsler Bellevue I Q scores (Borgatta & Corsini, 1964). Spatial visualization (range 0-60) was measured by the Space Relations Test of the Differential Aptitude Test (Bennett, Seashore, & Wesman, 1973). Math achievement (range 0-48) at the ninth grade level was measured by
135
SHERMANICONTINUING IN MATHEMATICS
the Test of Academic Progress (Scannell, 1972). The Fennema-Sherman Mathe- matics Attitudes Scales consist of eight 5-point Likert scales measuring attitudes toward mathematics (range 12-60 for each). Split-half reliabilities range from .87-33. Each scale consists of twelve items, half weighted negatively and half positively. The scales are Confidence in Learning Mathematics; Mother, Father, and Teacher Scales (perceived attitudes of each of these persons toward one as a learner of mathematics); Usefulness of Mathematics; Effectance Moti- vation in Math (joy in problem solving); Attitude toward Success in Mathematics; and Math as a Male Domain. While all scales are conceived to be relevant to sex role, with the prescriptions and proscriptions of the role mediated through a variety of attitudes such as confidence and perceived usefulness of mathematics, the last two scales measure attitudes more directly relevant to sex role. The Attitude toward Success in Mathematics Scale concerns the extent to which public success in mathematics evoked positive as opposed to negative emotions (e.g., embarassment). The scale was inspired by Horner’s (1972) concept of fear of success, but has not been empirically related to it. The Math as a Male Domain Scale concerns opinions that females cannot do math so well as males or that females who do well in math are peculiar or masculine. Scores for this scale range from low score, math seen as a male domain, to high score, math seen as sex-neutral. Low scores represent attitudes less favorable to the learning of mathematics (except possibly for boys). A principal components factor analysis yielded four factors with Math as a Male Domain and Attitude toward Success in Mathematics each as a separate factor. Fuller descriptions of the rationale and development of‘ the scales, definitions of the concepts, the items and relevant statistics, including scale intercorrelations, can be found in Fennema and Sher- man (1976).
Procedure
These data were gathered as part of a larger study (Sherman, 1979, 1982). The subjects were first interviewed about educational and work plans and their experiences with mathematics; then they were given the Fennema-Sherman Mathematics Attitudes Scales and a mathematics test. The interview (Sherman, 1982) and mathematics test results (Sherman, 1979) are not reported here. Subjects were tested in their own schools, individually or in small groups. They were told that the study concerned why girls did and did not enroll in high school mathematics. Data were analyzed by analysis of variance to compare groups. Univariate Fs were used in order to evaluate each scale individually*,
‘A multivariate approach (including males) to differentiating the larger pool of math enrollment groups on both cognitive and affective variables may be found in Sherman (1981). MANOVA was not used in this report since results for individual scales, especially those directly related to sex role attitudes, were of particular interest. Note also that use of the conventional .05 level of probability is a conservative test of differences since the groups were matched.
136
PSYCHOLOGY OF WOMEN QUARTERLY
and t tests for related means were used to compare changes in scores over the three-year interval. Scores in 1975 were correlated with 1978 scores to obtain stability coefficients.
RESULTS
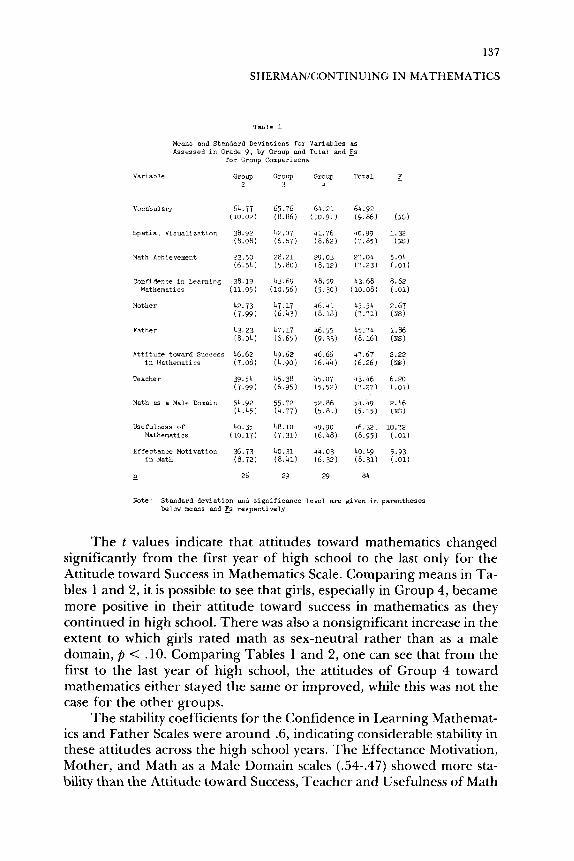
The means and standard deviations for the variables as assessed in Grade 9 in 1975 are presented in Table 1 along with the F values for group comparisons. As can be seen, the effort to equate the groups cognitively was successful though, as indicated, they differed in math achievement. As ninth graders, there were overall significant differences among the groups for the following variables: Usefulness of Math, Con- fidence in Learning Math, Teacher Scale and Effectance Motivation in Math. As may be seen from Table 1 , these effects can generally be accounted for by comparison of Group 2 with the other groups. There were fewer differences between Groups 3 and 4. The differences be- tween groups were not completely monotonic though scores of Group 2 were always less favorable than Group 3 and usually less favorable than Group 4.
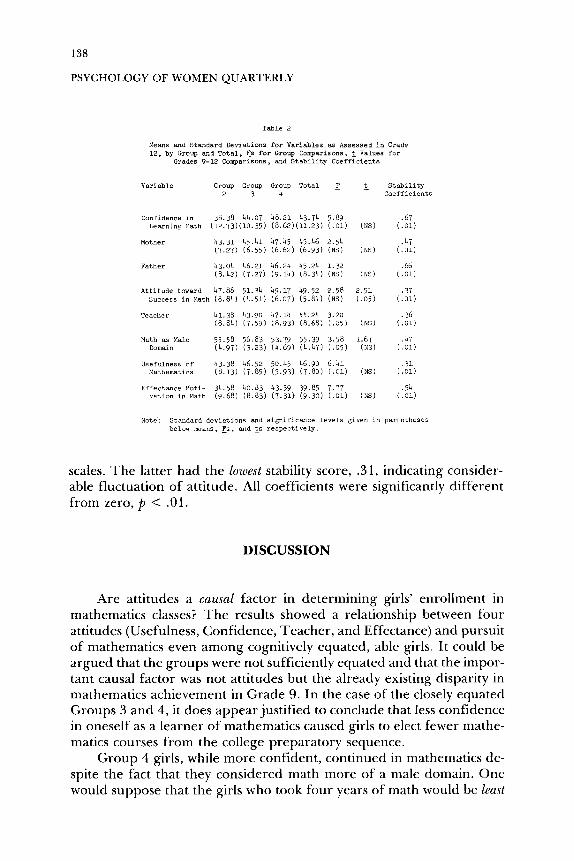
The means and standard deviations for variables as assessed in Grade 12 are given in Table 2 along with Fs for group comparisons and t values for the comparisons between scores in grades 9 and 12. In the right hand column of Table 2 are the stability coefficients for each scale. As seniors, the groups still significantly differed on the same scales. In addition, they were significantly different on the Math as a Male Domain Scale, Group 4 considering math as more of a male domain than the other groups. With a couple of exceptions, differences among groups were now more clearly monotonic with those students attempting more years of the math sequence having more favorable scores. As with the ninth grade data, the significant overall differences among the groups can mostly be attributed to the comparisons of Group 2 with the other groups. The comparison of Groups 3 and 4, who were also matched on math achievement, is particularly instructive. (There was also no dif- ference between these groups in background variables, see Sherman, 1982.) Group 4 attitudes were more favorable in that Confidence in Learning Mathematics was higher for Group 4 than for Group 3 in Grade 9, t(56) = 2.01, p < .05. However, Group 4 stereotyped math more as a male domain both in Grade 9, +(56) = 2.15, p < .05, and in Grade 12, t (56) = 2.66,p < .01.
137
SHERMAN/CONTINUING IN MATHEMATICS
Table 1
Means and Standard Deviations for Variables 85
Assessed i n Grade 9 , by Group and Tota l and c s f o r Group Comparisons
Variable Group Group Group Total c 2 3 4
Vocabulaly 64.77 (10.02)
Spat ia l Visuelize.tion 38.92 ( 8 . 0 8 )
Math Achievement 23.50 (6.541
Confidence in Learning 38.19 Mathematics (11.05)
Mother 42.73 (7 .99)
Attitude toward Success 46.62 i n 14athematics ( 7 . 0 8 )
(7 .99)
(4 .45)
Mathematics (10.17)
i n Math (8.72)
Teacher 39.54
Math 85 a Male Domain 5b.92
Usefulness of 40.35
Effectance Motivation 36.73
- 26
65.76 (6.86)
42.07 (6 .67)
28.21 ( 5 . 8 0 )
43.69 (10 .56)
47.17 (6 .43)
47.17 (6 .65)
49.62 (4 .90)
45.38 (6 .95)
55.72 (4.77)
48.10 (7 .31)
40.31 (8.41)
29
64.21 (10.91)
41.76 (8 .62)
29.03 (6 .12)
48.59 (5 .30)
46.41 (8 .18)
46.55 (9 .33)
46.66 (6 .44)
45.07 (5 .52)
52.86 (5.81)
49.90 (6.48)
44.03 (6 .32)
29
64.92 (9.861
40.99 ( 7 . 8 5 )
27.04 (7.23)
43.68 (10.08)
45.54 (7.71)
45.74 (8 .16)
47.67 (6.261
43.46 (7 .27)
54.49 (5.15)
46.32 (8.95)
40.49 (8 .31)
84
(NS)
1.32 (NS)
5.04 ( .01)
8.62 (.01)
2.67 (NS)
1.86 (NS)
2.22 "8)
(.01)
2.46 (NS)
10.72 (.01)
5.93 (.01)
6.20
Note: Standard deviation and s igni f icance level arr given i n parentheses below means and cs respect ive ly
The t values indicate that attitudes toward mathematics changed significantly from the first year of high school to the last only for the Attitude toward Success in Mathematics Scale. Comparing means in Ta- bles 1 and 2, it is possible to see that girls, especially in Group 4, became more positive in their attitude toward success in mathematics as they continued in high school. There was also a nonsignificant increase in the extent to which girls rated math as sex-neutral rather than as a male domain, p < .lo. Comparing Tables 1 and 2, one can see that from the first to the last year of high school, the attitudes of Group 4 toward mathematics either stayed the same or improved, while this was not the case for the other groups.
The stability coefficients for the Confidence in Learning Mathemat- ics and Father Scales were around .6, indicating considerable stability in these attitudes across the high school years. The Effectance Motivation, Mother, and Math as a Male Domain scales (.54-.47) showed more sta- bility than the Attitude toward Success, Teacher and Usefulness of Math
138
PSYCHOLOGY OF WOMEN QUARTERLY
Table 2
Means a d Standard Deviations for Variables &s Assessed i n Grade 12 , by Group and Tota l . rs For Group Comparisons, 4 Values for
Grades 9-12 Comparisons, and S t a b i l i t y Coeff ic ien ts
Variable Group Group Group Tota l t S t a b i l i t y Coeff ic ien t= 2 3 4
Confidence i n 38.38 44.07 48.21 43.74 5.89 Learning Math (12 .73) (10 .35) (8 .62) (11 .23) (.01) (NS)
Mother 4 3 . j 1 45.41 47.45 45.46 2.54 (7 .27) (6.55) ( 6 . 6 2 ) (6 .93) ( N S ) (NS)
Father 43.04 46.21 46.24 45.24 1.32 (8 .42) (7.27) (9.14) (8 .34) (NS) ( N S )
Att i tude toward 47.88 51.34 49.17 49.52 2.58 2 .51 Success i n Math ( 8 . 8 4 ) (4 .51) (6 .07) (5 .84) (NS) ( . 0 5 )
Teacher 41.38 183.90 47.14 44.24 3.20 18.84) (7.59) (8.93) (8.68) ( . 0 5 ) (NS)
Math as Male 55.58 56.83 53.79 55.39 3.58 1.67 Dornai n ( 4 . 9 7 ) (3 .23) ( 4 . 6 9 ) ( 4 . 4 7 ) ( . 0 5 ) (NS)
Usefulness of 43.38 46.52 50.45 46.90 6 .41 Mathematics ( 8 . 1 3 ) (7 .85) (5 .93) ( 7 . 8 0 ) ( . 0 1 ) (NS)
Effec tmce Moti- 34.58 40.83 43.59 39.85 7.77 va t ion i n Math ( 9 . 6 8 ) (8 .83) (7.31) ( 9 . 3 0 ) (.0l) ( N S )
Note: Standard devia t ions and s igni f icance levels given i n pawntheses below means. cs, and 4s respec t ive ly .
scales. The latter had the lowest stability score, .3 1, indicating consider- able fluctuation of attitude. All coefficients were significantly different from zero, p < .01.
DISCUSSION
Are attitudes a causal factor in determining girls’ enrollment in mathematics classes? The results showed a relationship between four attitudes (Usefulness, Confidence, Teacher, and Effectance) and pursuit of mathematics even among cognitively equated, able girls. It could be argued that the groups were not sufficiently equated and that the impor- tant causal factor was not attitudes but the already existing disparity in mathematics achievement in Grade 9. In the case of the closely equated Groups 3 and 4, it does appear justified to conclude that less confidence in oneself as a learner of mathematics caused girls to elect fewer mathe- matics courses from the college preparatory sequence.
Group 4 girls, while more confident, continued in mathematics de- spite the fact that they considered math more of a male domain. One would suppose that the girls who took four years of math would be least
139
SHERMANICONTINUING I N M A T H E M A T I C S
of the opinion that math is a domain where females do poorly and do not belong. One explanation is that some of these girls felt that they were personally different and able to handle tasks in a “male domain” even if the rest oftheir sex could not. However, the feelings of Group 4 toward issues of sex role and achievement were more ambivalent than those of the other groups (Sherman, 1982). Matina Horner (1972) observed that fear of success is most intense among those most at risk to succeed. These findings support that observation and suggest that sex-role strain about achievement is generally more intense in those most likely to achieve notably in a male area. Girls in Group 4 continued in mathemat- ics despite potentially more sex-role strain, probably because of their otherwise more favorable attitudes toward math, e.g. their greater confi- dence and possibly greater interest in mathematics (effectance motivation).
As a group, the girls did not change their views much from Grade 9 to Grade 12, except that they became less “fearful” of success in math. They stereotyped math less as a male domain but this effect was not statistically significant. Since 60 was the highest possible score and the average score was 54.49 in Grade 9, it may be that there was not suffi- cient ceiling in the scale to register positive change. These changes ap- peared to be maturational and attributable to more experience and facil- ity in dealing with female role requirements. They are consistent with results from the cross-sectional design (Fennema & Sherman, 1978), suggesting that the improved attitudes are not attributable to social change over the period 1975- 1978. Comments during interviews also corroborated the developmental nature of the changes, e.g., “I used to play dumb, but I found out my boyfriend prefers me to be myself’ (Sherman, 1982).
The most stable attitudes were Confidence in Learning Math and perceived attitude of Father toward one as a learner of mathematics. The importance of Confidence is clear; the high stability of the Father Scale is consistent with a variety of data suggesting the special impor- tance of father in girls’ learning of mathematics (Sherman, 1978). The low stability of perceived Usefulness of Math is surprising and suggests that students were poorly informed in Grade 9.
Practical Implications
The study suggests a relationship between lack of confidence in oneself as a learner of mathematics and discontinuation of the study of mathematics. This result emphasizes the need for encouragement and a
140
PSYCHOLOGY OF WOMEN QUARTERLY
supportive learning atmosphere. Observing the world of math educa- tion, one can note the prevalence of a philosophy of exclusion rather than inclusion. Too often, the emphasis is on weeding out the less adept students rather than on enabling all students to master as much mathe- matics as possible. Teachers and educational systems need to develop a more supportive environment for the learning of mathematics. While the clearest case for a causal relationship between attitudes and enroll- ment in mathematics courses can be made for confidence in oneself as a learner of mathematics, there is suggestive evidence of the importance of perceived attitude of the teacher, perceived usefulness of mathemat- ics, and effectance motivation in mathematics. These data warrant the attention of policy makers, teachers, and counselors.
REFERENCES
Astin, H. S. Career development of girls during the high school years.Journa1 of Counseling
Astin, H. S . , & Myint, T. Career development and stability of young women during the
Bennett, G . K., Seashore, H. G., & Wesman, A. G. Dfferential Aptitude Tectc, Form S and T.
Borgatta, E. F., & Corsini, R.J. Quick Ward Test, Manual. New York: Harcourt, Brace, 1964. Carnegie Commission on Higher Education. Opportunitiesfor women in higher education. New
York: McCraw-Hill, 1973. Fennema, E., & Sherman, J. Fennema-Sherman Mathematics Attitudes Scales. JSAS Cuta-
log of Selected Documents in Psychology, 1976, 6, 3 1. (Ms. No. 1225) Fennema, E., & Sherman, J. Sex-related differences in mathematics achievement, spatial
visualization and affective factors. American Educational Research journal, 1977, 14, 51-71.
Fennema, E., 8c Sherman, J . Sex-related differences in mathematics achievement and related factors: A further study. Journal for Research in Mathematics Education, 1978, 9, 189-203.
Psychology, 1968, 15, 536-540.
post high school years. Journal of Counseling Psychology, 197 1, 19, 369-394.
(4th ed.). New York: Psychological Corporation, 1973.
Heise, D. R. Causal analysis. New York: Wiley, 1975. Homer, M. S. Toward an understanding of achievement-related conflicts in women. jour-
Maccoby, E. E., & Jacklin, C. N. Psychology ofsex dqferences. Palo Alto, California: Stanford
Scannell, D. P. Test of Academic Progress, Mmmal, Form S . Boston: Houghton Mifflin, 1972. Sherman, J. Sex-related cognitwe dqferences: An essay on theory and eutdence. Springfield:
Sherman, J. Predicting mathematics performance in high school girls and boys. Journal of
Sherman, J. Mathematics the critical filter: A look at some residues. Psychology of Women
Sherman, J. Girls’ and boys’ enrollment in college preparatory mathematics: A longitudi-
Sherman, J., & Fennema, E. The study of mathematics by high school girls and boys:
nal of Social Issues, 1972, 28(2), 157-1 75.
University Press, 1974.
Charles C . Thomas, 1978.
Educational Psychology, 1979, 71, 242-249.
Quarterly, 1982, 6, 428-444.
nal study. Psychology of Women Quarterly, 1981, 5, 681-689.
Related variables. American Educational Research Journal, 1977, 14, 359-168.