continual reassessment method for first-in-human … cps 2... · continual reassessment method for...
TRANSCRIPT
Continual Reassessment Method for First-in-Human Trial: From Design to Trial Implementation
Inna Perevozskaya Statistical Research and Consulting Center, Pfizer in collaboration with
Lixin Han, Infinity Pharmaceuticals Oncology
Kristen Pierce, Pfizer Oncology
SCT Annual Meeting, May 20, 2014, Philadelphia

Acknowledgements
This work reflects contribution of many individuals, without their efforts this study would not be possible:
– Michael Krams – Vladimir Dragalin – Amar Sharma – Tom Parke – Charles Zacharchuk – Robert Millham
Introduction
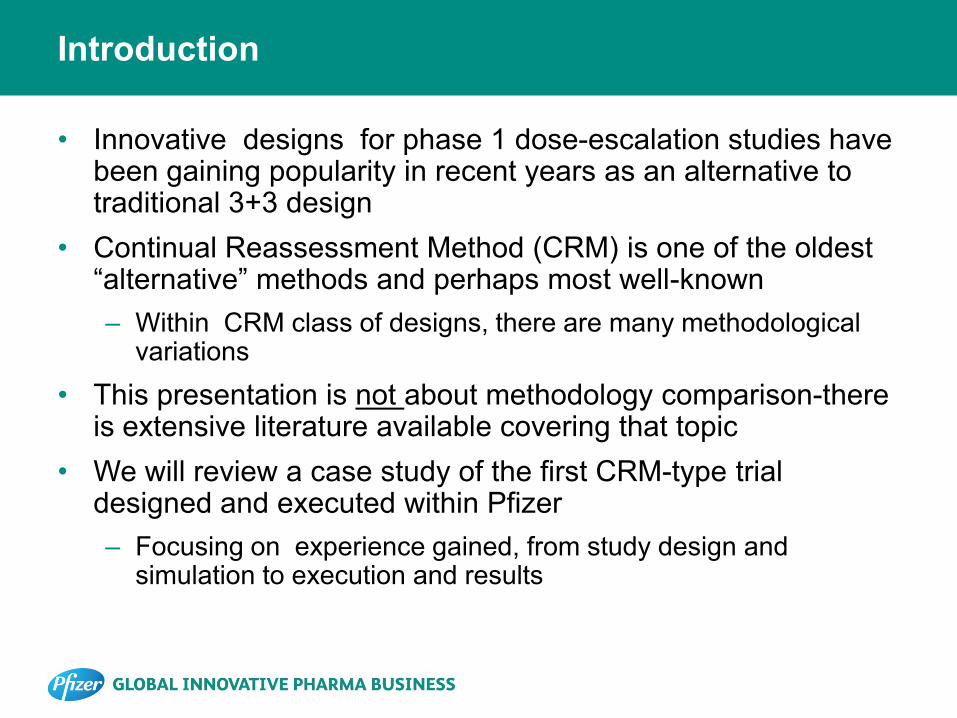
• Innovative designs for phase 1 dose-escalation studies have been gaining popularity in recent years as an alternative to traditional 3+3 design
• Continual Reassessment Method (CRM) is one of the oldest “alternative” methods and perhaps most well-known – Within CRM class of designs, there are many methodological
variations • This presentation is not about methodology comparison-there
is extensive literature available covering that topic • We will review a case study of the first CRM-type trial
designed and executed within Pfizer – Focusing on experience gained, from study design and
simulation to execution and results

Study Background and Design
• Phase 1, open–label study • PF-05212384, a.k.a PI3K-inhibitor, administered once weekly via IV
infusion to subjects with solid tumors • Study conducted in 2 parts: • Part 1 (≤50 subjects):
– MTD estimation utilizing CRM algorithm – Open to subjects with any solid tumor
• Part 2 (~20-30 additional subjects): – MTD confirmation phase
• Confirming safety and tolerability of MTD selected in Part 1
• Assessment of anti-tumor activity
– Open to subjects with select tumor types thought to be sensitive to PI3K pathway
Focus of statistical design
Adaptive Design Opportunity
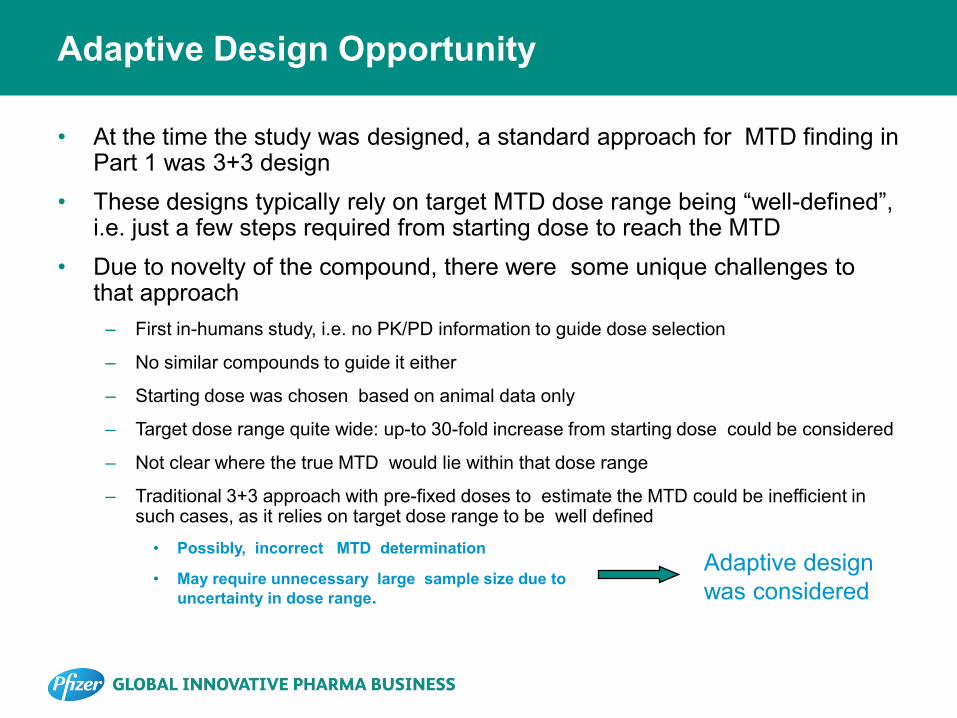
• At the time the study was designed, a standard approach for MTD finding in Part 1 was 3+3 design
• These designs typically rely on target MTD dose range being “well-defined”, i.e. just a few steps required from starting dose to reach the MTD
• Due to novelty of the compound, there were some unique challenges to that approach
– First in-humans study, i.e. no PK/PD information to guide dose selection
– No similar compounds to guide it either
– Starting dose was chosen based on animal data only
– Target dose range quite wide: up-to 30-fold increase from starting dose could be considered
– Not clear where the true MTD would lie within that dose range
– Traditional 3+3 approach with pre-fixed doses to estimate the MTD could be inefficient in such cases, as it relies on target dose range to be well defined
• Possibly, incorrect MTD determination
• May require unnecessary large sample size due to uncertainty in dose range.
Adaptive design was considered
Part 1 Study Design: Modified CRM algorithm
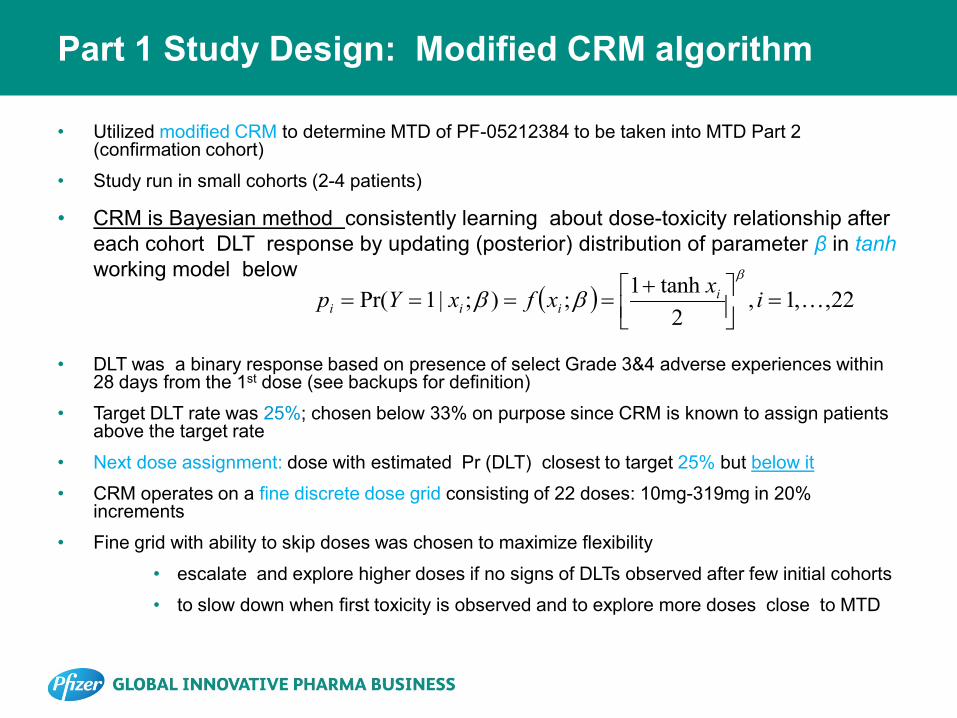
• Utilized modified CRM to determine MTD of PF-05212384 to be taken into MTD Part 2 (confirmation cohort)
• Study run in small cohorts (2-4 patients)
• CRM is Bayesian method consistently learning about dose-toxicity relationship after each cohort DLT response by updating (posterior) distribution of parameter β in tanh working model below
• DLT was a binary response based on presence of select Grade 3&4 adverse experiences within 28 days from the 1st dose (see backups for definition)
• Target DLT rate was 25%; chosen below 33% on purpose since CRM is known to assign patients above the target rate
• Next dose assignment: dose with estimated Pr (DLT) closest to target 25% but below it
• CRM operates on a fine discrete dose grid consisting of 22 doses: 10mg-319mg in 20% increments
• Fine grid with ability to skip doses was chosen to maximize flexibility
• escalate and explore higher doses if no signs of DLTs observed after few initial cohorts
• to slow down when first toxicity is observed and to explore more doses close to MTD
( ) 22,,1,2
tanh1;);|1Pr( =
+
==== ixxfxYp iiii
β
ββ

Part 1 Study design: Modified CRM algorithm (cont.)
• Safety restrictions: – Must start at the lowest dose 10 mg – No more than 3 doses can be skipped at a time (~100% max dose
increment from previously studies dose) – Additional human oversight: at any time CRM dose recommendation can
be overridden based on additional safety criteria (e.g. grade 2 AES, PK/PD info, clinical judgment)
• Stopping rules (ANY of the following) – maximum sample size (N=50) is reached – At least 9 subjects have been accumulated at “MTD candidate” dose – All doses appear to be overly toxic
• By design, such procedure is expected to cluster dose assignment around the dose with DLT rate 25% while protecting patients from exposure to overly toxic doses
• MTD declared at the end of Part 1 is taken into Part 2 (confirmation cohort) without any further dose modifications

Simulation setup overview
• Part 1 Sample size was 50 subjects maximum, with min=12 required to stop early
• Many combinations of CRM simulation parameters were considered – Cohort size: 2 or 3 subjects
– Maximum escalation allowed between cohorts: 3 or 4 doses
– Stopping rule: 6,9, or 12 subjects on MTD
– CRM working model: power, tanh, 1-parameter logistic
– Prior information on toxicity: pessimistic or optimistic DLT profile
• All ‘competing CRM “variants” were compared via simulations • The best design was selected • This best design was then evaluated against the standard 3+3 design • All simulations were done using the framework highlighted below:
– Among many metrics examined, precision of MTD selection was weighted against design ‘cost’ (ave. ssize and # of toxicities)
– 6 plausible dose-toxicity scenarios with varying MTD location and steepness of curve
72 total variants
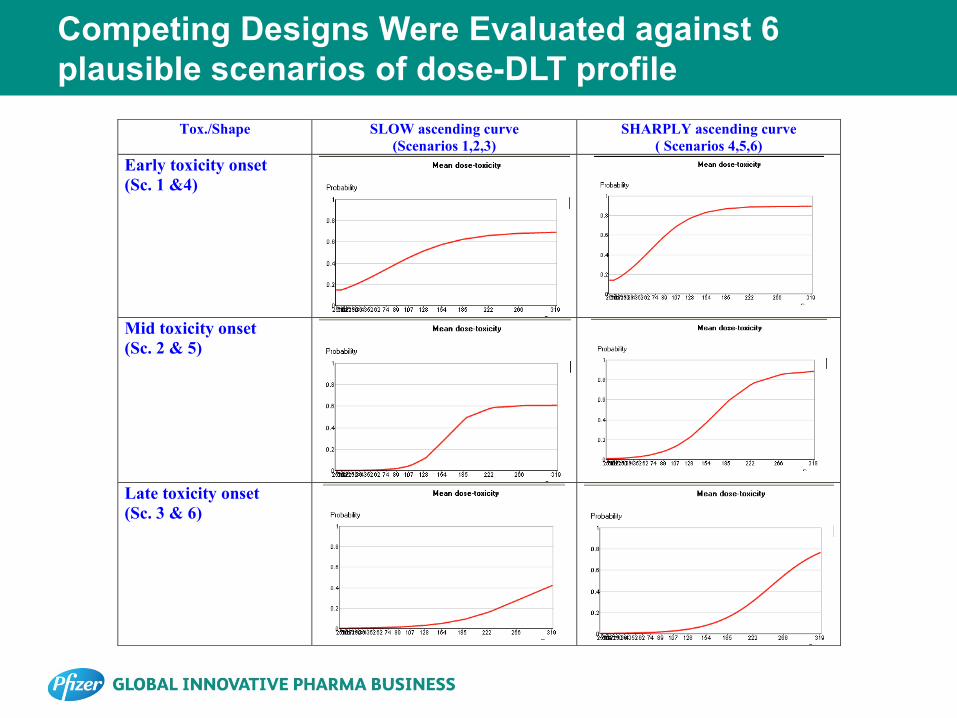
Competing Designs Were Evaluated against 6 plausible scenarios of dose-DLT profile
Tox./Shape SLOW ascending curve (Scenarios 1,2,3)
SHARPLY ascending curve ( Scenarios 4,5,6)
Early toxicity onset (Sc. 1 &4)
Mid toxicity onset (Sc. 2 & 5)
Late toxicity onset (Sc. 3 & 6)
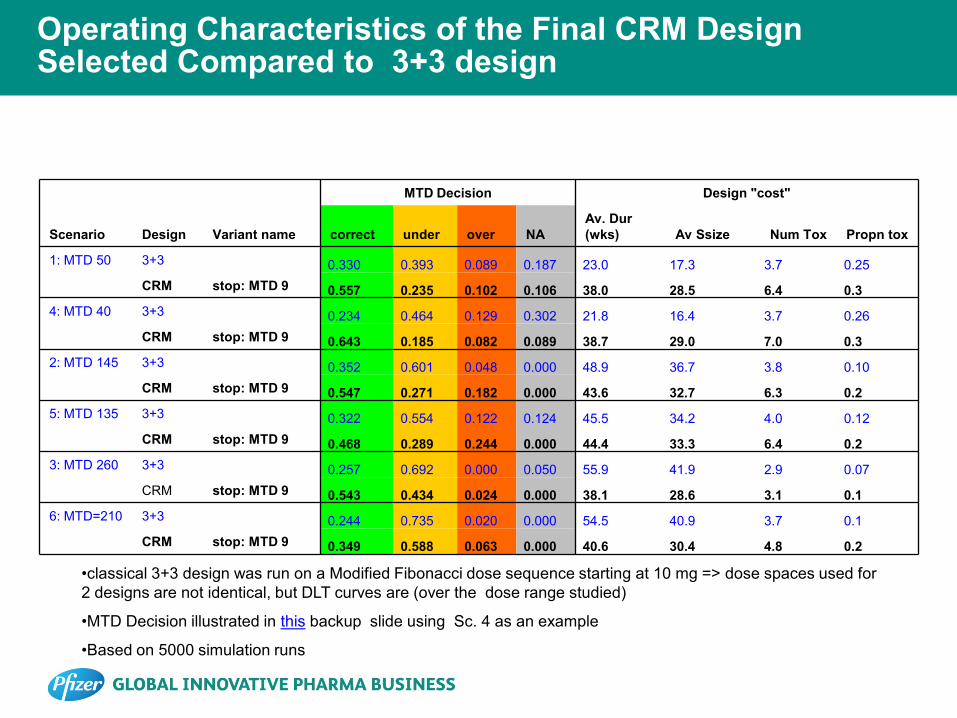
Operating Characteristics of the Final CRM Design Selected Compared to 3+3 design
MTD Decision Design "cost"
Scenario Design Variant name correct under over NA Av. Dur (wks) Av Ssize Num Tox Propn tox
1: MTD 50 3+3 0.330 0.393 0.089 0.187 23.0 17.3 3.7 0.25 CRM stop: MTD 9 0.557 0.235 0.102 0.106 38.0 28.5 6.4 0.3 4: MTD 40 3+3 0.234 0.464 0.129 0.302 21.8 16.4 3.7 0.26 CRM stop: MTD 9 0.643 0.185 0.082 0.089 38.7 29.0 7.0 0.3 2: MTD 145 3+3 0.352 0.601 0.048 0.000 48.9 36.7 3.8 0.10 CRM stop: MTD 9 0.547 0.271 0.182 0.000 43.6 32.7 6.3 0.2 5: MTD 135 3+3 0.322 0.554 0.122 0.124 45.5 34.2 4.0 0.12 CRM stop: MTD 9 0.468 0.289 0.244 0.000 44.4 33.3 6.4 0.2 3: MTD 260 3+3 0.257 0.692 0.000 0.050 55.9 41.9 2.9 0.07 CRM stop: MTD 9 0.543 0.434 0.024 0.000 38.1 28.6 3.1 0.1 6: MTD=210 3+3 0.244 0.735 0.020 0.000 54.5 40.9 3.7 0.1 CRM stop: MTD 9 0.349 0.588 0.063 0.000 40.6 30.4 4.8 0.2
•classical 3+3 design was run on a Modified Fibonacci dose sequence starting at 10 mg => dose spaces used for 2 designs are not identical, but DLT curves are (over the dose range studied)
•MTD Decision illustrated in this backup slide using Sc. 4 as an example
•Based on 5000 simulation runs

Simulation Results Summary
• In all 6 DLT scenarios simulated, CRM identified MTD more frequently than 3+3 – Best performance under Sc. 4 (~40% advantage over 3+3)
– Worst performance under Sc. 6 (~10% advantage over 3+3) • Very flat curve then rising sharply on the right with MTD sitting on the edge; true DLT
rate at MTD was 31%
• Overall number (and proportions) of DLT observed in simulated trials were slightly higher than those for 3+3 but still within clinically acceptable limits
– Related to higher percentages of MTD underestimated with 3+3 (it stops at doses below MTD => less toxicities seen)
• Sample size: CRM vs. 3+3 – In Sc. 1&4, CRM required more subjects in order to differentiate among many
“competing” MTD candidate doses
– In Sc. 2&5 - sample size comparable to 3+3 design
– In Sc. 3&6 - sample size less than 3+3 design
– The benefit of shortened trial duration increases as the location of the true MTD increases within the dose range studied, i.e. this benefit becomes prominent when there is a great uncertainty about upper bound of the meaningful dose range

From simulation experiment to one-trial experiment: What happened next?

CRM dose recommendation and selection through Part 1 (MTD finding) *
Cohort Dose (mg)
Evaluable Patients
Patients with DLTs
CRM-estimated MTD (mg)
Next Dose
Recomm. by CRM
(mg) Next Dose Assigned (mg)
1 10 4 0 222 21 21
2 21 4 0 266 43 43
3 43 3 0 266 89 89
4 89 4 0 266 185 154a
5 154 4 0 266 266 266b
6 266 4 1 383 383 319c
7 319 4 2 266 266 266
8 266 4 2 222 222 222
9 222 2 1 222 222 222
10 222 4 4 128 128 154d
11 154 4 0 154 154 154
12 154 4 1 154 154 NAe a Out of caution:154mg was maximum allowed at the time b Model switch occurred after this cohort c Other (non-DLT) AE's and investigators' input d Based on cohort 5 (154 mg) safety results e 154mg declared MTD, Part 1 concluded
*Data first presented in Tabernero et al. (2011)
Human Oversight
Model change
MTD
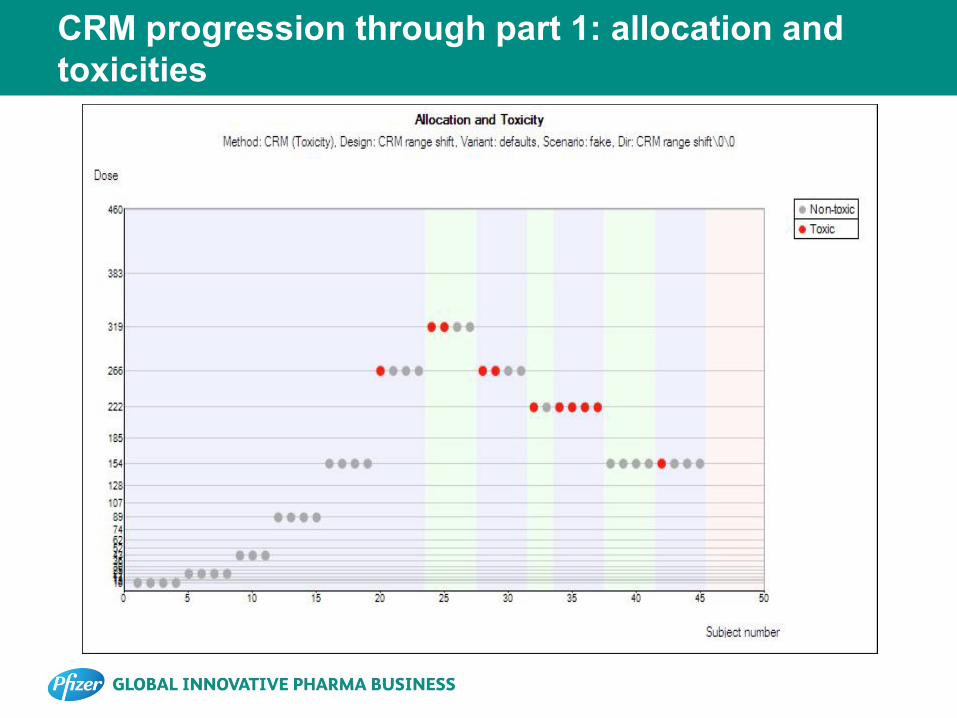
CRM progression through part 1: allocation and toxicities
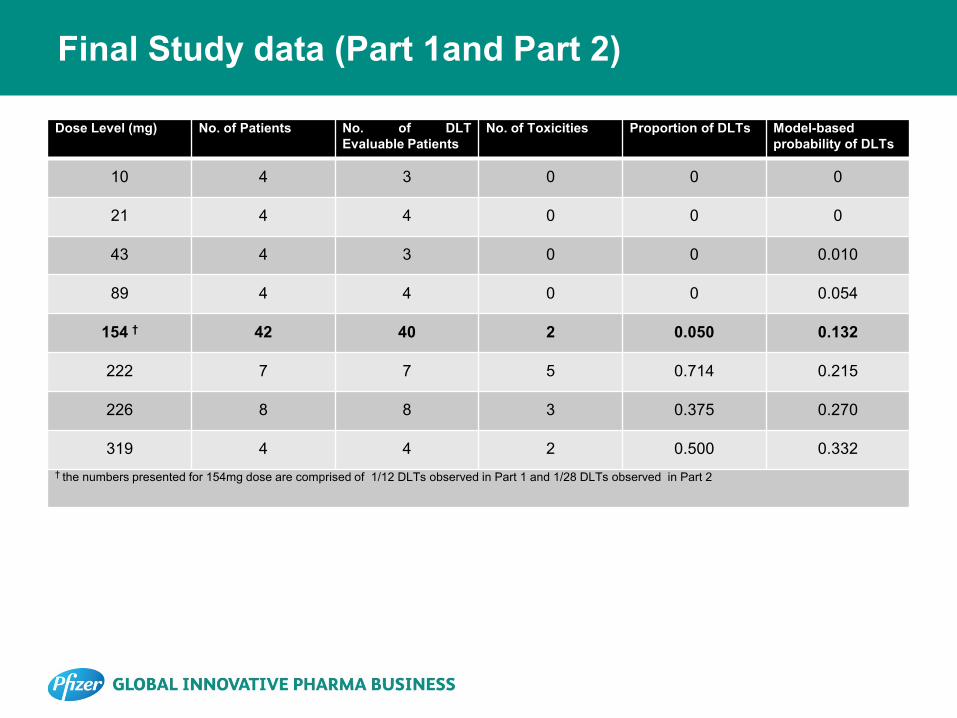
Final Study data (Part 1and Part 2)
Dose Level (mg) No. of Patients No. of DLT Evaluable Patients
No. of Toxicities Proportion of DLTs Model-based probability of DLTs
10 4 3 0 0 0
21 4 4 0 0 0
43 4 3 0 0 0.010
89 4 4 0 0 0.054
154 † 42 40 2 0.050 0.132
222 7 7 5 0.714 0.215
226 8 8 3 0.375 0.270
319 4 4 2 0.500 0.332 † the numbers presented for 154mg dose are comprised of 1/12 DLTs observed in Part 1 and 1/28 DLTs observed in Part 2

Discussion
• We have presented a story of an adaptive trial design implementation for FIH dose-escalation study in oncology
• This was a “pilot” study of its kind within organization • Extensive planning was done, but… • There were surprises:
– Dose range choice: model had to be adjusted mid-way through the trial – Even though, in retrospect , the model change could have been avoided, at
the time the decision had to be made, it appeared too risky of an option
– Observed DLT profile vs. simulations: sharply rising S-curve was not considered in simulations
– It is possible that a richer model, e.g. 2-parameter logistic could have provided better fit and performance
– Study was run in cohorts of 4 mostly even though it was designed for 3 because we allowed flexible cohort size 2-4 patients

Algorithmic Decisions vs. Human Oversight
• At all times a joint oversight committee from sponsor (clinicians and statisticians) was in place to monitor dose-escalation decisions
• In 3 instances, it has “overruled” CRM recommendations – 2 times in more conservative direction – 1 time in more aggressive direction
• Minor dose adjustment towards end of study when more safety data was accumulated
• All investigators supported this decision
• The need for oversight reflects the fact that CRM model has its limitations – works with binary toxicity only, not all safety data, – not flexible enough to capture wide range of DLT profiles
A reflection: trial objectives vs. CRM performance
• For a number of reasons, the design implemented was different from the “optimized” design derived via simulations
• The CRM was designed to deliver a dose with 25% DLT rate – The actual rate at estimated MTD was below the target
18-33% • Although it appeared that MTD yielded by CRM in Part 1
was underestimated, it is important to remember that the trial as a whole (Part1+Part 2) had broader objectives 1. To deliver a well tolerated dose 2. To show some evidence of target clinical activity in
select tumor types at that dose Those objectives were achieved

A reflection: CRM performance vs. simulation
• It may be disappointing that the DLT rate at MTD was below target in actual trial
• But hardly surprising, given simulation results, if we look back closely: – The observed DLT profile was somewhat close to Sc. 3 & 6 – For both scenarios, the probability to underestimate MTD was
43-59% under original model and 44-64% under new model – The scenario observed was the hardest (among 6) for CRM to
perform well in it – We simulate 5000 trials to derive operating characteristics that
looked good – But after that we get a chance to run only 1 trial! – And that’s where we take our chances
Conclusion and lessons learned
• In real life Ph1 trials, performance goes beyond those used in simulated operating characteristics – We may never know the true DLT profile of this drug – The real measure of performance would be success or failure of clinical
program and the role this trial played in it–too early to tell now
• Some positive “lessons learned”: – This trial “opened doors” for other adaptive trials for Phase 1 within the
company – Currently many Phase 1 trials consider and implement innovative designs
(e.g. CRM, mTPI)
– Planning considerably reduced from 3+ months it took to plan this trial – Logistics were quite manageable; not much difference from 3+3 – Due to many safety restriction in place, it behaved almost as conservatively
as 3+3 in terms of DLT, further increasing its acceptance

Thank You!
References
• I. Perevozskaya, L. Han, K. Pierce (2014). “Continual Reassessment Method for a First-In-Human Trial: From Design to Trial Implementation”, Chapter 19 In: Practical Considerations for Adaptive Trial Design and Implementation, Springer, New York (in press)
• Tabernero J, Bell-McGuinn K, Spicer J, Bendell J, Molina J, Kwak E, Millham R, Houk B, Borzillo G, Shapiro G.. First-in-patient study of PF-05212384, a small molecule intravenous dual inhibitor of PI3K and mTOR in patients with advanced cancer: Update on safety, efficacy, and pharmacology [abstract]. In: Proceedings of the AACR-NCI-EORTC International Conference: Molecular Targets and Cancer Therapeutics; 2011 Nov 12-16; San Francisco, CA. Philadelphia (PA): AACR; Mol Cancer Ther 2011;10(11 Suppl):Abstract nr A167.
• Braun TM. The bivariate continual reassessment method: extending the CRM to phase I trials of two competing outcomes. Controlled Clinical Trials 2002; 23:240 – 256.
• Goodman S, Zahurak ML, Piantadosi S. Some practical improvements in the continual reassessment method for phase I studies. Stat Med. 1995;14:1149–1161

Backups

DLT Definition
– DLT was defined as
– ≥Grade 3 nonhematologic AE (including nausea, vomiting, or diarrhea despite optimal therapy; or ≥Grade 3 asthenia >2 days; or fasting serum glucose >250 mg/dL despite optimal therapy);
– ≥Grade 4 thrombocytopenia;
– Grade 3 thrombocytopenia with bleeding;
– Grade 4 neutropenia lasting more than 7 days;
– Febrile neutropenia;
– Other Grade 4 hematologic AE; or
– Delay of treatment >2 consecutive weeks due to toxicity
• Patients evaluable for DLT were those that either:
– Experienced a DLT within the first 28 days, regardless of the number of doses received.
– OR
– Had received at least 2 infusions of PF-05212384 in the first 28 days of treatment and had not withdrawn from the study for reasons other than study drug-related toxicity within the first 28 days of treatment

Part 1 Study design: Modified CRM algorithm
• Study run in small cohorts (2-4 patients) • CRM is Bayesian method consistently learning about dose-toxicity relationship
after each cohort toxicity response by updating (posterior) distribution of parameter β in model below
• Operates on a fine discrete dose grid consisting of 22 doses: 10mg-319mg in 20% increments
• Fine grid with ability to skip doses was chosen to maximize flexibility • escalate and explore higher doses if no signs of DLTs observed after few initial cohorts
• to slow down when first toxicity is observed and to explore more doses close to MTD • Working model (tanh) :
• Next dose assignment: dose with estimated Pr (DLT) closest to target 25% but below it
( ) 22,,1,2
tanh1;);|1Pr( =
+
==== ixxfxYp iiii
β
ββ
labelsdose ; DLTofindicatorbinary −− ixY

Dose Grid Utilized by Modified CRM Algorithm
Dose (mg)
Increment from prior dose (%) if the number of skipped doses is 0 1 2* 3*
10 12 20% 14 20% 44% 17 20% 44% 73% 21 20% 44% 73% 107% 25 20% 44% 73% 107% 30 20% 44% 73% 107% 36 20% 44% 73% 107% 43 20% 44% 73% 107% 52 20% 44% 73% 107% 62 20% 44% 73% 107% 74 20% 44% 73% 107% 89 20% 44% 73% 107%
107 20% 44% 73% 107% 128 20% 44% 73% 107% 154 20% 44% 73% 107% 185 20% 44% 73% 107% 222 20% 44% 73% 107% 266 20% 44% 73% 107% 319 20% 44% 73% 107%
* These dose escalations were not allowed if 2 clinically significant grade 2 toxicities of the same type were seen in a cohort, or if 1 additional case of the same grade 2 toxicity or 2 other cases of clinically significant grade 2 toxicities of the same type were seen in the next cohort.

Traditional 3+3 design overview
• Prefixed dose grid resembling the modified Fibonacci sequence
• Patients treated in cohorts of size 3 starting at the lowest dose – If 0/3 DLT → escalate 1 dose level
– If ≥ 2/3 DLT→ de-escalate 1 dose level
– If 1/3 experiences a DLT, 3 more patients will be treated at the same dose level.
• The dose escalation continues until at least 2/6 patients experience DLT (i.e. ≥ 33% of patients with DLT at that dose level).
• The recommended MTD is conventionally defined as the dose level just below this toxic dose level.
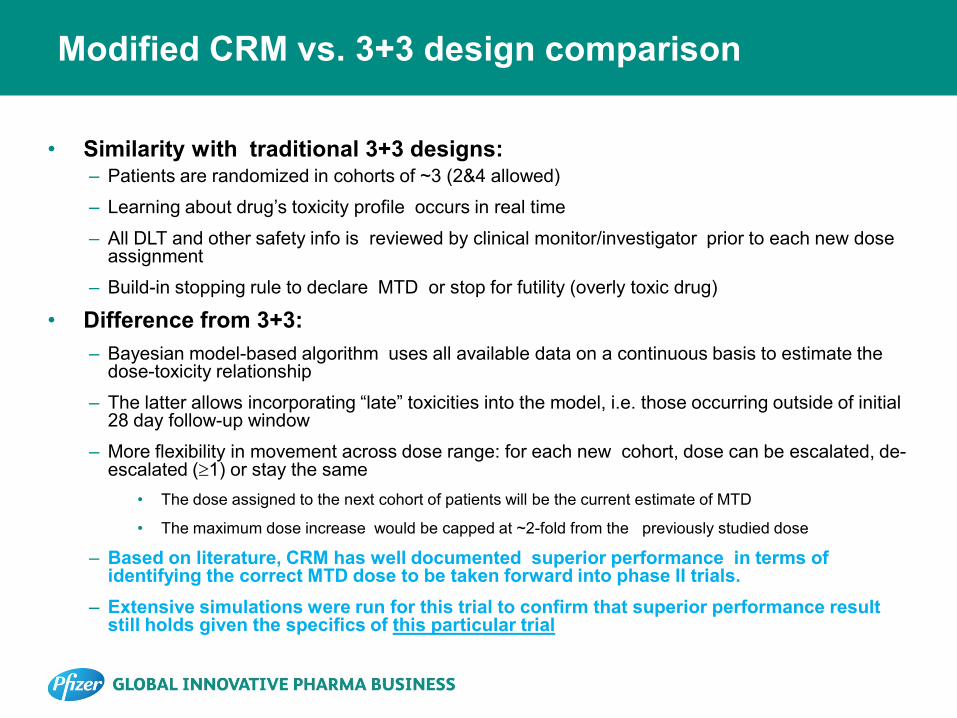
Modified CRM vs. 3+3 design comparison
• Similarity with traditional 3+3 designs: – Patients are randomized in cohorts of ~3 (2&4 allowed)
– Learning about drug’s toxicity profile occurs in real time
– All DLT and other safety info is reviewed by clinical monitor/investigator prior to each new dose assignment
– Build-in stopping rule to declare MTD or stop for futility (overly toxic drug)
• Difference from 3+3: – Bayesian model-based algorithm uses all available data on a continuous basis to estimate the
dose-toxicity relationship
– The latter allows incorporating “late” toxicities into the model, i.e. those occurring outside of initial 28 day follow-up window
– More flexibility in movement across dose range: for each new cohort, dose can be escalated, de-escalated (≥1) or stay the same
• The dose assigned to the next cohort of patients will be the current estimate of MTD
• The maximum dose increase would be capped at ~2-fold from the previously studied dose
– Based on literature, CRM has well documented superior performance in terms of identifying the correct MTD dose to be taken forward into phase II trials.
– Extensive simulations were run for this trial to confirm that superior performance result still holds given the specifics of this particular trial

Key Operating Characteristics to Compare Competing Designs
• Precision of MTD selection, expressed as percentage of times the dose selected as MTD has a true underlying rate within each of the 4 categories below:
– On-Target: selected dose produces 18%-33% true DLT rate
– Underestimated: selected dose produces <18% true DLT rate
– Overestimated: selected dose produces >33% true DLT rate
– N/A: trial stopped early for futility
• Design “Cost” – Average trial duration
– Average sample size
– Average number and proportion of of toxicities

Simulation Notes
• Precision of MTD estimation and trial cost metrics usually never pull the design choices in the same direction – More precision usually comes with greater cost and there has to be a
trade-off
• Simulated operating characteristics for various competing CRM options were used to quantify trade-off between precision of MTD selection and exposing more subjects to doses with higher toxicity levels, as well as trial duration (results not shown)
• Among many parameters examined, choice of stopping rule (6,9, or 12 subjects on MTD) had most impact on design’s performance
• Next slide summarizes operating characteristics of the final chosen CRM design compared to the standard 3+3 design option as a benchmark – CRM: 9 subjects on MTD, cohort size 3, tanh model and pessimistic DLT
prior – 3+3 design: can’t skip doses, dose space modified to resemble modified
Fibonacci, stops with only 6 subjects on MTD

Precision of MTD Selection: illustration using simulated 5000 trials for Sc. 4
Pr (“correct’) =0.643
Pr(“over”)=0.082
Pr(“under’’)=0.185

CRM Model, Allocation and Toxicity after Cohort #4
Next dose override
CRM recommended dose based on max allowed increment
Model-based next dose

CRM Model, Allocation and Toxicity after Cohort #5

CRM Model, Allocation and Toxicity after Cohort #6 (new model)
Dose Override

CRM Model, Allocation and Toxicity after Cohort #7
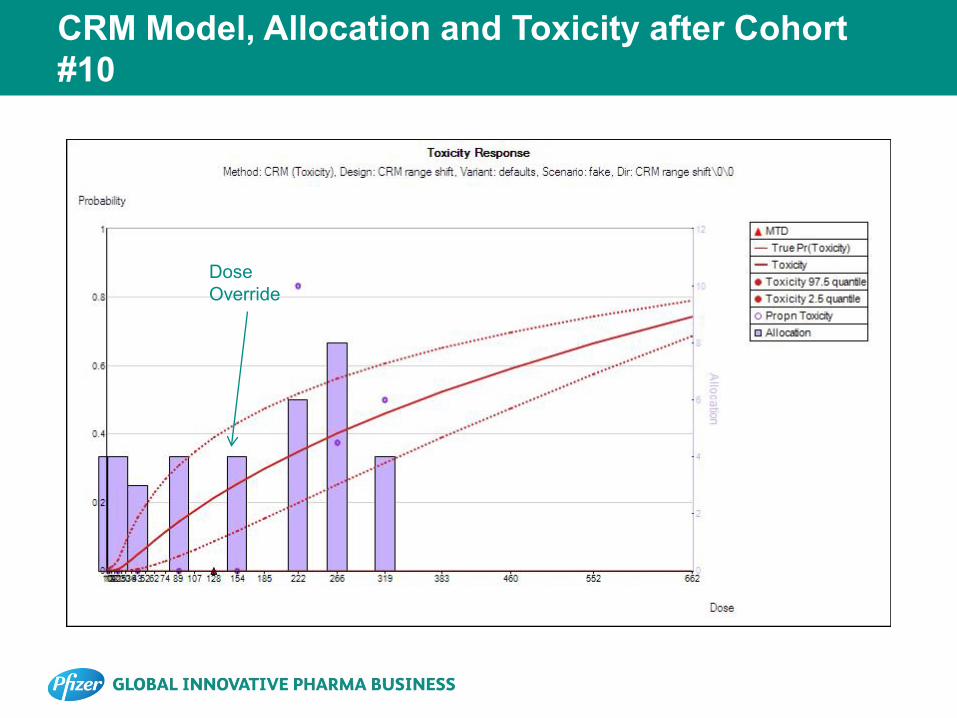
CRM Model, Allocation and Toxicity after Cohort #10
Dose Override
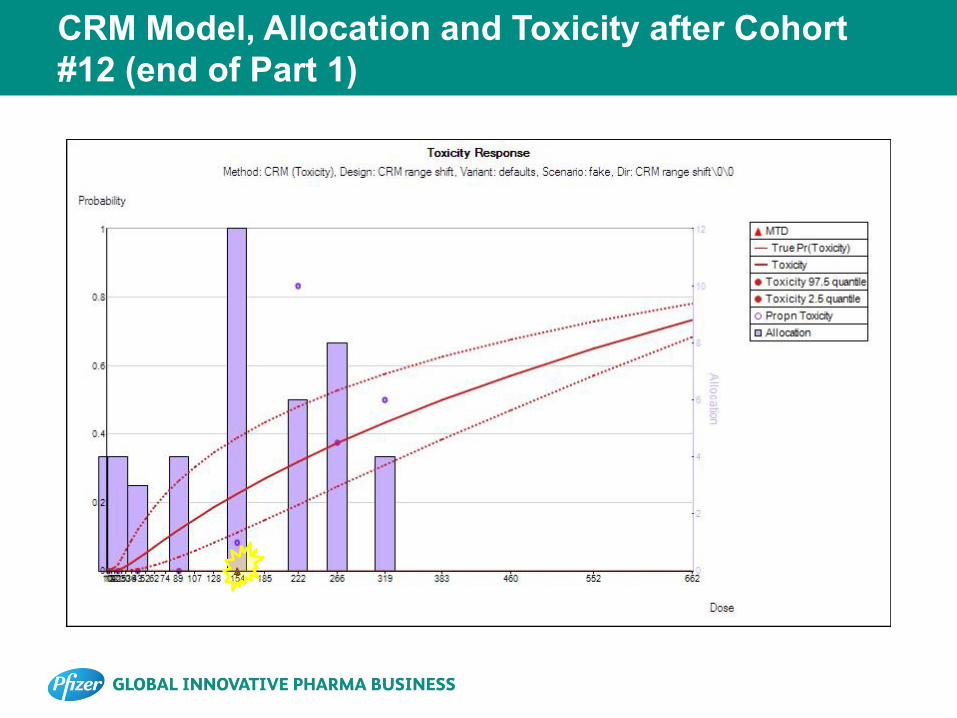
CRM Model, Allocation and Toxicity after Cohort #12 (end of Part 1)
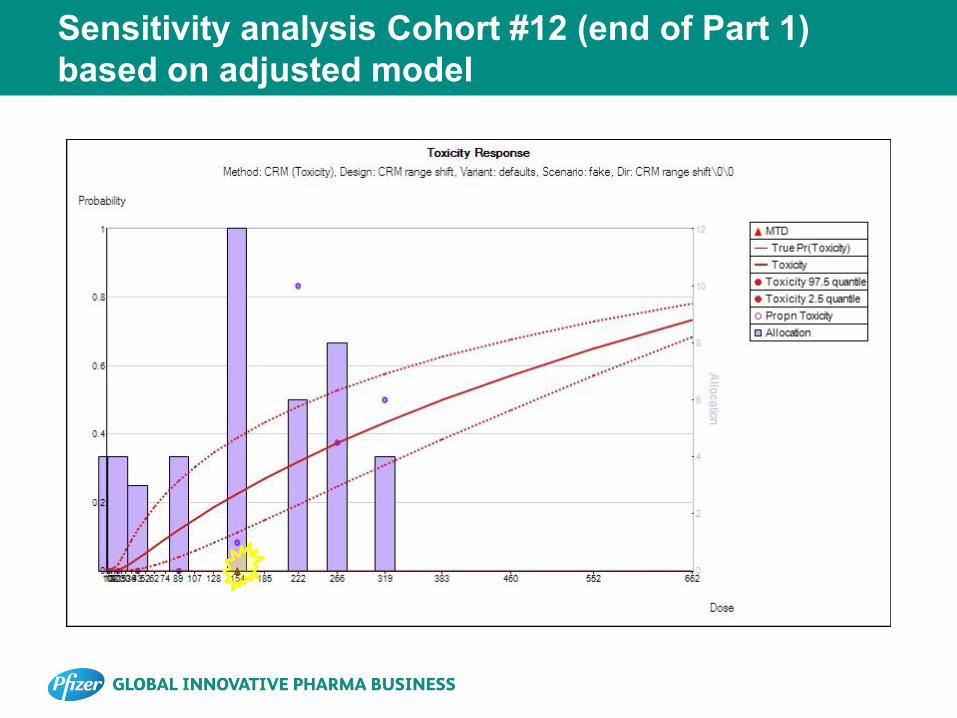
Sensitivity analysis Cohort #12 (end of Part 1) based on adjusted model
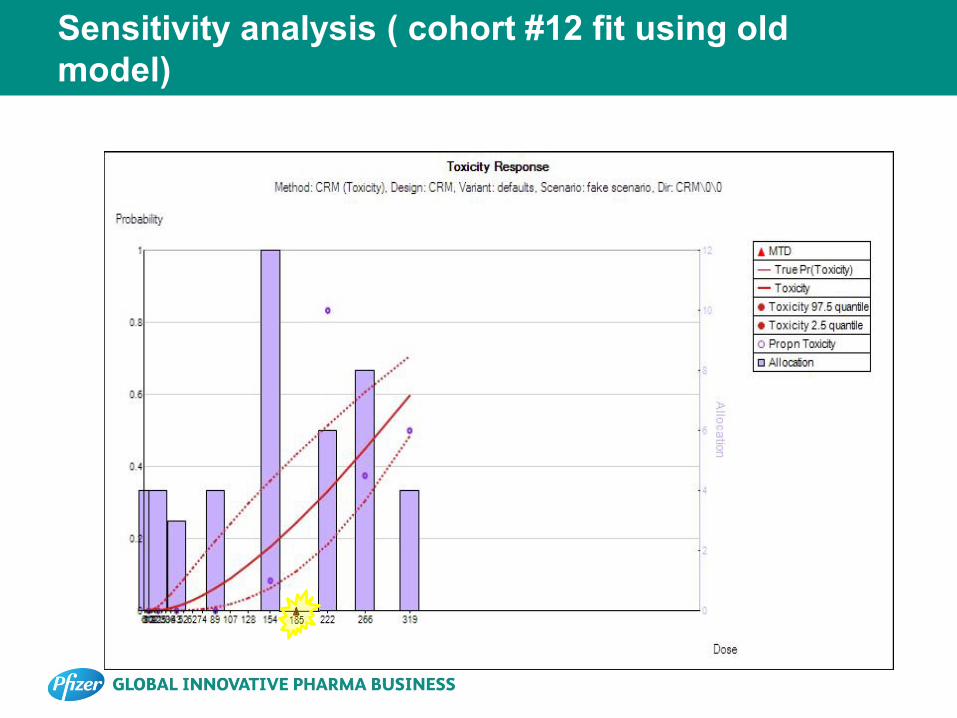
Sensitivity analysis ( cohort #12 fit using old model)
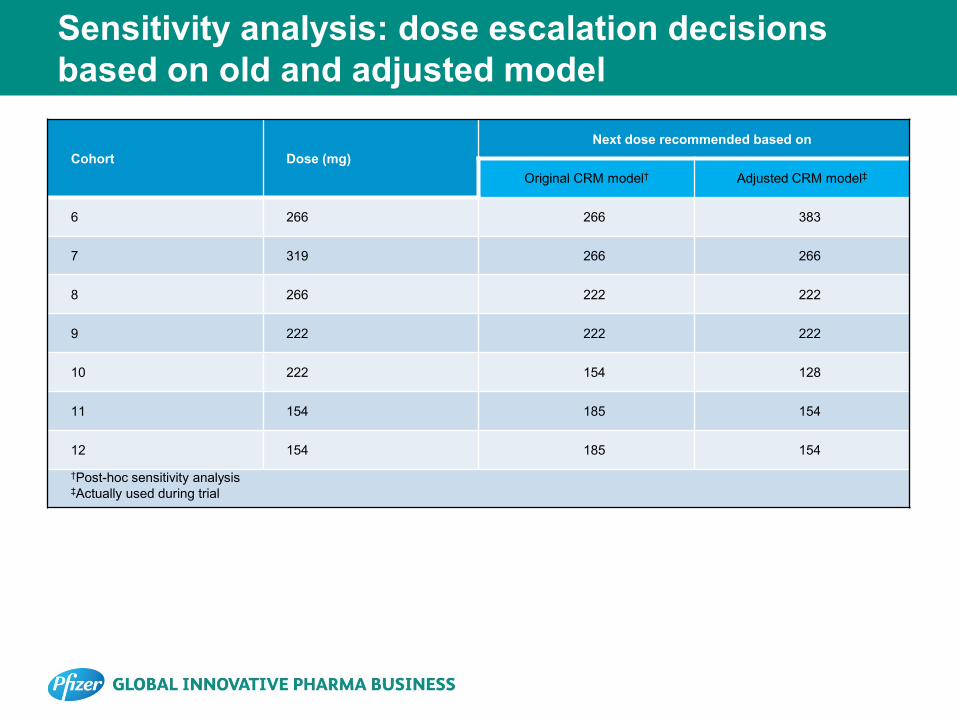
Sensitivity analysis: dose escalation decisions based on old and adjusted model
Cohort Dose (mg) Next dose recommended based on
Original CRM model† Adjusted CRM model‡
6 266 266 383
7 319 266 266
8 266 222 222
9 222 222 222
10 222 154 128
11 154 185 154
12 154 185 154
†Post-hoc sensitivity analysis ‡Actually used during trial