contextual role of trls and mrls in technology...
TRANSCRIPT

SANDIA REPORT SAND2010-7595 Unlimited Release Printed November 2010
Contextual Role of TRLs and MRLs in Technology Management Joseph A. Fernandez Prepared by Sandia National Laboratories Albuquerque, New Mexico 87185 and Livermore, California 94550
Sandia National Laboratories is a multi-program laboratory managed and operated by Sandia Corporation, a wholly owned subsidiary of Lockheed Martin Corporation, for the U.S. Department of Energy’s National Nuclear Security Administration under contract DE-AC04-94AL85000.
Approved for public release; further dissemination unlimited.

2
Issued by Sandia National Laboratories, operated for the United States Department of Energy by Sandia Corporation. NOTICE: This report was prepared as an account of work sponsored by an agency of the United States Government. Neither the United States Government, nor any agency thereof, nor any of their employees, nor any of their contractors, subcontractors, or their employees, make any warranty, express or implied, or assume any legal liability or responsibility for the accuracy, completeness, or usefulness of any information, apparatus, product, or process disclosed, or represent that its use would not infringe privately owned rights. Reference herein to any specific commercial product, process, or service by trade name, trademark, manufacturer, or otherwise, does not necessarily constitute or imply its endorsement, recommendation, or favoring by the United States Government, any agency thereof, or any of their contractors or subcontractors. The views and opinions expressed herein do not necessarily state or reflect those of the United States Government, any agency thereof, or any of their contractors. Printed in the United States of America. This report has been reproduced directly from the best available copy. Available to DOE and DOE contractors from U.S. Department of Energy Office of Scientific and Technical Information P.O. Box 62 Oak Ridge, TN 37831 Telephone: (865) 576-8401 Facsimile: (865) 576-5728 E-Mail: [email protected] Online ordering: http://www.osti.gov/bridge Available to the public from U.S. Department of Commerce National Technical Information Service 5285 Port Royal Rd. Springfield, VA 22161 Telephone: (800) 553-6847 Facsimile: (703) 605-6900 E-Mail: [email protected] Online order: http://www.ntis.gov/help/ordermethods.asp?loc=7-4-0#online

3
SAND2010-7595 Unlimited Release
Printed November 2010
Contextual Role of TRLs and MRLs in Technology Management
Joseph A. Fernandez ST&E Integration Department
National Security Studies and Integration Center Sandia National Laboratories
P.O. Box 5800 Albuquerque, New Mexico 87185-0431
Abstract
Technology Readiness Levels (TRLs) have been used extensively from the 1970s, especially in the National Aeronautics and Space Administration (NASA). Their application was recommended by the General Accounting Office in 1999 to be used for major Department of Defense acquisition projects. Manufacturing Readiness Levels (MRLs) have been proposed for improving the way manufacturing risks and readiness are identified; they were introduced to the defense community in 2005, but have not been used as broadly as TRLs. Originally TRLs were used to assess the readiness of a single technology. With the emergence of more complex systems and system of systems, it has been increasingly recognized that TRLs have limitations, especially when considering integration of complex systems. Therefore, it is important to use TRLs in the correct context. Details on TRLs and MRLs are reported in this paper. More recent indices to establish a better understanding of the integrated readiness state of systems are presented. Newer readiness indices, System Readiness Levels (SRLs) and Integration Readiness Levels, are discussed and their limitations and advantages are presented, along with an example of computing SRLs. It is proposed that a modified SRL be considered that explicitly includes the MRLs and a modification of the TRLs to include the Integrated Technology Index (ITI) and/or the Advancement Degree of Difficulty index proposed by NASA. Finally, the use of indices to perform technology assessments are placed into the overall context of technology management, recognizing that factors to transition and manage technology include cost, schedule, manufacturability, integration readiness, and technology maturity.

4
This page is intentionally left blank.

5
Contents
Purpose ............................................................................................................................................ 7
Introduction ..................................................................................................................................... 7
Technology Assessment Techniques .............................................................................................. 7
TRLs and TRAs .............................................................................................................................. 9
MRLs ............................................................................................................................................ 13
IRLs............................................................................................................................................... 15
SRLs .............................................................................................................................................. 16
Technology Management As A Whole ......................................................................................... 17
Summary ....................................................................................................................................... 20
References ..................................................................................................................................... 21
Figure Figure 1. The Technology Assessment Process at NASA (from Bilbro 2007). ..........................13
Tables Table 1. Qualitative and Quantitative Tools/Techniques Used to Assess Technology and
Manufacturing Readiness (modified from Azizian et al. 2009). ......................................8 Table 2. Correlation of Qualitative Cost Descriptions with TRL Levels (from Mankins
2002). ..............................................................................................................................11 Table 3. Typical Technology Management Tools Addressing Each of the Framework
Stages and the Context of Technology Maturity and Readiness Tools ..........................18 Table 4. Definitions for TRLs, MRLs, IRLs, SRLs (for Levels 1 to 9) and SRL Values. ............19

6
This page is intentionally left blank.

7
Purpose The purpose of this report is to present information on Technology Readiness Levels, Manufacturing Readiness Levels, and other indices to facilitate discussion on their application within the overall context of technology management in the National Nuclear Security Administration (NNSA) and their use in the development of the Component Maturation Framework (CMF) for NNSA’s NA-12, Office of Stockpile Management. The CMF
“illustrates the timeline for future component insertion and provides Congress and NNSA Senior Executive Managers with information to track progress towards meeting important commitments for the United States’ active nuclear stockpile. The CMF summarizes the underlying, complex integration across sites, and programs for maturing technologies (using TRLs) and providing manufacturing capabilities (using MRLs) early enough in the 6.X process to plan for timely and cost-effective insertion of components into the weapon. The CMF can be used by decision makers to integrate program funding for continued assurance of a safe, secure, and reliable US nuclear stockpile.” (NNSA 2010)
Introduction
Governmental acquisition and developmental projects have been faced with difficulties associated with insufficiently mature technology, lack of manufacturing maturity, and changing designs due in a large degree from changing requirements. The General Accounting Office (GAO) has issued reports addressing these issues (GAO 1999, 2006, 2008). These difficulties are a direct outcome of increasing complexity in major acquisition projects. Complex systems are now being connected as a system of systems (SoS). Further, SoS integration is complex, having properties including “ambiguous boundaries, diverse stakeholders, fluid situations and requirements, ill-defined problems, dysfunctional barriers, sophisticated technology, and uncertain resources.” (Brooks and Sage 2005/2006)
Technology Assessment Techniques As concluded by Azizian et al. (2009), objective and robust techniques/tools are needed to assess technology maturity accurately to provide insight into risks that lead to cost overruns, schedule delays, and performance degradation. Numerous qualitative and quantitative assessment tools/techniques exist to assess technology maturity and readiness states. Two tools used in the CMF Project are the Technology Readiness Levels (TRLs) and the Manufacturing Readiness Levels (MRLs). However, it is important to note that there are many different tools/techniques to assess the maturity states of technology, manufacturing, and systems in general (see Table 1). In addition to these readiness indices, other readiness level indices (including those related to project readiness) that are commonly used include:
Capability Readiness Levels Human Readiness Levels Integration Readiness Levels (IRLs) Logistics Readiness Levels System Readiness Levels (SRLs) Operational Readiness Levels Design Readiness Levels Software Readiness Levels
Innovation Readiness Levels Programmatic Readiness Levels

8
Table 1. Qualitative and Quantitative Tools/Techniques Used to Assess Technology and Manufacturing Readiness (modified from Azizian et al. 2009).
Tools Description
Qualitative Maturity Assessment Techniques Manufacturing Readiness Level (MRL)
The MRL is a 10-level scale used to define current level of manufacturing maturity, identify maturity shortfalls and associated risks, and provide the basis of manufacturing maturation and risk management (GAO 2010).
Integration Readiness Level (IRL)
The IRL is a 9-level scale intended to systematically measure the maturity, compatibility, and readiness of interfaces between various technologies and consistently compare interface maturity between multiple integration points. Further, it provides a means to reduce the uncertainty involved in maturing and integrating a technology into a system (Gove 2007).
TRL for Non-System Technologies
Expansion of the TRL definitions to account for non-system technologies such as processes, methods, algorithms, and architectures (Graettinger et al. 2002).
TRL for Software Expansion of the TRL metric to incorporate other attributes specific to software development (DoD 2009).
Technology Readiness Transfer Level (TRRL)
The TRRL is a 9-level scale describing the progress of technology transfer to a new application. It expands and modifies the TRL definitions to address the transfer to space technology into non-space system (Holt 2007 in Azizian et al. 2009).
Missile Defense Agency Checklist
A tailored version of the TRL metric specifically in support of hardware maturity through the development life cycle of the product (Mahafza 2005).
Moorhouses Risk Versus TRL Metric
A 9-level metric mapping risk progression analogous to technology maturity progression. The TRL descriptions are tailored specifically toward UAV (Moorehouse 2002 in Azizian et al. 2009).
Advancement Degree of Difficulty (AD2)
Leveraging the concept of R&D3, the AD2 augments TRLs by assessing the difficulty of advancing a technology from its current level to a desired level on a 9-tier scale (Bilbro 2002, 2006, 2007).
Research and Development Degree of Difficulty (R&D3)
The R&D3 is a 5-level scale intended to supplement the TRL by conveying the degree of difficulty involved in proceeding from the current TRL state to desired level, with 5 being very difficult and 1 being least difficult to mature the technology (Mankins 2002).
Quantitative Maturity Assessment Techniques System Readiness Level (SRL)
The SRL is a normalized matrix of pair-wise comparisons of TRLs and IRLs of a system. It is a quantitative method providing insight into system maturity as a product of IRL x TRL (Sauser et al. 2006; 2007; 2008)
SRLmax The SRLmax is a quantitative mathematical model aiming to maximize the SRL under constraint resources. The objective of the SRLmax is the achievement of the highest possible SRL based on the availability of resources such as cost and schedule (Ramirez-Marquez et al. 2009).
Technology Readiness and Risk Assessment (TRRA)
TRRA is a quantitative risk model that incorporates TRLs, the degree of difficulty (R&D3) of moving a technology from one TRL to another, and Technology Need Value (TNV). The TRRA expands the concept of the risk matrix by integrating “probability of failure” on the y-axis and “consequence of failure” on the x-axis (Mankins 2009).
Integrated Technology Analysis Methodology (ITAM)
ITAM is a quantitative mathematical model that integrates various system metrics to calculate the cumulative maturity of a system based on the readiness of its constituent technologies. The system metrics include TRLs, ∆TRL, R&D Degree of Difficulty (R&D3), and TNV (Mankins 2002).
TRL for Non- Developmental Item (NDI) Software
A mathematical method to assess the maturity of Non- Developmental Item (NDI) software using orthogonal metrics in combination with a pair-wise comparison matrix to examine two equivalent technologies that are candidates for insertion into a system. Incorporates other attributes such as requirement satisfaction, environment fidelity, criticality, product availability, and product maturity (Smith 2004).
Technology Insertion (TI) Metric
TI involves the integration of various metrics that deal with insertion of technology and subsystems into a current system in order to develop an “enhanced system.” The TI Metric is a high-level metric computed from sub-metrics or dimensions intended to evaluate the risk and feasibility of technology insertion from a subsystem and a system level (Dowling and Pardoe 2005).
TRL Schedule Risk Curve
This is a quantitative model that does not communicate the maturity of technology at a certain point in time but instead leverages the TRL metric to identify the appropriate schedule margins associated with each TRL level in order to mitigate schedule slips (Dubos et al. 2007).
9
TRLs and TRAs As indicated by Mankins (2002), the term “technology readiness” originated within the National Aeronautics and Space Administration (NASA) in the 1960s. This term evolved into “technology readiness levels” (TRLs) in the 1970s. A TRL is a metric that was initially pioneered by NASA Goddard Space Flight Center in the 1980s to assess readiness and risk of space technology. Mankins defined TRLs as follows: “Technology Readiness Levels (TRLs) are a systematic metric/measurement system that supports assessments of the maturity of a particular technology and the consistent comparison of maturity between different types of technology.” (Mankins 1995) The overall TRL for a system should not be any higher than the lowest TRL component (Engle et al. 2009). Similar logic would also suggest that the TRL for a component should not be any higher than the lowest TRL technology associated with the component. Definitions of approaches incorporating TRLs are given below. A Technology Readiness Assessment (TRA) is a “formal, systematic, metrics-based process and accompanying report that assesses the maturity of technologies called Critical Technology Elements (CTEs) to be used in systems. CTEs can be hardware or software.” (DoD 2009) A Critical Technology Element (CTE) is “critical” “if the system being acquired depends on this technology element to meet operational requirements (within acceptable cost and schedule limits) and if the technology element or its application is either new or novel in an area that poses major technological risk during detailed design or demonstration.” (DoD 2009) An Integrated Technology Index (ITI) is “a measure of the cumulative maturation that must be achieved for each technology, amplified by the anticipated difficulty of this maturation and the project importance of the technology of the system in which it will be used – and normalized by total number of technologies that have been documented.” (Mankins 2002). Benefits in using TRLs include:
Provides an ontology by which stakeholders can evaluate component technologies (Sauser et al. 2010);
Provides for a component TRA; Initiates a discussion among the stakeholders to consider other factors; Provides a mechanism whereby the process can be easily repeated during development; Is easy to understand and use; and Conveys a great deal of information in a projects status and in its relative risk in the life
cycle of the project.

10
Limitations in using TRLs include:
Does not address uncertainty (and difficulty) in technology development and application and how to best coordinate research and development (R&D) with advanced systems concepts studies (Mankins 2002; Azizian et al. 2009);
Provides a subjective assessment of maturity (Cornford and Sarsfield 2004) or lacks a standard guidelines for implementing (Mahafza 2005 and Graettinger et al. 2002 in Azizian et al. 2009);
An assessment of many technologies can become very complex without the use of a systematic method of comparison (Michaud et al. 2008);
Lacks focus on system-to-system integration as the TRLs focus on a particular element of technology (Cornford and Sarsfield, 2004; Smith 2004);
Does not include many of the Department of Defense’s (DoD’s) system needs such as manufacturing, integration, transition and difficulty of advancing (Azizian et al. 2009; Michaud et al. 2008; Sauser and Ramirez-Marquez 2007);
Focuses on hardware (when originally developed), not software (Cornford and Sarsfield 2004; Smith 2004);
Not well integrated into cost and risk modeling tools (Cornford and Sarsfield, 2004) or does not give a complete picture of risk in integrating a technology into a system (Azizian et al. 2009);
Lacks definition of terminology as terms are open to interpretation (Cornford and Sarsfield 2004; Minning et al. 2003);
Captures only a small part of the information that stakeholders need to support their decisions (Azizian et al. 2009);
“Blurs” several aspects of technology and product readiness into a single number (Smith 2004); and
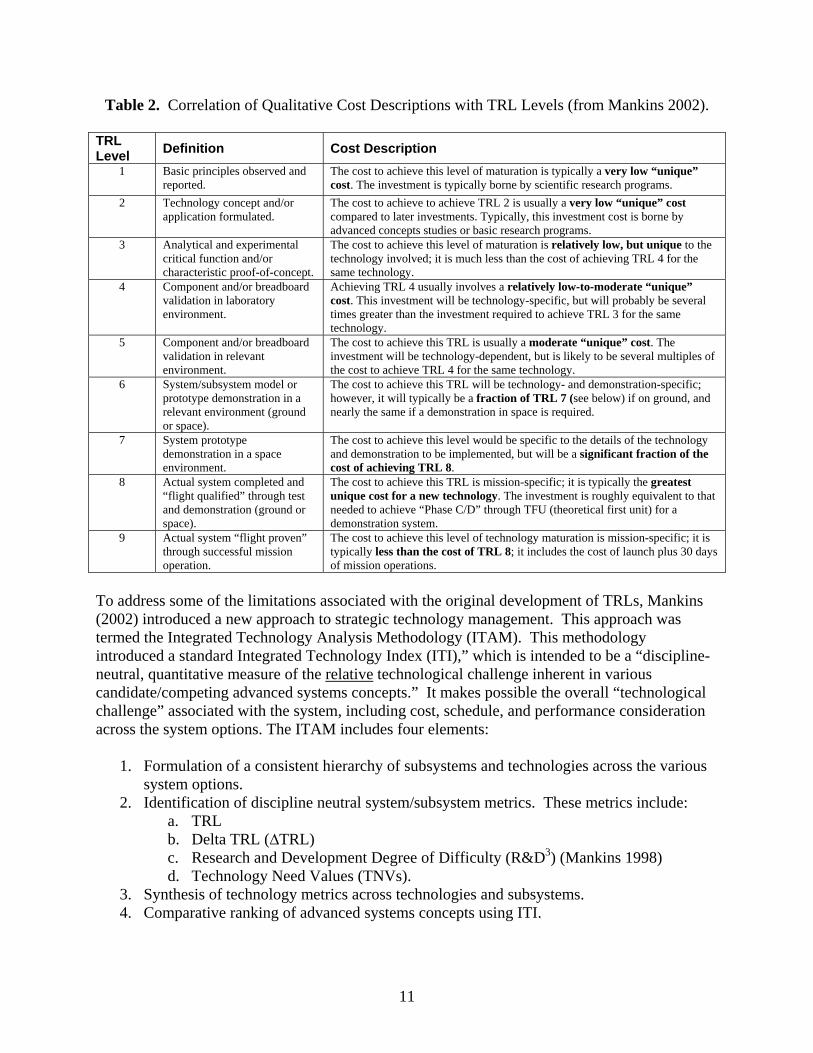
Does not account for product aging (Smith 2004). In using the TRLs it is important to consider these benefits and limitations. It is also important to consider that TRL increments are not a linear scale, especially when considering cost and schedule. To illustrate this point Table 2 describes the cost associated with each TRL step.
11
Table 2. Correlation of Qualitative Cost Descriptions with TRL Levels (from Mankins 2002).
TRL Level
Definition Cost Description
1 Basic principles observed and reported.
The cost to achieve this level of maturation is typically a very low “unique”cost. The investment is typically borne by scientific research programs.
2 Technology concept and/or application formulated.
The cost to achieve to achieve TRL 2 is usually a very low “unique” cost compared to later investments. Typically, this investment cost is borne by advanced concepts studies or basic research programs.
3 Analytical and experimental critical function and/or characteristic proof-of-concept.
The cost to achieve this level of maturation is relatively low, but unique to the technology involved; it is much less than the cost of achieving TRL 4 for the same technology.
4 Component and/or breadboard validation in laboratory environment.
Achieving TRL 4 usually involves a relatively low-to-moderate “unique”cost. This investment will be technology-specific, but will probably be several times greater than the investment required to achieve TRL 3 for the same technology.
5 Component and/or breadboard validation in relevant environment.
The cost to achieve this TRL is usually a moderate “unique” cost. The investment will be technology-dependent, but is likely to be several multiples of the cost to achieve TRL 4 for the same technology.
6 System/subsystem model or prototype demonstration in a relevant environment (ground or space).
The cost to achieve this TRL will be technology- and demonstration-specific; however, it will typically be a fraction of TRL 7 (see below) if on ground, and nearly the same if a demonstration in space is required.
7 System prototype demonstration in a space environment.
The cost to achieve this level would be specific to the details of the technology and demonstration to be implemented, but will be a significant fraction of the cost of achieving TRL 8.
8 Actual system completed and “flight qualified” through test and demonstration (ground or space).
The cost to achieve this TRL is mission-specific; it is typically the greatest unique cost for a new technology. The investment is roughly equivalent to that needed to achieve “Phase C/D” through TFU (theoretical first unit) for a demonstration system.
9 Actual system “flight proven” through successful mission operation.
The cost to achieve this level of technology maturation is mission-specific; it is typically less than the cost of TRL 8; it includes the cost of launch plus 30 days of mission operations.
To address some of the limitations associated with the original development of TRLs, Mankins (2002) introduced a new approach to strategic technology management. This approach was termed the Integrated Technology Analysis Methodology (ITAM). This methodology introduced a standard Integrated Technology Index (ITI),” which is intended to be a “discipline-neutral, quantitative measure of the relative technological challenge inherent in various candidate/competing advanced systems concepts.” It makes possible the overall “technological challenge” associated with the system, including cost, schedule, and performance consideration across the system options. The ITAM includes four elements:
1. Formulation of a consistent hierarchy of subsystems and technologies across the various system options.
2. Identification of discipline neutral system/subsystem metrics. These metrics include: a. TRL b. Delta TRL (∆TRL) c. Research and Development Degree of Difficulty (R&D3) (Mankins 1998) d. Technology Need Values (TNVs).
3. Synthesis of technology metrics across technologies and subsystems. 4. Comparative ranking of advanced systems concepts using ITI.

12
The individual technology index (for each technology) is part of the ITI and is defined as:
∆ & The ITI is defined as:
∑ ∆ &
.
The ITI can be characterized as the average TI values for all of the subsystem technologies for the new system. The Advancement Degree of Difficulty (AD2) leverages the concept of R&D3 proposed by Mankins (1998). The determination that results from the AD2 assessment is what is required to advance a technology from its current TRL to what is required to infuse it into the project/program with an acceptable level of risk (Bilbro 2007 and 2008). As suggested by Bilbro, it takes into consideration:
Design Readiness Level, Manufacturing Readiness Level, Integration Readiness Level, Software Readiness Level, Operational Readiness Level, Human Readiness Level, Capability Readiness Levels, and Organizational Aspect (ability of an organization to reproduce existing technology).

13
Figure 1 illustrates a technology assessment process with the insertion of AD2 and use of TRLs.
Figure 1. The Technology Assessment Process at NASA (from Bilbro 2007).
MRLs As identified by Foden and Berends (2010), “less attention is paid to management of manufacturing technologies, even though many organizations compete on the basis of their manufacturing capabilities.” In a recent report, the GAO concluded that better manufacturing outcomes can be achieved by standardizing the way in which manufacturing risks are managed (GAO 2010). The GAO has also characterized successful program as having (1) mature technologies, stable designs, and production processes in control and (2) ST&E organization responsible for maturing technologies, rather than the program or product development manager (Morgan 2008). For the NNSA production complex, because of the nature of nuclear weapons, many of the products, and their associated manufacturing critical processes, are unique and should adhere to industry standards and best manufacturing practices, where applicable, and should be “repeatable, sustainable, and consistently producing parts within the quality standards set.” (GAO 2010) A tool to assess the maturity of a technology’s associated manufacturing processes is termed the MRL.
Identify systems, subsystems, and components per the hierarchical product breakdown of the Work Breakdown Structure
Assign TRL to all components based on assessment of maturity
Assign TRL to subsystems based on lowest TRL of components + TRL state of integration
Baseline Technological Maturity Assessment
Identify all components, subsystems, and systems that are at lower TRLs than required by the program
Assign TRL to Systems based on lowest TRL of subsystems + TRL state of integration
Perform AD2 on all identif ied components, subsystems, and systems that are below requisite maturity level
Technology Development PlanCost Plan
Schedule PlanRisk Assessment

14
Manufacturing Readiness Level (MRL) is:
“ a measure used by some United States government agencies and many of the world's major companies (and agencies) to assess the maturity of manufacturing readiness, serving the same purpose as Technology Readiness Levels serve for technology readiness.
“(MRLs) are designed to be measures used to assess the maturity of a given technology, component or system from a manufacturing prospective. The purpose of MRLs is to provide decision makers (at all levels) with a common understanding of the relative maturity (and attendant risks) associated with manufacturing technologies, products, and processes being considered. Manufacturing risk identification and management must begin at the earliest stages of technology development, and continue vigorously throughout each stage of a program’s life-cycles.
“Manufacturing Readiness Level (MRL) definitions were developed by a joint DoD/industry working group under the sponsorship of the Joint Defense Manufacturing Technology Panel (JDMTP)1. The intent was to create a measurement scale that would serve the same purpose for manufacturing readiness as Technology Readiness Levels serve for technology readiness – to provide a common metric and vocabulary for assessing and discussing manufacturing maturity, risk and readiness. MRLs were designed with a numbering system to be roughly congruent with comparable levels of TRLs for synergy and ease of understanding and use.” (From Wikipedia)
MRLs are proposed as the standardized way/criteria to be used for improving manufacturing risks and readiness and subsequently contributing to achieving successful programs. The definitions of MRLs are given in Table 3. They are structured into five categories:
1. MRL 1-3, Pre-Concept Development (Invention Stage) 2. MRL 4, Concept Development 3. MRL 5-6, Technology Development 4. MRL 7-8, Engineering and Manufacturing Development 5. MRL 9-10, Production and Deployment.
MRLs have been recognized (Morgan 2008) as providing a common language and standard to (1) assess the manufacturing maturity of a technology or product for its future maturation and (2) understand the level of manufacturing risk.
1 The JDMTP established an MRL working group in 2001. An initial set of MRL definitions were published in an appendix to the Technology Readiness Assessment Deskbook in September 2003. The MRL working group hosted a workshop in 2005 with government and industry representatives from the ST&E and acquisition communities. Extensive details on MRLs were subsequently published in the May 2005 version of the Technology Readiness Assessment Deskbook. (see AFRL 2010).

15
Guidance on how to perform a Manufacturing Readiness Assessment (MRA) is given in a draft MRL Deskbook (DoD 2010), similar to the TRA Deskbook (DoD 2009; AFManTech 2008). Additionally, the Air Force prepared a Manufacturing Readiness Assessment Tool (MRAT) to help structure and efficiently complete an MRA to determine the MRL of a chosen product or technology. MRAT helps standardize the process and reporting of the product’s or processes current MRL (1-10). An additional tool called the MRL Assist Tool is also available (Best Manufacturing Practices Center of Excellence 2007). While the implementation of MRLs has the potential for the DoD to achieve savings and efficiencies, they have not been adopted DoD wide and their usage is being met with resistance similar to that experienced by the TRLs when first introduced (GAO 2010).
IRLs Integration Readiness Level is a metric that is to be used to evaluate the integration readiness of any two TRL-assessed technologies (Sauser et al. 2010). In the development of the IRL (Sauser et al. 2006a), it is important to consider physical properties of integration such as interfaces or standards but also interaction, compatibility reliability, quality performance, and common ontology when the two pieces are integrated. As summarized by Sauser et al. (2010), its strengths include:
It is based on open, widely accepted standards (ISO/OSI). Technology readiness is included in the overall assessment. Subjective assessment is made on technical data (however, this can also be considered a
weakness).
Its weaknesses include:
Requires a Work Breakdown Structure (WBS)/System architecture to be complete and accurate before the assessment.
Requires a TRL assessment before the IRL assessment. Lacks the ability to assess criticality and R&D effort. Requires a more quantitative algorithm to reduce integrations into a single assessment for
complex, net-centric systems. Does not evaluate cost and schedule.
Sauser et al. (2010) translated the limitation of TRLs into requirements for an Integration Maturity Metric (IMM). These requirements were:
(1) “IMM shall provide an integration specific metric... (2) IMM shall provide a means to reduce the risk when integrating and maturing a
technology into a system… (3) IMM shall provide the ability to consider meeting of system requirements in the
integration assessment…

16
(4) IMM shall provide a common platform for both new system development and technology insertion…”
These requirements were contrasted to other integration metrics including Mankins’ ITI, the Service Interoperability Assessment Model (Fang et al. 2004), the four-level scale (Nilsson et al. 1990), and the IMM. It was concluded, in part, that ITI was able to factor in R&D effort and technology criticality into the assessment and it may be “that a hybrid metric that uses IRL and ITI is the solution to this situation.”
SRLs A systems approach to expanding the TRL concept has been discussed elsewhere, e.g. Sauser et al. (2006b, 2008a, 2008b) and Magnaye et al. (2009). System Readiness Levels (SRLs)
“have been developed as a project management tool to capture evidence, and assess and communicate System Maturity in a consistent manner to stakeholders. SRLs define a set of nine maturity steps from Concept to in-service across a set of systems engineering disciplines. Each of the SRL steps align to key outputs from systems disciplines such as Training, Safety and Environmental, or Reliability and Maintainability. SRLs track a project’s progress against the systems engineering ‘V’ diagram.” (Tetlay and John, 2009).
SRLs provide the following ‘benefits’ / implications on defense acquisitions as captured by Sauser et al. (2008a).
Can be used as a “trade-study tool to select the most appropriate technologies and integrations to obtain the lowest amount of risk.”;
The SRL model can “improve customer confidence…by providing qualification of system maturity…to system functionality”;
Provides “insight into the interdependencies of different subfunctions” and their relationship to the larger architecture.
Provides for a fast, iterative, and repeated assessment allowing for system understanding and (re) formation;
Allows for other factors as measures of maturity such as obsolescing and optimization of technology investment;
Provides for a common ontology; and, The IRL portion of the approach reduces the uncertainty associated with integrating a
technology into the system.
Additional benefits, as captured by the UK MoD (2010) include:
A common language (ontology) for technology planning, business cases, and stakeholder communications;
Improvements in project planning by addressing all system discipline needs;

17
Information for system maturity assurance; and An established auditable statement of maturity.
A key limitation to the SRL approach is that: the SRL for one system cannot be compared to the SRL of another system unless they are the same system. “Likewise, the SRL can be effective for assessing the progressive maturity of the system of interest, but it is questionable to compare the maturity progression of two systems against each other because of other inherent factors related to the context in which the system is being developed.” (Sauser et al. 2008a)
Application of the SRLs To compensate for some of the shortcomings of using the TRLs, an approach has been developed around the concept of SRLs. Mathematically, they are defined as:
= or where n=3
/ , where
= SRL for technology 1
‘n’= number of technologies
‘mi’ = is the number of integrations of technology “i” with itself and all other technologies.
Another application of the SRL process is an optimization model with the objective to maximize the SRL under constraints associated with cost and schedule (Sauser and Ramirez-Marquez 2007; Ramirez-Marquez et al. 2009).
Technology Management As A Whole Organizations, in order to manage their technology development portfolio, should employ an integrated framework to ensure timely technology investment decisions and capability development (Foden and Berends 2010). As in any organization, the need for the technology must satisfy the business needs and product requirements (i.e., technology pull). A technology management framework can be structured in several stages. This framework is replicated here as Table 3 illustrates the breadth of tools used in the technology framework used at Rolls-Royce.

18
Technology maturation assessment is only a part of the overall framework, which includes additional tools such as Technology Watch, Technology Roadmapping, Technology Make-Buy, and Technology Risk Management. Table 4 gives definitions for technology assessment techniques and SRL values.
Table 3. Typical Technology Management Tools Addressing Each of the Framework Stages and the Context of Technology Maturity and Readiness Tools
(taken from Foden and Berends 2010).

19
Tab
le 4
. D
efin
itio
ns f
or T
RL
s, M
RL
s, I
RL
s, S
RL
s (f
or L
evel
s 1
to 9
) an
d S
RL
Val
ues
(com
pile
d fr
om G
ove
2007
; Ram
irez
-Mar
quez
an
d S
ause
r 20
09; S
ause
r et
al.
2010
; AF
Man
Tec
h 20
08).
LE
VE
L
TR
L D
efin
itio
n
MR
L D
efin
itio
n
IRL
Def
init
ion
S
RL
Def
init
ion
S
RL
Val
ue
1 B
asic
pri
ncip
les
obse
rved
and
re
port
ed.
Bas
ic m
anuf
actu
ring
impl
icat
ions
id
enti
fied
. A
n in
terf
ace
betw
een
tech
nolo
gies
ha
s be
en id
enti
fied
wit
h su
ffic
ient
de
tail
to a
llow
cha
ract
eriz
atio
n of
th
e re
lati
onsh
ip.
Con
cept
Ref
inem
ent
0.10
to 0
.39
2 T
echn
olog
y co
ncep
t and
/or
appl
icat
ion
form
ulat
ed.
Man
ufac
turi
ng c
once
pts
iden
tifi
ed.
The
re is
som
e le
vel o
f sp
ecif
icity
to
char
acte
rize
the
inte
ract
ion
betw
een
tech
nolo
gies
thro
ugh
thei
r in
terf
ace.
3 A
naly
tica
l and
exp
erim
enta
l cr
itic
al f
unct
ion
and/
or
char
acte
rist
ic p
roof
of
conc
ept.
Man
ufac
turi
ng p
roof
-of-
conc
ept
deve
lope
d.
The
re is
com
pati
bili
ty b
etw
een
tech
nolo
gies
to o
rder
ly a
nd
effi
cien
tly in
tegr
ate
and
inte
ract
.
4 C
ompo
nent
and
/or
brea
dboa
rd
vali
dati
on in
labo
rato
ry
envi
ronm
ent.
Cap
abil
ity
to p
rodu
ce th
e te
chno
logy
in a
labo
rato
ry
envi
ronm
ent.
The
re is
suf
fici
ent d
etai
l in
the
qual
ity
and
assu
ranc
e of
the
inte
grat
ion
betw
een
tech
nolo
gies
.
5 C
ompo
nent
and
/or
brea
dboa
rd
vali
dati
on in
rel
evan
t en
viro
nmen
t.
Cap
abil
ity
to p
rodu
ce p
roto
type
co
mpo
nent
s in
a p
rodu
ctio
n re
leva
nt e
nvir
onm
ent.
The
re is
suf
fici
ent c
ontr
ol b
etw
een
tech
nolo
gies
nec
essa
ry to
est
abli
sh,
man
age,
and
term
inat
e th
e in
tegr
atio
n.
Tec
hnol
ogy
Dev
elop
men
t 0.
40 to
0.5
9
6 Sy
stem
/sub
syst
em m
odel
de
mon
stra
tion
in r
elev
ant
envi
ronm
ent.
Cap
abil
ity
to p
rodu
ce a
pro
toty
pe
syst
em o
r su
bsys
tem
in a
pr
oduc
tion
rel
evan
t env
iron
men
t.
The
inte
grat
ing
tech
nolo
gies
can
ac
cept
, tra
nsla
te, a
nd s
truc
ture
in
form
atio
n fo
r it
s in
tend
ed
appl
icat
ion.
7 Sy
stem
pro
toty
pe d
emon
stra
tion
in
rel
evan
t env
iron
men
t. C
apab
ilit
y to
pro
duce
sys
tem
s,
subs
yste
ms,
or
com
pone
nts
in a
pr
oduc
tion
rep
rese
ntat
ive
envi
ronm
ent (
MR
L 7
).
The
inte
grat
ion
of te
chno
logi
es h
as
been
ver
ifie
d an
d va
lida
ted
wit
h su
ffic
ient
det
ail t
o be
act
iona
ble.
Syst
em D
evel
opm
ent
and
Dem
onst
rati
on
0.60
to 0
.79
Pilo
t lin
e ca
pabi
lity
de
mon
stra
ted;
rea
dy to
beg
in
low
-rat
e, in
itia
l pro
duct
ion
(MR
L
8).
8 A
ctua
l sys
tem
com
plet
ed a
nd
qual
ifie
d th
roug
h te
st a
nd
dem
onst
rati
on.
Low
-rat
e pr
oduc
tion
de
mon
stra
ted;
cap
abil
ity in
pla
ce
to b
egin
ful
l-ra
te p
rodu
ctio
n (M
RL
9).
Act
ual i
nteg
rati
on c
ompl
eted
and
m
issi
on q
uali
fied
thro
ugh
test
and
de
mon
stra
tion
in th
e sy
stem
en
viro
nmen
t.
9 A
ctua
l sys
tem
pro
ven
thro
ugh
succ
essf
ul m
issi
on o
pera
tion
s.
Ful
l-ra
te p
rodu
ctio
n de
mon
stra
ted
and
lean
pro
duct
ion
prac
tices
in p
lace
(M
RL
10)
.
Inte
grat
ion
is m
issi
on p
rove
n th
roug
h su
cces
sful
mis
sion
op
erat
ions
.
Pro
duct
ion
0.80
to 0
.89
Ope
rati
ons
and
Sup
port
0.
90 to
1.0
0

20
Summary Technology Readiness Levels (TRLs) have been used extensively from the 1970s, especially in NASA. Their application was recommended by the GAO in 1999 to be used for major Department of Defense (DoD) acquisition projects. Manufacturing Readiness Levels (MRLs) have been proposed for improving the way manufacturing risks and readiness are identified by DoD. These criteria have been introduced to the defense community more recently, in 2005 (GAO 2010), but have not been used as broadly as TRLs. Originally TRLs were used to assess the readiness of a single technology. With the emergence of more complex systems and system of systems (SoS), it has been increasingly recognized that TRLs have limitations, especially when considering integration within and between complex systems. Therefore, it is important to use TRLs in the correct context, especially when considering complex systems. Details on TRLs and MRLs have been presented in this report. Recognizing that there are limitations in using TRLs, other approaches have been proposed to address some of these limitations. Most notably, the System Readiness Levels (SRLs) approach, which incorporates Integration Readiness Levels (IRLs), has been proposed, specifically to address limitations when integrating system elements, given the presumption that most systems fail at the integration point. Details on both readiness levels are presented in this report. In addition, a simplified example is presented in this report on how to apply the SRL approach. The approach was modeled after papers from Stevens Institute of Technology. It is proposed that a modified SRL be considered that explicitly includes the MRLs and a modification of the TRLs to include the Integrated Technology Index and/or the Advanced Degree of Difficulty (AD2) index proposed by NASA. It is also important to note that using technology readiness assessments is only one tool to manage technology within an organization. Other common tools include technology roadmapping, technology watches, and technology risk management. Key factors to transition and manage technology include cost, schedule, manufacturability, integration readiness, and technology maturity.

21
References
Air Force Research Laboratory (AFRL), 2010, Manufacturing Readiness Levels - A New Tool for Technology Development and Acquisition Program Manufacturing Risk Reduction, at http://www.ml.afrl.af.mil/mlm/manufacturing_readiness.html , from AFRL’s Materials and Manufacturing Directorate.
Azizian, N., S. Sarkani, and T. Mazzuchi, 2009, A Comprehensive Review and Analysis of Maturity Assessment Approaches for Improved Decision Support to Achieve Efficient Defense Acquisition, in Proceedings of the World Congress on Engineering and Computer Science, Vol. II, WCECS 2009, San Francisco, USA, October 20-22, 2009.
Best Manufacturing Practices Center of Excellence, 2007, MRL Assist Tool User Manual (Version 1.1), BMP Center of Excellence, at www.bmpcoe.org.
Bilbro, J. W. and R. L. Sackheim, 2002, Managing a Technology Development Program, at http://jbconsultinginternational.com/AdvancementDegreeofDifficulty.aspx.
Bilbro, J. W., 2006, Technology Assessment Requirements for Programs and Projects, in Multi-Dimensional Assessment of Technology Maturity Workshop, May 9-11, 2006.
Bilbro, J. W., 2007, Mitigating the Adverse Impact of Technology Maturity, in Project Management Challenge 2007, Fourth Annual NASA Project Management Conference, February 6-7, 2007.
Bilbro, J. W., 2008, Using the Advancement Degree of Difficulty (AD2) as an Input to Risk Management, in Multi-Dimensional Assessment of Technology Maturity- Technology Maturity Conference, Virginia Beach, VA, September 8-12, 2008.
Brooks, R. T., and A. P., Sage, 2005/2006, Systems of Systems Integration and Test, in Information Knowledge Systems Management, Vol. 5, pp. 261-280.
Cornford, S., and L. Sarsfield, 2004, Quantitative Methods for Maturing and Infusing Advanced Spacecraft Technology, in IEEE Aerospace Conference Proceedings, pp. 663-681.
Department of Defense (DoD), 2009, Technology Readiness Assessment (TRA) Deskbook, Prepared by the Director, Research Directorate (DRD), Office of the Director, Defense Research and Engineering (DDR&E).
DoD, 2010, Manufacturing Readiness Level Deskbook, Prepared by the OSD Manufacturing Technology Program In Collaboration with The Joint Service/Industry MRL Working Group, June 25, 2010 (draft).

22
Dowling, T., and T. Pardoe, 2005, TIMPA—Technology Insertion Metrics, Ministry of Defence, London, UK.
Dubos, G.F., J. H. Saleh, and R. Braun, 2007, Technology Readiness Level, Schedule Risk and Slippage in Spacecraft Design: Data Analysis and Modeling, in AIAA SPACE 2007 Conference & Exposition, AIAA 2007-6020, Long Beach, California, September 18-20, 2007.
Engle, M., S. Sarkani, and T. Mazzuchi, 2009, Technical Maturity Evaluations for Sensor Fusion Technologies, in Applied Imagery Pattern Recognition Workshop (AIPRW), 2009 IEEE, Washington, D.C., October 14-16, 2009.
Fang, J., S. Hu, and Y. Han, 2004, A Service Interoperability Assessment Model for Service Composition, in Services Computing, 2004 IEEE International Conference on Services Computing (SCC 2004).
Foden, J., and H. Berends, 2010, Technology Management at Rolls-Royce, Industrial Research Institute, March-April 2010.
GAO, 1999, Best Practices: Better Management of Technology Development Can Improve Weapon System Outcomes, U.S. Government Accountability Office, NSIAD-99-162, July 1999.
GAO, 2006, Best Practices: Stronger Practices Needed to Improve DoD Technology Transition Process, U.S. Government Accountability Office, GAO-06-883, September 2006.
GAO, 2008, Defense Acquisition: Assessments of Selected Weapon Programs, U.S. Government Accountability Office, GAO-08-476SP.
GAO, 2010, DoD Can Achieve Better Outcomes by Standardizing the Way Manufacturing Risks Are Managed, U.S. Government Accountability Office, GAO-10-439, 70 pp.
Gove, R., 2007, Development of an Integration Ontology for Systems Operational Effectiveness, M.S. Thesis, Stevens Institute of Technology.
Graettinger, C. P., S. Garcia, J. Siviy, R. J. Schenk, and P. J. Van Syckle, 2002, Using the ‘Technology Readiness Levels’ Scale to Support Technology Management in the DoDs ATD/STO Environments, Carnegie Mellon Software Engineering Institute, CMU/SEI-2002-SR-027.
Magnaye, R. B., B. J. Suaser,and J. E. Ramirez-Marquez, 2009, System Development Planning Using Readiness Levels in a Cost of Development Minimization Model, in Systems Engineering DOI, Wiley Periodicals, Inc.

23
Mahafza, S., P. Componation, and D. Tippett, 2005, A Performance-Based Technology Assessment Methodology to Support DoD Acquisition, in Defense Acquisition Review Journal, Vol. 11, No. 3, December 2004-March 2005, pp. 269-282.
Mankins, J.C., 1995, Technology Readiness Levels – A White Paper, April 6, 1995, Advanced Concepts Office, Office of Space Access and Technology, National Aeronautics and Space Administration.
Mankins, J.C., 1998, Research & Development Degree of Difficulty (R&D3) – A White Paper, March 10, 1998, Advanced Project Office of Space Flight, National Aeronautics and Space Administration Headquarters.
Mankins, J.C., 2002, Approaches to Strategic Research and Technology (R&T) Analysis and Road Mapping, in Acta Astronautica, Vol. 51, No. 1-9, pp. 3-21.
Mankins, J.C., 2009, Technology Readiness and Risk Assessment: A New Approach, in Acta Astronautica, Vol. 65, Issues 9-10, November-December 2009, pp. 1208-1215.
Michaud, K., E. Forbes, B. Sauser, and P. Gentile, 2008, Evaluating Complex System Development Maturity – The Creation and Implementation of a System Readiness Level for Defense Acquisition Programs, in NDIA Systems Engineering Conference, October 22, 2008.
Minning, C. P., P. I. Moynihan, and J. F. Stocky, 2003, Technology Readiness Levels for the New Millennium Program, in Aerospace Conference 2003 Proceedings IEEE, Vol. 1, pp. 417-426.
Moorehouse, D., 2002, Detailed Definitions and Guidance for Application of Technology Readiness Levels, in Journal of Aircraft, Vol. 39, No. 1, Engineering Notes, pp. 190-192.
Morgan, J., 2008, Manufacturing Readiness Levels (MRLs) and Manufacturing Readiness
Assessments (MRAs), Performed by AFRL/RXMT, Wright Patterson AFB, OH.
Nilsson, E. G., E. K. Nordhagen, and G. Oftedal, 1990, Aspects of Systems Integration, in Proceedings of the First International Conference on Systems Integration '90, Morristown, New Jersey, United States, pp. 434-443.
NNSA, 2010, Component Maturation Framework NNSA Sites’ Package - For NNSA Site Review and Response, September 24, 2010.
Ramirez-Marquez, J., and B. Sauser, 2009, System Development Planning via System Maturity Optimization, in IEEE Transaction on Engineering Management, Vol. 56, No. 3, August 2009, pp. 533-548.

24
Sauser, B., J. Ramirez-Marquez, D. Verma, and R. Gove, 2006a, Determining System Interoperability Using an Integration Readiness Level, Stevens Institute of Technology, Hoboken, NJ.
Sauser, B., J. Ramirez-Marquez, D. Verma, and R. Gove, 2006b, From TRL to SRL: The Concept of Systems Readiness Levels, in Proceedings of the Conference on System Engineering Research, Los Angeles, CA., April 7, 8, 2006, Paper #126, Stevens Institute of Technology, Hoboken, N.J., 10 pp.
Sauser, B. J., and J.E. Ramirez-Marquez, 2007, A System Maturity Index for Decision Support in Life Cycle Acquisition, Presented at the AFRL Technology Maturity Conference, Virginia Beach, VA, September 11-13, 2007.
Sauser, B., J.E. Ramirez-Marquez, R. Magnaye, and W. Tan, 2008a, A Systems Approach to Expanding the Technology Readiness Level within Defense Acquisition, in International Journal of Defense Acquisition Management, Vol. 1, pp. 39-58.
Sauser, B. J., J. E. Ramirez-Marquez, and D. Henry, 2008b, A System Maturity Index for the Systems Engineering Life Cycle, in International Journal of Industrial and Systems Engineering, Vol. 3, No. 6, pp. 673-690.
Sauser, B., R. Gove, E. Forbes, and J.E. Ramirez-Marquez, 2010, Integration Maturity Metrics: Development of an Integration Readiness Level, in Information Knowledge Systems Management, Vol. 9, pp. 17-46.
Smith, J., 2004, An Alternative to Technology Readiness Levels for Non-Developmental Item (NDI) Software, Integration of Software-Intensive Systems Initiative, CMU/SEI-2004-TR-013, ESC-TR-2004-013, Carnegie Mellon Software Engineering Institute.
Tan, W., B. Sauser, J. Ramirez-Marquez, 2009, Monte-Carlo Simulation Approach for System Readiness Level Estimation, in 19th Annual International Symposium of INCOSE and 3rd Asia-Pacific Conference on System Engineering, July 20-23, 2009.
Tetlay, A. and P. John, 2009, Determining the Lines of System Maturity, System Readiness and Capability Readiness in the System Development Lifecycle, in 7th Annual Conference on Systems Engineering Research 2009 (CSER 2009), April 20-23, 2009.
UK MoD, 2010, “What are System Readiness Levels (SRLs)?”
U.S. Air Force (AFManTech), 2008, Manufacturing Readiness Assessment Tool – Users Manual, Public Release Case #88ABW-2008-1197, Version 1, November 20, 2008.

25
Appendix A. Example of Computing System Readiness Levels
This example assumes 12 technologies are embedded in five components. Their interrelationships are illustrated in Figure A-1. Technology Readiness Levels (TRLs), Manufacturing Readiness Levels (MRLs), and Integration Readiness Levels (IRLs) are given in Table A-1.
Figure A-1. Schematic Architecture of Hypothetical System.
Table A-1. TRL, MRL and IRL Values for Each Technology in the System.
Component Tech TRL MRLIntegrating
TechnologiesIRL
1
1 6 5 1,2 1,5
6 3
2 5 4 2.3 6 3 5 4 3,12 3
2
4 8 3 4,5 4,6 4,7
6 6 6
5 3 1 5,7 5,6 5,8 5,11
6 6 3 3
6 9 2 6,7 6 7 4 2 see above
3
8 4 2 8,9 6 9 4 4 9,10 6 10 4 4 10,12 3
4 11 8 9 11,12 3 5 12 9 9 see above

26
It is assumed in this example that the IRL values between technologies within a component are relatively mature, and the IRLs for technologies between components are much lower, i.e., MRL=3. For the majority of the components the MRLs are assumed to be low, i.e., MRL=3. The matrix formulas used to compute the individual System Readiness Levels (SRLs) and the composite, system SRL (Tan et al. 2009 and Sauser et al. 2008a and 2008b) are given below.
The component SRL matrix is the product of the TRL and the IRL matrices
1 ⁄ 0 … 0 0 1⁄ … 0
… … … … 0 0 . . . 1/
… …
… … … … …
1
2
where “mi” is the number of integrations of technology “i” with itself and all technologies, and [Norm] is to normalize the SRLi from the (0, mi) scale to the (0,1) scale.

27
The 1/mi matrix is given below to normalize to the “0, 1 scale.”
norm TRL
0
0
1
2
3
4
5
6
7
8
9
10
11
0.667
0.556
0.556
0.889
0.333
1
0.444
0.444
0.444
0.444
0.889
1
norm MRL
0
0
1
2
3
4
5
6
7
8
9
10
11
0.556
0.444
0.444
0.333
0.111
0.222
0.222
0.222
0.444
0.444
1
1
mi
.333
0
0
0
0
0
0
0
0
0
0
0
0
.333
0
0
0
0
0
0
0
0
0
0
0
0
.333
0
0
0
0
0
0
0
0
0
0
0
0
.25
0
0
0
0
0
0
0
0
0
0
0
0
.143
0
0
0
0
0
0
0
0
0
0
0
0
.25
0
0
0
0
0
0
0
0
0
0
0
0
.25
0
0
0
0
0
0
0
0
0
0
0
0
.333
0
0
0
0
0
0
0
0
0
0
0
0
0.333
0
0
0
0
0
0
0
0
0
0
0
0
.333
0
0
0
0
0
0
0
0
0
0
0
0
.333
0
0
0
0
0
0
0
0
0
0
0
0
.25
norm1
9
TRL
6
5
5
8
3
9
4
4
4
4
8
9
MRL
5
4
4
3
1
2
2
2
4
4
9
9

28
[SRL], (0,ni scale) = [Norm] x [IRL] x [TRL] =
INORM TNORM
0
0
1
2
3
4
5
6
7
8
9
10
11
1.148
1.37
1.259
2.074
2.556
2.111
1.926
0.852
1.037
1.074
1.333
1.63
IRL
9
6
0
0
3
0
0
0
0
0
0
0
6
9
6
0
0
0
0
0
0
0
0
0
0
6
9
0
0
0
0
0
0
0
0
3
0
0
0
9
6
6
6
0
0
0
0
0
3
0
0
6
9
6
6
3
0
0
3
0
0
0
0
6
6
9
6
0
0
0
0
0
0
0
0
6
6
6
9
0
0
0
0
0
0
0
0
0
3
0
0
9
6
0
0
0
0
0
0
0
0
0
0
6
9
6
0
0
0
0
0
0
0
0
0
0
6
9
0
3
0
0
0
0
3
0
0
0
0
0
9
3
0
0
3
0
0
0
0
0
0
3
3
9
norm IRL
0 1 2 3 4 5 6 7 8 9 10 11
0
1
2
3
4
5
6
7
8
9
10
11
1 0.667 0 0 0.333 0 0 0 0 0 0 0
0.667 1 0.667 0 0 0 0 0 0 0 0 0
0 0.667 1 0 0 0 0 0 0 0 0 0.333
0 0 0 1 0.667 0.667 0.667 0 0 0 0 0
0.333 0 0 0.667 1 0.667 0.667 0.333 0 0 0.333 0
0 0 0 0.667 0.667 1 0.667 0 0 0 0 0
0 0 0 0.667 0.667 0.667 1 0 0 0 0 0
0 0 0 0 0.333 0 0 1 0.667 0 0 0
0 0 0 0 0 0 0 0.667 1 0.667 0 0
0 0 0 0 0 0 0 0 0.667 1 0 0.333
0 0 0 0 0.333 0 0 0 0 0 1 0.333
0 0 0.333 0 0 0 0 0 0 0.333 0.333 1

29
[SRL], (0, 1 scale) = mi x [Norm] x [IRL] x [TRL] =
The results are summarized in Table A-2.
Table A-2. SRL for Individual Technologies 1 to 12.
∑
12
Composite SRL not considering MRLs = 0.416 Composite SRL considering MRLs = 0.189
mi INORM TNORM
0
0
1
2
3
4
5
6
7
8
9
10
11
0.382
0.456
0.419
0.519
0.365
0.528
0.481
0.284
0.345
0.358
0.444
0.407
SRL1 SRL2 SRL3 SRL4 SRL5 SRL6 SRL7 SRL8 SRL9 SRL10 SRL11 SRL12(0,ni ) scale
not
considering
MRLs 1.148 1.37 1.259 2.074 2.556 2.111 1.926 0.852 1.037 1.074 1.333 1.63
(0,1) scale
not
considering
MRLs 0.382 0.456 0.419 0.519 0.365 0.528 0.481 0.284 0.345 0.358 0.444 0.407
(0,1) scale
considering
MRLs 0.212 0.202 0.186 0.173 0.041 0.117 0.107 0.063 0.153 0.159 0.444 0.407

30
Figure A-2 demonstrates the correlation of project life cycle and SRLs when considering MRLs.
Figure A-2. Correlation of DoD Project Life Cycle, SRLs, and the Effects in SRLs when considering MRLs (upper part of figure from Sauser and Ramirez-Marquez 2007).
References Tan, W., B. Sauser, J. Ramirez-Marquez, 2009, Monte-Carlo Simulation Approach for System
Readiness Level Estimation, 19th Annual International Symposium of INCOSE and 3rd Asia-Pacific Conference on System Engineering, July 20-23, 2009.
Sauser, B. J., and J.E. Ramirez-Marquez, 2007, A System Maturity Index for Decision Support in Life Cycle Acquisition, Presented at the AFRL Technology Maturity Conference, Virginia Beach, VA, September 11-13, 2007.
Sauser, B., J.E. Ramirez-Marquez, R. Magnaye, and W. Tan, 2008a, A Systems Approach to Expanding the Technology Readiness Level within Defense Acquisition, International Journal of Defense Acquisition Management, Vol. 1, pp. 39-58.
Sauser, B. J., J. E. Ramirez-Marquez, and D. Henry, 2008b, A System Maturity Index for the Systems Engineering Life Cycle, International Journal of Industrial and Systems Engineering, Vol. 3, No. 6, pp. 673-690.
Span of technology specific SRLs not considering
MRLs
Span of technology specific SRLs considering
MRLs

31
Distribution 13 U. S. Department of Energy 1000 Independence Avenue, SW Washington, DC 20585 For: Kevin Greenaugh, NA12 Wendy Baca, NA-12.1 Joseph Oder, NA-122 Alan Felser, NA-122.1 Jay Pape, NA-122.3 Nanette Founds, NA-123 Julianne Levings, NA-123.1 Kevin Kleinsorge, NA-123 Maurice Pitt, NA-124 Robert Jones, NA-124.1 David Cameron, NA-124.2 David Coy, NA-124.2 Ann Morimizu, NA-60 1 The Kansas City Plant 2000 E. 95th Street Kansas City, MO 64131 For: John Davis 1 Livermore National Laboratory 7000 East Avenue Livermore, CA 94550-0808 For: Tom Horrillo 1 Los Alamos National Laboratory P.O. Box 1663 Los Alamos, NM 87545 For: Charles Hills 1 B&W Pantex P.O. Box 30020 Amarillo, TX 79120 For: Gary Cockrell 1 Savannah River Site P.O. Box 616 Building 235-H Aiken, SC 29802-0616 For: Geoff Netzley

32
1 Nevada Site Office P.O. Box 98518 2621 Losee Road North Las Vegas, NV 89193-8518 For: Lloyd Montoya 1 MS0109 J. McDowell 2 1 MS0110 J. M. Phillips 1200 1 MS0110 J. Johannes 1220 1 MS0110 W. Jenkins 1230 1 MS0134 D. Corbett 200 1 MS0351 D. Croessmann 1910 1 MS0359 H. R. Westrich 1911 1 MS0421 W. Jones 500 1 MS0421 M. Sjulin 540 1 MS0431 J. Everett 500 1 MS0431 J. Vinson 510 10 MS0431 J. Fernandez 511 1 MS0431 J. Pott 511 1 MS0431 P. Van Buren 511 1 MS0431 E. Grotheer 512 1 MS0431 D. Conatser 512/Y-12 1 MS0431 M. Dickinson 522 1 MS0438 M. Cieslak 2800 1 MS0438 T. Jones 2810 1 MS0453 B. Remund 2140 1 MS0447 J.F. Nagel 2127 1 MS0479 P. Cowen 2134 1 MS0751 R. Finley 6911 1 MS1369 R. MacKinnon 6781 1 MS1454 L. Minier 2554 1 MS9154 M. Lau 8230 1 MS9154 M. E.Gonzales 8240 1 MS 0899 Technical Library, 9536 (electronic copy)

33
