contents - somalilandcsd.org · contents preface ... 6.1 banking 8 6.2 ... somaliland is an islamic...
TRANSCRIPT

~ i ~
CONTENTS
PREFACE 1
1. INTRODUCTION 2
2. GEOGRAPHY AND CLIMATE 2
2.1 Location 2
2.2 Area 2
2.3 Climate 2
2.4 Rainfall 3
2.5 Humidity 3
3. ADMINISTRATIVE SUB-DIVISIONS 3
3.1 State 3
3.2 Regions & Districts 3
3.3 Capital 3
3.4 Other Principal Towns 4
3.5 Ports 4
4. POPULATION 4
4.1 Vital Statistics 4
4.2 Population Density 4
4.3 Religion 4
4.4 Languages 4
4.5 Currency 4
5. GOVERNMENT EMPLOYEES 5
6. ECONOMY SECTOR 8
6.1 Banking 8
6.2 Livestock 8
6.3 Agriculture 10
6.3.1 Rain-fed farming and Irrigation 10
6.3.2 Marketing of Agricultural Produce 10
6.3.3 Cereal Harvest in 2007-2012 10
6.4 Light Industries 12
6.5 Fisheries 13
6.5.1 Artisanal Fishing 13
6.5.2 Industrial Fishing 13
6.5.3 Fishing Cannery 13
6.5.4 Marketing 14
6.6 Central Government Budget 15

~ ii ~
6.7 Local Government Revenue & Expenditure 17
6.8 Imports 21
6.9 Export 30
6.9.1 Livestock Export 30
6.9.2 Hide and Skin Export 33
6.9.3 Frankincense Export 34
6.1. Transportation & Communication 36
7. SOCIAL SECTOR 37
7.1 Education 37
7.1.1 Primary Education 38
7.1.2 Secondary Education 42
7.1.3 Higher Education 46
7.2 Health 51
7.2.1 Public Health 51
7.2.2 Private Health Services 60
7.3 Justices 68
7.3.1 Criminal Statistics 68
7.3.2 Prisoners 72
7.3.3 Vehicle Accidents 73
7.4 Water 74
7.4.1 Available Water Facilities 74
7.4.2 Status of Boreholes 75
7.5 Tourism 76
7.5.1 Hotels 76

~ 1 ~
PREFACE
The Ministry of National Planning and Development (MNP& D) has the honour of presenting the
2013 edition of Somaliland In-Figures. This booklet is the 10-th publication in the series. It contains
official statistical data on various components of the economic and social activities in the Republic.
Its purpose is to provide information on different sectors to assist in the planning and development
of the nation.
Data contained in this booklet is based mainly on the administrative records of the ministries and
agencies of the state. The MNP&D is grateful for the assistance it received. Somaliland In-Figures will
be regularly updated. Therefore, we welcome the continued support of existing sources and
feedback from users of this data.
Comments and suggestions may be sent to the Department of Statistics and Research at the MNP&D
in Hargeisa.
Website: www.slministryofplanning.org
“ XOG LA HEL YAABA TALO LA HEL.”

~ 2 ~
1. INTRODUCTION The former British Somaliland Protectorate achieved full independence from the United Kingdom on
26 June, 1960. On 1 July, 1960, the state of Somaliland united with Somalia, a territory under a U.N.
mandated Italian Trusteeship until that same day, thereby creating the Somali Republic.
The Republic of Somaliland restored its independence after the total collapse of Somalia on 18 May
1991 as a result of the civil war of the late eighties and early nineties. The decision was made by the
Congress of Council of Clan Elders held in Burao from 27 April to 15 May, 1991. Constitutionally,
the Republic of Somaliland is a democratic country with a multi-party system.
The decision to reclaim independence in 1991 was confirmed by national referendum for the
constitution which and bodies the sanity of the sovereignty of Somaliland on which was approved by
97% of the votes. Since then Somaliland held two local municipal elections (2002 and 2012), a
parliamentary election (2005) and two presidential elections (2003 and 2010).
2. GEOGRAPHY AND CLIMATE
2.1. LOCATION The Republic of Somaliland is situated in the Horn of Africa. Its boundaries are defined by the Gulf of Aden in the north, Somalia in the east, the Federal Republic of Ethiopia in the south-west, and the Republic of Djibouti in the north-west. It lies between Latitudes 8o and 11o27’ North and Longitudes 42o35’ and 49o East; it has mountain ranges rising up to six and seven thousand feet in the centre and in the east of the country respectively.
2.2. AREA
The total area of the Republic of Somaliland is 137, 600sqkms, and it has a coastline which is 850kms
long.
2.3. CLIMATE
Somaliland is located north of the Equator. It is semi-arid. The average daily temperatures range
from 25oC to 35oC. The sun passes vertically overhead twice a year, on 22 March and 23 September.
Somaliland consists of three main topographic zones:
(1). A Coastal Plain (Guban) (2) The Coastal Range (Oogo) (3) A Plateau (Hawd)
The Coastal Plain (Guban) is a zone with high temperatures and low rainfall. Summer temperatures
in the region easily average over 100”F. However, temperatures come down during the winter, and
both human and livestock populations increase dramatically in the region.
The Coastal Range (Ogo) is a high plateau to the immediate south of Guban. Its elevation ranges
from 6000ft above sea level in the west to 7000ft in the East. Rainfall is heavier there than in Guban,
although it varies considerably within the zone.
The Plateau (Hawd) region lies to the south of Ogo range. It is generally more heavily populated
during the wet season, when surface water is available. It is also an important area for grazing.

~ 3 ~
2.4. RAINFALL
Somalilanders recognise four seasons in the year; GU and Hagaa comprise spring and summer in that
order, and Dayr and Jiilaal correspond to autumn and winter respectively.
The average annual rainfall is 14.5 inches in most parts of country, and most of it comes during Gu
and Dayr. GU, which is the first, or major, rainy season (late March, April, May, and early June),
experiences the heaviest rainfall in Ogo range and Hawd. This constitutes the period of fresh grazing
and abundant surface water. It is also the breeding season for livestock. Hagaa (from late June
through August) is usually dry although there are often some scattered showers in the Ogo range,
these are known as Karan rains. Hagaa tends to be hot and windy in most parts of the country. Deyr
(September, October, and early November), which roughly corresponds to autumn, is the second, or
minor, wet season; as the word “minor” suggests, the amount of precipitation is generally less than
that of Gu. Jilaal, or winter, falls in the coolest and driest months of the year (from late November to
early March). It is a season of thirst. Hawd receive virtually no rainfall in winter. The rainfall in the
Guban zone, known as “Hays”, comes between January and March or from December to January.
2.5. HUMIDITY
The humidity of the country varies from 63% in the dry season to 82% in the wet season.
3. ADMINISTRATIVE SUB-DIVISIONS
3.1. STATE
The administrative structure of the state consists of three branches: the judiciary, legislative (the
House of Elders and the House of Representatives), and the executive (the President and his chosen
Council of Ministers). The ministers may not be appointed from Members of Parliament.
3.2. REGIONS AND DISTRICTS
The country is divided into thirteen regions, namely, Awdal, Maroodi-jeeh, Saahil, Togdheer, Sanaag,
Sool, Gabilay, Salal, Oodweine, Saraar, Buhoodle, Hawd, and Badhan. These are sub-divided into 81
districts.
3.3. CAPITAL
The capital of the Republic of Somaliland is Hargeisa. The estimated population of the city is nearly
around 725,000.

~ 4 ~
3.4. OTHER PRINCIPAL TOWNS
Other towns are Borama, Berbera, Burao, Erigavo, and Las Anod.
3.5. PORTS
The principal port town of Somaliland is Berbera.
4. POPULATION
The population of Somaliland was estimated at 4.4 million in 2012. The population consists of
nomads (55%) and urban and rural dwellers (45%).
4.1 VITAL STATISTICS
The annual population growth rate is 3.14%. This figure is calculated from the average crude birth
rate of 4.46% and crude death rate of 1.32%. Life expectancy at birth is 49.
4.2 POPULATION DENSITY
The population density in the Republic of Somaliland has been estimated at 32persons per square
km in 2012
4.3 RELIGION
Somaliland is an Islamic State, and Somalilanders are Muslims. The influence of Islam throughout
Somaliland is profound, and faith plays a major role in everyday life.
4.4 LANGUAGES
The official language of the country is Somali. Arabic and English are also used widely, though mostly
in written form.
4.5 CURRENCY
The official currency of the Republic of Somaliland is the Somaliland Shilling. The shilling is divided
into 100 cents. Currency notes come in denominations of 5000, 1000, 500, 100, 50, 20, 10, and 5
shillings.

~ 5 ~
5. GOVERNMENT EMPLOYEES Table 1A.Number of institutional staff, gender and their grades 2011
NO NAME OF THE INSTITUTION FEMALE MALE A B C D TOTAL
1 Ministry of religion 2 36 6 23 6 3 38
2 Ministry of sports and youth 41 140 18 104 35 24 181
3 Ministry of Public Works 19 149 23 57 64 24 168
4 Ministry of Work and Social Affairs 35 63 22 39 18 19 98
5 Ministry of Water and Mineral resource 15 61 23 34 12 7 76
6 Ministry of Justice HQ (A) 11 23 16 8 4 6 34
Lower Courts (B) 69 68 4 39 13 81 137
7 Ministry of telecommunication 19 45 7 40 7 10 64
8 Ministry of Agriculture 23 132 36 59 27 33 155
9 Ministry of Livestock 24 168 33 108 35 16 192
10 Ministry of Environment and rural Dev 23 170 19 37 121 16 193 11 Ministry of Planning 13 30 16 11 10 6 43
12 Ministry of defence 7 15 4 5 8 5 22
13 Ministry of presidency 18 67 21 25 26 13 85
14 Ministry of fishery 14 68 9 28 30 15 82
15 Ministry of Interior HQ (A) 33 38 15 34 10 12 71
Regional (B) 39 106 21 12 16 12 52
16 Ministry of Re.and Reconstruction. 11 41 12 12 16 12 52
17 Ministry of Foreign Affairs 11 22 10 9 6 8 33
18 Ministry of Commerce 28 168 33 53 37 73 196
19 Ministry of Education 548 3,544 616 3,091 34 351 4092
20 Ministry of Civil Aviation 29 168 29 59 60 49 197
21 Ministry of Information 72 231 45 147 86 25 303
22 Ministry of Finance 105 491 91 269 122 114 596
23 Ministry of Health 565 1,258 179 723 593 328 1,823
24 Nerad 4 10 3 7 1 3 14
25 LRC 2 3 1 2 1 1 5
26 Auditing General 6 47 6 31 12 4 53
27 House of Representative 25 46 10 19 15 27 71 28 House of Elders 12 23 6 14 8 7 35
29 Human Rights Commission 7 6 8 1 2 2 13
30 Tender Committee 3 7 3 4 1 2 10
31 Higher Courts 6 9 2 5 5 3 15
32 Attorney General 12 25 2 12 7 16 37
33 ICT 1 5 4 0 1 1 6
34 NDRC 5 38 7 22 9 5 43
35 NDA 4 22 4 12 7 3 26
36 AIDS 7 21 6 8 2 12 28
37 Civil Service Commission 9 20 6 8 8 7 29
Civil Service Institute 14 9 7 1 2 13 23
38 Coordination Office of two Parliaments and Cabinet Ministries
2 10 4 4 3 1 12
39 Diaspora Agency 3 11 3 5 2 4 14
40 Quality Control agency 12 47 15 35 3 6 59
41 G. Governance & A. corruption Committee
2 14 8 3 1 4 16
42 Food Coordination Agency 2 4 2 1 1 2 6
Total 1,912 7,679 1,415 5,220 1,487 1,385 9,498 Source: Civil Service Commission.

~ 6 ~
Table 1B.Number of institutional staff, gender and their grades 2012
Source: Civil Service Commission.
Name of the institution
Gender Grades Total
female male A B C D Ministry of religion 3 44 9 26 8 4 47
Ministry of sports 44 137 23 99 35 24 181
Ministry of public works and transports 23 134 27 51 56 23 157
Ministry of labor and social affairs 32 180 39 64 60 49 212
Ministry of Water,mineral and energy 18 59 22 32 15 8 77
Ministry of justice 11 23 16 8 4 6 34
Ministry of telecommunication 20 66 18 51 8 9 86
Ministry of agriculture 27 139 36 66 28 33 163
Ministry of livestock 30 197 44 134 29 20 227
Ministry of environment and rural dev. 24 176 21 40 122 17 200
Ministry of planning 33 61 71 19 12 22 124
Ministry of defence 11 17 6 8 8 8 30
Ministry of Presidential 18 69 21 26 27 13 87
Ministry of fishery 14 68 9 28 30 15 82
Ministry of interior 39 168 32 77 44 54 207
Ministry of re. and reconstruction 12 46 13 14 18 13 58
Ministry of foreign affairs 11 22 12 7 6 8 33
Ministry of commerce and Industries 40 188 48 62 46 72 228
Ministry of education 812 4,471 616 4,285 33 349 5,283
Ministry of civil aviation 32 180 39 64 60 49 212
Ministry of information 73 235 47 150 86 25 308
Ministry of health 630 1,285 177 743 614 382 1,916
Ministry of Finance 111 538 142 269 123 115 649
Maxkamada dagmada 80 99 12 67 15 85 179
Nerad 4 9 3 6 1 3 13
Auditing general 6 47 6 31 12 7 56
House oh representative 25 46 10 19 15 27 71
House of elders 12 23 6 17 8 7 38
LRC 2 3 1 2 1 1 5
Human rights commission 7 6 8 1 2 2 13
Tender committee 3 9 3 4 2 2 11
Higher courts 7 14 5 6 6 4 21
Attorney general 15 32 3 17 9 18 47
ICT commission 1 5 4 0 1 1 6
NDRC 5 32 7 20 7 3 37
National demining agency 4 20 4 10 7 3 24
AIDS commission 7 21 6 8 2 12 28
Civil Service commission 9 21 7 8 8 7 30
Civil service institute 14 9 7 1 2 13 23
Food Coordination Agency 2 4 2 1 1 2 6
Quality Control 6 47 6 31 12 4 53
Good governance &Against corruption 2 14 8 3 1 4 16
Diaspora Agency 3 11 3 5 2 4 14
Road authority agency 9 16 4 11 0 10 25
Higher education committee 3 7 8 0 1 1 10
Total 2,294 8,998 1,611 6,591 1,587 1,538 11,327

~ 7 ~
Table 2. Number of the staff government within the government Agency 2012
Source: HWA/PA/CB/HEA .
Chart 1. Number of the staff government within the government Agency 2012
Table 3. Number of pensioners and their grades in 2012
No NAME Of INSTITUTION
Staff Grade Staff Gender TOTAL A B C D MALE FEMALE
1 HARGEISA WATER AGENCY 16 51 230 49 294 52 346
2 PRINTING AGENCY - - - - 50 7 57
3 CENTRAL BANK 94 62 76 102 261 73 334
4 HARGEISA ELECTRICITY AGENCY 20 60 47 9 121 17 138
N0. Grades Number of Pensions
1 A 58
2 B 107
3 C 91 4 D 77 Total 333 Source: Civil service Commission

~ 8 ~
6. ECONOMY SECTOR The backbone and the source of wealth of Somaliland’s economy is livestock. About 65% of the
population depend either directly or indirectly on livestock and livestock products for their
livelihood. Crop husbandry provides subsistence for about 20% of the country’s population. Foreign
aid and remittances from the Somaliland Diaspora also play a major role in the economy of the
country.
6.1 BANKING
One of the provisions of the National Constitution of the Republic Of Somaliland is the establishment
of a bank to carry out Central Bank functions. The Bank of Somaliland was inaugurated in 1994 with
appropriate bank laws to ensure that banking regulations are fully in place. The Bank of Somaliland
also operates as a commercial bank and has eight branches throughout the country.
6.2. LIVESTOCK The contribution of livestock to the national economy is estimated at 60-65%. About 60% of
Somaliland’s people rely mainly on the products and by-products of their livelihood.
Table 4. Estimated Population of livestock: 2007--2012 (Thousand)
Year Goat Sheep Camel Cattle Total 2007 7,698 8,178 1,614 384 17,874
2008 7,883 8,317 1,630 389 18,219
2009 8,072 8,458 1,646 394 18,570
2010 8,266 8,602 1,664 399 18,931
2011 8,464 8,748 1,682 404 19,298
2012 8,667 8,897 1,701 409 19,674
Sources: Ministry of National Planning & Development (Department of Statistics & Research)*
*Note: The estimates are based on 1975 Somalia census of livestock population and the annual growth rate,
goat: 2.4% sheep: 1.7% camel: 1.1% and cattle: 1.2%.
Chart 2: Estimated Population of livestock: 2007—2012

~ 9 ~
Table 5. Number of Livestock Vaccinated (from 24th Dec 2010 to 23th Sep 2011)
Region Vaccination
PPR CCPP Sh/G Pox Total
Awdal 206,720 134,865 75,259 416,844
M/Jeeh 197,601 91,000 107,398 395,999
Saahil 182,320 118,210 12,200 312,730
Togdheer 68,603 69,205 56,647 194,455
Sool 123,336 75,945 76,520 275,801
Sanaag 0 17,736 30,592 48,328
Total 778,580 506,961 358,616 1,644,157 Source: Ministry of Livestock
Chart 3: Number of Livestock Vaccinated per Region (from 24th Dec 2010 to 23th Sep 2011)
Table 6: Overall Household Beneficiaries from the Vaccination and Treatment Activities 2011
Region Household
Awdal 6,917 HH
M/Jeex 6,961 HH
Saahil 4,251 HH
Togdheer 2,912 HH
Sool 1,728 HH
Sanaag 882 HH
Total 23,651 HH Source: Ministry of Livestock

~ 10 ~
Table 7:No. of Slaughtering houses &Livestock slaughtered (Registered Slaughtering Houses) 2012.
Town No. Slaughtering house No. Livestock slaughtered
Hargeisa 2 86,899
Burao 1 88,769
Erigavo 1 57,664
Borama 1 75,333 Source: Ministry of Livestock
6.3 AGRICULTURE Somaliland has a total area of about 137,600sqkms. Land under cultivation is currently estimated at
3% of the total geographical area. Another 7% has potential for agricultural development. The
rainfall, soil (fertility and depth), and topography are the main determinants of these estimates.
6.3.1. RAIN-FED FARMING AND IRRIGATION
Rain-fed farming is the main agricultural production system. The main crops grown are cereals.
Sorghum is the principal crop, utilizing approximately 70% of the rain-fed agricultural land. Another
25% of the land is used for maize. Other crops such as cowpeas, millet, groundnuts, beans, and
barley are also grown in scattered marginal lands.
Irrigation farms are mainly situated along the banks of streams (togs) and other water sources close
to the riverbanks. Channelling from the source to the farm is mainly done by diversion of perennial
water (springs) to the farm through rudimentary earth canals or floods. The cultivable area of these
farms is subject to floods and is, therefore, in danger of being washed away. Most of the irrigated
farms have in them areas set aside for the cultivation of vegetables and fruits for commercial
purposes.
6.3.2. MARKETING OF AGRICULTURAL PRODUCE
Farmers sell their products at the local market. Where possible, farm produce is transported to the
markets in the urban centres by way of light transport trucks or donkey carts. Small retailers who are
supplied directly by the producers or wholesalers sell the produce. There are also middlemen who
operate between wholesalers and retailers.
6.3.3. CEREAL HARVEST IN 2007--2012
Harvest in Somaliland normally occurs three times a year. The 2011GU/Karan result was only two
harvests (sorghum in GU and maize in Karan). The total cereal harvest area of Somaliland has been
estimated at ha 43,790 with a total cereal production of 66,451 of tons (91.8% sorghum and 8.2%
maize) according to the Ministry of Agriculture.

~ 11 ~
Table 8:Estimated area, production and yield of major crops during 2007--2012
Selected Indicators 2007
2008
2009
2010
2011 2012
Average
1. Maize 2011-2012
Area(ha) 6,384 2,680 1,075 10,120 9,832 10,129 9,980.5
Production(tons) 4,022 1,252 330 15,195 5,454 8,180 6,817
Yield(Tones/Ha) 0.6 0.5 0.3 1.5 0.6 0.8 0.6
2.Sorghum
Area(Ha) 31,179 24,750 21,870 36,869 33,958 37,172 35,679.5
Production(Tons) 22,722 16,275 10,526 56,745 60,997 63,483 66,329.5
Yield (Tonnes/Ha) 0.7 0.7 0.5 1.5 1.8 1.7 1.9
Total
Area(Ha) 37,563 27,430 22,945 46,989 43,790 47,301 45,660 Production(tons) 26,744 17,527 10,856 71,940 66,451 71,662 73,146.5
Yield (Tons/Ha) 0.7 0.6 0.5 1.5 1.5 1.5 1.6
Source: Ministry of Agriculture.
Chart 4A. Estimated yield of major crops during 2007---2012
Chart 4B: Estimated area, production (Maize & Sorghum) during 2007--2012

~ 12 ~
6.4. LIGHT INDUSTRIES Table 9: Light Industries Production and Manpower 2011-2012
Gamuur Fiber Glass Factory Type of Production Quantity Local Consumption Export No. Manpower
2011 2012 2011 2012 2011 2012
Water Tanks (Piece) 1,420 1,545 1,328 1,425 92 100
Boats (Piece) 10 12 100% 100% 0 0
Fish (KG) 284,359 298,923 100% 100% 0 0 Source: Gamuur Trading Company
Golis Bottled Health water
Type of Production Quantity Local Consumption Export No. Manpower
2011 2012 2011 2012 2011 2012 11
750 ml bottles (Cartoons) 24,000 34,000 100% 100% - -
1.5L bottles (Cartoons) 10,000 5,000 100% 100% Source: Golis Health Water Factory
Ilo Tango Type of Production Quantity Local Consumption Export No. Manpower
2011 2012 2011 2012 2011 2012 21
Powder drink (Cartoon) 6,420 7,310 85% 95% 15% 5%
1.5L bottles (Cartoon) 10,000 5,000 100% 100% Source: ILO TANGO FACTORY
Hargeisa Plastic Factory
Type of Production Quantity Local Consumption Export No. Manpower
2011 2012 2011 2012 2011 2012 40
Shopping bags (KG) 40,000 45,000 30,000 33,000kg - -
Pre Pipes (KG) - 15,000 - 8,000 - - Source: Hargeisa Plastic Factory
Somaliland Beverage Industry SBI Type of Production Quantity Local Consumption Export No. Manpower
2011 2012 2011 2012 2011 2012 77
Soft Drinks (Cartoon) 0 80,000 0 80,000 - - Source: SBI
FOSTER ZAMZAM FACTORY Type of Production Quantity Local Consumption Export No. Manpower
2011 2012 2011 2012 2011 2012 46
Instant Drinks (Cartoon) 7,615 9,430 100% 100% 0 0
Candy (Cartoon) 2,127 3,001 100% 100% 0 0
Chips (Cartoon) 2,265 3,582 100% 100% 0 0 Source: Foster ZamZamFactory
Saxansaxo Mineral Water
Type of Production Quantity Local Consumption Export No. Manpower
2011 2012 2011 2012 2011 2012 40 Mineral Water (Bottles) 360,000 430,000 83% 81% 17% 19%
Source: Saxansaxo Mineral Water

~ 13 ~
6.5 FISHERIES The warm water of the Gulf of Aden borders the country of Somaliland along a coastline spanning
850kms on its southern fringes. This coastline extends from Lowya-Addo in the west to Elayo in the
east and is characterized by sandy beaches broken at intervals by rocky cliffs that often penetrate
into the shallow waters.
The continental shelf is relatively narrow, rarely exceeding 15kms, except in the west near the Djibouti border, where it averages 100kms. Artisan fishermen harvest various tropical fish. They include tuna, snappers, groupers, grunts, trevally, emperors, barracudas, goatfish, parrotfish Spanish mackerels, sea breams, horse mackerels, and mulleys. Other marine organisms caught occasionally by local fishermen include sea cucumbers, shrimp, lobsters, and edible crabs. Production of fish in Somaliland is still very low (it’s less than 10% of the pre-war level and constitutes less than 2% of the Gross National Product [GNP]). According to various reports published by international organisations, fisheries in Somaliland remain
untapped. FAO estimates this abundance of fish in the national waters at 200,000 tons and
maintains that a maximum sustainable yield of 40,000 tons could be harvested without endangering
the stocks. At the present time, estimated fish production is quite low compared to the potential.
The shark fishing industry is the mainstay of the artisan fishing community in Somaliland, and more
than 90% of the fishing fleet hunts for sharks for their valuable fins. In addition to these, a sizeable
yield of sea cucumbers reaching several tons per year is harvested in the waters of Zeila and nearby
islands. Furthermore, edible crabs and shrimp are caught in the Zeila and Togoshi areas. Local
fishermen market around 30-50Kgs of live, edible crabs daily to Djibouti on foot.
6.5.1. ARTISANAL FISHING Artisanal fishermen conduct most fishing activity in Somaliland. There are around 15 fishing communities composed of active fishermen and their dependents. Berbera serves as a focal point for the fishing industry in Somaliland. Fish caught at Berbera range from 1000 to 2000kgs and are transported immediately to Hargeisa or to Burao for local consumption. The current fishing fleet consists of 425 motor boats and 109 canoes; four hundred twenty eight of these vessels are operational.
6.5.2. INDUSTRIAL FISHING
Presently, no industrial fishing is undertaken by foreign vessels. Somaliland does not have deep sea Fishing vessels.
6.5.3. FISH CANNERY
The country has one fish cannery at Las-Qorey in Sanaag region; it was built in 2002 by a group of local businessmen who installed a new canning machine. Production started in 2002 at a capacity of 1-2.5 tonnes per a day. But unfortunately, it was closed down March 2010.
Maaxda
Type of Production Quantity Local Consumption Export No. Manpower
2011 2012 2011 2012 2011 2012
40
Mineral Water(750 ml Bottles)
96,173,600 100,273,600 100% 100% 0 0
Mineral Water (1000 ml Bottles)
12,182,400 10,823,700 100% 100% 0 0 Mineral Water (1500 ml
Bottles) 16,005,600 9,167,400 100% 100% 0 0
Source: Togdheer Mineral Water & Beverages (Maaxda)

~ 14 ~
6.5.4. MARKETING
Catches of fresh fish such as groupers, snappers, emperors, tuna, mackerels, and trevally are sold locally in internal markets such as Berbera, Hargeisa, Burao, Borama, and Erigavo at a price of US $3.10 per Kilogramme. Local fishermen do not have access to an open external market for Exportation of their goods. Trucks transporting fish from the coast to the towns are in short Supply and the roads are narrow and inaccessible in most of the eastern and north-western parts of the coast. The most important item exported by fishermen is dried, salted shark fins. This marine product is exported to South-East Asian countries and usually serves as a good source of income for Fishermen (around US $ 1-1.5 million a year). Table 10: Monthly Price Fish in Hargeisa 2007--2012 Price/kg (SL.Sh)
Month 2007 2008 2009 2010 2011 2012 January 12,531.25 12,528 21,188 14,125 17,563 18,000
February 12,562.50 13,828 21,594 14,000 17,719 18,313
March 12,234.34 12,438 21,188 17,218 17,688 19,000
April 11,875.00 12,875 14,906 16,500 17,313 19,729
May 12,000.00 13,234 14,000 14,750 18,469 19,800
June 12,000.00 14,234 13,688 14,500 18,094 19,800
July 12,562.50 18,094 23,063 16,500 15,975 20,000 August 13,000.00 17,469 13,500 15,000 18,000 20,500
September 12,162.50 15,547 13,625 16,500 18,000 20,500
October 12,656.25 16,016 14,250 16,000 18,000 21,000
November 11,912.50 17,503 14,000 17,375 18,313 21,000
December 12,437.50 17,503 13,969 17,750 18,000 21,000 Source: Ministry of Planning & Development (Department of Statistics).
Chart5: Monthly Price of Fish in Hargeisa 2007- 2012 (SL.Sh)
Table 11: The Industrial (Off-Shore) Production on Seasonal Basis
SEASON PRODUCTION IN MT
8/10/03--18/6/04 1,233
15/9/04--11/5/05 2,133
28/9/05--12/4/05 1,378
16/9/06--10/4/07 1,283
2008 N\A
2009 242,980
2010 254,416
2011 1,100 Source: Ministry of Fishing and Marine Resource

~ 15 ~
6.6. Central Government Budget Table 12: Central government Estimated Budget 2012
Security Sector Estimated
Budget Productive Sector Estimated Budget
11D. Immigration Office 3,214,534,526 19. Ministry of Agriculture 2,067,964,813
11B. Coastal Guards 6,286,511,633 16. Ministry of Commerce 2,644,657,302
8A. Presidential Guards 6,900,394,495 20. Ministry of Livestock, Rural
Development & Environment 4,605,232,901
11. Ministry of Interior 14,684,818,890 Grand Sum 9,317,855,016
13. Ministry of Defence 1,498,938,966 Infrastructure & Natural Resource Sector
Estimated Budget
10A. Custodial Corps 29,729,133,176 17. Ministry of Water & Mineral Resources
2,506,523,016
11A. National Police Army 59,808,328,123 25. Ministry of Public Works 6,430,889,904
13A. National Army 133,517,821,750 18. Ministry of fishing & Marine Resource
Grand Sum 255,640,481,559 26. Ministry of Civil Aviation 8,638,011,361
Good Governance and Rule of Law
Estimated Budget
21. Ministry of Post & Telecommunication
4,304,777,080
36. WFP 288,225,600 Grand Sum 21,880,201,316
10D. Law Reform Commission 360,848,800 Economic Sector Estimated Budget
35. ICT Commission 329,136,000 33. National Tender Board 557,047,391
Chief of State Counseling Office 375,686,800 14. Ministry of Planning & Dev 1,694,840,320
37.Somaliland Diaspora Agency 294,766,600 15. Ministry of Finance
85,783,951,475
1A. Vice-President's Office 585,000,000 16.Ministry Commerce 4,008,757,591
29. Ministry of Parliamentary Affairs
580,163,824 Grand Sum 92,044,596,777
1. President's Office 819,000,000 Social Sector Estimated Budget
10. Ministry of Justice & Judiciary
1,631,720,320 10C. National Humanitarian Committee
1,217,248,800
4. Supreme Court 1,662,712,120 11C. Fact finding Massacre
Commission 332,240,000
39. Good Governance & Anti-
Corruption Commission 1,350,086,400 28. National Demining Agency 476,094930
5. Attorney General 1,822,920,400 27. NDC Agency 25,199,998
7. Magistrate of Account 1,831,210,024 01B. Comm.Aides. 520,566,204
38. Quality Control Commission 1,014,668,00 30. Ministry of Labour & Social Affairs
2,095,912,418
32. National Election Commission
15,050,303,208 31. Ministry of Youth & sports 2,605,665,120
10B. Local Court 7,431,930,880 24. Ministry of Endowment & Religious Affairs
1,725,410,400
9. Ministry of Foreign Affairs &
International Corporation 10,308,034,508 6. Civil Service Commission 8,241,133,782
3. House of Representatives 13,336,485,600 23. Ministry of Health & Labour 26,462,450,638
2. House of Elders 14,413,692,800 22.Ministry of Education 44,523,310,424
8. Ministry of Presidency 37,666,480,824 22A. Director General of Labour 1,616,813,600
Grand Sum 110,138,404,708
22B.Higher Education 798,810,400
Media Sector Estimated
Budget 25.Ministry of Culture & Tourism Nil
12. Ministry of Information 9,118,002,660 29. Ministry of Rehabilitation 1,057,424,598
12A. Somaliland National T.V 17,085,350,274 Grand Sum 119,775,142,042
Environment Sector Budget Estimate
41. Ministry of Ruler & Environment 2,902,062212
34. NERAD 503,918,072
Grand Sum 3,405,980,284

~ 16 ~
Table 13: Central government Estimated Budget (Sectors) 2012
Sectors Budget 2012 %
Security Sector 255,640,481,559 40%
Productive Sector 9,317,855,016 1%
Media Sector 26,203,352,934 4%
Infrastructure & Natural Resource Sector 21,880,201,361 3%
Good Governance and Rule of Law 114,003,692,708 18%
Economic Sector 92,044,596,777 14%
Environment Sector 3,405,980,284 1%
Social Sector 116,873,079,830 18%
Total 639,369,240,469 100% Source: Ministry of Finance.
Chart 7: Central government Estimated Budget (Sectors): 2012
Table 14: Central gover’t Actual revenue and expenditure at current price: 2008 – 2012 (Sl.sh.)
Year Revenue Expenditure Surplus/(Deficit)
2008 233,103,883,883 247,711,179,723 -14,607,295,840 2009 261,993,714,246 258,496,237,034 3,497,477,212
2010 330,909,580,627 262,079,735,632 68,829,844,995
2011 481,323,687,473 494,493,147,825 -13,169,460,352
2012 649,740,967,407 618,779,267,104 30,464,404,054 Source: Ministry of Finance.

~ 17 ~
Chart8: Central government revenue and expenditure at current price: 2008-2012 (Sl.sh.)
Table 15: Trends in expenditure: 2009-2012 (Sl.sh.)
Head/Expenditure 2009 2010 2011 2012
A. Open Balance -14,607,295,840 3,497,477,212 Nil Nil B. Budget Expenditure 258,496,237,034 262,079,735,632 494,493,147,825 618,779,267,104 C. Out of Budget expenditure
56,322,385,565 62,638,247,391 12,170,464,330 85,929,683,611 D. Total Expenditure ( B+C) 314,818,622,599 324,717,983,023 494,493,147,825 704,708,950,715 Total ( A+D) 300,211,326,759 328,215,450,235 494,493,147,825 704,708,950,715 Source: Ministry of Finance.
Table 16: Trends in Revenue during 2009-2012 (Sl.sh.)
Indicators 2009 2010 2011 2012
Import Duties 222,256,562,237 278,823,490,000 407,014,668,334 238,411,970,931
Direct taxes on income/Profits
27,557,615,917 38,977,821,842 13,840,197,999 33,979,991,447
Indirect Taxes 12,179,536,092 13,108,267,785 60,468,821,140 377,349,005,029
Total 261,993,714,246 330,909,579,627 481,323,687,473 649,740,967,407 Sources: Ministry of Finance.
6.7. Local Government Revenue and Expenditure (Grade A Districts)
Table 17: Local government revenue and expenditure Hargeisa: 2007 – 2012 (Sl.sh.)
Revenue Expenditure Surplus/ Deficit
2007 13,613,400,103 13,973,211,237 -359,811,134
2008 13,318,366,415 13,172,419,023 145,947,392
2009 14,465,406,988 14,250,149,174 215,257,814
2010 18,425,168,000 19,844,945,000 -1,419,777,000
2011 18,412,568,908 20,594,945,000 -2,182,286,092 2012 24,227,948,926 24,957,982,539 -730,033,613
Source: Local Government of Hargeisa

~ 18 ~
Chart 9: Local government revenue and expenditure Hargeisa: 2007– 2012 (Sl.sh.)
Table 18: Local Gover’t Revenue and Expenditure Gabiley: 2007-2012 (Sl.sh.)
Year Revenue Expenditure Surplus
2007 3,769,572,000 3,550,972,000 218,600,000
2008 3,760,000 3,760,000 -0- 2009 3,639,482,596 3,354,821,671 284,660,925
2010 5,404,184,752 3,715,000,000 1,689,184,752
2011 7,115,492,000 5,333,992,000 1,781,500,000
2012 10,171,493,898 18,917,535,417 -8,746,041,519 Source: Local government of Gabiley
Chart 10: Local Government Revenue and Expenditure Gabiley: 2007—2012 (Sl.Sh)
Table 19: Local government revenue and expenditure Boroma: 2007– 2012 (Sl.Sh)
Year Revenue Expenditure Surplus/ Deficit
2007 2,188,459,257 2,188,711,916 -242,659
2008 1,988,179,102 1,994,349,187 -6,170,085
2009 2,069,689,622 2,028,301,632 47,454,017
2010 2,557,503,744 2,377,503,744 180,000,000
2011 3,297,000,000 3,287,360,000 9,640,000
2012 2,728,963,269 2,480,891,732 248,071,537 Source: Local Government of Borama

~ 19 ~
Chart 11: Local Government Revenue and Expenditure Borama 2007-2012 (Sl.Sh)
Table 20: Local government revenue and expenditure Burao: 2007– 2012 (Sl.Sh)
Year Revenue Expenditure Surplus/Deficit
2007 4,173,799,376 4,137,638,891 36,160,485
2008 4,005,144,590 3,969,140,233 36,004,357
2009 5,187,312,906 4,786,641,216 400,671,690
2010 5,248,878,338 6,230,200,000 -981,321,662
2011 7,464,200,000 6,806,200,000 658,000,000
2012 8,425,721,807 8,026,123,392 399,598,415 Source: Local Government Burao
Chart 12: Local government revenue and Expenditure Burao: 2007 – 2012 (Sl.Sh)
Table 21: Local government revenue and expenditure Berbera: 2007 – 2012 (Sl.Sh)
Year Revenue Expenditure Surplus/Deficit
2007 2,299,205,867 1,662,767,082 636,438,785
2008 13,895,279,092 14,464,736,611 -569,457,519
2009 15,098,873,146 15,047,103,553 518,687,407
2010 18,405,400,000 17,049,458,022 1,355,941,978
2011 20,049,458,022 17,049,458,022 3,000,000,000 2012 2,728,963,269 2,480,891,732 248,071,537
Source: Local Government Berbera & Ministry of Interior

~ 20 ~
Chart 13: Local government revenue and expenditure Berbera: 2010 – 2012 (Sl.Sh)
Table 22: Local government revenue and expenditure Lasanod: 2010 – 2011 (Sl.Sh)
Year Revenue Expenditure Surplus/Deficit
2010 1,776,800,000 1,756,800,000 200,000,000
2011 2,169,000,000 2,188,000,000 19,000,000 Sources: Ministry of Interior
Chart 14: Local government revenue and expenditure Lasanod: 2010 – 2011 (Sl.Sh)
Table 23: Local government revenue and expenditure Erigavo: 2010 – 2012 (Sl.Sh)
Year Revenue Expenditure Surplus/Deficit
2010 1,657,000,000 1,575,000,000 82,000,000
2011 1,785,000,000 1,685,000,000 100,000,000
2012 2,574,509,348 1112938691 1,461,570,657 Sources: Ministry of Interior

~ 21 ~
Chart 15: Local government revenue and expenditure Erigavo: 2010 – 2012 (Sl.Sh)
Table 24: Total Local government revenue and expenditure 2005-2012 (Sl.Sh)
Year Revenue Expenditure Surplus/deficit
2005 17,541,189,564 20,189,424,141 -2,648,234,577
2006 19,264,259,721 22,890,294,275 -3,626,034,554
2007 18,101,065,227 23,850,534,044 -5,749,468,817
2008 33,210,729,199 33,604,405,054 -393,675,855
2009 40,460,765,258 39,467,017,246 993,748,012
2010 53,474,934,834 52,548,906,766 926,028,068
2011 60,292,718,930 56,944,955,022 3,347,763,908
2012 50,857,600,517 57,976,363,503 -7,118,762,986
Source: Ministry of Interior
Chart 16: Total Local Government Expenditure and Revenue (Sl.Sh)
6.8. Import Table 25: Import of Food Items through Berbera Port: 2008 (Tonnes)

~ 22 ~
Month Sugar Rice W/Flour Wheat O/Beans C/Oil Pasta Dates Biscuit Jan 14,112 109 1,236 0 1,416 3,674 1,205 341 623
Feb 8,888 601 5,941 0 2,346 1,569 395 183 313
Mar 20,830 24,434 1,556 150 354 4,450 2882 260 1,565
Apr 13,067 285 0 0 0 3,338 1,294 341 543
May 25,216 5,003 1,099 0 0 3,269 639 435 451
Jun 5,943 251 759 0 60 1,523 1,340 212 385
Jul 13,425 2,509 7,462 959 0 1052 871 40 263
Aug 13,249 4,631 10,112 16 1,896 1,128 104 240 242
Sep 9,507 7,286 3,578 0 960 3,492 1,248 999 210
Oct 43,762 3,155 5,130 884 0 3,032 2,658 75 230
Nov 1,561 4,008 6,699 0 0 2,237 4,288 154 125
Dec 24,963 9,016 8,024 9,500 998 2,742 1,979 194 625
Total 194,523 61,288 51,596 11,509 7,032 31,506 18,903 3,474 5,575 Sources: Berbera Port Authority
Table 26: Import of Non Food Items through Berbera Port: 2008 (Tonnes)
Month Petrol Diesel E/Oil Clothes C/Truck S/part Cigart Soap B/Material Other
Jan 0 0 36 1,177 391 345 708 1,222 12,535 6392
Feb 0 0 71 1,494 675 259 478 950 2,826 6490
Mar 2,199 4,000 63 1,183 530 533 842 1,177 11,653 6905
Apr 0 8 88 950 624 367 365 1,768 8,951 8054
May 0 33 148 1,215 463 303 925 1,083 4,405 5444
Jun 0 78 431 1,010 618 273 396 623 11,279 6212
Jul 0 294 33 2,015 76 236 542 631 4,711 6448
Aug 0 86 218 578 603 250 192 675 12,175 3839
Sep 1,969 3,894 72 1,653 283 232 646 919 1,367 8128
Oct 0 85 118 1,004 771 227 770 1,187 32,501 9163 Nov 0 2,811 2 2,806 1,011 239 646 701 17,145 10879
Dec 0 963 23 1,891 441 214 853 1,785 21,652 10791
Total 4,168 12,252 1,303 16,976 6,486 3,478 7,363 12,721 140,200 88,745 Sources: Berbera Authority
Table 27: Import of Food Items through Berbera Port: 2009 (Tonnes)
Month Sugar Rice W/Flour Wheat O/Beans C/Oil Pasta Dates Biscuit Jan 3075 8188 1195 0 0 2266 1300 241 700
Feb 12769 1878 4622 14025 1404 3184 2104 228 362
Mar 17493 3182 7285 0 941 1336 1176 166 384
Apr 21994 2646 1595 0 0 2670 1151 279 506
May 16027 12992 6567 24165 0 1272 962 95 262
Jun 3557 4552 4439 1800 913 2002 1611 43 218
Jul 7999 4764 4383 29369 3574 439 1197 662 245 Aug 13945 760 5899 0 699 446 1025 634 192
Sep 6012 4120 5131 997 0 526 3660 242 105
Oct 13359 3305 4498 0 0 364 660 89 284
Nov 39735 7158 3957 0 4800 1248 1731 271 602
Dec 0 6100 904 45356 607 1457 2199 119 372
Total 155,965 59,645 53,475 115,712 12,938 17,210 18,776 3,015 4,232 Sources: Berbera Authority
Table 28: Import of Non Food Items through Berbera Port: 2009 (Tonnes)
Month Petrol Diesel E/Oil Clothes C/Truck S/part Cigart Soap B/Material Other

~ 23 ~
Jan 0 953 35 1,810 1,173 209 1,225 694 7,835 7,657
Feb 0 7,176 36 1,265 773 274 436 923 2,052 6,889
Mar 0 905 35 798 478 136 283 1,068 12,114 5,839
Apr 2,661 2,369 380 1,550 886 372 290 674 16,988 9,440
May 0 8,193 215 1,167 768 651 366 736 4,075 10,367
Jun 658 2,511 117 1,103 617 343 496 864 16,394 12,972
Jul 0 2,812 206 1,271 978 268 593 532 11,536 12,128
Aug 990 ,138 75 703 217 230 368 1,002 12,132 6,396
Sep 1,064 4,495 270 1,831 1,731 421 235 1,214 16,270 11,110
Oct 0 6,644 158 1,464 933 71 80 726 19,870 6,145
Nov 1,465 9,140 138 1,983 627 838 1,833 1,337 2,623 15,333
Dec 798 1,806 299 1,345 1,127 279 242 1,116 11,507 13,930
Total 7,636 49,142 1,964 16,290 10,308 4,192 6,447 10,886 133,396 118,206 Sources: Berbera Authority
Table 29: Import of Food Items through Berbera Port: 2010 (Tonnes)
Month Sugar Rice W/Flour Wheat O/Beans C/Oil Pasta Dates Biscuit Jan 6,934 11,652 5,747 0 6 2,740 3,387 215 691
Feb 0 5,780 10,680 0 4,850 1,058 2,249 147 579
Mar 25,326 11,668 8,489 8,686 370 1,591 2,920 248 262
Apr 19,449 10,613 3,437 0 811 3,108 1,855 330 910 May 16,502 2,684 1,621 47,326 3,804 1,498 1,495 259 607
Jun 7,174 4,937 8,540 0 0 1,565 1,369 176 84
Jul 0 0 1,972 40 0 629 799 145 245
Aug 1,141 1,327 8,908 0 22,122 1,806 2,146 1,458 493
Sep 1,942 6,106 3,058 0 0 859 1,513 74 203
Oct 31,340 2,801 4,844 0 925 1,551 6,807 112 557
Nov 12,406 853 7,482 0 21 381 1,954 304 311
Dec 11,286 1,849 6,872 0 20 1,163 2,095 281 1,122
Total 133,500 60,270 71,650 56,052 53,409 17,949 28,589 3,749 6,064 Sources: Berbera Authority
Table 30: Import of Non-Food Items through Berbera port: 2010 (Tonnes)
Month Petrol Diesel E/Oil Clothes C/Truck S/part Cigart Soap B/Material Other Jan 0 5,779 193 2,504 1,669 270 1,060 1,546 13,039 11,949
Feb 700 5,315 68 1,112 387 222 397 927 7,751 4,750
Mar 0 1,533 48 1,893 1,845 222 483 264 24,965 10,618
Apr 788 4,232 114 2,180 1,397 240 657 331 17,249 14,360
May 787 8,179 318 1,756 542 173 677 752 4,874 12,456
Jun 800 4,242 5 1,370 750 243 458 679 23,380 11,450
Jul 0 1,200 102 1,488 866 228 454 309 14,073 6,400
Aug 772 3,982 172 1,673 1,168 248 472 468 5,664 12,914
Sep 1,202 6,605 46 974 1,190 382 564 1,280 33,250 7,980
Oct 394 3,900 164 2,028 651 454 873 1,102 8,203 11,053
Nov 868 4,715 77 1,567 1,706 410 361 1,318 39,624 12,676
Dec 143 2,719 44 1,969 1,008 386 416 1,016 11,088 12,382
Total 6,454 52,401 1,351 20,514 13,179 3,478 6,872 9,992 203,162 128,988 Sources: Berbera Authority
Table 31: Import of Food Items through Berbera port: 2011 (Tonnes)
Month Sugar Rice W/Flour Wheat O/Beans C/Oil Pasta Dates Biscuit

~ 24 ~
Jan 17,979 7,030 4,884 0 96 2,014 2,154 381 784
Feb 1,100 6,294 3,721 0 5 337 974 82 732
Mar 11,256 14,067 6,704 0 1 1,000 2,499 346 836
Apr 594 3,551 2,764 0 80 1,106 1,786 263 697
May 5,162 9,463 11,874 0 0 1,481 6,312 616 609
Jun 30 5,067 4,949 0 1,121 978 4,311 645 327
Jul 1,928 5,371 11,914 0 1,617 3,211 3,293 1,888 683
Aug 11,223 8,581 7,798 0 0 2,828 1,872 111 308
Sep 11,065 3,627 6,291 0 1,042 2,853 4,423 100 160
Oct 16,669 3,209 1,860 0 4 454 1,854 70 1,057
Nov 10,099 6,898 3,994 20,500 0 452 2,454 1,825 171 Dec 7,861 13,669 4,758 0 540 902 3,066 243 503
Total 94,956 86,827 71,511 20,500 4,506 17,656 34,998 6,570 6,887 Sources: Berbera Authority
Chart 17: Import of Food Items through Berbera port: 2011 (Tonnes)
Table 32: Import of Non Food Items through Berbera port: 2011 (Tonnes)

~ 25 ~
Month Petrol Diesel E/Oil Clothes C/Truck S/part Cigart Soap B/Material Other
Jan 0 7,556 54 1,270 805 365 995 1,258 3,889 11,823
Feb 750 3,721 49 1,460 2,100 208 386 513 3,757 8,1939
Mar 0 4,000 226 879 720 94 720 240 2,058 9,383
Apr 396 4,500 87 627 630 149 575 759 3,131 7,601
May 927 3,578 3 650 1,143 161 566 1,446 5,901 13,781
Jun 412 7,897 62 851 524 253 508 585 2,268 10,996
Jul 916 48 23 705 566 152 494 956 3,408 12,627
Aug 0 3,898 128 1,212 908 185 631 268 4,775 11,683
Sep 1,391 8,091 40 921 726 125 609 413 3,465 12,969
Oct 0 7,214 50 429 447 160 557 1,491 4,386 15,012
Nov 1,204 2,066 62 185 1,007 239 335 743 4,216 16,193
Dec 1,172 3,823 183 994 1,198 203 648 909 4,059 16,941
Total 7,168 56,392 967 10,183 10,774 2,294 7,124 9,581 45,313 147,199 Sources: Berbera Authority
Chart 18: Import of Non-Food Items through Berbera port: 2011 (Tonnes)
Table 33: Import of Food Items through Berbera port: 2012 (Tonnes)

~ 26 ~
Month Sugar Rice W/Flour Wheat O/Beans C/Oil Pasta Dates Biscuit
Jan 12,555 27,699 7,648 11,669 851 1,763 1,583 575 1702
Feb 7,535 13,107 4,105 31,400 - 1,072 2736 329 831
Mar 2,622 15,128 8,880 72 68 926 2,988 473 1323
Apr 19,442 6,099 12,175 9,012 1,434 1,538 2,853 367 1263
May 6,420 2,885 7,758 12,527 - 4,989 2,136 399 360
Jun 13,167 1,384 1,075 87 204 777 2,603 222 578
Jul 3,932 1,406 5,560 - 1 896 2,450 694 698
Aug 26,014 2,508 6,424 - 1,176 1,288 4,330 443 581
Sep 11,779 3,147 2,238 - 1,434 1,299 3,625 301 398
Oct 3,423 4,442 3,276 - 6 420 2,255 80 1,151
Nov 10,551 4,635 9,866 - - 4,326 3,685 597 379
Dec 1,000 1,406 6,920 - 500 594 3,157 375 921
Total 118,440 83,846 75,925 64,767 5,674 19,888 34,401 4,855 10,185 Sources: Berbera Authority
Chart 19: Import of Food Items through Berbera port: 2012 (Tonnes)
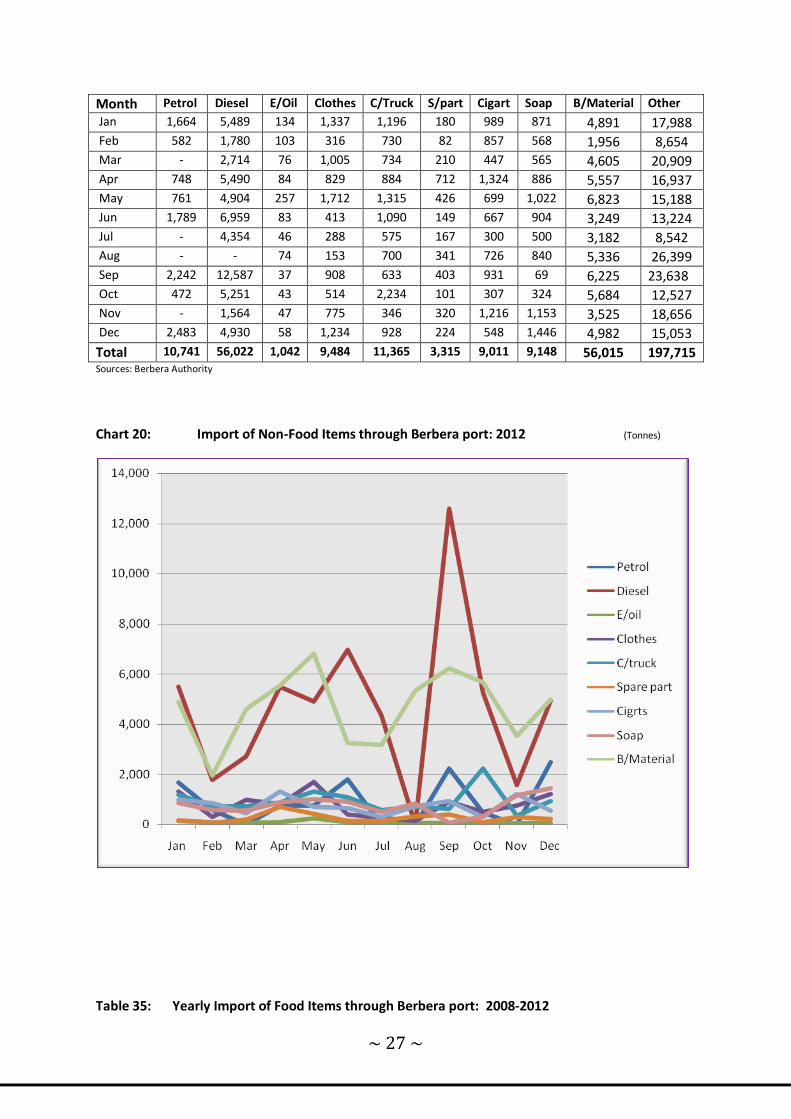
Table 34: Import of Non Food Items through Berbera port: 2012 (Tonnes)
~ 27 ~
Month Petrol Diesel E/Oil Clothes C/Truck S/part Cigart Soap B/Material Other
Jan 1,664 5,489 134 1,337 1,196 180 989 871 4,891 17,988 Feb 582 1,780 103 316 730 82 857 568 1,956 8,654 Mar - 2,714 76 1,005 734 210 447 565 4,605 20,909 Apr 748 5,490 84 829 884 712 1,324 886 5,557 16,937 May 761 4,904 257 1,712 1,315 426 699 1,022 6,823 15,188 Jun 1,789 6,959 83 413 1,090 149 667 904 3,249 13,224 Jul - 4,354 46 288 575 167 300 500 3,182 8,542 Aug - - 74 153 700 341 726 840 5,336 26,399 Sep 2,242 12,587 37 908 633 403 931 69 6,225 23,638
23,638
Oct 472 5,251 43 514 2,234 101 307 324 5,684 12,527 Nov - 1,564 47 775 346 320 1,216 1,153 3,525 18,656 Dec 2,483 4,930 58 1,234 928 224 548 1,446 4,982 15,053
Total 10,741 56,022 1,042 9,484 11,365 3,315 9,011 9,148 56,015 197,715 Sources: Berbera Authority
Chart 20: Import of Non-Food Items through Berbera port: 2012 (Tonnes)
Table 35: Yearly Import of Food Items through Berbera port: 2008-2012

~ 28 ~
Year Sugar Rice W/Flour Wheat O/Beans C/Oil Pasta Dates Biscuit
2008 194,523 61,288 51,596 11,509 7,032 31,506 18,903 3,474 5,575
2009 155,965 59,645 53,475 115,712 12,938 17,210 18,776 3,015 4,232
2010 133,500 60,270 71,650 56,052 53,409 17,949 28,589 3,749 6,064
2011 94,956 86,827 71,511 20,500 4,506 17,656 34,998 6,570 6,887
2012 118,440 83,846 75,925 64,767 5,674 19,888 34,401 4,855 10,185 Sources: Berbera Authority
Chart 21: Yearly Import of Food Items through Berbera port: 2008-2012
Table 36: Yearly Import of Non Food Items through Berbera port: 2008- 2012
Year Petrol Diesel E/Oil Clothes C/Truck S/part Cigart Soap B/Material Other
2008 4,168 12,252 1,303 16,976 6,486 3,478 7,363 12,721 140,200 88745
2009 7,636 49,142 1,964 16,290 10,308 4,192 6,447 10,886 133,396 118,206
2010 6,454 52,401 1,351 20,514 13,179 3,478 6,872 9,992 203,162 128,988
2011 7,168 56,392 967 10,183 10,774 2,294 7,124 9,581 45,313 147,199
2012 10,741 56,022 1,042 9,484 11,365 3,315 9,011 9,148 56,015 197,715 Sources: Berbera Authority
Chart 22: Yearly Import of Non Food Items through Berbera port: 2008- 2012
Table 37: Total Import of Fuel: 2007-----2012 (M3)

~ 29 ~
Year Mogas Jet A 1 M3 Kerosene M3
2005 47,017 12 6,968
2006 41,639 10781.2 5,921.3
2007 19,196 N/A N/A
2008 16,420 3,712 2,878.01
2009 56,778 4,183.05 2,366.7
2010 58,855 14,700.89 1,019.70
2011 91,698 6,579.91 875
2012 22,989.7 6,945.412 843.750 Sources: Ministry of Finance (Mogas= Petrol & Diesel Combined)
Chart 23: Total Import of Fuel: 2007-----2012 (M3)
Table 38: Some of the Indicators Imported on Yearly Comparison (Tonnes & M3)
Year Sugar Rice W/ Flour Bdg/Mats Fuel 2007 174,076 89,762 46,817 138,152 20,443
2008 194,523 61,288 51,596 140,200 16,420
2009 155,965 59,645 53,475 133,396 56,778
2010 133,500 60,270 71,650 203,160 58,855
2011 87,105 73,158 66,753 45,313 91,698
2012 118,440 83,846 75,925 56,015 30,777 Source: Berbera Port Authority
Table 39: Import Containers through Berbera Port 2007—2012 (Size & Weight)
Year Size 20 Size 40 TEU Weight (Kg)
2007 4,437 1,378 7,193 125,079,414
2008 6,807 1,991 10,789 190,928,909
2009 5,209 2,050 9,309 159,056,061
2010 6,176 2,663 11,502 192,590,848
2011 8,150 3,160 14,470 251,208,818
2012 10,260 3,846 17,980 329,821,714 Source: Berbera Port Authority
Chart 24: Import Containers through Berbera Port 2007—2012 (Size & Weight)

~ 30 ~
6.9. EXPORT
6.9.1. Livestock Export
The livestock sector makes a significant contribution to the national economy, and a majority of
Somalilanders rely on this sector and related activities. Camels, cattle, and sheep/goats are the
primary species in the pastoral and agro-pastoral livelihood areas. Most of the country’s hard
currency is generated through the export of livestock. A total of 3,362,314 livestock head were
exported from January to December 2011 of these, 92 % were sheep/ goats.
Table 40: Export of goats and sheep through Berbera Port 2007--2012 (HDS)
Month 2007 2008 2009 2010 2011 2012
Jan 42,618 15,321 114,134 189,662 70,967 111,646
Feb 73,699 55,508 50,153 51,994 86,684 241,356
Mar 38,927 33,823 58,910 37,923 127,304 107,948
Apr 15130 26,549 30,461 66,696 106,845 95,092
May 73,832 46,076 29,613 7,712 57,831 71,676 Jun 35315 44,512 45,879 92,936 167,777 183,357
Jul 76,879 69,409 112,942 174,909 317,763 203,054
Aug 110,689 122,051 139,723 160,313 193,731 163,101
Sep 106,531 100,164 135,702 255,456 177,081 271,680
Oct 113,348 102,477 65,424 515,137 1,219,775 1,564,484
Nov 315,867 339,885 780,171 938,228 371,994 42,625
Dec 347,219 268,758 2,410 51,988 206,932 163,565
Total 1,350,054 1,224,533 1,565,522 2,542,954 3,104,684 3,219,584 Source: Berbera Port Authority
Chart 25: Yearly Export of goats and sheep through Berbera Port 2007----2012 (HDS)

~ 31 ~
Table 41: Export of Cattle through Berbera Port: 2007---20012 (HDS)
Month 2007 2008 2009 2010 2011 2012
Jan 5,295 4,930 3,448 11,990 13,532 18,917
Feb 6,323 7,691 12,322 8,623 11,337 19,592
Mar 3,244 5,671 5,049 4,320 7,449 14,696
Apr 1,151 4,115 3,806 7,487 6,568 10,413
May 4,728 3,864 3,510 49,568 8,653 9,766
Jun 9,593 4,097 5,162 8,576 4,643 11,539
Jul 10,103 8,480 7,658 9,535 14,164 13,970
Aug 8,605 4,907 7,857 10,264 13,920 13,904
Sep 9,119 3,582 6,481 13,387 13,532 16,158
Oct 7,841 9,989 11,666 24,842 27,972 27,486
Nov 10,788 17,027 20,471 17,067 13,008 17,249
Dec 11,353 6,828 2,256 9,218 16,156 16,664
Total 76,790 74,353 87,430 165,659 134,778 173,690
Source: Berbera Port Authority
Chart 26: Yearly Export of Cattle through Berbera Port 2007----2012 (HDS)
Table 42: Export of Camel through Berbera Port 2007--2012 (HDS)

~ 32 ~
Month 2007 2008 2009 2010 2011 2012
Jan 1,327 1,299 20 10,187 10,503 10,740
Feb 1,3499 3,248 880 10,049 11,626 10,934
Mar 1,787 2,590 15 4,323 9,374 8,506
Apr 1,232 2,140 1,085 9,194 6,245 10,598
May 430 1,241 667 3,340 5,829 6,160
Jun 1,620 1,475 1,925 1,912 8,779 14,872
Jul 1,391 4,114 3,963 6,157 14,042 15,776
Aug 997 3,072 3,406 8,657 8,801 5,226
Sep 1,439 2,611 2,414 6,281 12,381 6,174
Oct 927 2,311 3,266 12,600 6,889 2,166 Nov 911 2,245 1,244 11,397 2,901 4,512
Dec 835 17 1,317 8,554 9,911 7,000
Total 26395 26,363 20,202 92,651 107,281 102,664 Source: Berbera Port Authority
Chart 27: Yearly Export of Camel through Berbera Port 2007--2012 (HDS)
Table 43: Total Export of livestock through Berbera Port: 2007---2012 (HDS)
Month 2007 2008 2009 2010 2011 2012 Total
Jan 49,240 21,550 117,602 211,839 95,002 141,303 636,536
Feb 81,371 66,447 63,355 70,666 109,647 271,882 663,368
Mar 43,958 42,084 63,974 46,566 144,127 131,150 471,859
Apr 17,513 32,804 35,352 83,377 119,658 116,103 404,807
May 78,990 51,181 33,790 60,620 72,313 87,602 384,496
Jun 46,428 50,084 52,966 103,424 180,614 209,768 643,284
Jul 88,373 82,003 124,563 190,601 345,969 232,800 1,064,309
Aug 120,291 130,030 150,986 179,234 216,452 182,231 979,224
Sep 117,089 106,357 144,597 275,124 202,994 294,012 1,140,173
Oct 121,116 114,777 80,356 552,579 1,254,636 594,136 2,717,600
Nov 327,566 359,157 801,886 966,692 387,903 64,386 2,907,590
Dec 359,407 275,603 5,983 69,760 232,999 187,229 1,130,981
Total 1,451,342 1,332,077 1,675,410 2,810,482 3,362,314 2,512,602 13,144,227 Source: Berbera Port Authority
Chart 28: Yearly Export of livestock through Berbera Port: 2007--2012 (HDS)

~ 33 ~
6.9.2. Hide and Skin Export
Table 44: Export of hide and skin pieces through Berbera Port: 2007—2012 (Piece)
Month 2007 2008 2009 2010 2011 2012 Jan 35,600 296,184 500,030 505,347 862,255 314,490
Feb 140,126 231,052 181,509 257,850 2,368,945 223,891
Mar 206,949 459,002 144,300 432,847 3,127,508 249,612
Apr 107,625 357,773 150,812 306,555 791,100 391,854
May 203,220 651,028 25,787 492,864 1,918,757 329,033
Jun 62,000 511,650 244,770 151,222 1,143,535 115,776
Jul 192,027 257,846 222,584 196,950 1,796,932 181,954
Aug 328,069 210,051 908,850 575,235 225,400 352,180
Sep 362,650 308,835 102,760 124,664 604,100 1,070,058
Oct 232,352 305,020 77,000 563,738 242,976 199,336
Nov 287,356 343,880 251,197 1,005,800 244,154 269,843
Dec 451,401 108,800 712,966 2,290,974 316,685 278,004
Total 2,609,375 4,041,121 3,522,565 6,904,046 13,642,346 3,976,031 Source: Berbera Port Authority
Chart 29: Yearly Export of hide and skin pieces through Berbera Port: 2007—2012 (Piece)

~ 34 ~
6.9.3. Frankincense Export
Table 45: Export of Frankincense through Berbera Port: 2007--2012 (Kg)
Source: Berbera Port Authority.
Chart 30: Yearly Export of Beeyo through berbera Port: 2007--2012 (Kg)
Month 2007 2008 2009 2010 2011 2012
Jan 0 55,900 37,780 300 271,020 97,825
Feb 67,482 177,520 64,300 6,500 53,650 42,320
Mar 33,900 42,193 0 34,100 16,240 0
Apr 157,500 160,640 4,974,650 168,650 245,502 24,200
May 66,500 147,420 1,520 23,800 118,520 35,659
Jun 3,500 0 49,917 6,300 274,240 0
Jul 129,920 50,000 56,000 0 136,693 0
Aug 52,460 3,200 0 3,116,700 55,200 0
Sep 1,940 210,005 41,115 0 0 163,667
Oct 19,400 209,180 48,000 24,570 0 16,000
Nov 32,104 153,024 148,011 199,810 9,600 43,000 Dec 50,000 61,155 125,000 303,287 107,750 67,672
Total 614,706 1,270,237 5,546,293 3,884,017 1,288,515 490,343

~ 35 ~
Table 46: Berbera Port Traffic: 2007--2012 (NO)
Year Dhows Ships Total
2007 104 278 382
2008 153 316 469
2009 187 307 494
2010 285 378 663
2011 307 363 670
2012 345 401 746 Source: Berbera Port Authority
Chart 31: Berbera Port Traffic: 2007-2012 (No)
~ 36 ~
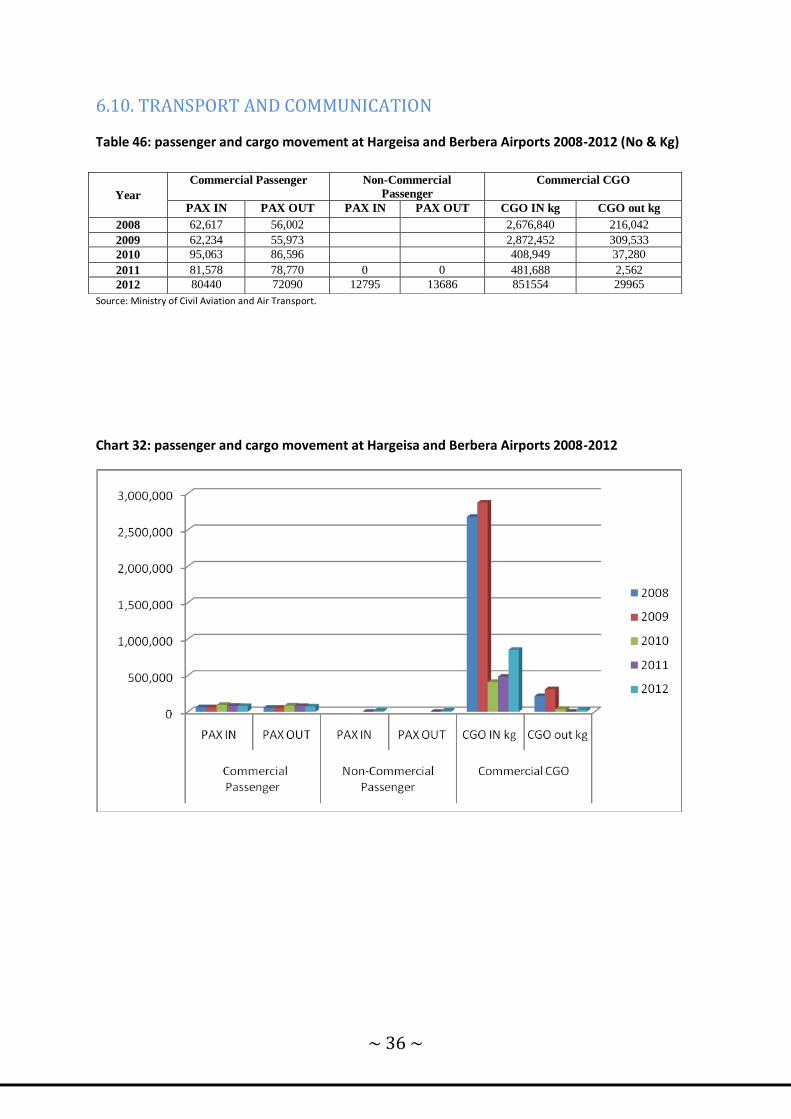
6.10. TRANSPORT AND COMMUNICATION
Table 46: passenger and cargo movement at Hargeisa and Berbera Airports 2008-2012 (No & Kg)
Source: Ministry of Civil Aviation and Air Transport.
Chart 32: passenger and cargo movement at Hargeisa and Berbera Airports 2008-2012
Year
Commercial Passenger Non-Commercial
Passenger
Commercial CGO
PAX IN PAX OUT PAX IN PAX OUT CGO IN kg CGO out kg
2008 62,617 56,002 2,676,840 216,042
2009 62,234 55,973 2,872,452 309,533
2010 95,063 86,596 408,949 37,280
2011 81,578 78,770 0 0 481,688 2,562
2012 80440 72090 12795 13686 851554 29965

~ 37 ~
7. Social Sector 7.1 EDUCATION –
The current educational system consists of a primary level with eight grades, followed by a
secondary level with four grades. Overall, the number of students enrolled in primary schools,
secondary schools and universities in Somaliland continues to grow rapidly.
Table 47 : Growth of Public and Private Education during 1997/98-2011/2012
Year Pri. schools Sec.schools Family life Vocational Universities
1997/98 165 3 11 2 1
1998/99 144 5 13 3 2
1999/00 174 13 13 4 2
2000/01 294 15 13 4 2
2001/02 307 16 17 4 2
2002/03 353 20 24 4 2
2003/04 385 29 33 4 2
2004/05 412 35 33 2 3
2005/06 516 43 N/B 2 5
2006/07 N/A 44 N/A 2 6
2007/08 N/A N/A N/A N/A N/A
2008/09 627 59 30 N|A 10
2009/10 917 84 30 5 20
2010/2011 907 99 5 22
2011/2012 1,030 94 174 27 22 Source: Ministry of Education.
Chart 33: Growth of Public and Private Education during 1997/98-2011/2012

~ 38 ~
7.1.1 PRIMARY EDUCATION
Primary schools have increased students enrolment from 35,997 in 1998/99 t o 170,930. Likely
gender enrolment estimates in 2011/12 indicate that there is 1 girl for nearly 2 boys. Most of the
schools were constructed with the help of aid assistance from the international community.
Table 48: Growth of Primary Education (Public and Private) during 1998/99-2011/2012
Year Schools classes Male Female Total Teachers
1998/99 144 887 26,356 9,641 35,997 960
1999/00 174 1,106 32,720 12503 45,223 1,167
2000/01 222 1,893 38,106 14,819 52,925 1,921
2001/02 307 2,078 56,951 27,723 84,674 2,062
2002/03 354 2,386 63,912 32,294 96,206 2,346
2003/04 385 2,65 70,617 35,863 106,480 2,590
2004/05 412 2586 79,878 38,438 118,316 2,801
2005/06 516 3,277 85,665 51,091 136,756 3,941
2006/07 N/A N/A 94,627 56,873 151,500 N/A
2007/08 590 3,746 75,985 42,730 159,042 3,937
2008/09 627 N\A 108,322 62,608 170,930 4969
2009/10 917 4,043 138,137 94,862 232,999 4,969
2010/11 907 98,359 71,988 170,347 5,668
2011/12 1,030 105,986 78,696 184,682 5,960 Source: Ministry of Education.
Chart 34A: Growth of Primary Education (Public and Private) 1998/99-2011/12

~ 39 ~
Chart 34B: Growth of Primary Education (Public and Private) 1998/99-2011/12
Table 49: Distribution of Primary Education by Region during 2008/2009
Region Schools Classes Student Enrolment
Male Female M/F Total
Awdal 84 14,010 9,508 23,518
M.Jeex 177 44,136 23,962 68,098
Sahil 41 5,131 3,611 8,742
Togdheer 130 18,434 9,569 28,003
Sanag 101 13,149 7,978 21,127
Sool 94 13,462 7,980 21,442
Total 627 108,322 62,608 170,930 Source: Ministry of Education.
Chart 35: Distribution of Primary Education by Region during 2008/09

~ 40 ~
Table 50: Distribution of Primary Education by Region during 2011/2012
Region Schools Classes Student Enrolment
Male Female M/F Total
Awdal 96 12,490 10,691 23,181
M.Jeex 241 42,501 28,819 71,320
Sahil 75 5,139 3,881 9,020
Togdheer 135 22,134 16,478 39,387
Sanag 184 12,134 10,051 22,185
Sool 108 10,813 8,776 19,589
Total 8,39 105,986 78,696 184,682 Source: Ministry of Education.
Chart 36: Distribution of Primary Education by Region during 2011/2012 (No)
Table 51: Primary Education—Distribution of Students by Gender and Region during 08/09
Region URBAN RURAL
Male Female Male Female
Awdal 10,395 7,305 4,097 1,721
Maroodi Jeeh 36,197 20,210 7,939 3,752
Sahil 3,421 2,865 1,510 946
Togdheer 12,993 7,527 5,441 2,042
Sanag 9,594 5,792 3,555 2,186
Sool 9,639 6,392 3,843 1,594
Total 82,239 50,091 26,385 12,241 Source: Ministry of Education

~ 41 ~
Chart 37: Primary Education—Distribution of Students by Gender and Region during 08/09
Table 52: Primary Education—Distribution of Students by Gender during 11/12
Student Enrolment
Male Female TMF Rural 74,116 55.598 129,714
Urban 30,863 22,371 53,234
Chart 38: Primary Education—Distribution of Students by Gender during 11/12
~ 42 ~
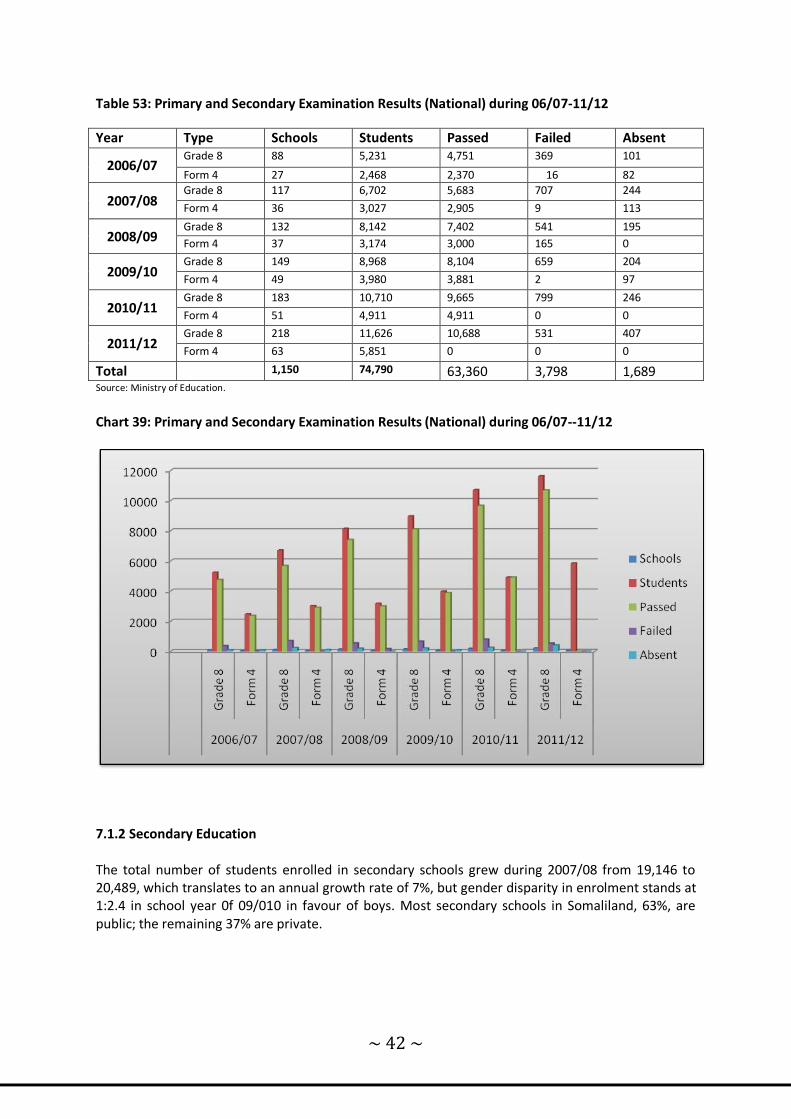
Table 53: Primary and Secondary Examination Results (National) during 06/07-11/12
Year Type Schools Students Passed Failed Absent
2006/07 Grade 8 88 5,231 4,751 369 101
Form 4 27 2,468 2,370 16 82
2007/08 Grade 8 117 6,702 5,683 707 244
Form 4 36 3,027 2,905 9 113
2008/09 Grade 8 132 8,142 7,402 541 195
Form 4 37 3,174 3,000 165 0
2009/10 Grade 8 149 8,968 8,104 659 204
Form 4 49 3,980 3,881 2 97
2010/11 Grade 8 183 10,710 9,665 799 246
Form 4 51 4,911 4,911 0 0
2011/12 Grade 8 218 11,626 10,688 531 407
Form 4 63 5,851 0 0 0
Total 1,150 74,790 63,360 3,798 1,689 Source: Ministry of Education.
Chart 39: Primary and Secondary Examination Results (National) during 06/07--11/12
7.1.2 Secondary Education
The total number of students enrolled in secondary schools grew during 2007/08 from 19,146 to 20,489, which translates to an annual growth rate of 7%, but gender disparity in enrolment stands at 1:2.4 in school year 0f 09/010 in favour of boys. Most secondary schools in Somaliland, 63%, are public; the remaining 37% are private.
~ 43 ~
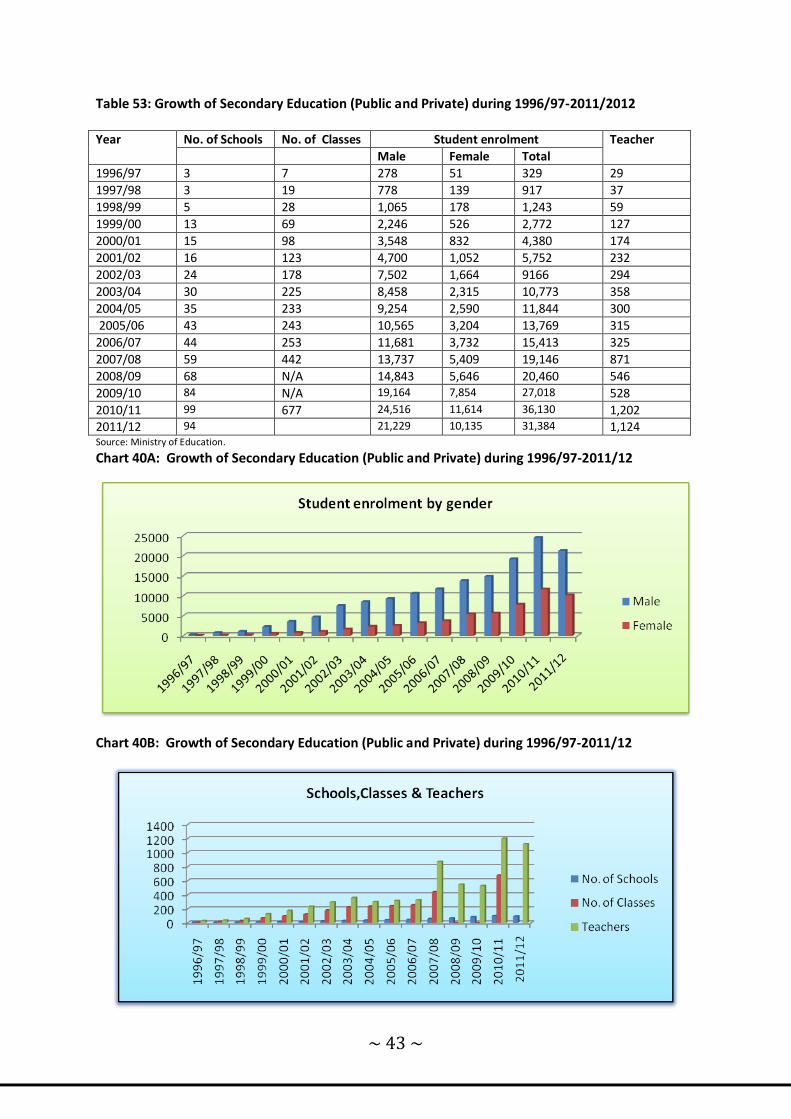
Table 53: Growth of Secondary Education (Public and Private) during 1996/97-2011/2012
Year No. of Schools No. of Classes Student enrolment Teacher
Male Female Total
1996/97 3 7 278 51 329 29
1997/98 3 19 778 139 917 37
1998/99 5 28 1,065 178 1,243 59
1999/00 13 69 2,246 526 2,772 127
2000/01 15 98 3,548 832 4,380 174
2001/02 16 123 4,700 1,052 5,752 232
2002/03 24 178 7,502 1,664 9166 294
2003/04 30 225 8,458 2,315 10,773 358
2004/05 35 233 9,254 2,590 11,844 300
2005/06 43 243 10,565 3,204 13,769 315
2006/07 44 253 11,681 3,732 15,413 325
2007/08 59 442 13,737 5,409 19,146 871
2008/09 68 N/A 14,843 5,646 20,460 546
2009/10 84 N/A 19,164 7,854 27,018 528
2010/11 99 677 24,516 11,614 36,130 1,202 2011/12 94 21,229 10,135 31,384 1,124 Source: Ministry of Education.
Chart 40A: Growth of Secondary Education (Public and Private) during 1996/97-2011/12
Chart 40B: Growth of Secondary Education (Public and Private) during 1996/97-2011/12

~ 44 ~
Table 54: Public and Private Secondary Schools Distribution by Region during 08/09-09/10
Region Form 1-4
2008/2009 2009/2010
Sch. Male Female Total Sch. Male Female Total
M.Jeex 1-4 31 9,047 3,654 12,701 36 9,998 4,593 14,591
Awdal 1-4 9 1,974 795 2,769 10 2,624 1,355 3,979
Sahil 1-4 4 732 210 942 4 818 248 1,066
Togdheer 1-4 11 1,528 370 1,869 14 2,338 620 2,958
Sanaag 1-4 7 714 273 987 11 898 473 1,371
Sool 1-4 6 848 344 1,192 9 1,488 565 2,053
Total 68 14,843 5,646 20,460 84 18,164 7,854 26,018
Source: Ministry of Education.
Chart 41A: Public and Private Secondary Schools Distribution by Region during 08/09-09/10
Chart 41B: Public and Private Secondary Schools Distribution by Region during 08/09-09/10

~ 45 ~
Table 55: Distribution of Primary Education by Region during 2011/2012 (No)
Region
Schools
Classes
Student Enrolment
Male
Female
M/F Total Awdal 96 12,490 10,691 23,181
M/jeex 241 42,501 28,819 71,320
Saxil 75 5,139 3,881 9,020
Togdheer 135 22,134 16,478 39,387
Sanaag 184 12,134 10,051 22,185
Sool 108 10,813 8,776 19,589
Total 8,39 105,986 78,696 184,682 Source: Ministry of Education.
Chart 42A: Public and Private Secondary Schools Distribution by Region during 11/12
Chart 42B: Public and Private Secondary Schools Distribution by Region during 11/12

~ 46 ~
7.1.3. HIGHER EDUCATION
Table 56: Number of Students Enrolled at the beginning of the academic year in Universities
City
2008 2009 2010 2011 2012
Borama Amoud 1484 2127 2684 3508 2895
EELO 283 382 710 659 654
Gebiley Tima Cadde
184 227
Hargeisa
U. Hargeisa 1739 2403 2521 3126 4005
U. Golis 470 605 1589 2223 2102
U.HOPE
183
U. Admas 612 936 1526 1472 1472
U. Alpha
1504
IHU 146 352 425 422
Berbera Golis
195
Academy
84
Burao Burao 145 145 618 321 658
Total 4,879 6,950 10,257 11,958 13,752
Chart 43: Number of Students Enrolled at the beginning of the academic year in Universities

~ 47 ~
Table 57: Total Students Enrolled in all universities by faculty during the 2008-2012
Faculties 2008 2009 2010 2011 2012
All freshs 368 505 841 1018 828
Business 935 977 1293 1391 2,135
Education 1116 1280 678 460 369
Agriculture 147 145 312 413 277
Medicine 237 226 409 635 567
Shar & Law 530 610 531 590 489
Nursing 43 69 95 112 110
Comp. ICT 342 932 1157 1267 2,648
Dental 0 17 45 75 56
Engineering 113 274 915 1480 1,201
Lab. Tech 0 0 28 56 68
Pharmacy 0 0 26 50 62
Dip.in Bus 0 0 91 101 -
Dip. in Proj 0 0 57 77 -
Dip. in Edu 0 0 254 225 -
Scott 0 0 185 0 -
Islamic Stu. 48 20 123 214 317
Science 133 236 251 589 801
Economics 270 640 595 636 981
Management 123 172 278 233 233
Accounting 181 240 318 315 315
Com. Science 128 96 247 197 195
Mgt. Science 105 0 572 792 177
Eco. Manag Science 60 310 88 65 -
Teleco Eng. 139 0 0 391
Quran Science 62 129 153 -
MSM 102 150 142
Institute of Peace 50 30 -
Veterinary 48 0 37
Languages` 137 27 39
Office Admin 118 20 20
Dev’t Studies 185 221 263
Continuous Study 27 266 -
MBA 33 46 -
Business & IT (BIT) 39 54 -
Computer Engineering
46
Geology 102
Public Health 127
Social Work 42
Health and Science 110
Social Science 78
Post gradute studies 122
MBBS 50
CLS 35
Marine Engineering 35
Science foundation 63
Commmunity devel 98
Animal science & Agri
74
Nautical Science 49
Total 4,879 6,950 10,257 11,958 13,752
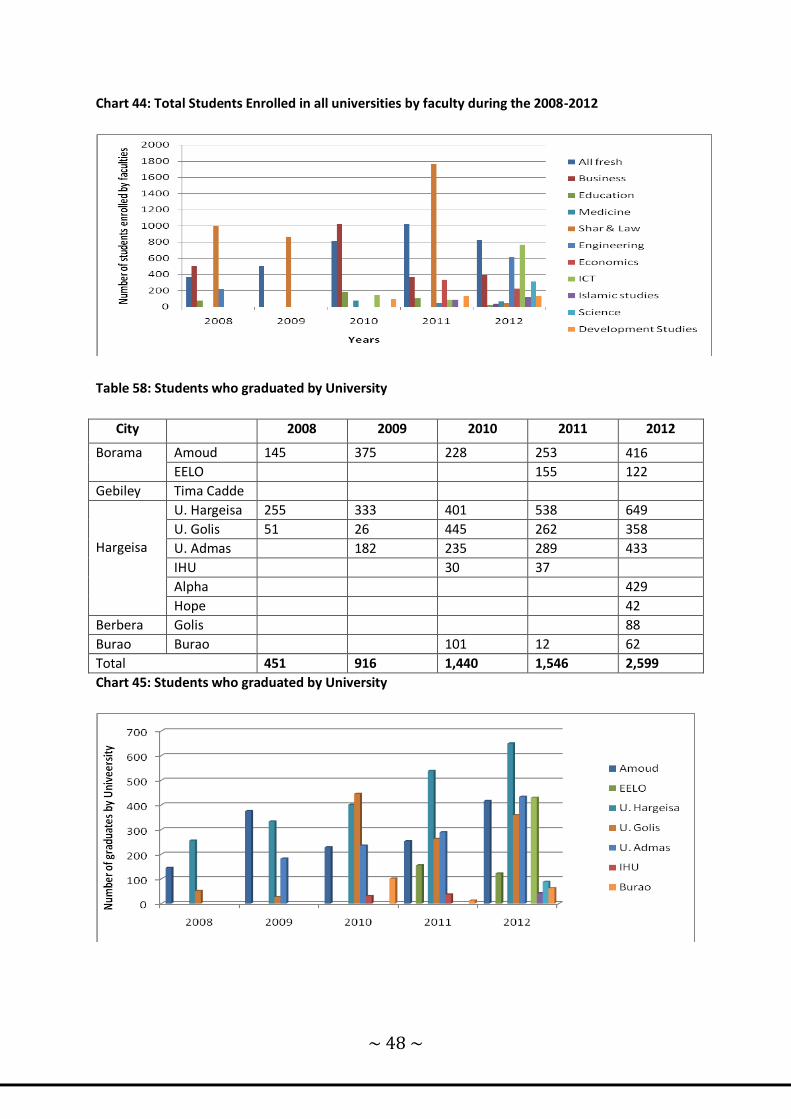
~ 48 ~
Chart 44: Total Students Enrolled in all universities by faculty during the 2008-2012
Table 58: Students who graduated by University
City 2008 2009 2010 2011 2012
Borama Amoud 145 375 228 253 416
EELO 155 122
Gebiley Tima Cadde
Hargeisa
U. Hargeisa 255 333 401 538 649
U. Golis 51 26 445 262 358
U. Admas 182 235 289 433
IHU 30 37
Alpha 429
Hope 42
Berbera Golis 88
Burao Burao 101 12 62
Total 451 916 1,440 1,546 2,599
Chart 45: Students who graduated by University

~ 49 ~
Table 59: Students graduating nationwide from universities by specialty
Faculty 2008 2009 2010 2011 2012
Male
08
Female Male Female Male Female Male Female Male Female
MS-IT 0 0 43 27 51 22 130 57 448 145
Telecom
Engineering
0 0 0 0 0 0 0 0 83 10
Civil Engineering 18 1 25 1 43 2 71 2 143 4
Medical 4 2 18 6 12 5 13 4 20 13
Anes Thesia 0 0 0 0 0 0 0 0 11 2
Law 38 12 40 29 60 34 59 15 75 50
Computer Science 0 0 0 0 9 4 29 16 165 36
Accounting and
Finance
0 0 47 30 44 21 28 30 134 62
Business 160 51 209 47 213 70 149 91 202 109
Economics 0 0 33 2 90 20 154 33 186 54
BPA 0 0 0 0 0 0 0 0 21 4
Mgt science 0 0 0 0 28 21 92 57 34 24
Islamic 0 0 1 8 0 0 24 21 30 11
Science 18 3 4 3 12 4 8 5 43 21
MSM 0 0 0 0 0 0 28 1 38 4
Education 66 12 245 59 331 139 131 51 29 5
IPCS 0 0 0 0 30 3 21 2 28 6
Midwifery 0 0 0 0 0 0 0 0 21 0
Medical
Laboratory
0 0 0 0 0 0 0 0 13 4
Agriculture 27 7 24 1 30 9 28 5 32 3
Nursing 0 0 5 9 7 11 9 17 7 24
Dentists 0 0 0 0 0 0 0 0 10 2
Sharia & Law 0 0 0 0 21 19 36 11 25 11
Diploma
Education
0 0 0 0 40 7 69 13 46 3
Diploma in
Business
0 0 0 0 0 0 0 0 25 6
Diploma in Dental 0 0 0 0 0 0 0 0 1 1
MDG 0 0 0 0 0 0 0 0 34 46
D.s 0 0 0 0 0 0 0 0 20 6
Crim. & Justice 27 5 0 0 0 0 23 4 8 1
Distance Prog 0 0 0 0 0 0 0 0 0 0
Veterinary 0 0 0 0 11 2 0 0 0 0
Journalism 0 0 0 0 14 1 0 0 0 0
Continuous Study
0 0 0 0 0 0 8 1 0 0
Total 358 93 694 222 1,046 394 1,110 436 1,932 667

~ 50 ~
Chart 46A: Students graduating nationwide from universities by Gender
Chart 46B: Students graduating nationwide from universities by specialty

~ 51 ~
7.2. Health The approximately 4.4million population of Somaliland is served by 25 hospitals, 91 health centres,
and 164 health posts. The health sector receives large amounts of assistance from international
organizations.
7.2.1Public Health Table 60: Available Health Service facilities during 2008-2009
Selected Region
Doctors Nurses Midvies X-Ray Technicians
Beds Laboratory Technologists
2008 2009 2008 2009 2008 2009 2008 2009 2008 2009 2008 2009
M.jeex 41 47 172 216 36 39 2 2 550 559 5 16
Sahil 3 3 10 10 5 9 0 0 250 255 1 1 Awdal 11 11 37 37 9 13 1 1 380 384 2 2
T/Dheer 12 15 47 78 10 14 1 1 270 276 3 3
Sanaag 4 4 24 24 5 9 0 0 130 133 1 1
Sool 2 6 4 4 1 5 0 0 140 142 1 1
Total 73 86 294 369 65 89 4 4 1720 1749 13 24 Sources: Ministry of Health.
Chart 47A: Available Health Staff Distribution by Region during 2008-2009
Chart 47B: Available Health Bed Distribution by Region during 2008-2009

~ 52 ~
Table 61: Available Health services facilities 2010---2011
Selected Region
Doctors Nurses Midwives X-Ray Technicians
Beds Laboratory Technologists
2010 2011 2010 2011 2010 2011 2010 2011 2010 2011 2010 2011
Awdal 11 17 37 64 13 13 1 1 384 390 2 4
M/Jeeh 47 60 216 269 39 47 2 3 565 571 16 21
Sahil 3 5 10 11 9 9 0 1 258 263 1 1
T/Dheer 15 17 78 83 14 23 1 1 273 282 3 5
Sanaag 4 5 24 27 9 9 0 1 140 142 1 1
Sool 6 6 4 5 5 5 0 1 150 153 1 2
Total 86 110 369 459 89 106 4 8 1770 1801 21 34 Sources: Ministry of Health.
Chart 48A: Available Health Staff Distribution by Region during 2010-2011
Chart 48B: Available Health Bed Distribution by Region 2010-2011

~ 53 ~
Table 62: Available Health services facilities 2012
Sources: Ministry of Health.
Chart 49: Available Health services facilities 2012
Doctors Nurses
Mid wife Lab Pharmcy X,ray Adm/mgt Auxilary TECHNCIAN TOTAL
Awdal 52 30 1 1 45 1 130
M.Jee 79 430 26 28 0 1 27 591
SAHIL 4 12 1 1 1 33
T/DHER 11 61 36 150
SANAAG 3 12 4 1 1 28 70
SOOL 2 37 3 37 106
Total 151 582 31 34 0 1 2 173 2 976

~ 54 ~
Table 63: Regional Immunization Routing Data in 2008-2009
BCG DPT1-2-3 OPV1-2-3 Measles TT for pregnant woman*
TT for non pregnant woman*
2008 2009 2008 2009 2008 2009 2008 2009 2008 2009 2008 2009
M.jeex 10,361 12,401 28,179 33,526 28,226 33,625 9,244 10,598 9,964 14,561 4,998 4,716
Sahil 4,236 3,106 11,173 13,303 11,079 13,492 3,695 4,461 2,258 3,529 2,455 2,910
Awdal 11,901 10,070 36,542 29,760 36,720 29,900 8,968 8,286 9,592 9,783 6,412 6,053
T/Dheer 7,601 4,229 21,188 14,856 20,753 14,294 8,141 4,858 6,222 5,429 4,573 2,139
Sanaag 3,069 4,454 8,290 13,980 8,294 13,942 2,660 4,992 1,932 5,457 1,389 6,482
Sool 1,101 2,360 4,478 12,813 4,388 13,463 1,377 5,008 1,431 4,678 1,265 3,827
Total 38,269 36,620 109,850 118,238 109,460 118,716 34,085 38,203 31,399 43,437 21,092 26,127
*1st
+ 2nd
Dose Sources: Ministry of Health.
Chart 50A: Regional Immunization Routing Data in 2008-2009
Chart 50B: Regional Immunization Routing Data TT for Pregnant & Non-Pregnant women in 2008-2009

~ 55 ~
Table 64: Regional Immunization Routing Data in 2010---2011
Selected Region
BCG DPT1-2-3 OPV1-2-3 Measles TT for pregnant woman*
TT for non pregnant woman*
2010 2011 2010 2011 2010 2011 2010 2011 2010 2011 2010 2011
Awdal 6508 9287 6132 8804 6127 8888 4720 6205 6194 11190 4790 9875
M.Jeeh 14665 14554 12024 11064 12136 11086 11464 10415 13157 17625 6819 10301
Sahil 2175 2936 2178 2461 2150 2455 2495 2566 4341 4196 2896 4512
T/Dheer 3198 5377 2342 2792 2365 3045 2931 3807 3231 4469 1115 3516
Sanaag 3319 4798 2176 2764 2181 3016 1938 2637 4063 4419 5765 8920
Sool 2976 4148 8281 3691 8379 3711 5709 2542 8615 6620 7043 9525
Total 32,841 41,100 33,133 31,576 33,338 32,201 29,257 28,172 39,601 48,519 28,428 46,649
Sources: Ministry of Health. *1st
+ 2nd
Dose
Chart 51A: Regional Immunization Routing Data in 2010-2011
Chart 51B: Regional Immunization Routing Data TT for Pregnant & Non-Pregnant women in 2010-2011

~ 56 ~
Table 65: Regional Immunization Routing Data in 2012
Sources: Ministry of Health.
Chart 52A: Regional Immunization Routing Data in 2012
Chart 52B: Regional Immunization Routing Data TT for Pregnant & Non-Pregnant women in 2012
Awdal M. Jeex Sahil Togdher Sanag Sool Total
EPI: CHILDREN
BCG Under 1yr 10,213 17,610 7,223 3,889 7,950 5,027 51,912
Polio-0 Under 1yr 3,637 6,066 1,277 661 2,645 2,671 16,957
OPV1 Under 1yr 18,745 22,171 9,945 10,033 9,589 6,946 77,429
OPV3 Under 1yr 16,580 19,001 8,540 17,381 11,204 6,542 79,248
DPT1 Under 1yr 18,622 21,424 9,872 9,393 9,330 7,469 76,110
DPT3 Under 1yr 16,495 18,383 7,926 7,534 10,518 7,005 67,861
Measles Under 1yr 13,906 18,540 9,639 9,558 8,785 5,326 65,754
EPI: WOMEN
TT2+ Pregnant Women 24,603 29,103 16,877 12,900 16,334 12,562 112,379
WCBA 14,330 16,813 12,770 5,624 20,569 12,954 83,060

~ 57 ~
Table 66: Number of Cases in TB Hospitals 2011
Hospitals Pulmonary sputum smear microscopy positive
New pulmonary sputum smear microscopy negative
New cases
Previously treated 0-4 yrs 5-14 yrs > 15 yrs
Relapses After
failure After
default
Borama 100 8 4 0 1 17 90
Gabilay 37 8 4 0 0 6 50
Finsoma Har 70 5 4 1 0 2 25
Hargeisa 347 41 20 0 1 60 260
Berbera 56 5 0 0 0 6 51
Burao 246 16 8 2 4 9 265
Buhodle 86 3 1 3 0 0 3
Erigavo 44 9 4 1 0 3 10
Lasanod 97 10 0 0 0 7 77
Elafwein 43 1 1 0 0 0 13
B/ Gubadle 26 0 0 0 0 2 5
Sheikh 61 4 0 0 1 0 6
Badhan 25 0 0 0 0 0 2
Odweine 12 1 0 0 1 0 3
G/Total 1,250 11 46 7 8 112 860
Sources: Ministry of Health.
Hospitals
Pulmonary sputum smear microscopy not done / not available New extra-pulmonary Other
previously treated
3
TOTAL
Transfer In
All cases
0-4 yrs
5-14 yrs
> 15 yrs
0-4 yrs
5-14 yrs
> 15 yrs
Borama 23 8 2 4 17 74 28 376 43
Gabilay 8 0 0 1 8 45 9 174 21
Finsoma Har 26 11 8 4 14 40 2 212 10
Hargeisa 229 45 19 13 61 393 65 1,754 64
Berbera 28 5 0 0 4 28 51 136 38
Burao 111 43 26 6 36 230 4 956 78
Buhodle 4 0 0 0 6 13 0 122 8
Erigavo 3 3 0 2 1 22 3 105 4
Lasanod 11 0 2 10 17 49 3 282 18
Elafwein 0 0 2 0 2 4 0 67 11
B/ Gubadle 5 1 0 0 0 7 0 56 2
Sheikh 6 3 0 1 0 6 0 67 4
Badhan 0 0 0 0 0 0 0 0 3
Odweine 0 0 0 1 1 3 1 24 2
G/Total 454 119 59 42 167 914 166 4,331 306

~ 58 ~
Table 67: TB Case detection in 14 TB Centres in Somaliland during 2012
TB Centre
Pulmonary sputum smear microscopy
positive
New pulmonary sputum smear
microscopy negative
Pulmonary sputum smear
microscopy not done / not available
New extra-pulmonary Oth
er previously
treated
3
TOTAL
Tra
nsfe
r In
All case
s
New
cases
Previously treated
0-4
yrs
5-1
4 y
rs
> 1
5 y
rs
0-4
yrs
5-1
4 y
rs
> 1
5 y
rs
0-4
yrs
5-1
4 y
rs
> 1
5 y
rs
Rela
pses
Aft
er
failu
re
Aft
er
defa
ult
Borama 86 11 0 0 2 21 97 20 12 1 8 19 88 26 391 38
Gabilay 60 9 5 0 1 14 59 7 3 0 1 0 37 11 207 21
Finsoma 80 12 0 0 0 1 31 34 16 8 2 10 68 0 262 20
Harg. TB H 531 55 26 1 23 53 157 193 54 51 14 49 420 65 1692 77
Berbera 48 4 1 0 0 0 33 34 8 1 3 9 23 0 164 19
Burao 222 24 7 0 1 6 171 137 26 1 11 36 224 0 866 32
Buhodle 52 2 3 1 1 0 9 1 0 0 3 3 12 0 87 20
Erigavo 78 4 1 0 0 2 20 5 0 0 3 11 33 3 160 10
Lasanod 59 9 1 0 0 3 65 9 4 2 3 6 38 2 201 13
odweine 49 1 0 2 0 6 11 0 3 0 0 0 13 0 85 7
B/Gubadle 18 0 0 0 0 4 25 11 3 0 0 0 16 0 77 1
Sheik 84 9 1 0 0 0 3 5 1 0 1 1 3 0 108 5
Badhan 42 0 0 0 0 1 23 0 0 0 0 0 1 0 67 7
Odweine 49 2 0 0 0 0 0 1 1 0 0 0 7 0 60 0
G/Total 1458 142 45 4 28 111 704 457 131 64 49 144 983 107 4427 270

~ 59 ~
Table 68: Number of TB Patients in selected towns: 2007—2011
Selected Towns
2006
2007
2008
2009
2011
Total
Borama 422 320 285 354 376 1,858
Hargeisa 1849 1858 2,078 1,856 2,022 9,791
Berbera 202 210 226 220 203 1,140
Burco 649 686 879 1010 1,102 3,954
Gabilay 161 144 146 154 174 767
Erigavo 0 0 0 0 172 172
Lasanod 0 0 0 0 282 282
Total 3,283 3,218 3,614 3,594 4,331 17,964 Sources: Ministry of Health.
Chart 53A: Number of TB Patients in selected towns: 2007--2011.
Chart 53B: Percentage of TB Patient in Major towns 2011

~ 60 ~
7.2.2 PRIVATE HEALTH SERVICES Table 69: Availability of Private Health Services during 2008
Selected towns
Name of Hospitals
Doctors Nurses Midwives X-Ray Technicians
Beds Laboratory technologists
Hargeisa
Manhal Hosp. 12 12 4 0 84 4 Horn of Africa 2 4 4 0 20 1 Red Sea Hosp. 1 5 0 0 8 2
Ugbaad Maternity
Hosp.
1 3 2 0 9 4
B.kal-kaal Hosp.
1 2 0 0 15 1
Edna Maternity
Hosp.
4 12 9 1 60 5
Borama Alaale Hosp. 4 7 5 1 32 3
G. Total 25 45 24 2 228 20 Source: Private Health Sector.
Chart 54A: Availability of Private Health Services during 2008
Chart 54B: Availablity of private Health Bed Distribution by 2008

~ 61 ~
Table 70: Availability of Private Health Services 2009
Source: Private Health Sector.
Chart 55A: Availability of Private Health Services 2009
Chart 55B: Availablity of private Health Bed Distribution by 2009
Selected towns
Name of Hospitals
Doctors Nurses Midwives X-Ray Technicians
Beds Laboratory technologists
Hargeisa
Manhal Hosp. 12 3 3 1 84 3 Horn of Africa 2 4 4 0 20 1 Red Sea Hosp. 1 5 0 0 8 2 Ugbaad Maternity Hosp.
1 3 2 0 9 4
B.kal-kaal Hosp.
1 2 0 0 15 1
Edna Maternity Hosp.
4 12 9 1 60 5
Borama Alaale Hosp. 4 7 5 1 32 3
General Total
25 36 23 3 228 19

~ 62 ~
Table 71: Availability of Private Health Services 2011
Source: Private Health Sector.
Chart 56A: Availability of Private Health Services 2011
Chart 56B: Availablity of private Health Bed Distribution by 2011
Selected towns
Name of Hospitals
Doctors Nurses Midwives X-Ray Technicians
Beds Laboratory technologists
Hargeisa
Manhal Hosp. 14 9 0 2 83 2 Horn of Africa Red Sea Hosp. 1 5 0 0 8 2 Gargaar Hosp. 8 26 4 0 88 10 B.kal-kaal Hosp.
4 2 0 0 15 2
Edna M. Hosp.
5
12
8
0
69
6 Borama Allale Hospital
5 3 2 1 75 4
Amoud F. Hospital
11 21 3 2 100 2
General Total
48 78 17 5 448 28

~ 63 ~
Table 72: Availability of Private Health Services 2012
PRIVATE HOSPITALS
City Hospital name # of Doctors
# of Nurses
# of Midwives
# of X-ray Technicians
# of Beds
# of Laboratory technicians TBA Pharmacologists
Hargeisa
Herer 3 2 0 0 10 2 0 0
Gargaar 10 23 9 0 90 10 0 0
Kaah 0 0
Harg. Neuro 3 4 0 0 5 2 0 0
Bukan Kalkaal 1 2 0 0 15 1 0 0
Qudus 4 7 1 1 30 4 0 0
Manhal 16 14 2 1 84 5 0 0
New Hargeisa 9 12 0 0 40 4 0 0
Edna 5 14 14 1 72 5 0 0
Redsea 0 0
Lama huraan 0 0 0 0 0 0 0 0
Togdheer Manhal 9 15 0 1 40 2 0 0
Borama
Al- Hayad 16 26 0 2 70 6 0 3
Alaale 5 3 1 93 3 2 4
Chart 57A: Availability of Private Health Services 2012
Chart 57B: Availablity of private Health Bed Distribution by 2012

~ 64 ~
Table 73: Number of health facilities (public and private) by region 2010
Health facility M/jeeh Awdal Sahil Togdheer Sool Sanaag Total
Public hospitals 4 3 2 2 2 2 15
MCH 24 20 8 14 9 12 87
Health Posts 30 30 15 30 35 35 165
Public mental health 1 0 1 1 0 0 3
Private hospitals 3 2 0 1 1 1 8 Sources: Ministry of Health.
Chart 58A: Health facilities (public and private) by region 2010
Chart 58B: Health facilities (MCH and Health posts) by region 2010

~ 65 ~
Table 74: Number of health facilities (public and private) by region 2011
Health facility M/jeeh Awdal Sahil Togdheer Sool Sanaag Total
Public hospitals 4 3 2 2 2 2 15
MCH 24 20 8 14 9 12 87
Health Posts 30 30 15 30 35 35 165
Public mental health 1 0 1 1 0 0 3
Private hospitals 3 2 0 1 1 1 8 Sources: Ministry of Health.
Chart 59A: Health facilities (public and private) by region 2011
Chart 59B: Health facilities (MCH and Health posts) by region 2011

~ 66 ~
Table 75: Number of health facilities (public and private) by region 2012
Health facility M/jeeh Awdal Sahil Togdheer Sool Sanaag Total
Public hospitals 3 3 2 4 2 2 16
MCH 26 21 8 14 10 12 91
Health Posts 30 30 14 30 30 30 164
Mobile Clinics 2 1 1 1 2 2 9
Public mental health 1 1 1 1 0 0 4
Private hospitals 4 2 0 1 1 1 9 Sources: Ministry of Health.
Chart 60A: Health facilities (public and private) by region 2012
Chart 60B: Health facilities (MCH and Health posts) by region 2012

~ 67 ~
Table 76: Voluntary counselling and Test Data in six regions from 2006-2010
Health Facility M/jeeh Awdal Sahil Togdheer Sool Sanaag G.Total
2006
VCT Male 346 346 Female 337 337
Total 683 683
positive
Male 97 97
Female 145 145
Total 242 242
2007
VCT
VCT
Male 921 69 26 65 1081
Female 176 82 19 46 623
Total 1397 151 45 111 1704
positive
Male 101 24 13 30 168
Female 138 35 7 30 210
Total 239 59 20 60 378
2008
VCT
Male 653 179 271 128 1231
Female 486 146 228 136 996
Total 1139 325 499 264 2227
Positive
Male 112 22 65 34 233
Female 138 28 36 33 235
Total 250 50 101 67 468
2009
VCT
Male 796 149 252 165 150 1521
Female 651 155 298 171 114 1389
Total 1447 304 550 336 264 2901
Positive
Male 147 20 21 36 6 230
Female 175 17 30 34 2 258
Total 322 37 51 70 8 488
2010
VCT
Male 507 292 141 97 92 1146
Female 484 298 286 157 57 1314
Total 1271 590 427 254 149 2460
positive
Male 74 21 15 24 4 140
Female 126 26 18 39 1 210
Total 200 47 33 63 5 3521
G.Total
VCT
Male 3223 689 690 455 242 5316
Female 2434 681 831 510 171 4659
Total 5657 1370 1521 965 413 9975
positive
Male 531 87 114 124 10 868
Female 722 108 91 136 3 1062
Total 1253 193 205 260 13 1930
Source: AIDS Commission
Remarks :
Total number of VCT centers in the country in 2010 was 23.
Total number of health facilities capable of providing medical treatment for HIV infected persons
(ART centers) are 4 in the country which are Hargeisa, Borama, Berbera and Burao general Hospitals.
Total numbers of HIV patients receiving ART drugs in 2010 in Somaliland were 775 persons.

~ 68 ~
7.3 JUSTICES
7.3.1 CRIMINAL STATISTICS:
Table 77: Criminal and Civil Statistics in Somaliland during 2008-2009
SN. Region Number of Cases Number Cases Convicted Number of Cases Pending
2008 2009 2008 2009 2008 2009
Hargeisa 2756 2,229 1,781 2,110 975 119
Awdal 388 365 335 328 53 37
Sahil 426 400 398 388 28 12
Togdheer 450 412 404 371 46 41
Sanaag 228 208 193 180 35 28
Sool 223 259 192 243 31 16
Total 4,471 3,873 3,303 3,620 1,168 253 Sources: Supreme Court
Chart 61: Criminal Statistics in Somaliland during 2008-2009

~ 69 ~
Table 78: Criminal Statistics in Somaliland during 2010
Name of Courts Number cases Number cases convicted Number of cases Pending
Supreme court 339 208 94
Hargeisa Courts 3,164 2204 960
Sahil Courts 647 612 25
Awdal Courts 777 713 64
Togdheer Courts 980 906 74
Sanag Courts 413 355 58
Sool Courts 200 183 17
General Total 6,520 5,181 1,292 Source: Supreme Court of Somaliland
Table 79: Criminal and Civil Statistics in Somaliland during 2010-2011
Regions Completed cases Pending Cases Total of Civil and Criminal
cases Civil Criminal Civil Criminal
2010 2011 2010 2011 2010 2011 2010 2011 2010 2011
M/jeeh 1,430 1,725 774 2,463 445 440 515 270 3,164 4,898
Awdal 361 486 352 358 37 44 27 37 777 925
Sahil 118 255 494 492 13 28 22 22 647 797
T/Dheer 381 557 525 729 48 76 26 118 980 1,480
Sanaag 178 217 177 281 31 31 27 18 413 547
Sool 106 77 17 0 200 Total 2,777 3,281 2,441 4,344 670 869 632 483 6,181 8,647 Source: Supreme Court of Somaliland
Chart 62: Criminal and Civil Statistics in Somaliland during 2010-2011

~ 70 ~
Table 80: Criminal and Civil Statistics in Somaliland during 2012
Source: Supreme Court of Somaliland
Chart 63A: Civil & Criminal Statistics in Somaliland during 2012
Chart 63B: Civil & Criminal Statistics Cases in Somaliland during 2012 (Continued and Completed)
Regions cases registered
Civil Cases
Criminal Cases cases continued cases completed
years 2012 2012 2012 2012 Civil Criminal 2012 Civil Criminal
M/jeh 1,441 479 962 397 205 192 1,056 286 770
Sahil 583 135 428 38 22 16 595 113 482
Togdheer 1,083 588 495 186 146 40 967 514 486
Sanaag 302 143 159 54 29 25 146 51 95
Awdal 999 659 340 142 84 58 857 575 282
Total 4,408 2004 2384 817 486 331 3621 1539 2115

~ 71 ~
Table 81: Registered Notaries in Somaliland by Region 2012
Notaries
Region M/jeex Saxil Sool Sanaag Togdheer Awdal Total
Number 55 2 1 N/A 20 10 88
Chart 64: Registered Notaries in Somaliland by Region 2012
Table 82: Number of Women Divorced in Hargeisa District Court 2008--2010
Years Age No. Divorced
2008
16-22 39
23-29 65
30-36 29
37-43 16
2009
16-22 28
23-29 54
30-36 26
37-43 41
2010
16-22 25
23-29 43
30-36 18
37-43 10
2011 N/A N/A
2012 N/A N/A Source: Hargeisa District Court
Chart 65: Number of Women Divorced in Hargeisa District Court 2008--2010

~ 72 ~
7.3.2 Prisoners
Table 83: Number of Prisoners in Jails 2010--2011
Region Prisoners 2010 Prisoners 2011
Total Men 2010 Women 2010
Total Men 2011 Women 2011
Awdal 264 251 13 257 248 09
M/Jeeh 146 121 25 431 403 28
Sahil 169 159 10 182 176 06
Togdheer 348 335 13 378 362 16
Sool 38 36 2 50 46 04
Sanaag 365 358 7 363 351 12
Gr.Total 1,330 1,260 70 1,661 1,586 75 Sources: Police Commander in Chief of Somaliland
Chart 66: Number of Prisoners in Jails 2010—2011

~ 73 ~
7.3.3 VEHICLE ACCIDENTS Table 84: Vehicle Accidents during 2008-2012
Sources: Police Commander in Chief of Somaliland
Chart 67: Vehicle Accidents in Somaliland during 2008-2009
year # vehicle accidents vehicle deaths vehicle accident injuries Asset crushed
2008 2094 112 1031 951
2009 2784 110 893 781
2010 1680 162 1225 901
2011 2199 152 1546 1595
2012 2191 156 1658 1469

~ 74 ~
7.4 Water
7.4.1 Available Water Facilities
Table 85: Number of Available Water Facilities by Region (2011)
M.Jeex Awdal Sanaag Sool Sahil Togdheer
Rehabilitation of boreholes 5 4 7 6 2 3
Drilling of new boreholes 4 3 3 -0- 2 3
Shallow Wells 15 10 6 10 3 4
Communal Dams(Ballys) 20 8 -0- -0- -0- 4
Springs 3 2 2 -0- 4 -0-
Sub surface Berkad 120 20 25 3 -0- 150
Water system 20 10 5 4 7 4 Source: Ministry of Water &Natural Resources.
Chart 68: Number of Available Water Facilities by Region
Table 86: Number of Available Water Facilities 2012
Source: Ministry of Water.
years shallow wells boreholes Dams Berkad water Kiosks
2011 48 123 32 318 80
2012 78 133 42 378 120

~ 75 ~
Chart 69: Number of Available Water Facilities 2011-2012
7.4.2 STATUS OF BOREHOLES
Table 87: Boreholes and their Functional Status during 2009-2011
Region Functioning Not Functioning
2009 2010 2011 2009 2010 2011
Marood Jeex 23 36 36 13 19 29
Awdal 12 19 19 2 15 16
Sanaag 29 17 17 6 13 13
Togdheer 30 24 24 10 17 25
Sahil 5 10 13 2 8 5
Sool 9 11 14 9 9 6
Total 108 117 123 42 81 97 Source: Ministry of Water & Natural Resources.
Chart 70: Functioning and Not Functioning Boreholes in Somaliland during 2009-2011

~ 76 ~
7.5 Tourism
7.5.1 Hotels Table 88: All Hotels in main towns by Staffs, Rooms, Beds and type of hotel and grade 2012
Chart 71: Hotels 2012
Table 89: Number of Available Media In Somaliland 2012
Number of TV station Number of Website Registered Number of Journal Registered
Public Private Public Private Public Private 1 13 4 0 2 47
Sources: Ministry of Information.
Table 88: Prayer Holly Places Islamic People 2012
Region name Number of mosques
M/jeh 530
Togdheer 195
Awdal 130
Sanaag 112
Sool 108
Sahil 53
Gabilay 69
Hawd 21
Daad Madheedh 33
Buhoodle 58
Saraar 35
Badhan 70
Selel 20 Source: ministry of endowment
Hargiesa Borama Gabiley Berbera Burao Erigavo
Hotels 47 10 6 16 17 6
No.Rooms 1,105 145 77 301 323 120
No.Beds 1,368 204 84 466 352 102
No.Staffs 619 64 9 66 101 16

~ 77 ~
Table 90: Exchange Rate of $1 into Somaliland Shillings SH. (Sh.Sl)
Year Selling Buying
2007 6,167 6,286
2008 6,094 6,168
2009 6,692 6,749
2010 6,595 6,647
2011 5,628 5,738
2012 6,354 6,464 Source: MNP&D (Depart. Of Statistics)
Chart 72: Exchange rate of $1 into Somaliland shillings SH.

~ 0 ~