contents...contents consolidated financial statements 4 profit and loss account for the year ended...
TRANSCRIPT

- 2 -
Consolidated financial statements at 31 December 2014
CONTENTS
CONSOLIDATED FINANCIAL STATEMENTS 4
PROFIT AND LOSS ACCOUNT FOR THE YEAR ENDED 31 DECEMBER 2014 4
STATEMENT OF NET INCOME AND CHANGES IN ASSETS AND LIABILITIES RECOGNISED
DIRECTLY IN EQUITY
5
BALANCE SHEET AT 31 DECEMBER 2014 6
CASH FLOW STATEMENT FOR THE YEAR ENDED 31 DECEMBER 2014 7
STATEMENT OF CHANGES IN SHAREHOLDERS’ EQUITY BETWEEN 1 JAN. 2013 AND 31 DEC. 2014 8
NOTES TO THE FINANCIAL STATEMENTS 10
1. SUMMARY OF SIGNIFICANT ACCOUNTING POLICIES APPLIED BY THE GROUP 10
1.a Applicable accounting standards 10
1.b Consolidation 11
1.c Financial assets and financial liabilities 15
1.d Accounting standards specific to the insurance business 26
1.e Property, plant, equipment and intangible assets 28
1.f Leases 29
1.g Non-current assets held for sale and discontinued operations 30
1.h Employee benefits 31
1.i Share-based payments 32
1.j Provisions recorded under liabilities 33
1.k Current and deferred taxes 34
1.l Cash flow statement 34
1.m Use of estimates in the preparation of the financial statements 35
2. RETROSPECTIVE IMPACT OF IFRS 10, IFRS 11 AND THE AMENDMENT TO IAS 32 36
3. NOTES TO THE PROFIT AND LOSS ACCOUNT FOR THE YEAR ENDED 31 DECEMBER 2014 41
3.a Net interest income 41
3.b Commission income and expense 42
3.c Net gain on financial instruments at fair value through profit or loss 42
3.d Net gain on available-for-sale financial assets and other financial assets not measured at fair value 43
3.e Net income from other activities 43
3.f Cost of risk 44
3.g Costs related to the comprehensive settlement with US authorities 46
3.h Corporate income tax 47
4. SEGMENT INFORMATION 48
5. NOTES TO THE BALANCE SHEET AT 31 DECEMBER 2014 52
5.a Financial assets, financial liabilities and derivatives at fair value through profit or loss 52
5.b Derivatives used for hedging purposes 54
5.c Available-for-sale financial assets 54
5.d Measurement of the fair value of financial instruments 56
5.e Reclassification of financial instruments initially recognised as at fair value through profit or loss held for
trading purposes or as available-for-sale assets
67
5.f Interbank and money-market items 68
5.g Customer items 68
5.h Past-due and doubtful loans 69
5.i Debt securities and subordinated debt 71
5.j Held-to-maturity financial assets 74
5.k Current and deferred taxes 75
5.l Accrued income/expense and other assets/liabilities 76
5.m Equity-method investments 77
5.n Property, plant, equipment and intangible assets used in operations, investment property 78
5.o Goodwill 79
5.p Technical reserves of insurance companies 83
- 3 -
Consolidated financial statements at 31 December 2014
5.q Provisions for contingencies and charges 84
5.r Offsetting of financial assets and liabilities 85
5.s Transfers of financial assets
88
6. FINANCING COMMITMENTS AND GUARANTEE COMMITMENTS 89
6.a Financing commitments given or received 89
6.b Guarantee commitments given by signature 89
6.c Other guarantee commitments 90
7. SALARIES AND EMPLOYEE BENEFITS 91
7.a Salary and employee benefit expenses 91
7.b Post-employment benefits 91
7.c Other long-term benefits 99
7.d Termination benefits 100
7.e Share-based payments 100
8. ADDITIONAL INFORMATION 105
8.a Changes in share capital and earnings per share 105
8.b Contingent liabilities : legal proceedings and arbitration 109
8.c Business combinations 111
8.d Minority interests 113
8.e Significant restrictions in subsidiaries, joint ventures and associates 115
8.f Structured entities 116
8.g Compensation and benefits awarded to the Group’s corporate officers 119
8.h Other related parties 121
8.i Financial instruments by maturity 122
8.j Fair value of financial instruments carried at amortised cost 124
8.k Scope of consolidation 126
8.l Fees paid to the statutory auditors 133
- 4 -
Consolidated financial statements at 31 December 2014
CONSOLIDATED FINANCIAL STATEMENTS Prepared in accordance with International Financial Reporting Standards as adopted by the European Union
The consolidated financial statements of the BNP Paribas Group are presented for the years ended 31 December 2014 and 31 December 2013. In accordance with Article 20.1 of Annex I of European Commission Regulation (EC) 809/2004, the consolidated financial statements for 2012 are provided in the registration document filed with the Autorité des marchés financiers on 7 March 2014 under number D.14-0123.
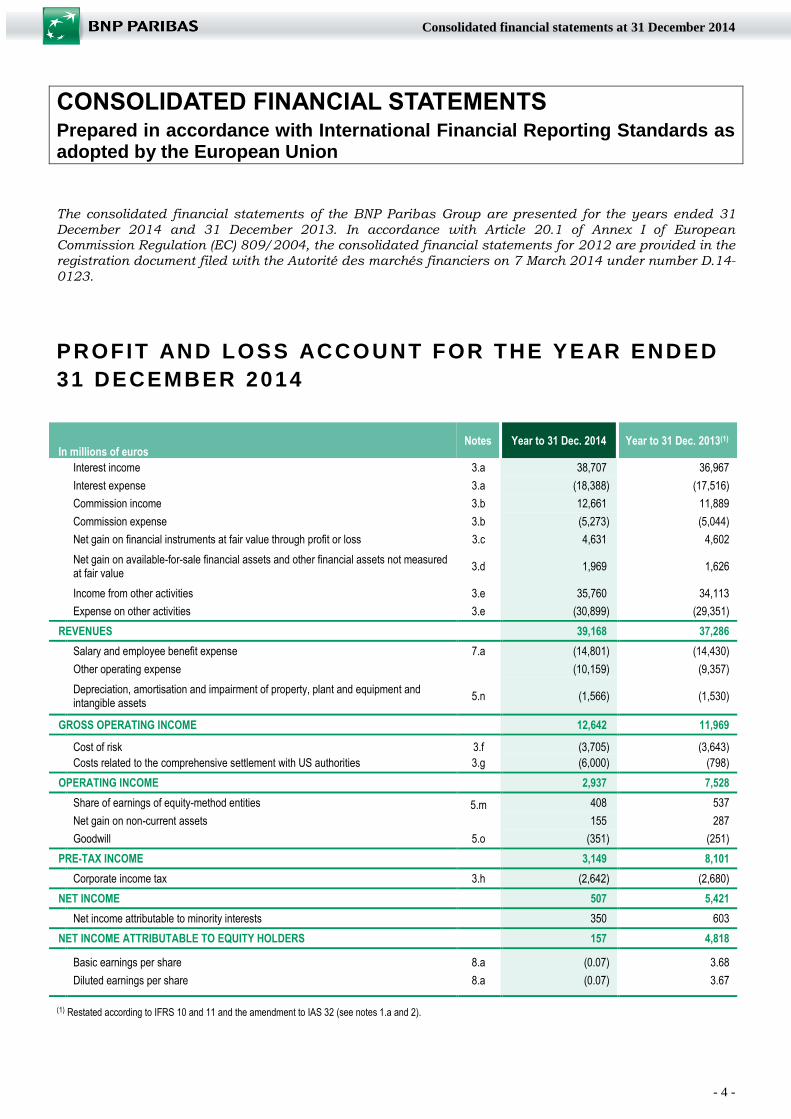
PROFIT AND LOSS ACCOUNT FOR THE YEAR ENDED
31 DECEMBER 2014
In millions of euros Notes Year to 31 Dec. 2014 Year to 31 Dec. 2013(1)
Interest income 3.a 38,707 36,967
Interest expense 3.a (18,388) (17,516)
Commission income 3.b 12,661 11,889
Commission expense 3.b (5,273) (5,044)
Net gain on financial instruments at fair value through profit or loss 3.c 4,631 4,602
Net gain on available-for-sale financial assets and other financial assets not measured at fair value 3.d 1,969 1,626
Income from other activities 3.e 35,760 34,113
Expense on other activities 3.e (30,899) (29,351)
REVENUES 39,168 37,286
Salary and employee benefit expense 7.a (14,801) (14,430)
Other operating expense (10,159) (9,357)
Depreciation, amortisation and impairment of property, plant and equipment and intangible assets 5.n (1,566) (1,530)
GROSS OPERATING INCOME 12,642 11,969
Cost of risk 3.f (3,705) (3,643) Costs related to the comprehensive settlement with US authorities 3.g (6,000) (798)
OPERATING INCOME 2,937 7,528
Share of earnings of equity-method entities 5.m 408 537
Net gain on non-current assets 155 287
Goodwill 5.o (351) (251)
PRE-TAX INCOME 3,149 8,101
Corporate income tax 3.h (2,642) (2,680)
NET INCOME 507 5,421
Net income attributable to minority interests 350 603
NET INCOME ATTRIBUTABLE TO EQUITY HOLDERS 157 4,818
Basic earnings per share 8.a (0.07) 3.68
Diluted earnings per share 8.a (0.07) 3.67 (1) Restated according to IFRS 10 and 11 and the amendment to IAS 32 (see notes 1.a and 2).
- 5 -
Consolidated financial statements at 31 December 2014
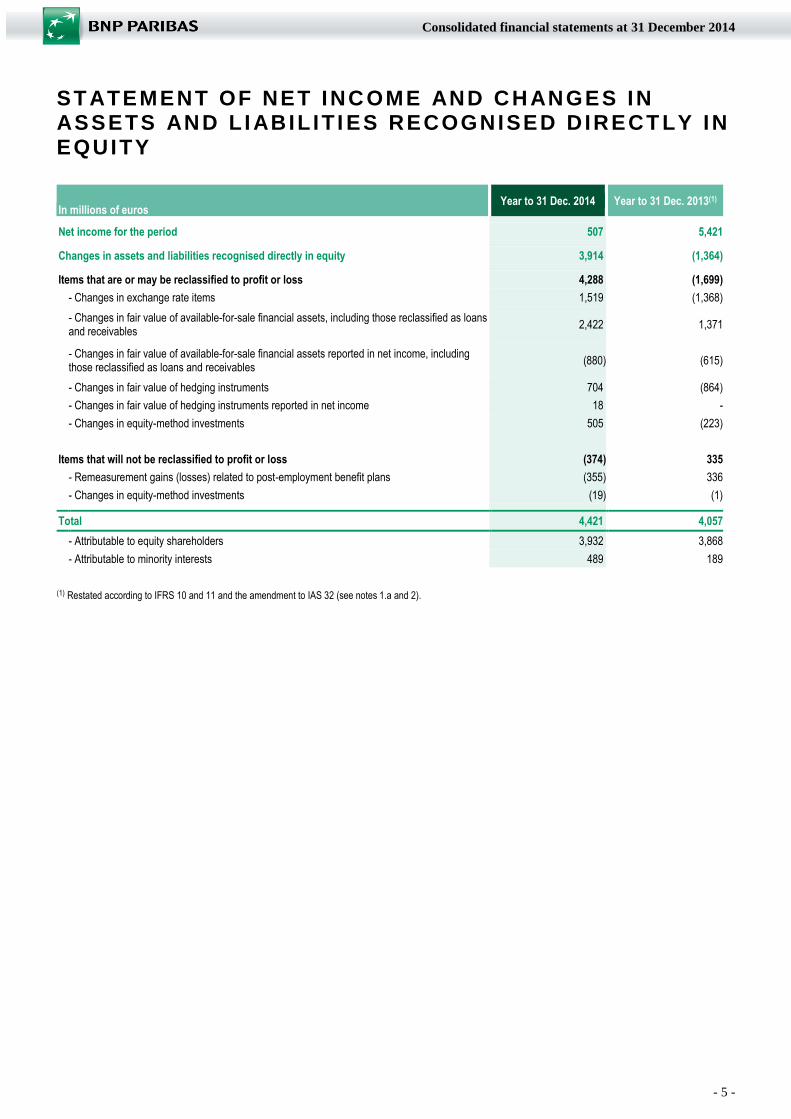
ST ATEMENT OF NET INC OME AND CH ANGES IN ASSETS AND L IABIL IT I ES RECOGNISED DIRECT LY IN EQUITY
In millions of euros Year to 31 Dec. 2014 Year to 31 Dec. 2013(1)
Net income for the period 507 5,421 Changes in assets and liabilities recognised directly in equity 3,914 (1,364) Items that are or may be reclassified to profit or loss 4,288 (1,699)
- Changes in exchange rate items 1,519 (1,368)
- Changes in fair value of available-for-sale financial assets, including those reclassified as loans and receivables 2,422 1,371
- Changes in fair value of available-for-sale financial assets reported in net income, including those reclassified as loans and receivables (880) (615)
- Changes in fair value of hedging instruments 704 (864)
- Changes in fair value of hedging instruments reported in net income 18 -
- Changes in equity-method investments 505 (223)
Items that will not be reclassified to profit or loss (374) 335
- Remeasurement gains (losses) related to post-employment benefit plans (355) 336
- Changes in equity-method investments (19) (1)
Total 4,421 4,057
- Attributable to equity shareholders 3,932 3,868
- Attributable to minority interests 489 189
(1) Restated according to IFRS 10 and 11 and the amendment to IAS 32 (see notes 1.a and 2).
- 6 -
Consolidated financial statements at 31 December 2014
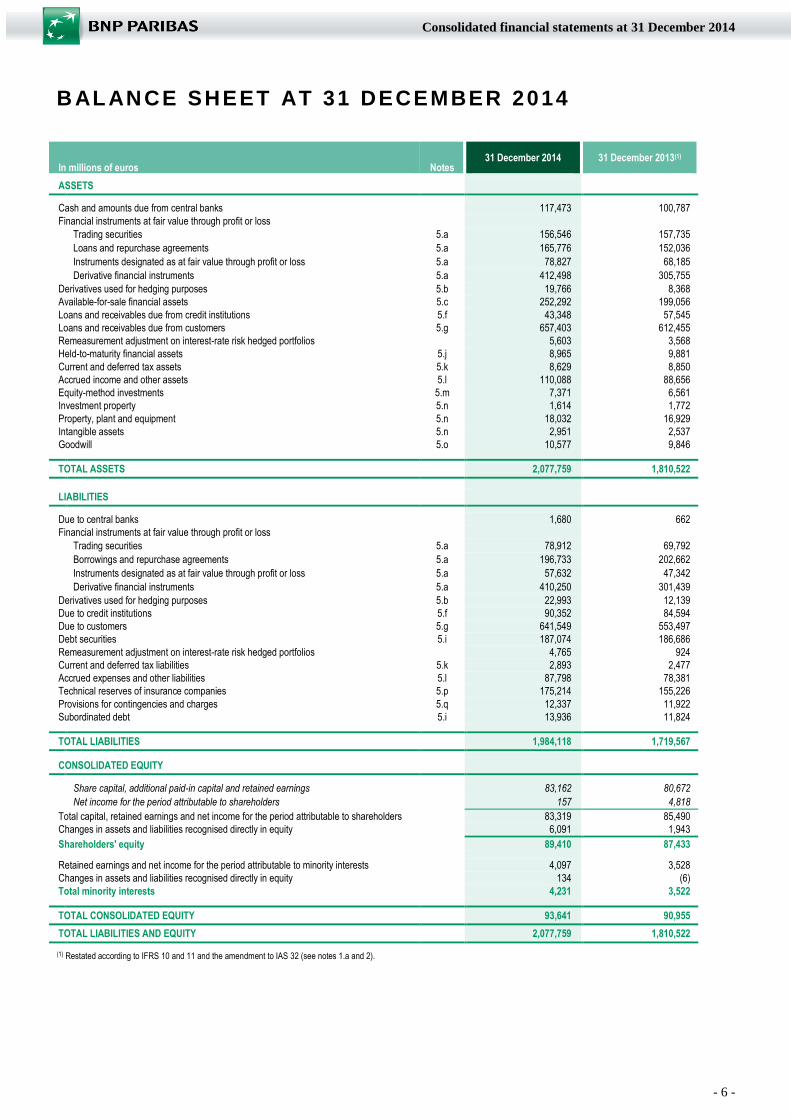
B AL ANCE SHEET AT 31 DECEMBER 2014
In millions of euros Notes 31 December 2014 31 December 2013(1)
ASSETS
Cash and amounts due from central banks 117,473 100,787 Financial instruments at fair value through profit or loss Trading securities 5.a 156,546 157,735 Loans and repurchase agreements 5.a 165,776 152,036 Instruments designated as at fair value through profit or loss 5.a 78,827 68,185 Derivative financial instruments 5.a 412,498 305,755 Derivatives used for hedging purposes 5.b 19,766 8,368 Available-for-sale financial assets 5.c 252,292 199,056 Loans and receivables due from credit institutions 5.f 43,348 57,545 Loans and receivables due from customers 5.g 657,403 612,455 Remeasurement adjustment on interest-rate risk hedged portfolios 5,603 3,568 Held-to-maturity financial assets 5.j 8,965 9,881 Current and deferred tax assets 5.k 8,629 8,850 Accrued income and other assets 5.l 110,088 88,656 Equity-method investments 5.m 7,371 6,561 Investment property 5.n 1,614 1,772 Property, plant and equipment 5.n 18,032 16,929 Intangible assets 5.n 2,951 2,537 Goodwill 5.o 10,577 9,846
TOTAL ASSETS 2,077,759 1,810,522
LIABILITIES
Due to central banks 1,680 662 Financial instruments at fair value through profit or loss Trading securities 5.a 78,912 69,792 Borrowings and repurchase agreements 5.a 196,733 202,662 Instruments designated as at fair value through profit or loss 5.a 57,632 47,342 Derivative financial instruments 5.a 410,250 301,439 Derivatives used for hedging purposes 5.b 22,993 12,139 Due to credit institutions 5.f 90,352 84,594 Due to customers 5.g 641,549 553,497 Debt securities 5.i 187,074 186,686 Remeasurement adjustment on interest-rate risk hedged portfolios 4,765 924 Current and deferred tax liabilities 5.k 2,893 2,477 Accrued expenses and other liabilities 5.l 87,798 78,381 Technical reserves of insurance companies 5.p 175,214 155,226 Provisions for contingencies and charges 5.q 12,337 11,922 Subordinated debt 5.i 13,936 11,824
TOTAL LIABILITIES 1,984,118 1,719,567
CONSOLIDATED EQUITY
Share capital, additional paid-in capital and retained earnings 83,162 80,672 Net income for the period attributable to shareholders 157 4,818 Total capital, retained earnings and net income for the period attributable to shareholders 83,319 85,490 Changes in assets and liabilities recognised directly in equity 6,091 1,943 Shareholders' equity 89,410 87,433 Retained earnings and net income for the period attributable to minority interests 4,097 3,528 Changes in assets and liabilities recognised directly in equity 134 (6) Total minority interests 4,231 3,522
TOTAL CONSOLIDATED EQUITY 93,641 90,955
TOTAL LIABILITIES AND EQUITY 2,077,759 1,810,522
(1) Restated according to IFRS 10 and 11 and the amendment to IAS 32 (see notes 1.a and 2).
- 7 -
Consolidated financial statements at 31 December 2014
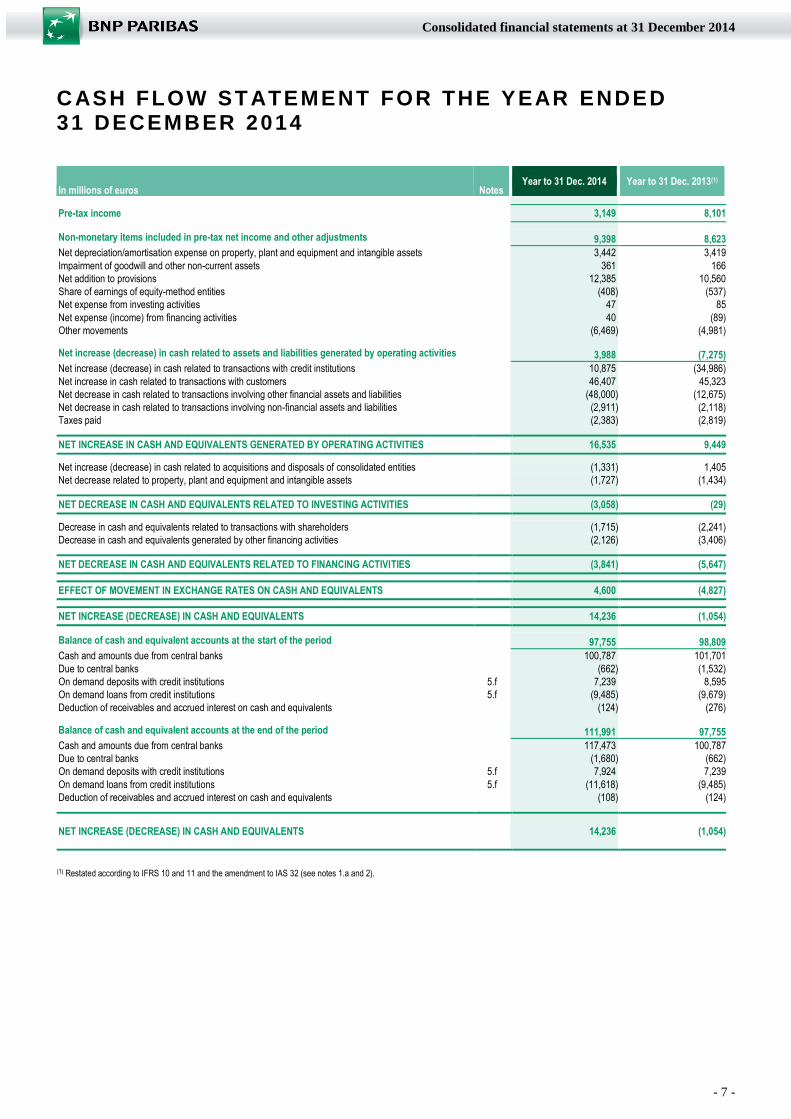
C ASH FLOW ST ATEMENT FOR THE YEAR ENDED 31 DECEMBER 2014
In millions of euros Notes Year to 31 Dec. 2014 Year to 31 Dec. 2013(1)
Pre-tax income 3,149 8,101
Non-monetary items included in pre-tax net income and other adjustments 9,398 8,623 Net depreciation/amortisation expense on property, plant and equipment and intangible assets 3,442 3,419 Impairment of goodwill and other non-current assets 361 166 Net addition to provisions 12,385 10,560 Share of earnings of equity-method entities (408) (537) Net expense from investing activities 47 85 Net expense (income) from financing activities 40 (89) Other movements (6,469) (4,981)
Net increase (decrease) in cash related to assets and liabilities generated by operating activities 3,988 (7,275) Net increase (decrease) in cash related to transactions with credit institutions 10,875 (34,986) Net increase in cash related to transactions with customers 46,407 45,323 Net decrease in cash related to transactions involving other financial assets and liabilities (48,000) (12,675) Net decrease in cash related to transactions involving non-financial assets and liabilities (2,911) (2,118) Taxes paid (2,383) (2,819)
NET INCREASE IN CASH AND EQUIVALENTS GENERATED BY OPERATING ACTIVITIES 16,535 9,449
Net increase (decrease) in cash related to acquisitions and disposals of consolidated entities (1,331) 1,405 Net decrease related to property, plant and equipment and intangible assets (1,727) (1,434)
NET DECREASE IN CASH AND EQUIVALENTS RELATED TO INVESTING ACTIVITIES (3,058) (29)
Decrease in cash and equivalents related to transactions with shareholders (1,715) (2,241) Decrease in cash and equivalents generated by other financing activities (2,126) (3,406)
NET DECREASE IN CASH AND EQUIVALENTS RELATED TO FINANCING ACTIVITIES (3,841) (5,647)
EFFECT OF MOVEMENT IN EXCHANGE RATES ON CASH AND EQUIVALENTS 4,600 (4,827)
NET INCREASE (DECREASE) IN CASH AND EQUIVALENTS 14,236 (1,054)
Balance of cash and equivalent accounts at the start of the period 97,755 98,809 Cash and amounts due from central banks 100,787 101,701 Due to central banks (662) (1,532) On demand deposits with credit institutions 5.f 7,239 8,595 On demand loans from credit institutions 5.f (9,485) (9,679) Deduction of receivables and accrued interest on cash and equivalents (124) (276)
Balance of cash and equivalent accounts at the end of the period 111,991 97,755 Cash and amounts due from central banks 117,473 100,787 Due to central banks (1,680) (662) On demand deposits with credit institutions 5.f 7,924 7,239 On demand loans from credit institutions 5.f (11,618) (9,485) Deduction of receivables and accrued interest on cash and equivalents (108) (124)
NET INCREASE (DECREASE) IN CASH AND EQUIVALENTS 14,236 (1,054)
(1) Restated according to IFRS 10 and 11 and the amendment to IAS 32 (see notes 1.a and 2).

- 8 -
Consolidated financial statements at 31 December 2014
ST ATEMENT OF CH ANGES IN SHAREHOLDERS’
Capital and retained earnings
Attributable to shareholders Minority interests
In millions of euros
Share capital and additional
paid-in capital
Undated Super
Subordinated Notes
Non-distributed reserves
Total Capital and
retained earnings
Preferred shares
eligible as Tier 1 capital
Total
Capital and retained earnings at 31 December 2012 (before IFRS 10 and 11) 26,714 7,241 48,263 82,218 7,409 752 8,161
Impact of IFRS 10 and IFRS 11 (151) (151) (54) (67) (121)
Capital and retained earnings at 1 January 2013 (1) 26,714 7,241 48,112 82,067 7,355 685 8,040
Appropriation of net income for 2012 (1,863) (1,863) (171) (171)
Increases in capital and issues 108 108
Reduction in capital (649) (1) (650) (685) (685)
Movements in own equity instruments (9) 22 (90) (77)
Share-based payment plans 49 49
Remuneration on preferred shares and undated super subordinated notes (266) (266) (39) (39)
Impact of internal transactions on minority shareholders (note 8.d) 78 78 (83) (83)
Movements in consolidation scope impacting minority shareholders (16) (16) (15) (15)
Acquisitions of additional interests or partial sales of interests (note 8.d) 911 911 (4,161) (4,161)
Changes in commitments to repurchase minority shareholders' interests (1) (1) (8) (8)
Other movements (1) (1) 55 55
Changes in assets and liabilities recognised directly in equity (1) 333 333 2 2
Net income for 2013 4,818 4,818 603 603
Interim dividend payments (10) (10)
Capital and retained earnings at 31 December 2013 (1) 26,812 6,614 52,064 85,490 3,528 3,528
Appropriation of net income for 2013 (1,866) (1,866) (107) (107)
Increases in capital and issues 53 53
Reduction in capital (30) (30)
Movements in own equity instruments 136 (25) (121) (10)
Share-based payment plans 19 19
Remuneration on preferred shares and undated super subordinated notes (238) (238) (1) (1)
Impact of internal transactions on minority shareholders (note 8.d)
Movements in consolidation scope impacting minority shareholders 367 73 440
Acquisitions of additional interests or partial sales of interests (note 8.d) 12 12 21 21
Changes in commitments to repurchase minority shareholders' interests 77 77 (130) (130)
Other movements 28 28 (3) (3)
Changes in assets and liabilities recognised directly in equity (373) (373) (1) (1)
Net income for 2014 157 157 350 350
Capital and retained earnings at 31 December 2014 26,971 6,589 49,759 83,319 4,024 73 4,097
(1) Restated according to IFRS 10 and 11 and the amendment to IAS 32 (see notes 1.a and 2).
- 9 -
Consolidated financial statements at 31 December 2014
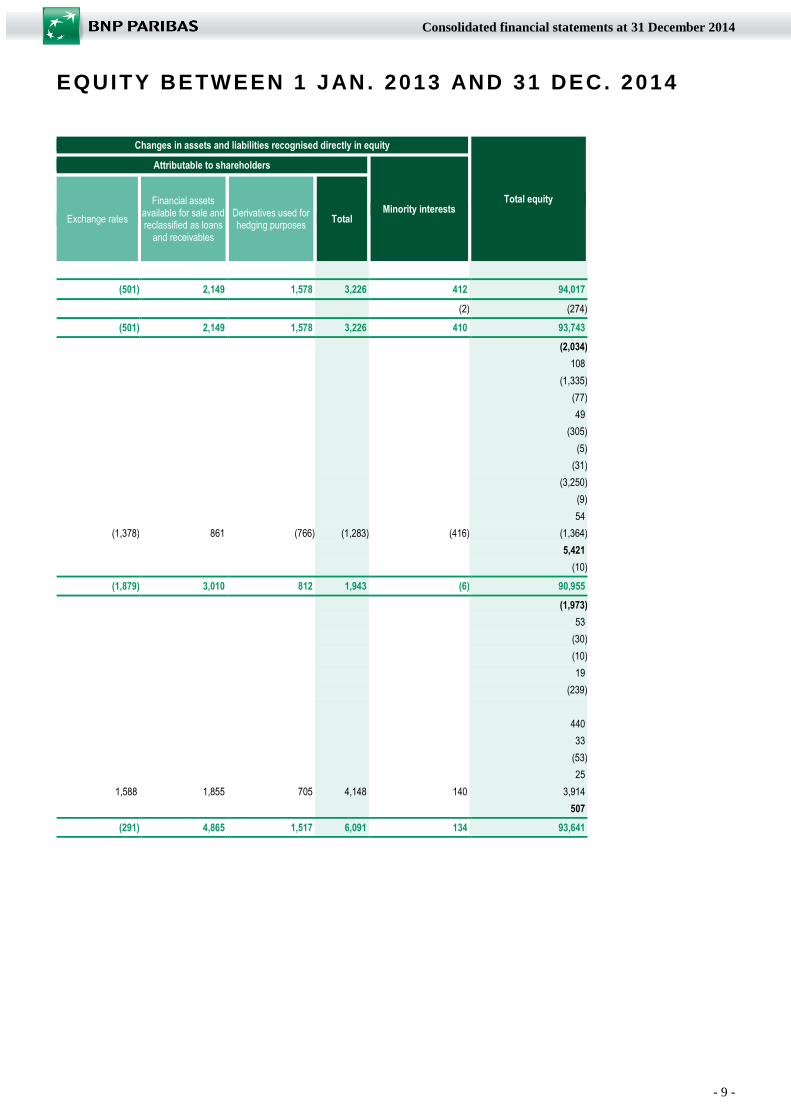
EQUITY BETWEEN 1 JAN. 2013 AND 31 DEC. 2014
Changes in assets and liabilities recognised directly in equity
Total equity
Attributable to shareholders
Minority interests Exchange rates
Financial assets available for sale and reclassified as loans
and receivables
Derivatives used for hedging purposes
Total
(501) 2,149 1,578 3,226 412 94,017
(2) (274)
(501) 2,149 1,578 3,226 410 93,743
(2,034)
108
(1,335)
(77)
49
(305)
(5)
(31)
(3,250)
(9)
54
(1,378) 861 (766) (1,283) (416) (1,364)
5,421
(10)
(1,879) 3,010 812 1,943 (6) 90,955
(1,973)
53
(30)
(10)
19
(239)
440
33
(53)
25
1,588 1,855 705 4,148 140 3,914
507
(291) 4,865 1,517 6,091 134 93,641
- 10 -
Consolidated financial statements at 31 December 2014
NOTES TO THE FINANCIAL STATEMENTS Prepared in accordance with International Financial Reporting Standards as adopted by the European Union
1 . SUMMARY OF S IGNIF ICANT ACCOUNTING POLICIES APPLIED BY THE BNP PARIB AS GROU P
1.a APPLICABLE ACCOUNTING STANDARDS
The consolidated financial statements of the BNP Paribas Group have been prepared in accordance with
international accounting standards (International Financial Reporting Standards – IFRS), as adopted for
use in the European Union1. Accordingly, certain provisions of IAS 39 on hedge accounting have been excluded, and the application of IFRIC 21 “Levies” (adopted by the European Union on 14 June 2014)
will be mandatory only for annual reporting periods beginning on or after 17 June 2014.
As of 1 January 2014, the Group has applied IFRS 10 “Consolidated Financial Statements”, IFRS 11
“Joint Arrangements”, IFRS 12 “Disclosure of Interests in Other Entities”, the amended IAS 28
“Investments in Associates and Joint Ventures” and the amendment to IAS 32 “Financial Instruments: Presentation – Offsetting Financial Assets and Financial Liabilities”, adopted on 29 December 2012 by
the European Union. As these standards and amendments have a retrospective effect, the comparative
financial statements as at 1 January and 31 December 2013 have been restated as presented in note 2.
The introduction of the other standards which are mandatory as of 1 January 2014 has no effect on the
2014 financial statements.
The Group did not choose to early-adopt the new standards, amendments, and interpretations adopted by the European Union, whose application in 2014 was optional.
The Group will apply the IFRIC 21 “Levies” interpretation in the consolidated financial statements as of
1 January 2015. The application of this interpretation as at 31 December 2014 would have triggered an
estimated increase of EUR 49 million in shareholders’ equity, including a non-material impact on the 2014 net income after tax.
Information on the nature and extent of risks relating to financial instruments as required by IFRS 7
“Financial Instruments: Disclosures” and to insurance contracts as required by IFRS 4 “Insurance
Contracts”, along with information on regulatory capital required by IAS 1 “Presentation of Financial
Statements” is presented in Chapter 5 of the Registration document. This information, which is an integral part of the notes to the BNP Paribas Group’s consolidated financial statements, is covered by
the opinion of the Statutory Auditors concerning the consolidated financial statements, and is identified
in the Annual Report by the word “Audited”.
The Group did not change its accounting principles following the asset quality review (AQR) performed by the European Central Bank in 2014.
(1) The full set of standards adopted for use in the European Union can be found on the website of the European Commission at: http://ec.europa.eu/internal_market/accounting/ias_en.htm#adopted-commission.
- 11 -
Consolidated financial statements at 31 December 2014
1.b CONSOLIDATION
1.b.1 SCOPE OF CONSOLIDATION
The consolidated financial statements of BNP Paribas include entities that are controlled by the Group,
jointly controlled, and under significant influence, with the exception of those entities whose
consolidation is regarded as immaterial to the Group. The consolidation of an entity is regarded as
immaterial if its contribution to the consolidated financial statements is below the following three
thresholds: EUR 15 million of consolidated revenues, EUR 1 million of consolidated net income before tax, EUR 500 million of total consolidated assets. Companies that hold shares in consolidated
companies are also consolidated.
Subsidiaries are consolidated from the date on which the Group obtains effective control. Entities under
temporary control are included in the consolidated financial statements until the date of disposal.
1.b.2 CONSOLIDATION METHODS
Controlled enterprises are fully consolidated. The Group controls a subsidiary when it is exposed, or
has rights, to variable returns from its involvement with the entity and has the ability to affect those
returns through its power over the entity.
For entities governed by voting rights, the Group generally controls the entity if it directly or indirectly
holds the majority of voting rights and if there are no other agreements altering the power of these
voting rights.
For structured entities defined as entities that are not governed by voting rights, such as when those
voting rights relate to administrative tasks only, whereas the relevant activities are directed by means of
contractual arrangements, the analysis of control shall consider the purpose and design of the entity,
the risks to which the entity is designed to be exposed and to what extent the Group absorbs the related
variability. The assessment of control shall consider all facts and circumstances able to determine the Group's practical ability to make decisions that could significantly affect its returns, even if such
decisions are contingent on uncertain future events or circumstances.
In assessing whether it has power, the Group considers only substantive rights which it holds or which
are held by third parties. For a right to be substantive, the holder must have the practical ability to
exercise that right when decisions about the relevant activities of the entity need to be made.
Control shall be reassessed if facts and circumstances indicate that there are changes to one or more of the elements of control.
Where the Group contractually holds the decision-making power, for instance where the Group acts as
fund manager, it shall determine whether it is acting as agent or principal. Indeed, when associated
with a certain level of exposure to the variability of returns, this decision-making power may indicate
that the Group is acting on its own account and that it thus has control over those entities.
Where the Group carries out an activity with one or more partners, sharing control by virtue of a
contractual agreement which requires unanimous consent on relevant activities (those that significantly
affect the entity’s returns), the Group exercises joint control over the activity. Where the jointly
controlled activity is structured through a separate vehicle in which the partners have rights to the net
assets, this joint venture is accounted for using the equity method. Where the jointly controlled activity is not structured through a separate vehicle or where the partners have rights to the assets and
obligations for the liabilities of the jointly controlled activity, the Group accounts for its share of the
assets, liabilities, revenues and expenses in accordance with the applicable IFRSs.
- 12 -
Consolidated financial statements at 31 December 2014
Enterprises over which the Group exercises significant influence (associates) are accounted for by the
equity method. Significant influence is the power to participate in the financial and operating policy decisions of an enterprise without exercising control. Significant influence is presumed to exist when
the Group holds, directly or indirectly, 20% or more of the voting power of an enterprise. Interests of
less than 20% are excluded from consolidation unless they represent a strategic investment and the
Group effectively exercises significant influence. This applies to companies developed in partnership
with other groups, where the BNP Paribas Group participates in strategic decisions of the enterprise
through representation on the Board of Directors or equivalent governing body, exercises influence over the enterprise’s operational management by supplying management systems or senior managers, or
provides technical assistance to support the enterprise’s development.
Changes in the net assets of associates (companies accounted for under the equity method) are
recognised on the assets side of the balance sheet under “Investments in equity-method entities” and in
the relevant component of shareholders’ equity. Goodwill on associates is also included under
“Investments in equity-method entities”.
Whenever there is an indication of impairment, the carrying amount of the investment consolidated
under the equity method (including goodwill) is subjected to an impairment test, by comparing its
recoverable value (the higher of value-in-use and market value less costs to sell) to its carrying amount.
Where appropriate, impairment is recognised under "Share of earnings of equity-method entities" in the
consolidated income statement and can be reversed at a later date.
If the Group’s share of losses of an equity-method entity equals or exceeds the carrying amount of its
investment in this entity, the Group discontinues including its share of further losses. The investment
is reported at nil value. Additional losses of the equity-method entity are provided for only to the extent
that the Group has a legal or constructive obligation to do so, or has made payments on behalf of this
entity.
Minority interests are presented separately in the consolidated profit and loss account and balance sheet within consolidated equity. The calculation of minority interests takes into account the
outstanding cumulative preferred shares classified as equity instruments issued by subsidiaries, when
such shares are held outside the Group.
As regards fully consolidated funds, units held by third-party investors are recognised as debts at fair
value through profit or loss, inasmuch as they are redeemable at market value at the subscriber’s initiative.
For transactions resulting in a loss of control, any equity interest retained by the Group is remeasured
at its fair value through profit or loss.
Realised gains and losses on investments in consolidated undertakings are recognised in the profit and
loss account under “Net gain on non-current assets”.
1.b.3 CONSOLIDATION PROCEDURES
The consolidated financial statements are prepared using uniform accounting policies for reporting like
transactions and other events in similar circumstances.
Elimination of intragroup balances and transactions
Intragroup balances arising from transactions between consolidated enterprises, and the transactions
themselves (including income, expenses and dividends), are eliminated. Profits and losses arising from
intragroup sales of assets are eliminated, except where there is an indication that the asset sold is
impaired. Unrealised gains and losses included in the value of available-for-sale assets are maintained
in the consolidated financial statements.
- 13 -
Consolidated financial statements at 31 December 2014
Translation of financial statements expressed in foreign currencies
The consolidated financial statements of BNP Paribas are prepared in euros.
The financial statements of enterprises whose functional currency is not the euro are translated using
the closing rate method. Under this method, all assets and liabilities, both monetary and non-monetary,
are translated using the spot exchange rate at the balance sheet date. Income and expense items are
translated at the average rate for the period.
The same method is applied to the financial statements of enterprises located in hyperinflationary
economies, after adjusting for the effects of inflation by applying a general price index.
Differences arising from the translation of balance sheet items and profit and loss items are recorded in
shareholders’ equity under “Exchange rates” for the portion attributable to shareholders, and in
“Minority interests” for the portion attributable to outside investors. Under the optional treatment
permitted by IFRS 1, the Group has reset to zero all translation differences, by booking all cumulative
translation differences attributable to shareholders and to minority interests in the opening balance
sheet at 1 January 2004 to retained earnings.
On liquidation or disposal of some or all of an interest held in a foreign enterprise located outside the
euro zone, leading to a change in the nature of the investment (loss of control, loss of significant
influence or loss of joint control without keeping a significant influence), the cumulative translation
adjustment at the date of liquidation or sale, determined according to the step method, is recognised in
the profit and loss account.
Should the interest percentage held change without any modification in the nature of the investment,
the translation adjustment is reallocated between the portion attributable to shareholders and that
attributable to minority interests, if the enterprise is fully consolidated. For enterprises consolidated
under the equity method, the portion related to the interest sold is recognised in the profit and loss
account.
1.b.4 BUSINESS COMBINATIONS AND MEASUREMENT OF GOODWILL
Business combinations
Business combinations are accounted for using the purchase method.
Under this method, the acquiree’s identifiable assets and liabilities assumed are measured at fair value
at the acquisition date except for non-current assets classified as assets held for sale, which are
accounted for at fair value less costs to sell.
The acquiree’s contingent liabilities are not recognised in the consolidated balance sheet unless they
represent a present obligation on the acquisition date and their fair value can be measured reliably.
The cost of a business combination is the fair value, at the date of exchange, of assets given, liabilities
incurred or assumed, and equity instruments issued to obtain control of the acquiree. Costs directly
attributable to the business combination are treated as a separate transaction and recognised through
profit or loss.
Any contingent consideration is included in the cost, as soon as control is obtained, at fair value on the
date when control was acquired. Subsequent changes in the value of any contingent consideration
recognised as a financial liability are recognised through profit or loss.
The Group may recognise any adjustments to the provisional accounting within 12 months of the
acquisition date.
Goodwill represents the difference between the cost of the combination and the acquirer’s interest in the
net fair value of the identifiable assets and liabilities of the acquiree at the acquisition date. Positive
goodwill is recognised in the acquirer’s balance sheet, while negative goodwill is recognised immediately
in profit or loss, on the acquisition date. Minority interests are measured at their share of the fair value
of the acquiree’s identifiable assets and liabilities. However, for each business combination, the Group
can elect to measure minority interests at fair value, in which case a proportion of goodwill is allocated to them. To date, the Group has never used this latter option.
- 14 -
Consolidated financial statements at 31 December 2014
Goodwill is recognised in the functional currency of the acquiree and translated at the closing exchange
rate.
On the acquisition date, any previously held equity interest in the acquiree is remeasured at its fair value through profit or loss. In the case of a step acquisition, the goodwill is therefore determined by
reference to the acquisition-date fair value.
Since the revised IFRS 3 is applied prospectively, business combinations completed prior to 1 January
2010 were not restated for the effects of changes to IFRS 3.
As permitted under IFRS 1, business combinations that took place before 1 January 2004 and were
recorded in accordance with the previously applicable accounting standards (French GAAP), have not been restated in accordance with the principles of IFRS 3.
Measurement of goodwill
The BNP Paribas Group tests goodwill for impairment on a regular basis.
- Cash-generating units
The BNP Paribas Group has split all its activities into cash-generating units2 representing major
business lines. This split is consistent with the Group’s organisational structure and management
methods, and reflects the independence of each unit in terms of results and management approach. It is reviewed on a regular basis in order to take account of events likely to affect the composition of cash-
generating units, such as acquisitions, disposals and major reorganisations.
- Testing cash-generating units for impairment
Goodwill allocated to cash-generating units is tested for impairment annually and whenever there is an
indication that a unit may be impaired, by comparing the carrying amount of the unit with its
recoverable amount. If the recoverable amount is less than the carrying amount, an irreversible
impairment loss is recognised, and the goodwill is written down by the excess of the carrying amount of
the unit over its recoverable amount.
- Recoverable amount of a cash-generating unit
The recoverable amount of a cash-generating unit is the higher of the fair value of the unit less costs to
sell, and its value in use.
Fair value is the price that would be obtained from selling the unit at the market conditions prevailing
at the date of measurement, as determined mainly by reference to actual prices of recent transactions
involving similar entities or on the basis of stock market multiples for comparable companies.
Value in use is based on an estimate of the future cash flows to be generated by the cash-generating
unit, derived from the annual forecasts prepared by the unit’s management and approved by Group
Executive Management, and from analyses of changes in the relative positioning of the unit’s activities on their market. These cash flows are discounted at a rate that reflects the return that investors would
require from an investment in the business sector and region involved.
(2) As defined by IAS 36.
- 15 -
Consolidated financial statements at 31 December 2014
1.c FINANCIAL ASSETS AND FINANCIAL LIABILITIES
1.c.1 LOANS AND RECEIVABLES
Loans and receivables include credit provided by the Group, the Group’s share in syndicated loans, and
purchased loans that are not quoted in an active market, unless they are held for trading purposes.
Loans that are quoted in an active market are classified as “Available-for-sale financial assets” and
measured using the methods applicable to this category.
Loans and receivables are initially measured at fair value or equivalent, which is usually the net amount disbursed at inception including directly attributable origination costs and certain types of fees
or commission (syndication commission, commitment fees and handling charges) that are regarded as
an adjustment to the effective interest rate on the loan.
Loans and receivables are subsequently measured at amortised cost. The income from the loan,
representing interest plus transaction costs and fees/commission included in the initial value of the loan, is calculated using the effective interest method and taken to profit or loss over the life of the loan.
Commission earned on financing commitments prior to the inception of a loan is deferred and included
in the value of the loan when the loan is made.
Commission earned on financing commitments when the probability of drawdown is low, or when there
is uncertainty as to the timing and amount of drawdowns, is recognised on a straight-line basis over the
life of the commitment.
1.c.2 REGULATED SAVINGS AND LOAN CONTRACTS
Home savings accounts (Comptes Épargne-Logement – “CEL”) and home savings plans (Plans d’Épargne
Logement – “PEL”) are government-regulated retail products sold in France. They combine a savings
phase and a loan phase which are inseparable, with the loan phase contingent upon the savings phase.
These products contain two types of obligations for BNP Paribas: an obligation to pay interest on the
savings for an indefinite period, at a rate set by the government at the inception of the contract (in the case of PEL products) or at a rate reset every six months using an indexation formula set by law (in the
case of CEL products); and an obligation to lend to the customer (at the customer’s option) an amount
contingent upon the rights acquired during the savings phase, at a rate set at the inception of the
contract (in the case of PEL products) or at a rate contingent upon the savings phase (in the case of CEL
products).
The Group’s future obligations with respect to each generation (in the case of PEL products, a generation comprises all products with the same interest rate at inception; in the case of CEL products,
all such products constitute a single generation) are measured by discounting potential future earnings
from at-risk outstandings for that generation.
At-risk outstandings are estimated on the basis of a historical analysis of customer behaviour, and are
equivalent to:
- for the loan phase: statistically probable loans outstanding and actual loans outstanding;
- for the savings phase: the difference between statistically probable outstandings and minimum
expected outstandings, with minimum expected outstandings being deemed equivalent to
unconditional term deposits.
Earnings for future periods from the savings phase are estimated as the difference between the
reinvestment rate and the fixed savings interest rate on at-risk savings outstanding for the period in question. Earnings for future periods from the loan phase are estimated as the difference between the
refinancing rate and the fixed loan interest rate on at-risk loans outstanding for the period in question.
The reinvestment rate for savings and the refinancing rate for loans are derived from the swap yield
curve and from the spreads expected on financial instruments of similar type and maturity. Spreads are
- 16 -
Consolidated financial statements at 31 December 2014
determined on the basis of actual spreads on fixed rate home loans in the case of the loan phase and
products offered to individual clients in the case of the savings phase. In order to reflect the uncertainty
of future interest rate trends, and the impact of such trends on customer behaviour models and on at-risk outstandings, the obligations are estimated using the Monte-Carlo method.
Where the sum of the Group’s estimated future obligations with respect to the savings and loan phases
of any generation of contracts indicates a potentially unfavourable situation for the Group, a provision
is recognised (with no offset between generations) in the balance sheet in “Provisions for contingencies
and charges”. Movements in this provision are recognised as interest income in the profit and loss
account.
1.c.3 SECURITIES
Categories of securities
Securities held by the Group are classified into one of four categories.
- Financial assets at fair value through profit or loss
Apart from derivative instruments, financial assets at fair value through profit or loss are composed of:
- financial assets held for trading purposes;
- financial assets that the Group has designated, on initial recognition, at fair value through profit
or loss using the fair value option available under IAS 39. The conditions for applying the fair
value option are set out in section 1.c.11.
Securities in this category are measured at fair value at the balance sheet date. Transaction costs are
directly posted in the profit and loss account. Changes in fair value (excluding accrued interest on
fixed-income securities) are presented in the profit and loss account under “Net gain/loss on financial
instruments at fair value through profit or loss”, along with dividends from variable-income securities
and realised gains and losses on disposal.
Income earned on fixed-income securities classified into this category is shown under “Interest income”
in the profit and loss account.
Fair value incorporates an assessment of the counterparty risk on these securities.
- Loans and receivables
Securities with fixed or determinable payments that are not traded on an active market, apart from
securities for which the owner may not recover almost all of its initial investment due to reasons other
than credit deterioration, are classified as “Loans and receivables” if they do not meet the criteria to be
classified as “Financial assets at fair value through profit or loss”. These securities are measured and
recognised as described in section 1.c.1.
- Held-to-maturity financial assets
Held-to-maturity financial assets are investments with fixed or determinable payments and fixed
maturity that the Group has the intention and ability to hold until maturity. Hedges contracted to cover assets in this category against interest rate risk do not qualify for hedge accounting as defined in IAS
39.

- 17 -
Consolidated financial statements at 31 December 2014
Assets in this category are accounted for at amortised cost using the effective interest method, which
builds in amortisation of premium and discount (corresponding to the difference between the purchase
price and redemption value of the asset) and acquisition costs (where material). Income earned from this category of assets is included in “Interest income” in the profit and loss account.
- Available-for-sale financial assets
Available-for-sale financial assets are fixed-income and variable-income securities other than those
classified as “fair value through profit or loss” or “held-to-maturity” or “loans and receivables”.
Assets included in the available-for-sale category are initially recorded at fair value, plus transaction
costs where material. At the balance sheet date, they are remeasured at fair value, with changes in fair
value (excluding accrued interest) shown on a separate line in shareholders’ equity. Upon disposal,
these unrealised gains and losses are transferred from shareholders’ equity to the profit and loss
account, where they are shown on the line “Net gain/loss on available-for-sale financial assets”. The
same applies in the event of impairment.
Income recognised using the effective interest method for fixed-income available-for-sale securities is
recorded under “Interest income” in the profit and loss account. Dividend income from variable-income
securities is recognised under “Net gain/loss on available-for-sale financial assets” when the Group’s
right to receive payment is established.
Repurchase agreements and securities lending/borrowing
Securities temporarily sold under repurchase agreements continue to be recorded in the Group’s
balance sheet in the category of securities to which they belong. The corresponding liability is
recognised in the appropriate debt category on the balance sheet except in the case of repurchase
agreements contracted for trading purposes where the corresponding liability is classified under “Financial liabilities at fair value through profit or loss”.
Securities temporarily acquired under reverse repurchase agreements are not recognised in the Group’s
balance sheet. The corresponding receivable is recognised under “Loans and receivables” except in the
case of reverse repurchase agreements contracted for trading purposes, where the corresponding receivable is recognised under “Financial assets at fair value through profit or loss”.
Securities lending transactions do not result in derecognition of the lent securities, and securities
borrowing transactions do not result in recognition of the borrowed securities on the balance sheet. In
cases where the borrowed securities are subsequently sold by the Group, the obligation to deliver the
borrowed securities on maturity is recognised on the balance sheet under “Financial liabilities at fair
value through profit or loss”.
Date of recognition for securities transactions
Securities classified as at fair value through profit or loss, held-to-maturity or available-for-sale
financial assets are recognised at the trade date.
Regardless of their classification (at fair value through profit or loss, loans and receivables or debt),
temporary sales of securities as well as sales of borrowed securities are initially recognised at the
settlement date. For reverse repurchase agreements and repurchase agreements, a financing
commitment, respectively given and received, is recognized between the trade date and the settlement
date when the transactions are recognised, respectively, as "Loans and receivables" and "Liabilities". When reverse repurchase agreements and repurchase agreements are recognised, respectively, as
"Financial assets at fair value through profit or loss" and "Financial liabilities at fair value through
profit or loss", the repurchase commitment is recognised as a derivative financial instrument.
- 18 -
Consolidated financial statements at 31 December 2014
Securities transactions are carried on the balance sheet until the Group’s rights to receive the related
cash flows expire, or until the Group has substantially transferred all the risks and rewards related to
ownership of the securities.
1.c.4 FOREIGN CURRENCY TRANSACTIONS
The methods used to account for assets and liabilities relating to foreign currency transactions entered
into by the Group, and to measure the foreign exchange risk arising on such transactions, depend on
whether the asset or liability in question is classified as a monetary or a non-monetary item.
- Monetary assets and liabilities3 expressed in foreign currencies
Monetary assets and liabilities expressed in foreign currencies are translated into the functional
currency of the relevant Group entity at the closing rate. Translation differences are recognised
in the profit and loss account, except for those arising from financial instruments designated as a cash flow hedge or a net foreign investment hedge, which are recognised in shareholders’
equity.
- Non-monetary assets and liabilities expressed in foreign currencies
Non-monetary assets may be measured either at historical cost or at fair value. Non-monetary
assets expressed in foreign currencies are translated using the exchange rate at the date of the
transaction if they are measured at historical cost, and at the closing rate if they are measured
at fair value.
Translation differences on non-monetary assets expressed in foreign currencies and measured
at fair value (variable-income securities) are recognised in the profit and loss account if the asset is classified under “Financial assets at fair value through profit or loss”, and in shareholders’
equity if the asset is classified under “Available-for-sale financial assets”, unless the financial
asset in question is designated as an item hedged against foreign exchange risk in a fair value
hedging relationship, in which case the translation difference is recognised in the profit and loss
account.
1.c.5 IMPAIRMENT AND RESTRUCTURING OF FINANCIAL ASSETS
Doubtful assets
Doubtful assets are defined as assets where the Bank considers that there is a risk that the debtors will
be unable to honour all or part of their commitments.
Impairment of loans and receivables and held-to-maturity financial assets, provisions for financing and guarantee commitments
An impairment loss is recognised against loans and held-to-maturity financial assets where (i) there is
objective evidence of a decrease in value as a result of an event occurring after inception of the loan or
acquisition of the asset; (ii) the event affects the amount or timing of future cash flows; and (iii) the
consequences of the event can be reliably measured. Loans are initially assessed for evidence of impairment on an individual basis, and subsequently on a portfolio basis. Similar principles are applied
(3) Monetary assets and liabilities are assets and liabilities to be received or paid in fixed or determinable amounts of cash.
- 19 -
Consolidated financial statements at 31 December 2014
to financing and guarantee commitments given by the Group, with the probability of drawdown taken
into account in any assessment of financing commitments.
At an individual level, objective evidence that a financial asset is impaired includes observable data
regarding the following events:
- the existence of accounts that are more than three months past due (six months past due for real
estate loans and loans to local authorities);
- knowledge or indications that the borrower meets significant financial difficulty, such that a risk
can be considered to have arisen regardless of whether the borrower has missed any payments;
- concessions with respect to the credit terms granted to the borrower that the lender would not have
considered had the borrower not been meeting financial difficulty (see section “Restructuring of
assets classified as "Loans and receivables"”).
The amount of the impairment is the difference between the carrying amount before impairment and
the present value, discounted at the original effective interest rate of the asset, of those components (principal, interest, collateral, etc.) regarded as recoverable. Changes in the amount of impairment
losses are recognised in the profit and loss account under “Cost of risk”. Any subsequent decrease in an
impairment loss that can be related objectively to an event occurring after the impairment loss was
recognised is credited to the profit and loss account, also under “Cost of risk”. Once an asset has been
impaired, the theoretical income earned on the carrying amount of the asset calculated at the original effective interest rate used to discount the estimated recoverable cash flows is recognised under
“Interest income” in the profit and loss account.
Impairment losses on loans and receivables are usually recorded in a separate provision account which
reduces the amount for which the loan or receivable was recorded in assets upon initial recognition.
Provisions relating to off-balance sheet financial instruments, financing and guarantee commitments or disputes are recognised in liabilities. Impaired receivables are written off in whole or in part and the
corresponding provision is reversed for the amount of the loss when all other means available to the
Bank for recovering the receivables or guarantees have failed, or when all or part of the receivables have
been waived.
Counterparties that are not individually impaired are risk-assessed on a portfolio basis with similar
characteristics. This assessment draws upon an internal rating system based on historical data,
adjusted as necessary to reflect circumstances prevailing at the balance sheet date. It enables the
Group to identify groups of counterparties which, as a result of events occurring since inception of the
loans, have collectively acquired a probability of default at maturity that provides objective evidence of
impairment of the entire portfolio, but without it being possible at that stage to allocate the impairment to individual counterparties. This assessment also estimates the amount of the loss on the portfolios in
question, taking account of trends in the economic cycle during the assessment period. Changes in the
amount of portfolio impairments are recognised in the profit and loss account under “Cost of risk”.
Based on the experienced judgement of the Bank’s divisions or Risk Management, the Group may
recognise additional collective impairment provisions with respect to a given economic sector or geographic area affected by exceptional economic events. This may be the case when the consequences
of these events cannot be measured with sufficient accuracy to adjust the parameters used to
determine the collective provision recognised against affected portfolios of loans with similar
characteristics.
Impairment of available-for-sale financial assets
Impairment of available-for-sale financial assets (which mainly comprise securities) is recognised on an
individual basis if there is objective evidence of impairment as a result of one or more events occurring
since acquisition.
- 20 -
Consolidated financial statements at 31 December 2014
In the case of variable-income securities quoted in an active market, the control system identifies
securities that may be impaired on a long term basis and is based on criteria such as a significant
decline in quoted price below the acquisition cost or a prolonged decline, which prompts the Group to carry out an additional individual qualitative analysis. This may lead to the recognition of an
impairment loss calculated on the basis of the quoted price.
Apart from the identification criteria, the Group has determined three indications of impairment, one
being a significant decline in price, defined as a fall of more than 50% of the acquisition price, another
being a prolonged decline over two consecutive years and the final one being a decline on average of at
least 30% over an observation period of one year. The Group believes that a period of two years is what is necessary for a moderate decline in price below the purchase cost to be considered as something
more than just the effect of random volatility inherent in the stock markets or a cyclical change lasting
a few years, but which represents a lasting phenomenon justifying an impairment.
A similar method is applied for variable-income securities not quoted in an active market. Any
impairment is then determined based on the model value.
In the case of fixed-income securities, impairment is assessed based on the same criteria applied to individually impaired loans and receivables. For securities quoted in an active market, impairment is
determined based on the quoted price. For all the others, it is determined based on model value.
Impairment losses taken against variable-income securities are recognised as a component of Revenues
on the line “Net gain/loss on available-for-sale financial assets”, and may not be reversed through the
profit and loss account until these securities are sold. Any subsequent decline in fair value constitutes an additional impairment loss, recognised in the profit and loss account.
Impairment losses taken against fixed-income securities are recognised under “Cost of risk”, and may
be reversed through the profit and loss account in the event of an increase in fair value that relates
objectively to an event occurring after the last impairment was recognised.
Restructuring of assets classified as "Loans and receivables"
The restructuring of an asset classified in loans and receivables is considered to be a troubled debt restructuring when the Bank, for economic or legal reasons related to the borrower's financial
difficulties, agrees to a modification of terms of the original transaction that it would not otherwise
consider, resulting in the borrower's contractual obligation to the Bank, measured at present value,
being reduced compared with the original terms.
At the time of restructuring, a discount is applied to the loan to reduce its carrying amount to the present value of the new expected future cash flows discounted at the original effective interest rate.
The decrease in the asset value is recognised in profit and loss under "Cost of risk".
When the restructuring consists of a partial or full settlement with other substantially different assets,
the original debt (see note 1.c.14) and the assets received in settlement are recognised at their fair value
on the settlement date. The difference in value is recognised in profit or loss under "Cost of risk".
- 21 -
Consolidated financial statements at 31 December 2014
1.c.6 RECLASSIFICATION OF FINANCIAL ASSETS
The only authorised reclassifications of financial assets are the following:
- For a non-derivative financial asset which is no longer held for the purposes of selling it in the
near-term, out of “Financial assets at fair value through profit or loss” and into:
“Loans and receivables” if the asset meets the definition for this category and the Group has the intention and ability to hold the asset for the foreseeable future or until maturity; or
Other categories only under rare circumstances when justified and provided that the reclassified assets meet the conditions applicable to the host portfolio.
- Out of “Available-for-sale financial assets” and into:
“Loans and receivables” with the same conditions as set out above for "Financial assets at fair value through profit or loss;
“Held-to-maturity financial assets,” for assets that have a maturity, or “Financial assets at cost,” for unlisted variable-income assets.
Financial assets are reclassified at fair value, or at the value calculated by a model, on the reclassification date. Any derivatives embedded in the reclassified financial assets are recognised
separately and changes in fair value are recognised through profit or loss.
After reclassification, assets are recognised according to the provisions applied to the host portfolio. The
transfer price on the reclassification date is deemed to be the initial cost of the asset for the purpose of
determining any impairment.
In the event of reclassification from "Available-for-sale financial assets" to another category, gains or
losses previously recognised through equity are amortised to profit or loss over the residual life of the
instrument using the effective interest method.
Any upward revisions to the estimated recoverable amounts are recognised through an adjustment to
the effective interest rate as of the date on which the estimate is revised. Downward revisions are
recognised through an adjustment to the financial asset's carrying amount.
1.c.7 ISSUES OF DEBT SECURITIES
Financial instruments issued by the Group are qualified as debt instruments if the Group company
issuing the instruments has a contractual obligation to deliver cash or another financial asset to the
holder of the instrument. The same applies if the Group is required to exchange financial assets or financial liabilities with another entity under conditions that are potentially unfavourable to the Group,
or to deliver a variable number of the Group’s own equity instruments.
Issues of debt securities are initially recognised at the issue value including transaction costs, and are
subsequently measured at amortised cost using the effective interest method.
Bonds redeemable for or convertible into equity instruments of the Group are accounted for as hybrid
instruments with a debt component and an equity component, determined on initial recognition.
1.c.8 OWN EQUITY INSTRUMENTS AND OWN EQUITY INSTRUMENT DERIVATIVES
The term “own equity instruments” refers to shares issued by the parent company (BNP Paribas SA) and
by its fully consolidated subsidiaries. External costs that are directly attributable to an issue of new
shares are deducted from equity net of all related taxes.
Own equity instruments held by the Group, also known as treasury shares, are deducted from
consolidated shareholders’ equity irrespective of the purpose for which they are held. Gains and losses
arising on such instruments are eliminated from the consolidated profit and loss account.
- 22 -
Consolidated financial statements at 31 December 2014
When the Group acquires equity instruments issued by subsidiaries under the exclusive control of
BNP Paribas, the difference between the acquisition price and the share of net assets acquired is
recorded in retained earnings attributable to BNP Paribas shareholders. Similarly, the liability corresponding to put options granted to minority shareholders in such subsidiaries, and changes in the
value of that liability, are offset initially against minority interests, with any surplus offset against
retained earnings attributable to BNP Paribas shareholders. Until these options have been exercised,
the portion of net income attributable to minority interests is allocated to minority interests in the profit
and loss account. A decrease in the Group’s interest in a fully consolidated subsidiary is recognised in
the Group's accounts as a change in shareholders' equity.
Own equity instrument derivatives are treated as follows, depending on the method of settlement:
- as equity instruments if they are settled by physical delivery of a fixed number of own equity
instruments for a fixed amount of cash or other financial asset. Such instruments are not revalued;
- as derivatives if they are settled in cash, or by choice, depending on whether they are settled by
physical delivery of the shares or in cash. Changes in value of such instruments are taken to the profit and loss account.
If the contract includes an obligation, whether contingent or not, for the bank to repurchase its own
shares, the bank must recognise the debt at its present value with an offsetting entry in equity.
1.c.9 DERIVATIVE INSTRUMENTS AND HEDGE ACCOUNTING
All derivative instruments are recognised in the balance sheet on the trade date at the transaction price,
and are remeasured to fair value on the balance sheet date.
Derivatives held for trading purposes
Derivatives held for trading purposes are recognised in the balance sheet in “Financial assets at fair
value through profit or loss” when their fair value is positive, and in “Financial liabilities at fair value
through profit or loss” when their fair value is negative. Realised and unrealised gains and losses are
recognised in the profit and loss account on the line “Net gain/loss on financial instruments at fair value through profit or loss”.
Derivatives and hedge accounting
Derivatives contracted as part of a hedging relationship are designated according to the purpose of the
hedge.
Fair value hedges are particularly used to hedge interest rate risk on fixed rate assets and liabilities, both for identified financial instruments (securities, debt issues, loans, borrowings) and for portfolios of
financial instruments (in particular, demand deposits and fixed rate loans).
Cash flow hedges are particularly used to hedge interest rate risk on floating-rate assets and liabilities,
including rollovers, and foreign exchange risks on highly probable forecast foreign currency revenues.
At the inception of the hedge, the Group prepares formal documentation which details the hedging relationship, identifying the instrument, or portion of the instrument, or portion of risk that is being
hedged, the hedging strategy and the type of risk hedged, the hedging instrument, and the methods
used to assess the effectiveness of the hedging relationship.
On inception and at least quarterly, the Group assesses, in consistency with the original
documentation, the actual (retrospective) and expected (prospective) effectiveness of the hedging
relationship. Retrospective effectiveness tests are designed to assess whether the ratio of actual changes in the fair value or cash flows of the hedging instrument to those in the hedged item is within a range of
80% to 125%. Prospective effectiveness tests are designed to ensure that expected changes in the fair
value or cash flows of the derivative over the residual life of the hedge adequately offset those of the
- 23 -
Consolidated financial statements at 31 December 2014
hedged item. For highly probable forecast transactions, effectiveness is assessed largely on the basis of
historical data for similar transactions.
Under IAS 39 as adopted by the European Union, which excludes certain provisions on portfolio hedging, interest rate risk hedging relationships based on portfolios of assets or liabilities qualify for fair
value hedge accounting as follows:
- the risk designated as being hedged is the interest rate risk associated with the interbank rate
component of interest rates on commercial banking transactions (loans to customers, savings
accounts and demand deposits);
- the instruments designated as being hedged correspond, for each maturity band, to a portion of the interest rate gap associated with the hedged underlyings;
- the hedging instruments used consist exclusively of “plain vanilla” swaps;
- prospective hedge effectiveness is established by the fact that all derivatives must, on inception,
have the effect of reducing interest rate risk in the portfolio of hedged underlyings. Retrospectively,
a hedge will be disqualified from hedge accounting once a shortfall arises in the underlyings
specifically associated with that hedge for each maturity band (due to prepayment of loans or withdrawals of deposits).
The accounting treatment of derivatives and hedged items depends on the hedging strategy.
In a fair value hedging relationship, the derivative instrument is remeasured at fair value in the balance
sheet, with changes in fair value recognised in profit or loss in “Net gain/loss on financial instruments at fair value through profit or loss”, symmetrically with the remeasurement of the hedged item to reflect
the hedged risk. In the balance sheet, the fair value remeasurement of the hedged component is
recognised in accordance with the classification of the hedged item in the case of a hedge of identified
assets and liabilities, or under “Remeasurement adjustment on interest rate risk hedged portfolios” in
the case of a portfolio hedging relationship.
If a hedging relationship ceases or no longer fulfils the effectiveness criteria, the hedging instrument is transferred to the trading book and accounted for using the treatment applied to this category. In the
case of identified fixed-income instruments, the remeasurement adjustment recognised in the balance
sheet is amortised at the effective interest rate over the remaining life of the instrument. In the case of
interest rate risk hedged fixed-income portfolios, the adjustment is amortised on a straight-line basis
over the remainder of the original term of the hedge. If the hedged item no longer appears in the balance sheet, in particular due to prepayments, the adjustment is taken to the profit and loss account
immediately.
In a cash flow hedging relationship, the derivative is measured at fair value in the balance sheet, with
changes in fair value taken to shareholders’ equity on a separate line, “Unrealised or deferred gains or
losses”. The amounts taken to shareholders’ equity over the life of the hedge are transferred to the profit
and loss account under “Net interest income” as and when the cash flows from the hedged item impact profit or loss. The hedged items continue to be accounted for using the treatment specific to the
category to which they belong.
If the hedging relationship ceases or no longer fulfils the effectiveness criteria, the cumulative amounts
recognised in shareholders’ equity as a result of the remeasurement of the hedging instrument remain
in equity until the hedged transaction itself impacts profit or loss, or until it becomes clear that the transaction will not occur, at which point they are transferred to the profit and loss account.
If the hedged item ceases to exist, the cumulative amounts recognised in shareholders’ equity are
immediately taken to the profit and loss account.
Whatever the hedging strategy used, any ineffective portion of the hedge is recognised in the profit and
loss account under “Net gain/loss on financial instruments at fair value through profit or loss”.
Hedges of net foreign currency investments in subsidiaries and branches are accounted for in the same way as cash flow hedges. Hedging instruments may be currency derivatives or any other non-derivative
financial instrument.
- 24 -
Consolidated financial statements at 31 December 2014
Embedded derivatives
Derivatives embedded in hybrid financial instruments are separated from the value of the host contract
and accounted for separately as a derivative if the hybrid instrument is not recorded as a financial asset or liability at fair value through profit or loss, and if the economic characteristics and risks of the
embedded derivative are not closely related to those of the host contract.
1.c.10 DETERMINATION OF FAIR VALUE
Fair value is the price that would be received to sell an asset or paid to transfer a liability in an orderly transaction between market participants in the principal market or most advantageous market, at the
measurement date.
The Group determines the fair value of financial instruments either by using prices obtained directly
from external data or by using valuation techniques. These valuation techniques are primarily market
and income approaches encompassing generally accepted models (e.g. discounted cash flows, Black-
Scholes model, and interpolation techniques). They maximize the use of observable inputs and minimize the use of unobservable inputs. They are calibrated to reflect current market conditions and valuation
adjustments are applied as appropriate, when some factors such as model, liquidity and credit risks are
not captured by the models or their underlying inputs but are nevertheless considered by market
participants when setting the exit price.
The unit of measurement is generally the individual financial asset or financial liability but a portfolio-based measurement can be elected subject to certain conditions. Accordingly, the Group retains this
portfolio-based measurement exception to determine the fair value when some group of financial assets
and financial liabilities with substantially similar and offsetting market risks or credit risks are
managed on the basis of a net exposure, in accordance with the documented risk management strategy.
Assets and liabilities measured or disclosed at fair value are categorised into the three following levels of
the fair value hierarchy:
- Level 1: fair values are determined using directly quoted prices in active markets for identical
assets and liabilities. Characteristics of an active market include the existence of a sufficient
frequency and volume of activity and of readily available prices.
- Level 2: fair values are determined based on valuation techniques for which significant inputs are
observable market data, either directly or indirectly. These techniques are regularly calibrated and the inputs are corroborated with information from active markets.
- Level 3: fair values are determined using valuation techniques for which significant inputs are
unobservable or cannot be corroborated by market-based observations, due for instance to
illiquidity of the instrument and significant model risk. An unobservable input is a parameter for
which there are no market data available and that is therefore derived from proprietary
assumptions about what other market participants would consider when assessing fair value. The assessment of whether a product is illiquid or subject to significant model risks is a matter of
judgment.
The level in the fair value hierarchy within which the asset or liability is categorised in its entirety is
based upon the lowest level input that is significant to the entire fair value.
For financial instruments disclosed in Level 3 of the fair value hierarchy, a difference between the
transaction price and the fair value may arise at initial recognition. This “Day One Profit” is deferred
and released to the profit and loss account over the period during which the valuation parameters are
expected to remain non-observable. When parameters that were originally non-observable become
observable, or when the valuation can be substantiated in comparison with recent similar transactions
in an active market, the unrecognised portion of the day one profit is released to the profit and loss account.

- 25 -
Consolidated financial statements at 31 December 2014
1.c.11 FINANCIAL ASSETS AND LIABILITIES DESIGNATED AT FAIR VALUE THROUGH
PROFIT OR LOSS (FAIR VALUE OPTION)
Financial assets or financial liabilities may be designated on initial recognition as at fair value through
profit or loss, in the following cases:
- hybrid financial instruments containing one or more embedded derivatives which otherwise would
have been separated and accounted for separately;
- where using the option enables the entity to eliminate or significantly reduce a mismatch in the
measurement and accounting treatment of assets and liabilities that would arise if they were to be classified in separate categories;
- when a group of financial assets and/or financial liabilities is managed and measured on the basis
of fair value, in accordance with a documented risk management and investment strategy.
1.c.12 INCOME AND EXPENSES ARISING FROM FINANCIAL ASSETS AND FINANCIAL
LIABILITIES
Income and expenses arising from financial instruments measured at amortised cost and from fixed-
income securities classified in “Available-for-sale financial assets” are recognised in the profit and loss
account using the effective interest method.
The effective interest rate is the rate that exactly discounts estimated future cash flows through the
expected life of the financial instrument or, when appropriate, a shorter period, to the net carrying amount of the asset or liability in the balance sheet. The effective interest rate calculation takes into
account all fees received or paid that are an integral part of the effective interest rate of the contract,
transaction costs, and premiums and discounts.
The method used by the Group to recognise service-related commission income and expenses depends
on the nature of the service. Commission treated as an additional component of interest is included in
the effective interest rate, and is recognised in the profit and loss account in “Net interest income”. Commission payable or receivable on execution of a significant transaction is recognised in the profit
and loss account in full on execution of the transaction, under “Commission income and expense”.
Commission payable or receivable for recurring services is recognised over the term of the service, also
under “Commission income and expense”.
Commission received in respect of financial guarantee commitments is regarded as representing the fair value of the commitment. The resulting liability is subsequently amortised over the term of the
commitment, under commission income in Revenues.
1.c.13 COST OF RISK
Cost of risk includes movements in provisions for impairment of fixed-income securities and loans and
receivables due from customers and credit institutions, movements in provisions for financing and
guarantee commitments given, losses on irrecoverable loans and amounts recovered on loans written
off. This caption also includes impairment losses recorded with respect to default risk incurred on counterparties for over-the-counter financial instruments, as well as expenses relating to fraud and to
disputes inherent to the financing business.
- 26 -
Consolidated financial statements at 31 December 2014
1.c.14 DERECOGNITION OF FINANCIAL ASSETS AND FINANCIAL LIABILITIES
The Group derecognises all or part of a financial asset either when the contractual rights to the cash
flows from the asset expire or when the Group transfers the contractual rights to the cash flows from
the asset and substantially all the risks and rewards of ownership of the asset. Unless these conditions
are fulfilled, the Group retains the asset in its balance sheet and recognises a liability for the obligation created as a result of the transfer of the asset.
The Group derecognises all or part of a financial liability when the liability is extinguished in full or in
part.
1.c.15 OFFSETTING FINANCIAL ASSETS AND FINANCIAL LIABILITIES
A financial asset and a financial liability are offset and the net amount presented in the balance sheet
if, and only if, the Group has a legally enforceable right to set off the recognised amounts, and intends either to settle on a net basis, or to realise the asset and settle the liability simultaneously.
Repurchase agreements and derivatives traded with clearing houses that meet the two criteria set out in
the accounting standard are offset in the balance sheet.
1.d ACCOUNTING STANDARDS SPECIFIC TO INSURANCE BUSINESS
The specific accounting policies relating to assets and liabilities generated by insurance contracts and financial contracts with a discretionary participation feature written by fully consolidated insurance
companies are retained for the purposes of the consolidated financial statements. These policies comply
with IFRS 4.
All other insurance company assets and liabilities are accounted for using the policies applied to the
Group’s assets and liabilities generally, and are included in the relevant balance sheet and profit and loss account headings in the consolidated financial statements.
1.d.1 ASSETS
Financial assets and non-current assets are accounted for using the policies described elsewhere in this
note. The only exceptions are shares in civil property companies (SCIs) held in unit-linked insurance
contract portfolios, which are measured at fair value on the balance sheet date with changes in fair
value taken to profit or loss.
Financial assets representing technical provisions related to unit-linked business are shown in “Financial assets at fair value through profit or loss”, and are stated at the realisable value of the
underlying assets at the balance sheet date.
1.d.2 LIABILITIES
The Group’s obligations to policyholders and beneficiaries are shown in “Technical reserves of insurance
companies” and are comprised of liabilities relating to insurance contracts carrying a significant
insurance risk (e.g., mortality or disability) and to financial contracts with a discretionary participation
feature, which are covered by IFRS 4. A discretionary participation feature is one which gives life policyholders the right to receive a share of actual profits as a supplement to guaranteed benefits.

- 27 -
Consolidated financial statements at 31 December 2014
Liabilities relating to other financial contracts, which are covered by IAS 39, are shown in “Due to
customers”.
Unit-linked contract liabilities are measured in reference to the fair value of the underlying assets at the balance sheet date.
The technical reserves of life insurance subsidiaries consist primarily of mathematical reserves, which
generally correspond to the surrender value of the contract.
The benefits offered relate mainly to the risk of death (term life insurance, annuities, loan repayment,
guaranteed minimum on unit-linked contracts) and, for borrowers’ insurance, to disability, incapacity
and unemployment risks. These types of risks are controlled by the use of appropriate mortality tables (certified tables in the case of annuity-holders), medical screening appropriate to the level of benefit
offered, statistical monitoring of insured populations, and reinsurance programmes.
Non-life technical reserves include unearned premium reserves (corresponding to the portion of written
premiums relating to future periods) and outstanding claims reserves, inclusive of claims handling
costs.
The adequacy of technical reserves is tested at the balance sheet date by comparing them with the average value of future cash flows as derived from stochastic analyses. Any adjustments to technical
reserves are taken to the profit and loss account for the period. A capitalisation reserve is set up in
individual statutory accounts on the sale of amortisable securities in order to defer part of the net
realised gain and hence maintain the yield to maturity on the portfolio of admissible assets. In the
consolidated financial statements, the bulk of this reserve is reclassified to “Policyholders’ surplus” on the liabilities side of the consolidated balance sheet; a deferred tax liability is recognised on the portion
taken to shareholders' equity.
This item also includes the policyholders’ surplus reserve resulting from the application of shadow
accounting. This represents the interest of policyholders, mainly within French life insurance
subsidiaries, in unrealised gains and losses on assets where the benefit paid under the policy is linked
to the return on those assets. This interest is an average derived from stochastic analyses of unrealised gains and losses attributable to policyholders in various scenarios.
In the event of an unrealised loss on shadow accounted assets, a policyholders' loss reserve is
recognised on the assets side of the consolidated balance sheet in an amount equal to the probable
deduction from the policyholders' future profit share. The recoverability of the policyholders' loss
reserve is assessed prospectively, taking into account policyholders' surplus reserves recognised elsewhere, capital gains on financial assets that are not shadow accounted due to accounting elections
made (held-to-maturity financial assets and property investments measured at cost) and the company's
ability and intention to hold the assets carrying the unrealised loss. The policyholders' loss reserve is
recognised symmetrically with the corresponding assets and shown on the assets side of the balance
sheet under the line item "Accrued income and other assets".
1.d.3 PROFIT AND LOSS ACCOUNT
Income and expenses arising on insurance contracts written by the Group are recognised in the profit and loss account under “Income from other activities” and “Expense on other activities”.
Other insurance company income and expenses are included in the relevant profit and loss account
item. Consequently, movements in the policyholders’ surplus reserve are shown on the same line as
gains and losses on the assets that generated the movements.
- 28 -
Consolidated financial statements at 31 December 2014
1.e PROPERTY, PLANT, EQUIPMENT AND INTANGIBLE ASSETS
Property, plant and equipment and intangible assets shown in the consolidated balance sheet are
composed of assets used in operations and investment property.
Assets used in operations are those used in the provision of services or for administrative purposes, and include non-property assets leased by the Group as lessor under operating leases.
Investment property comprises property assets held to generate rental income and capital gains.
Property, plant and equipment and intangible assets are initially recognised at purchase price plus
directly attributable costs, together with borrowing costs where a long period of construction or
adaptation is required before the asset can be brought into service.
Software developed internally by the BNP Paribas Group that fulfils the criteria for capitalisation is capitalised at direct development cost, which includes external costs and the labour costs of employees
directly attributable to the project.
Subsequent to initial recognition, property, plant and equipment and intangible assets are measured at
cost less accumulated depreciation or amortisation and any impairment losses. The only exceptions are
shares in civil property companies (SCIs) held in unit-linked insurance contract portfolios, which are measured at fair value on the balance sheet date, with changes in fair value taken to profit or loss.
The depreciable amount of property, plant and equipment and intangible assets is calculated after
deducting the residual value of the asset. Only assets leased by the Group as the lessor under operating
leases are presumed to have a residual value, as the useful life of property, plant and equipment and
intangible assets used in operations is generally the same as their economic life.
Property, plant and equipment and intangible assets are depreciated or amortised using the straight-line method over the useful life of the asset. Depreciation and amortisation expense is recognised in the
profit and loss account under “Depreciation, amortisation and impairment of property, plant and
equipment and intangible assets”.
Where an asset consists of a number of components which may require replacement at regular
intervals, or which have different uses or generate economic benefits at different rates, each component is recognised separately and depreciated using a method appropriate to that component. The
BNP Paribas Group has adopted the component-based approach for property used in operations and for
investment property.
The depreciation periods used for office property are as follows: 80 years or 60 years for the shell (for
prime and other property respectively); 30 years for facades; 20 years for general and technical
installations; and 10 years for fixtures and fittings.
Software is amortised, depending on its type, over periods of no more than 8 years in the case of
infrastructure developments and 3 years or 5 years in the case of software developed primarily for the
purpose of providing services to customers.
Software maintenance costs are expensed as incurred. However, expenditure that is regarded as
upgrading the software or extending its useful life is included in the initial acquisition or production cost.
Depreciable property, plant and equipment and intangible assets are tested for impairment if there is an
indication of potential impairment at the balance sheet date. Non-depreciable assets are tested for
impairment at least annually, using the same method as for goodwill allocated to cash-generating units.
If there is an indication of impairment, the new recoverable amount of the asset is compared with the
carrying amount. If the asset is found to be impaired, an impairment loss is recognised in the profit and loss account. This loss is reversed in the event of a change in the estimated recoverable amount or if
there is no longer an indication of impairment. Impairment losses are taken to the profit and loss
account in “Depreciation, amortisation and impairment of property, plant and equipment and intangible
assets”.
Gains and losses on disposals of property, plant and equipment and intangible assets used in
operations are recognised in the profit and loss account in “Net gain on non-current assets”.
Gains and losses on disposals of investment property are recognised in the profit and loss account in
“Income from other activities” or “Expense on other activities”.

- 29 -
Consolidated financial statements at 31 December 2014
1.f LEASES
Group companies may either be the lessee or the lessor in a lease agreement.
1.f.1 LESSOR ACCOUNTING
Leases contracted by the Group as lessor are categorised as either finance leases or operating leases.
Finance leases
In a finance lease, the lessor transfers substantially all the risks and rewards of ownership of an asset
to the lessee. It is treated as a loan made to the lessee to finance the purchase of the asset.
The present value of the lease payments, plus any residual value, is recognised as a receivable. The net
income earned from the lease by the lessor is equal to the amount of interest on the loan, and is taken
to the profit and loss account under “Interest income”. The lease payments are spread over the lease term, and are allocated to reduction of the principal and to interest such that the net income reflects a
constant rate of return on the net investment outstanding in the lease. The rate of interest used is the
rate implicit in the lease.
Individual and portfolio impairments of lease receivables are determined using the same principles as
applied to other loans and receivables.
Operating leases
An operating lease is a lease under which substantially all the risks and rewards of ownership of an
asset are not transferred to the lessee.
The asset is recognised under property, plant and equipment in the lessor’s balance sheet and depreciated on a straight-line basis over the lease term. The depreciable amount excludes the residual
value of the asset. The lease payments are taken to the profit and loss account in full on a straight-line
basis over the lease term. Lease payments and depreciation expenses are taken to the profit and loss
account under “Income from other activities” and “Expenses on other activities”.
1.f.2 LESSEE ACCOUNTING
Leases contracted by the Group as lessee are categorised as either finance leases or operating leases.
Finance leases
A finance lease is treated as an acquisition of an asset by the lessee, financed by a loan. The leased
asset is recognised in the balance sheet of the lessee at the lower of its fair value or the present value of
the minimum lease payments calculated at the interest rate implicit in the lease. A matching liability,
equal to the fair value of the leased asset or the present value of the minimum lease payments, is also recognised in the balance sheet of the lessee. The asset is depreciated using the same method as that
applied to owned assets, after deducting the residual value from the amount initially recognised, over
the useful life of the asset. If there is no reasonable certainty that the lessee will obtain ownership by

- 30 -
Consolidated financial statements at 31 December 2014
the end of the lease term, the asset shall be fully depreciated over the shorter of the lease term and its
useful life. The lease obligation is accounted for at amortised cost.
Operating leases
The asset is not recognised in the balance sheet of the lessee. Lease payments made under operating
leases are taken to the profit and loss account of the lessee on a straight-line basis over the lease term.
1.g NON-CURRENT ASSETS HELD FOR SALE AND DISCONTINUED OPERATIONS
Where the Group decides to sell non-current assets and it is highly probable that the sale will occur
within 12 months, these assets are shown separately in the balance sheet, on the line “Non-current assets held for sale”. Any liabilities associated with these assets are also shown separately in the
balance sheet, on the line “Liabilities associated with non-current assets held for sale”.
Once classified in this category, non-current assets and groups of assets and liabilities are measured at
the lower of carrying amount or fair value less costs to sell.
Such assets are no longer depreciated. If an asset or group of assets and liabilities becomes impaired,
an impairment loss is recognised in the profit and loss account. Impairment losses may be reversed.
Where a group of assets and liabilities held for sale represents a cash generating unit, it is categorised
as a “discontinued operation”. Discontinued operations include operations that are held for sale,
operations that have been shut down, and subsidiaries acquired exclusively with a view to resell.
All gains and losses related to discontinued operations are shown separately in the profit and loss account, on the line “Post-tax gain/loss on discontinued operations and assets held for sale”. This line
includes the post-tax profits or losses of discontinued operations, the post-tax gain or loss arising from
remeasurement at fair value less costs to sell, and the post-tax gain or loss on disposal of the operation.

- 31 -
Consolidated financial statements at 31 December 2014
1.h EMPLOYEE BENEFITS
Employee benefits are classified in one of four categories:
- short-term benefits, such as salary, annual leave, incentive plans, profit-sharing and additional
payments;
- long-term benefits, including compensated absences, long-service awards, and other types of cash-
based deferred compensation;
- termination benefits;
- post-employment benefits, including top-up banking industry pensions and retirement bonuses in
France and pension plans in other countries, some of which are operated through pension funds.
Short-term benefits
The Group recognises an expense when it has used services rendered by employees in exchange for
employee benefits.
Long-term benefits
These are benefits, other than short-term benefits, post-employment benefits and termination benefits. This relates, in particular, to compensation deferred for more than 12 months and not linked to the
BNP Paribas share price, which is accrued in the financial statements for the period in which it is
earned.
The actuarial techniques used are similar to those used for defined-benefit post-employment benefits,
except that the revaluation items are recognised in the profit and loss account and not in equity.
Termination benefits
Termination benefits are employee benefits payable in exchange for the termination of an employee’s
contract as a result of either a decision by the Group to terminate a contract of employment before the
legal retirement age, or a decision by an employee to accept voluntary redundancy in exchange for these
benefits. Termination benefits due more than 12 months after the balance sheet date are discounted.
Post-employment benefits
In accordance with IFRS, the BNP Paribas Group draws a distinction between defined-contribution
plans and defined-benefit plans.
Defined-contribution plans do not give rise to an obligation for the Group and do not require a
provision. The amount of the employer’s contributions payable during the period is recognised as an expense.
Only defined-benefit schemes give rise to an obligation for the Group. This obligation must be measured
and recognised as a liability by means of a provision.
The classification of plans into these two categories is based on the economic substance of the plan,
which is reviewed to determine whether the Group has a legal or constructive obligation to pay the agreed benefits to employees.
Post-employment benefit obligations under defined-benefit plans are measured using actuarial
techniques that take demographic and financial assumptions into account.

- 32 -
Consolidated financial statements at 31 December 2014
The net liability recognised with respect to post-employment benefit plans is the difference between the
present value of the defined-benefit obligation and the fair value of any plan assets.
The present value of the defined-benefit obligation is measured on the basis of the actuarial
assumptions applied by the Group, using the projected unit credit method. This method takes into
account various parameters, specific to each country or Group entity, such as demographic
assumptions, the probability that employees will leave before retirement age, salary inflation, a discount
rate, and the general inflation rate.
When the value of the plan assets exceeds the amount of the obligation, an asset is recognised if it represents a future economic benefit for the Group in the form of a reduction in future contributions or
a future partial refund of amounts paid into the plan.
The annual expense recognised in the profit and loss account under “Salaries and employee benefits”,
with respect to defined-benefit plans includes the current service cost (the rights vested by each
employee during the period in return for service rendered), the net interests linked to the effect of discounting the net defined-benefit liability (asset), the past service cost arising from plan amendments
or curtailments, and the effect of any plan settlements.
Remeasurements of the net defined-benefit liability (asset) are recognised in other comprehensive
income and are never reclassified to profit or loss. They include actuarial gains and losses, the return on plan assets and any change in the effect of the asset ceiling (excluding amounts included in net
interest on the defined-benefit liability or asset).
1.i SHARE-BASED PAYMENTS
Share-based payment transactions are payments based on shares issued by the Group, whether the
transaction is settled in the form of equity or cash of which the amount is based on trends in the value of BNP Paribas shares.
IFRS 2 requires share-based payments granted after 7 November 2002 to be recognised as an expense.
The amount recognised is the value of the share-based payment granted to the employee.
The Group grants employees stock subscription option plans and deferred share-based or share price-
linked cash-settled compensation plans, and also offers them the possibility to purchase specially-
issued BNP Paribas shares at a discount, on condition that they retain the shares for a specified period.
Stock option and share award plans
The expense related to stock option and share award plans is recognised over the vesting period, if the
benefit is conditional upon the grantee’s continued employment.
Stock options and share award expenses are recorded under salary and employee benefits expenses,
with a corresponding adjustment to shareholders' equity. They are calculated on the basis of the overall plan value, determined at the date of grant by the Board of Directors.
In the absence of any market for these instruments, financial valuation models are used that take into
account any performance conditions related to the BNP Paribas share price. The total expense of a plan
is determined by multiplying the unit value per option or share awarded by the estimated number of options or shares awarded vested at the end of the vesting period, taking into account the conditions
regarding the grantee’s continued employment.
The only assumptions revised during the vesting period, and hence resulting in a remeasurement of the
expense, are those relating to the probability that employees will leave the Group and those relating to
performance conditions that are not linked to the price value of BNP Paribas shares.
- 33 -
Consolidated financial statements at 31 December 2014
Share price-linked cash-settled deferred compensation plans
The expense related to these plans is recognised in the year during which the employee rendered the
corresponding services.
If the payment of share-based variable compensation is explicitly subject to the employee's continued
presence at the vesting date, the services are presumed to have been rendered during the vesting period
and the corresponding compensation expense is recognised on a pro rata basis over that period. The
expense is recognised under salary and employee benefits expenses with a corresponding liability in the
balance sheet. It is revised to take into account any non-fulfilment of the continued presence or
performance conditions and the change in BNP Paribas share price.
If there is no continued presence condition, the expense is not deferred, but recognised immediately
with a corresponding liability in the balance sheet. This is then revised on each reporting date until settlement to take into account any performance conditions and the change in the BNP Paribas share
price.
Share subscriptions or purchases offered to employees under the company savings plan
Share subscriptions or purchases offered to employees under the company savings plan (Plan d’Épargne Entreprise) at lower-than-market rates over a specified period do not include a vesting period.
However, employees are prohibited by law from selling shares acquired under this plan for a period of
five years. This restriction is taken into account when measuring the benefit to the employees, which is
reduced accordingly. Therefore, the benefit equals the difference, at the date the plan is announced to
employees, between the fair value of the share (after allowing for the restriction on sale) and the
acquisition price paid by the employee, multiplied by the number of shares acquired.
The cost of the mandatory five-year holding period is equivalent to the cost of a strategy involving the forward sale of shares subscribed at the time of the capital increase reserved for employees and the
cash purchase of an equivalent number of BNP Paribas shares on the market, financed by a loan repaid
at the end of a five-year period out of the proceeds from the forward sale transaction. The interest rate
on the loan is the rate that would be applied to a five-year general purpose loan taken out by an
individual with an average risk profile. The forward sale price for the shares is determined on the basis of market parameters.
1.j PROVISIONS RECORDED UNDER LIABILITIES
Provisions recorded under liabilities (other than those relating to financial instruments, employee
benefits and insurance contracts) mainly relate to restructuring, claims and litigation, fines and
penalties, and tax risks.
A provision is recognised when it is probable that an outflow of resources embodying economic benefits will be required to settle an obligation arising from a past event, and a reliable estimate can be made of
the amount of the obligation. The amount of such obligations is discounted, where the impact of
discounting is material, in order to determine the amount of the provision.
- 34 -
Consolidated financial statements at 31 December 2014
1.k CURRENT AND DEFERRED TAXES
The current income tax charge is determined on the basis of the tax laws and tax rates in force in each
country in which the Group operates during the period in which the income is generated.
Deferred taxes are recognised when temporary differences arise between the carrying amount of an
asset or liability in the balance sheet and its tax base.
Deferred tax liabilities are recognised for all taxable temporary differences other than:
- taxable temporary differences on initial recognition of goodwill;
- taxable temporary differences on investments in enterprises under the exclusive or joint control of
the Group, where the Group is able to control the timing of the reversal of the temporary difference and it is probable that the temporary difference will not reverse in the foreseeable future.
Deferred tax assets are recognised for all deductible temporary differences and unused carryforwards of
tax losses only to the extent that it is probable that the entity in question will generate future taxable
profits against which these temporary differences and tax losses can be offset.
Deferred tax assets and liabilities are measured using the liability method, using the tax rate which is
expected to apply to the period when the asset is realised or the liability is settled, based on tax rates
and tax laws that have been or will have been enacted by the balance sheet date of that period. They are
not discounted.
Deferred tax assets and liabilities are offset when they arise within the same tax group, they fall under
the jurisdiction of a single tax authority, and there is a legal right to offset.
Current and deferred taxes are recognised as tax income or expenses in the profit and loss account,
excepted for deferred taxes relating to unrealised gains or losses on available-for-sale assets or to
changes in the fair value of instruments designated as cash flow hedges, which are taken to
shareholders’ equity.
When tax credits on revenues from receivables and securities are used to settle corporate income tax payable for the period, the tax credits are recognised on the same line as the income to which they
relate. The corresponding tax expense continues to be carried in the profit and loss account under
“Corporate income tax”.
1.l CASH FLOW STATEMENT
The cash and cash equivalents balance is composed of the net balance of cash accounts and accounts
with central banks, and the net balance of interbank demand loans and deposits.
Changes in cash and cash equivalents related to operating activities reflect cash flows generated by the
Group’s operations, including cash flows related to investment property, held-to-maturity financial
assets and negotiable certificates of deposit.
Changes in cash and cash equivalents related to investing activities reflect cash flows resulting from
acquisitions and disposals of subsidiaries, associates or joint ventures included in the consolidated group, as well as acquisitions and disposals of property, plant and equipment excluding investment
property and property held under operating leases.
Changes in cash and cash equivalents related to financing activities reflect the cash inflows and
outflows resulting from transactions with shareholders, cash flows related to bonds and subordinated
debt, and debt securities (excluding negotiable certificates of deposit).

- 35 -
Consolidated financial statements at 31 December 2014
1.m USE OF ESTIMATES IN THE PREPARATION OF THE FINANCIAL STATEMENTS
Preparation of the financial statements requires managers of core businesses and corporate functions to
make assumptions and estimates that are reflected in the measurement of income and expense in the
profit and loss account and of assets and liabilities in the balance sheet, and in the disclosure of information in the notes to the financial statements. This requires the managers in question to exercise
their judgement and to make use of information available at the date of the preparation of the financial
statements when making their estimates. The actual future results from operations where managers
have made use of estimates may in reality differ significantly from those estimates, mainly according to
market conditions. This may have a material effect on the financial statements.
This applies in particular to:
- impairment losses recognised to cover credit risks inherent in banking intermediation activities;
- the use of internally-developed models to measure positions in financial instruments that are not
quoted in active markets;
- calculations of the fair value of unquoted financial instruments classified in “Available-for-sale financial assets”, “Financial assets at fair value through profit or loss” or “Financial liabilities at fair
value through profit or loss”, and more generally calculations of the fair value of financial
instruments subject to a fair value disclosure requirement;
- whether a market is active or inactive for the purposes of using a valuation technique;
- impairment losses on variable-income financial assets classified as "Available-for-sale";
- impairment tests performed on intangible assets;
- the appropriateness of the designation of certain derivative instruments such as cash flow hedges,
and the measurement of hedge effectiveness;
- estimates of the residual value of assets leased under finance leases or operating leases, and more
generally of assets on which depreciation is charged net of their estimated residual value;
- the measurement of provisions for contingencies and charges.
This is also the case for assumptions applied to assess the sensitivity of each type of market risk and
the sensitivity of valuations to non-observable parameters.
- 36 -
Consolidated financial statements at 31 December 2014
2 . RETROSPECTIVE IMPACT OF IFRS 10 , IFRS 11 AND THE AMENDMENT TO IAS 32
As of 1 January 2014, the Group has applied IFRS 10 “Consolidated Financial Statements”, IFRS 11
“Joint Arrangements” and the amendment to IAS 32 “Financial Instruments: Presentation – Offsetting
Financial Assets and Financial Liabilities”. As these standards and amendments have a retrospective
effect, the comparative financial statements as at 1 January and 31 December 2013 have been restated.
Retrospective impact of IFRS 10 and IFRS 11
The main impact of the first-time adoption of IFRS 10 is the consolidation of two asset-backed commercial paper conduits.
The adoption of IFRS 11 has resulted in the Group's use of the equity method to account for jointly
controlled activities conducted via a separate vehicle in which the partners have rights to the net assets.
Such activities had hitherto been proportionally consolidated.
The relevant entities are identified in note 8.k Scope of Consolidation.
The TEB group, fully consolidated since 20 December 2013, was previously proportionally consolidated. The application of IFRS 11 led to its consolidation under the equity method until 20 December 2013 in
the restated 2013 financial statements. Thus, the TEB group contributes to the IFRS 11 adjustments to
the balance sheet as at 1 January 2013 and to the 2013 profit and loss account. Then, the TEB group
is fully consolidated in the balance sheet as at 31 December 2013.
Retrospective impact of the amendment to IAS 32
The principles of offsetting financial assets and liabilities have been clarified: the legally enforceable right to set off the recognised amounts must be unconditional and must exist in all circumstances.
Clarification has been given on the circumstances in which simultaneous gross settlement may be
considered equivalent to net settlement.
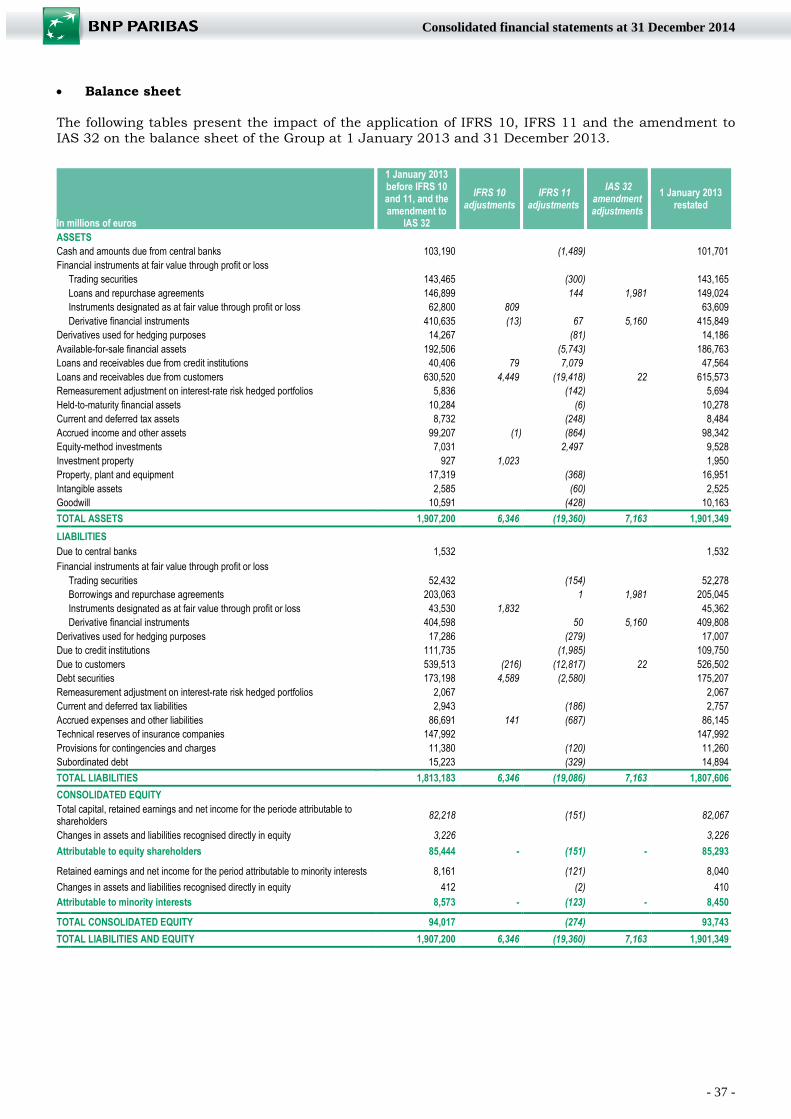
- 37 -
Consolidated financial statements at 31 December 2014
Balance sheet
The following tables present the impact of the application of IFRS 10, IFRS 11 and the amendment to
IAS 32 on the balance sheet of the Group at 1 January 2013 and 31 December 2013.
In millions of euros
1 January 2013 before IFRS 10 and 11, and the amendment to
IAS 32
IFRS 10 adjustments
IFRS 11 adjustments
IAS 32 amendment adjustments
1 January 2013 restated
ASSETS
Cash and amounts due from central banks 103,190 (1,489) 101,701
Financial instruments at fair value through profit or loss
Trading securities 143,465 (300) 143,165
Loans and repurchase agreements 146,899 144 1,981 149,024
Instruments designated as at fair value through profit or loss 62,800 809 63,609
Derivative financial instruments 410,635 (13) 67 5,160 415,849
Derivatives used for hedging purposes 14,267 (81) 14,186
Available-for-sale financial assets 192,506 (5,743) 186,763
Loans and receivables due from credit institutions 40,406 79 7,079 47,564
Loans and receivables due from customers 630,520 4,449 (19,418) 22 615,573
Remeasurement adjustment on interest-rate risk hedged portfolios 5,836 (142) 5,694
Held-to-maturity financial assets 10,284 (6) 10,278
Current and deferred tax assets 8,732 (248) 8,484
Accrued income and other assets 99,207 (1) (864) 98,342
Equity-method investments 7,031 2,497 9,528
Investment property 927 1,023 1,950
Property, plant and equipment 17,319 (368) 16,951
Intangible assets 2,585 (60) 2,525
Goodwill 10,591 (428) 10,163
TOTAL ASSETS 1,907,200 6,346 (19,360) 7,163 1,901,349
LIABILITIES
Due to central banks 1,532 1,532
Financial instruments at fair value through profit or loss
Trading securities 52,432 (154) 52,278
Borrowings and repurchase agreements 203,063 1 1,981 205,045
Instruments designated as at fair value through profit or loss 43,530 1,832 45,362
Derivative financial instruments 404,598 50 5,160 409,808
Derivatives used for hedging purposes 17,286 (279) 17,007
Due to credit institutions 111,735 (1,985) 109,750
Due to customers 539,513 (216) (12,817) 22 526,502
Debt securities 173,198 4,589 (2,580) 175,207
Remeasurement adjustment on interest-rate risk hedged portfolios 2,067 2,067
Current and deferred tax liabilities 2,943 (186) 2,757
Accrued expenses and other liabilities 86,691 141 (687) 86,145
Technical reserves of insurance companies 147,992 147,992
Provisions for contingencies and charges 11,380 (120) 11,260
Subordinated debt 15,223 (329) 14,894
TOTAL LIABILITIES 1,813,183 6,346 (19,086) 7,163 1,807,606
CONSOLIDATED EQUITY
Total capital, retained earnings and net income for the periode attributable to shareholders
82,218 (151) 82,067
Changes in assets and liabilities recognised directly in equity 3,226 3,226
Attributable to equity shareholders 85,444 - (151) - 85,293
Retained earnings and net income for the period attributable to minority interests 8,161 (121) 8,040
Changes in assets and liabilities recognised directly in equity 412 (2) 410
Attributable to minority interests 8,573 - (123) - 8,450
TOTAL CONSOLIDATED EQUITY 94,017 (274) 93,743
TOTAL LIABILITIES AND EQUITY 1,907,200 6,346 (19,360) 7,163 1,901,349
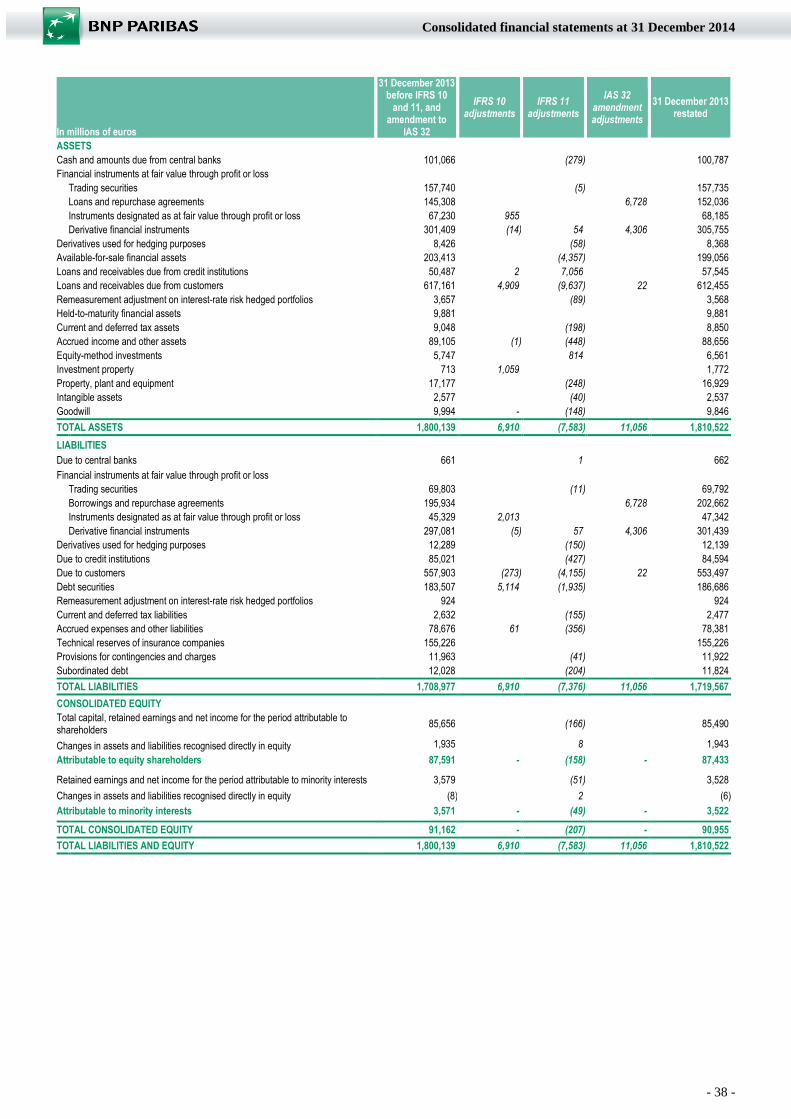
- 38 -
Consolidated financial statements at 31 December 2014
In millions of euros
31 December 2013 before IFRS 10
and 11, and amendment to
IAS 32
IFRS 10 adjustments
IFRS 11 adjustments
IAS 32 amendment adjustments
31 December 2013 restated
ASSETS
Cash and amounts due from central banks 101,066 (279) 100,787
Financial instruments at fair value through profit or loss
Trading securities 157,740 (5) 157,735
Loans and repurchase agreements 145,308 6,728 152,036
Instruments designated as at fair value through profit or loss 67,230 955 68,185
Derivative financial instruments 301,409 (14) 54 4,306 305,755
Derivatives used for hedging purposes 8,426 (58) 8,368
Available-for-sale financial assets 203,413 (4,357) 199,056
Loans and receivables due from credit institutions 50,487 2 7,056 57,545
Loans and receivables due from customers 617,161 4,909 (9,637) 22 612,455
Remeasurement adjustment on interest-rate risk hedged portfolios 3,657 (89) 3,568
Held-to-maturity financial assets 9,881 9,881
Current and deferred tax assets 9,048 (198) 8,850
Accrued income and other assets 89,105 (1) (448) 88,656
Equity-method investments 5,747 814 6,561
Investment property 713 1,059 1,772
Property, plant and equipment 17,177 (248) 16,929
Intangible assets 2,577 (40) 2,537
Goodwill 9,994 - (148) 9,846
TOTAL ASSETS 1,800,139 6,910 (7,583) 11,056 1,810,522
LIABILITIES
Due to central banks 661 1 662
Financial instruments at fair value through profit or loss
Trading securities 69,803 (11) 69,792
Borrowings and repurchase agreements 195,934 6,728 202,662
Instruments designated as at fair value through profit or loss 45,329 2,013 47,342
Derivative financial instruments 297,081 (5) 57 4,306 301,439
Derivatives used for hedging purposes 12,289 (150) 12,139
Due to credit institutions 85,021 (427) 84,594
Due to customers 557,903 (273) (4,155) 22 553,497
Debt securities 183,507 5,114 (1,935) 186,686
Remeasurement adjustment on interest-rate risk hedged portfolios 924 924
Current and deferred tax liabilities 2,632 (155) 2,477
Accrued expenses and other liabilities 78,676 61 (356) 78,381
Technical reserves of insurance companies 155,226 155,226
Provisions for contingencies and charges 11,963 (41) 11,922
Subordinated debt 12,028 (204) 11,824
TOTAL LIABILITIES 1,708,977 6,910 (7,376) 11,056 1,719,567
CONSOLIDATED EQUITY
Total capital, retained earnings and net income for the period attributable to shareholders
85,656 (166) 85,490
Changes in assets and liabilities recognised directly in equity 1,935 8 1,943
Attributable to equity shareholders 87,591 - (158) - 87,433
Retained earnings and net income for the period attributable to minority interests 3,579 (51) 3,528
Changes in assets and liabilities recognised directly in equity (8) 2 (6)
Attributable to minority interests 3,571 - (49) - 3,522
TOTAL CONSOLIDATED EQUITY 91,162 - (207) - 90,955
TOTAL LIABILITIES AND EQUITY 1,800,139 6,910 (7,583) 11,056 1,810,522
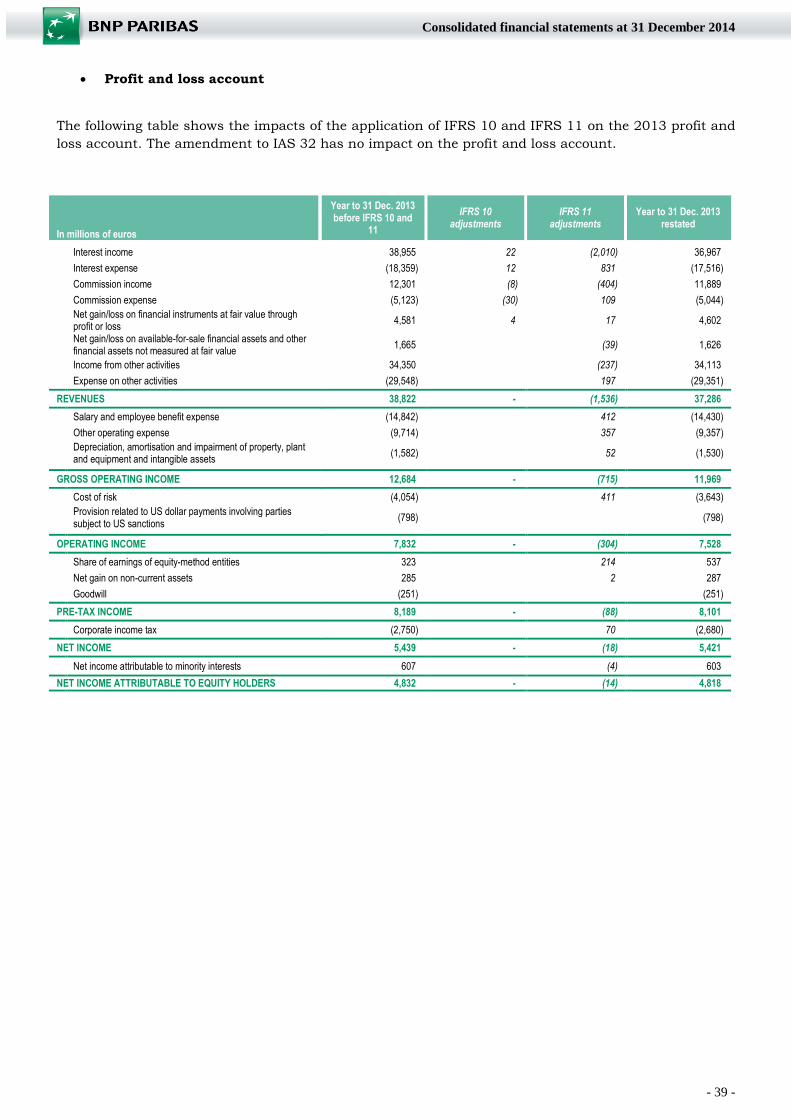
- 39 -
Consolidated financial statements at 31 December 2014
Profit and loss account
The following table shows the impacts of the application of IFRS 10 and IFRS 11 on the 2013 profit and
loss account. The amendment to IAS 32 has no impact on the profit and loss account.
In millions of euros
Year to 31 Dec. 2013 before IFRS 10 and
11
IFRS 10 adjustments
IFRS 11 adjustments
Year to 31 Dec. 2013 restated
Interest income 38,955 22 (2,010) 36,967
Interest expense (18,359) 12 831 (17,516)
Commission income 12,301 (8) (404) 11,889
Commission expense (5,123) (30) 109 (5,044)
Net gain/loss on financial instruments at fair value through profit or loss
4,581 4 17 4,602
Net gain/loss on available-for-sale financial assets and other financial assets not measured at fair value
1,665 (39) 1,626
Income from other activities 34,350 (237) 34,113
Expense on other activities (29,548) 197 (29,351)
REVENUES 38,822 - (1,536) 37,286
Salary and employee benefit expense (14,842) 412 (14,430)
Other operating expense (9,714) 357 (9,357)
Depreciation, amortisation and impairment of property, plant and equipment and intangible assets
(1,582) 52 (1,530)
GROSS OPERATING INCOME 12,684 - (715) 11,969
Cost of risk (4,054) 411 (3,643)
Provision related to US dollar payments involving parties subject to US sanctions
(798) (798)
OPERATING INCOME 7,832 - (304) 7,528
Share of earnings of equity-method entities 323 214 537
Net gain on non-current assets 285 2 287
Goodwill (251) (251)
PRE-TAX INCOME 8,189 - (88) 8,101
Corporate income tax (2,750) 70 (2,680)
NET INCOME 5,439 - (18) 5,421
Net income attributable to minority interests 607 (4) 603
NET INCOME ATTRIBUTABLE TO EQUITY HOLDERS 4,832 - (14) 4,818
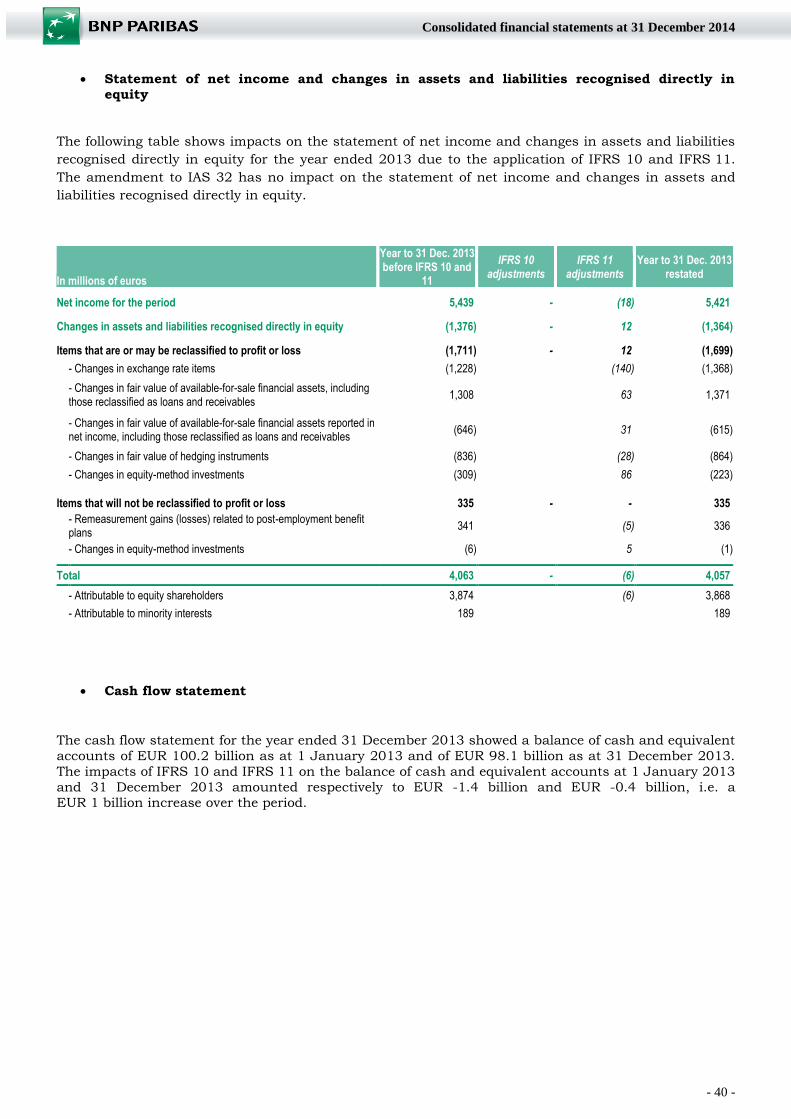
- 40 -
Consolidated financial statements at 31 December 2014
Statement of net income and changes in assets and liabilities recognised directly in equity
The following table shows impacts on the statement of net income and changes in assets and liabilities
recognised directly in equity for the year ended 2013 due to the application of IFRS 10 and IFRS 11.
The amendment to IAS 32 has no impact on the statement of net income and changes in assets and
liabilities recognised directly in equity.
In millions of euros
Year to 31 Dec. 2013 before IFRS 10 and
11
IFRS 10 adjustments
IFRS 11 adjustments
Year to 31 Dec. 2013 restated
Net income for the period 5,439 - (18) 5,421
Changes in assets and liabilities recognised directly in equity (1,376) - 12 (1,364)
Items that are or may be reclassified to profit or loss (1,711) - 12 (1,699)
- Changes in exchange rate items (1,228) (140) (1,368)
- Changes in fair value of available-for-sale financial assets, including those reclassified as loans and receivables
1,308 63 1,371
- Changes in fair value of available-for-sale financial assets reported in net income, including those reclassified as loans and receivables
(646) 31 (615)
- Changes in fair value of hedging instruments (836) (28) (864)
- Changes in equity-method investments (309) 86 (223)
Items that will not be reclassified to profit or loss 335 - - 335
- Remeasurement gains (losses) related to post-employment benefit plans
341 (5) 336
- Changes in equity-method investments (6) 5 (1)
Total 4,063 - (6) 4,057
- Attributable to equity shareholders 3,874 (6) 3,868
- Attributable to minority interests 189 189
Cash flow statement
The cash flow statement for the year ended 31 December 2013 showed a balance of cash and equivalent
accounts of EUR 100.2 billion as at 1 January 2013 and of EUR 98.1 billion as at 31 December 2013.
The impacts of IFRS 10 and IFRS 11 on the balance of cash and equivalent accounts at 1 January 2013
and 31 December 2013 amounted respectively to EUR -1.4 billion and EUR -0.4 billion, i.e. a EUR 1 billion increase over the period.
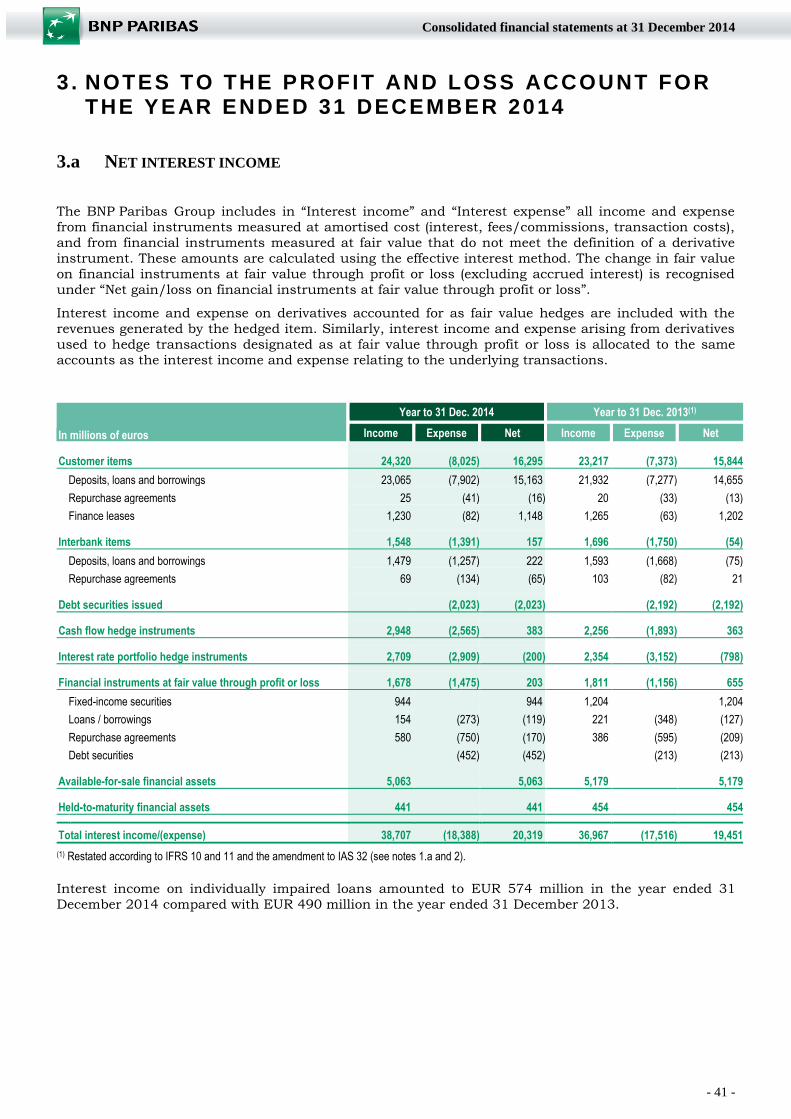
- 41 -
Consolidated financial statements at 31 December 2014
3 . NOTES TO THE PROFIT AND LOSS ACCOUNT FOR THE YEAR ENDED 31 DECEMBER 2014
3.a NET INTEREST INCOME
The BNP Paribas Group includes in “Interest income” and “Interest expense” all income and expense
from financial instruments measured at amortised cost (interest, fees/commissions, transaction costs),
and from financial instruments measured at fair value that do not meet the definition of a derivative
instrument. These amounts are calculated using the effective interest method. The change in fair value
on financial instruments at fair value through profit or loss (excluding accrued interest) is recognised
under “Net gain/loss on financial instruments at fair value through profit or loss”.
Interest income and expense on derivatives accounted for as fair value hedges are included with the
revenues generated by the hedged item. Similarly, interest income and expense arising from derivatives
used to hedge transactions designated as at fair value through profit or loss is allocated to the same
accounts as the interest income and expense relating to the underlying transactions.
In millions of euros
Year to 31 Dec. 2014 Year to 31 Dec. 2013(1)
Income Expense Net Income Expense Net
Customer items 24,320 (8,025) 16,295 23,217 (7,373) 15,844
Deposits, loans and borrowings 23,065 (7,902) 15,163 21,932 (7,277) 14,655
Repurchase agreements 25 (41) (16) 20 (33) (13)
Finance leases 1,230 (82) 1,148 1,265 (63) 1,202
Interbank items 1,548 (1,391) 157 1,696 (1,750) (54)
Deposits, loans and borrowings 1,479 (1,257) 222 1,593 (1,668) (75)
Repurchase agreements 69 (134) (65) 103 (82) 21
Debt securities issued (2,023) (2,023) (2,192) (2,192)
Cash flow hedge instruments 2,948 (2,565) 383 2,256 (1,893) 363
Interest rate portfolio hedge instruments 2,709 (2,909) (200) 2,354 (3,152) (798)
Financial instruments at fair value through profit or loss 1,678 (1,475) 203 1,811 (1,156) 655
Fixed-income securities 944 944 1,204 1,204
Loans / borrowings 154 (273) (119) 221 (348) (127)
Repurchase agreements 580 (750) (170) 386 (595) (209)
Debt securities (452) (452) (213) (213)
Available-for-sale financial assets 5,063 5,063 5,179 5,179
Held-to-maturity financial assets 441 441 454 454
Total interest income/(expense) 38,707 (18,388) 20,319 36,967 (17,516) 19,451
(1) Restated according to IFRS 10 and 11 and the amendment to IAS 32 (see notes 1.a and 2).
Interest income on individually impaired loans amounted to EUR 574 million in the year ended 31
December 2014 compared with EUR 490 million in the year ended 31 December 2013.
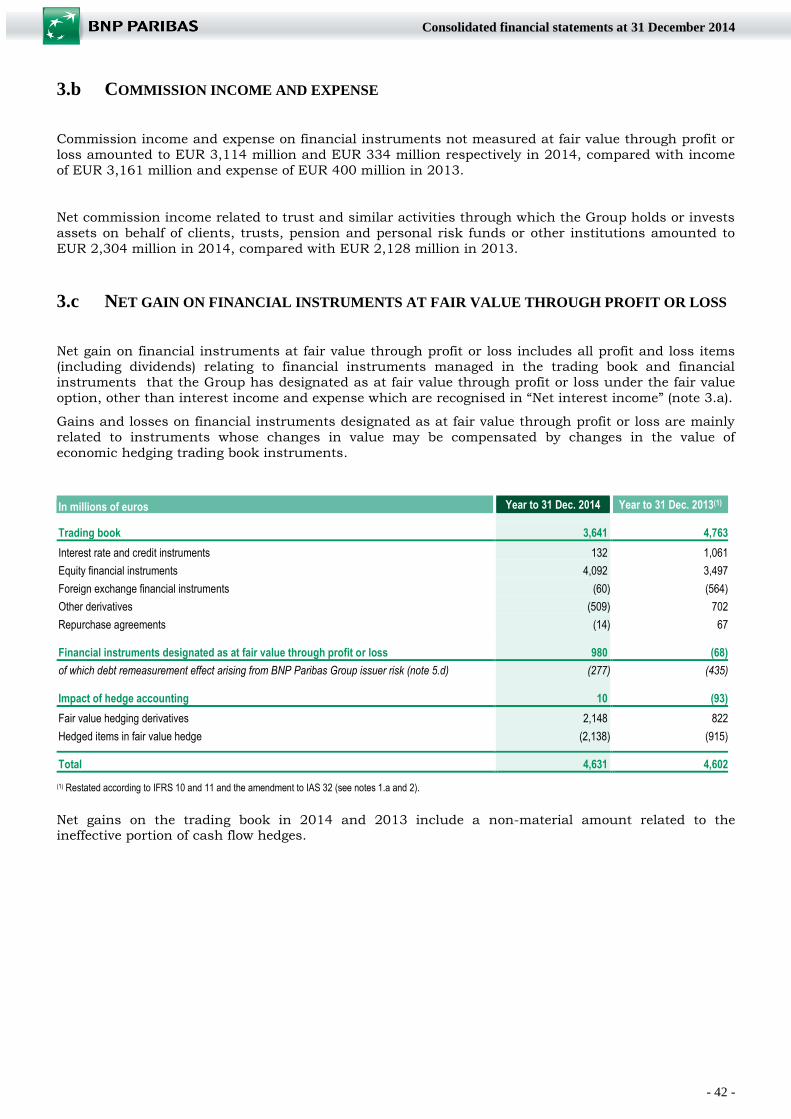
- 42 -
Consolidated financial statements at 31 December 2014
3.b COMMISSION INCOME AND EXPENSE
Commission income and expense on financial instruments not measured at fair value through profit or
loss amounted to EUR 3,114 million and EUR 334 million respectively in 2014, compared with income
of EUR 3,161 million and expense of EUR 400 million in 2013.
Net commission income related to trust and similar activities through which the Group holds or invests
assets on behalf of clients, trusts, pension and personal risk funds or other institutions amounted to
EUR 2,304 million in 2014, compared with EUR 2,128 million in 2013.
3.c NET GAIN ON FINANCIAL INSTRUMENTS AT FAIR VALUE THROUGH PROFIT OR LOSS
Net gain on financial instruments at fair value through profit or loss includes all profit and loss items (including dividends) relating to financial instruments managed in the trading book and financial
instruments that the Group has designated as at fair value through profit or loss under the fair value
option, other than interest income and expense which are recognised in “Net interest income” (note 3.a).
Gains and losses on financial instruments designated as at fair value through profit or loss are mainly
related to instruments whose changes in value may be compensated by changes in the value of
economic hedging trading book instruments.
In millions of euros Year to 31 Dec. 2014 Year to 31 Dec. 2013(1)
Trading book 3,641 4,763
Interest rate and credit instruments 132 1,061
Equity financial instruments 4,092 3,497
Foreign exchange financial instruments (60) (564)
Other derivatives (509) 702
Repurchase agreements (14) 67
Financial instruments designated as at fair value through profit or loss 980 (68)
of which debt remeasurement effect arising from BNP Paribas Group issuer risk (note 5.d) (277) (435) Impact of hedge accounting 10 (93)
Fair value hedging derivatives 2,148 822
Hedged items in fair value hedge (2,138) (915)
Total 4,631 4,602 (1) Restated according to IFRS 10 and 11 and the amendment to IAS 32 (see notes 1.a and 2).
Net gains on the trading book in 2014 and 2013 include a non-material amount related to the ineffective portion of cash flow hedges.
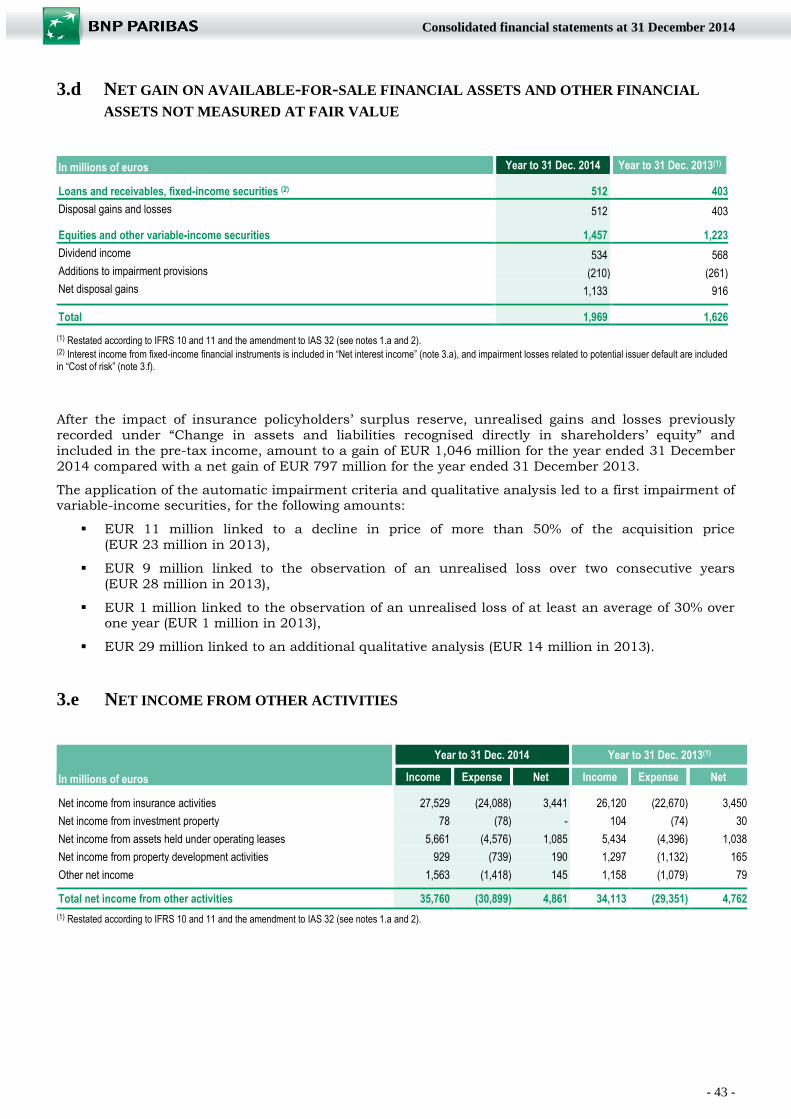
- 43 -
Consolidated financial statements at 31 December 2014
3.d NET GAIN ON AVAILABLE-FOR-SALE FINANCIAL ASSETS AND OTHER FINANCIAL
ASSETS NOT MEASURED AT FAIR VALUE
In millions of euros Year to 31 Dec. 2014 Year to 31 Dec. 2013(1)
Loans and receivables, fixed-income securities (2) 512 403
Disposal gains and losses 512 403
Equities and other variable-income securities 1,457 1,223
Dividend income 534 568 Additions to impairment provisions (210) (261) Net disposal gains 1,133 916
Total 1,969 1,626 (1) Restated according to IFRS 10 and 11 and the amendment to IAS 32 (see notes 1.a and 2).
(2) Interest income from fixed-income financial instruments is included in “Net interest income” (note 3.a), and impairment losses related to potential issuer default are included in “Cost of risk” (note 3.f).
After the impact of insurance policyholders’ surplus reserve, unrealised gains and losses previously
recorded under “Change in assets and liabilities recognised directly in shareholders’ equity” and
included in the pre-tax income, amount to a gain of EUR 1,046 million for the year ended 31 December
2014 compared with a net gain of EUR 797 million for the year ended 31 December 2013.
The application of the automatic impairment criteria and qualitative analysis led to a first impairment of variable-income securities, for the following amounts:
EUR 11 million linked to a decline in price of more than 50% of the acquisition price
(EUR 23 million in 2013),
EUR 9 million linked to the observation of an unrealised loss over two consecutive years
(EUR 28 million in 2013),
EUR 1 million linked to the observation of an unrealised loss of at least an average of 30% over one year (EUR 1 million in 2013),
EUR 29 million linked to an additional qualitative analysis (EUR 14 million in 2013).
3.e NET INCOME FROM OTHER ACTIVITIES
In millions of euros
Year to 31 Dec. 2014 Year to 31 Dec. 2013(1)
Income Expense Net Income Expense Net
Net income from insurance activities 27,529 (24,088) 3,441 26,120 (22,670) 3,450
Net income from investment property 78 (78) - 104 (74) 30
Net income from assets held under operating leases 5,661 (4,576) 1,085 5,434 (4,396) 1,038
Net income from property development activities 929 (739) 190 1,297 (1,132) 165
Other net income 1,563 (1,418) 145 1,158 (1,079) 79
Total net income from other activities 35,760 (30,899) 4,861 34,113 (29,351) 4,762
(1) Restated according to IFRS 10 and 11 and the amendment to IAS 32 (see notes 1.a and 2).

- 44 -
Consolidated financial statements at 31 December 2014
Net income from insurance activities
In millions of euros Year to 31 Dec. 2014 Year to 31 Dec. 2013 Gross premiums written 23,588 21,811
Policy benefit expenses (14,295) (15,532)
Changes in technical reserves (8,051) (5,232)
Change in value of admissible investments related to unit-linked policies 2,513 2,768
Reinsurance ceded (394) (375)
Other income and expense 80 10
Total net income from insurance activities 3,441 3,450
"Policy benefit expenses" include expenses arising from surrenders, maturities and claims relating to
insurance contracts. "Changes in technical reserves" reflects changes in the value of financial contracts,
in particular unit-linked policies. Interest paid on such contracts is recognised in "Interest expense".
3.f COST OF RISK
“Cost of risk” represents the net amount of impairment losses recognised in respect to credit risks inherent in the Group’s banking intermediation activities, plus any impairment losses in the cases of
known counterparty risks on over-the-counter financial instruments.
Cost of risk for the period
In millions of euros Year to 31 Dec. 2014 Year to 31 Dec. 2013(1) Net allowances to impairment (3,501) (3,792)
Recoveries on loans and receivables previously written off 482 557
Irrecoverable loans and receivables not covered by impairment provisions (686) (408)
Total cost of risk for the period (3,705) (3,643)
(1) Restated according to IFRS 10 and 11 and the amendment to IAS 32 (see notes 1.a and 2).
Cost of risk for the period by asset type
In millions of euros Year to 31 Dec. 2014 Year to 31 Dec. 2013(1) Loans and receivables due from credit institutions 48 (7)
Loans and receivables due from customers (3,674) (3,410)
Available-for-sale financial assets (19) (19)
Financial instruments of trading activities 32 (108)
Other assets (7) (9)
Commitments given and other items (85) (90)
Total cost of risk for the period
(3,705) (3,643)
(1) Restated according to IFRS 10 and 11 and the amendment to IAS 32 (see notes 1.a and 2).
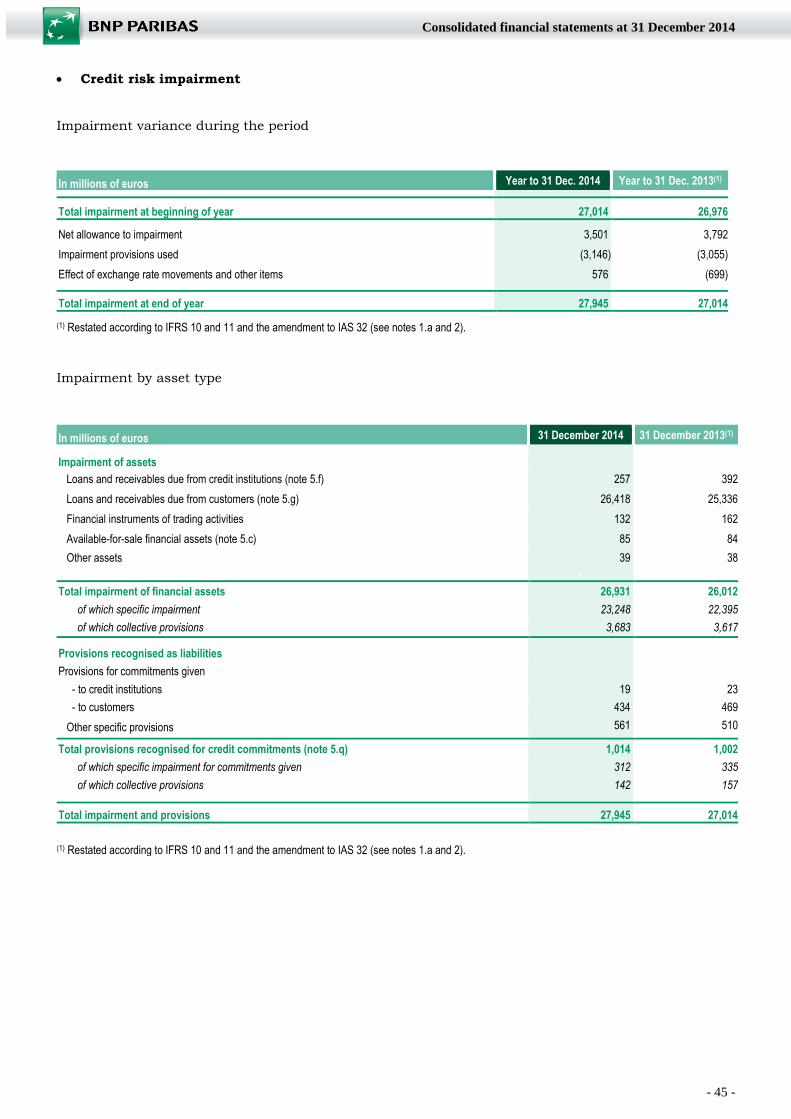
- 45 -
Consolidated financial statements at 31 December 2014
Credit risk impairment
Impairment variance during the period
In millions of euros Year to 31 Dec. 2014 Year to 31 Dec. 2013(1)
Total impairment at beginning of year 27,014 26,976 Net allowance to impairment 3,501 3,792
Impairment provisions used (3,146) (3,055)
Effect of exchange rate movements and other items 576 (699)
Total impairment at end of year 27,945 27,014 (1) Restated according to IFRS 10 and 11 and the amendment to IAS 32 (see notes 1.a and 2).
Impairment by asset type
In millions of euros 31 December 2014 31 December 2013(1)
Impairment of assets Loans and receivables due from credit institutions (note 5.f) 257 392
Loans and receivables due from customers (note 5.g) 26,418 25,336
Financial instruments of trading activities 132 162
Available-for-sale financial assets (note 5.c) 85 84
Other assets 39 38 - -
Total impairment of financial assets 26,931 26,012
of which specific impairment 23,248 22,395
of which collective provisions 3,683 3,617
Provisions recognised as liabilities
Provisions for commitments given
- to credit institutions 19 23
- to customers 434 469
Other specific provisions 561 510 Total provisions recognised for credit commitments (note 5.q) 1,014 1,002
of which specific impairment for commitments given 312 335
of which collective provisions 142 157
Total impairment and provisions 27,945 27,014
(1) Restated according to IFRS 10 and 11 and the amendment to IAS 32 (see notes 1.a and 2).
- 46 -
Consolidated financial statements at 31 December 2014
3.g COSTS RELATED TO THE COMPREHENSIVE SETTLEMENT WITH US AUTHORITIES
On 30 June 2014, the Group has come to a comprehensive settlement of the pending investigation
relating to US dollar transactions involving parties subject to US sanctions, including agreements with
the U.S. Department of Justice, the U.S. Attorney’s Office for the Southern District of New York, the New York County District Attorney’s Office, the Board of Governors of the U.S. Federal Reserve System
(FED), the New York State Department of Financial Services (DFS), and the US Department of the
Treasury’s Office of Foreign Assets Control (OFAC).
The settlement includes guilty pleas entered into by BNP Paribas SA in relation to violations of certain
US laws and regulations regarding economic sanctions against certain countries and related recordkeeping. BNP Paribas also agrees to pay a total of USD 8.97 billion (EUR 6.55 billion). Beyond
what has already been provisioned as at 31 December 2013 (EUR 0.8 billion), this resulted in an
exceptional charge of EUR 5.75 billion recorded in the second quarter of 2014. An uncertainty remains
regarding the fiscal rule that will apply eventually to the different Group entities involved in the
settlement. BNP Paribas also accepts a temporary suspension of one year, starting 1 January 2015, of the USD direct clearing focused mainly on the Oil & Gas Energy & Commodity Finance business line in
certain locations.
BNP Paribas has worked with the US authorities to resolve these issues and the resolution of these
matters was coordinated by its home regulator (Autorité de Contrôle Prudentiel et de Résolution - ACPR)
with its lead regulators. BNP Paribas maintains its licenses as part of the settlements.
In advance of the settlement, the bank designed new robust compliance and control procedures. They
involve important changes to the Group’s procedures. Specifically:
a new department called Group Financial Security US, part of the Group Compliance function, is headquartered in New York and ensures that BNP Paribas complies globally with US
regulation related to international sanctions and embargoes.
all USD flows for the entire BNP Paribas Group will be ultimately processed and controlled via the branch in New York.
The Group recorded a EUR 250 million provision for additional implementation costs related to the
remediation plan agreed upon with US authorities. Including these, total costs related to the
comprehensive settlement amount to EUR 6 billion for the year ended 31 December 2014.
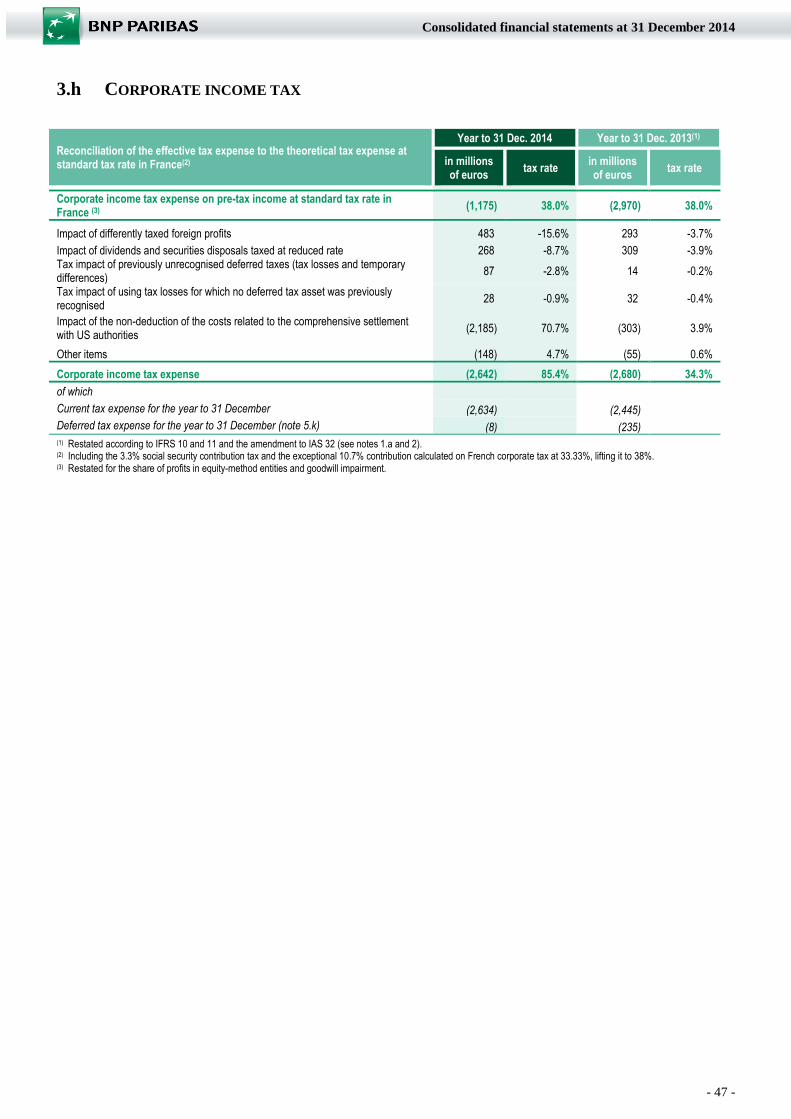
- 47 -
Consolidated financial statements at 31 December 2014
3.h CORPORATE INCOME TAX
Reconciliation of the effective tax expense to the theoretical tax expense at standard tax rate in France(2)
Year to 31 Dec. 2014 Year to 31 Dec. 2013(1)
in millions of euros tax rate
in millions of euros
tax rate
Corporate income tax expense on pre-tax income at standard tax rate in France (3) (1,175) 38.0% (2,970) 38.0%
Impact of differently taxed foreign profits 483 -15.6% 293 -3.7%
Impact of dividends and securities disposals taxed at reduced rate 268 -8.7% 309 -3.9% Tax impact of previously unrecognised deferred taxes (tax losses and temporary differences) 87 -2.8% 14 -0.2%
Tax impact of using tax losses for which no deferred tax asset was previously recognised 28 -0.9% 32 -0.4%
Impact of the non-deduction of the costs related to the comprehensive settlement with US authorities (2,185) 70.7% (303) 3.9%
Other items (148) 4.7% (55) 0.6%
Corporate income tax expense (2,642) 85.4% (2,680) 34.3%
of which
Current tax expense for the year to 31 December (2,634) (2,445)
Deferred tax expense for the year to 31 December (note 5.k) (8) (235) (1) Restated according to IFRS 10 and 11 and the amendment to IAS 32 (see notes 1.a and 2).
(2) Including the 3.3% social security contribution tax and the exceptional 10.7% contribution calculated on French corporate tax at 33.33%, lifting it to 38%. (3) Restated for the share of profits in equity-method entities and goodwill impairment.

- 48 -
Consolidated financial statements at 31 December 2014
4 . SEGMENT INFORM ATION
The Group is composed of three core businesses:
Retail Banking (RB), which covers Domestic Markets, Personal Finance, and International Retail Banking. Domestic Markets include retail banking networks in France (FRB), Italy (BNL banca
commerciale), Belgium (BRB), and Luxembourg (LRB), as well as certain specialised retail banking
divisions (Personal Investors, Leasing Solutions and Arval). International Retail Banking is composed of all BNP Paribas Group retail banking businesses out of the Eurozone, split between
Europe Mediterranean and BancWest in the United States;
Investment Solutions (IS), which includes Wealth Management; Investment Partners – covering all of the Group’s Asset Management businesses; Securities Services to management companies,
financial institutions and other corporations; Insurance and Real Estate Services;
Corporate and Investment Banking (CIB), which includes Advisory & Capital Markets (Equities and Equity Derivatives, Fixed Income & Forex, Corporate Finance) and Corporate Banking (Europe,
Asia, Americas, Middle East Africa) businesses.
Other activities mainly include Principal Investments, activities related to the Group’s central treasury
function, some costs related to cross-business projects, the residential mortgage lending business of
Personal Finance (a significant part of which is managed in run-off), and investments such as the
Klépierre property investment company.
They also include non-recurring items resulting from applying the rules on business combinations. In order to provide consistent and relevant economic information for each core business, the impact of
amortising fair value adjustments recognised in the net equity of entities acquired and restructuring
costs incurred in respect to the integration of entities, have been allocated to the “Other Activities”
segment. The same applies to transformation costs relating to the Group’s cross-business savings
programme (Simple and Efficient).
Inter-segment transactions are conducted at arm’s length. The segment information presented
comprises agreed inter-segment transfer prices.
The capital allocation is carried out on the basis of risk exposure, taking into account various
conventions relating primarily to the capital requirement of the business as derived from the risk-
weighted asset calculations required under capital adequacy rules. Normalised equity income by segment is determined by attributing to each segment the income of its allocated equity. The equity
allocation to segments is based on 9% of weighted assets. The breakdown of balance sheet by core
business follows the same rules as the breakdown of the profit and loss by core business.
So as to be comparable with 2014, the segment information for 2013 has been restated of the following main effects as if these had occurred from 1 January 2013:
1. In the context of the medium-term plan, internal transfers of activities and results have been
made as of 1 January 2014, the main ones being:
the allocation of the mortgage activity of Personal Finance to the Corporate Centre (a significant portion of which is managed in run-off);
the set-up of two new internal Private Banking joint ventures between Investment Solutions and, on the one hand TEB group (Europe-Mediterranean), on the other hand
BancWest. Henceforth, the results of Europe-Mediterranean and BancWest are published
in an identical manner to that of Domestic Markets;
the reallocation of Hello bank! launching costs, previously accounted for under “Other Domestic Markets”, to the operating businesses of Domestic Markets which benefit from
them.
2. The capital allocation by division and business line has been modified to take into account the
application of Basel 3 (CRD 4) starting from 1 January 2014 and the above-mentioned internal
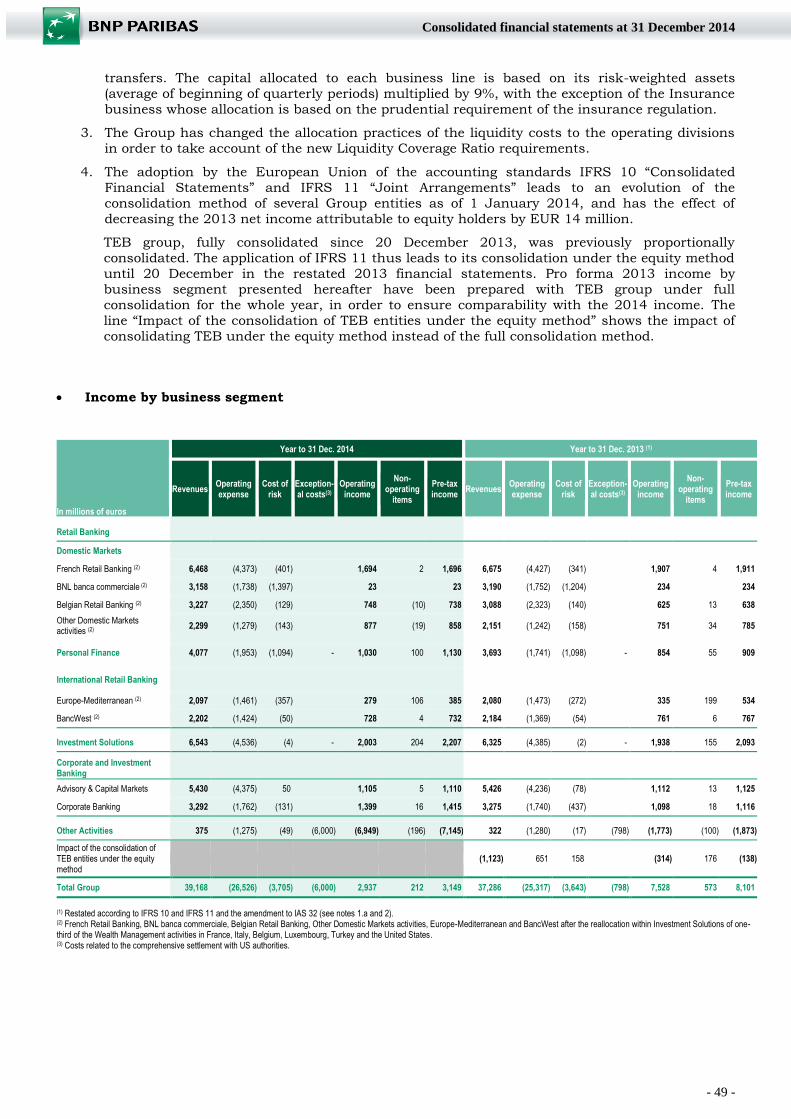
- 49 -
Consolidated financial statements at 31 December 2014
transfers. The capital allocated to each business line is based on its risk-weighted assets
(average of beginning of quarterly periods) multiplied by 9%, with the exception of the Insurance
business whose allocation is based on the prudential requirement of the insurance regulation.
3. The Group has changed the allocation practices of the liquidity costs to the operating divisions
in order to take account of the new Liquidity Coverage Ratio requirements.
4. The adoption by the European Union of the accounting standards IFRS 10 “Consolidated
Financial Statements” and IFRS 11 “Joint Arrangements” leads to an evolution of the
consolidation method of several Group entities as of 1 January 2014, and has the effect of
decreasing the 2013 net income attributable to equity holders by EUR 14 million.
TEB group, fully consolidated since 20 December 2013, was previously proportionally
consolidated. The application of IFRS 11 thus leads to its consolidation under the equity method
until 20 December in the restated 2013 financial statements. Pro forma 2013 income by
business segment presented hereafter have been prepared with TEB group under full
consolidation for the whole year, in order to ensure comparability with the 2014 income. The
line “Impact of the consolidation of TEB entities under the equity method” shows the impact of
consolidating TEB under the equity method instead of the full consolidation method.
Income by business segment
In millions of euros
Year to 31 Dec. 2014 Year to 31 Dec. 2013 (1)
Revenues Operating expense
Cost of risk
Exception- al costs(3)
Operating income
Non-operating
items
Pre-tax income
Revenues Operating expense
Cost of risk
Exception- al costs(3)
Operating income
Non-operating
items
Pre-tax income
Retail Banking
Domestic Markets
French Retail Banking (2) 6,468 (4,373) (401) 1,694 2 1,696 6,675 (4,427) (341) 1,907 4 1,911
BNL banca commerciale (2) 3,158 (1,738) (1,397) 23 23 3,190 (1,752) (1,204) 234 234
Belgian Retail Banking (2) 3,227 (2,350) (129) 748 (10) 738 3,088 (2,323) (140) 625 13 638
Other Domestic Markets activities (2)
2,299 (1,279) (143) 877 (19) 858 2,151 (1,242) (158) 751 34 785
Personal Finance 4,077 (1,953) (1,094) - 1,030 100 1,130 3,693 (1,741) (1,098) - 854 55 909
International Retail Banking
Europe-Mediterranean (2) 2,097 (1,461) (357) 279 106 385 2,080 (1,473) (272) 335 199 534
BancWest (2) 2,202 (1,424) (50) 728 4 732 2,184 (1,369) (54) 761 6 767
Investment Solutions 6,543 (4,536) (4) - 2,003 204 2,207 6,325 (4,385) (2) - 1,938 155 2,093
Corporate and Investment Banking
Advisory & Capital Markets 5,430 (4,375) 50 1,105 5 1,110 5,426 (4,236) (78) 1,112 13 1,125
Corporate Banking 3,292 (1,762) (131) 1,399 16 1,415 3,275 (1,740) (437) 1,098 18 1,116
Other Activities 375 (1,275) (49) (6,000) (6,949) (196) (7,145) 322 (1,280) (17) (798) (1,773) (100) (1,873)
Impact of the consolidation of TEB entities under the equity method
(1,123) 651 158 (314) 176 (138)
Total Group 39,168 (26,526) (3,705) (6,000) 2,937 212 3,149 37,286 (25,317) (3,643) (798) 7,528 573 8,101
(1) Restated according to IFRS 10 and IFRS 11 and the amendment to IAS 32 (see notes 1.a and 2). (2) French Retail Banking, BNL banca commerciale, Belgian Retail Banking, Other Domestic Markets activities, Europe-Mediterranean and BancWest after the reallocation within Investment Solutions of one-third of the Wealth Management activities in France, Italy, Belgium, Luxembourg, Turkey and the United States. (3) Costs related to the comprehensive settlement with US authorities.
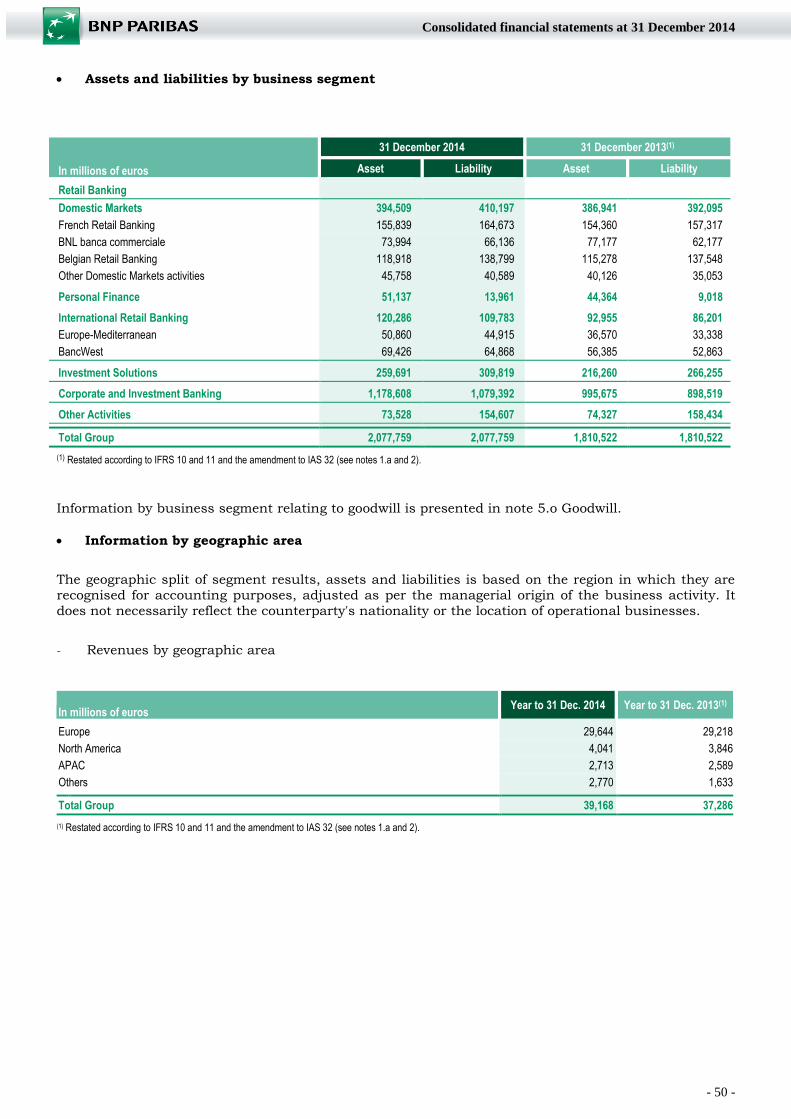
- 50 -
Consolidated financial statements at 31 December 2014
Assets and liabilities by business segment
In millions of euros
31 December 2014 31 December 2013(1)
Asset Liability Asset Liability Retail Banking
Domestic Markets 394,509 410,197 386,941 392,095 French Retail Banking 155,839 164,673 154,360 157,317 BNL banca commerciale 73,994 66,136 77,177 62,177 Belgian Retail Banking 118,918 138,799 115,278 137,548 Other Domestic Markets activities 45,758 40,589 40,126 35,053 Personal Finance 51,137 13,961 44,364 9,018 International Retail Banking 120,286 109,783 92,955 86,201 Europe-Mediterranean 50,860 44,915 36,570 33,338 BancWest 69,426 64,868 56,385 52,863
Investment Solutions 259,691 309,819 216,260 266,255
Corporate and Investment Banking 1,178,608 1,079,392 995,675 898,519
Other Activities 73,528 154,607 74,327 158,434 Total Group 2,077,759 2,077,759 1,810,522 1,810,522 (1) Restated according to IFRS 10 and 11 and the amendment to IAS 32 (see notes 1.a and 2).
Information by business segment relating to goodwill is presented in note 5.o Goodwill.
Information by geographic area
The geographic split of segment results, assets and liabilities is based on the region in which they are
recognised for accounting purposes, adjusted as per the managerial origin of the business activity. It
does not necessarily reflect the counterparty's nationality or the location of operational businesses.
- Revenues by geographic area
In millions of euros Year to 31 Dec. 2014 Year to 31 Dec. 2013(1)
Europe 29,644 29,218 North America 4,041 3,846 APAC 2,713 2,589 Others 2,770 1,633 Total Group 39,168 37,286
(1) Restated according to IFRS 10 and 11 and the amendment to IAS 32 (see notes 1.a and 2).
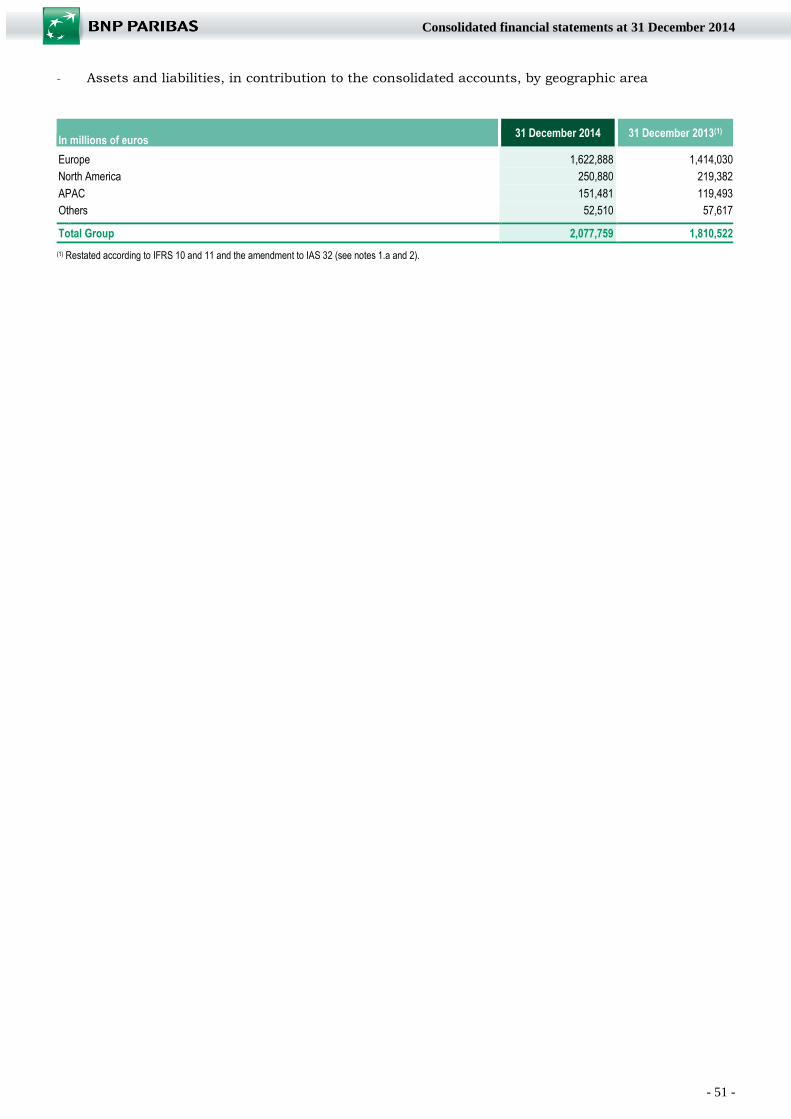
- 51 -
Consolidated financial statements at 31 December 2014
- Assets and liabilities, in contribution to the consolidated accounts, by geographic area
In millions of euros 31 December 2014 31 December 2013(1)
Europe 1,622,888 1,414,030 North America 250,880 219,382 APAC 151,481 119,493 Others 52,510 57,617 Total Group 2,077,759 1,810,522 (1) Restated according to IFRS 10 and 11 and the amendment to IAS 32 (see notes 1.a and 2).
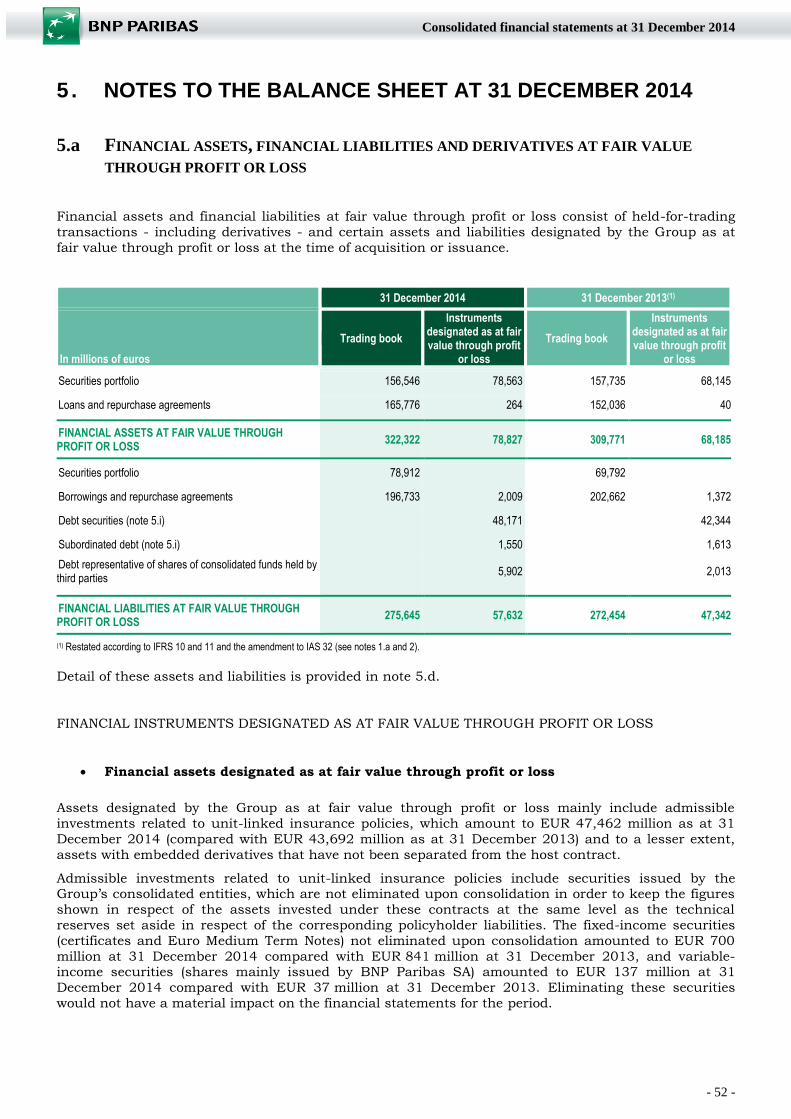
- 52 -
Consolidated financial statements at 31 December 2014
5 . NOTES TO THE BALANCE SHEET AT 31 DECEMBER 2014
5.a FINANCIAL ASSETS, FINANCIAL LIABILITIES AND DERIVATIVES AT FAIR VALUE
THROUGH PROFIT OR LOSS
Financial assets and financial liabilities at fair value through profit or loss consist of held-for-trading
transactions - including derivatives - and certain assets and liabilities designated by the Group as at
fair value through profit or loss at the time of acquisition or issuance.
31 December 2014 31 December 2013(1)
In millions of euros
Trading book
Instruments designated as at fair value through profit
or loss
Trading book
Instruments designated as at fair value through profit
or loss Securities portfolio 156,546 78,563 157,735 68,145 Loans and repurchase agreements 165,776 264 152,036 40
FINANCIAL ASSETS AT FAIR VALUE THROUGH PROFIT OR LOSS
322,322 78,827 309,771 68,185
Securities portfolio 78,912 69,792 Borrowings and repurchase agreements 196,733 2,009 202,662 1,372 Debt securities (note 5.i) 48,171 42,344 Subordinated debt (note 5.i) 1,550 1,613
Debt representative of shares of consolidated funds held by third parties 5,902 2,013
FINANCIAL LIABILITIES AT FAIR VALUE THROUGH PROFIT OR LOSS
275,645 57,632 272,454 47,342
(1) Restated according to IFRS 10 and 11 and the amendment to IAS 32 (see notes 1.a and 2).
Detail of these assets and liabilities is provided in note 5.d.
FINANCIAL INSTRUMENTS DESIGNATED AS AT FAIR VALUE THROUGH PROFIT OR LOSS
Financial assets designated as at fair value through profit or loss
Assets designated by the Group as at fair value through profit or loss mainly include admissible
investments related to unit-linked insurance policies, which amount to EUR 47,462 million as at 31
December 2014 (compared with EUR 43,692 million as at 31 December 2013) and to a lesser extent,
assets with embedded derivatives that have not been separated from the host contract.
Admissible investments related to unit-linked insurance policies include securities issued by the Group’s consolidated entities, which are not eliminated upon consolidation in order to keep the figures
shown in respect of the assets invested under these contracts at the same level as the technical
reserves set aside in respect of the corresponding policyholder liabilities. The fixed-income securities
(certificates and Euro Medium Term Notes) not eliminated upon consolidation amounted to EUR 700
million at 31 December 2014 compared with EUR 841 million at 31 December 2013, and variable-income securities (shares mainly issued by BNP Paribas SA) amounted to EUR 137 million at 31
December 2014 compared with EUR 37 million at 31 December 2013. Eliminating these securities
would not have a material impact on the financial statements for the period.
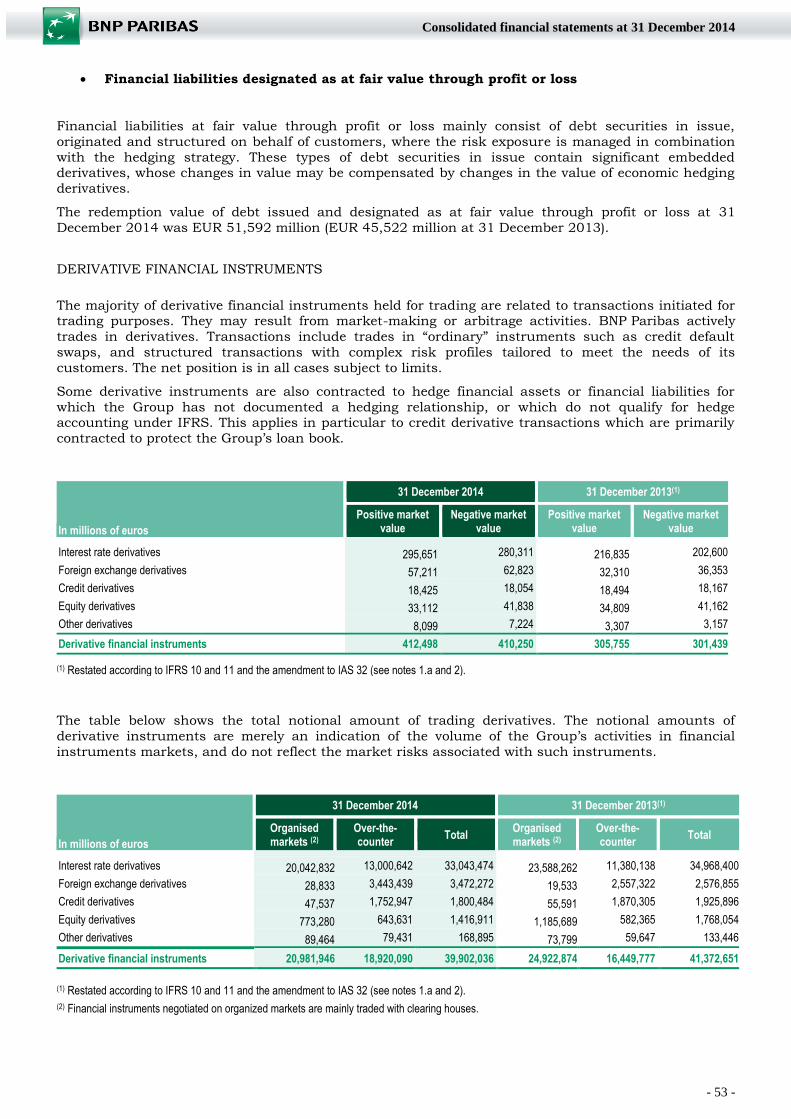
- 53 -
Consolidated financial statements at 31 December 2014
Financial liabilities designated as at fair value through profit or loss
Financial liabilities at fair value through profit or loss mainly consist of debt securities in issue,
originated and structured on behalf of customers, where the risk exposure is managed in combination
with the hedging strategy. These types of debt securities in issue contain significant embedded derivatives, whose changes in value may be compensated by changes in the value of economic hedging
derivatives.
The redemption value of debt issued and designated as at fair value through profit or loss at 31
December 2014 was EUR 51,592 million (EUR 45,522 million at 31 December 2013).
DERIVATIVE FINANCIAL INSTRUMENTS
The majority of derivative financial instruments held for trading are related to transactions initiated for trading purposes. They may result from market-making or arbitrage activities. BNP Paribas actively
trades in derivatives. Transactions include trades in “ordinary” instruments such as credit default
swaps, and structured transactions with complex risk profiles tailored to meet the needs of its
customers. The net position is in all cases subject to limits.
Some derivative instruments are also contracted to hedge financial assets or financial liabilities for
which the Group has not documented a hedging relationship, or which do not qualify for hedge accounting under IFRS. This applies in particular to credit derivative transactions which are primarily
contracted to protect the Group’s loan book.
In millions of euros
31 December 2014 31 December 2013(1)
Positive market value
Negative market value
Positive market value
Negative market value
Interest rate derivatives 295,651 280,311 216,835 202,600
Foreign exchange derivatives 57,211 62,823 32,310 36,353
Credit derivatives 18,425 18,054 18,494 18,167
Equity derivatives 33,112 41,838 34,809 41,162
Other derivatives 8,099 7,224 3,307 3,157
Derivative financial instruments 412,498 410,250 305,755 301,439
(1) Restated according to IFRS 10 and 11 and the amendment to IAS 32 (see notes 1.a and 2).
The table below shows the total notional amount of trading derivatives. The notional amounts of
derivative instruments are merely an indication of the volume of the Group’s activities in financial
instruments markets, and do not reflect the market risks associated with such instruments.
In millions of euros
31 December 2014 31 December 2013(1)
Organised markets (2)
Over-the-counter
Total Organised markets (2)
Over-the-counter
Total
Interest rate derivatives 20,042,832 13,000,642 33,043,474 23,588,262 11,380,138 34,968,400
Foreign exchange derivatives 28,833 3,443,439 3,472,272 19,533 2,557,322 2,576,855
Credit derivatives 47,537 1,752,947 1,800,484 55,591 1,870,305 1,925,896
Equity derivatives 773,280 643,631 1,416,911 1,185,689 582,365 1,768,054
Other derivatives 89,464 79,431 168,895 73,799 59,647 133,446
Derivative financial instruments 20,981,946 18,920,090 39,902,036 24,922,874 16,449,777 41,372,651
(1) Restated according to IFRS 10 and 11 and the amendment to IAS 32 (see notes 1.a and 2).
(2) Financial instruments negotiated on organized markets are mainly traded with clearing houses.
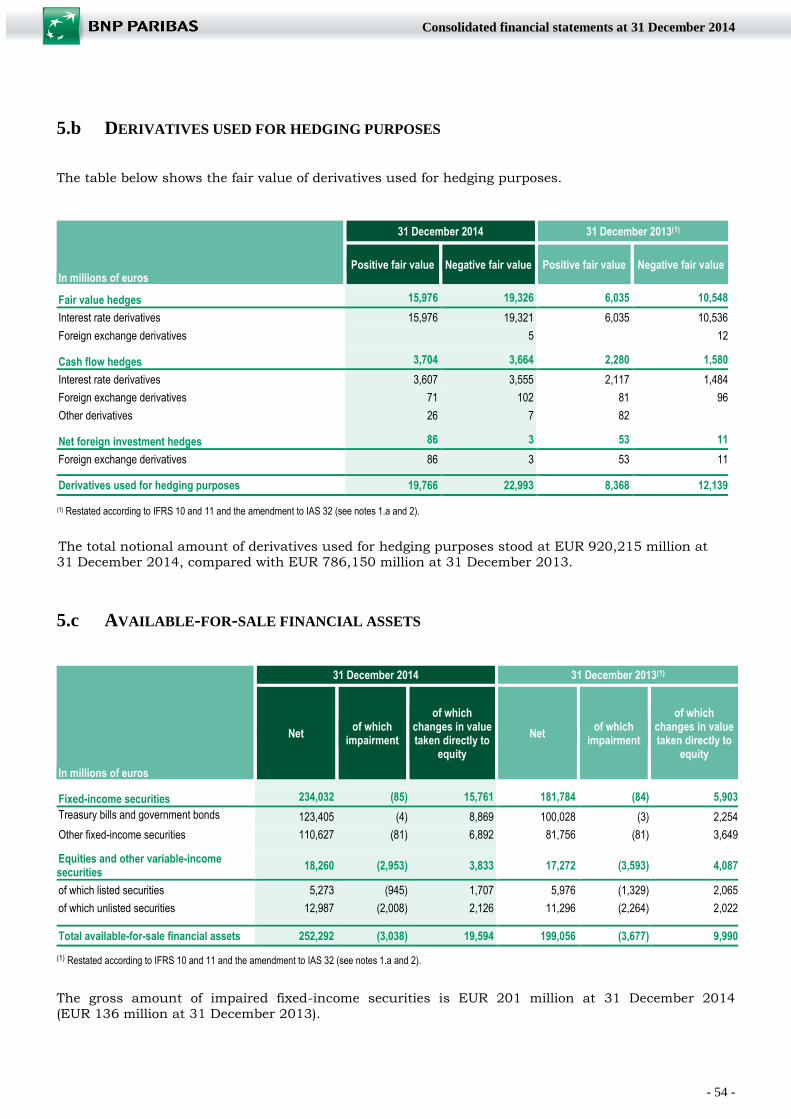
- 54 -
Consolidated financial statements at 31 December 2014
5.b DERIVATIVES USED FOR HEDGING PURPOSES
The table below shows the fair value of derivatives used for hedging purposes.
In millions of euros
31 December 2014 31 December 2013(1)
Positive fair value Negative fair value Positive fair value Negative fair value
Fair value hedges 15,976 19,326 6,035 10,548
Interest rate derivatives 15,976 19,321 6,035 10,536
Foreign exchange derivatives 5 12 Cash flow hedges 3,704 3,664 2,280 1,580
Interest rate derivatives 3,607 3,555 2,117 1,484
Foreign exchange derivatives 71 102 81 96
Other derivatives 26 7 82
Net foreign investment hedges 86 3 53 11
Foreign exchange derivatives 86 3 53 11
Derivatives used for hedging purposes 19,766 22,993 8,368 12,139
(1) Restated according to IFRS 10 and 11 and the amendment to IAS 32 (see notes 1.a and 2).
The total notional amount of derivatives used for hedging purposes stood at EUR 920,215 million at
31 December 2014, compared with EUR 786,150 million at 31 December 2013.
5.c AVAILABLE-FOR-SALE FINANCIAL ASSETS
In millions of euros
31 December 2014 31 December 2013(1)
Net of which impairment
of which changes in value taken directly to
equity
Net of which
impairment
of which changes in value taken directly to
equity
Fixed-income securities 234,032 (85) 15,761 181,784 (84) 5,903
Treasury bills and government bonds 123,405 (4) 8,869 100,028 (3) 2,254
Other fixed-income securities 110,627 (81) 6,892 81,756 (81) 3,649 Equities and other variable-income securities 18,260 (2,953) 3,833 17,272 (3,593) 4,087
of which listed securities 5,273 (945) 1,707 5,976 (1,329) 2,065
of which unlisted securities 12,987 (2,008) 2,126 11,296 (2,264) 2,022
Total available-for-sale financial assets 252,292 (3,038) 19,594 199,056 (3,677) 9,990
(1) Restated according to IFRS 10 and 11 and the amendment to IAS 32 (see notes 1.a and 2).
The gross amount of impaired fixed-income securities is EUR 201 million at 31 December 2014
(EUR 136 million at 31 December 2013).
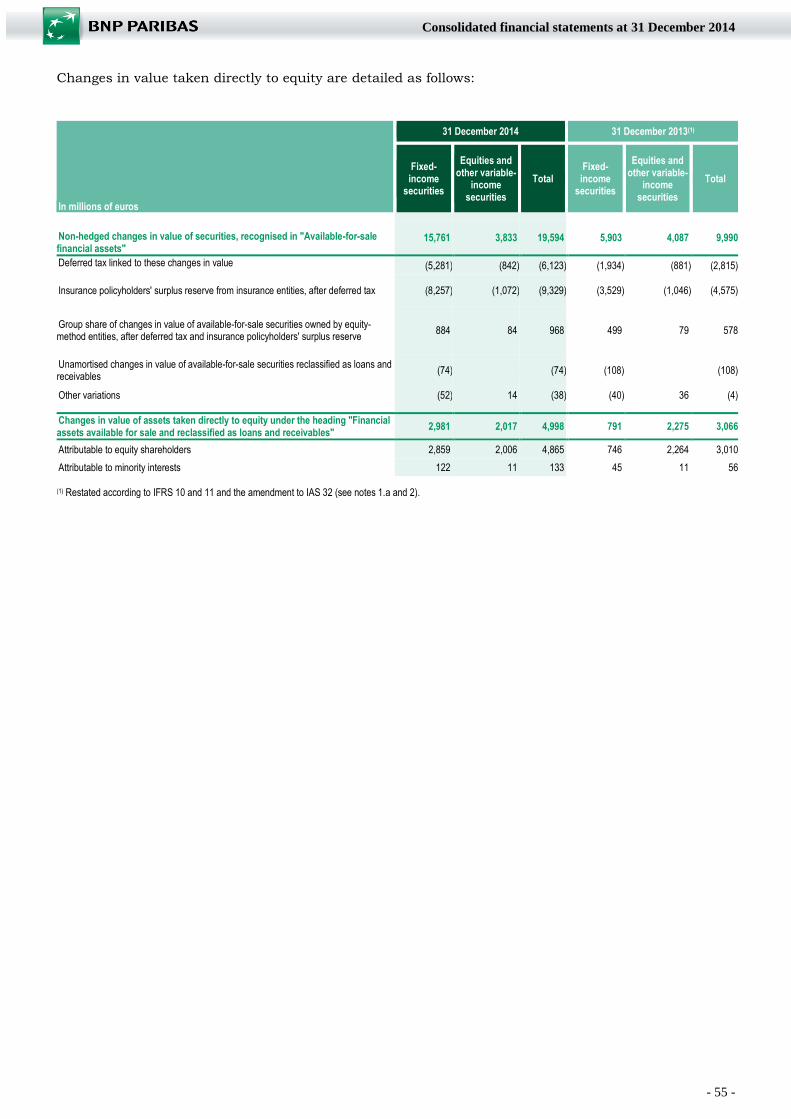
- 55 -
Consolidated financial statements at 31 December 2014
Changes in value taken directly to equity are detailed as follows:
In millions of euros
31 December 2014 31 December 2013(1)
Fixed-income
securities
Equities and other variable-
income securities
Total Fixed-income
securities
Equities and other variable-
income securities
Total
Non-hedged changes in value of securities, recognised in "Available-for-sale financial assets"
15,761 3,833 19,594 5,903 4,087 9,990
Deferred tax linked to these changes in value (5,281) (842) (6,123) (1,934) (881) (2,815)
Insurance policyholders' surplus reserve from insurance entities, after deferred tax (8,257) (1,072) (9,329) (3,529) (1,046) (4,575)
Group share of changes in value of available-for-sale securities owned by equity-method entities, after deferred tax and insurance policyholders' surplus reserve
884 84 968 499 79 578
Unamortised changes in value of available-for-sale securities reclassified as loans and receivables
(74) (74) (108) (108)
Other variations (52) 14 (38) (40) 36 (4)
Changes in value of assets taken directly to equity under the heading "Financial assets available for sale and reclassified as loans and receivables"
2,981 2,017 4,998 791 2,275 3,066
Attributable to equity shareholders 2,859 2,006 4,865 746 2,264 3,010
Attributable to minority interests 122 11 133 45 11 56 (1) Restated according to IFRS 10 and 11 and the amendment to IAS 32 (see notes 1.a and 2).
- 56 -
Consolidated financial statements at 31 December 2014
5.d MEASUREMENT OF THE FAIR VALUE OF FINANCIAL INSTRUMENTS
VALUATION PROCESS
BNP Paribas has retained the fundamental principle that it should have a unique and integrated processing chain for producing and controlling the valuations of financial instruments that are used for
the purpose of daily risk management and financial reporting. All these processes are based on a
common economic valuation which is a core component of business decisions and risk management
strategies.
Economic value is composed of mid-market value and additional valuation adjustments.
Mid-market value is derived from external data or valuation techniques that maximise the use of observable and market-based data. Mid-market value is a theoretical additive value which does not take
account of i) the direction of the transaction or its impact on the existing risks in the portfolio, ii) the
nature of the counterparties, and iii) the aversion of a market participant to particular risks inherent in
the instrument, the market in which it is traded, or the risk management strategy.
Additional valuation adjustments take into account valuation uncertainty and include market and credit risk premiums to reflect costs that could be incurred in case of an exit transaction in the
principal market. When valuation techniques are used for the purpose of deriving fair value, funding
assumptions related to the future expected cash flows are an integral part of the mid-market valuation,
notably through the use of appropriate discount rates. These assumptions reflect what the Bank
anticipates as being the effective funding conditions of the instrument that a market participant would
consider. This notably takes into account the existence and terms of any collateral agreement. In particular, for non- or imperfectly collateralized derivative instruments, they include an explicit
adjustment to the interbank interest rate (Funding Valuation Adjustment – FVA).
Fair value generally equals the economic value, subject to limited additional adjustments, such as own
credit adjustments, which are specifically required by IFRS standards.
The main additional valuation adjustments are presented in the section below.
ADDITIONAL VALUATION ADJUSTMENTS
Additional valuation adjustments retained by BNP Paribas for determining fair values are as follows:
Bid/offer adjustments: the bid/offer range reflects the additional exit cost for a price taker and
symmetrically the compensation sought by dealers to bear the risk of holding the position or closing it
out by accepting another dealer’s price.
BNP Paribas assumes that the best estimate of an exit price is the bid or offer price, unless there is evidence that another point in the bid/offer range would provide a more representative exit price.
Input uncertainty adjustments: when the observation of prices or data inputs required by valuation
techniques is difficult or irregular, an uncertainty exists on the exit price. There are several ways to
gauge the degree of uncertainty on the exit price such as measuring the dispersion of the available price
indications or estimating the possible ranges of the inputs to a valuation technique.
Model uncertainty adjustments: these relate to situations where valuation uncertainty is due to the
valuation technique used, even though observable inputs might be available. This situation arises when
the risks inherent in the instruments are different from those available in the observable data, and
therefore the valuation technique involves assumptions that cannot be easily corroborated.
Credit valuation adjustment (CVA): the CVA adjustment applies to valuations and market quotations
whereby the credit worthiness of the counterparty is not reflected. It aims to account for the possibility
that the counterparty may default and that BNP Paribas may not receive the full fair value of the
transactions.
In determining the cost of exiting or transferring counterparty risk exposures, the relevant market is
deemed to be an inter-dealer market. However, the determination of CVA remains judgemental due to i)
- 57 -
Consolidated financial statements at 31 December 2014
the possible absence or lack of price discovery in the inter-dealer market, ii) the influence of the
regulatory landscape relating to counterparty risk on the market participants’ pricing behaviour and iii)
the absence of a dominant business model for managing counterparty risk.
The CVA model is grounded on the same exposures as those used for regulatory purposes. The model
attempts to estimate the cost of an optimal risk management strategy based on i) implicit incentives
and constraints inherent in the regulations in force and their evolutions, ii) market perception of the
probability of default and iii) default parameters used for regulatory purposes.
Own-credit valuation adjustment for debts (OCA) and for derivatives (debit valuation adjustment
- DVA): OCA and DVA are adjustments reflecting the effect of credit worthiness of BNP Paribas, on
respectively the value of debt securities designated as at fair value through profit and loss and
derivatives. Both adjustments are based on the expected future liability profiles of such instruments.
The own credit worthiness is inferred from the market-based observation of the relevant bond issuance
levels. The DVA adjustment is determined after taking into account the Funding Valuation Adjustment (FVA).
Thus, the carrying value of debt securities designated as at fair value though profit or loss is increased
by EUR 682 million as at 31 December 2014, compared with an increase in value of EUR 405 million as
at 31 December 2013, i.e. a - EUR 277 million variation recognised in net gain on financial instruments
at fair value through profit or loss (note 3.c).
INSTRUMENT CLASSES AND CLASSIFICATION WITHIN THE FAIR VALUE HIERARCHY FOR
ASSETS AND LIABILITIES MEASURED AT FAIR VALUE
As explained in the summary of significant accounting policies (note 1.c.10), financial instruments measured at fair value are categorised into a fair value hierarchy consisting of three levels.
The disaggregation of assets and liabilities into risk classes is meant to provide further insight into the
nature of the instruments:
Securitised exposures are further broken down by collateral type.
For derivatives, fair values are broken down by dominant risk factor, namely interest rate, foreign exchange, credit and equity. Derivatives used for hedging purposes are mainly interest rate derivatives.
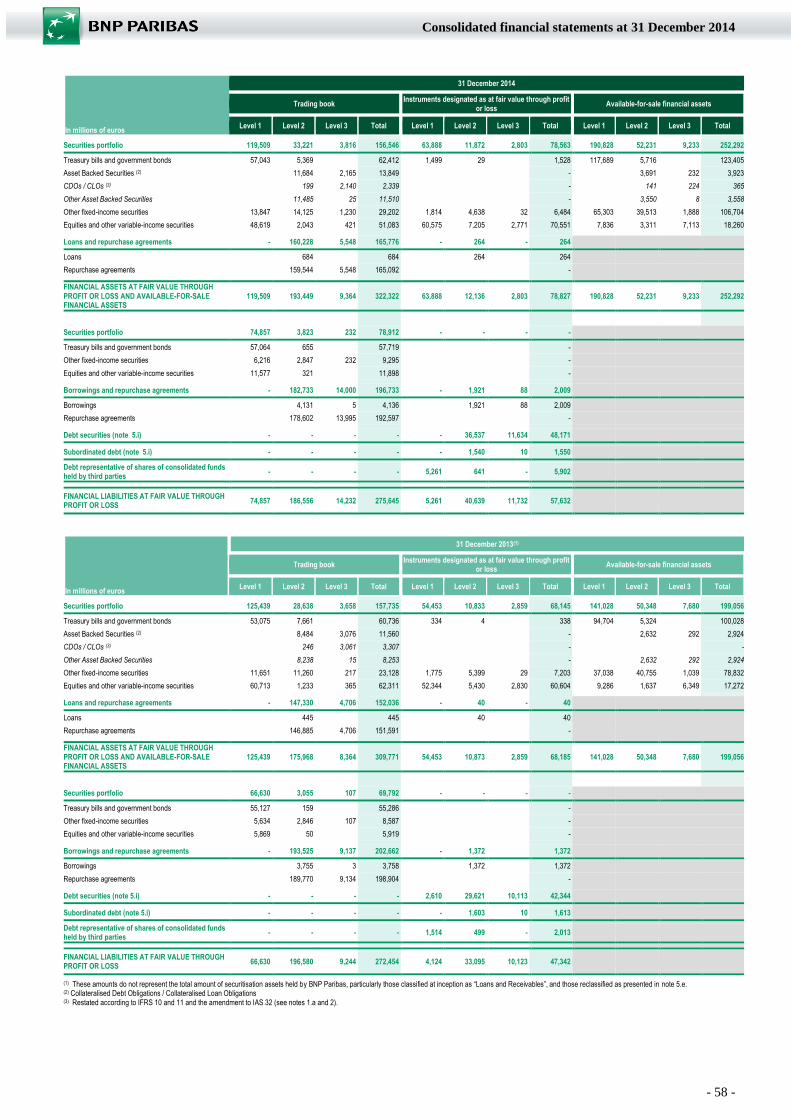
- 58 -
Consolidated financial statements at 31 December 2014
In millions of euros
31 December 2014
Trading book Instruments designated as at fair value through profit or loss
Available-for-sale financial assets
Level 1 Level 2 Level 3 Total Level 1 Level 2 Level 3 Total Level 1 Level 2 Level 3 Total
Securities portfolio 119,509 33,221 3,816 156,546 63,888 11,872 2,803 78,563 190,828 52,231 9,233 252,292
Treasury bills and government bonds 57,043 5,369 62,412 1,499 29 1,528 117,689 5,716 123,405
Asset Backed Securities (2) 11,684 2,165 13,849 - 3,691 232 3,923
CDOs / CLOs (3) 199 2,140 2,339 - 141 224 365
Other Asset Backed Securities 11,485 25 11,510 - 3,550 8 3,558
Other fixed-income securities 13,847 14,125 1,230 29,202 1,814 4,638 32 6,484 65,303 39,513 1,888 106,704
Equities and other variable-income securities 48,619 2,043 421 51,083 60,575 7,205 2,771 70,551 7,836 3,311 7,113 18,260
Loans and repurchase agreements - 160,228 5,548 165,776 - 264 - 264
Loans 684 684 264 264
Repurchase agreements 159,544 5,548 165,092 -
FINANCIAL ASSETS AT FAIR VALUE THROUGH PROFIT OR LOSS AND AVAILABLE-FOR-SALE FINANCIAL ASSETS
119,509 193,449 9,364 322,322 63,888 12,136 2,803 78,827 190,828 52,231 9,233 252,292
Securities portfolio 74,857 3,823 232 78,912 - - - -
Treasury bills and government bonds 57,064 655 57,719 -
Other fixed-income securities 6,216 2,847 232 9,295 -
Equities and other variable-income securities 11,577 321 11,898 -
Borrowings and repurchase agreements - 182,733 14,000 196,733 - 1,921 88 2,009
Borrowings 4,131 5 4,136 1,921 88 2,009
Repurchase agreements 178,602 13,995 192,597 -
Debt securities (note 5.i) - - - - - 36,537 11,634 48,171
Subordinated debt (note 5.i) - - - - - 1,540 10 1,550
Debt representative of shares of consolidated funds
held by third parties - - - - 5,261 641 - 5,902
FINANCIAL LIABILITIES AT FAIR VALUE THROUGH PROFIT OR LOSS
74,857 186,556 14,232 275,645 5,261 40,639 11,732 57,632
In millions of euros
31 December 2013(1)
Trading book Instruments designated as at fair value through profit or loss
Available-for-sale financial assets
Level 1 Level 2 Level 3 Total Level 1 Level 2 Level 3 Total Level 1 Level 2 Level 3 Total
Securities portfolio 125,439 28,638 3,658 157,735 54,453 10,833 2,859 68,145 141,028 50,348 7,680 199,056
Treasury bills and government bonds 53,075 7,661 60,736 334 4 338 94,704 5,324 100,028
Asset Backed Securities (2) 8,484 3,076 11,560 - 2,632 292 2,924
CDOs / CLOs (3) 246 3,061 3,307 - -
Other Asset Backed Securities 8,238 15 8,253 - 2,632 292 2,924
Other fixed-income securities 11,651 11,260 217 23,128 1,775 5,399 29 7,203 37,038 40,755 1,039 78,832
Equities and other variable-income securities 60,713 1,233 365 62,311 52,344 5,430 2,830 60,604 9,286 1,637 6,349 17,272
Loans and repurchase agreements - 147,330 4,706 152,036 - 40 - 40
Loans 445 445 40 40
Repurchase agreements 146,885 4,706 151,591 -
FINANCIAL ASSETS AT FAIR VALUE THROUGH PROFIT OR LOSS AND AVAILABLE-FOR-SALE FINANCIAL ASSETS
125,439 175,968 8,364 309,771 54,453 10,873 2,859 68,185 141,028 50,348 7,680 199,056
Securities portfolio 66,630 3,055 107 69,792 - - - -
Treasury bills and government bonds 55,127 159 55,286 -
Other fixed-income securities 5,634 2,846 107 8,587 -
Equities and other variable-income securities 5,869 50 5,919 -
Borrowings and repurchase agreements - 193,525 9,137 202,662 - 1,372 1,372
Borrowings 3,755 3 3,758 1,372 1,372
Repurchase agreements 189,770 9,134 198,904 -
Debt securities (note 5.i) - - - - 2,610 29,621 10,113 42,344
Subordinated debt (note 5.i) - - - - - 1,603 10 1,613
Debt representative of shares of consolidated funds
held by third parties - - - - 1,514 499 - 2,013
FINANCIAL LIABILITIES AT FAIR VALUE THROUGH PROFIT OR LOSS
66,630 196,580 9,244 272,454 4,124 33,095 10,123 47,342
(1) These amounts do not represent the total amount of securitisation assets held by BNP Paribas, particularly those classified at inception as “Loans and Receivables”, and those reclassified as presented in note 5.e.
(2) Collateralised Debt Obligations / Collateralised Loan Obligations (3) Restated according to IFRS 10 and 11 and the amendment to IAS 32 (see notes 1.a and 2).
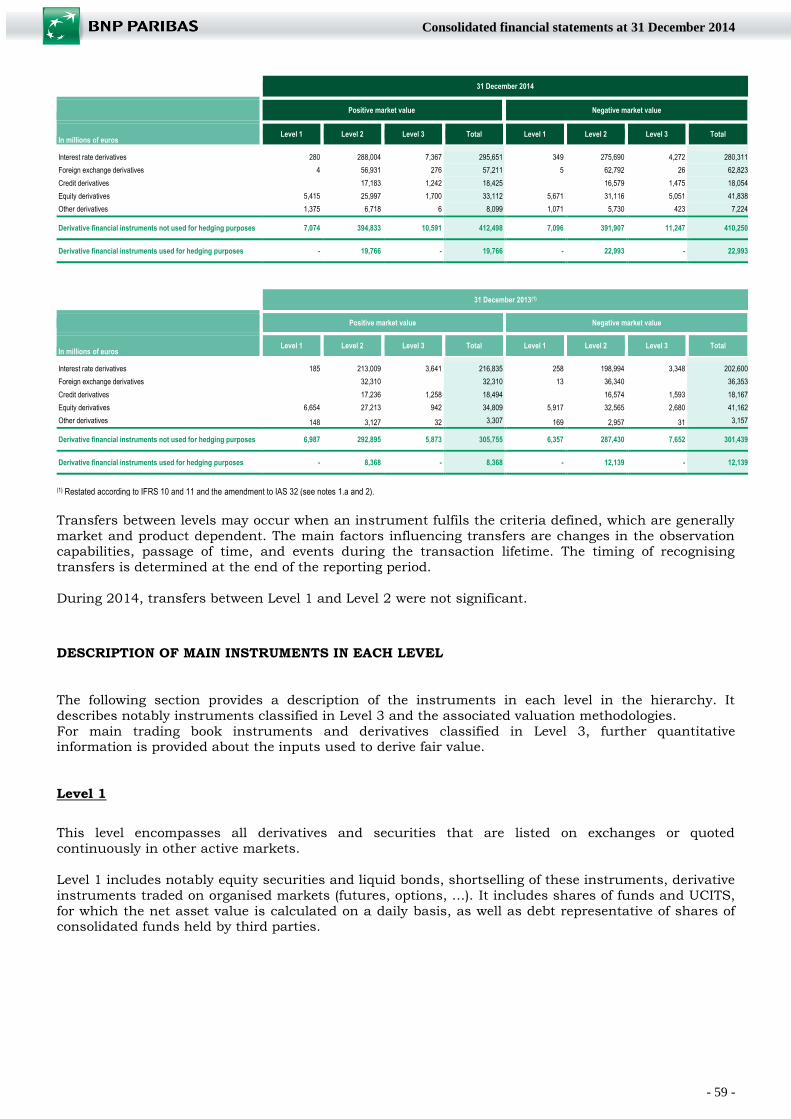
- 59 -
Consolidated financial statements at 31 December 2014
31 December 2014
Positive market value Negative market value
In millions of euros Level 1 Level 2 Level 3 Total Level 1 Level 2 Level 3 Total
Interest rate derivatives 280 288,004 7,367 295,651 349 275,690 4,272 280,311
Foreign exchange derivatives 4 56,931 276 57,211 5 62,792 26 62,823
Credit derivatives 17,183 1,242 18,425 16,579 1,475 18,054
Equity derivatives 5,415 25,997 1,700 33,112 5,671 31,116 5,051 41,838
Other derivatives 1,375 6,718 6 8,099 1,071 5,730 423 7,224
Derivative financial instruments not used for hedging purposes 7,074 394,833 10,591 412,498 7,096 391,907 11,247 410,250
Derivative financial instruments used for hedging purposes - 19,766 - 19,766 - 22,993 - 22,993
31 December 2013(1)
Positive market value Negative market value
In millions of euros Level 1 Level 2 Level 3 Total Level 1 Level 2 Level 3 Total
Interest rate derivatives 185 213,009 3,641 216,835 258 198,994 3,348 202,600
Foreign exchange derivatives 32,310 32,310 13 36,340 36,353
Credit derivatives 17,236 1,258 18,494 16,574 1,593 18,167
Equity derivatives 6,654 27,213 942 34,809 5,917 32,565 2,680 41,162
Other derivatives 148 3,127 32 3,307 169 2,957 31 3,157
Derivative financial instruments not used for hedging purposes 6,987 292,895 5,873 305,755 6,357 287,430 7,652 301,439
Derivative financial instruments used for hedging purposes - 8,368 - 8,368 - 12,139 - 12,139
(1) Restated according to IFRS 10 and 11 and the amendment to IAS 32 (see notes 1.a and 2).
Transfers between levels may occur when an instrument fulfils the criteria defined, which are generally
market and product dependent. The main factors influencing transfers are changes in the observation capabilities, passage of time, and events during the transaction lifetime. The timing of recognising
transfers is determined at the end of the reporting period.
During 2014, transfers between Level 1 and Level 2 were not significant.
DESCRIPTION OF MAIN INSTRUMENTS IN EACH LEVEL
The following section provides a description of the instruments in each level in the hierarchy. It
describes notably instruments classified in Level 3 and the associated valuation methodologies.
For main trading book instruments and derivatives classified in Level 3, further quantitative information is provided about the inputs used to derive fair value.
Level 1
This level encompasses all derivatives and securities that are listed on exchanges or quoted
continuously in other active markets.
Level 1 includes notably equity securities and liquid bonds, shortselling of these instruments, derivative
instruments traded on organised markets (futures, options, …). It includes shares of funds and UCITS,
for which the net asset value is calculated on a daily basis, as well as debt representative of shares of consolidated funds held by third parties.
- 60 -
Consolidated financial statements at 31 December 2014
Level 2
The Level 2 stock of securities is composed of securities which are less liquid than the Level 1 bonds. They are predominantly government bonds, corporate debt securities, mortgage backed securities, fund
shares and short-term securities such as certificates of deposit. They are classified in Level 2 notably
when external prices for the same security can be regularly observed from a reasonable number of
market makers that are active in this security, but these prices do not represent directly tradable
prices. This comprises amongst other, consensus pricing services with a reasonable number of
contributors that are active market makers as well as indicative runs from active brokers and/or dealers. Other sources such as primary issuance market, collateral valuation and counterparty
collateral valuation matching may also be used where relevant.
Repurchase agreements are classified predominantly in Level 2. The classification is primarily based
on the observability and liquidity of the repo market, depending on the underlying collateral.
Debts issued designated as at fair value through profit and loss, are classified in the same level as the
one that would apply to the embedded derivative taken individually. The issuance spread is considered
observable.
Derivatives classified in Level 2 comprise mainly the following instruments:
- Vanilla instruments such as interest rate swaps, caps, floors and swaptions, credit default
swaps, equity/foreign exchange (FX)/commodities forwards and options;
- Structured derivatives such as exotic FX options, mono- and multi-underlying equity/funds
derivatives, single curve exotic interest rate derivatives and derivatives based on structured
rates.
Derivatives are classified in Level 2 when there is a documented stream of evidence supporting one of
the following:
- Fair value is predominantly derived from prices or quotations of other Level 1 and Level 2
instruments, through standard market interpolation or stripping techniques whose results are
regularly corroborated by real transactions;
- Fair value is derived from other standard techniques such as replication or discounted cash
flows that are calibrated to observable prices, that bear limited model risk and enable an
effective offset of the risks of the instrument through trading Level 1 or Level 2 instruments;
- Fair value is derived from more complex or proprietary valuation techniques but is directly
evidenced through regular back-testing using external market-based data.
Determining of whether an over-the-counter (OTC) derivative is eligible for Level 2 classification involves
judgement. Consideration is given to the origin, transparency and reliability of external data used, and
the amount of uncertainty associated with the use of models. It follows that the Level 2 classification
criteria involve multiple analysis axis within an “observability zone” whose limits are determined by i) a
predetermined list of product categories and ii) the underlying and maturity bands. These criteria are regularly reviewed and updated, together with the applicable additional valuation adjustments, so that
the classification by level remains consistent with the valuation adjustment policy.

- 61 -
Consolidated financial statements at 31 December 2014
Level 3
Level 3 securities of the trading book mainly comprise CLOs and CDOs of ABSs linked to legacy
activity. Other Level 3 securities designated as at fair value through profit or loss or classified as
available for sale comprise units of funds and unquoted equity shares.
CLOs represent the large majority of the Level 3 trading book stock. Fair value is determined using a
methodology that takes into consideration both the available external indicative prices as well as
discounted expected cash flows. Constant prepayment rates are amongst the main unobservable inputs
required to model the underlying pool of cash flow payments. Other unobservable inputs are related to
the cash/synthetic funding basis and the discounting margin.
CDOs of ABSs collateral pools comprise Commercial Real Estate Loans, Commercial Mortgage Backed
Securities – CMBSs and Residential Mortgage Backed Securities – RMBSs. The fair value of CDOs is based on a “liquidation approach” and a “discounted expected cash flow” approach, depending on the
distressed nature of the collateral.
For RMBSs, prices are obtained to a large extent from external sources, while for Commercial Real
Estate Loans prices are independently valued by an external provider.
The Discounted Expected Cash flow approach for CDOs takes in consideration both an internal and an
external independent set of hypotheses to derive expectations about the underlying cash flow payments.
Such cash flow expectations are then passed through the CDO waterfall modelled in external platforms,
allowing deriving cash flow expectations of the considered CDO tranche. Similarly to the above, fair
value requires assumptions about the cash/synthetic funding basis and a discount margin.
Fund units relate to real estate funds for which the valuation of the underlying investments is not
frequent, as well as hedge funds for which the observation of the net asset value is not frequent.
Unlisted private equities are systematically classified as Level 3, with the exception of UCITS with a
daily net asset value, presented as unlisted securities in note 5.c , but which are classified in the Level 1 of the fair value hierarchy.
Repurchase agreements: mainly long-term or structured repurchase agreements on corporate
bonds and ABSs: The valuation of these transactions requires proprietary methodologies given the bespoke nature of the transactions and the lack of activity and price discovery in the long-term repo
market. The curves used in the valuation are corroborated using available data such as the implied
basis of the relevant benchmark bond pool, recent long-term repo trade data and price enquiry data.
Additional valuation adjustments applicable to these exposures are commensurate with the degree of
uncertainty inherent in the modelling choices and amount of data available.
Debts issued designated as at fair value through profit and loss, are classified in the same level as the
one that would apply to the embedded derivative taken individually. The issuance spread is considered
observable.
Derivatives
Vanilla derivatives are classified in Level 3 when the exposure is beyond the observation zone for rate
curves or volatility surfaces, or relates to less liquid markets such as tranches on old credit index series
or emerging markets interest rates markets. The main instruments are:
- 62 -
Consolidated financial statements at 31 December 2014
- Interest rate derivatives: exposures mainly comprise swap products in less liquid currencies.
Classification is driven by the lower liquidity of some maturities, while observation capabilities
through consensus may be available. The valuation technique is standard, and uses external market information and extrapolation techniques.
- Credit derivatives (CDS): exposures mainly comprise CDSs beyond the maximum observable
maturity and, to a much lesser extent, CDSs on illiquid or distressed names and CDSs on loan
indices. Classification is driven by the lack of liquidity while observation capabilities may be
available notably through consensus. Level 3 exposures also comprise CDS and Total Return Swaps (TRS) positions on securitised assets. These are priced along the same modelling
techniques as the underlying bonds, taking into consideration the funding basis and specific
risk premium.
- Equity derivatives: exposures essentially comprise long dated forward or volatility products or
exposures where there is a limited market for optional products. The marking of the forward curves and volatility surfaces beyond the maximum observable maturity relies on extrapolation
techniques. However, when there is no market for model input, volatility or forward is generally
determined on the basis of proxy or historical analysis.
These vanilla derivatives are subject to additional valuation adjustments linked to uncertainty on
liquidity, specialised by nature of underlying and liquidity bands.
Complex derivatives classified in Level 3 predominantly comprise hybrid products (FX/Interest Rates
hybrids, Equity hybrids), credit correlation products, prepayment-sensitive products, some stock basket
optional products and some interest rate optional instruments. The main exposures, related valuation
techniques and associated source of uncertainty are as follows:
- Hybrid FX/Interest rate products essentially comprise a specific product family known as Power Reverse Dual Currency (PRDC). The valuation of PRDCs requires complex modelling of
joint behaviour of FX and interest rate, and is notably sensitive to the unobservable FX/ interest
rate correlations. PRDCs valuations are corroborated with recent trade data and consensus
data.
- Securitisation swaps mainly comprise fixed rate swaps, cross currency or basis swaps whose
notional is indexed to the prepayment behaviour of some underlying portfolio. The estimation of
the maturity profile of securitisation swaps is corroborated by statistical estimates using
external historical data.
- Forward volatility options are generally products whose pay-off is indexed to the future
variability of a rate index such as volatility swaps. These products involve material model risk as
it is difficult to infer forward volatility information from the market-traded instruments. The
valuation adjustment framework is calibrated to the uncertainty inherent in the product, and to
the range of uncertainty from the existing external consensus data.
- Inflation derivatives classified in Level 3 mainly comprise swap products on inflation indices
that are not associated with a liquid indexed bond market, optional products on inflation indices
(such as caps and floors) and other forms of inflation indices involving optionality on the
inflation indices or on the inflation annual rate. Valuation techniques used for inflation
derivatives are predominantly standard market models. Proxy techniques are used for a few limited exposures. Although the valuations are corroborated through monthly consensus data,
these products are classified as Level 3 due to their lack of liquidity and some uncertainties
inherent in the calibration.
- The valuation of bespoke CDOs requires correlation of default events. This information is inferred from the active index tranche market through a proprietary projection technique and
- 63 -
Consolidated financial statements at 31 December 2014
involves proprietary extrapolation and interpolation techniques. Multi-geography CDOs further
require an additional correlation assumption. Finally, the bespoke CDO model also involves
proprietary assumptions and parameters related to the dynamic of the recovery factor. CDO modelling, is calibrated on the observable index tranche markets, and is regularly back-tested
against consensus data on standardised pools. The uncertainty arises from the model risk
associated with the projection and geography mixing technique, and the uncertainty of
associated parameters, together with the recovery modelling.
- N to Default baskets are other forms of credit correlation products, modelled through standard copula techniques. The main inputs required are the pair-wise correlations between the basket
components which can be observed in the consensus and the transactions. Linear baskets are
considered observable.
- Equity and equity-hybrid correlation products are instruments whose pay-off is dependent on the joint behaviour of a basket of equities/indices leading to a sensitivity of the fair value
measurement to the correlation amongst the basket components. Hybrid versions of these
instruments involve baskets that mix equity and non-equity underlyings such as commodity
indices. Only a subset of the Equity/index correlation matrix is regularly observable and traded,
while most cross-asset correlations are not active. Therefore, classification in Level 3 depends on the composition of the basket, the maturity, and the hybrid nature of the product. The
correlation input is derived from a proprietary model combining historical estimators, and other
adjustment factors, that are corroborated by reference to recent trades or external data. The
correlation matrix is essentially available from consensus services, and when a correlation
between two underlying instruments is not available, it might be obtained from extrapolation or
proxy techniques.
These complex derivatives are subject to specific additional valuation adjustments to cover
uncertainties linked to liquidity, parameters and model risk.
Valuation adjustments (CVA, DVA and FVA)
The additional valuation adjustment for counterparty credit risk (CVA), own-credit risk for derivatives
(DVA) and the explicit funding valuation adjustment (FVA) are deemed to be unobservable components
of the valuation framework and therefore classified in Level 3. This does not impact, in general cases,
the classification of individual transactions into the fair value hierarchy. However since 2014, a specific
process allows to identify individual deals for which the marginal contribution of these adjustments and
related uncertainty is significant. Are particularly concerned some poorly collateralized instruments with very long residual maturity.
For these products classified in Level 3, the following table provides the range of values of main
unobservable inputs. The ranges displayed correspond to a variety of different underlying instruments
and are meaningful only in the context of the valuation technique implemented by BNP Paribas. The weighted averages, where relevant and available, are based on fair values, nominal amounts or
sensitivities.
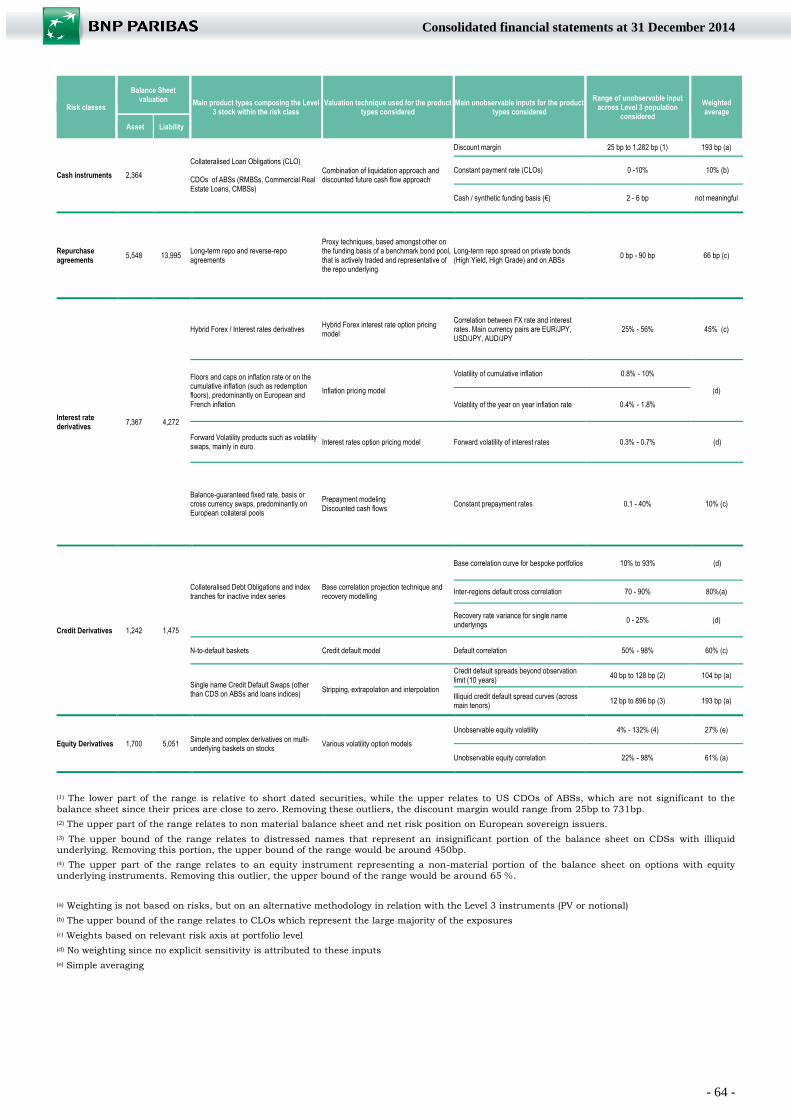
- 64 -
Consolidated financial statements at 31 December 2014
Risk classes
Balance Sheet valuation Main product types composing the Level
3 stock within the risk class Valuation technique used for the product
types considered Main unobservable inputs for the product
types considered
Range of unobservable input across Level 3 population
considered
Weighted average
Asset Liability
Cash instruments 2,364
Collateralised Loan Obligations (CLO) CDOs of ABSs (RMBSs, Commercial Real Estate Loans, CMBSs)
Combination of liquidation approach and discounted future cash flow approach
Discount margin 25 bp to 1,282 bp (1) 193 bp (a)
Constant payment rate (CLOs) 0 -10% 10% (b)
Cash / synthetic funding basis (€) 2 - 6 bp not meaningful
Repurchase agreements
5,548 13,995 Long-term repo and reverse-repo agreements
Proxy techniques, based amongst other on the funding basis of a benchmark bond pool, that is actively traded and representative of the repo underlying
Long-term repo spread on private bonds (High Yield, High Grade) and on ABSs
0 bp - 90 bp 66 bp (c)
Interest rate derivatives
7,367 4,272
Hybrid Forex / Interest rates derivatives Hybrid Forex interest rate option pricing model
Correlation between FX rate and interest rates. Main currency pairs are EUR/JPY, USD/JPY, AUD/JPY
25% - 56% 45% (c)
Floors and caps on inflation rate or on the cumulative inflation (such as redemption floors), predominantly on European and French inflation
Inflation pricing model
Volatility of cumulative inflation 0.8% - 10%
(d)
Volatility of the year on year inflation rate 0.4% - 1.8%
Forward Volatility products such as volatility swaps, mainly in euro
Interest rates option pricing model Forward volatility of interest rates 0.3% - 0.7% (d)
Balance-guaranteed fixed rate, basis or cross currency swaps, predominantly on European collateral pools
Prepayment modeling Discounted cash flows
Constant prepayment rates 0.1 - 40% 10% (c)
Credit Derivatives 1,242 1,475
Collateralised Debt Obligations and index tranches for inactive index series
Base correlation projection technique and recovery modelling
Base correlation curve for bespoke portfolios 10% to 93% (d)
Inter-regions default cross correlation 70 - 90% 80%(a)
Recovery rate variance for single name underlyings
0 - 25% (d)
N-to-default baskets Credit default model Default correlation 50% - 98% 60% (c)
Single name Credit Default Swaps (other than CDS on ABSs and loans indices)
Stripping, extrapolation and interpolation
Credit default spreads beyond observation limit (10 years)
40 bp to 128 bp (2) 104 bp (a)
Illiquid credit default spread curves (across main tenors)
12 bp to 896 bp (3) 193 bp (a)
Equity Derivatives 1,700 5,051 Simple and complex derivatives on multi-underlying baskets on stocks
Various volatility option models
Unobservable equity volatility 4% - 132% (4) 27% (e)
Unobservable equity correlation 22% - 98% 61% (a)
(1) The lower part of the range is relative to short dated securities, while the upper relates to US CDOs of ABSs, which are not significant to the
balance sheet since their prices are close to zero. Removing these outliers, the discount margin would range from 25bp to 731bp.
(2) The upper part of the range relates to non material balance sheet and net risk position on European sovereign issuers.
(3) The upper bound of the range relates to distressed names that represent an insignificant portion of the balance sheet on CDSs with illiquid underlying. Removing this portion, the upper bound of the range would be around 450bp.
(4) The upper part of the range relates to an equity instrument representing a non-material portion of the balance sheet on options with equity
underlying instruments. Removing this outlier, the upper bound of the range would be around 65 %.
(a) Weighting is not based on risks, but on an alternative methodology in relation with the Level 3 instruments (PV or notional)
(b) The upper bound of the range relates to CLOs which represent the large majority of the exposures
(c) Weights based on relevant risk axis at portfolio level
(d) No weighting since no explicit sensitivity is attributed to these inputs
(e) Simple averaging

- 65 -
Consolidated financial statements at 31 December 2014
TABLE OF MOVEMENTS IN LEVEL 3 FINANCIAL INSTRUMENTS
For Level 3 financial instruments, the following movements occurred between 1 January 2013 and 31
December 2014:
In millions of euros
Financial Assets Financial Liabilities
Financial instruments at
fair value through profit or loss held
for trading
Financial instruments
designated as at fair value
through profit or loss
Available-for-sale financial
assets TOTAL
Financial instruments at
fair value through profit or loss held
for trading
Financial instruments
designated as at fair value
through profit or loss
TOTAL
At 31 December 2012 13,639 4,049 9,936 27,624 (17,289) (8,554) (25,843)
Purchases 5,145 2,382 973 8,500 -
Issues - (6,963) (8,134) (15,097)
Sales (2,414) (2,383) (1,122) (5,919) -
Settlements (1) (1,917) (1,111) (701) (3,729) 6,563 6,595 13,158
Transfers to level 3 850 12 133 995 (569) (554) (1,123)
Transfers from level 3 (866) (89) (1,551) (2,506) 628 153 781
Gains (or losses) recognised in profit or loss with respect to transactions expired or terminated during the period
73 95 (171) (3) 321 119 440
Gains (or losses) recognised in profit or loss with respect to unexpired instruments at the end of the period
30 (96) (66) 113 213 326
Changes in fair value of assets and liabilities recognised directly in equity
- Items related to exchange rate movements (303) (72) (375) 300 39 339
- Changes in fair value of assets and liabilities recognised in equity
255 255 -
At 31 December 2013(2) 14,237 2,859 7,680 24,776 (16,896) (10,123) (27,019)
Purchases 8,725 2,743 3,532 15,000 -
Issues - (12,622) (4,506) (17,128)
Sales (1,459) (2,562) (1,266) (5,287) -
Settlements (1) (7,727) (233) (1,262) (9,222) 3,838 2,507 6,345
Transfers to level 3 3,204 90 3,294 (2,188) (4,178) (6,366)
Transfers from level 3 (3,106) (122) (409) (3,637) 332 4,197 4,529
Gains (or losses) recognised in profit or loss with respect to transactions expired or terminated during the period
132 48 (87) 93 880 239 1,119
Gains (or losses) recognised in profit or loss with respect to unexpired instruments at the end of the period
5,302 70 (8) 5,364 2,127 313 2,440
Changes in fair value of assets and liabilities recognised directly in equity
- Items related to exchange rate movements 647 151 798 (950) (181) (1,131)
- Changes in fair value of assets and liabilities recognised in equity
812 812 -
At 31 December 2014 19,955 2,803 9,233 31,991 (25,479) (11,732) (37,211)
(1) For the assets, includes redemptions of principal, interest payments as well as cash inflows and outflows relating to derivatives. For the liabilities, includes principal redemptions, interest payments as well as cash inflows and outflows relating to derivatives the fair value of which is negative.
(2) Restated according to IFRS 10 and 11 and the amendment to IAS 32 (see notes 1.a and 2).
The main changes during 2014 are mainly transfers to Level 3 of instruments whose valuation
adjustments (CVA, DVA and FVA) are significant. They amounted to EUR 2.4 billion.
Transfers have been reflected as if they had taken place at the end of the reporting period.
The Level 3 financial instruments may be hedged by other Level 1 and Level 2 instruments, the gains
and losses of which are not shown in this table. Consequently, the gains and losses shown in this table
are not representative of the gains and losses arising from management of the net risk on all these instruments.
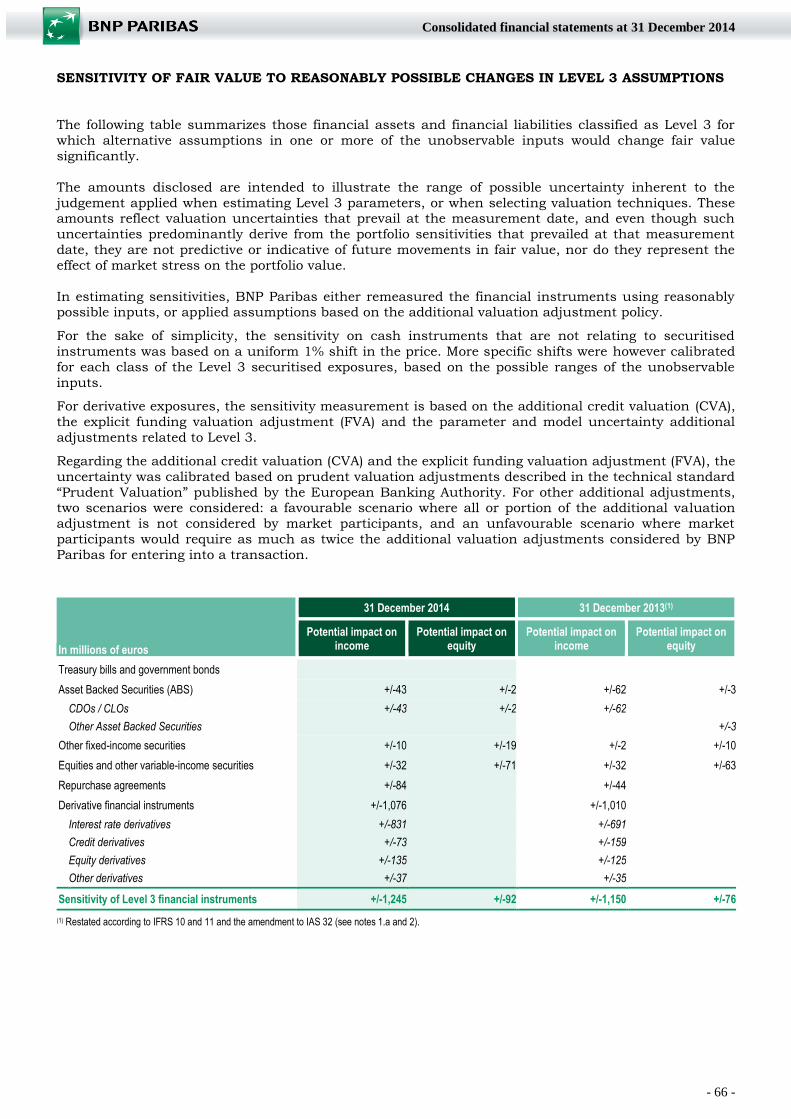
- 66 -
Consolidated financial statements at 31 December 2014
SENSITIVITY OF FAIR VALUE TO REASONABLY POSSIBLE CHANGES IN LEVEL 3 ASSUMPTIONS
The following table summarizes those financial assets and financial liabilities classified as Level 3 for
which alternative assumptions in one or more of the unobservable inputs would change fair value
significantly.
The amounts disclosed are intended to illustrate the range of possible uncertainty inherent to the
judgement applied when estimating Level 3 parameters, or when selecting valuation techniques. These amounts reflect valuation uncertainties that prevail at the measurement date, and even though such
uncertainties predominantly derive from the portfolio sensitivities that prevailed at that measurement
date, they are not predictive or indicative of future movements in fair value, nor do they represent the
effect of market stress on the portfolio value.
In estimating sensitivities, BNP Paribas either remeasured the financial instruments using reasonably possible inputs, or applied assumptions based on the additional valuation adjustment policy.
For the sake of simplicity, the sensitivity on cash instruments that are not relating to securitised
instruments was based on a uniform 1% shift in the price. More specific shifts were however calibrated
for each class of the Level 3 securitised exposures, based on the possible ranges of the unobservable
inputs.
For derivative exposures, the sensitivity measurement is based on the additional credit valuation (CVA),
the explicit funding valuation adjustment (FVA) and the parameter and model uncertainty additional
adjustments related to Level 3.
Regarding the additional credit valuation (CVA) and the explicit funding valuation adjustment (FVA), the
uncertainty was calibrated based on prudent valuation adjustments described in the technical standard
“Prudent Valuation” published by the European Banking Authority. For other additional adjustments, two scenarios were considered: a favourable scenario where all or portion of the additional valuation
adjustment is not considered by market participants, and an unfavourable scenario where market
participants would require as much as twice the additional valuation adjustments considered by BNP
Paribas for entering into a transaction.
In millions of euros
31 December 2014 31 December 2013(1)
Potential impact on income
Potential impact on equity
Potential impact on income
Potential impact on equity
Treasury bills and government bonds
Asset Backed Securities (ABS) +/-43 +/-2 +/-62 +/-3
CDOs / CLOs +/-43 +/-2 +/-62
Other Asset Backed Securities +/-3
Other fixed-income securities +/-10 +/-19 +/-2 +/-10
Equities and other variable-income securities +/-32 +/-71 +/-32 +/-63
Repurchase agreements +/-84 +/-44
Derivative financial instruments +/-1,076 +/-1,010
Interest rate derivatives +/-831 +/-691
Credit derivatives +/-73 +/-159
Equity derivatives +/-135 +/-125
Other derivatives +/-37 +/-35
Sensitivity of Level 3 financial instruments +/-1,245 +/-92 +/-1,150 +/-76
(1) Restated according to IFRS 10 and 11 and the amendment to IAS 32 (see notes 1.a and 2).
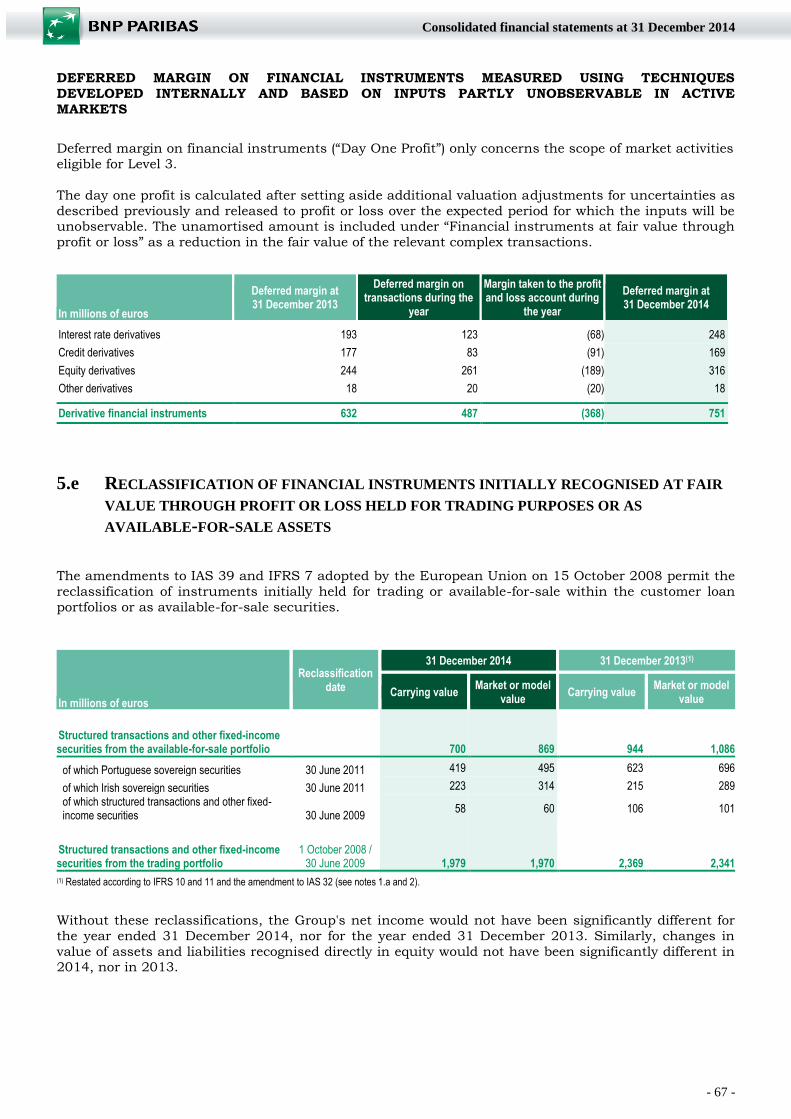
- 67 -
Consolidated financial statements at 31 December 2014
DEFERRED MARGIN ON FINANCIAL INSTRUMENTS MEASURED USING TECHNIQUES
DEVELOPED INTERNALLY AND BASED ON INPUTS PARTLY UNOBSERVABLE IN ACTIVE
MARKETS
Deferred margin on financial instruments (“Day One Profit”) only concerns the scope of market activities
eligible for Level 3.
The day one profit is calculated after setting aside additional valuation adjustments for uncertainties as
described previously and released to profit or loss over the expected period for which the inputs will be unobservable. The unamortised amount is included under “Financial instruments at fair value through
profit or loss” as a reduction in the fair value of the relevant complex transactions.
In millions of euros
Deferred margin at 31 December 2013
Deferred margin on transactions during the
year
Margin taken to the profit and loss account during
the year
Deferred margin at 31 December 2014
Interest rate derivatives 193 123 (68) 248
Credit derivatives 177 83 (91) 169
Equity derivatives 244 261 (189) 316
Other derivatives 18 20 (20) 18 Derivative financial instruments 632 487 (368) 751
5.e RECLASSIFICATION OF FINANCIAL INSTRUMENTS INITIALLY RECOGNISED AT FAIR
VALUE THROUGH PROFIT OR LOSS HELD FOR TRADING PURPOSES OR AS
AVAILABLE-FOR-SALE ASSETS
The amendments to IAS 39 and IFRS 7 adopted by the European Union on 15 October 2008 permit the
reclassification of instruments initially held for trading or available-for-sale within the customer loan
portfolios or as available-for-sale securities.
In millions of euros
Reclassification date
31 December 2014 31 December 2013(1)
Carrying value Market or model value
Carrying value Market or model
value
Structured transactions and other fixed-income securities from the available-for-sale portfolio 700 869 944 1,086 of which Portuguese sovereign securities 30 June 2011 419 495 623 696
of which Irish sovereign securities 30 June 2011 223 314 215 289
of which structured transactions and other fixed-income securities 30 June 2009
58 60 106 101
Structured transactions and other fixed-income securities from the trading portfolio
1 October 2008 / 30 June 2009 1,979 1,970 2,369 2,341
(1) Restated according to IFRS 10 and 11 and the amendment to IAS 32 (see notes 1.a and 2).
Without these reclassifications, the Group's net income would not have been significantly different for
the year ended 31 December 2014, nor for the year ended 31 December 2013. Similarly, changes in
value of assets and liabilities recognised directly in equity would not have been significantly different in 2014, nor in 2013.
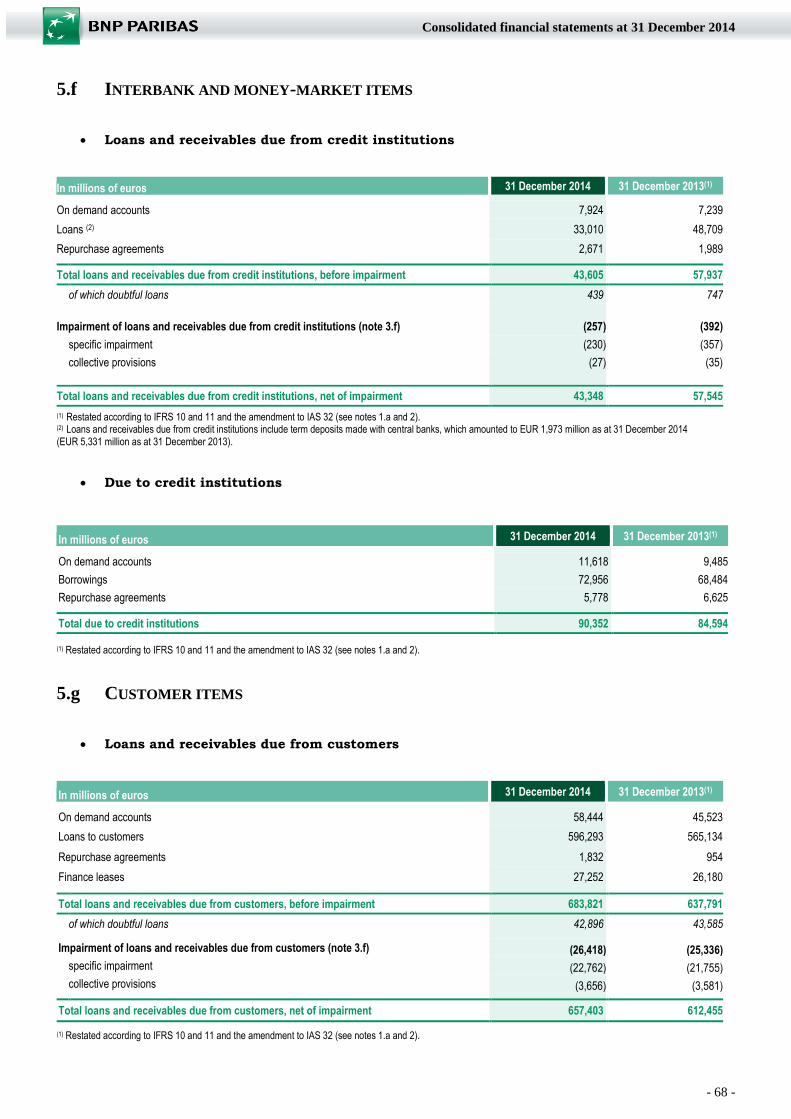
- 68 -
Consolidated financial statements at 31 December 2014
5.f INTERBANK AND MONEY-MARKET ITEMS
Loans and receivables due from credit institutions
In millions of euros 31 December 2014 31 December 2013(1)
On demand accounts 7,924 7,239
Loans (2) 33,010 48,709
Repurchase agreements 2,671 1,989
Total loans and receivables due from credit institutions, before impairment 43,605 57,937
of which doubtful loans 439 747 of which doubtful loans
Impairment of loans and receivables due from credit institutions (note 3.f) (257) (392)
specific impairment (230) (357)
collective provisions (27) (35) collective provisions
Total loans and receivables due from credit institutions, net of impairment 43,348 57,545
(1) Restated according to IFRS 10 and 11 and the amendment to IAS 32 (see notes 1.a and 2).
(2) Loans and receivables due from credit institutions include term deposits made with central banks, which amounted to EUR 1,973 million as at 31 December 2014 (EUR 5,331 million as at 31 December 2013).
Due to credit institutions
In millions of euros 31 December 2014 31 December 2013(1) On demand accounts 11,618 9,485
Borrowings 72,956 68,484
Repurchase agreements 5,778 6,625
Total due to credit institutions 90,352 84,594
(1) Restated according to IFRS 10 and 11 and the amendment to IAS 32 (see notes 1.a and 2).
5.g CUSTOMER ITEMS
Loans and receivables due from customers
In millions of euros 31 December 2014 31 December 2013(1) On demand accounts 58,444 45,523
Loans to customers 596,293 565,134
Repurchase agreements 1,832 954
Finance leases 27,252 26,180
Total loans and receivables due from customers, before impairment 683,821 637,791
of which doubtful loans 42,896 43,585 Impairment of loans and receivables due from customers (note 3.f) (26,418) (25,336)
specific impairment (22,762) (21,755)
collective provisions (3,656) (3,581)
Total loans and receivables due from customers, net of impairment 657,403 612,455
(1) Restated according to IFRS 10 and 11 and the amendment to IAS 32 (see notes 1.a and 2).
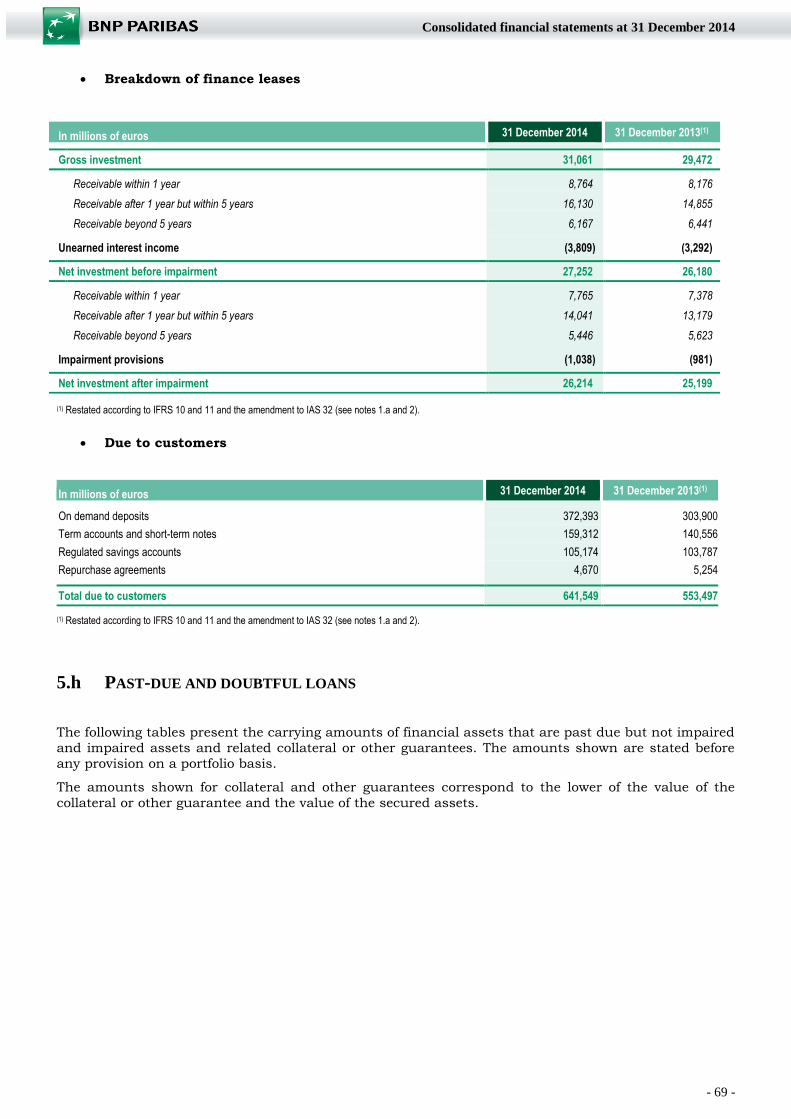
- 69 -
Consolidated financial statements at 31 December 2014
Breakdown of finance leases
In millions of euros 31 December 2014 31 December 2013(1)
Gross investment 31,061 29,472
Receivable within 1 year
8,764 8,176
Receivable after 1 year but within 5 years
16,130 14,855
Receivable beyond 5 years
6,167 6,441
Unearned interest income (3,809) (3,292)
Net investment before impairment 27,252 26,180
Receivable within 1 year
7,765 7,378
Receivable after 1 year but within 5 years
14,041 13,179
Receivable beyond 5 years
5,446 5,623
Impairment provisions (1,038) (981)
Net investment after impairment 26,214 25,199
(1) Restated according to IFRS 10 and 11 and the amendment to IAS 32 (see notes 1.a and 2).
Due to customers
In millions of euros 31 December 2014 31 December 2013(1)
On demand deposits 372,393 303,900
Term accounts and short-term notes 159,312 140,556
Regulated savings accounts 105,174 103,787
Repurchase agreements 4,670 5,254
Total due to customers 641,549 553,497
(1) Restated according to IFRS 10 and 11 and the amendment to IAS 32 (see notes 1.a and 2).
5.h PAST-DUE AND DOUBTFUL LOANS
The following tables present the carrying amounts of financial assets that are past due but not impaired
and impaired assets and related collateral or other guarantees. The amounts shown are stated before
any provision on a portfolio basis.
The amounts shown for collateral and other guarantees correspond to the lower of the value of the
collateral or other guarantee and the value of the secured assets.
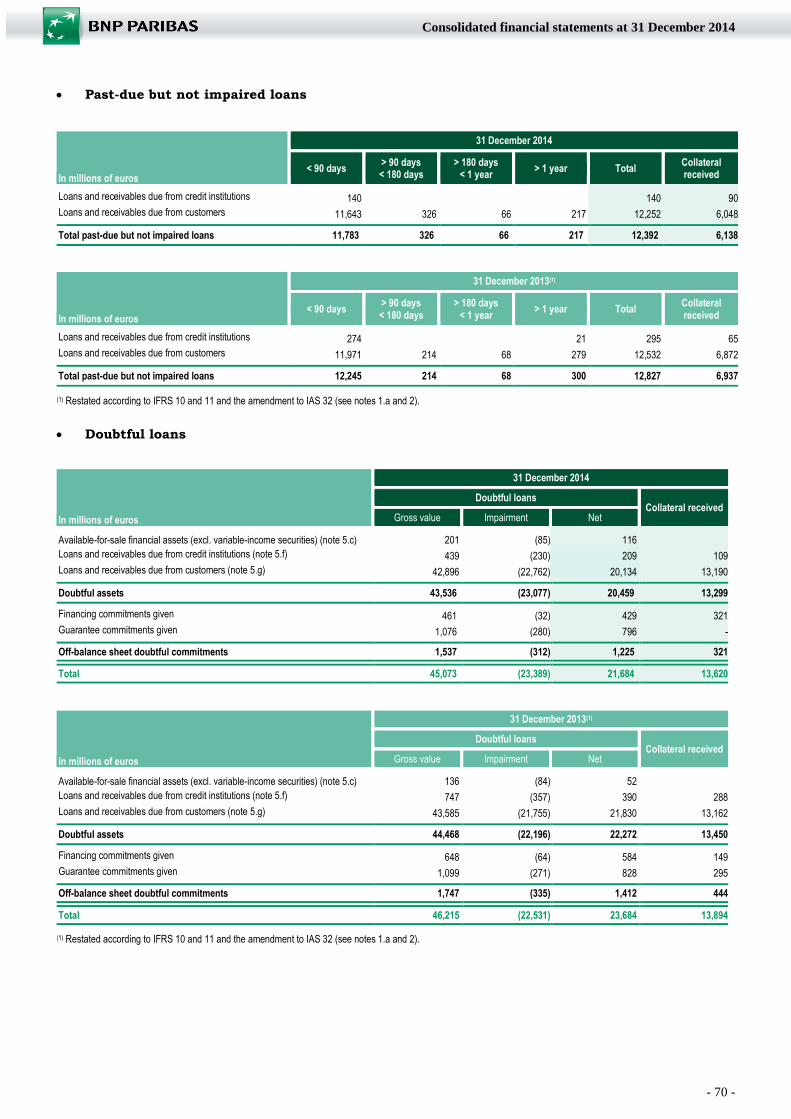
- 70 -
Consolidated financial statements at 31 December 2014
Past-due but not impaired loans
In millions of euros
31 December 2014
< 90 days > 90 days < 180 days
> 180 days < 1 year
> 1 year Total Collateral received
Loans and receivables due from credit institutions 140 140 90 Loans and receivables due from customers 11,643 326 66 217 12,252 6,048
Total past-due but not impaired loans 11,783 326 66 217 12,392 6,138
In millions of euros
31 December 2013(1)
< 90 days > 90 days < 180 days
> 180 days < 1 year
> 1 year Total Collateral received
Loans and receivables due from credit institutions 274 21 295 65 Loans and receivables due from customers 11,971 214 68 279 12,532 6,872
Total past-due but not impaired loans 12,245 214 68 300 12,827 6,937
(1) Restated according to IFRS 10 and 11 and the amendment to IAS 32 (see notes 1.a and 2).
Doubtful loans
In millions of euros
31 December 2014
Doubtful loans
Collateral received Gross value Impairment Net
Available-for-sale financial assets (excl. variable-income securities) (note 5.c) 201 (85) 116 Loans and receivables due from credit institutions (note 5.f) 439 (230) 209 109 Loans and receivables due from customers (note 5.g) 42,896 (22,762) 20,134 13,190
Doubtful assets 43,536 (23,077) 20,459 13,299
Financing commitments given 461 (32) 429 321 Guarantee commitments given 1,076 (280) 796 - Off-balance sheet doubtful commitments 1,537 (312) 1,225 321 Total 45,073 (23,389) 21,684 13,620
In millions of euros
31 December 2013(1)
Doubtful loans
Collateral received Gross value Impairment Net
Available-for-sale financial assets (excl. variable-income securities) (note 5.c) 136 (84) 52 Loans and receivables due from credit institutions (note 5.f) 747 (357) 390 288 Loans and receivables due from customers (note 5.g) 43,585 (21,755) 21,830 13,162
Doubtful assets 44,468 (22,196) 22,272 13,450
Financing commitments given 648 (64) 584 149 Guarantee commitments given 1,099 (271) 828 295 Off-balance sheet doubtful commitments 1,747 (335) 1,412 444 Total 46,215 (22,531) 23,684 13,894 (1) Restated according to IFRS 10 and 11 and the amendment to IAS 32 (see notes 1.a and 2).
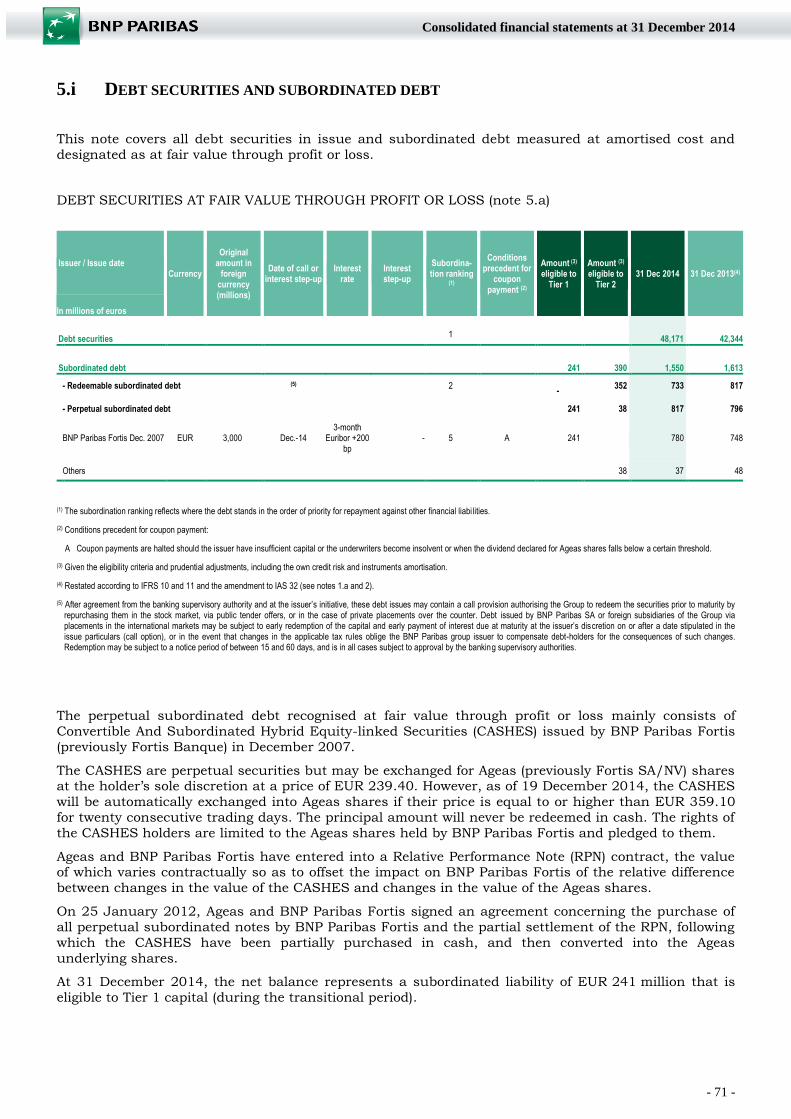
- 71 -
Consolidated financial statements at 31 December 2014
5.i DEBT SECURITIES AND SUBORDINATED DEBT
This note covers all debt securities in issue and subordinated debt measured at amortised cost and
designated as at fair value through profit or loss.
DEBT SECURITIES AT FAIR VALUE THROUGH PROFIT OR LOSS (note 5.a)
Issuer / Issue date Currency
Original amount in
foreign currency (millions)
Date of call or interest step-up
Interest rate
Interest step-up
Subordina- tion ranking
(1)
Conditions precedent for
coupon payment (2)
Amount (3)
eligible to
Tier 1
Amount (3)
eligible to Tier 2
31 Dec 2014 31 Dec 2013(4)
In millions of euros
Debt securities 1 48,171 42,344
Subordinated debt 241 390 1,550 1,613
- Redeemable subordinated debt (5) 2 -
352 733 817
- Perpetual subordinated debt 241 38 817 796
BNP Paribas Fortis Dec. 2007 EUR 3,000 Dec.-14 3-month
Euribor +200 bp
- 5 A 241 780 748
Others 38 37 48
(1) The subordination ranking reflects where the debt stands in the order of priority for repayment against other financial liabi lities.
(2) Conditions precedent for coupon payment:
A Coupon payments are halted should the issuer have insufficient capital or the underwriters become insolvent or when the dividend declared for Ageas shares falls below a certain threshold.
(3) Given the eligibility criteria and prudential adjustments, including the own credit risk and instruments amortisation.
(4) Restated according to IFRS 10 and 11 and the amendment to IAS 32 (see notes 1.a and 2).
(5) After agreement from the banking supervisory authority and at the issuer’s initiative, these debt issues may contain a call provision authorising the Group to redeem the securities prior to maturity by repurchasing them in the stock market, via public tender offers, or in the case of private placements over the counter. Debt issued by BNP Paribas SA or foreign subsidiaries of the Group via placements in the international markets may be subject to early redemption of the capital and early payment of interest due at maturity at the issuer’s discretion on or after a date stipulated in the issue particulars (call option), or in the event that changes in the applicable tax rules oblige the BNP Paribas group issuer to compensate debt-holders for the consequences of such changes. Redemption may be subject to a notice period of between 15 and 60 days, and is in all cases subject to approval by the banking supervisory authorities.
The perpetual subordinated debt recognised at fair value through profit or loss mainly consists of
Convertible And Subordinated Hybrid Equity-linked Securities (CASHES) issued by BNP Paribas Fortis
(previously Fortis Banque) in December 2007.
The CASHES are perpetual securities but may be exchanged for Ageas (previously Fortis SA/NV) shares at the holder’s sole discretion at a price of EUR 239.40. However, as of 19 December 2014, the CASHES
will be automatically exchanged into Ageas shares if their price is equal to or higher than EUR 359.10
for twenty consecutive trading days. The principal amount will never be redeemed in cash. The rights of
the CASHES holders are limited to the Ageas shares held by BNP Paribas Fortis and pledged to them.
Ageas and BNP Paribas Fortis have entered into a Relative Performance Note (RPN) contract, the value of which varies contractually so as to offset the impact on BNP Paribas Fortis of the relative difference
between changes in the value of the CASHES and changes in the value of the Ageas shares.
On 25 January 2012, Ageas and BNP Paribas Fortis signed an agreement concerning the purchase of
all perpetual subordinated notes by BNP Paribas Fortis and the partial settlement of the RPN, following
which the CASHES have been partially purchased in cash, and then converted into the Ageas
underlying shares.
At 31 December 2014, the net balance represents a subordinated liability of EUR 241 million that is
eligible to Tier 1 capital (during the transitional period).
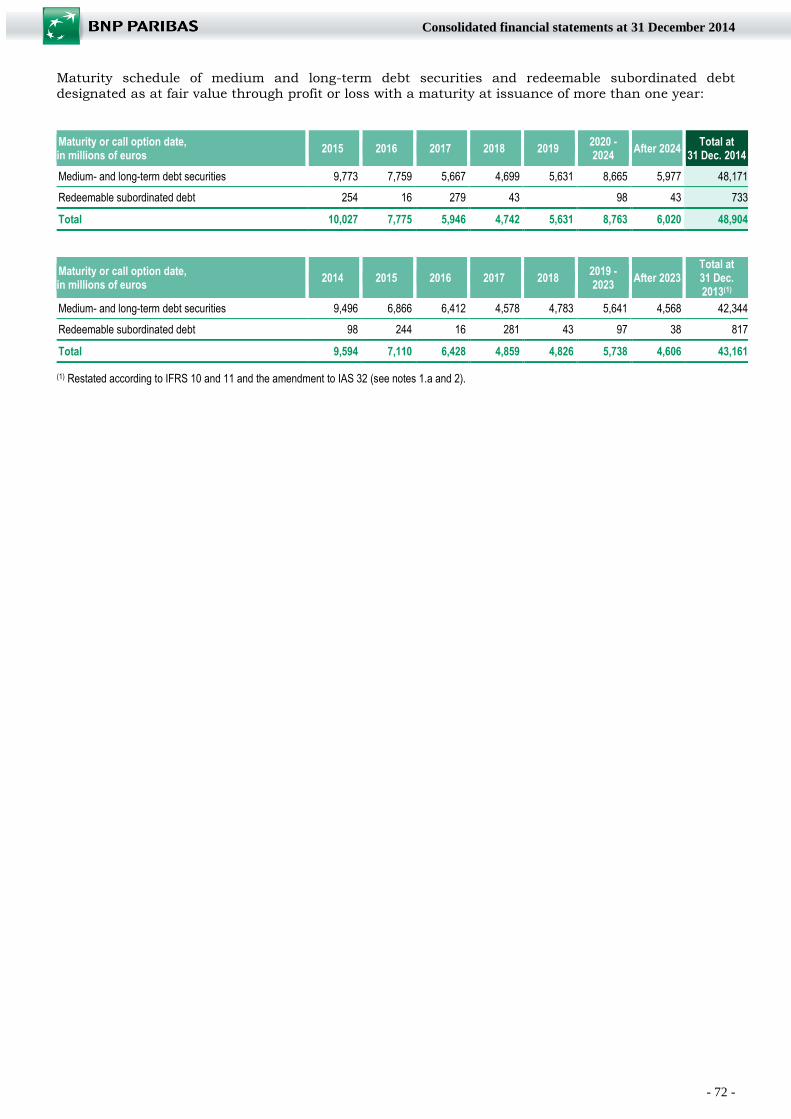
- 72 -
Consolidated financial statements at 31 December 2014
Maturity schedule of medium and long-term debt securities and redeemable subordinated debt
designated as at fair value through profit or loss with a maturity at issuance of more than one year:
Maturity or call option date,
in millions of euros 2015 2016 2017 2018 2019
2020 - 2024
After 2024 Total at
31 Dec. 2014
Medium- and long-term debt securities 9,773 7,759 5,667 4,699 5,631 8,665 5,977 48,171
Redeemable subordinated debt 254 16 279 43 98 43 733
Total 10,027 7,775 5,946 4,742 5,631 8,763 6,020 48,904
Maturity or call option date,
in millions of euros 2014 2015 2016 2017 2018
2019 - 2023
After 2023 Total at 31 Dec. 2013(1)
Medium- and long-term debt securities 9,496 6,866 6,412 4,578 4,783 5,641 4,568 42,344
Redeemable subordinated debt 98 244 16 281 43 97 38 817
Total 9,594 7,110 6,428 4,859 4,826 5,738 4,606 43,161
(1) Restated according to IFRS 10 and 11 and the amendment to IAS 32 (see notes 1.a and 2).
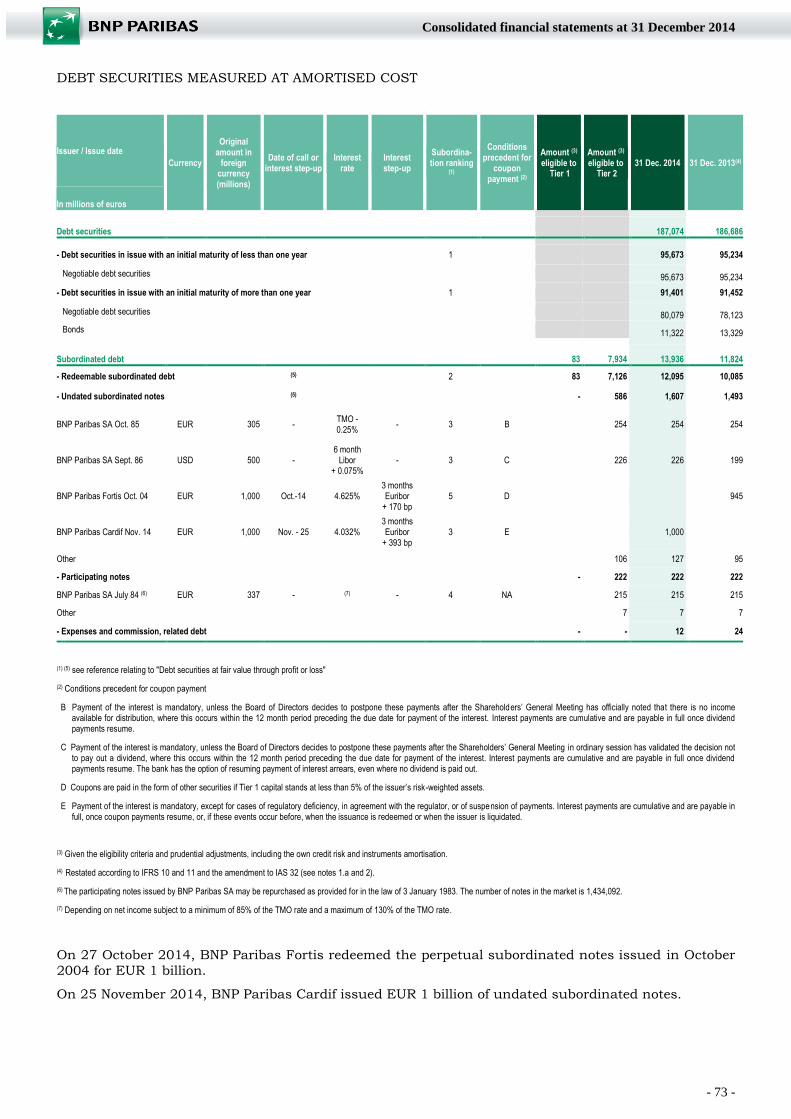
- 73 -
Consolidated financial statements at 31 December 2014
DEBT SECURITIES MEASURED AT AMORTISED COST
Issuer / Issue date Currency
Original amount in
foreign currency (millions)
Date of call or interest step-up
Interest rate
Interest step-up
Subordina- tion ranking
(1)
Conditions precedent for
coupon payment (2)
Amount (3)
eligible to
Tier 1
Amount (3)
eligible to Tier 2
31 Dec. 2014 31 Dec. 2013(4)
In millions of euros
Debt securities
187,074 186,686
- Debt securities in issue with an initial maturity of less than one year 1 95,673 95,234
Negotiable debt securities 95,673 95,234
- Debt securities in issue with an initial maturity of more than one year 1 91,401 91,452
Negotiable debt securities 80,079 78,123
Bonds 11,322 13,329
Subordinated debt
83 7,934 13,936 11,824
- Redeemable subordinated debt (5) 2 83 7,126 12,095 10,085
- Undated subordinated notes (5) - 586 1,607 1,493
BNP Paribas SA Oct. 85 EUR 305 - TMO - 0.25%
- 3 B 254 254 254
BNP Paribas SA Sept. 86 USD 500 - 6 month
Libor + 0.075%
- 3 C 226 226 199
BNP Paribas Fortis Oct. 04 EUR 1,000 Oct.-14 4.625% 3 months Euribor
+ 170 bp 5 D 945
BNP Paribas Cardif Nov. 14 EUR 1,000 Nov. - 25 4.032% 3 months Euribor
+ 393 bp 3 E 1,000
Other 106 127 95
- Participating notes - 222 222 222
BNP Paribas SA July 84 (6) EUR 337 - (7) - 4 NA 215 215 215
Other 7 7 7
- Expenses and commission, related debt - - 12 24
(1) (5) see reference relating to "Debt securities at fair value through profit or loss"
(2) Conditions precedent for coupon payment
B Payment of the interest is mandatory, unless the Board of Directors decides to postpone these payments after the Shareholders’ General Meeting has officially noted that there is no income available for distribution, where this occurs within the 12 month period preceding the due date for payment of the interest. Interest payments are cumulative and are payable in full once dividend payments resume.
C Payment of the interest is mandatory, unless the Board of Directors decides to postpone these payments after the Shareholders’ General Meeting in ordinary session has validated the decision not to pay out a dividend, where this occurs within the 12 month period preceding the due date for payment of the interest. Interest payments are cumulative and are payable in full once dividend payments resume. The bank has the option of resuming payment of interest arrears, even where no dividend is paid out.
D Coupons are paid in the form of other securities if Tier 1 capital stands at less than 5% of the issuer’s risk-weighted assets.
E Payment of the interest is mandatory, except for cases of regulatory deficiency, in agreement with the regulator, or of suspension of payments. Interest payments are cumulative and are payable in full, once coupon payments resume, or, if these events occur before, when the issuance is redeemed or when the issuer is liquidated.
(3) Given the eligibility criteria and prudential adjustments, including the own credit risk and instruments amortisation.
(4) Restated according to IFRS 10 and 11 and the amendment to IAS 32 (see notes 1.a and 2).
(6) The participating notes issued by BNP Paribas SA may be repurchased as provided for in the law of 3 January 1983. The number of notes in the market is 1,434,092.
(7) Depending on net income subject to a minimum of 85% of the TMO rate and a maximum of 130% of the TMO rate.
On 27 October 2014, BNP Paribas Fortis redeemed the perpetual subordinated notes issued in October
2004 for EUR 1 billion.
On 25 November 2014, BNP Paribas Cardif issued EUR 1 billion of undated subordinated notes.
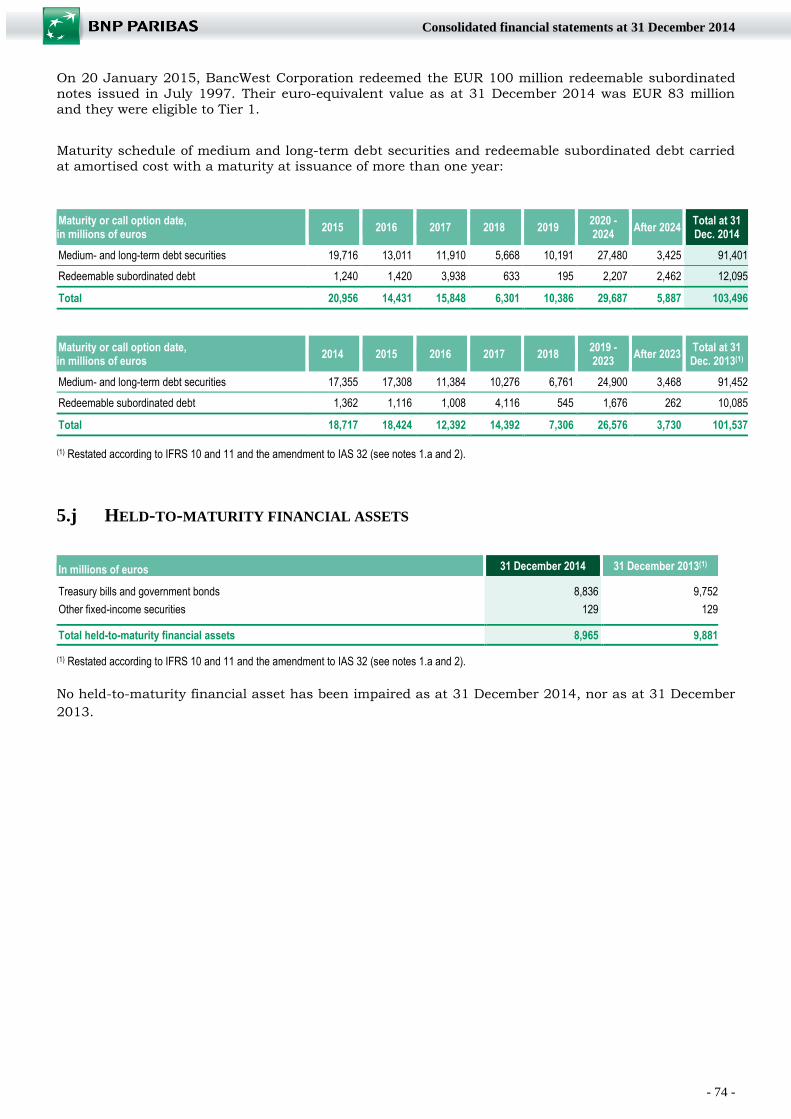
- 74 -
Consolidated financial statements at 31 December 2014
On 20 January 2015, BancWest Corporation redeemed the EUR 100 million redeemable subordinated
notes issued in July 1997. Their euro-equivalent value as at 31 December 2014 was EUR 83 million
and they were eligible to Tier 1.
Maturity schedule of medium and long-term debt securities and redeemable subordinated debt carried
at amortised cost with a maturity at issuance of more than one year:
Maturity or call option date,
in millions of euros 2015 2016 2017 2018 2019
2020 - 2024
After 2024 Total at 31 Dec. 2014
Medium- and long-term debt securities 19,716 13,011 11,910 5,668 10,191 27,480 3,425 91,401
Redeemable subordinated debt 1,240 1,420 3,938 633 195 2,207 2,462 12,095
Total 20,956 14,431 15,848 6,301 10,386 29,687 5,887 103,496
Maturity or call option date,
in millions of euros 2014 2015 2016 2017 2018
2019 - 2023
After 2023 Total at 31 Dec. 2013(1)
Medium- and long-term debt securities 17,355 17,308 11,384 10,276 6,761 24,900 3,468 91,452
Redeemable subordinated debt 1,362 1,116 1,008 4,116 545 1,676 262 10,085
Total 18,717 18,424 12,392 14,392 7,306 26,576 3,730 101,537
(1) Restated according to IFRS 10 and 11 and the amendment to IAS 32 (see notes 1.a and 2).
5.j HELD-TO-MATURITY FINANCIAL ASSETS
In millions of euros 31 December 2014 31 December 2013(1) Treasury bills and government bonds 8,836 9,752
Other fixed-income securities 129 129
Total held-to-maturity financial assets 8,965 9,881
(1) Restated according to IFRS 10 and 11 and the amendment to IAS 32 (see notes 1.a and 2).
No held-to-maturity financial asset has been impaired as at 31 December 2014, nor as at 31 December
2013.
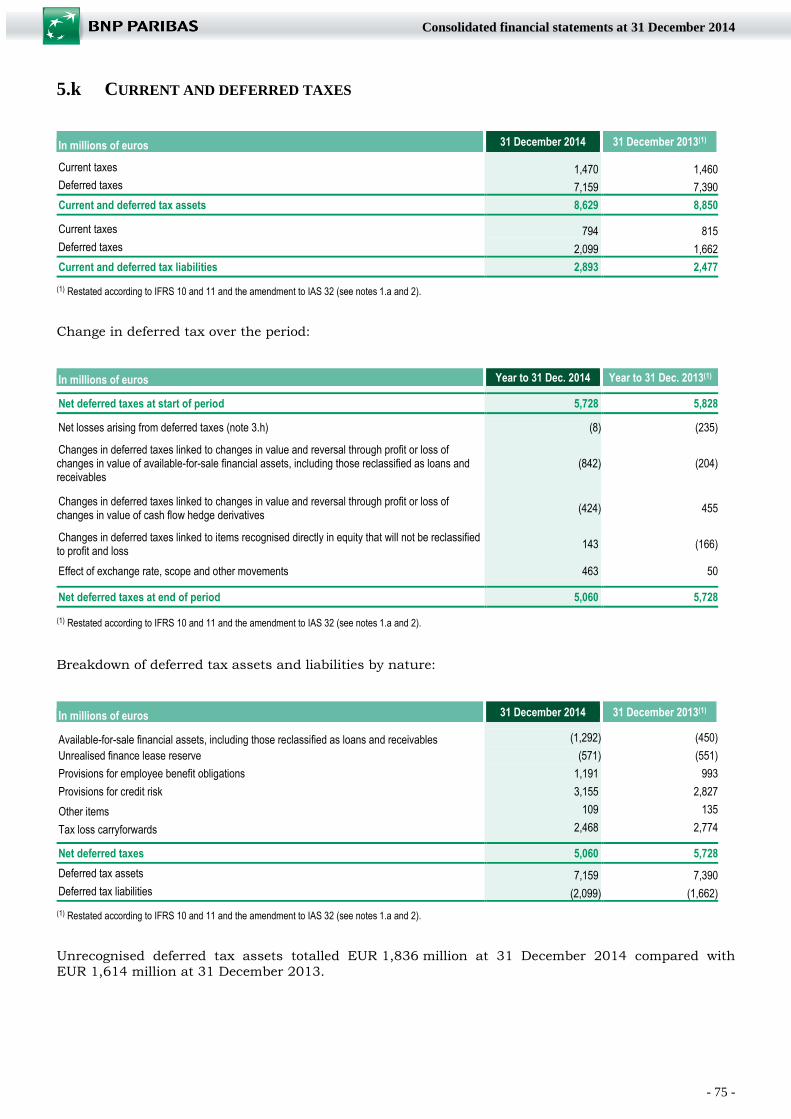
- 75 -
Consolidated financial statements at 31 December 2014
5.k CURRENT AND DEFERRED TAXES
In millions of euros 31 December 2014 31 December 2013(1)
Current taxes 1,470 1,460 Deferred taxes 7,159 7,390
Current and deferred tax assets 8,629 8,850
Current taxes 794 815 Deferred taxes 2,099 1,662
Current and deferred tax liabilities 2,893 2,477
(1) Restated according to IFRS 10 and 11 and the amendment to IAS 32 (see notes 1.a and 2).
Change in deferred tax over the period:
In millions of euros Year to 31 Dec. 2014 Year to 31 Dec. 2013(1)
Net deferred taxes at start of period 5,728 5,828
Net losses arising from deferred taxes (note 3.h) (8) (235)
Changes in deferred taxes linked to changes in value and reversal through profit or loss of changes in value of available-for-sale financial assets, including those reclassified as loans and receivables
(842) (204)
Changes in deferred taxes linked to changes in value and reversal through profit or loss of changes in value of cash flow hedge derivatives (424) 455
Changes in deferred taxes linked to items recognised directly in equity that will not be reclassified to profit and loss 143 (166)
Effect of exchange rate, scope and other movements 463 50
Net deferred taxes at end of period 5,060 5,728
(1) Restated according to IFRS 10 and 11 and the amendment to IAS 32 (see notes 1.a and 2).
Breakdown of deferred tax assets and liabilities by nature:
In millions of euros 31 December 2014 31 December 2013(1)
Available-for-sale financial assets, including those reclassified as loans and receivables (1,292) (450)
Unrealised finance lease reserve (571) (551)
Provisions for employee benefit obligations 1,191 993
Provisions for credit risk 3,155 2,827
Other items 109 135
Tax loss carryforwards 2,468 2,774
Net deferred taxes 5,060 5,728
Deferred tax assets 7,159 7,390 Deferred tax liabilities (2,099) (1,662) (1) Restated according to IFRS 10 and 11 and the amendment to IAS 32 (see notes 1.a and 2).
Unrecognised deferred tax assets totalled EUR 1,836 million at 31 December 2014 compared with
EUR 1,614 million at 31 December 2013.
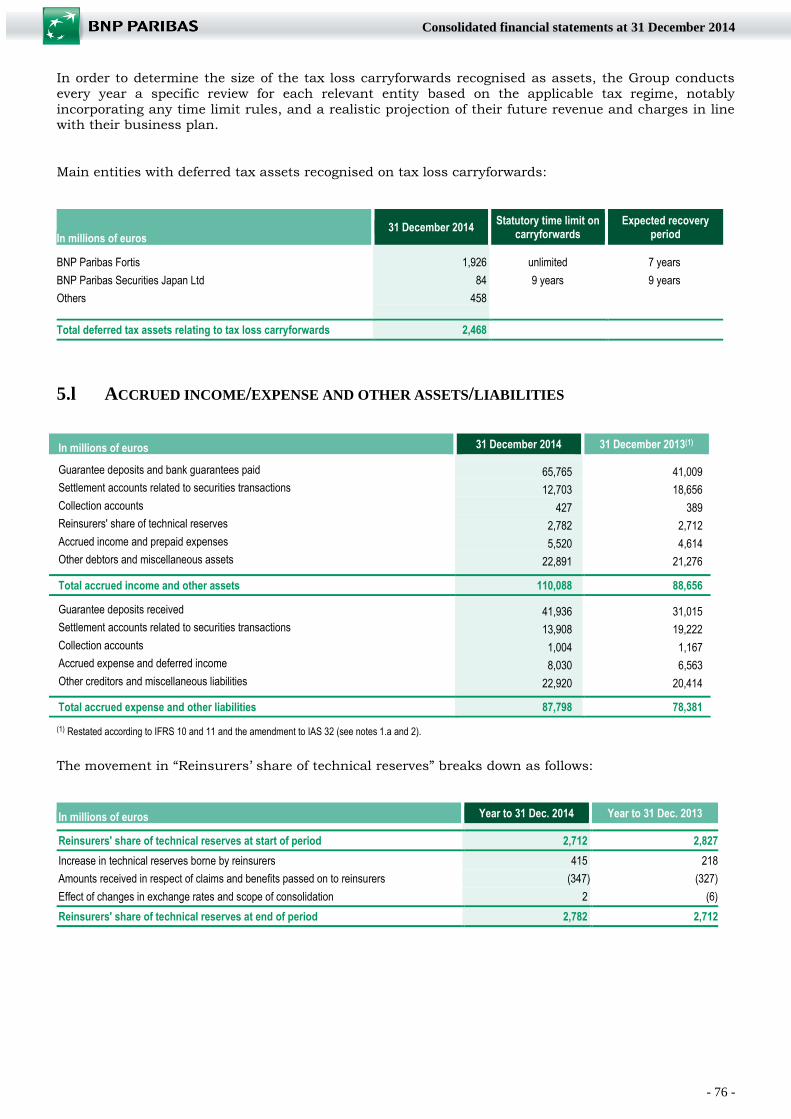
- 76 -
Consolidated financial statements at 31 December 2014
In order to determine the size of the tax loss carryforwards recognised as assets, the Group conducts
every year a specific review for each relevant entity based on the applicable tax regime, notably
incorporating any time limit rules, and a realistic projection of their future revenue and charges in line with their business plan.
Main entities with deferred tax assets recognised on tax loss carryforwards:
In millions of euros 31 December 2014
Statutory time limit on carryforwards
Expected recovery period
BNP Paribas Fortis 1,926 unlimited 7 years
BNP Paribas Securities Japan Ltd 84 9 years 9 years
Others 458
Total deferred tax assets relating to tax loss carryforwards 2,468
5.l ACCRUED INCOME/EXPENSE AND OTHER ASSETS/LIABILITIES
In millions of euros 31 December 2014 31 December 2013(1)
Guarantee deposits and bank guarantees paid 65,765 41,009 Settlement accounts related to securities transactions 12,703 18,656 Collection accounts 427 389 Reinsurers' share of technical reserves 2,782 2,712 Accrued income and prepaid expenses 5,520 4,614 Other debtors and miscellaneous assets 22,891 21,276
Total accrued income and other assets 110,088 88,656
Guarantee deposits received 41,936 31,015 Settlement accounts related to securities transactions 13,908 19,222 Collection accounts 1,004 1,167 Accrued expense and deferred income 8,030 6,563 Other creditors and miscellaneous liabilities 22,920 20,414
Total accrued expense and other liabilities 87,798 78,381
(1) Restated according to IFRS 10 and 11 and the amendment to IAS 32 (see notes 1.a and 2).
The movement in “Reinsurers’ share of technical reserves” breaks down as follows:
In millions of euros Year to 31 Dec. 2014 Year to 31 Dec. 2013
Reinsurers' share of technical reserves at start of period 2,712 2,827
Increase in technical reserves borne by reinsurers 415 218
Amounts received in respect of claims and benefits passed on to reinsurers (347) (327)
Effect of changes in exchange rates and scope of consolidation 2 (6)
Reinsurers' share of technical reserves at end of period 2,782 2,712
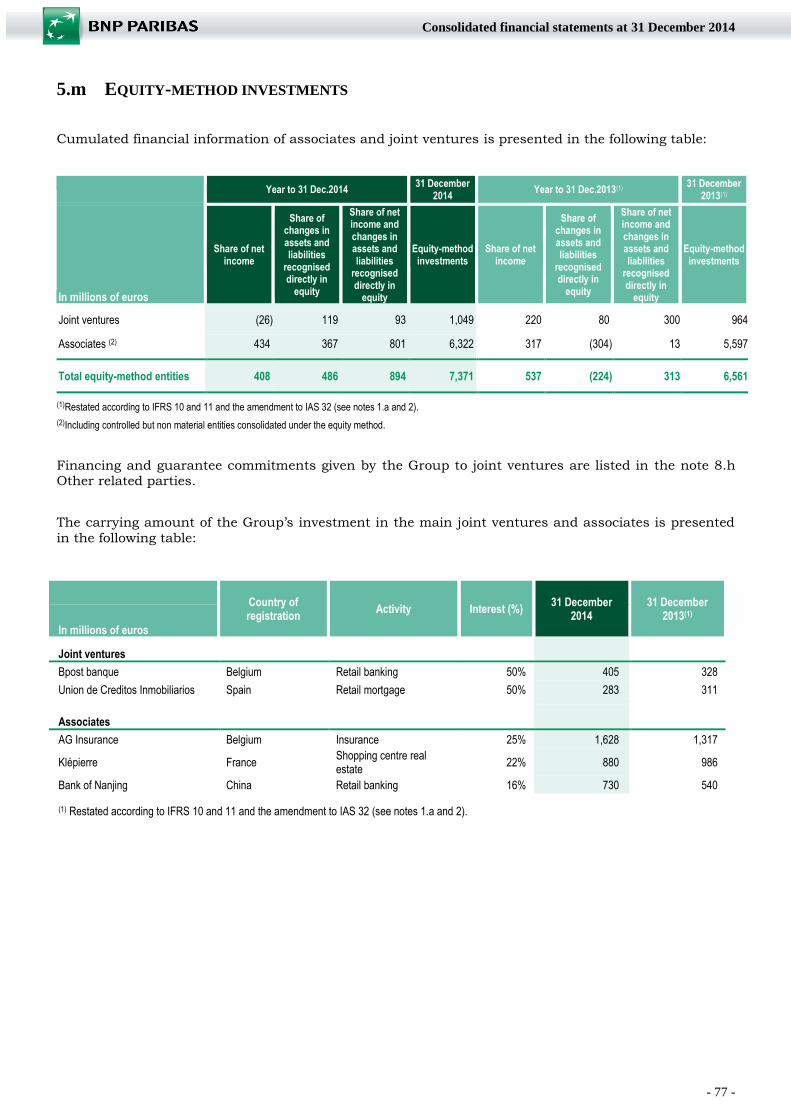
- 77 -
Consolidated financial statements at 31 December 2014
5.m EQUITY-METHOD INVESTMENTS
Cumulated financial information of associates and joint ventures is presented in the following table:
Year to 31 Dec.2014 31 December
2014 Year to 31 Dec.2013(1)
31 December 2013(1)
In millions of euros
Share of net income
Share of changes in assets and liabilities
recognised directly in
equity
Share of net income and changes in assets and liabilities
recognised directly in
equity
Equity-method investments
Share of net income
Share of changes in assets and liabilities
recognised directly in
equity
Share of net income and changes in assets and liabilities
recognised directly in
equity
Equity-method investments
Joint ventures (26) 119 93 1,049 220 80 300 964
Associates (2) 434 367 801 6,322 317 (304) 13 5,597
Total equity-method entities 408 486 894 7,371 537 (224) 313 6,561
(1)Restated according to IFRS 10 and 11 and the amendment to IAS 32 (see notes 1.a and 2).
(2)Including controlled but non material entities consolidated under the equity method.
Financing and guarantee commitments given by the Group to joint ventures are listed in the note 8.h Other related parties.
The carrying amount of the Group’s investment in the main joint ventures and associates is presented
in the following table:
Country of registration Activity Interest (%)
31 December 2014
31 December 2013(1)
In millions of euros
Joint ventures
Bpost banque Belgium Retail banking 50% 405 328
Union de Creditos Inmobiliarios Spain Retail mortgage 50% 283 311
Associates
AG Insurance Belgium Insurance 25% 1,628 1,317
Klépierre France Shopping centre real estate
22% 880 986
Bank of Nanjing China Retail banking 16% 730 540
(1) Restated according to IFRS 10 and 11 and the amendment to IAS 32 (see notes 1.a and 2).
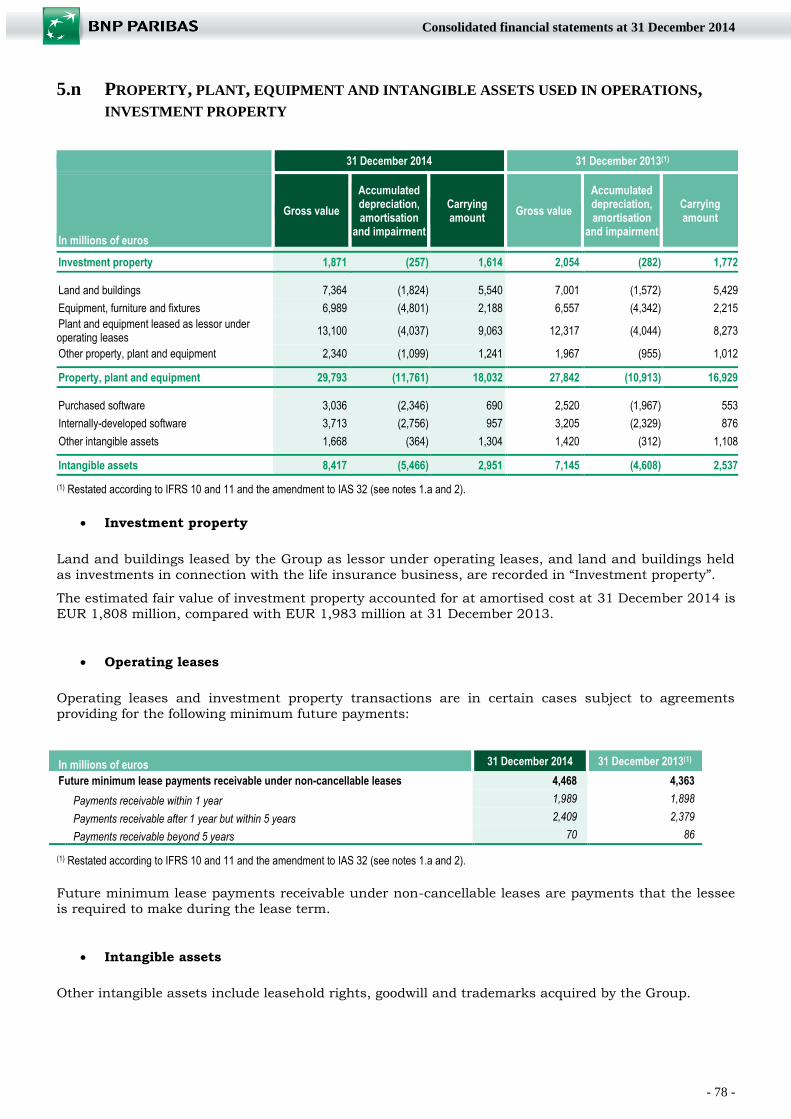
- 78 -
Consolidated financial statements at 31 December 2014
5.n PROPERTY, PLANT, EQUIPMENT AND INTANGIBLE ASSETS USED IN OPERATIONS,
INVESTMENT PROPERTY
31 December 2014 31 December 2013(1)
In millions of euros
Gross value
Accumulated depreciation, amortisation
and impairment
Carrying amount
Gross value
Accumulated depreciation, amortisation
and impairment
Carrying amount
Investment property 1,871 (257) 1,614 2,054 (282) 1,772
Land and buildings 7,364 (1,824) 5,540 7,001 (1,572) 5,429
Equipment, furniture and fixtures 6,989 (4,801) 2,188 6,557 (4,342) 2,215 Plant and equipment leased as lessor under operating leases 13,100 (4,037) 9,063 12,317 (4,044) 8,273
Other property, plant and equipment 2,340 (1,099) 1,241 1,967 (955) 1,012 Property, plant and equipment 29,793 (11,761) 18,032 27,842 (10,913) 16,929
Purchased software 3,036 (2,346) 690 2,520 (1,967) 553
Internally-developed software 3,713 (2,756) 957 3,205 (2,329) 876
Other intangible assets 1,668 (364) 1,304 1,420 (312) 1,108 Intangible assets 8,417 (5,466) 2,951 7,145 (4,608) 2,537
(1) Restated according to IFRS 10 and 11 and the amendment to IAS 32 (see notes 1.a and 2).
Investment property
Land and buildings leased by the Group as lessor under operating leases, and land and buildings held
as investments in connection with the life insurance business, are recorded in “Investment property”.
The estimated fair value of investment property accounted for at amortised cost at 31 December 2014 is
EUR 1,808 million, compared with EUR 1,983 million at 31 December 2013.
Operating leases
Operating leases and investment property transactions are in certain cases subject to agreements
providing for the following minimum future payments:
In millions of euros 31 December 2014 31 December 2013(1)
Future minimum lease payments receivable under non-cancellable leases 4,468 4,363
Payments receivable within 1 year 1,989 1,898
Payments receivable after 1 year but within 5 years 2,409 2,379
Payments receivable beyond 5 years 70 86
(1) Restated according to IFRS 10 and 11 and the amendment to IAS 32 (see notes 1.a and 2).
Future minimum lease payments receivable under non-cancellable leases are payments that the lessee
is required to make during the lease term.
Intangible assets
Other intangible assets include leasehold rights, goodwill and trademarks acquired by the Group.
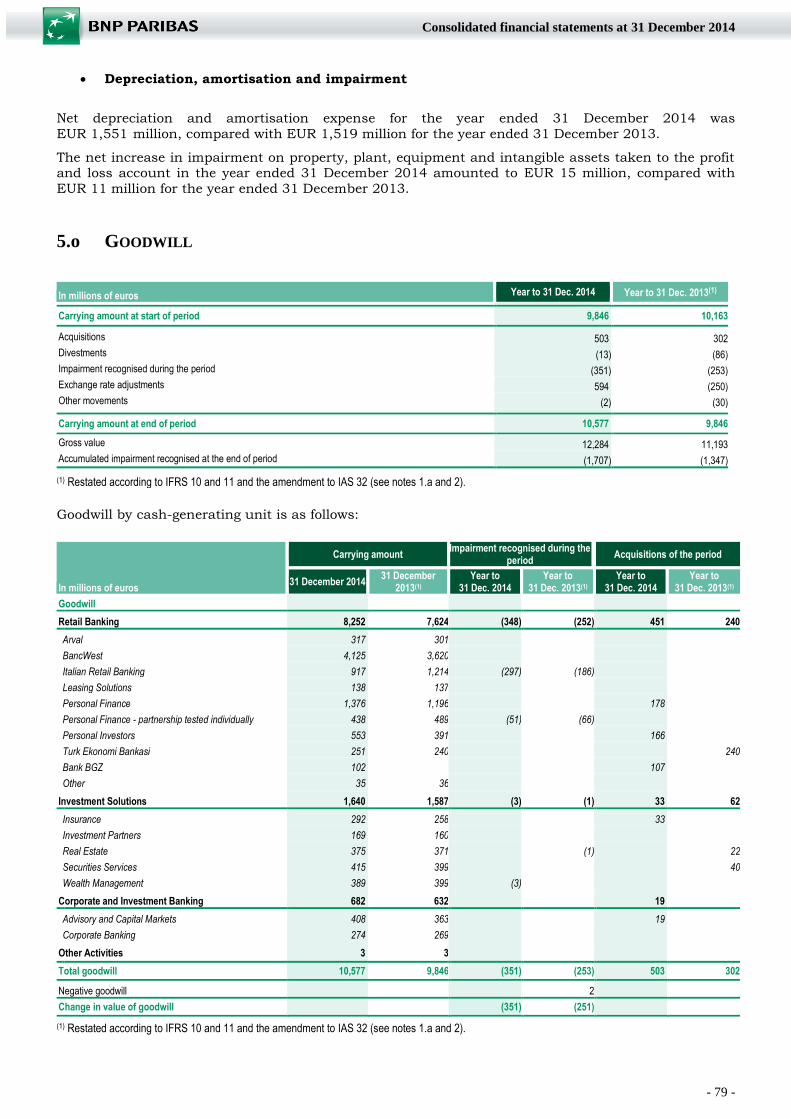
- 79 -
Consolidated financial statements at 31 December 2014
Depreciation, amortisation and impairment
Net depreciation and amortisation expense for the year ended 31 December 2014 was
EUR 1,551°million, compared with EUR 1,519 million for the year ended 31 December 2013.
The net increase in impairment on property, plant, equipment and intangible assets taken to the profit and loss account in the year ended 31 December 2014 amounted to EUR 15 million, compared with
EUR 11 million for the year ended 31 December 2013.
5.o GOODWILL
In millions of euros Year to 31 Dec. 2014 Year to 31 Dec. 2013(1)
Carrying amount at start of period 9,846 10,163
Acquisitions 503 302
Divestments (13) (86)
Impairment recognised during the period (351) (253)
Exchange rate adjustments 594 (250)
Other movements (2) (30)
Carrying amount at end of period 10,577 9,846
Gross value 12,284 11,193
Accumulated impairment recognised at the end of period (1,707) (1,347)
(1) Restated according to IFRS 10 and 11 and the amendment to IAS 32 (see notes 1.a and 2).
Goodwill by cash-generating unit is as follows:
In millions of euros
Carrying amount Impairment recognised during the
period Acquisitions of the period
31 December 2014 31 December
2013(1) Year to
31 Dec. 2014 Year to
31 Dec. 2013(1) Year to
31 Dec. 2014 Year to
31 Dec. 2013(1)
Goodwill
Retail Banking 8,252 7,624 (348) (252) 451 240
Arval 317 301
BancWest 4,125 3,620
Italian Retail Banking 917 1,214 (297) (186)
Leasing Solutions 138 137
Personal Finance 1,376 1,196 178
Personal Finance - partnership tested individually 438 489 (51) (66)
Personal Investors 553 391 166
Turk Ekonomi Bankasi 251 240 240
Bank BGZ 102 107
Other 35 36
Investment Solutions 1,640 1,587 (3) (1) 33 62
Insurance 292 258 33
Investment Partners 169 160
Real Estate 375 371 (1) 22
Securities Services 415 399 40
Wealth Management 389 399 (3)
Corporate and Investment Banking 682 632 19
Advisory and Capital Markets 408 363 19
Corporate Banking 274 269
Other Activities 3 3
Total goodwill 10,577 9,846 (351) (253) 503 302
Negative goodwill 2
Change in value of goodwill (351) (251)
(1) Restated according to IFRS 10 and 11 and the amendment to IAS 32 (see notes 1.a and 2).

- 80 -
Consolidated financial statements at 31 December 2014
The homogeneous groups of businesses to which goodwill is allocated are:
Arval: Specialist in multi-brand full-service corporate vehicle leasing, Arval offers its customers tailored
solutions that optimise their employees’ mobility and outsource the risks associated with fleet management.
BancWest: In the United States, the Retail Banking business is conducted through Bank of the West
and First Hawaiian Bank, subsidiaries of BancWest Corporation since 1998. Bank of the West markets
a very broad range of retail banking products and services to individuals, small businesses and
corporate clients, and has strong positions in certain niche lending markets. First Hawaiian Bank is Hawaii’s leading bank, offering banking services to a local clientele of private individuals and
corporates.
Italian Retail Banking: BNL banca commerciale is Italy’s 6th largest bank in terms of total assets and
loans to customers. It provides a comprehensive range of banking, financial and insurance products
and services to meet the needs of its diversified client base. BNL bc has a strong position in lending, especially residential mortgages. BNL bc also has a long-stand tradition in supporting large companies
and local authorities, with a reputation in cross-border payments, project financing and structured
finance, as well as factoring through its specialised subsidiary Ifitalia.
Leasing Solutions : BNP Paribas Leasing Solutions uses a multi-channel approach (direct sales, sales via referrals, partnerships and banking networks) to offer corporate and small business clients an array
of leasing and rental solutions, ranging from equipment financing to fleet outsourcing.
Personal Finance: BNP Paribas Personal Finance is the Group’s consumer credit specialist. BNP
Paribas Personal Finance operates in around 30 countries, and through brands such as Cetelem,
LaSer, Cofinoga, Findomestic and AlphaCredit, it provides a comprehensive range of consumer loans at point of sale (retail stores and car dealerships) and directly to clients either online or through its
customer relation centres. The consumer credit business also operates within the Group’s retail
banking network in the emerging countries, through the « PF Inside » set-up. In Germany, Bulgaria,
France, Hungary and Italy, the lending and insurance offer of Personal Finance has been complemented
by savings products. It is also developing an active strategy of partnerships with retail chains, car
manufacturers and dealers, web merchants and other financial institutions (banking and insurance).
A partnership of the BNP Paribas Personal Finance homogeneous group is tested individually for
impairment.
Personal Investors: BNP Paribas Personal Investors provides independent financial advice and a wide
range of corporate and investment services to individual clients, mainly through digital channels. It includes notably Cortal Consors, rebranded as Consorsbank (European specialist in online savings and
brokerage in Germany, France and Spain), B*Capital and Geojit BNP Paribas.
Turk Ekonomi Bankasi: Present mostly in Turkey, Turk Ekonomi Bankasi offers its customers (Retail,
Corporate and SME) a wide array of financial products and services, including retail and private
banking, treasury and capital markets services, and financing.
Bank BGŻ: Bank BGŻ is a universal commercial bank, one of the leading banks in Poland for years.
Through its network of about 400 branches, it offers services to retail and institutional clients,
including a sizeable group of businesses in the food and agricultural sector.
Insurance: BNP Paribas Cardif, a world leader in personal insurance, has designed, developed and
marketed savings and protection products and services.
BNP Paribas Cardif has developed new forms of insurance and extended its offer of protection to health
insurance, budget insurance, revenue and means of payment insurance, warranty extensions, non-life
insurance, unemployment insurance, return-to-work assistance, protection of private digital data, etc.

- 81 -
Consolidated financial statements at 31 December 2014
BNP Paribas Cardif sells its products through the BNP Paribas Retail Banking channel, as well as the
Partnerships channel and the Digital & Brokers channel.
Investment Partners: BNP Paribas Investment Partners (BNPP IP) is the dedicated asset management
business line of the BNP Paribas Group and offers a comprehensive range of asset management services
to both private and institutional investors worldwide.
As a "multi-local" asset manager, BNPP IP has an Institutional line offering investors European and
global customised management solutions; a Distributors line offering a wide range of savings and
services solutions adapted to the needs of distributors and their customers; and an Asia Pacific & Emerging Markets division (combining local asset management companies and global skills to meet the
needs of both institutional investors and distributors in these regions).
Real Estate: BNP Paribas Real Estate ranks as Continental Europe’s no. 1 provider of real estate
services to corporates and as one of France’s leading players in residential property.
Securities Services: BNP Paribas Securities Services is one of the major global players in securities
services and provides integrated solutions for all actors involved in the investment cycle, sell side, buy
side and issuers.
Wealth Management: BNP Paribas Wealth Management encompasses the private banking activities of BNP Paribas and serves a clientele of wealthy individuals, shareholder families and entrepreneurs
seeking a one-stop shop for all their wealth management and financial needs.
Advisory and Capital Markets: incudes Global Equities and Commodity Derivatives (division which
offers equity, commodity, index and fund derivatives, as well as financing solutions and an integrated
equity brokerage platform), Fixed Income (global player in credit, currency and interest-rate products), and Corporate Finance (offers advisory services for mergers and acquisitions and primary equity capital
market transactions).
Corporate Banking : Corporate Banking comprises all financing products and services for corporate
clients, from transaction banking (cash management, international trade finance and liquidity management) to financing solutions : vanilla lending, specialised financing (aircraft, shipping, real
estate, export, leveraged financing, project, corporate acquisition financing and media telecom). This
offer has been expanded with a line of products dedicated to the gathering of corporate deposits.
Goodwill impairment tests are based on three different methods: observation of transactions related to
comparable businesses, share price data for listed companies with comparable businesses, and
discounted future cash flows (DCF).
If one of the two comparables-based methods indicates the need for impairment, the DCF method is used to validate the results and determine the amount of impairment required.
The DCF method is based on a number of assumptions in terms of future revenues, expenses and cost
of risk (cash flows) based on medium-term business plans over a period of five years. Cash flow
projections beyond the 5-year forecast period are based on a growth rate to perpetuity and are
normalised when the short-term environment does not reflect the normal conditions of the economic cycle.
The key parameters which are sensitive to the assumptions made are the cost of capital, the
cost/income ratio, the cost of risk and the growth rate to perpetuity.
Cost of capital is determined on the basis of a risk-free rate, an observed market risk premium weighted
by a risk factor based on comparables specific to each homogeneous group of businesses. The values of
these parameters are obtained from external information sources.
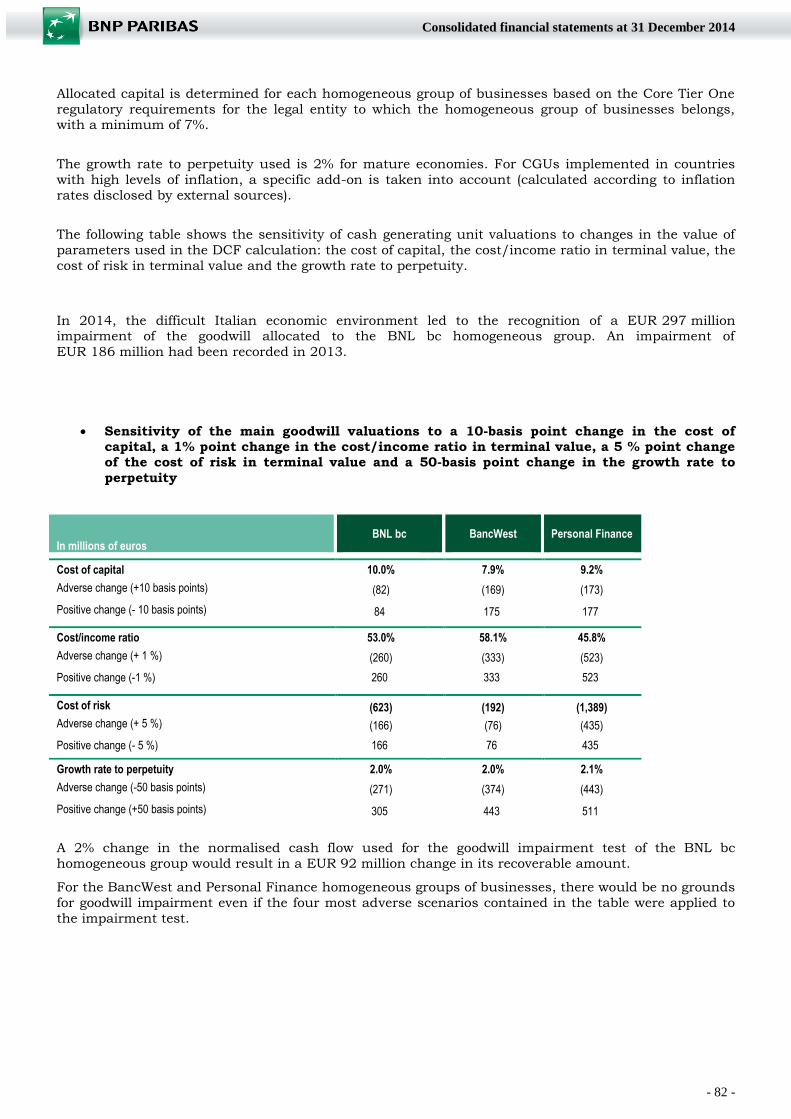
- 82 -
Consolidated financial statements at 31 December 2014
Allocated capital is determined for each homogeneous group of businesses based on the Core Tier One
regulatory requirements for the legal entity to which the homogeneous group of businesses belongs, with a minimum of 7%.
The growth rate to perpetuity used is 2% for mature economies. For CGUs implemented in countries
with high levels of inflation, a specific add-on is taken into account (calculated according to inflation
rates disclosed by external sources).
The following table shows the sensitivity of cash generating unit valuations to changes in the value of
parameters used in the DCF calculation: the cost of capital, the cost/income ratio in terminal value, the
cost of risk in terminal value and the growth rate to perpetuity.
In 2014, the difficult Italian economic environment led to the recognition of a EUR 297 million impairment of the goodwill allocated to the BNL bc homogeneous group. An impairment of
EUR 186 million had been recorded in 2013.
Sensitivity of the main goodwill valuations to a 10-basis point change in the cost of capital, a 1% point change in the cost/income ratio in terminal value, a 5 % point change of the cost of risk in terminal value and a 50-basis point change in the growth rate to
perpetuity
In millions of euros BNL bc BancWest Personal Finance
Cost of capital 10.0% 7.9% 9.2%
Adverse change (+10 basis points) (82) (169) (173) Positive change (- 10 basis points) 84 175 177 Cost/income ratio 53.0% 58.1% 45.8%
Adverse change (+ 1 %) (260) (333) (523) Positive change (-1 %) 260 333 523
Cost of risk (623) (192) (1,389)
Adverse change (+ 5 %) (166) (76) (435) Positive change (- 5 %) 166 76 435
Growth rate to perpetuity 2.0% 2.0% 2.1%
Adverse change (-50 basis points) (271) (374) (443) Positive change (+50 basis points) 305 443 511 A 2% change in the normalised cash flow used for the goodwill impairment test of the BNL bc
homogeneous group would result in a EUR 92 million change in its recoverable amount.
For the BancWest and Personal Finance homogeneous groups of businesses, there would be no grounds
for goodwill impairment even if the four most adverse scenarios contained in the table were applied to
the impairment test.

- 83 -
Consolidated financial statements at 31 December 2014
5.p TECHNICAL RESERVES OF INSURANCE COMPANIES
In millions of euros 31 December 2014 31 December 2013
Liabilities related to insurance contracts 128,396 118,785
Gross technical reserves
Unit-linked contracts 46,382 42,677
Other insurance contracts 82,014 76,108 Liabilities related to financial contracts with discretionary participation feature 30,444 28,383 Policyholders' surplus reserve - liability 16,374 8,058
Total technical reserves of insurance companies 175,214 155,226
Liabilities related to unit-linked financial contracts (1) 2,434 2,260
Liabilities related to general fund financial contracts 2
Total liabilities related to contracts written by insurance companies 177,648 157,488
(1)Liabilities related to unit-linked financial contracts are included in “Due to customers” (note 5.g)
The policyholders’ surplus reserve arises from the application of shadow accounting. It represents the
interest of policyholders within French and Italian life insurance subsidiaries in unrealised gains and
losses and impairment losses on assets where the benefit paid under the policy is linked to the return
on those assets. It is obtained from stochastic calculations modelling the unrealised gains and losses
attributable to policyholders based on economic scenarios and assumptions as regards rates paid to
customers and new business inflows. For France, this resulted in an interest of 90% in 2014,
unchanged from 2013.
The movement in liabilities related to insurance contracts breaks down as follows:
In millions of euros Year to 31 Dec. 2014 Year to 31 Dec. 2013
Liabilities related to insurance contracts at start of period 157,488 149,315
Additions to insurance contract technical reserves and deposits taken on financial contracts related to life insurance 31,413 21,275
Claims and benefits paid (14,339) (15,579)
Effect of changes in value of admissible investments related to unit-linked business 2,513 2,768
Effect of movements in exchange rates 482 (494)
Effect of changes in the scope of consolidation 91 203
Liabilities related to insurance contracts at end of period 177,648 157,488
See note 5.l for details of reinsurers’ share of technical reserves.
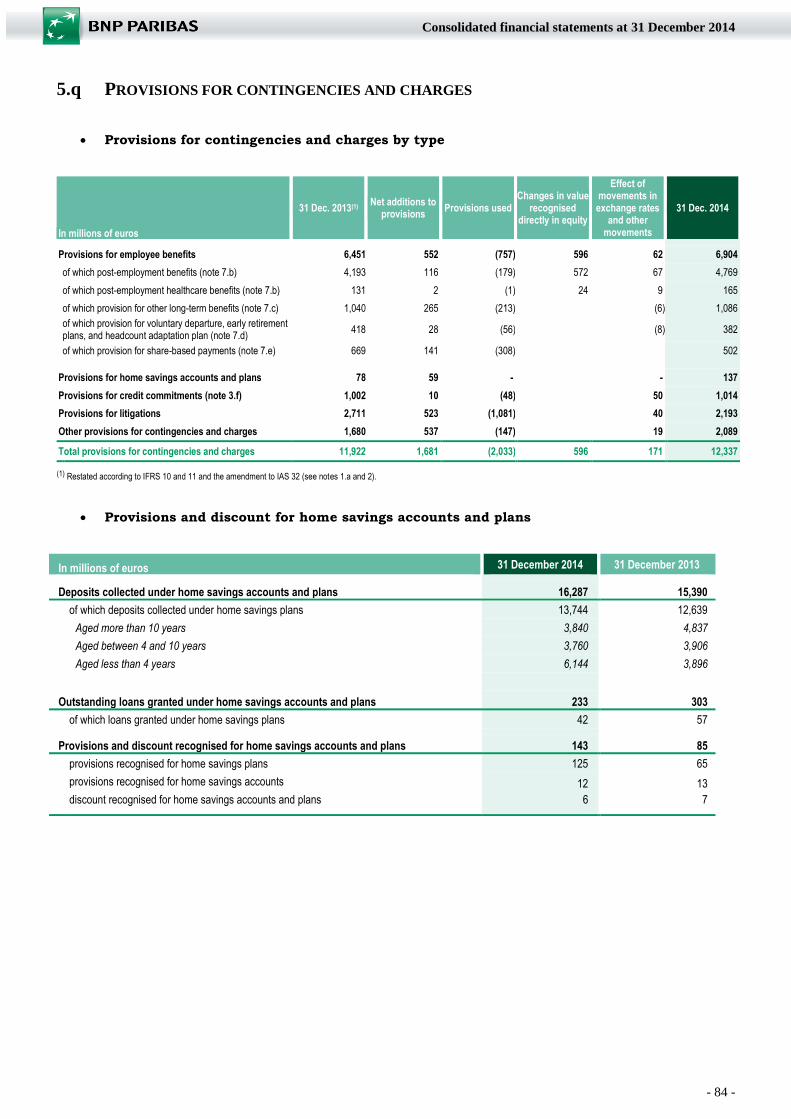
- 84 -
Consolidated financial statements at 31 December 2014
5.q PROVISIONS FOR CONTINGENCIES AND CHARGES
Provisions for contingencies and charges by type
In millions of euros
31 Dec. 2013(1) Net additions to
provisions Provisions used
Changes in value recognised
directly in equity
Effect of movements in exchange rates
and other movements
31 Dec. 2014
Provisions for employee benefits 6,451 552 (757) 596 62 6,904
of which post-employment benefits (note 7.b) 4,193 116 (179) 572 67 4,769
of which post-employment healthcare benefits (note 7.b) 131 2 (1) 24 9 165
of which provision for other long-term benefits (note 7.c) 1,040 265 (213) (6) 1,086
of which provision for voluntary departure, early retirement plans, and headcount adaptation plan (note 7.d)
418 28 (56) (8) 382
of which provision for share-based payments (note 7.e) 669 141 (308) 502
Provisions for home savings accounts and plans 78 59 - - 137
Provisions for credit commitments (note 3.f) 1,002 10 (48) 50 1,014
Provisions for litigations 2,711 523 (1,081) 40 2,193
Other provisions for contingencies and charges 1,680 537 (147) 19 2,089
Total provisions for contingencies and charges 11,922 1,681 (2,033) 596 171 12,337
(1) Restated according to IFRS 10 and 11 and the amendment to IAS 32 (see notes 1.a and 2).
Provisions and discount for home savings accounts and plans
In millions of euros 31 December 2014 31 December 2013
Deposits collected under home savings accounts and plans 16,287 15,390
of which deposits collected under home savings plans 13,744 12,639
Aged more than 10 years 3,840 4,837
Aged between 4 and 10 years 3,760 3,906
Aged less than 4 years 6,144 3,896
Outstanding loans granted under home savings accounts and plans 233 303
of which loans granted under home savings plans 42 57
Provisions and discount recognised for home savings accounts and plans 143 85
provisions recognised for home savings plans 125 65
provisions recognised for home savings accounts 12 13 discount recognised for home savings accounts and plans 6 7

- 85 -
Consolidated financial statements at 31 December 2014
5.r OFFSETTING OF FINANCIAL ASSETS AND LIABILITIES
The following table presents the amounts of financial assets and liabilities before and after offsetting.
This information, required by IFRS 7, aims to enable the comparability with the accounting treatment
applicable in accordance with generally accepted accounting principles in the United States (US GAAP), which are less restrictive than IAS 32 as regards offsetting.
“Amounts set off on the balance sheet” have been determined according to IAS 32. Thus, a financial
asset and a financial liability are offset and the net amount presented on the balance sheet when, and
only when, the Group has a legally enforceable right to set off the recognised amounts and intends
either to settle on a net basis, or to realise the asset and settle the liability simultaneously. Amounts set
off derive mainly from repurchase agreements and derivative instruments traded with clearing houses.
The “impacts of master netting agreements and similar agreements” are relative to outstanding
amounts of transactions within an enforceable agreement, which do not meet the offsetting criteria
defined by IAS 32. This is the case of transactions for which offsetting can only be performed in case of
default, insolvency or bankruptcy of one of the contracting parties.
“Financial instruments given or received as collateral” include guarantee deposits and securities collateral recognised at fair value. These guarantees can only be exercised in case of default, insolvency
or bankruptcy of one of the contracting parties.
Regarding master netting agreements, the guarantee deposits received or given in compensation for the
positive or negative fair values of financial instruments are recognised in the balance sheet in accrued
income or expenses and other assets or liabilities.
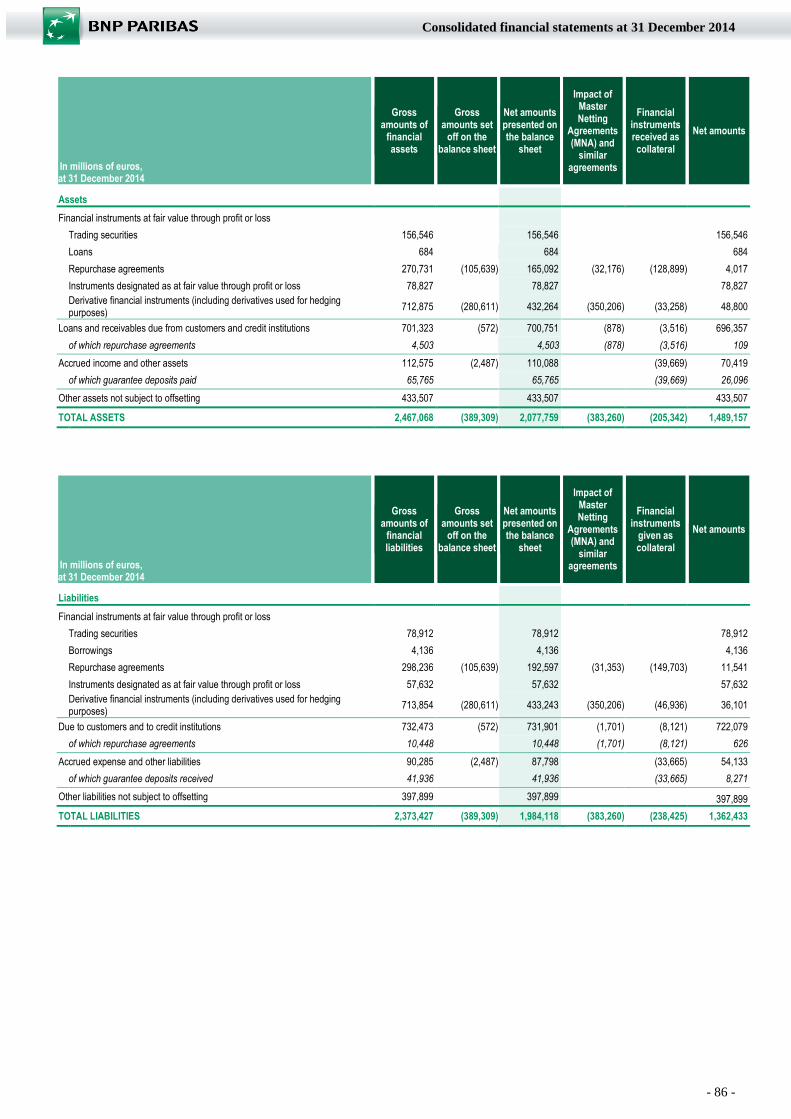
- 86 -
Consolidated financial statements at 31 December 2014
In millions of euros,
at 31 December 2014
Gross amounts of
financial assets
Gross amounts set
off on the balance sheet
Net amounts presented on the balance
sheet
Impact of Master Netting
Agreements (MNA) and
similar agreements
Financial instruments received as collateral
Net amounts
Assets
Financial instruments at fair value through profit or loss
Trading securities 156,546 156,546 156,546
Loans 684 684 684
Repurchase agreements 270,731 (105,639) 165,092 (32,176) (128,899) 4,017
Instruments designated as at fair value through profit or loss 78,827 78,827 78,827
Derivative financial instruments (including derivatives used for hedging purposes) 712,875 (280,611) 432,264 (350,206) (33,258) 48,800
Loans and receivables due from customers and credit institutions 701,323 (572) 700,751 (878) (3,516) 696,357
of which repurchase agreements 4,503 4,503 (878) (3,516) 109
Accrued income and other assets 112,575 (2,487) 110,088 (39,669) 70,419
of which guarantee deposits paid 65,765 65,765 (39,669) 26,096
Other assets not subject to offsetting 433,507 433,507 433,507
TOTAL ASSETS 2,467,068 (389,309) 2,077,759 (383,260) (205,342) 1,489,157
In millions of euros,
at 31 December 2014
Gross amounts of
financial liabilities
Gross amounts set
off on the balance sheet
Net amounts presented on the balance
sheet
Impact of Master Netting
Agreements (MNA) and
similar agreements
Financial instruments
given as collateral
Net amounts
Liabilities
Financial instruments at fair value through profit or loss
Trading securities 78,912 78,912 78,912
Borrowings 4,136 4,136 4,136
Repurchase agreements 298,236 (105,639) 192,597 (31,353) (149,703) 11,541
Instruments designated as at fair value through profit or loss 57,632 57,632 57,632
Derivative financial instruments (including derivatives used for hedging purposes)
713,854 (280,611) 433,243 (350,206) (46,936) 36,101
Due to customers and to credit institutions 732,473 (572) 731,901 (1,701) (8,121) 722,079
of which repurchase agreements 10,448 10,448 (1,701) (8,121) 626
Accrued expense and other liabilities 90,285 (2,487) 87,798 (33,665) 54,133
of which guarantee deposits received 41,936 41,936 (33,665) 8,271
Other liabilities not subject to offsetting 397,899 397,899 397,899
TOTAL LIABILITIES 2,373,427 (389,309) 1,984,118 (383,260) (238,425) 1,362,433
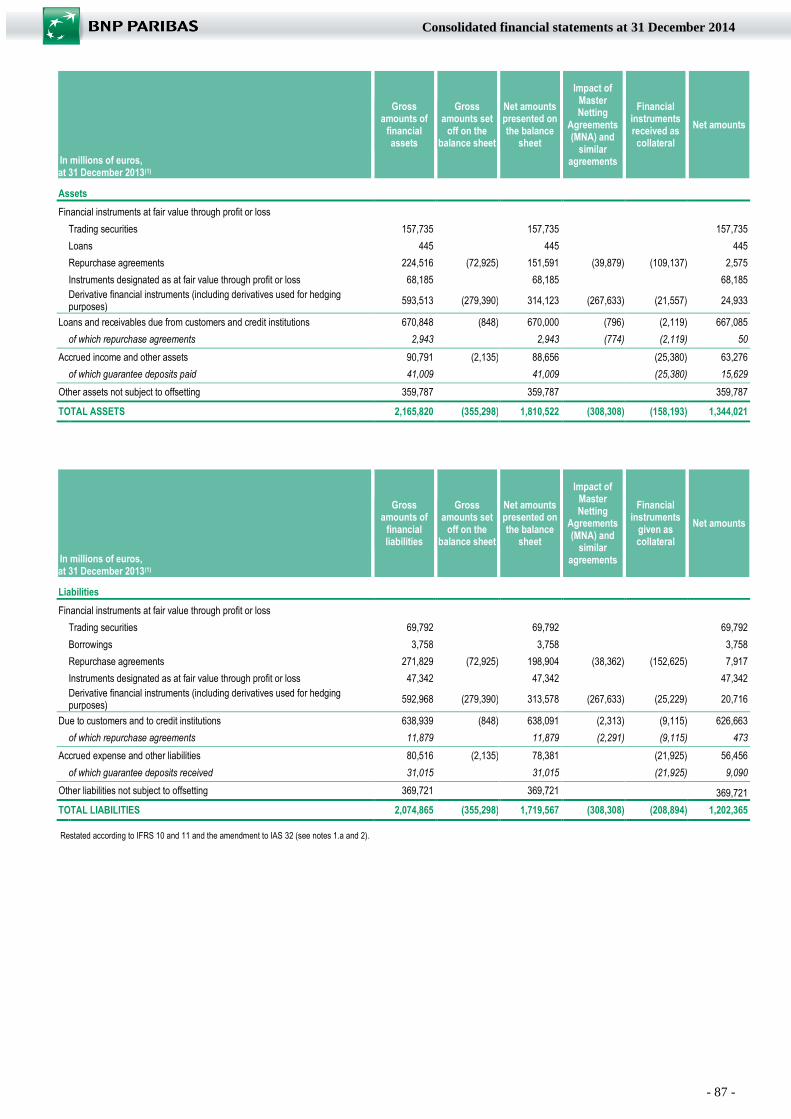
- 87 -
Consolidated financial statements at 31 December 2014
In millions of euros,
at 31 December 2013(1)
Gross amounts of
financial assets
Gross amounts set
off on the balance sheet
Net amounts presented on the balance
sheet
Impact of Master Netting
Agreements (MNA) and
similar agreements
Financial instruments received as collateral
Net amounts
Assets
Financial instruments at fair value through profit or loss
Trading securities 157,735 157,735 157,735
Loans 445 445 445
Repurchase agreements 224,516 (72,925) 151,591 (39,879) (109,137) 2,575
Instruments designated as at fair value through profit or loss 68,185 68,185 68,185
Derivative financial instruments (including derivatives used for hedging purposes) 593,513 (279,390) 314,123 (267,633) (21,557) 24,933
Loans and receivables due from customers and credit institutions 670,848 (848) 670,000 (796) (2,119) 667,085
of which repurchase agreements 2,943 2,943 (774) (2,119) 50
Accrued income and other assets 90,791 (2,135) 88,656 (25,380) 63,276
of which guarantee deposits paid 41,009 41,009 (25,380) 15,629
Other assets not subject to offsetting 359,787 359,787 359,787
TOTAL ASSETS 2,165,820 (355,298) 1,810,522 (308,308) (158,193) 1,344,021
In millions of euros,
at 31 December 2013(1)
Gross amounts of
financial liabilities
Gross amounts set
off on the balance sheet
Net amounts presented on the balance
sheet
Impact of Master Netting
Agreements (MNA) and
similar agreements
Financial instruments
given as collateral
Net amounts
Liabilities
Financial instruments at fair value through profit or loss
Trading securities 69,792 69,792 69,792
Borrowings 3,758 3,758 3,758
Repurchase agreements 271,829 (72,925) 198,904 (38,362) (152,625) 7,917
Instruments designated as at fair value through profit or loss 47,342 47,342 47,342
Derivative financial instruments (including derivatives used for hedging purposes) 592,968 (279,390) 313,578 (267,633) (25,229) 20,716
Due to customers and to credit institutions 638,939 (848) 638,091 (2,313) (9,115) 626,663
of which repurchase agreements 11,879 11,879 (2,291) (9,115) 473
Accrued expense and other liabilities 80,516 (2,135) 78,381 (21,925) 56,456
of which guarantee deposits received 31,015 31,015 (21,925) 9,090
Other liabilities not subject to offsetting 369,721 369,721 369,721
TOTAL LIABILITIES 2,074,865 (355,298) 1,719,567 (308,308) (208,894) 1,202,365
Restated according to IFRS 10 and 11 and the amendment to IAS 32 (see notes 1.a and 2).
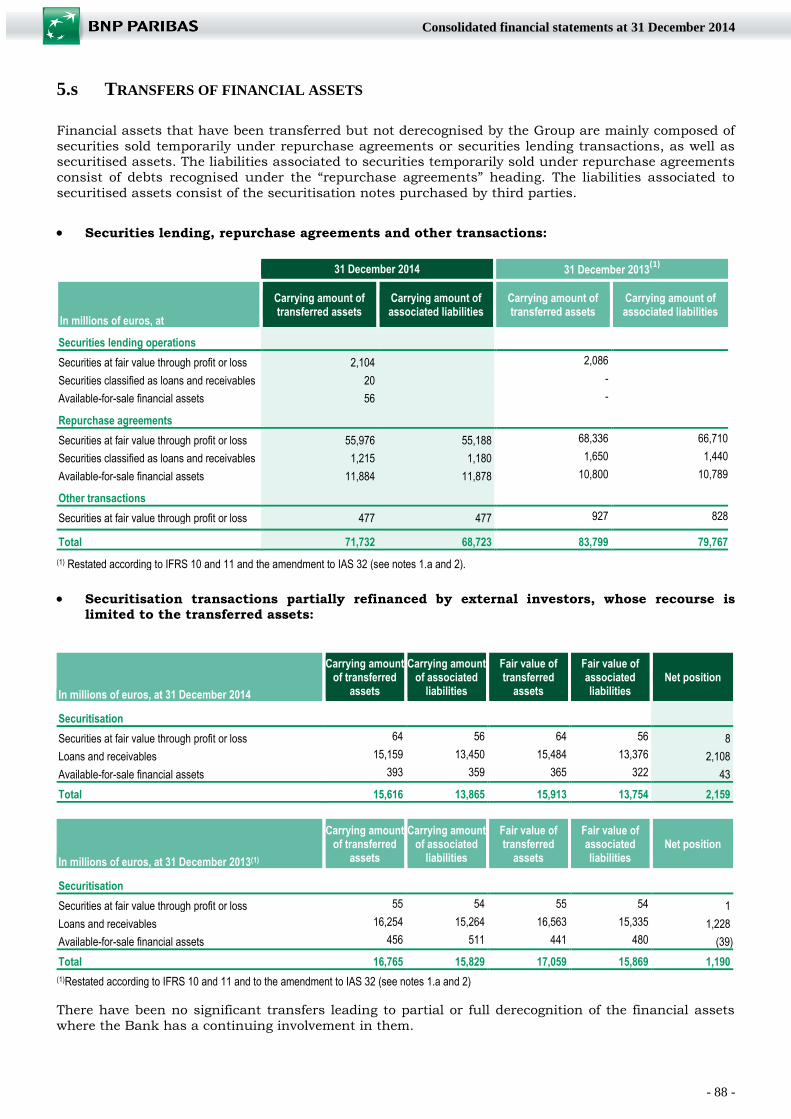
- 88 -
Consolidated financial statements at 31 December 2014
5.s TRANSFERS OF FINANCIAL ASSETS
Financial assets that have been transferred but not derecognised by the Group are mainly composed of
securities sold temporarily under repurchase agreements or securities lending transactions, as well as securitised assets. The liabilities associated to securities temporarily sold under repurchase agreements
consist of debts recognised under the “repurchase agreements” heading. The liabilities associated to
securitised assets consist of the securitisation notes purchased by third parties.
Securities lending, repurchase agreements and other transactions:
31 December 2014 31 December 2013(1)
In millions of euros, at
Carrying amount of transferred assets
Carrying amount of associated liabilities
Carrying amount of transferred assets
Carrying amount of associated liabilities
Securities lending operations
Securities at fair value through profit or loss 2,104 2,086
Securities classified as loans and receivables 20 -
Available-for-sale financial assets 56 - Repurchase agreements
Securities at fair value through profit or loss 55,976 55,188 68,336 66,710
Securities classified as loans and receivables 1,215 1,180 1,650 1,440
Available-for-sale financial assets 11,884 11,878 10,800 10,789 Other transactions
Securities at fair value through profit or loss 477 477 927 828
Total 71,732 68,723 83,799 79,767 (1) Restated according to IFRS 10 and 11 and the amendment to IAS 32 (see notes 1.a and 2).
Securitisation transactions partially refinanced by external investors, whose recourse is limited to the transferred assets:
In millions of euros, at 31 December 2014
Carrying amount of transferred
assets
Carrying amount of associated
liabilities
Fair value of transferred
assets
Fair value of associated liabilities
Net position
Securitisation
Securities at fair value through profit or loss 64 56 64 56 8
Loans and receivables 15,159 13,450 15,484 13,376 2,108
Available-for-sale financial assets 393 359 365 322 43
Total 15,616 13,865 15,913 13,754 2,159
In millions of euros, at 31 December 2013(1)
Carrying amount of transferred
assets
Carrying amount of associated
liabilities
Fair value of transferred
assets
Fair value of associated liabilities
Net position
Securitisation
Securities at fair value through profit or loss 55 54 55 54 1
Loans and receivables 16,254 15,264 16,563 15,335 1,228
Available-for-sale financial assets 456 511 441 480 (39)
Total 16,765 15,829 17,059 15,869 1,190 (1)Restated according to IFRS 10 and 11 and to the amendment to IAS 32 (see notes 1.a and 2)
There have been no significant transfers leading to partial or full derecognition of the financial assets
where the Bank has a continuing involvement in them.
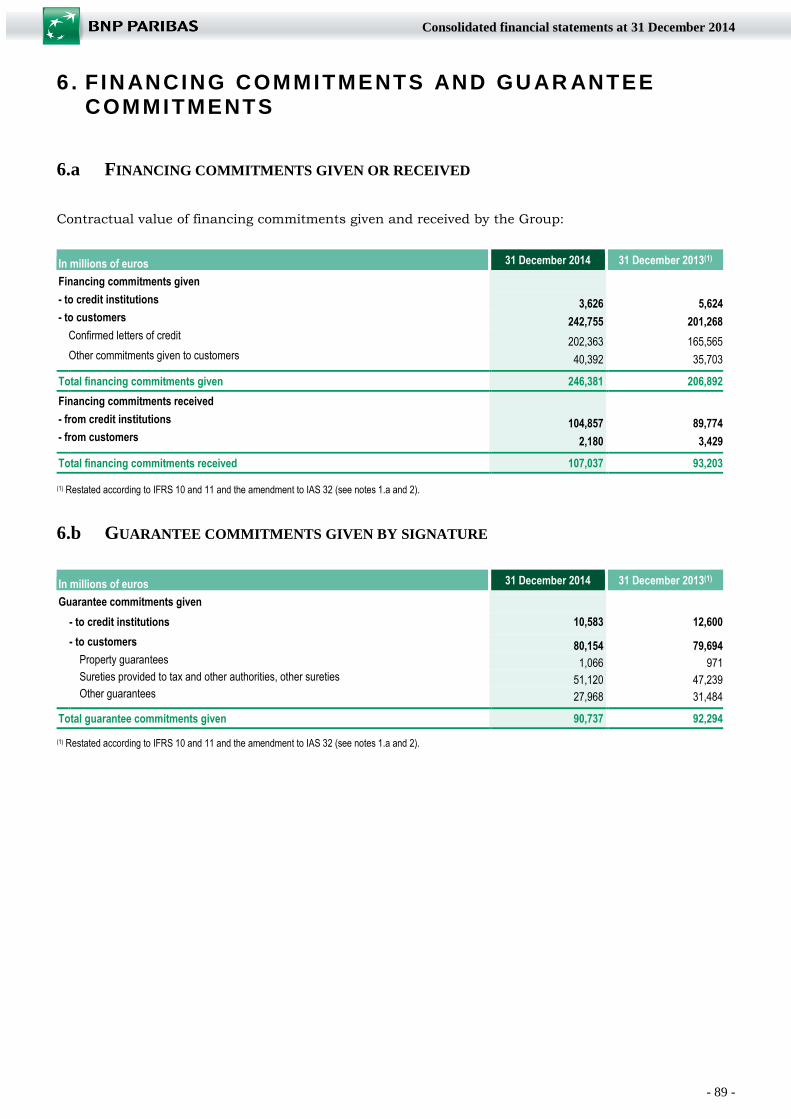
- 89 -
Consolidated financial statements at 31 December 2014
6 . F IN ANCING COMMITMENTS AND GU AR ANTEE COMMITMENTS
6.a FINANCING COMMITMENTS GIVEN OR RECEIVED
Contractual value of financing commitments given and received by the Group:
In millions of euros 31 December 2014 31 December 2013(1) Financing commitments given
- to credit institutions
3,626 5,624 - to customers
242,755 201,268
Confirmed letters of credit
202,363 165,565
Other commitments given to customers
40,392 35,703 Total financing commitments given 246,381 206,892
Financing commitments received
- from credit institutions 104,857 89,774
- from customers 2,180 3,429
Total financing commitments received 107,037 93,203
(1) Restated according to IFRS 10 and 11 and the amendment to IAS 32 (see notes 1.a and 2).
6.b GUARANTEE COMMITMENTS GIVEN BY SIGNATURE
In millions of euros 31 December 2014 31 December 2013(1)
Guarantee commitments given
- to credit institutions 10,583 12,600 - to customers
80,154 79,694 Property guarantees
1,066 971
Sureties provided to tax and other authorities, other sureties
51,120 47,239 Other guarantees
27,968 31,484
Total guarantee commitments given 90,737 92,294
(1) Restated according to IFRS 10 and 11 and the amendment to IAS 32 (see notes 1.a and 2).
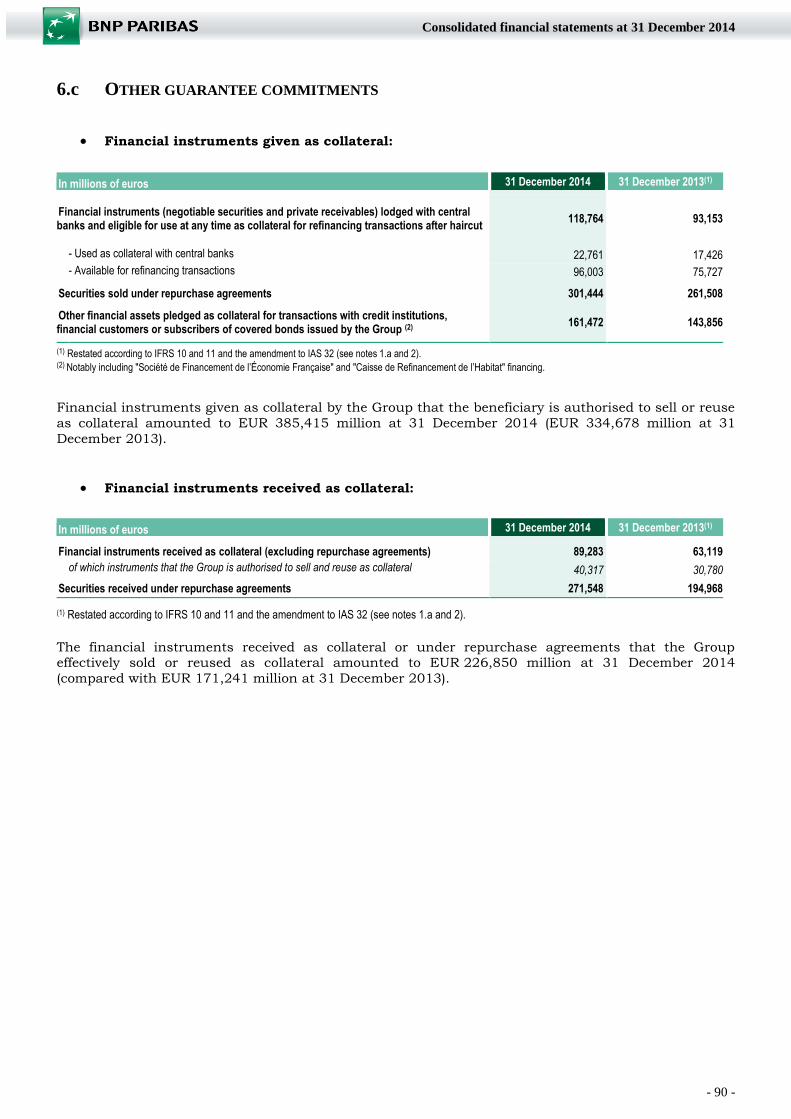
- 90 -
Consolidated financial statements at 31 December 2014
6.c OTHER GUARANTEE COMMITMENTS
Financial instruments given as collateral:
In millions of euros 31 December 2014 31 December 2013(1)
Financial instruments (negotiable securities and private receivables) lodged with central banks and eligible for use at any time as collateral for refinancing transactions after haircut 118,764 93,153
- Used as collateral with central banks 22,761 17,426
- Available for refinancing transactions 96,003 75,727 Securities sold under repurchase agreements 301,444 261,508 Other financial assets pledged as collateral for transactions with credit institutions, financial customers or subscribers of covered bonds issued by the Group (2) 161,472 143,856
(1) Restated according to IFRS 10 and 11 and the amendment to IAS 32 (see notes 1.a and 2).
(2) Notably including "Société de Financement de l’Économie Française" and "Caisse de Refinancement de l’Habitat" financing.
Financial instruments given as collateral by the Group that the beneficiary is authorised to sell or reuse
as collateral amounted to EUR 385,415 million at 31 December 2014 (EUR 334,678 million at 31
December 2013).
Financial instruments received as collateral:
In millions of euros 31 December 2014 31 December 2013(1) Financial instruments received as collateral (excluding repurchase agreements) 89,283 63,119
of which instruments that the Group is authorised to sell and reuse as collateral 40,317 30,780
Securities received under repurchase agreements 271,548 194,968 (1) Restated according to IFRS 10 and 11 and the amendment to IAS 32 (see notes 1.a and 2).
The financial instruments received as collateral or under repurchase agreements that the Group effectively sold or reused as collateral amounted to EUR 226,850 million at 31 December 2014
(compared with EUR 171,241 million at 31 December 2013).
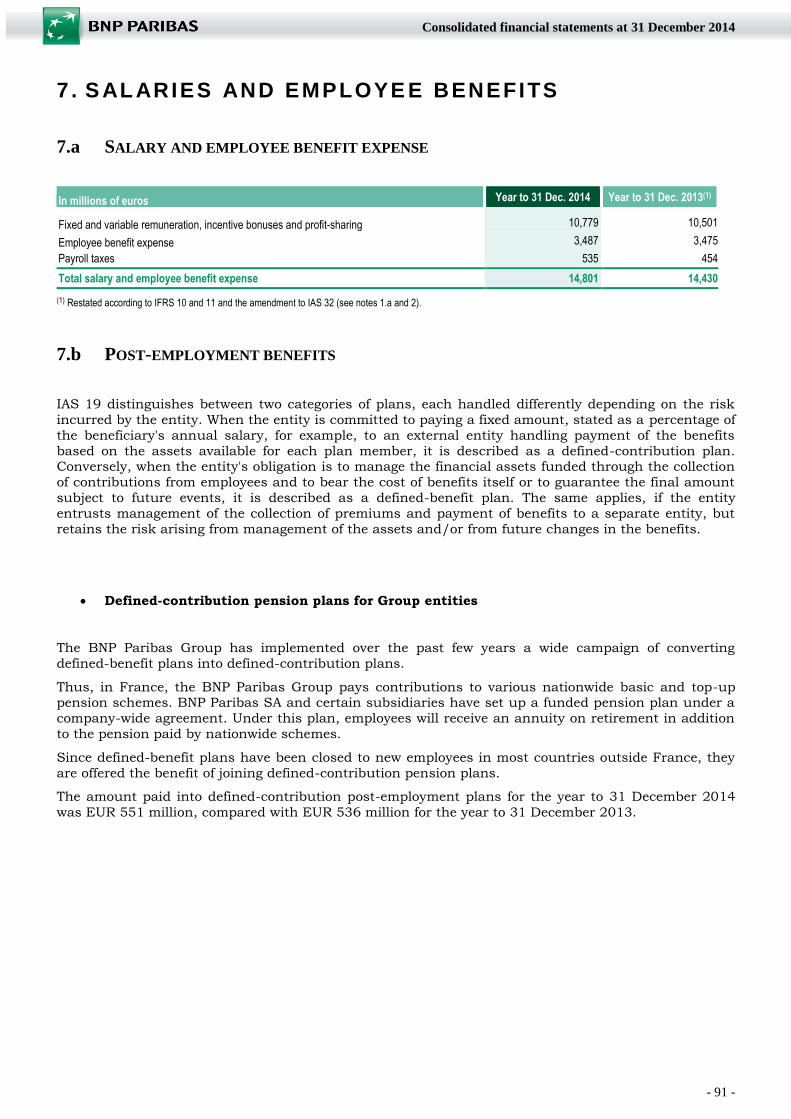
- 91 -
Consolidated financial statements at 31 December 2014
7 . S AL ARIES AND EMPLOYE E BENEFITS
7.a SALARY AND EMPLOYEE BENEFIT EXPENSE
In millions of euros Year to 31 Dec. 2014 Year to 31 Dec. 2013(1)
Fixed and variable remuneration, incentive bonuses and profit-sharing 10,779 10,501
Employee benefit expense 3,487 3,475
Payroll taxes 535 454
Total salary and employee benefit expense 14,801 14,430
(1) Restated according to IFRS 10 and 11 and the amendment to IAS 32 (see notes 1.a and 2).
7.b POST-EMPLOYMENT BENEFITS
IAS 19 distinguishes between two categories of plans, each handled differently depending on the risk
incurred by the entity. When the entity is committed to paying a fixed amount, stated as a percentage of
the beneficiary's annual salary, for example, to an external entity handling payment of the benefits
based on the assets available for each plan member, it is described as a defined-contribution plan. Conversely, when the entity's obligation is to manage the financial assets funded through the collection
of contributions from employees and to bear the cost of benefits itself or to guarantee the final amount
subject to future events, it is described as a defined-benefit plan. The same applies, if the entity
entrusts management of the collection of premiums and payment of benefits to a separate entity, but
retains the risk arising from management of the assets and/or from future changes in the benefits.
Defined-contribution pension plans for Group entities
The BNP Paribas Group has implemented over the past few years a wide campaign of converting
defined-benefit plans into defined-contribution plans.
Thus, in France, the BNP Paribas Group pays contributions to various nationwide basic and top-up pension schemes. BNP Paribas SA and certain subsidiaries have set up a funded pension plan under a
company-wide agreement. Under this plan, employees will receive an annuity on retirement in addition
to the pension paid by nationwide schemes.
Since defined-benefit plans have been closed to new employees in most countries outside France, they
are offered the benefit of joining defined-contribution pension plans.
The amount paid into defined-contribution post-employment plans for the year to 31 December 2014
was EUR 551 million, compared with EUR 536 million for the year to 31 December 2013.
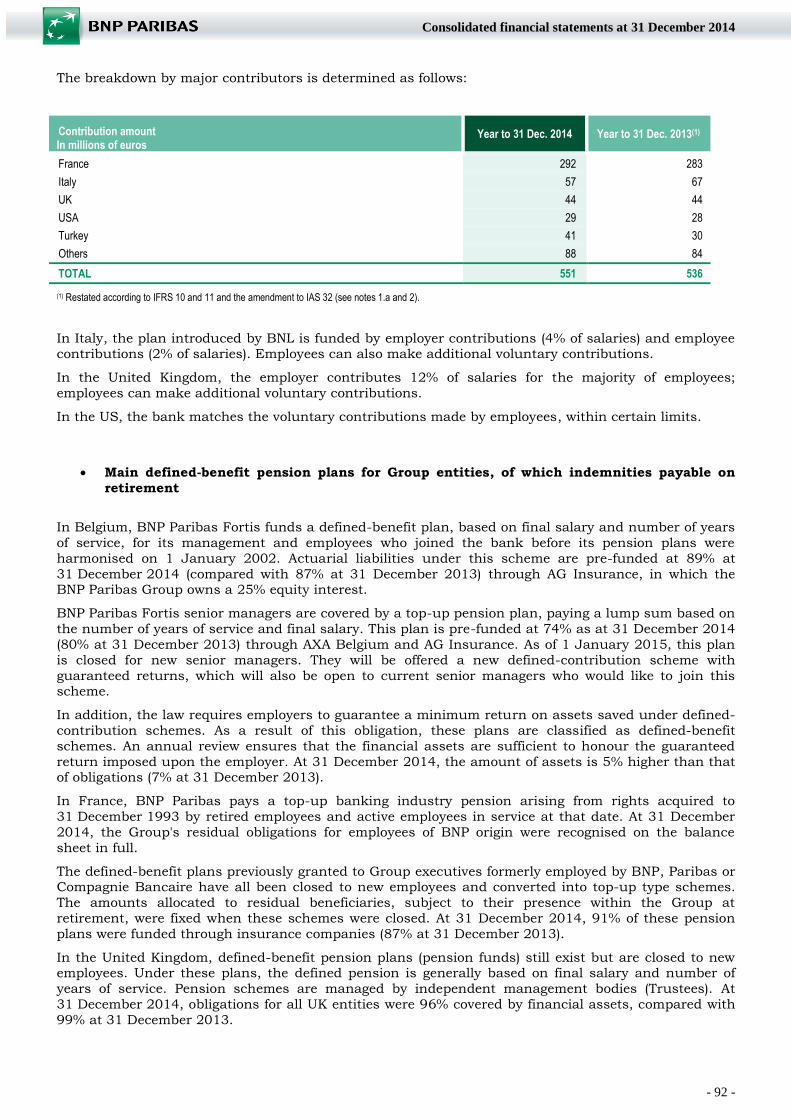
- 92 -
Consolidated financial statements at 31 December 2014
The breakdown by major contributors is determined as follows:
Contribution amount
In millions of euros Year to 31 Dec. 2014 Year to 31 Dec. 2013(1)
France 292 283
Italy 57 67
UK 44 44
USA 29 28
Turkey 41 30
Others 88 84
TOTAL 551 536
(1) Restated according to IFRS 10 and 11 and the amendment to IAS 32 (see notes 1.a and 2).
In Italy, the plan introduced by BNL is funded by employer contributions (4% of salaries) and employee contributions (2% of salaries). Employees can also make additional voluntary contributions.
In the United Kingdom, the employer contributes 12% of salaries for the majority of employees;
employees can make additional voluntary contributions.
In the US, the bank matches the voluntary contributions made by employees, within certain limits.
Main defined-benefit pension plans for Group entities, of which indemnities payable on
retirement
In Belgium, BNP Paribas Fortis funds a defined-benefit plan, based on final salary and number of years
of service, for its management and employees who joined the bank before its pension plans were
harmonised on 1 January 2002. Actuarial liabilities under this scheme are pre-funded at 89% at
31 December 2014 (compared with 87% at 31 December 2013) through AG Insurance, in which the BNP Paribas Group owns a 25% equity interest.
BNP Paribas Fortis senior managers are covered by a top-up pension plan, paying a lump sum based on
the number of years of service and final salary. This plan is pre-funded at 74% as at 31 December 2014
(80% at 31 December 2013) through AXA Belgium and AG Insurance. As of 1 January 2015, this plan
is closed for new senior managers. They will be offered a new defined-contribution scheme with
guaranteed returns, which will also be open to current senior managers who would like to join this scheme.
In addition, the law requires employers to guarantee a minimum return on assets saved under defined-
contribution schemes. As a result of this obligation, these plans are classified as defined-benefit
schemes. An annual review ensures that the financial assets are sufficient to honour the guaranteed
return imposed upon the employer. At 31 December 2014, the amount of assets is 5% higher than that of obligations (7% at 31 December 2013).
In France, BNP Paribas pays a top-up banking industry pension arising from rights acquired to
31 December 1993 by retired employees and active employees in service at that date. At 31 December
2014, the Group's residual obligations for employees of BNP origin were recognised on the balance
sheet in full.
The defined-benefit plans previously granted to Group executives formerly employed by BNP, Paribas or Compagnie Bancaire have all been closed to new employees and converted into top-up type schemes.
The amounts allocated to residual beneficiaries, subject to their presence within the Group at
retirement, were fixed when these schemes were closed. At 31 December 2014, 91% of these pension
plans were funded through insurance companies (87% at 31 December 2013).
In the United Kingdom, defined-benefit pension plans (pension funds) still exist but are closed to new employees. Under these plans, the defined pension is generally based on final salary and number of
years of service. Pension schemes are managed by independent management bodies (Trustees). At
31 December 2014, obligations for all UK entities were 96% covered by financial assets, compared with
99% at 31 December 2013.

- 93 -
Consolidated financial statements at 31 December 2014
In Switzerland, liabilities relate to top-up pension plans based on the principle of defined-contribution
schemes with guaranteed returns, paying an annuity under pre-defined terms. These schemes are
managed by a foundation. At the end of 2014, obligations were 97% covered by financial assets, compared with 100% at the end of 2013.
In the United States, defined-benefit pension plans are based on annual vesting rights to a lump sum
comprising a pension expressed as a percentage of annual salary and paying interest at a pre-defined
rate. These plans are closed to new entrants and have offered almost no new vesting rights since 2012.
At 31 December 2014, the obligation was 70% covered by financial assets, compared with 82% at
31 December 2013.
In Turkey, the pension plan replaces the national pension scheme (these obligations are measured
based on the terms of the eventual transfer to the Turkish State) and offers guarantees exceeding the
minimal legal requirements. At the end of 2014, obligations under this plan are fully funded by
financial assets held with an external foundation; these financial assets exceed the related obligations,
but since it is not refundable, this surplus is not recognised as an asset by the Group. The funding
coverage rate at 31 December 2014 reached 195% (204% at 31 December 2013).
- Other post-employment benefits
Group employees also receive various other contractual post-employment benefits, such as indemnities
payable on retirement, determined according to minimal legal requirements (Labour Code, collective agreements) or according to specific company-level agreements.
In France, the obligations for these benefits are funded through a contract held with a third-party
insurer. At 31 December 2014, this obligation was 79% covered by financial assets, compared with 84%
at 31 December 2013.
In other countries, the gross obligations of the Group related to these benefits are mainly concentrated
in Italy. They are representative of rights vested up to 31 December 2006, since pension reforms
changed Italian termination indemnity schemes into defined-contribution plans.
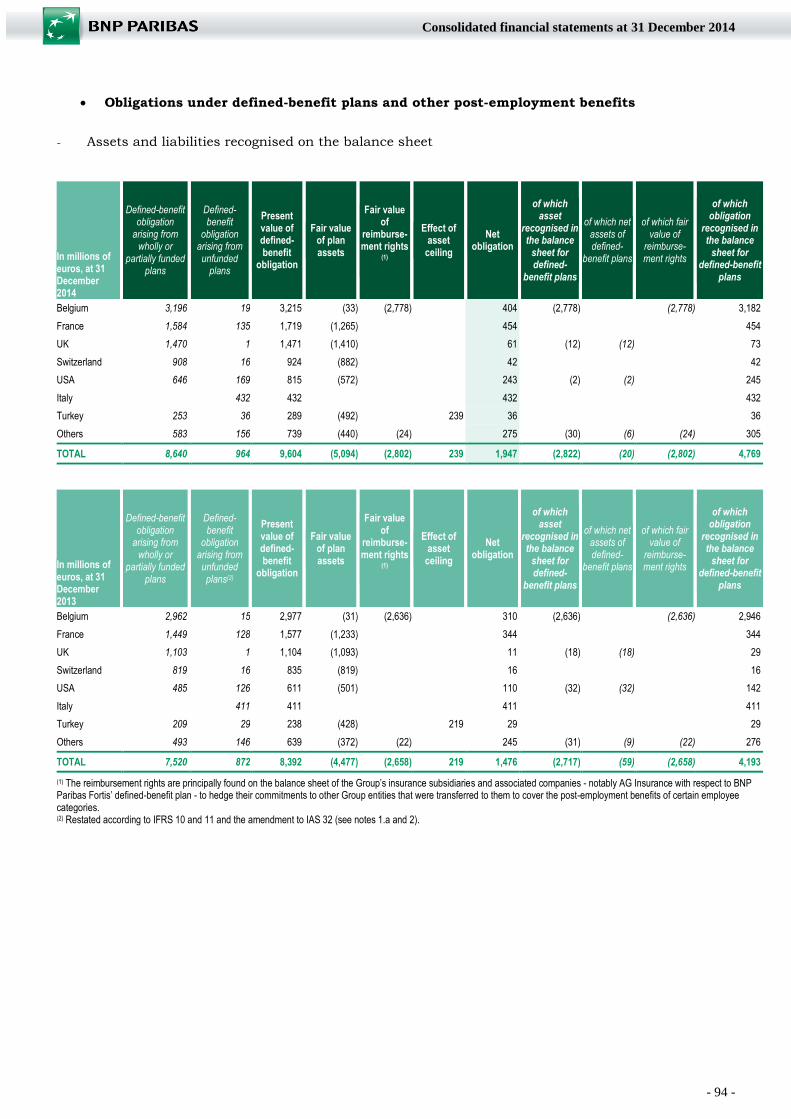
- 94 -
Consolidated financial statements at 31 December 2014
Obligations under defined-benefit plans and other post-employment benefits
- Assets and liabilities recognised on the balance sheet
In millions of euros, at 31 December 2014
Defined-benefit obligation
arising from wholly or
partially funded plans
Defined-benefit
obligation arising from unfunded
plans
Present value of defined-benefit
obligation
Fair value of plan assets
Fair value of
reimburse-ment rights
(1)
Effect of asset
ceiling
Net obligation
of which asset
recognised in the balance
sheet for defined-
benefit plans
of which net assets of defined-
benefit plans
of which fair value of
reimburse-ment rights
of which obligation
recognised in the balance
sheet for defined-benefit
plans
Belgium 3,196 19 3,215 (33) (2,778) 404 (2,778) (2,778) 3,182
France 1,584 135 1,719 (1,265) 454 454
UK 1,470 1 1,471 (1,410) 61 (12) (12) 73
Switzerland 908 16 924 (882) 42 42
USA 646 169 815 (572) 243 (2) (2) 245
Italy 432 432 432 432
Turkey 253 36 289 (492) 239 36 36
Others 583 156 739 (440) (24) 275 (30) (6) (24) 305
TOTAL 8,640 964 9,604 (5,094) (2,802) 239 1,947 (2,822) (20) (2,802) 4,769
In millions of euros, at 31 December 2013
Defined-benefit obligation
arising from wholly or
partially funded plans
Defined-benefit
obligation arising from unfunded plans(2)
Present value of defined-benefit
obligation
Fair value of plan assets
Fair value of
reimburse-ment rights
(1)
Effect of asset
ceiling
Net obligation
of which asset
recognised in the balance
sheet for defined-
benefit plans
of which net assets of defined-
benefit plans
of which fair value of
reimburse-ment rights
of which obligation
recognised in the balance
sheet for defined-benefit
plans
Belgium 2,962 15 2,977 (31) (2,636) 310 (2,636) (2,636) 2,946
France 1,449 128 1,577 (1,233) 344 344
UK 1,103 1 1,104 (1,093) 11 (18) (18) 29
Switzerland 819 16 835 (819) 16 16
USA 485 126 611 (501) 110 (32) (32) 142
Italy 411 411 411 411
Turkey 209 29 238 (428) 219 29 29
Others 493 146 639 (372) (22) 245 (31) (9) (22) 276
TOTAL 7,520 872 8,392 (4,477) (2,658) 219 1,476 (2,717) (59) (2,658) 4,193
(1) The reimbursement rights are principally found on the balance sheet of the Group’s insurance subsidiaries and associated companies - notably AG Insurance with respect to BNP Paribas Fortis’ defined-benefit plan - to hedge their commitments to other Group entities that were transferred to them to cover the post-employment benefits of certain employee categories. (2) Restated according to IFRS 10 and 11 and the amendment to IAS 32 (see notes 1.a and 2).
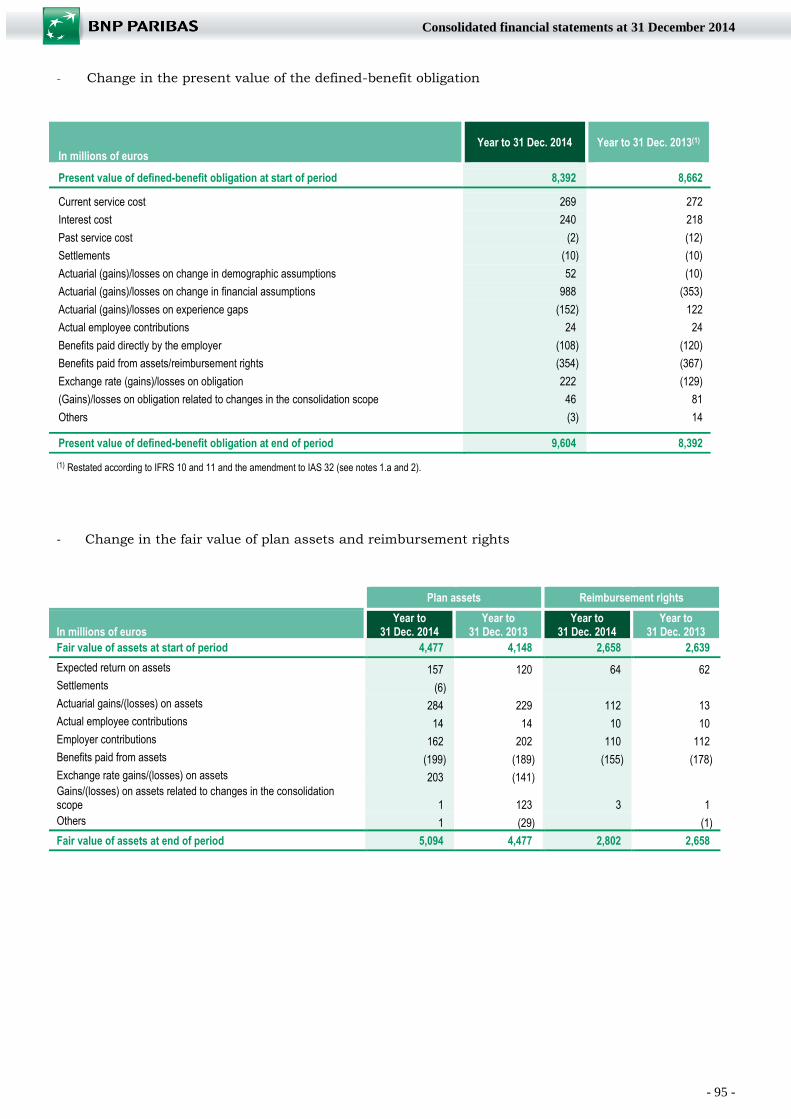
- 95 -
Consolidated financial statements at 31 December 2014
- Change in the present value of the defined-benefit obligation
In millions of euros
Year to 31 Dec. 2014 Year to 31 Dec. 2013(1)
Present value of defined-benefit obligation at start of period 8,392 8,662
Current service cost 269 272
Interest cost 240 218
Past service cost (2) (12)
Settlements (10) (10)
Actuarial (gains)/losses on change in demographic assumptions 52 (10)
Actuarial (gains)/losses on change in financial assumptions 988 (353)
Actuarial (gains)/losses on experience gaps (152) 122
Actual employee contributions 24 24
Benefits paid directly by the employer (108) (120)
Benefits paid from assets/reimbursement rights (354) (367)
Exchange rate (gains)/losses on obligation 222 (129)
(Gains)/losses on obligation related to changes in the consolidation scope 46 81
Others (3) 14
Present value of defined-benefit obligation at end of period 9,604 8,392
(1) Restated according to IFRS 10 and 11 and the amendment to IAS 32 (see notes 1.a and 2).
- Change in the fair value of plan assets and reimbursement rights
Plan assets Reimbursement rights
In millions of euros Year to
31 Dec. 2014 Year to
31 Dec. 2013 Year to
31 Dec. 2014 Year to
31 Dec. 2013
Fair value of assets at start of period 4,477 4,148 2,658 2,639
Expected return on assets 157 120 64 62
Settlements (6)
Actuarial gains/(losses) on assets 284 229 112 13
Actual employee contributions 14 14 10 10
Employer contributions 162 202 110 112
Benefits paid from assets (199) (189) (155) (178)
Exchange rate gains/(losses) on assets 203 (141) Gains/(losses) on assets related to changes in the consolidation scope 1 123 3 1
Others 1 (29) (1)
Fair value of assets at end of period 5,094 4,477 2,802 2,658
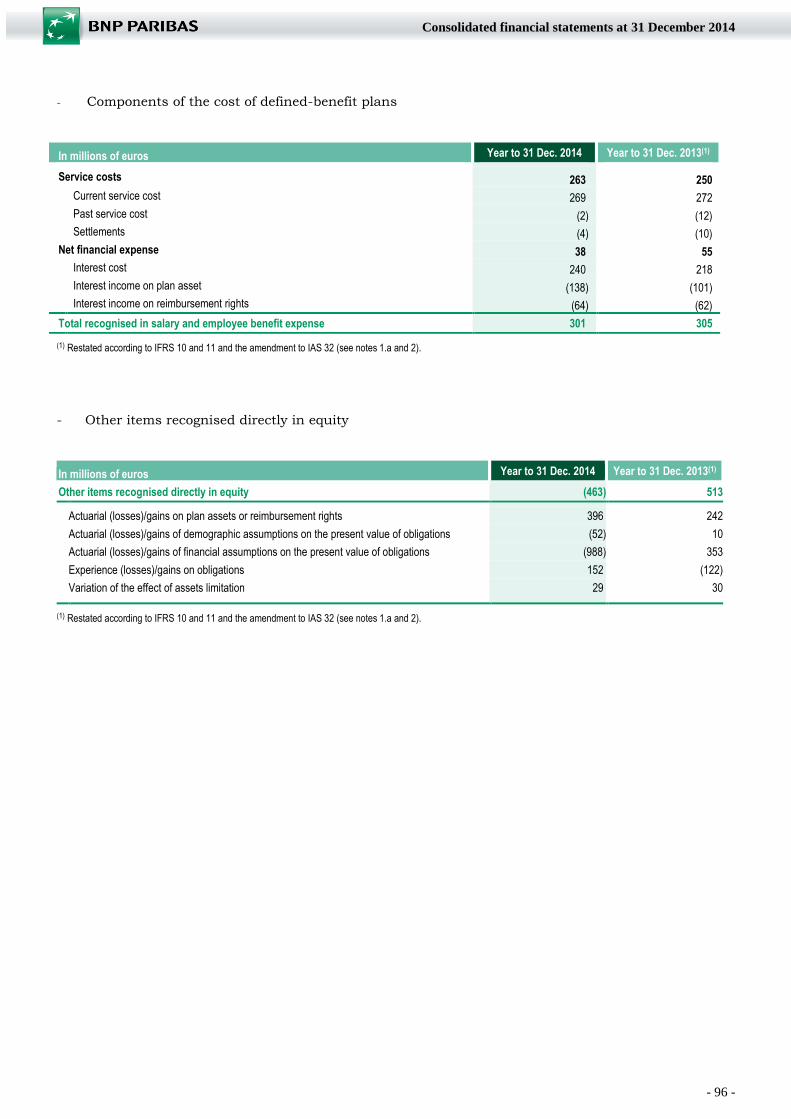
- 96 -
Consolidated financial statements at 31 December 2014
- Components of the cost of defined-benefit plans
In millions of euros Year to 31 Dec. 2014 Year to 31 Dec. 2013(1) Service costs
263 250 Current service cost 269 272 Past service cost (2) (12) Settlements (4) (10) Net financial expense 38 55 Interest cost 240 218 Interest income on plan asset (138) (101) Interest income on reimbursement rights (64) (62)
Total recognised in salary and employee benefit expense 301 305
(1) Restated according to IFRS 10 and 11 and the amendment to IAS 32 (see notes 1.a and 2).
- Other items recognised directly in equity
In millions of euros
Year to 31 Dec. 2014 Year to 31 Dec. 2013(1) Other items recognised directly in equity (463) 513
Actuarial (losses)/gains on plan assets or reimbursement rights 396 242
Actuarial (losses)/gains of demographic assumptions on the present value of obligations (52) 10
Actuarial (losses)/gains of financial assumptions on the present value of obligations (988) 353
Experience (losses)/gains on obligations 152 (122)
Variation of the effect of assets limitation 29 30 (1) Restated according to IFRS 10 and 11 and the amendment to IAS 32 (see notes 1.a and 2).
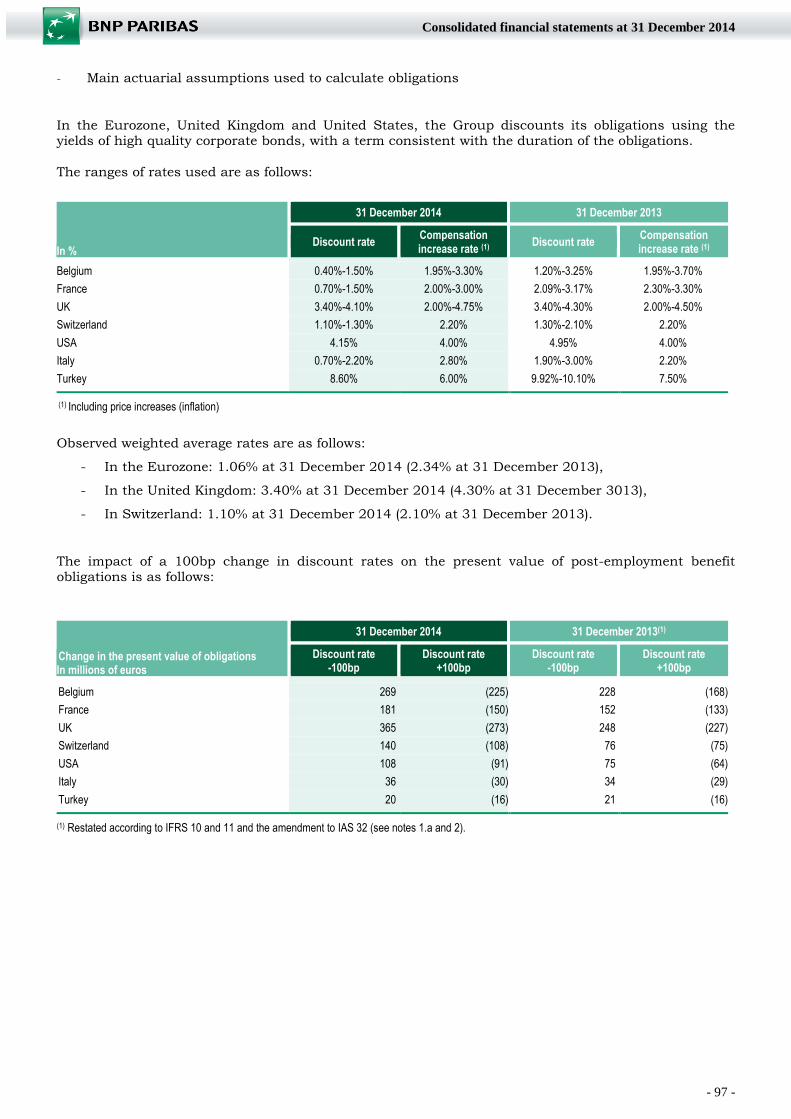
- 97 -
Consolidated financial statements at 31 December 2014
- Main actuarial assumptions used to calculate obligations
In the Eurozone, United Kingdom and United States, the Group discounts its obligations using the yields of high quality corporate bonds, with a term consistent with the duration of the obligations.
The ranges of rates used are as follows:
In %
31 December 2014 31 December 2013
Discount rate Compensation increase rate (1)
Discount rate Compensation increase rate (1)
Belgium 0.40%-1.50% 1.95%-3.30% 1.20%-3.25% 1.95%-3.70%
France 0.70%-1.50% 2.00%-3.00% 2.09%-3.17% 2.30%-3.30%
UK 3.40%-4.10% 2.00%-4.75% 3.40%-4.30% 2.00%-4.50%
Switzerland 1.10%-1.30% 2.20% 1.30%-2.10% 2.20%
USA 4.15% 4.00% 4.95% 4.00%
Italy 0.70%-2.20% 2.80% 1.90%-3.00% 2.20%
Turkey 8.60% 6.00% 9.92%-10.10% 7.50%
(1) Including price increases (inflation) Observed weighted average rates are as follows:
- In the Eurozone: 1.06% at 31 December 2014 (2.34% at 31 December 2013),
- In the United Kingdom: 3.40% at 31 December 2014 (4.30% at 31 December 3013),
- In Switzerland: 1.10% at 31 December 2014 (2.10% at 31 December 2013).
The impact of a 100bp change in discount rates on the present value of post-employment benefit obligations is as follows:
Change in the present value of obligations
In millions of euros
31 December 2014 31 December 2013(1)
Discount rate
-100bp Discount rate
+100bp Discount rate
-100bp Discount rate
+100bp Belgium 269 (225) 228 (168)
France 181 (150) 152 (133)
UK 365 (273) 248 (227)
Switzerland 140 (108) 76 (75)
USA 108 (91) 75 (64)
Italy 36 (30) 34 (29)
Turkey 20 (16) 21 (16) (1) Restated according to IFRS 10 and 11 and the amendment to IAS 32 (see notes 1.a and 2).
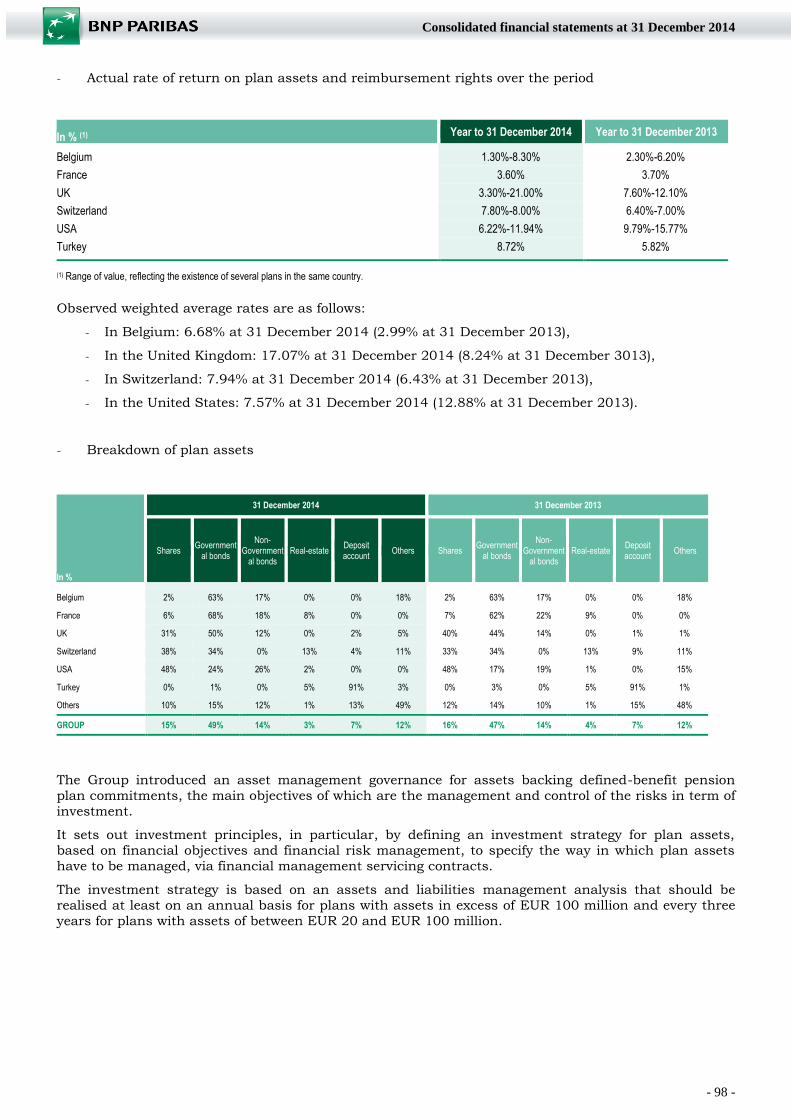
- 98 -
Consolidated financial statements at 31 December 2014
- Actual rate of return on plan assets and reimbursement rights over the period
In % (1) Year to 31 December 2014 Year to 31 December 2013
Belgium 1.30%-8.30% 2.30%-6.20%
France 3.60% 3.70%
UK 3.30%-21.00% 7.60%-12.10%
Switzerland 7.80%-8.00% 6.40%-7.00%
USA 6.22%-11.94% 9.79%-15.77%
Turkey 8.72% 5.82%
(1) Range of value, reflecting the existence of several plans in the same country.
Observed weighted average rates are as follows:
- In Belgium: 6.68% at 31 December 2014 (2.99% at 31 December 2013),
- In the United Kingdom: 17.07% at 31 December 2014 (8.24% at 31 December 3013),
- In Switzerland: 7.94% at 31 December 2014 (6.43% at 31 December 2013),
- In the United States: 7.57% at 31 December 2014 (12.88% at 31 December 2013).
- Breakdown of plan assets
In %
31 December 2014 31 December 2013
Shares Government
al bonds
Non-Government
al bonds Real-estate
Deposit account
Others Shares Government
al bonds
Non-Government
al bonds Real-estate
Deposit account
Others
Belgium 2% 63% 17% 0% 0% 18% 2% 63% 17% 0% 0% 18%
France 6% 68% 18% 8% 0% 0% 7% 62% 22% 9% 0% 0%
UK 31% 50% 12% 0% 2% 5% 40% 44% 14% 0% 1% 1%
Switzerland 38% 34% 0% 13% 4% 11% 33% 34% 0% 13% 9% 11%
USA 48% 24% 26% 2% 0% 0% 48% 17% 19% 1% 0% 15%
Turkey 0% 1% 0% 5% 91% 3% 0% 3% 0% 5% 91% 1%
Others 10% 15% 12% 1% 13% 49% 12% 14% 10% 1% 15% 48%
GROUP 15% 49% 14% 3% 7% 12% 16% 47% 14% 4% 7% 12%
The Group introduced an asset management governance for assets backing defined-benefit pension
plan commitments, the main objectives of which are the management and control of the risks in term of
investment.
It sets out investment principles, in particular, by defining an investment strategy for plan assets,
based on financial objectives and financial risk management, to specify the way in which plan assets
have to be managed, via financial management servicing contracts.
The investment strategy is based on an assets and liabilities management analysis that should be
realised at least on an annual basis for plans with assets in excess of EUR 100 million and every three
years for plans with assets of between EUR 20 and EUR 100 million.
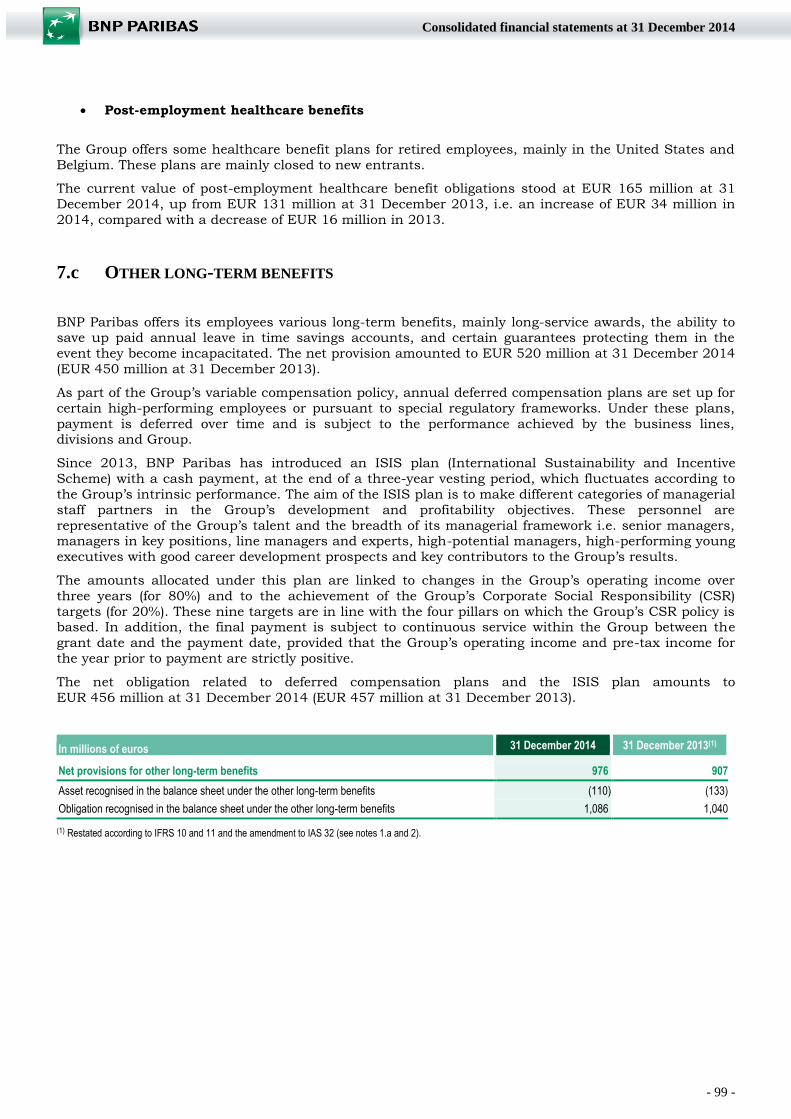
- 99 -
Consolidated financial statements at 31 December 2014
Post-employment healthcare benefits
The Group offers some healthcare benefit plans for retired employees, mainly in the United States and
Belgium. These plans are mainly closed to new entrants.
The current value of post-employment healthcare benefit obligations stood at EUR 165 million at 31
December 2014, up from EUR 131 million at 31 December 2013, i.e. an increase of EUR 34 million in
2014, compared with a decrease of EUR 16 million in 2013.
7.c OTHER LONG-TERM BENEFITS
BNP Paribas offers its employees various long-term benefits, mainly long-service awards, the ability to save up paid annual leave in time savings accounts, and certain guarantees protecting them in the
event they become incapacitated. The net provision amounted to EUR 520 million at 31 December 2014
(EUR 450 million at 31 December 2013).
As part of the Group’s variable compensation policy, annual deferred compensation plans are set up for
certain high-performing employees or pursuant to special regulatory frameworks. Under these plans,
payment is deferred over time and is subject to the performance achieved by the business lines, divisions and Group.
Since 2013, BNP Paribas has introduced an ISIS plan (International Sustainability and Incentive
Scheme) with a cash payment, at the end of a three-year vesting period, which fluctuates according to
the Group’s intrinsic performance. The aim of the ISIS plan is to make different categories of managerial
staff partners in the Group’s development and profitability objectives. These personnel are
representative of the Group’s talent and the breadth of its managerial framework i.e. senior managers, managers in key positions, line managers and experts, high-potential managers, high-performing young
executives with good career development prospects and key contributors to the Group’s results.
The amounts allocated under this plan are linked to changes in the Group’s operating income over
three years (for 80%) and to the achievement of the Group’s Corporate Social Responsibility (CSR)
targets (for 20%). These nine targets are in line with the four pillars on which the Group’s CSR policy is based. In addition, the final payment is subject to continuous service within the Group between the
grant date and the payment date, provided that the Group’s operating income and pre-tax income for
the year prior to payment are strictly positive.
The net obligation related to deferred compensation plans and the ISIS plan amounts to
EUR 456 million at 31 December 2014 (EUR 457 million at 31 December 2013).
In millions of euros 31 December 2014 31 December 2013(1)
Net provisions for other long-term benefits 976 907
Asset recognised in the balance sheet under the other long-term benefits (110) (133)
Obligation recognised in the balance sheet under the other long-term benefits 1,086 1,040
(1) Restated according to IFRS 10 and 11 and the amendment to IAS 32 (see notes 1.a and 2).
- 100 -
Consolidated financial statements at 31 December 2014
7.d TERMINATION BENEFITS
BNP Paribas has implemented a number of voluntary redundancy plans and headcount adaptation
plans for employees who meet certain eligibility criteria. The obligations to eligible active employees
under such plans are provided for as soon as a bilateral agreement or a bilateral agreement proposal for a particular plan is made.
In millions of euros 31 December 2014 31 December 2013(1) Provision for voluntary departure, early retirement plans, and headcount adaptation plans 382 418
(1) Restated according to IFRS 10 and 11 and the amendment to IAS 32 (see notes 1.a and 2).
7.e SHARE-BASED PAYMENTS
SHARE-BASED LOYALTY, COMPENSATION AND INCENTIVE SCHEMES
BNP Paribas has set up several share-based payment schemes for certain employees:
- deferred share price-linked, cash-settled long term compensation plans, mainly for employees
whose activities are likely to have an impact on the Group's risk exposure;
- until 2012, a Global Share-Based Incentive Plan including:
o performance shares plans,
o stock subscription or purchase option plans.
Deferred share price-linked, cash-settled compensation plans
As part of the Group’s variable remuneration policy, deferred annual compensation plans offered to
certain high-performing employees or set up pursuant to special regulatory frameworks may entitle
beneficiaries to variable compensation settled in cash but linked to the share price, payable over several years.
- Variable compensation for employees, subject to special regulatory frameworks.
Since the publication of the Decree by the French ministry of finance on 13 December 2010, and
following the new provisions of the European Directive CRD4 of 26 July 2013 transposed into
the French law in the Monetary and Financial Code by the Order of 20 February 2014 as well as
the Decrees and Orders of 3 November 2014 and the delegated European regulation of 4 March 2014, the variable compensation plans apply to Group employees performing activities that may
have a material impact on the Group’s risk profile.
Under these plans, payment is deferred over time and is contingent on the performance achieved
by the business lines, core businesses and Group.
Sums are mostly paid in cash linked to the increase or decrease in the BNP Paribas share price. In addition, in accordance with the regulatory requirements in force, some of the variable
compensation granted over the year in respect of the performance of the previous year is also
indexed to the BNP Paribas share price and paid to beneficiaries during the year of attribution.
- Deferred variable compensation for other Group employees
Sums due under the annual deferred compensation plans for high-performing employees are paid all or part in cash linked to the increase or decrease in the BNP Paribas share price.
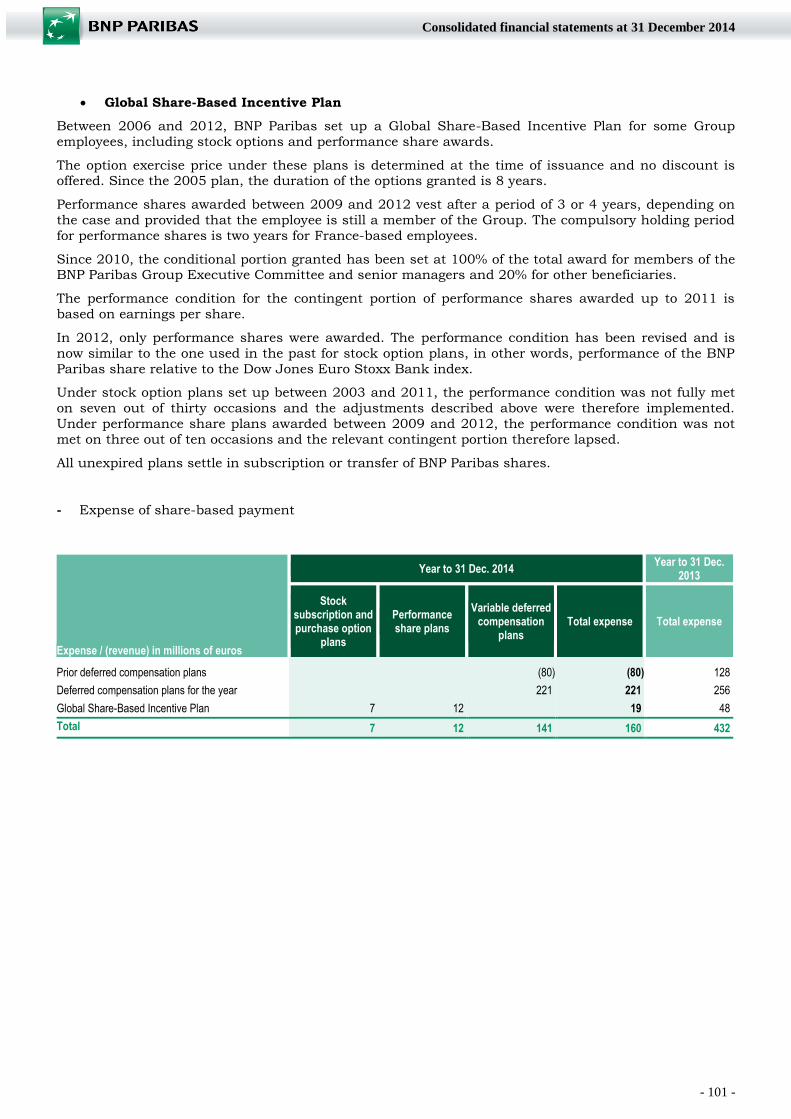
- 101 -
Consolidated financial statements at 31 December 2014
Global Share-Based Incentive Plan
Between 2006 and 2012, BNP Paribas set up a Global Share-Based Incentive Plan for some Group
employees, including stock options and performance share awards.
The option exercise price under these plans is determined at the time of issuance and no discount is offered. Since the 2005 plan, the duration of the options granted is 8 years.
Performance shares awarded between 2009 and 2012 vest after a period of 3 or 4 years, depending on
the case and provided that the employee is still a member of the Group. The compulsory holding period
for performance shares is two years for France-based employees.
Since 2010, the conditional portion granted has been set at 100% of the total award for members of the BNP Paribas Group Executive Committee and senior managers and 20% for other beneficiaries.
The performance condition for the contingent portion of performance shares awarded up to 2011 is
based on earnings per share.
In 2012, only performance shares were awarded. The performance condition has been revised and is
now similar to the one used in the past for stock option plans, in other words, performance of the BNP
Paribas share relative to the Dow Jones Euro Stoxx Bank index.
Under stock option plans set up between 2003 and 2011, the performance condition was not fully met
on seven out of thirty occasions and the adjustments described above were therefore implemented.
Under performance share plans awarded between 2009 and 2012, the performance condition was not
met on three out of ten occasions and the relevant contingent portion therefore lapsed.
All unexpired plans settle in subscription or transfer of BNP Paribas shares.
- Expense of share-based payment
Expense / (revenue) in millions of euros
Year to 31 Dec. 2014 Year to 31 Dec.
2013
Stock subscription and purchase option
plans
Performance share plans
Variable deferred compensation
plans Total expense Total expense
Prior deferred compensation plans (80) (80) 128
Deferred compensation plans for the year 221 221 256
Global Share-Based Incentive Plan 7 12 19 48
Total 7 12 141 160 432
- 102 -
Consolidated financial statements at 31 December 2014
Valuation of stock option plans and performance share plans
As required under IFRS 2, BNP Paribas attributes a value to stock options and performance shares
granted to employees and recognises an expense, determined at the date of grant, calculated
respectively on the basis of the fair value of the options and shares concerned. This initial fair value
may not subsequently be adjusted for changes in the quoted market price of BNP Paribas shares. The only assumptions that may result in a revision of the fair value during the vesting period, and hence an
adjustment in the expense, are those related to the population of grantees (loss of rights) and internal
performance conditions. The Group’s share-based payment plans are valued by an independent
specialist firm.
Measurement of stock subscription options
Binomial or trinomial tree algorithms are used to build in the possibility of non-optimal exercise of
options from the vesting date. The Monte-Carlo method is also used to price in the characteristics of
certain secondary grants linking options to the performance of the BNP Paribas share relative to a sector index.
The last stock subscription options were granted in 2011.
Measurement of performance shares
The unit value retained for performance shares is the value at the end of the holding period plus
dividends paid since the vesting date, discounted at the grant date.
The last performance shares were granted in 2012.
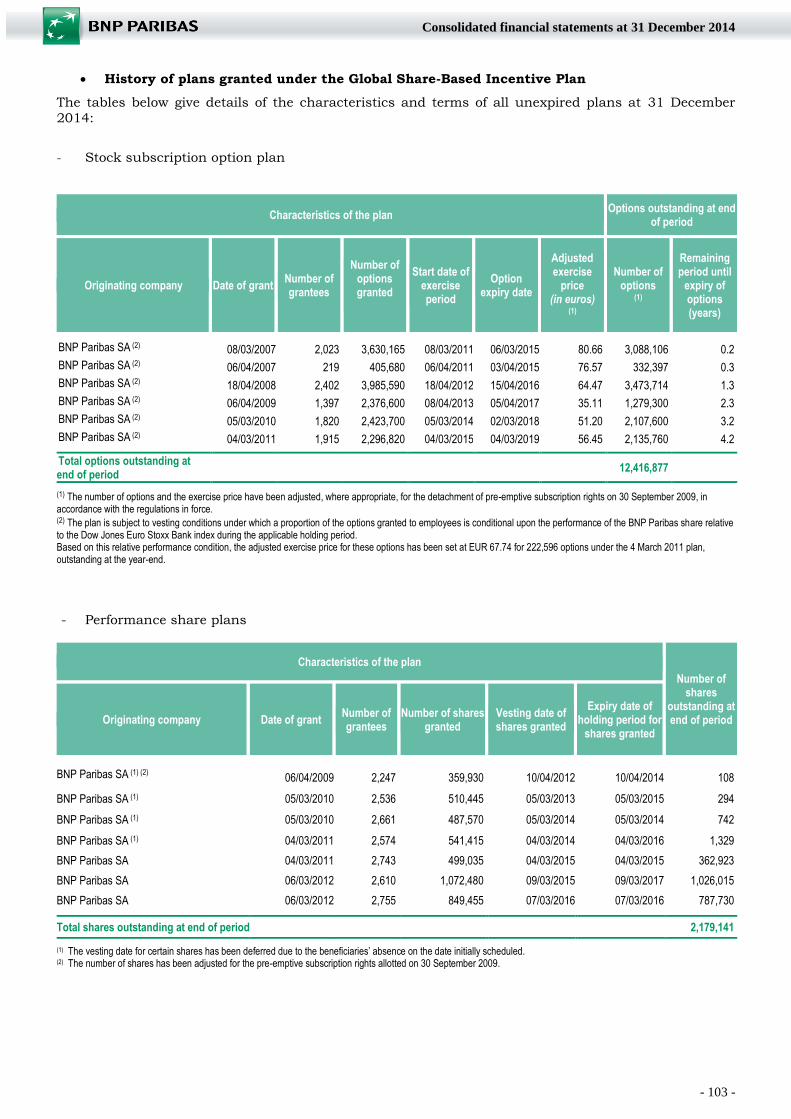
- 103 -
Consolidated financial statements at 31 December 2014
History of plans granted under the Global Share-Based Incentive Plan
The tables below give details of the characteristics and terms of all unexpired plans at 31 December
2014:
- Stock subscription option plan
Characteristics of the plan Options outstanding at end of period
Originating company Date of grant Number of grantees
Number of options granted
Start date of exercise period
Option expiry date
Adjusted exercise
price (in euros)
(1)
Number of options
(1)
Remaining period until
expiry of options (years)
BNP Paribas SA (2) 08/03/2007 2,023 3,630,165 08/03/2011 06/03/2015 80.66 3,088,106 0.2 BNP Paribas SA (2) 06/04/2007 219 405,680 06/04/2011 03/04/2015 76.57 332,397 0.3 BNP Paribas SA (2) 18/04/2008 2,402 3,985,590 18/04/2012 15/04/2016 64.47 3,473,714 1.3 BNP Paribas SA (2) 06/04/2009 1,397 2,376,600 08/04/2013 05/04/2017 35.11 1,279,300 2.3 BNP Paribas SA (2) 05/03/2010 1,820 2,423,700 05/03/2014 02/03/2018 51.20 2,107,600 3.2 BNP Paribas SA (2) 04/03/2011 1,915 2,296,820 04/03/2015 04/03/2019 56.45 2,135,760 4.2 Total options outstanding at end of period 12,416,877
(1) The number of options and the exercise price have been adjusted, where appropriate, for the detachment of pre-emptive subscription rights on 30 September 2009, in accordance with the regulations in force.
(2) The plan is subject to vesting conditions under which a proportion of the options granted to employees is conditional upon the performance of the BNP Paribas share relative to the Dow Jones Euro Stoxx Bank index during the applicable holding period. Based on this relative performance condition, the adjusted exercise price for these options has been set at EUR 67.74 for 222,596 options under the 4 March 2011 plan, outstanding at the year-end.
- Performance share plans
Characteristics of the plan Number of
shares outstanding at end of period Originating company Date of grant
Number of grantees
Number of shares granted
Vesting date of shares granted
Expiry date of holding period for
shares granted
BNP Paribas SA (1) (2) 06/04/2009 2,247 359,930 10/04/2012 10/04/2014 108
BNP Paribas SA (1) 05/03/2010 2,536 510,445 05/03/2013 05/03/2015 294
BNP Paribas SA (1) 05/03/2010 2,661 487,570 05/03/2014 05/03/2014 742
BNP Paribas SA (1) 04/03/2011 2,574 541,415 04/03/2014 04/03/2016 1,329
BNP Paribas SA 04/03/2011 2,743 499,035 04/03/2015 04/03/2015 362,923
BNP Paribas SA 06/03/2012 2,610 1,072,480 09/03/2015 09/03/2017 1,026,015
BNP Paribas SA 06/03/2012 2,755 849,455 07/03/2016 07/03/2016 787,730 Total shares outstanding at end of period 2,179,141
(1) The vesting date for certain shares has been deferred due to the beneficiaries’ absence on the date initially scheduled. (2) The number of shares has been adjusted for the pre-emptive subscription rights allotted on 30 September 2009.
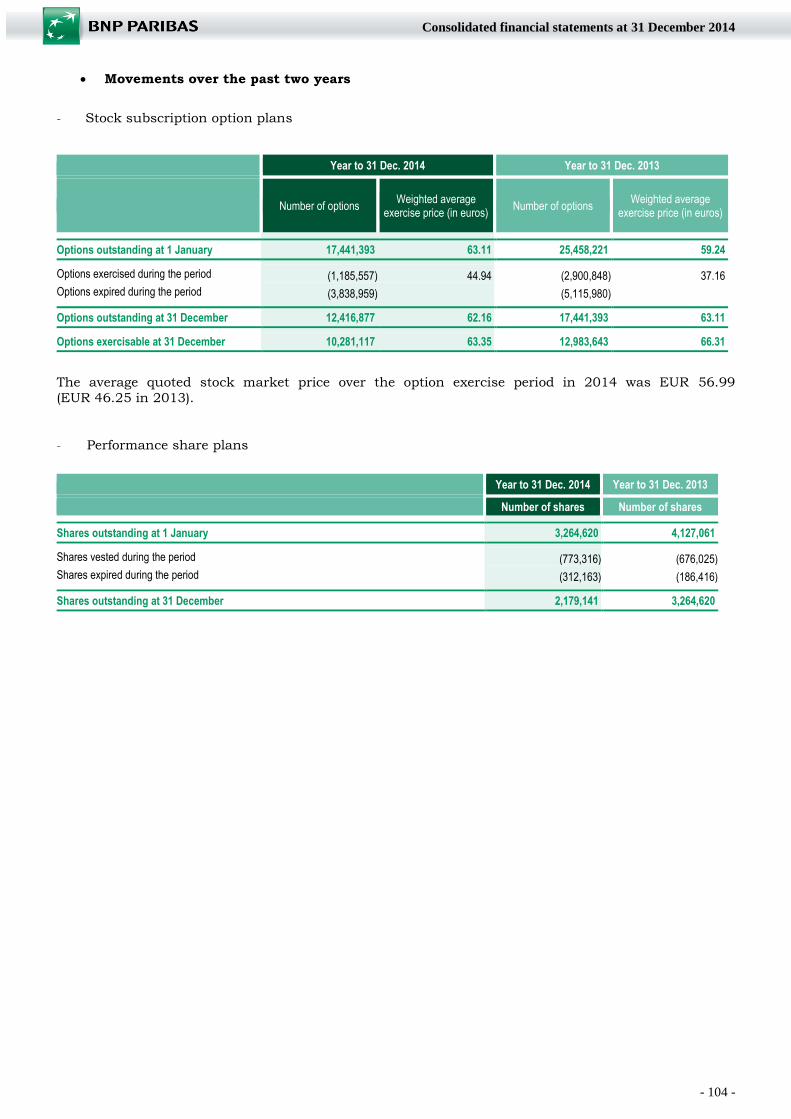
- 104 -
Consolidated financial statements at 31 December 2014
Movements over the past two years
- Stock subscription option plans
Year to 31 Dec. 2014 Year to 31 Dec. 2013
Number of options Weighted average
exercise price (in euros) Number of options
Weighted average exercise price (in euros)
Options outstanding at 1 January 17,441,393 63.11 25,458,221 59.24
Options exercised during the period (1,185,557) 44.94 (2,900,848) 37.16
Options expired during the period (3,838,959) (5,115,980) Options outstanding at 31 December 12,416,877 62.16 17,441,393 63.11
Options exercisable at 31 December 10,281,117 63.35 12,983,643 66.31
The average quoted stock market price over the option exercise period in 2014 was EUR 56.99
(EUR 46.25 in 2013).
- Performance share plans
Year to 31 Dec. 2014 Year to 31 Dec. 2013
Number of shares Number of shares
Shares outstanding at 1 January 3,264,620 4,127,061
Shares vested during the period (773,316) (676,025)
Shares expired during the period (312,163) (186,416) Shares outstanding at 31 December 2,179,141 3,264,620

- 105 -
Consolidated financial statements at 31 December 2014
8 . ADDIT ION AL INFORM ATI ON
8.a CHANGES IN SHARE CAPITAL AND EARNINGS PER SHARE
At 31 December 2014, the share capital of BNP Paribas SA amounted to EUR 2 491 915 350, and was
divided into 1 245 957 675 shares. The nominal value of each share is EUR 2. At 31 December 2013,
the share capital amounted to EUR 2 490 325 618 and was divided into 1 245 162 809 shares.
Ordinary shares issued by BNP Paribas and held by the Group
Proprietary transactions Trading transactions (1) Total
Number of
shares
Carrying amount
(in millions of euros)
Number of shares
Carrying amount
(in millions of euros)
Number of shares
Carrying amount
(in millions of euros)
Shares held at 31 December 2012 3,497,676 165 (1,365,449) (58) 2,132,227 107
Acquisitions 2,646,201 119 2,646,201 119
Disposals (2,639,701) (117) (2,639,701) (117)
Shares delivered to employees (676,025) (29) (676,025) (29)
Other movements (29,209) - 989,869 36 960,660 36
Shares held at 31 December 2013 2,798,942 138 (375,580) (22) 2,423,362 116
Acquisitions 1,987,822 99 1,987,822 99
Disposals (650,904) (35) (650,904) (35)
Shares delivered to employees (773,316) (32) (773,316) (32)
Capital decrease (390,691) (30) - - (390,691) (30)
Other movements - (2,867,888) (138) (2,867,888) (138) Shares held at 31 December 2014 2,971,853 140 (3,243,468) (160) (271,615) (20)
(1) Transactions realised in the framework of an activity of trading and arbitrage transactions on equity indices.
At 31 December 2014, the BNP Paribas Group was a net seller of 271,615 BNP Paribas shares
representing an amount of EUR 20 million, which was recognised as an increase in equity.
BNP Paribas held 390,691 shares from the public tender launched in 2006 on Banca Nazionale del
Lavoro (BNL). They were cancelled following the decision of the Board of Directors made on 18 December 2014.
In 2014, BNP Paribas SA has acquired on the market 1,320,384 shares, at an average price of EUR
48.60 per share with a par value of EUR 2, with the aim of honouring the obligations relating to the
allocation of shares to employees.
Under the Bank’s market-making agreement relating to the BNP Paribas share on the Italian market made with Exane BNP Paribas, and in line with the Code of Ethics recognised by the AMF, BNP Paribas
SA bought back 667,438 shares in 2014 at an average share price of EUR 51.72, and sold 650,904
shares at an average share price of EUR 51.98. At 31 December 2014, 172,866 shares worth
EUR 8.4 million were held by BNP Paribas under this agreement.
From 1 January 2014 to 31 December 2014, 773,316 shares were delivered following the definitive award of performance shares to their beneficiaries.
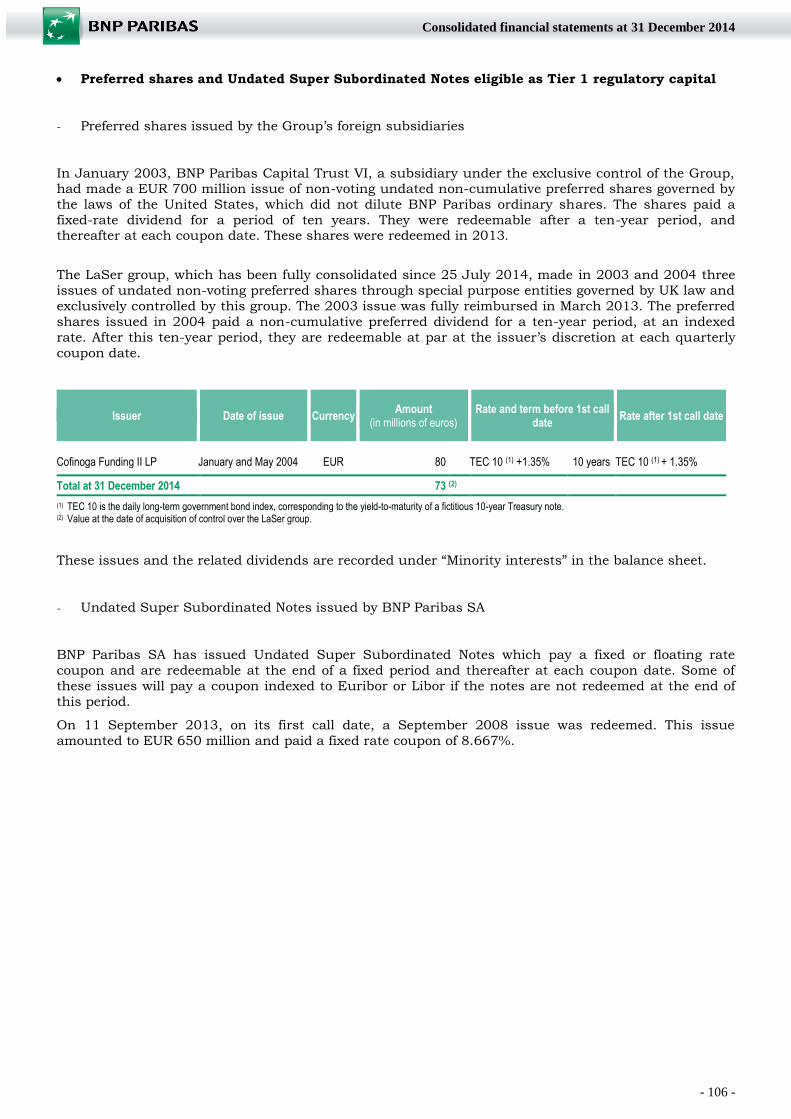
- 106 -
Consolidated financial statements at 31 December 2014
Preferred shares and Undated Super Subordinated Notes eligible as Tier 1 regulatory capital
- Preferred shares issued by the Group’s foreign subsidiaries
In January 2003, BNP Paribas Capital Trust VI, a subsidiary under the exclusive control of the Group, had made a EUR 700 million issue of non-voting undated non-cumulative preferred shares governed by
the laws of the United States, which did not dilute BNP Paribas ordinary shares. The shares paid a
fixed-rate dividend for a period of ten years. They were redeemable after a ten-year period, and thereafter at each coupon date. These shares were redeemed in 2013.
The LaSer group, which has been fully consolidated since 25 July 2014, made in 2003 and 2004 three
issues of undated non-voting preferred shares through special purpose entities governed by UK law and
exclusively controlled by this group. The 2003 issue was fully reimbursed in March 2013. The preferred
shares issued in 2004 paid a non-cumulative preferred dividend for a ten-year period, at an indexed
rate. After this ten-year period, they are redeemable at par at the issuer’s discretion at each quarterly
coupon date.
Issuer Date of issue Currency Amount
(in millions of euros) Rate and term before 1st call
date Rate after 1st call date
Cofinoga Funding II LP January and May 2004 EUR 80 TEC 10 (1) +1.35% 10 years TEC 10 (1) + 1.35% Total at 31 December 2014 73 (2)
(1) TEC 10 is the daily long-term government bond index, corresponding to the yield-to-maturity of a fictitious 10-year Treasury note.
(2) Value at the date of acquisition of control over the LaSer group.
These issues and the related dividends are recorded under “Minority interests” in the balance sheet.
- Undated Super Subordinated Notes issued by BNP Paribas SA
BNP Paribas SA has issued Undated Super Subordinated Notes which pay a fixed or floating rate
coupon and are redeemable at the end of a fixed period and thereafter at each coupon date. Some of
these issues will pay a coupon indexed to Euribor or Libor if the notes are not redeemed at the end of
this period.
On 11 September 2013, on its first call date, a September 2008 issue was redeemed. This issue
amounted to EUR 650 million and paid a fixed rate coupon of 8.667%.
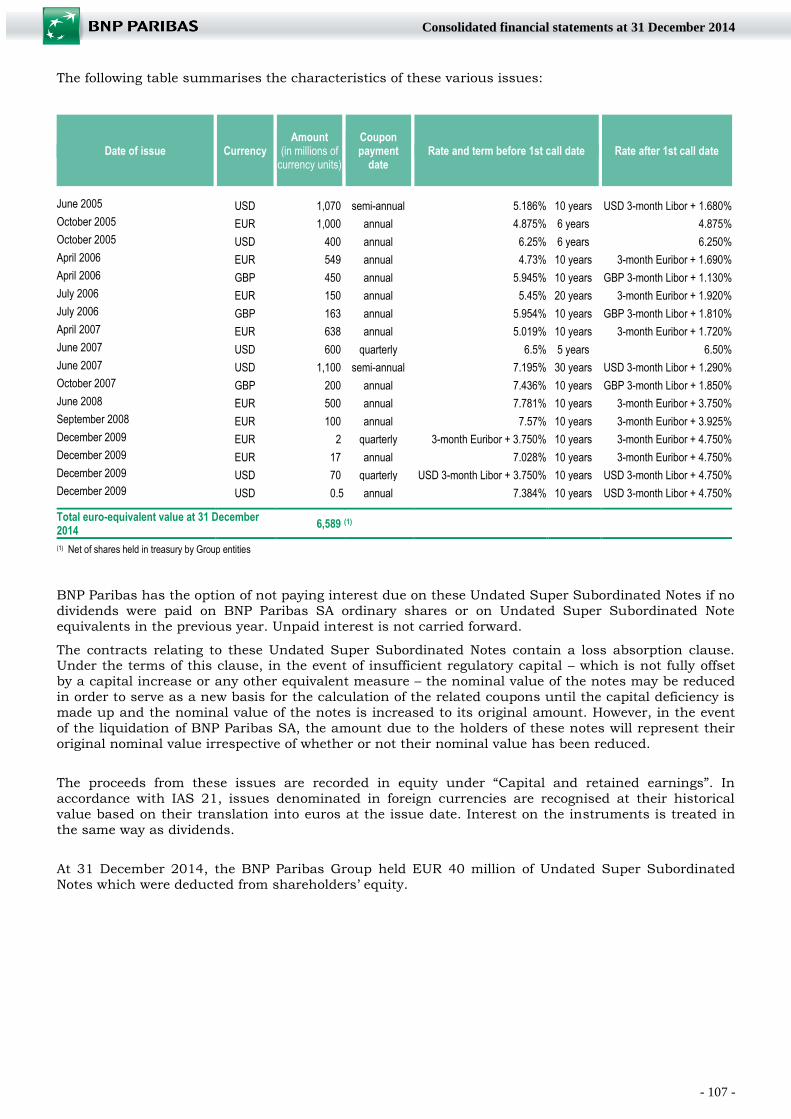
- 107 -
Consolidated financial statements at 31 December 2014
The following table summarises the characteristics of these various issues:
Date of issue Currency Amount
(in millions of currency units)
Coupon payment
date Rate and term before 1st call date Rate after 1st call date
June 2005 USD 1,070 semi-annual 5.186% 10 years USD 3-month Libor + 1.680%
October 2005 EUR 1,000 annual 4.875% 6 years 4.875%
October 2005 USD 400 annual 6.25% 6 years 6.250%
April 2006 EUR 549 annual 4.73% 10 years 3-month Euribor + 1.690%
April 2006 GBP 450 annual 5.945% 10 years GBP 3-month Libor + 1.130%
July 2006 EUR 150 annual 5.45% 20 years 3-month Euribor + 1.920%
July 2006 GBP 163 annual 5.954% 10 years GBP 3-month Libor + 1.810%
April 2007 EUR 638 annual 5.019% 10 years 3-month Euribor + 1.720%
June 2007 USD 600 quarterly 6.5% 5 years 6.50%
June 2007 USD 1,100 semi-annual 7.195% 30 years USD 3-month Libor + 1.290%
October 2007 GBP 200 annual 7.436% 10 years GBP 3-month Libor + 1.850%
June 2008 EUR 500 annual 7.781% 10 years 3-month Euribor + 3.750%
September 2008 EUR 100 annual 7.57% 10 years 3-month Euribor + 3.925%
December 2009 EUR 2 quarterly 3-month Euribor + 3.750% 10 years 3-month Euribor + 4.750%
December 2009 EUR 17 annual 7.028% 10 years 3-month Euribor + 4.750%
December 2009 USD 70 quarterly USD 3-month Libor + 3.750% 10 years USD 3-month Libor + 4.750%
December 2009 USD 0.5 annual 7.384% 10 years USD 3-month Libor + 4.750% Total euro-equivalent value at 31 December 2014
6,589 (1)
(1) Net of shares held in treasury by Group entities
BNP Paribas has the option of not paying interest due on these Undated Super Subordinated Notes if no
dividends were paid on BNP Paribas SA ordinary shares or on Undated Super Subordinated Note
equivalents in the previous year. Unpaid interest is not carried forward.
The contracts relating to these Undated Super Subordinated Notes contain a loss absorption clause. Under the terms of this clause, in the event of insufficient regulatory capital – which is not fully offset
by a capital increase or any other equivalent measure – the nominal value of the notes may be reduced
in order to serve as a new basis for the calculation of the related coupons until the capital deficiency is
made up and the nominal value of the notes is increased to its original amount. However, in the event
of the liquidation of BNP Paribas SA, the amount due to the holders of these notes will represent their
original nominal value irrespective of whether or not their nominal value has been reduced.
The proceeds from these issues are recorded in equity under “Capital and retained earnings”. In
accordance with IAS 21, issues denominated in foreign currencies are recognised at their historical
value based on their translation into euros at the issue date. Interest on the instruments is treated in
the same way as dividends.
At 31 December 2014, the BNP Paribas Group held EUR 40 million of Undated Super Subordinated
Notes which were deducted from shareholders’ equity.
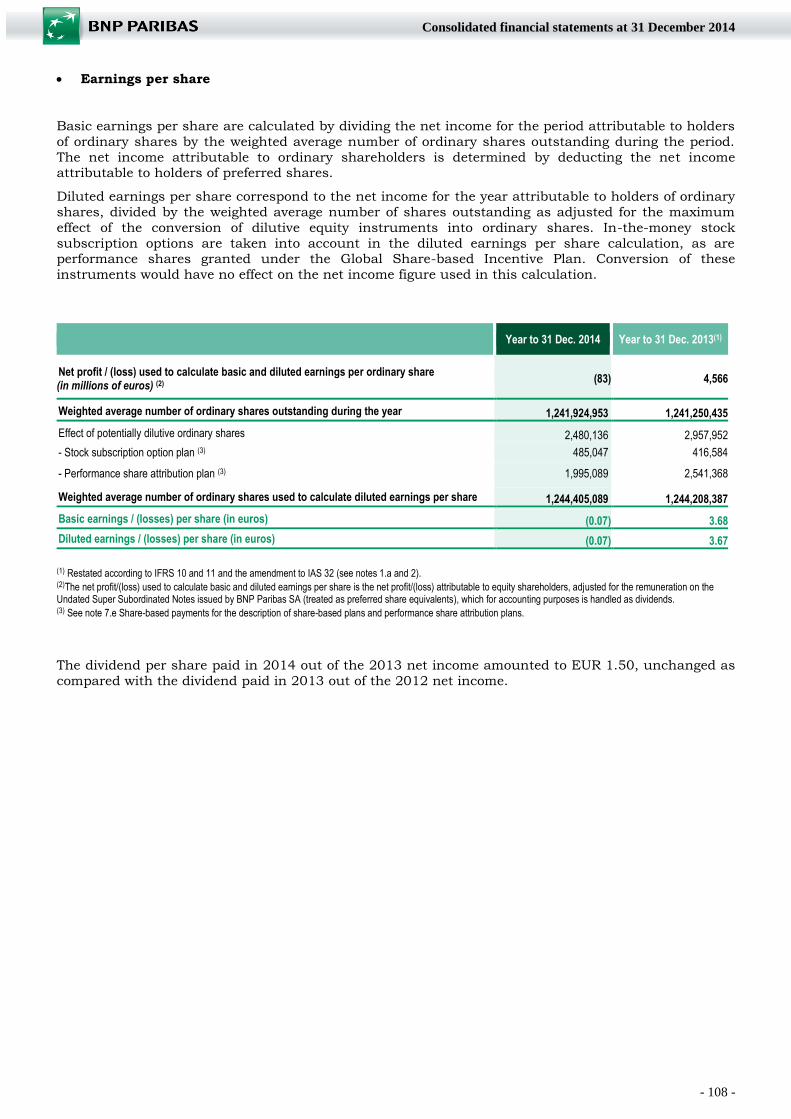
- 108 -
Consolidated financial statements at 31 December 2014
Earnings per share
Basic earnings per share are calculated by dividing the net income for the period attributable to holders
of ordinary shares by the weighted average number of ordinary shares outstanding during the period.
The net income attributable to ordinary shareholders is determined by deducting the net income attributable to holders of preferred shares.
Diluted earnings per share correspond to the net income for the year attributable to holders of ordinary
shares, divided by the weighted average number of shares outstanding as adjusted for the maximum
effect of the conversion of dilutive equity instruments into ordinary shares. In-the-money stock
subscription options are taken into account in the diluted earnings per share calculation, as are performance shares granted under the Global Share-based Incentive Plan. Conversion of these
instruments would have no effect on the net income figure used in this calculation.
Year to 31 Dec. 2014 Year to 31 Dec. 2013(1)
Net profit / (loss) used to calculate basic and diluted earnings per ordinary share
(in millions of euros) (2) (83) 4,566
Weighted average number of ordinary shares outstanding during the year 1,241,924,953 1,241,250,435 Effect of potentially dilutive ordinary shares 2,480,136 2,957,952 - Stock subscription option plan (3) 485,047 416,584
- Performance share attribution plan (3) 1,995,089 2,541,368 Weighted average number of ordinary shares used to calculate diluted earnings per share 1,244,405,089 1,244,208,387 Basic earnings / (losses) per share (in euros) (0.07) 3.68
Diluted earnings / (losses) per share (in euros) (0.07) 3.67
(1) Restated according to IFRS 10 and 11 and the amendment to IAS 32 (see notes 1.a and 2). (2)The net profit/(loss) used to calculate basic and diluted earnings per share is the net profit/(loss) attributable to equity shareholders, adjusted for the remuneration on the Undated Super Subordinated Notes issued by BNP Paribas SA (treated as preferred share equivalents), which for accounting purposes is handled as dividends.
(3) See note 7.e Share-based payments for the description of share-based plans and performance share attribution plans.
The dividend per share paid in 2014 out of the 2013 net income amounted to EUR 1.50, unchanged as
compared with the dividend paid in 2013 out of the 2012 net income.
- 109 -
Consolidated financial statements at 31 December 2014
8.b CONTINGENT LIABILITIES: LEGAL PROCEEDINGS AND ARBITRATION
Legal action has been taken against several Algerian and international banks, including BNP Paribas El
Djazair, a BNP Paribas SA subsidiary, for administrative errors in processing international trade
financing applications. BNP Paribas El Djazair has been accused of non-compliance with foreign exchange regulations in seven cases before Algerian courts. BNP Paribas El Djazair was ordered by a
lower court to pay fines of approximately EUR 200 million. Three of these cases were subsequently
overturned on appeal, including the case involving the most significant amount (EUR 150 million). Two
other appeals rulings have upheld fines totalling EUR 52 million. All of these rulings have been
appealed before the Cassation Court, and execution has been suspended pending the outcome of these
appeals pursuant to Algerian law. BNP Paribas El Djazair will continue to vigorously defend itself before the Algerian courts with a view to obtaining recognition of its good faith towards the authorities, which
suffered no actual damage.
On 27 June 2008, the Republic of Iraq filed a lawsuit in New York against approximately 90
international companies that participated in the oil-for-food ("OFF") programme and against BNP Paribas as holder of the OFF account on behalf of the United Nations. The complaint alleged, notably,
that the defendants conspired to defraud the OFF programme, thereby depriving the Iraqi people of
more than USD 10 billion in food, medicine and other humanitarian goods. The complaint also
contended that BNP Paribas breached purported fiduciary duties and contractual obligations created by
the banking services agreement binding BNP Paribas and the United Nations. The complaint was
pleaded under the US Racketeer Influenced and Corrupt Organisations Act (“RICO”) which allows treble damages if damages are awarded. The defendants, including BNP Paribas, moved to dismiss the action
in its entirety on a number of different legal grounds. On 6 February 2013, the complaint was
dismissed by the United States District Court Southern District of New York (which means that the
plaintiff does not have the opportunity to re-file an amended complaint). On 15 February 2013, the
Republic of Iraq filed a notice of appeal before the United States Court of Appeals for the Second Circuit. In two decisions dated 19 September 2014, and 9 December 2014, respectively, the Court of Appeals
affirmed the dismissal of the complaint filed by the Republic of Iraq.
The Bank and certain of its subsidiaries are defendants in several actions pending before the United
States Bankruptcy Court Southern District of New York brought by the Trustee appointed for the
liquidation of Bernard L. Madoff Investment Securities LLC (“BLMIS”). These actions, known generally as “clawback claims”, are similar to those brought by the BLMIS Trustee against numerous institutions,
and seek recovery of amounts allegedly received by the BNP Paribas entities from BLMIS or indirectly
through BLMIS-related “feeder funds” in which BNP Paribas entities held interests. The BLMIS Trustee
claims in these actions that the amounts which BNP Paribas entities received are avoidable and
recoverable under the U.S. Bankruptcy Code and New York state law. In the aggregate, the amounts sought to be recovered in these actions approximates USD 1.3 billion. BNP Paribas has substantial and
credible defenses to these actions and is defending against them vigorously.
Various litigations and investigations are ongoing relating to the restructuring of the Fortis Group, now
Ageas, of which BNP Paribas Fortis is no longer part, and to events having occurred before BNP Paribas
Fortis became part of the BNP Paribas Group. Among these are litigations brought by shareholder groups in The Netherlands and Belgium against Ageas and, among others, against BNP Paribas Fortis,
in relation to its role as global coordinator of Fortis (now Ageas)'s capital increase in October 2007 to
partly finance its acquisition of ABN Amro Bank N.V. Those groups of shareholders mainly allege that
there has been a breach in the financial communication, as, inter alia, the disclosure regarding the
exposure to subprime mortgages.
The Bank is vigorously defending itself in these proceedings. The Court of Appeal of Amsterdam upheld on 29 July 2014 the ruling of the Dutch Court of first instance that Ageas was liable for
mismanagement in relation to its financial communication during the period in question. BNP Paribas
Fortis is not a party to this case.
If these litigations and investigations were to be successful, they could eventually result in monetary
consequences for BNP Paribas Fortis. Such impact is unquantifiable at this stage.
- 110 -
Consolidated financial statements at 31 December 2014
Regulatory and law enforcement authorities in multiple jurisdictions are conducting investigations or
making inquiries of a number of financial institutions regarding trading on the foreign exchange
markets, including, among other things, possible collusion among financial institutions to manipulate certain benchmark currency exchange rates. The Bank has to date received requests for information in
this respect from regulatory and law enforcement authorities in the United Kingdom, the United States
and several countries in the Asia-Pacific region as well as from the European Competition Commission.
The Bank is cooperating with the investigations and inquiries and responding to the information
requests. In November 2014 the Financial Conduct Authority in the United Kingdom and in December
2014 the Hong Kong Monetary Authority informed the Bank that they had discontinued their investigation as to BNP Paribas. Moreover the Bank is conducting its own internal review of foreign
exchange trading. While this review is ongoing, the Bank is not in a position to foresee the outcome of
these investigations and proceedings nor their potential impact.
The Bank, along with eleven other financial institutions, was named as a defendant in a consolidated
civil action filed in March 2014 in the U.S. District Court for the Southern District of New York on
behalf of a purported class of plaintiffs alleging manipulation of foreign exchange markets. The plaintiffs allege in particular that the defendants colluded to manipulate the WM/Reuters rate (WMR), thereby
causing the putative classes to suffer losses in connection with WMR-based financial instruments. The
plaintiffs assert U.S. federal and state antitrust claims and claims for unjust enrichment, and seek
compensatory damages, treble damages where authorized by statute, restitution, and declaratory and
injunctive relief. The Bank and its co-defendants have filed a motion to dismiss the consolidated complaint, which was denied on 28 January 2015 in respect of the class of U.S. plaintiffs but was
granted in respect of the class of non-U.S. plaintiffs. The Bank is vigorously contesting the allegations
in the lawsuit.
- 111 -
Consolidated financial statements at 31 December 2014
8.c BUSINESS COMBINATIONS
Operations realised in 2014
LaSer group
On 25 July 2014, BNP Paribas Personal Finance acquired the 50% interest held by its partner, the
Galeries Lafayette group, in the LaSer group, previously consolidated under the equity method. This
acquisition is linked to the decision of the Galeries Lafayette group to exercise its sale option under the
partnership agreements. The parties are involved in an arbitration.
Following this acquisition, the BNP Paribas Group took control of the LaSer group, and the latter is fully
consolidated.
The change in the consolidation method has a EUR 63 million impact on the Group’s profit and loss
account. The estimated goodwill for the LaSer group amounts to EUR 131 million.
The Group's balance sheet increased by EUR 2.9 billion as a result of this additional acquisition with
change of control; “Loans and receivables”, in particular, rose by EUR 2.2 billion.
Bank BGŻ
Following a takeover bid during the second half of 2014 (finalised on 17 October 2014), BNP Paribas
acquired an 88.98% interest in Bank BGŻ, 88.64% of which was contributed by Rabobank. As a result
of this transaction, Bank BGŻ is fully consolidated by the BNP Paribas Group.
Goodwill for Bank BGŻ was EUR 107 million at the acquisition date.
A squeeze-out for the remaining 1.02% minority interest was launched on 23 December 2014 and completed on 7 January 2015. As at 31 December 2014, this commitment was recognised in liabilities
in respect of the minority shareholders.
This acquisition adds EUR 8.7 billion to the Group's balance sheet. In particular, “Loans and
receivables due from customers” rose by EUR 7.1 billion and amounts due to customers increased by
EUR 7.6 billion.
Bank BGŻ is a Polish credit institution which specialises in the food and agricultural sector.
DAB Bank
BNP Paribas acquired a 91.7% stake in DAB Bank in the second half of 2014, following an agreement
with Unicredit and a takeover bid finalised on 17 December 2014. 81.4% was contributed by Unicredit.
As a result of this transaction, DAB Bank is fully consolidated by the BNP Paribas Group.
Goodwill arising from the transaction at acquisition date was EUR 166 million.
The effect of this acquisition is to increase the Group's balance sheet by EUR 5.3 billion, with notably
EUR 3.4 billion added to “Available-for-sale financial assets” and EUR 5.2 billion to “Due to customers”.
This acquisition strengthens the digital banking activity in Germany, and also lays the foundations for
the expansion of the bank's retail business in Austria.
RCS
BNP Paribas Personal Finance acquired RCS Investments Holdings on 6 August 2014. As a result of
this transaction, RCS is fully consolidated by the BNP Paribas Group.
Goodwill for RCS amounted to EUR 47 million at the acquisition date.
As a result of this acquisition, the Group's balance sheet rose by EUR 251 million at the acquisition date, with, in particular, “Loans and receivables due from customers” increasing by EUR 338 million.
RCS is a South-African consumer finance institution which develops retail credit cards with distributors
and grants individual loans.

- 112 -
Consolidated financial statements at 31 December 2014
Operations realised in 2013
TEB Holding
An amendment to the shareholders' agreement binding the BNP Paribas Group to the Colakoglu group in the holding structure of the TEB entities was signed on 20 December 2013. This amendment led to
the full consolidation of the TEB ensemble.
The change in the consolidation method had a EUR -2 million impact on the Group’s profit and loss
account. The goodwill related to the TEB group amounted, at 31 December 2013, to TRY 708 million, or
EUR 240 million.
The TEB group, fully consolidated since 20 December 2013, was previously proportionally consolidated. The application of IFRS 11 led to the consolidation of the TEB group under the equity method in the
restated balance sheet as at 1 January 2013. As a result of the change of control, the Group’s balance
sheet rose by EUR 18 billion as at 31 December 2013; in particular, "Loans and receivables" due from
customers increased by EUR 13.4 billion and "Amounts due to customers" was up by EUR 11.7 billion.
The Colakoglu group retains a put option which allows it to sell its interest in TEB Holding to BNP
Paribas Group at the market value. This option includes a minimum price on the historical stake of the Colakoglu group reaching TRY 1.6 billion as of 1 April 2014.
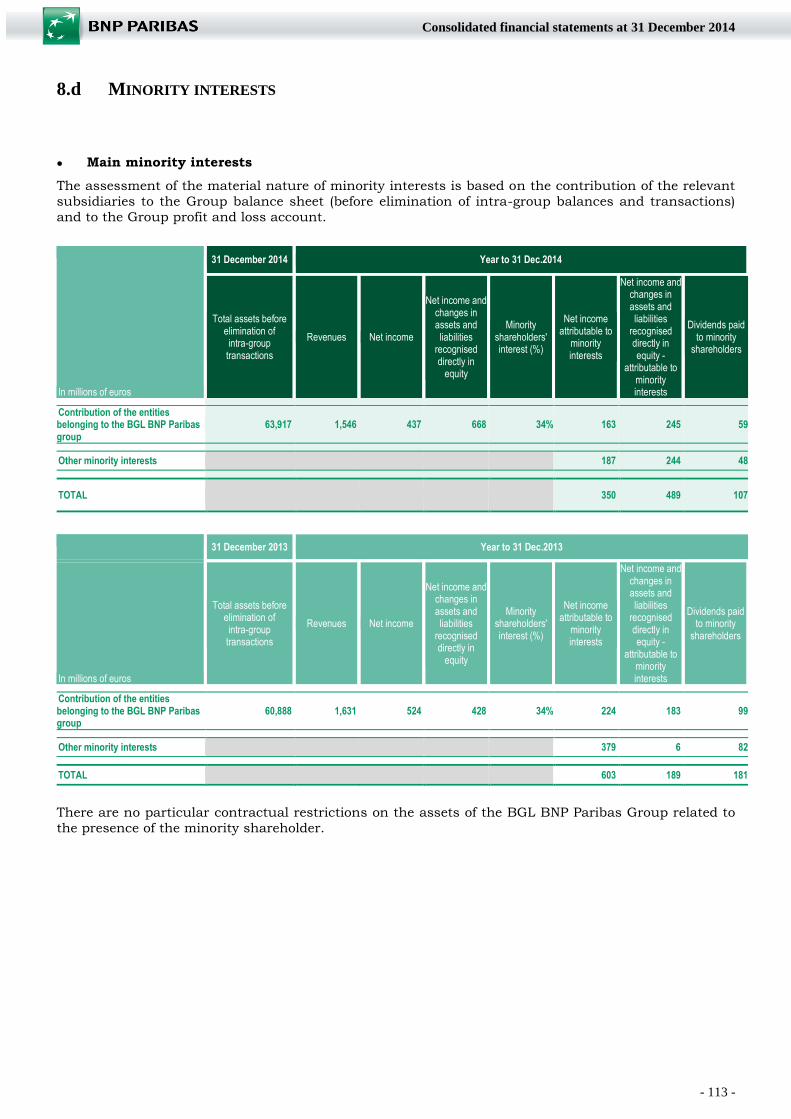
- 113 -
Consolidated financial statements at 31 December 2014
8.d MINORITY INTERESTS
Main minority interests
The assessment of the material nature of minority interests is based on the contribution of the relevant
subsidiaries to the Group balance sheet (before elimination of intra-group balances and transactions)
and to the Group profit and loss account.
31 December 2014 Year to 31 Dec.2014
In millions of euros
Total assets before elimination of intra-group transactions
Revenues Net income
Net income and changes in assets and liabilities
recognised directly in
equity
Minority shareholders' interest (%)
Net income attributable to
minority interests
Net income and changes in assets and liabilities
recognised directly in equity -
attributable to minority interests
Dividends paid to minority
shareholders
Contribution of the entities belonging to the BGL BNP Paribas group
63,917 1,546 437 668 34% 163 245 59
Other minority interests 187 244 48
TOTAL 350 489 107
31 December 2013 Year to 31 Dec.2013
In millions of euros
Total assets before elimination of intra-group transactions
Revenues Net income
Net income and changes in assets and liabilities
recognised directly in
equity
Minority shareholders' interest (%)
Net income attributable to
minority interests
Net income and changes in assets and liabilities
recognised directly in equity -
attributable to minority interests
Dividends paid to minority
shareholders
Contribution of the entities belonging to the BGL BNP Paribas group
60,888 1,631 524 428 34% 224 183 99
Other minority interests 379 6 82
TOTAL 603 189 181
There are no particular contractual restrictions on the assets of the BGL BNP Paribas Group related to
the presence of the minority shareholder.

- 114 -
Consolidated financial statements at 31 December 2014
Internal restructuring that led to a change in minority shareholders’ interest in the equity of
subsidiaries
In millions of euros
31 December 2014 31 December 2013
Attributable to shareholders
Minority interests
Attributable to shareholders
Minority interests
Sale of assets by BNP Paribas SA to BNP Paribas Fortis - - 78 (83)
Total - - 78 (83)
Acquisitions of additional interests and partial sales of interests leading to changes in
minority interests in the equity of subsidiaries
In millions of euros
31 December 2014 31 December 2013
Attributable to shareholders
Minority interests
Attributable to shareholders
Minority interests
BNP Paribas Fortis
BNP Paribas SA bought out minority shareholders' interests representing 25% of the capital, lifting its interest percentage to 99.93%
911 (4,161)
BNP Paribas Bank Polska
BNP Paribas Bank Polska SA realised a capital increase, fully subscribed by external investors. The Group's interest in this entity decreases from 99.83% to 84.94%.
(15) 67 Turk Ekonomi Bankasi BNP Paribas Fortis Yatirimlar Holding bought out minority shareholders' interests representing 1.01% of the capital, lifting its interest pourcentage of Turk Ekonomi Bankasi AS to 69.48% 16 (35)
Other 11 (11) Total 12 21 911 (4,161)
Commitments to repurchase minority shareholders’ interests
In connection with the acquisition of certain entities, the Group granted minority shareholders put
options on their holdings.
The total value of these commitments, which are recorded as a reduction in shareholders’ equity, amounts to EUR 853 million at 31 December 2014, compared with EUR 773 million at 31 December
2013.
- 115 -
Consolidated financial statements at 31 December 2014
8.e SIGNIFICANT RESTRICTIONS IN SUBSIDIARIES, JOINT VENTURES AND ASSOCIATES
Significant restrictions related to the ability of entities to transfer cash to the Group The ability of entities to pay dividends or to repay loans and advances depends, inter alia, on local
regulatory requirements for capitalisation and legal reserves, as well as the entities' financial and
operating performance. During 2013 and 2014, no BNP Paribas Group entity was subject to significant restrictions other than those related to regulatory requirements.
Significant restrictions relative to the Group's ability to use the assets lodged in consolidated
structured entities
Access to the assets of consolidated structured entities in which third-party investors have invested is limited inasmuch as these entities' assets are reserved for the holders of units or securities. These
assets total EUR 23 billion as at 31 December 2014 (compared with EUR 20 billion as at 31 December
2013).
Significant restrictions related to the Group's ability to use assets pledged as collateral or under
repurchase agreements The financial instruments pledged by the BNP Paribas Group as collateral or under repurchase
agreements are presented in notes 5.s and 6.c.
Significant restrictions related to liquidity reserves
Significant restrictions related to liquidity reserves correspond to the mandatory deposits placed with central banks presented in chapter 5 of the registration document under “Liquidity and funding risk”.
Assets representative of unit-linked insurance contracts
Assets representative of unit-linked insurance contracts designated as at fair value through profit or
loss (see note 5.a) are held for the benefit of the holders of these contracts.
- 116 -
Consolidated financial statements at 31 December 2014
8.f STRUCTURED ENTITIES
The BNP Paribas Group is engaged in transactions with sponsored structured entities mainly through
its activities of securitisation of financial assets - as either initiator or sponsor -, fund management and specialised asset financing.
In addition, the BNP Paribas Group is also engaged in transactions with structured entities that it has
not sponsored, notably in the form of investments in funds or securitisation vehicles.
The method for assessing control for structured entities is detailed in Note 1.b.2. “Consolidation methods”.
Consolidated structured entities
The main categories of consolidated structured entities are:
ABCP (Asset-Backed Commercial Paper) conduits: the ABCP securitisation conduits Starbird, Matchpoint and Scaldis fund securitisation transactions managed by the BNP Paribas Group on behalf
of its customers. Details on how these are financed and the Group's risk exposure are presented in
Chapter 5 of the Registration Document under "Securitisation as sponsor on behalf of clients / Short-
term refinancing".
Proprietary securitisation: proprietary securitisation positions originated and held by the BNP Paribas
Group are detailed in Chapter 5 of the Registration Document under "Proprietary securitisation
activities (initiator)".
Funds managed by the Group: the BNP Paribas Group structures different types of funds for which it
may act as fund manager, investor, custodian or guarantor. These funds are consolidated when the Group is both the manager and a significant investor, and is therefore exposed to variable returns.
Unconsolidated structured entities
The BNP Paribas Group has entered into relations with unconsolidated structured entities in the course
of its business activities to meet the needs of its customers.
Information relative to interests in sponsored structured entities
The main categories of unconsolidated sponsored structured entities are as follows:
Securitisation: the BNP Paribas Group structures securitisation vehicles for the purposes of offering
customers financing solutions for their assets, either directly or through consolidated ABCP conduits. Each vehicle finances the purchase of customers' assets (receivables, bonds, etc.) primarily by issuing
bonds backed by these assets and whose redemption is linked to their performance.
Funds: the Group structures and manages funds to offer investment opportunities to its customers.
Dedicated or public funds are offered to institutional and individual customers, and are distributed and
commercially monitored by the BNP Paribas Group. The entities of the BNP Paribas Group responsible for managing these funds may receive management fees and performance commission. The BNP Paribas
Group may hold units in these funds, as well as units in funds dedicated to the insurance activity not
managed by the BNP Paribas Group.
Asset financing: the BNP Paribas Group finances structured entities that acquire assets (aircraft, ships, etc.) intended for lease, and the lease payments received by the structured entity are used to
repay the financing, which is guaranteed by the asset held by the structured entity.

- 117 -
Consolidated financial statements at 31 December 2014
Other: on behalf of its customers, the Group may also structure entities which invest in assets or are
involved in debt restructuring.
An interest in an unconsolidated structured entity is a contractual or non-contractual link that exposes
the BNP Paribas Group to variable returns from the performance of the entity.
The Group's assets and liabilities related to the interests held in sponsored structured entities are as
follows:
In millions of euros, at 31 December 2014 Securitisation Funds Asset Financing Others Total
INTERESTS ON THE GROUP BALANCE SHEET
ASSETS
Trading book 396 772 298 2,872 4,338 Instruments designated as at fair value through profit or loss (1)
25,350 60 25,410
Available-for-sale financial assets 63 3,867 235 472 4,637
Loans and receivables 6,843 179 10,832 274 18,128
Other assets 577 22 599
TOTAL ASSETS 7,302 30,745 11,425 3,640 53,112
LIABILITIES
Trading book 29 669 8 2,682 3,388 Instruments designated as at fair value through profit or loss
44 18 62
Financial liabilities carried at amortised cost 167 14,162 567 582 15,478
Other liabilities 384 270 41 13 708
TOTAL LIABILITIES 580 15,145 616 3,295 19,636
MAXIMUM EXPOSURE TO LOSS 10,601 30,828 12,462 4,413 58,304
SIZE OF STRUCTURED ENTITIES (2) 62,653 394,518 42,754 11,084 511,009
(1) of which EUR 17,096 million representative of unit-linked insurance contracts, invested in funds managed by the BNP
Paribas Group. (2) the size of sponsored structured entities equals the total assets of the structured entity for securitisation vehicles, the
net asset value for funds and the structured entity's total assets or the amount of the BNP Paribas Group's commitment for asset financing and other structures.
The BNP Paribas Group's maximum exposure to losses on sponsored structured entities is the carrying
amount of the assets, excluding, for available-for-sale financial assets, changes in value taken directly
to equity, as well as the nominal amount of the financing commitments and guarantee commitments
given and the notional amount of credit default swaps (CDS) sold.
Information relative to interests in non-sponsored structured entities The main interests held by the BNP Paribas Group when it acts solely as an investor in non-sponsored structured entities are detailed below:
Units in funds that are not managed by the Group, which are held by the Insurance business line: as
part of the asset allocation strategy corresponding to investments related to the premiums for unit-
linked contracts or for the general fund, the Insurance business line subscribes to units of
structured entities. These short- or medium-term investments are held for their financial
performance and meet the risk diversification criteria inherent to the business. They amounted to
EUR 31 billion as at 31 December 2014. Changes in value and the majority of the risks associated

- 118 -
Consolidated financial statements at 31 December 2014
with these investments are borne by policyholders in the case of assets representative of unit-
linked contracts, and by the insurer in the case of assets representative of the general fund;
Other investments in funds not managed by the Group: as part of its trading business, the BNP
Paribas Group invests in structured entities without any involvement in either managing or
structuring these entities (investments in mutual funds, securities funds or alternative funds), particularly as economic hedge for structured products sold to customers. The Group also invests
in minority holdings in support of companies as part of its venture capital business. These
investments amounted to EUR 10 billion as at 31 December 2014.
Investments in securitisation vehicles: the breakdown of the Group's exposure and the nature of the
securities held are presented in Chapter 5 of the Registration Document in the section
"Securitisation as investor".
- 119 -
Consolidated financial statements at 31 December 2014
8.g COMPENSATION AND BENEFITS AWARDED TO THE GROUP’S CORPORATE OFFICERS
The remuneration and benefits policy relating to the Group’s corporate officers, as well as the detailed
information on an individual basis, are presented in chapter 2 Corporate Governance of the registration
document.
Remuneration and benefits awarded to the Group’s corporate officers
Year to 31 Dec. 2014 Year to 31 Dec. 2013
Gross remuneration, including Directors' fees and benefits in kind
- payable for the year €6,378,790 €7,550,344
- paid during the year €7,925,248 €8,379,539
Post-employment benefits
Retirement bonuses: present value of the benefit obligation (payroll taxes excluded) €261,438 €652,156
Contingent collective defined-benefit top-up pension plan Nil €19.4 m
Defined contribution pension plan : contributions paid by BNP Paribas during the year €1,857 €2,037
Welfare benefits: premiums paid by BNP Paribas during the year €13,692 €24,184
Share-based payments
Stock subscription options
- value of stock options granted during the year Nil Nil
- number of options held at 31 December 966,287 1,322,380
Performance shares
- value of shares granted during the year Nil Nil
- number of shares held at 31 December 7,000 9,330
Long-term compensation (*)
- fair value at grant date (**) €621,000 €822,494
(*) Up until 2014, the multi-annual variable compensation shown in the note to the consolidated financial statements ("Compensation and benefits awarded to the Group’s corporate officers") was the amount allocated during the year under review, unlike the annual variable compensation, which was applicable to the year preceding its allocation. To avoid the time difference between these two types of variable compensation and comply fully with EU Capital Requirement Directive IV applicable to credit institutions, this presentation has now been changed. Consequently, the multi-annual variable compensation taken into account in the total compensation paid in 2013 is that awarded by the Board of Directors on 29 April 2014. Likewise, the multi-annual variable compensation taken into account in the total compensation paid in 2014 is that awarded by the Board of Directors on 4 February 2015.
(**) Valuation according to the method described in note 1.i.
The defined-benefit pension plan commitments for executive corporate officers in office on 31 December
of the year under review, correspond to the discounted value, on that date, of the life annuities provided
by this plan, i.e. EUR 19.4 million at 31 December 2013. This commitment, which was outsourced in
2004 through an insurance policy overseeing the financing and management of this pension plan, has been covered by the payment of premiums since that date.
At 31 December 2014, no executive corporate officer was eligible for a defined-benefit pension plan.
Directors’ fees paid to members of the board of directors
The directors’ fees paid in 2014 to all members of the Board of Directors amount to EUR 975,001,
compared with EUR 950,593 paid in 2013. The amount paid in 2014 to members other than corporate officers was EUR 866,865, compared with EUR 860,742 in 2013.
- 120 -
Consolidated financial statements at 31 December 2014
Remuneration and benefits awarded to directors representing the employees
In euros Year to 31 Dec. 2014 Year to 31 Dec. 2013 Gross remuneration paid during the year 87,681 81,636
Directors' fees (paid to the trade unions) 120,081 112,352
Premiums paid by BNP Paribas during the year into schemes related to Garantie Vie Professionnelle Accidents benefits and healthcare expense coverage
1,707 1,831
Contributions paid by BNP Paribas during the year into the defined-contribution plan 697 720
Loans, advances and guarantees granted to the Group’s corporate officers
At 31 December 2014, the total outstanding loans granted directly or indirectly to the Group’s corporate
officers and their spouses amounted to EUR 1,352,551 (EUR 1,263,432 at 31 December 2013). These
loans representing normal transactions were carried out on an arm’s length basis.
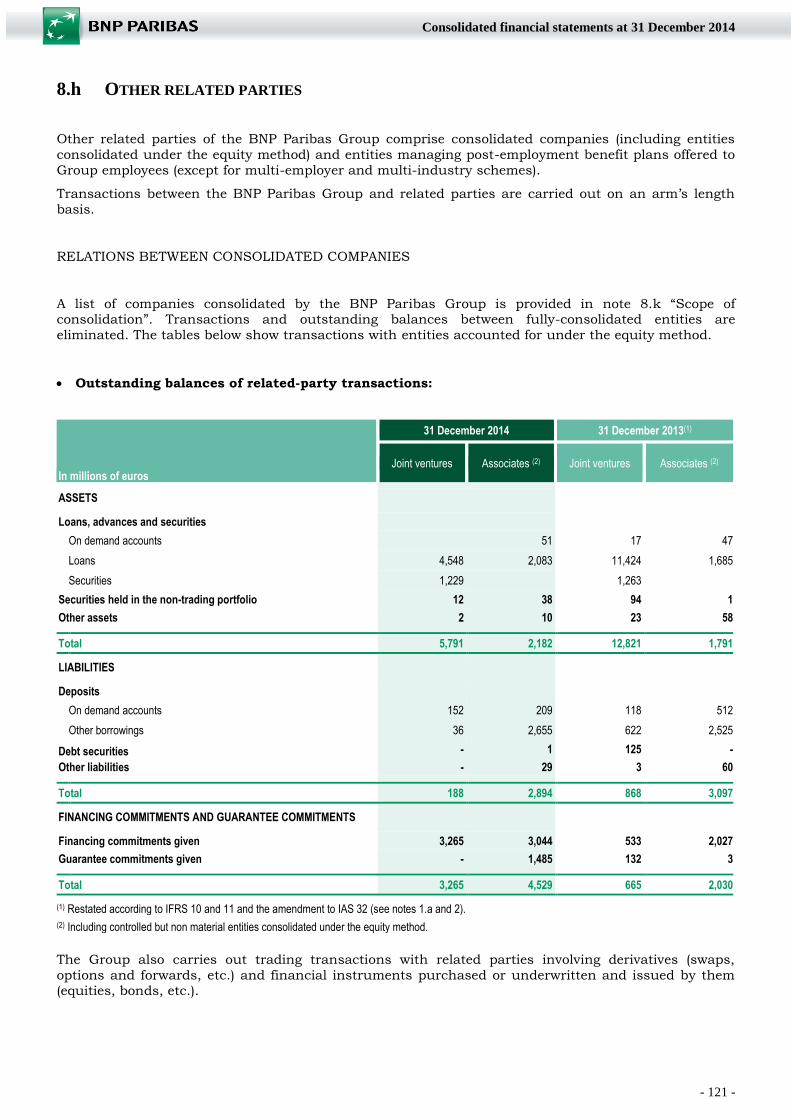
- 121 -
Consolidated financial statements at 31 December 2014
8.h OTHER RELATED PARTIES
Other related parties of the BNP Paribas Group comprise consolidated companies (including entities
consolidated under the equity method) and entities managing post-employment benefit plans offered to
Group employees (except for multi-employer and multi-industry schemes).
Transactions between the BNP Paribas Group and related parties are carried out on an arm’s length
basis.
RELATIONS BETWEEN CONSOLIDATED COMPANIES
A list of companies consolidated by the BNP Paribas Group is provided in note 8.k “Scope of consolidation”. Transactions and outstanding balances between fully-consolidated entities are
eliminated. The tables below show transactions with entities accounted for under the equity method.
Outstanding balances of related-party transactions:
In millions of euros
31 December 2014 31 December 2013(1)
Joint ventures Associates (2) Joint ventures Associates (2)
ASSETS Loans, advances and securities
On demand accounts
51 17 47
Loans
4,548 2,083 11,424 1,685
Securities
1,229 1,263
Securities held in the non-trading portfolio 12 38 94 1
Other assets 2 10 23 58
Total 5,791 2,182 12,821 1,791
LIABILITIES Deposits
On demand accounts
152 209 118 512
Other borrowings
36 2,655 622 2,525
Debt securities - 1 125 -
Other liabilities - 29 3 60
Total 188 2,894 868 3,097
FINANCING COMMITMENTS AND GUARANTEE COMMITMENTS Financing commitments given 3,265 3,044 533 2,027
Guarantee commitments given - 1,485 132 3
Total 3,265 4,529 665 2,030
(1) Restated according to IFRS 10 and 11 and the amendment to IAS 32 (see notes 1.a and 2).
(2) Including controlled but non material entities consolidated under the equity method.
The Group also carries out trading transactions with related parties involving derivatives (swaps,
options and forwards, etc.) and financial instruments purchased or underwritten and issued by them (equities, bonds, etc.).
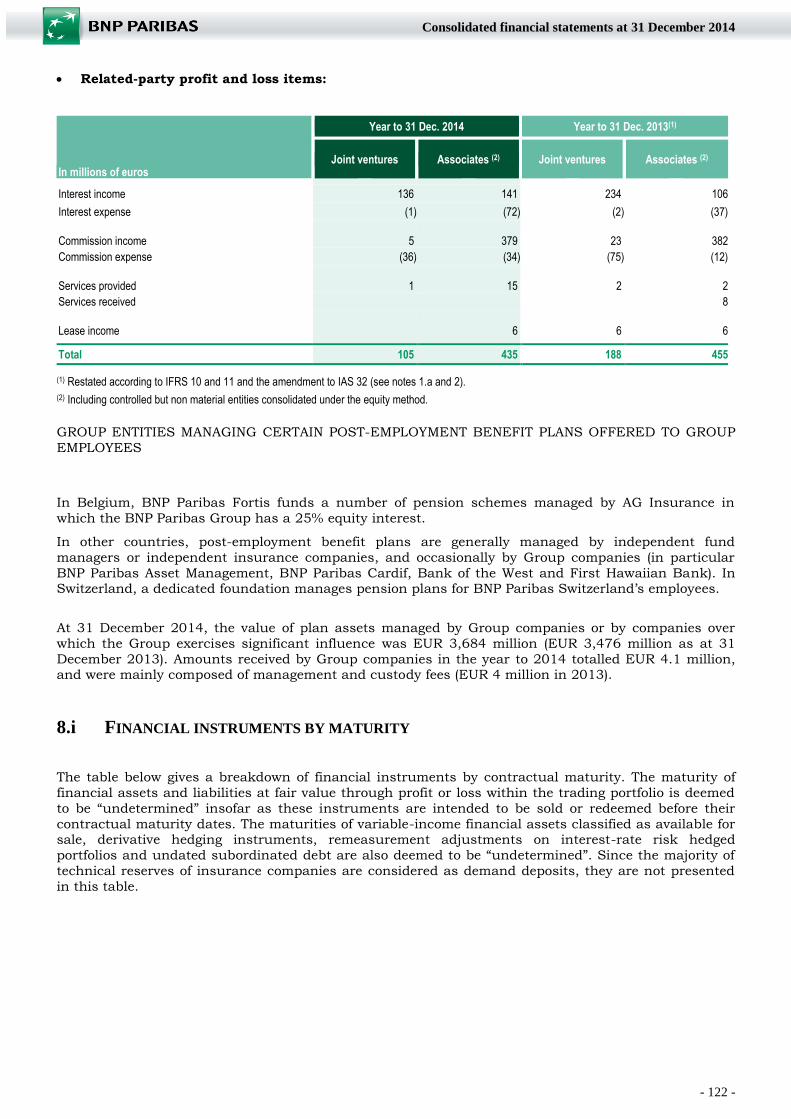
- 122 -
Consolidated financial statements at 31 December 2014
Related-party profit and loss items:
In millions of euros
Year to 31 Dec. 2014 Year to 31 Dec. 2013(1)
Joint ventures Associates (2) Joint ventures Associates (2)
Interest income 136 141 234 106
Interest expense (1) (72) (2) (37)
Commission income 5 379 23 382 Commission expense (36) (34) (75) (12)
Services provided 1 15 2 2 Services received 8
Lease income 6 6 6
Total 105 435 188 455
(1) Restated according to IFRS 10 and 11 and the amendment to IAS 32 (see notes 1.a and 2).
(2) Including controlled but non material entities consolidated under the equity method.
GROUP ENTITIES MANAGING CERTAIN POST-EMPLOYMENT BENEFIT PLANS OFFERED TO GROUP
EMPLOYEES
In Belgium, BNP Paribas Fortis funds a number of pension schemes managed by AG Insurance in
which the BNP Paribas Group has a 25% equity interest.
In other countries, post-employment benefit plans are generally managed by independent fund
managers or independent insurance companies, and occasionally by Group companies (in particular
BNP Paribas Asset Management, BNP Paribas Cardif, Bank of the West and First Hawaiian Bank). In Switzerland, a dedicated foundation manages pension plans for BNP Paribas Switzerland’s employees.
At 31 December 2014, the value of plan assets managed by Group companies or by companies over
which the Group exercises significant influence was EUR 3,684 million (EUR 3,476 million as at 31
December 2013). Amounts received by Group companies in the year to 2014 totalled EUR 4.1 million, and were mainly composed of management and custody fees (EUR 4 million in 2013).
8.i FINANCIAL INSTRUMENTS BY MATURITY
The table below gives a breakdown of financial instruments by contractual maturity. The maturity of
financial assets and liabilities at fair value through profit or loss within the trading portfolio is deemed
to be “undetermined” insofar as these instruments are intended to be sold or redeemed before their
contractual maturity dates. The maturities of variable-income financial assets classified as available for sale, derivative hedging instruments, remeasurement adjustments on interest-rate risk hedged
portfolios and undated subordinated debt are also deemed to be “undetermined”. Since the majority of
technical reserves of insurance companies are considered as demand deposits, they are not presented
in this table.

- 123 -
Consolidated financial statements at 31 December 2014
In millions of euros, at 31 December 2014
Not determined
Overnight or demand
Up to 1 month (excl. overnight)
1 to 3 months
3 months to 1 year
1 to 5 years More than 5
years TOTAL
Cash and amounts due from central banks 117,473 117,473
Financial assets at fair value through profit or loss 813,647 813,647
Derivatives used for hedging purposes 19,766 19,766
Available-for-sale financial assets 18,261 19,106 10,624 14,477 78,455 111,369 252,292
Loans and receivables due from credit institutions 64 9,401 9,916 7,207 4,242 4,271 8,247 43,348
Loans and receivables due from customers 56,937 67,864 61,130 75,342 196,440 199,690 657,403 Remeasurement adjustment on interest-rate risk hedged portfolios
5,603 5,603
Held-to-maturity financial assets 27 721 662 5,596 1,959 8,965
Financial assets 857,341 183,811 96,913 79,682 94,723 284,762 321,265 1,918,497
Due to central banks 1,680 1,680
Financial liabilities at fair value through profit or loss 694,591 553 1,586 7,921 24,093 14,783 743,527
Derivatives used for hedging purposes 22,993 22,993
Due to credit institutions 15,808 21,453 19,971 8,482 21,998 2,640 90,352
Due to customers 469,891 65,682 56,767 28,715 16,545 3,949 641,549
Debt securities 21,203 49,300 42,249 43,419 30,903 187,074
Subordinated debt 1,831 381 292 686 6,185 4,561 13,936 Remeasurement adjustment on interest-rate risk hedged portfolios
4,765 4,765
Financial liabilities 724,180 487,379 109,272 127,916 88,053 112,240 56,836 1,705,876
In millions of euros, at 31 December 2013(1)
Not determined
Overnight or demand
Up to 1 month (excl. overnight)
1 to 3 months
3 months to 1 year
1 to 5 years More than 5
years TOTAL
Cash and amounts due from central banks 100,787 100,787
Financial assets at fair value through profit or loss 683,711 683,711
Derivatives used for hedging purposes 8,368 8,368
Available-for-sale financial assets 17,275 12,562 9,117 13,787 57,433 88,882 199,056
Loans and receivables due from credit institutions 39 11,794 10,457 9,371 6,216 6,698 12,970 57,545
Loans and receivables due from customers 143 47,007 45,837 55,526 72,706 190,959 200,277 612,455 Remeasurement adjustment on interest-rate risk hedged portfolios
3,568 3,568
Held-to-maturity financial assets 229 888 4,549 4,215 9,881
Financial assets 713,104 159,588 68,856 74,243 93,597 259,639 306,344 1,675,371
Due to central banks 662 662
Financial liabilities at fair value through profit or loss 578,054 296 1,776 7,542 23,224 10,343 621,235
Derivatives used for hedging purposes 12,139 12,139
Due to credit institutions 15,174 21,201 17,838 8,779 20,026 1,576 84,594
Due to customers 411,090 55,742 35,177 24,871 20,216 6,401 553,497
Debt securities 14,953 48,168 48,886 46,311 28,368 186,686
Subordinated debt 1,719 59 595 728 6,785 1,938 11,824 Remeasurement adjustment on interest-rate risk hedged portfolios
924 924
Financial liabilities 592,836 426,926 92,251 103,554 90,806 116,562 48,626 1,471,561
(1) Restated according to IFRS 10 and 11 and the amendment to IAS 32 (see notes 1.a and 2).
The majority of the financing and guarantee commitments given, which amounted to EUR 246,381
million and EUR 90,737 million respectively at 31 December 2014 (EUR 206,892 million and EUR
92,294 million respectively at 31 December 2013), can be drawn at sight.
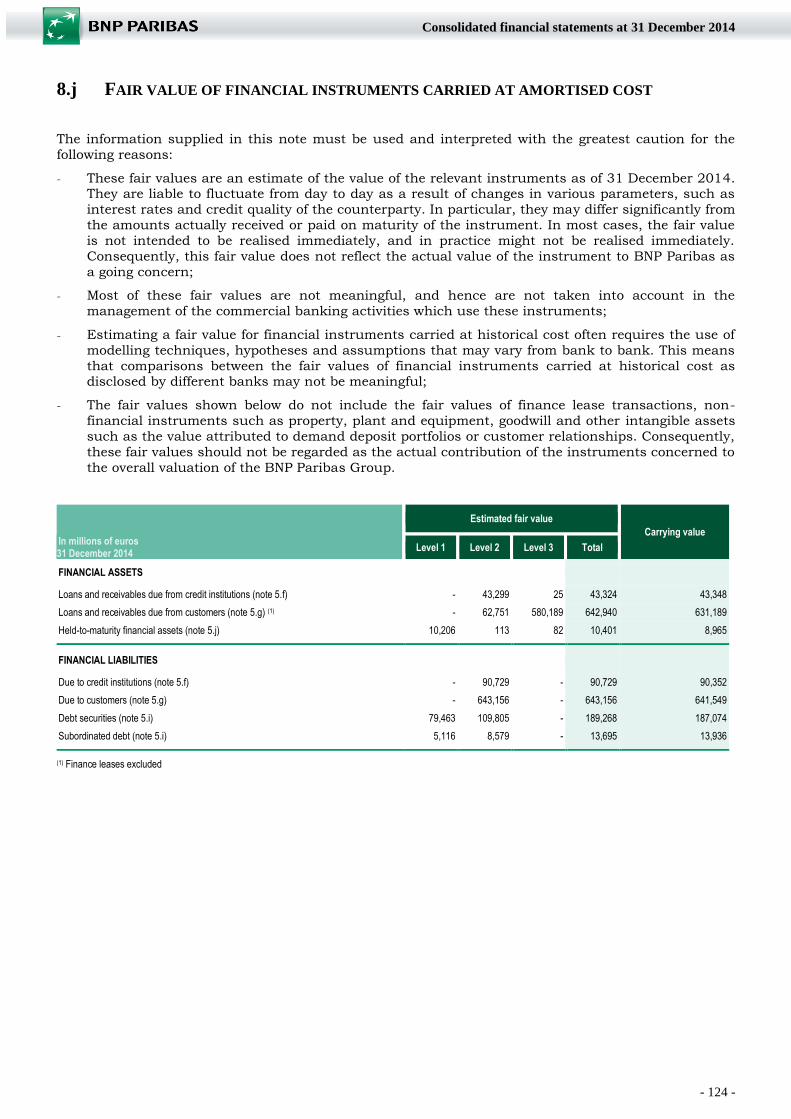
- 124 -
Consolidated financial statements at 31 December 2014
8.j FAIR VALUE OF FINANCIAL INSTRUMENTS CARRIED AT AMORTISED COST
The information supplied in this note must be used and interpreted with the greatest caution for the
following reasons:
- These fair values are an estimate of the value of the relevant instruments as of 31 December 2014. They are liable to fluctuate from day to day as a result of changes in various parameters, such as
interest rates and credit quality of the counterparty. In particular, they may differ significantly from
the amounts actually received or paid on maturity of the instrument. In most cases, the fair value
is not intended to be realised immediately, and in practice might not be realised immediately.
Consequently, this fair value does not reflect the actual value of the instrument to BNP Paribas as
a going concern;
- Most of these fair values are not meaningful, and hence are not taken into account in the
management of the commercial banking activities which use these instruments;
- Estimating a fair value for financial instruments carried at historical cost often requires the use of
modelling techniques, hypotheses and assumptions that may vary from bank to bank. This means
that comparisons between the fair values of financial instruments carried at historical cost as disclosed by different banks may not be meaningful;
- The fair values shown below do not include the fair values of finance lease transactions, non-
financial instruments such as property, plant and equipment, goodwill and other intangible assets
such as the value attributed to demand deposit portfolios or customer relationships. Consequently,
these fair values should not be regarded as the actual contribution of the instruments concerned to
the overall valuation of the BNP Paribas Group.
In millions of euros
31 December 2014
Estimated fair value
Carrying value
Level 1 Level 2 Level 3 Total
FINANCIAL ASSETS
Loans and receivables due from credit institutions (note 5.f) - 43,299 25 43,324 43,348
Loans and receivables due from customers (note 5.g) (1) - 62,751 580,189 642,940 631,189
Held-to-maturity financial assets (note 5.j) 10,206 113 82 10,401 8,965 FINANCIAL LIABILITIES
Due to credit institutions (note 5.f) - 90,729 - 90,729 90,352
Due to customers (note 5.g) - 643,156 - 643,156 641,549
Debt securities (note 5.i) 79,463 109,805 - 189,268 187,074
Subordinated debt (note 5.i) 5,116 8,579 - 13,695 13,936 (1) Finance leases excluded
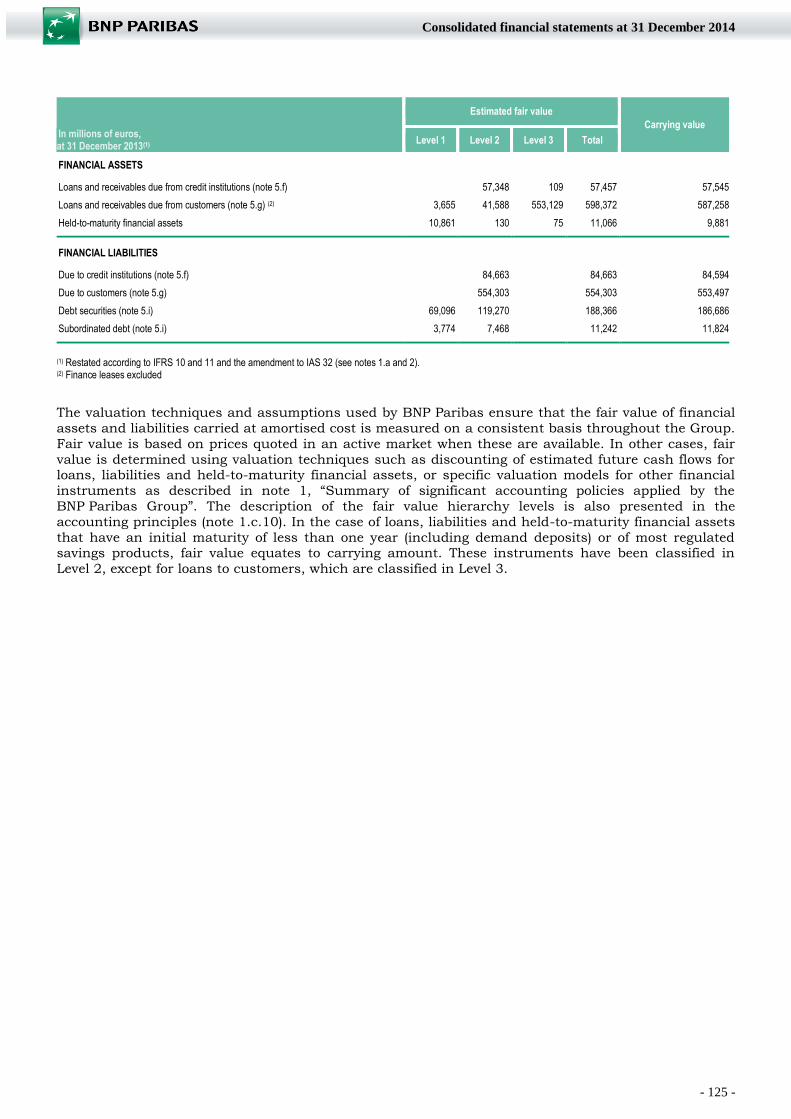
- 125 -
Consolidated financial statements at 31 December 2014
In millions of euros,
at 31 December 2013(1)
Estimated fair value
Carrying value
Level 1 Level 2 Level 3 Total
FINANCIAL ASSETS
Loans and receivables due from credit institutions (note 5.f) 57,348 109 57,457 57,545
Loans and receivables due from customers (note 5.g) (2) 3,655 41,588 553,129 598,372 587,258
Held-to-maturity financial assets 10,861 130 75 11,066 9,881 FINANCIAL LIABILITIES
Due to credit institutions (note 5.f) 84,663 84,663 84,594
Due to customers (note 5.g) 554,303 554,303 553,497
Debt securities (note 5.i) 69,096 119,270 188,366 186,686
Subordinated debt (note 5.i) 3,774 7,468 11,242 11,824
(1) Restated according to IFRS 10 and 11 and the amendment to IAS 32 (see notes 1.a and 2).
(2) Finance leases excluded
The valuation techniques and assumptions used by BNP Paribas ensure that the fair value of financial
assets and liabilities carried at amortised cost is measured on a consistent basis throughout the Group.
Fair value is based on prices quoted in an active market when these are available. In other cases, fair
value is determined using valuation techniques such as discounting of estimated future cash flows for loans, liabilities and held-to-maturity financial assets, or specific valuation models for other financial
instruments as described in note 1, “Summary of significant accounting policies applied by the
BNP Paribas Group”. The description of the fair value hierarchy levels is also presented in the
accounting principles (note 1.c.10). In the case of loans, liabilities and held-to-maturity financial assets
that have an initial maturity of less than one year (including demand deposits) or of most regulated savings products, fair value equates to carrying amount. These instruments have been classified in
Level 2, except for loans to customers, which are classified in Level 3.
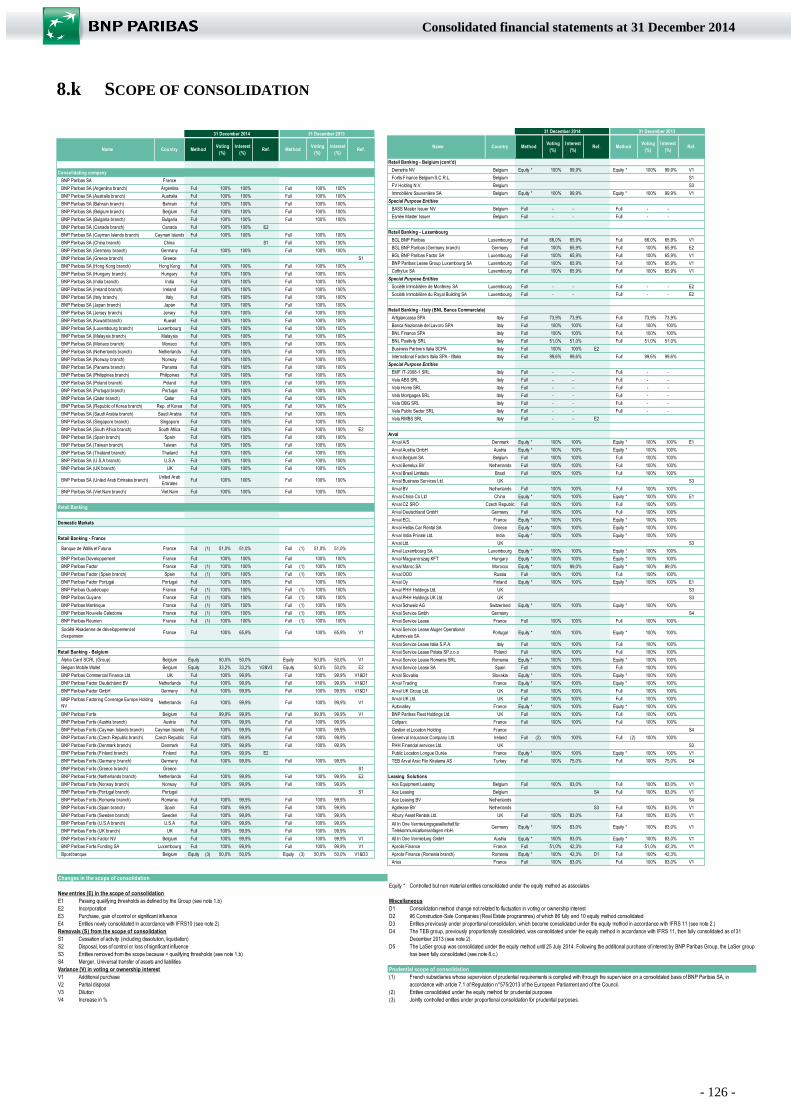
- 126 -
Consolidated financial statements at 31 December 2014
8.k SCOPE OF CONSOLIDATION
Name Country Method Voting
(%)
Interest
(%)Ref. Method
Voting
(%)
Interest
(%)Ref.
Consolidating company
BNP Paribas SA France
BNP Paribas SA (Argentina branch) Argentina Full 100% 100% Full 100% 100%
BNP Paribas SA (Australia branch) Australia Full 100% 100% Full 100% 100%
BNP Paribas SA (Bahrain branch) Bahrain Full 100% 100% Full 100% 100%
BNP Paribas SA (Belgium branch) Belgium Full 100% 100% Full 100% 100%
BNP Paribas SA (Bulgaria branch) Bulgaria Full 100% 100% Full 100% 100%
BNP Paribas SA (Canada branch) Canada Full 100% 100% E2
BNP Paribas SA (Cayman Islands branch) Cayman Islands Full 100% 100% Full 100% 100%
BNP Paribas SA (China branch) China S1 Full 100% 100%
BNP Paribas SA (Germany branch) Germany Full 100% 100% Full 100% 100%
BNP Paribas SA (Greece branch) Greece S1
BNP Paribas SA (Hong Kong branch) Hong Kong Full 100% 100% Full 100% 100%
BNP Paribas SA (Hungary branch) Hungary Full 100% 100% Full 100% 100%
BNP Paribas SA (India branch) India Full 100% 100% Full 100% 100%
BNP Paribas SA (Ireland branch) Ireland Full 100% 100% Full 100% 100%
BNP Paribas SA (Italy branch) Italy Full 100% 100% Full 100% 100%
BNP Paribas SA (Japan branch) Japan Full 100% 100% Full 100% 100%
BNP Paribas SA (Jersey branch) Jersey Full 100% 100% Full 100% 100%
BNP Paribas SA (Kuwait branch) Kuwait Full 100% 100% Full 100% 100%
BNP Paribas SA (Luxembourg branch) Luxembourg Full 100% 100% Full 100% 100%
BNP Paribas SA (Malaysia branch) Malaysia Full 100% 100% Full 100% 100%
BNP Paribas SA (Monaco branch) Monaco Full 100% 100% Full 100% 100%
BNP Paribas SA (Netherlands branch) Netherlands Full 100% 100% Full 100% 100%
BNP Paribas SA (Norway branch) Norway Full 100% 100% Full 100% 100%
BNP Paribas SA (Panama branch) Panama Full 100% 100% Full 100% 100%
BNP Paribas SA (Philippines branch) Philippines Full 100% 100% Full 100% 100%
BNP Paribas SA (Poland branch) Poland Full 100% 100% Full 100% 100%
BNP Paribas SA (Portugal branch) Portugal Full 100% 100% Full 100% 100%
BNP Paribas SA (Qatar branch) Qatar Full 100% 100% Full 100% 100%
BNP Paribas SA (Republic of Korea branch) Rep. of Korea Full 100% 100% Full 100% 100%
BNP Paribas SA (Saudi Arabia branch) Saudi Arabia Full 100% 100% Full 100% 100%
BNP Paribas SA (Singapore branch) Singapore Full 100% 100% Full 100% 100%
BNP Paribas SA (South Africa branch) South Africa Full 100% 100% Full 100% 100% E2
BNP Paribas SA (Spain branch) Spain Full 100% 100% Full 100% 100%
BNP Paribas SA (Taiwan branch) Taiwan Full 100% 100% Full 100% 100%
BNP Paribas SA (Thailand branch) Thailand Full 100% 100% Full 100% 100%
BNP Paribas SA (U.S.A branch) U.S.A Full 100% 100% Full 100% 100%
BNP Paribas SA (UK branch) UK Full 100% 100% Full 100% 100%
BNP Paribas SA (United Arab Emirates branch)United Arab
EmiratesFull 100% 100% Full 100% 100%
BNP Paribas SA (Viet Nam branch) Viet Nam Full 100% 100% Full 100% 100%
Retail Banking
Domestic Markets
Retail Banking - France
Banque de Wallis et Futuna France Full (1) 51,0% 51,0% Full (1) 51,0% 51,0%
BNP Paribas Developpement France Full 100% 100% Full 100% 100%
BNP Paribas Factor France Full (1) 100% 100% Full (1) 100% 100%
BNP Paribas Factor (Spain branch) Spain Full (1) 100% 100% Full (1) 100% 100%
BNP Paribas Factor Portugal Portugal Full 100% 100% Full 100% 100%
BNP Paribas Guadeloupe France Full (1) 100% 100% Full (1) 100% 100%
BNP Paribas Guyane France Full (1) 100% 100% Full (1) 100% 100%
BNP Paribas Martinique France Full (1) 100% 100% Full (1) 100% 100%
BNP Paribas Nouvelle Caledonie France Full (1) 100% 100% Full (1) 100% 100%
BNP Paribas Réunion France Full (1) 100% 100% Full (1) 100% 100%
Société Alsacienne de développement et
d'expansionFrance Full 100% 65,9% Full 100% 65,9% V1
Retail Banking - Belgium
Alpha Card SCRL (Group) Belgium Equity 50,0% 50,0% Equity 50,0% 50,0% V1
Belgian Mobile Wallet Belgium Equity 33,2% 33,2% V2&V3 Equity 50,0% 50,0% E2
BNP Paribas Commercial Finance Ltd. UK Full 100% 99,9% Full 100% 99,9% V1&D1
BNP Paribas Factor Deutschland BV Netherlands Full 100% 99,9% Full 100% 99,9% V1&D1
BNP Paribas Factor GmbH Germany Full 100% 99,9% Full 100% 99,9% V1&D1
BNP Paribas Factoring Coverage Europe Holding
NVNetherlands Full 100% 99,9% Full 100% 99,9% V1
BNP Paribas Fortis Belgium Full 99,9% 99,9% Full 99,9% 99,9% V1
BNP Paribas Fortis (Austria branch) Austria Full 100% 99,9% Full 100% 99,9%
BNP Paribas Fortis (Cayman Islands branch) Cayman Islands Full 100% 99,9% Full 100% 99,9%
BNP Paribas Fortis (Czech Republic branch) Czech Republic Full 100% 99,9% Full 100% 99,9%
BNP Paribas Fortis (Denmark branch) Denmark Full 100% 99,9% Full 100% 99,9%
BNP Paribas Fortis (Finland branch) Finland Full 100% 99,9% E2
BNP Paribas Fortis (Germany branch) Germany Full 100% 99,9% Full 100% 99,9%
BNP Paribas Fortis (Greece branch) Greece S1
BNP Paribas Fortis (Netherlands branch) Netherlands Full 100% 99,9% Full 100% 99,9% E2
BNP Paribas Fortis (Norway branch) Norway Full 100% 99,9% Full 100% 99,9%
BNP Paribas Fortis (Portugal branch) Portugal S1
BNP Paribas Fortis (Romania branch) Romania Full 100% 99,9% Full 100% 99,9%
BNP Paribas Fortis (Spain branch) Spain Full 100% 99,9% Full 100% 99,9%
BNP Paribas Fortis (Sweden branch) Sweden Full 100% 99,9% Full 100% 99,9%
BNP Paribas Fortis (U.S.A branch) U.S.A Full 100% 99,9% Full 100% 99,9%
BNP Paribas Fortis (UK branch) UK Full 100% 99,9% Full 100% 99,9%
BNP Paribas Fortis Factor NV Belgium Full 100% 99,9% Full 100% 99,9% V1
BNP Paribas Fortis Funding SA Luxembourg Full 100% 99,9% Full 100% 99,9% V1
Bpost banque Belgium Equity (3) 50,0% 50,0% Equity (3) 50,0% 50,0% V1&D3
31 December 201331 December 2014
Name Country Method Voting
(%)
Interest
(%)Ref. Method
Voting
(%)
Interest
(%)Ref.
Retail Banking - Belgium (cont'd)
Demetris NV Belgium Equity * 100% 99,9% Equity * 100% 99,9% V1
Fortis Finance Belgium S.C.R.L. Belgium S1
FV Holding N.V. Belgium S3
Immobilière Sauvenière SA Belgium Equity * 100% 99,9% Equity * 100% 99,9% V1
Special Purpose Entities
BASS Master Issuer NV Belgium Full - - Full - -
Esmée Master Issuer Belgium Full - - Full - -
Retail Banking - Luxembourg
BGL BNP Paribas Luxembourg Full 66,0% 65,9% Full 66,0% 65,9% V1
BGL BNP Paribas (Germany branch) Germany Full 100% 65,9% Full 100% 65,9% E2
BGL BNP Paribas Factor SA Luxembourg Full 100% 65,9% Full 100% 65,9% V1
BNP Paribas Lease Group Luxembourg SA Luxembourg Full 100% 65,9% Full 100% 65,9% V1
Cofhylux SA Luxembourg Full 100% 65,9% Full 100% 65,9% V1
Special Purpose Entities
Société Immobilière de Monterey SA Luxembourg Full - - Full - - E2
Société Immobilière du Royal Building SA Luxembourg Full - - Full - - E2
Retail Banking - I taly (BNL Banca Commerciale)
Artigiancassa SPA Italy Full 73,9% 73,9% Full 73,9% 73,9%
Banca Nazionale del Lavoro SPA Italy Full 100% 100% Full 100% 100%
BNL Finance SPA Italy Full 100% 100% Full 100% 100%
BNL Positivity SRL Italy Full 51,0% 51,0% Full 51,0% 51,0%
Business Partners Italia SCPA Italy Full 100% 100% E2
International Factors Italia SPA - Ifitalia Italy Full 99,6% 99,6% Full 99,6% 99,6%
Special Purpose Entities
EMF IT-2008-1 SRL Italy Full - - Full - -
Vela ABS SRL Italy Full - - Full - -
Vela Home SRL Italy Full - - Full - -
Vela Mortgages SRL Italy Full - - Full - -
Vela OBG SRL Italy Full - - Full - -
Vela Public Sector SRL Italy Full - - Full - -
Vela RMBS SRL Italy Full - - E2
Arval
Arval A/S Denmark Equity * 100% 100% Equity * 100% 100% E1
Arval Austria GmbH Austria Equity * 100% 100% Equity * 100% 100%
Arval Belgium SA Belgium Full 100% 100% Full 100% 100%
Arval Benelux BV Netherlands Full 100% 100% Full 100% 100%
Arval Brasil Limitada Brazil Full 100% 100% Full 100% 100%
Arval Business Services Ltd. UK S3
Arval BV Netherlands Full 100% 100% Full 100% 100%
Arval China Co Ltd China Equity * 100% 100% Equity * 100% 100% E1
Arval CZ SRO Czech Republic Full 100% 100% Full 100% 100%
Arval Deutschland GmbH Germany Full 100% 100% Full 100% 100%
Arval ECL France Equity * 100% 100% Equity * 100% 100%
Arval Hellas Car Rental SA Greece Equity * 100% 100% Equity * 100% 100%
Arval India Private Ltd. India Equity * 100% 100% Equity * 100% 100%
Arval Ltd. UK S3
Arval Luxembourg SA Luxembourg Equity * 100% 100% Equity * 100% 100%
Arval Magyarorszag KFT Hungary Equity * 100% 100% Equity * 100% 100%
Arval Maroc SA Morocco Equity * 100% 89,0% Equity * 100% 89,0%
Arval OOO Russia Full 100% 100% Full 100% 100%
Arval Oy Finland Equity * 100% 100% Equity * 100% 100% E1
Arval PHH Holdings Ltd. UK S3
Arval PHH Holdings UK Ltd. UK S3
Arval Schweiz AG Switzerland Equity * 100% 100% Equity * 100% 100%
Arval Service Gmbh Germany S4
Arval Service Lease France Full 100% 100% Full 100% 100%
Arval Service Lease Aluger Operational
Automoveis SAPortugal Equity * 100% 100% Equity * 100% 100%
Arval Service Lease Italia S.P.A. Italy Full 100% 100% Full 100% 100%
Arval Service Lease Polska SP.z.o.o Poland Full 100% 100% Full 100% 100%
Arval Service Lease Romania SRL Romania Equity * 100% 100% Equity * 100% 100%
Arval Service Lease SA Spain Full 100% 100% Full 100% 100%
Arval Slovakia Slovakia Equity * 100% 100% Equity * 100% 100%
Arval Trading France Equity * 100% 100% Equity * 100% 100%
Arval UK Group Ltd. UK Full 100% 100% Full 100% 100%
Arval UK Ltd. UK Full 100% 100% Full 100% 100%
Autovalley France Equity * 100% 100% Equity * 100% 100%
BNP Paribas Fleet Holdings Ltd. UK Full 100% 100% Full 100% 100%
Cofiparc France Full 100% 100% Full 100% 100%
Gestion et Location Holding France S4
Greenval Insurance Company Ltd. Ireland Full (2) 100% 100% Full (2) 100% 100%
PHH Financial services Ltd. UK S3
Public Location Longue Durée France Equity * 100% 100% Equity * 100% 100% V1
TEB Arval Arac Filo Kiralama AS Turkey Full 100% 75,0% Full 100% 75,0% D4
Leasing Solutions
Ace Equipment Leasing Belgium Full 100% 83,0% Full 100% 83,0% V1
Ace Leasing Belgium S4 Full 100% 83,0% V1
Ace Leasing BV Netherlands S4
Agrilease BV Netherlands S3 Full 100% 83,0% V1
Albury Asset Rentals Ltd. UK Full 100% 83,0% Full 100% 83,0% V1
All In One Vermietungsgesellschaft für
Telekommunicationsanlagen mbH.Germany Equity * 100% 83,0% Equity * 100% 83,0% V1
All In One Vermietung GmbH Austria Equity * 100% 83,0% Equity * 100% 83,0% V1
Aprolis Finance France Full 51,0% 42,3% Full 51,0% 42,3% V1
Aprolis Finance (Romania branch) Romania Equity * 100% 42,3% D1 Full 100% 42,3%
Arius France Full 100% 83,0% Full 100% 83,0% V1
31 December 2014 31 December 2013
Changes in the scope of consolidation
Equity * Controlled but non material entities consolidated under the equity method as associates
New entries (E) in the scope of consolidation
E1 Passing qualifying thresholds as defined by the Group (see note 1.b) Miscellaneous
E2 Incorporation D1 Consolidation method change not related to fluctuation in voting or ownership interest
E3 Purchase, gain of control or significant influence D2 96 Construction-Sale Companies (Real Estate programmes) of which 86 fully and 10 equity method consolidated
E4 Entities newly consolidated in accordance with IFRS10 (see note 2) D3 Entities previously under proportional consolidation, which become consolidated under the equity method in accordance with IFRS 11 (see note 2.)
Removals (S) from the scope of consolidation D4
S1 Cessation of activity (including dissolution, liquidation)
S2 Disposal, loss of control or loss of significant influence D5
S3 Entities removed from the scope because < qualifying thresholds (see note 1.b)
S4 Merger, Universal transfer of assets and liabilities
Variance (V) in voting or ownership interest Prudential scope of consolidation
V1 Additional purchase (1)
V2 Partial disposal
V3 Dilution (2) Entites consolidated under the equity method for prudential purposes
V4 Increase in % (3) Jointly controlled entities under proportional consolidation for prudential purposes.
French subsidiaries whose supervision of prudential requirements is complied with through the supervision on a consolidated basis of BNP Paribas SA, in
accordance with article 7.1 of Regulation n°575/2013 of the European Parliament and of the Council.
The TEB group, previously proportionally consolidated, was consolidated under the equity method in accordance with IFRS 11, then fully consolidated as of 31
December 2013 (see note 2).
The LaSer group was consolidated under the equity method until 25 July 2014. Following the additional purchase of interest by BNP Paribas Group, the LaSer group
has been fully consolidated (see note 8.c.)

- 127 -
Consolidated financial statements at 31 December 2014
Name Country Method Voting
(%)
Interest
(%)Ref. Method
Voting
(%)
Interest
(%)Ref.
Leasing Solutions (cont'd)
Artegy Ltd. UK Equity * 100% 83,0% D1 Full 100% 83,0% V1
Artegy France Full 100% 83,0% Full 100% 83,0% V1
BNP Paribas Finansal Kiralama AS Turkey Full 100% 82,4% V1 Full 100% 82,3% V1
BNP Paribas Lease Group BPLG France Full (1) 100% 83,0% Full (1) 100% 83,0% V1
BNP Paribas Lease Group BPLG (Germany
branch)Germany Full (1) 100% 83,0% Full (1) 100% 83,0%
BNP Paribas Lease Group BPLG (Italy branch) Italy Full (1) 100% 83,0% Full (1) 100% 83,0%
BNP Paribas Lease Group BPLG (Portugal
branch)Portugal Full (1) 100% 83,0% Full (1) 100% 83,0%
BNP Paribas Lease Group BPLG (Spain branch) Spain Full (1) 100% 83,0% Full (1) 100% 83,0%
BNP Paribas Lease Group (Rentals) Ltd. UK Full 100% 83,0% Full 100% 83,0% V1
BNP Paribas Lease Group IFN SA Romania Equity * 100% 83,0% Equity * 100% 83,0% V1
BNP Paribas Lease Group KFT Hungary Equity * 100% 83,0% Equity * 100% 83,0% V1
BNP Paribas Lease Group Leasing Solutions SPA Italy Full 100% 95,5% Full 100% 95,5% V1
BNP Paribas Lease Group Lizing RT Hungary Equity * 100% 83,0% Equity * 100% 83,0% V1
BNP Paribas Lease Group Netherlands BV Netherlands S4
BNP Paribas Lease Group Polska SP z.o.o Poland Equity * 100% 83,0% Equity * 100% 83,0% V1
BNP Paribas Lease Group PLC UK Full 100% 83,0% Full 100% 83,0% V1
BNP Paribas Lease Group SA Belgium Belgium Full 100% 83,0% Full 100% 83,0% V1
BNP Paribas Leasing Solutions Luxembourg Full 100% 83,0% Full 100% 83,0% V1
BNP Paribas Leasing Solutions Immobilier Suisse Switzerland Equity * 100% 83,0% Equity * 100% 83,0% V1
BNP Paribas Leasing Solutions Ltd. UK Full 100% 83,0% Full 100% 83,0% V1
BNP Paribas Leasing Solutions NV Netherlands Full 100% 83,0% Full 100% 83,0% V1
BNP Paribas Leasing Solutions Suisse SA Switzerland Equity * 100% 83,0% Equity * 100% 83,0% V1
Claas Financial Services France Full (1) 60,1% 49,9% Full (1) 60,1% 49,9% V1
Claas Financial Services (Germany branch) Germany Full (1) 100% 49,9% Full (1) 100% 49,9%
Claas Financial Services (Italy branch) Italy Full (1) 100% 49,9% Full (1) 100% 49,9%
Claas Financial Services (Poland branch) Poland Full (1) 100% 49,9% Full (1) 100% 49,9%
Claas Financial Services (Spain branch) Spain Full (1) 100% 49,9% Full (1) 100% 49,9%
Claas Financial Services Inc. U.S.A Full 100% 49,9% Full 100% 49,9% V1
Claas Financial Services Ltd. UK Full 51,0% 42,3% Full 51,0% 42,3% V1
CNH Industrial Capital Europe (ex- CNH Capital
Europe)France Full (1) 50,1% 41,6% Full (1) 50,1% 41,6% V1
CNH Industrial Capital Europe (Belgium branch) Belgium Full (1) 100% 41,6% Full (1) 100% 41,6%
CNH Industrial Capital Europe (Germany branch) Germany Full (1) 100% 41,6% Full (1) 100% 41,6%
CNH Industrial Capital Europe (Italy branch) Italy Full (1) 100% 41,6% Full (1) 100% 41,6%
CNH Industrial Capital Europe (Poland branch) Poland Full (1) 100% 41,6% E2
CNH Industrial Capital Europe (Spain branch) Spain Full (1) 100% 41,6% Full (1) 100% 41,6%
CNH Industrial Capital Europe BV (ex- CNH
Capital Europe BV)Netherlands Full 100% 41,6% Full 100% 41,6% V1
CNH Industrial Capital Europe GmbH (ex- CNH
Capital Europe GmbH)Austria Full 100% 41,6% Full 100% 41,6% V1
CNH Industrial Capital Europe Ltd. (ex- CNH
Capital Europe Ltd.)UK Full 100% 41,6% Full 100% 41,6% V1
Commercial Vehicle Finance Ltd. UK Full 100% 83,0% Full 100% 83,0% V1
Equipment Lease BV Netherlands S4
ES-Finance Belgium Full 100% 99,9% Full 100% 99,9% V1
Fortis Lease Belgium Belgium Full 100% 83,0% Full 100% 83,0% V1
Fortis Lease (France) France Full (1) 100% 83,0% Full (1) 100% 83,0% V1
Fortis Lease Car & Truck Belgium S4 Full 100% 83,0% V1
Fortis Lease Deutschland GmbH Germany Equity * 100% 83,0% Equity * 100% 83,0% V1
Fortis Lease Iberia SA Spain Equity * 100% 86,6% Equity * 100% 86,6% V1
Fortis Lease Operativ Lizing Zartkoruen Mukodo
ReszvenytarsasagHungary Equity * 100% 83,0% Equity * 100% 83,0% V1
Fortis Lease Polska Sp.z.o.o. Poland S3 Full 100% 99,8% V1
Fortis Lease Portugal Portugal Equity * 100% 83,0% Equity * 100% 83,0% V1
Fortis Lease Romania IFN SA Romania Equity * 100% 83,0% Equity * 100% 83,0% V1
Fortis Lease UK Ltd. UK Equity * 100% 83,0% D1 Full 100% 83,0% V1
Fortis Lease UK Retail Ltd. UK Equity * 100% 83,0% D1 Full 100% 83,0% V1
Fortis Vastgoedlease BV Netherlands Equity * 100% 83,0% D1 Full 100% 83,0% V1
Heffiq Heftruck Verhuur BV (ex- Barloworld
Heftruck BV)Netherlands S3 Equity 50,0% 41,5% V1
H.F.G.L Ltd. UK Full 100% 83,0% Full 100% 83,0% V1
Humberclyde Commercial Investments Ltd. UK Full 100% 83,0% Full 100% 83,0% V1
Humberclyde Commercial Investments N°1 Ltd. UK Full 100% 83,0% Full 100% 83,0% V1
JCB Finance France Full (1) 100% 41,6% Full (1) 100% 41,6% V1
JCB Finance (Germany branch) Germany Full (1) 100% 41,6% Full (1) 100% 41,6%
JCB Finance (Italy branch) Italy Full (1) 100% 41,6% Full (1) 100% 41,6%
JCB Finance (Spain branch) Spain S1 Full (1) 100% 41,6%
JCB Finance Holdings Ltd. UK Full 50,1% 41,6% Full 50,1% 41,6% V1
Locatrice Italiana SPA Italy Equity * 100% 95,5% Equity * 100% 95,5% V1
Manitou Finance Ltd. UK Full 51,0% 42,3% Full 51,0% 42,3% V1
MFF France Full (1) 51,0% 42,3% Full (1) 51,0% 42,3% V1
Natiocrédibail France Full (1) 100% 100% Full (1) 100% 100%
Natiocrédimurs France Full (1) 100% 100% Full (1) 100% 100%
Natioénergie 2 France Equity * 100% 100% Equity * 100% 100% D1
Same Deutz Fahr Finance Ltd. UK Full 100% 83,0% Full 100% 83,0% V1
Same Deutz-Fahr Finance France Full (1) 100% 83,0% Full (1) 100% 83,0% V1
SREI Equipement Finance Ltd. (ex- SREI
Equipement Finance Private Ltd.)India Equity (3) 50,0% 41,5% Equity (3) 50,0% 41,5% V1&D3
Special Purpose Entities
Fortis Energy Leasing XI BV Netherlands S4
Fortis Energy Leasing X2 BV Netherlands S4
Fortis Energy Leasing XIV BV Netherlands S4
Vela Lease SRL Italy Full - - Full - -
Personal Investors
B*Capital France Full (1) 100% 99,9% Full (1) 100% 99,9%
Cortal Consors France S4 Full (1) 100% 100%
Cortal Consors (Germany branch) Germany S4 Full (1) 100% 100%
31 December 201331 December 2014
Name Country Method Voting
(%)
Interest
(%)Ref. Method
Voting
(%)
Interest
(%)Ref.
Personal Investors (cont'd)
Cortal Consors (Italy branch) Italy S1
Cortal Consors (Spain branch) Spain S4 Full (1) 100% 100%
DAB Bank AG Germany Full 91,7% 91,7% E3
Direktanlage AT AG Austria Full 100% 91,7% E3
Geojit BNP Paribas Financial Services Ltd (Group) India Equity 34,4% 34,4% V1 Equity 33,6% 33,6% D3
Geojit Technologies Private Ltd. India Full 57,4% 57,4% V1 Full 56,8% 56,8%
Portzamparc Gestion France S3 Full 100% 51,0%
Portzamparc société de Bourse France Full (1) 51,0% 51,0% Full (1) 51,0% 51,0%
Special Purpose Entities
BNP Paribas Beteiligungsholding AG Germany Full - - E3
BNP Paribas Personal Finance
Alpha Crédit SA Belgium Full 100% 99,9% Full 100% 99,9% V1
Axa Banque Financement France Equity 35,0% 35,0% Equity 35,0% 35,0%
Banco BNP Paribas Personal Finance SA Portugal Full 100% 100% Full 100% 100%
Banco Cetelem Argentina SA Argentina Full 100% 100% Full 100% 100%
Banco Cetelem SA Spain Full 100% 100% Full 100% 100%
Banco Cetelem SA (ex- Banco BGN SA) Brazil Full 100% 100% Full 100% 100%
Banco de Servicios Financieros SA Argentina Equity 40,0% 40,0% Equity 40,0% 40,0%
Banque Solféa France Equity (3) 44,9% 44,9% V1&D5
BGN Mercantil E Servicos Ltda Brazil Equity * 100% 100% Equity * 100% 100%
Bieffe 5 SPA Italy S4 Full 100% 100%
BNP Paribas Personal Finance France Full 100% 100% Full 100% 100%
BNP Paribas Personal Finance BV Netherlands Full 100% 100% Full 100% 100%
BNP Paribas Personal Finance EAD Bulgaria Full 100% 100% Full 100% 100%
BNP Paribas Personal Finance SA de CV Mexico Full 100% 100% Full 100% 100%
Cafineo France Full (1) 51,0% 50,8% Full (1) 51,0% 50,8%
Carrefour Banque France Equity 39,2% 39,2% Equity 39,2% 39,2%
Cetelem Algérie Algeria Equity * 100% 100% Equity * 100% 100%
Cetelem America Ltda Brazil Full 100% 100% Full 100% 100%
Cetelem Bank LLC Russia Equity 26,0% 26,0% Equity 26,0% 26,0% V2
Cetelem Brasil SA Brazil S4 Full 100% 100%
Cetelem CR AS Czech Republic Full 100% 100% Full 100% 100%
Cetelem IFN Romania Full 100% 100% Full 100% 100%
Cetelem Latin America Holding Participaçoes Ltda Brazil S4
Cetelem Serviços Ltda Brazil Full 100% 100% Full 100% 100% E1
Cetelem Slovensko AS Slovakia Full 100% 100% Full 100% 100%
CMV Médiforce France Full (1) 100% 100% Full (1) 100% 100%
Cofica Bail France Full (1) 100% 100% Full (1) 100% 100%
Cofiplan France Full (1) 100% 100% Full (1) 100% 100%
Commerz Finanz Germany Full 50,1% 50,1% Full 50,1% 50,1%
Communication Marketing Services - CMS France Full 100% 100% V1&D5
Compagnie de Gestion et de Prêts France Full 65,0% 65,0% V1&D5
Cosimo France S3
Creation Consumer Finance Ltd. UK Full 100% 100% V1&D5
Creation Financial Services Ltd. UK Full 100% 100% V1&D5
Creation Marketing Services Ltd. UK Full 100% 100% V1&D5
Credirama SPA Italy S3
Crédit Moderne Antilles Guyane France Full (1) 100% 100% Full (1) 100% 100%
Crédit Moderne Océan Indien France Full (1) 97,8% 97,8% Full (1) 97,8% 97,8%
Direct Services Bulgaria Full 100% 100% Full 100% 100%
Domofinance France Full (1) 55,0% 55,0% Full (1) 55,0% 55,0%
Effico France Full 100% 100% Full 100% 100%
Effico Iberia SA Spain Equity * 100% 100% Equity * 100% 100% D1
Effico Portugal Portugal S2
EkspresBank Denmark Full 100% 100% V1&D5
EkspresBank (Norway branch) Norway Full 100% 100% V1&D5
Eos Aremas Belgium SA Belgium Equity 50,0% 49,9% Equity 50,0% 49,9% V1
Eurocredito EFC SA Spain Full 100% 100% Full 100% 100%
Facet France Full (1) 100% 100% Full (1) 100% 100%
Fidecom France Full 82,4% 82,4% V1&D5
Fidem France Full (1) 100% 100% Full (1) 100% 100% V1
Fimestic Expansion SA Spain Full 100% 100% Full 100% 100%
Finalia Belgium S4
Findomestic Banca SPA Italy Full 100% 100% Full 100% 100%
Findomestic Banka AD Serbia Full 100% 100% Full 100% 100%
Gesellschaft für Capital & Vermögensverwaltung
Gmbh (GCV)Germany Equity * 100% 99,9% Equity * 100% 99,9% E1
Gestion et Services Groupe Cofinoga GIE France Full 100% 100% V1&D5
Inkasso Kodat Gmbh & Co KG Germany Equity * 100% 99,9% Equity * 100% 99,9% E1
LaSer Cofinoga France Full 100% 100% V1&D5
LaSer Loyalty France Full 100% 100% V1&D5
LaSer SA France Full 100% 100% V1&D5 Equity (3) 50,0% 50,0% D3
LaSer Symag France Full 100% 100% V1&D5
Leval 20 France Full 100% 100% Full 100% 100%
Loisirs Finance France Full (1) 51,0% 51,0% Full (1) 51,0% 51,0%
Magyar Cetelem Bank Zrt. Hungary Full 100% 100% Full 100% 100%
Nissan Finance Belgium NV Belgium S4 Full 100% 99,9% V1
Norrsken Finance France Full (1) 51,0% 51,0% Full (1) 51,0% 51,0%
Oney Magyarorszag Zrt Hungary Equity 40,0% 40,0% Equity 40,0% 40,0% E1
Prestacomer SA de CV Mexico S3
Prêts et Services SAS France Full (1) 100% 100% Full (1) 100% 100%
Projeo France Full (1) 51,0% 51,0% Full (1) 51,0% 51,0%
RCS Botswana Proprietary Ltd. Botswana Full 100% 100% E3
RCS Cards Proprietary Ltd. South Africa Full 100% 100% E3
RCS Collections Proprietary Ltd. South Africa Full 100% 100% E3
RCS Home Loans Proprietary Ltd. South Africa Full 100% 100% E3
RCS Investment Holdings Ltd. South Africa Full 100% 100% E3
RCS Investment Holdings Namibia Proprietary Ltd. Namibia Full 100% 100% E3
31 December 2014 31 December 2013
Changes in the scope of consolidation
Equity * Controlled but non material entities consolidated under the equity method as associates
New entries (E) in the scope of consolidation
E1 Passing qualifying thresholds as defined by the Group (see note 1.b) Miscellaneous
E2 Incorporation D1 Consolidation method change not related to fluctuation in voting or ownership interest
E3 Purchase, gain of control or significant influence D2 96 Construction-Sale Companies (Real Estate programmes) of which 86 fully and 10 equity method consolidated
E4 Entities newly consolidated in accordance with IFRS10 (see note 2) D3 Entities previously under proportional consolidation, which become consolidated under the equity method in accordance with IFRS 11 (see note 2.)
Removals (S) from the scope of consolidation D4
S1 Cessation of activity (including dissolution, liquidation)
S2 Disposal, loss of control or loss of significant influence D5
S3 Entities removed from the scope because < qualifying thresholds (see note 1.b)
S4 Merger, Universal transfer of assets and liabilities
Variance (V) in voting or ownership interest Prudential scope of consolidation
V1 Additional purchase (1)
V2 Partial disposal
V3 Dilution (2) Entites consolidated under the equity method for prudential purposes
V4 Increase in % (3) Jointly controlled entities under proportional consolidation for prudential purposes.
French subsidiaries whose supervision of prudential requirements is complied with through the supervision on a consolidated basis of BNP Paribas SA, in
accordance with article 7.1 of Regulation n°575/2013 of the European Parliament and of the Council.
The TEB group, previously proportionally consolidated, was consolidated under the equity method in accordance with IFRS 11, then fully consolidated as of 31
December 2013 (see note 2).
The LaSer group was consolidated under the equity method until 25 July 2014. Following the additional purchase of interest by BNP Paribas Group, the LaSer group
has been fully consolidated (see note 8.c.)
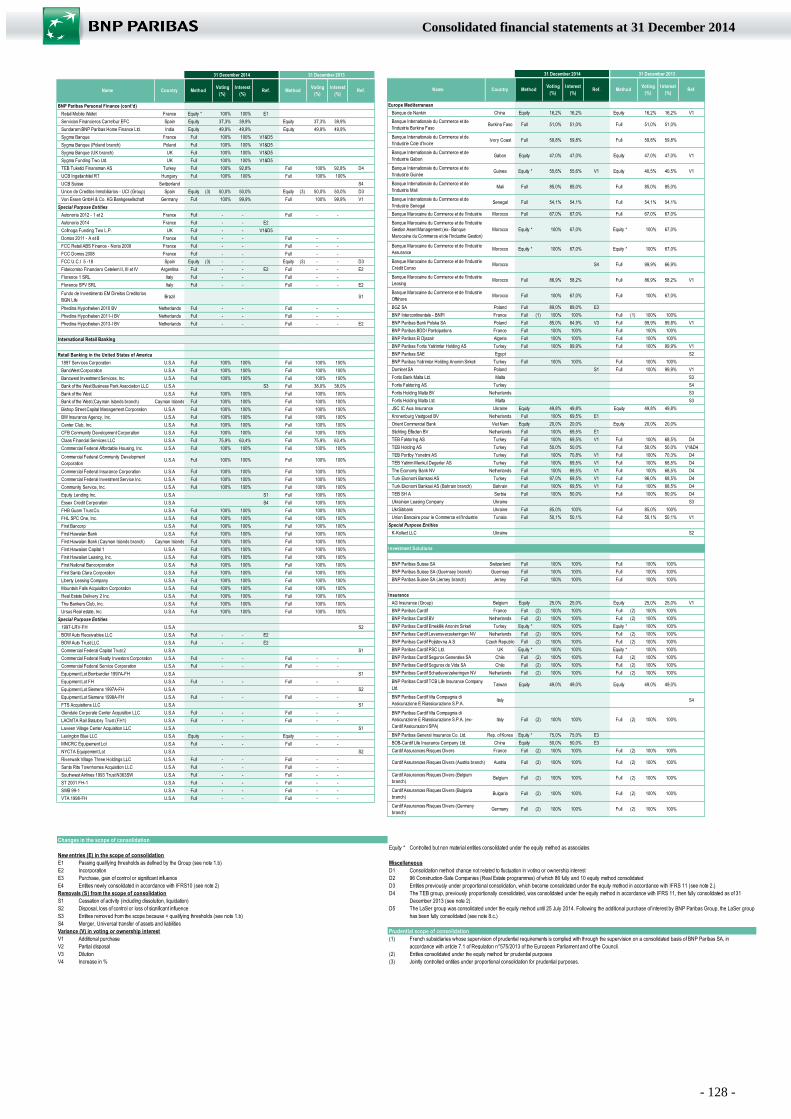
- 128 -
Consolidated financial statements at 31 December 2014
Name Country Method Voting
(%)
Interest
(%)Ref. Method
Voting
(%)
Interest
(%)Ref.
BNP Paribas Personal Finance (cont'd)
Retail Mobile Wallet France Equity * 100% 100% E1
Servicios Financieros Carrefour EFC Spain Equity 37,3% 39,9% Equity 37,3% 39,9%
Sundaram BNP Paribas Home Finance Ltd. India Equity 49,9% 49,9% Equity 49,9% 49,9%
Sygma Banque France Full 100% 100% V1&D5
Sygma Banque (Poland branch) Poland Full 100% 100% V1&D5
Sygma Banque (UK branch) UK Full 100% 100% V1&D5
Sygma Funding Two Ltd. UK Full 100% 100% V1&D5
TEB Tuketici Finansman AS Turkey Full 100% 92,8% Full 100% 92,8% D4
UCB Ingatlanhitel RT Hungary Full 100% 100% Full 100% 100%
UCB Suisse Switzerland S4
Union de Creditos Inmobiliarios - UCI (Group) Spain Equity (3) 50,0% 50,0% Equity (3) 50,0% 50,0% D3
Von Essen GmbH & Co. KG Bankgesellschaft Germany Full 100% 99,9% Full 100% 99,9% V1
Special Purpose Entities
Autonoria 2012 - 1 et 2 France Full - - Full - -
Autonoria 2014 France Full - - E2
Cofinoga Funding Two L.P. UK Full - - V1&D5
Domos 2011 - A et B France Full - - Full - -
FCC Retail ABS Finance - Noria 2009 France Full - - Full - -
FCC Domos 2008 France Full - - Full - -
FCC U.C.I 5 -18 Spain Equity (3) - - Equity (3) - - D3
Fideicomiso Financiero Cetelem II, III et IV Argentina Full - - E2 Full - - E2
Florence 1 SRL Italy Full - - Full - -
Florence SPV SRL Italy Full - - Full - - E2
Fundo de Investimento EM Direitos Creditorios
BGN LifeBrazil S1
Phedina Hypotheken 2010 BV Netherlands Full - - Full - -
Phedina Hypotheken 2011-I BV Netherlands Full - - Full - -
Phedina Hypotheken 2013-I BV Netherlands Full - - Full - - E2
International Retail Banking
Retail Banking in the United States of America
1897 Services Corporation U.S.A Full 100% 100% Full 100% 100%
BancWest Corporation U.S.A Full 100% 100% Full 100% 100%
Bancwest Investment Services, Inc. U.S.A Full 100% 100% Full 100% 100%
Bank of the West Business Park Association LLC U.S.A S3 Full 38,0% 38,0%
Bank of the West U.S.A Full 100% 100% Full 100% 100%
Bank of the West (Cayman Islands branch) Cayman Islands Full 100% 100% Full 100% 100%
Bishop Street Capital Management Corporation U.S.A Full 100% 100% Full 100% 100%
BW Insurance Agency, Inc. U.S.A Full 100% 100% Full 100% 100%
Center Club, Inc. U.S.A Full 100% 100% Full 100% 100%
CFB Community Development Corporation U.S.A Full 100% 100% Full 100% 100%
Claas Financial Services LLC U.S.A Full 75,9% 63,4% Full 75,9% 63,4%
Commercial Federal Affordable Housing, Inc. U.S.A Full 100% 100% Full 100% 100%
Commercial Federal Community Development
CorporationU.S.A Full 100% 100% Full 100% 100%
Commercial Federal Insurance Corporation U.S.A Full 100% 100% Full 100% 100%
Commercial Federal Investment Service Inc. U.S.A Full 100% 100% Full 100% 100%
Community Service, Inc. U.S.A Full 100% 100% Full 100% 100%
Equity Lending Inc. U.S.A S1 Full 100% 100%
Essex Credit Corporation U.S.A S4 Full 100% 100%
FHB Guam Trust Co. U.S.A Full 100% 100% Full 100% 100%
FHL SPC One, Inc. U.S.A Full 100% 100% Full 100% 100%
First Bancorp U.S.A Full 100% 100% Full 100% 100%
First Hawaïan Bank U.S.A Full 100% 100% Full 100% 100%
First Hawaïan Bank (Cayman Islands branch) Cayman Islands Full 100% 100% Full 100% 100%
First Hawaiian Capital 1 U.S.A Full 100% 100% Full 100% 100%
First Hawaiian Leasing, Inc. U.S.A Full 100% 100% Full 100% 100%
First National Bancorporation U.S.A Full 100% 100% Full 100% 100%
First Santa Clara Corporation U.S.A Full 100% 100% Full 100% 100%
Liberty Leasing Company U.S.A Full 100% 100% Full 100% 100%
Mountain Falls Acquisition Corporation U.S.A Full 100% 100% Full 100% 100%
Real Estate Delivery 2 Inc. U.S.A Full 100% 100% Full 100% 100%
The Bankers Club, Inc. U.S.A Full 100% 100% Full 100% 100%
Ursus Real estate, Inc. U.S.A Full 100% 100% Full 100% 100%
Special Purpose Entities
1997-LRV-FH U.S.A S2
BOW Auto Receivables LLC U.S.A Full - - E2
BOW Auto Trust LLC U.S.A Full - - E2
Commercial Federal Capital Trust 2 U.S.A S1
Commercial Federal Realty Investors Corporation U.S.A Full - - Full - -
Commercial Federal Service Corporation U.S.A Full - - Full - -
Equipment Lot Bombardier 1997A-FH U.S.A S1
Equipment Lot FH U.S.A Full - - Full - -
Equipment Lot Siemens 1997A-FH U.S.A S2
Equipment Lot Siemens 1998A-FH U.S.A Full - - Full - -
FTS Acquisitions LLC U.S.A S1
Glendale Corporate Center Acquisition LLC U.S.A Full - - Full - -
LACMTA Rail Statutory Trust (FH1) U.S.A Full - - Full - -
Laveen Village Center Acquisition LLC U.S.A S1
Lexington Blue LLC U.S.A Equity - - Equity - -
MNCRC Equipement Lot U.S.A Full - - Full - -
NYCTA Equipement Lot U.S.A S2
Riverwalk Village Three Holdings LLC U.S.A Full - - Full - -
Santa Rita Townhomes Acquisition LLC U.S.A Full - - Full - -
Southwest Airlines 1993 Trust N363SW U.S.A Full - - Full - -
ST 2001 FH-1 U.S.A Full - - Full - -
SWB 99-1 U.S.A Full - - Full - -
VTA 1998-FH U.S.A Full - - Full - -
31 December 201331 December 2014
Name Country Method Voting
(%)
Interest
(%)Ref. Method
Voting
(%)
Interest
(%)Ref.
Europe Mediterranean
Banque de Nankin China Equity 16,2% 16,2% Equity 16,2% 16,2% V1
Banque Internationale du Commerce et de
l'Industrie Burkina FasoBurkina Faso Full 51,0% 51,0% Full 51,0% 51,0%
Banque Internationale du Commerce et de
l'Industrie Cote d'IvoireIvory Coast Full 59,8% 59,8% Full 59,8% 59,8%
Banque Internationale du Commerce et de
l'Industrie GabonGabon Equity 47,0% 47,0% Equity 47,0% 47,0% V1
Banque Internationale du Commerce et de
l'Industrie GuinéeGuinea Equity * 55,6% 55,6% V1 Equity 40,5% 40,5% V1
Banque Internationale du Commerce et de
l'Industrie MaliMali Full 85,0% 85,0% Full 85,0% 85,0%
Banque Internationale du Commerce et de
l'Industrie SenegalSenegal Full 54,1% 54,1% Full 54,1% 54,1%
Banque Marocaine du Commerce et de l'Industrie Morocco Full 67,0% 67,0% Full 67,0% 67,0%
Banque Marocaine du Commerce et de l'Industrie
Gestion Asset Management (ex- Banque
Marocaine du Commerce et de l'Industrie Gestion)
Morocco Equity * 100% 67,0% Equity * 100% 67,0%
Banque Marocaine du Commerce et de l'Industrie
AssuranceMorocco Equity * 100% 67,0% Equity * 100% 67,0%
Banque Marocaine du Commerce et de l'Industrie
Crédit ConsoMorocco S4 Full 99,9% 66,9%
Banque Marocaine du Commerce et de l'Industrie
LeasingMorocco Full 86,9% 58,2% Full 86,9% 58,2% V1
Banque Marocaine du Commerce et de l'Industrie
OffshoreMorocco Full 100% 67,0% Full 100% 67,0%
BGZ SA Poland Full 89,0% 89,0% E3
BNP Intercontinentale - BNPI France Full (1) 100% 100% Full (1) 100% 100%
BNP Paribas Bank Polska SA Poland Full 85,0% 84,9% V3 Full 99,9% 99,8% V1
BNP Paribas BDDI Participations France Full 100% 100% Full 100% 100%
BNP Paribas El Djazair Algeria Full 100% 100% Full 100% 100%
BNP Paribas Fortis Yatirimlar Holding AS Turkey Full 100% 99,9% Full 100% 99,9% V1
BNP Paribas SAE Egypt S2
BNP Paribas Yatirimlar Holding Anonim Sirketi Turkey Full 100% 100% Full 100% 100%
Dominet SA Poland S1 Full 100% 99,9% V1
Fortis Bank Malta Ltd. Malta S3
Fortis Faktoring AS Turkey S4
Fortis Holding Malta BV Netherlands S3
Fortis Holding Malta Ltd. Malta S3
JSC IC Axa Insurance Ukraine Equity 49,8% 49,8% Equity 49,8% 49,8%
Kronenburg Vastgoed BV Netherlands Full 100% 69,5% E1
Orient Commercial Bank Viet Nam Equity 20,0% 20,0% Equity 20,0% 20,0%
Stichting Effecten BV Netherlands Full 100% 69,5% E1
TEB Faktoring AS Turkey Full 100% 69,5% V1 Full 100% 68,5% D4
TEB Holding AS Turkey Full 50,0% 50,0% Full 50,0% 50,0% V1&D4
TEB Portfoy Yonetimi AS Turkey Full 100% 70,8% V1 Full 100% 70,3% D4
TEB Yatirim Menkul Degerler AS Turkey Full 100% 69,5% V1 Full 100% 68,5% D4
The Economy Bank NV Netherlands Full 100% 69,5% V1 Full 100% 68,5% D4
Turk Ekonomi Bankasi AS Turkey Full 97,0% 69,5% V1 Full 96,0% 68,5% D4
Turk Ekonomi Bankasi AS (Bahrain branch) Bahrain Full 100% 69,5% V1 Full 100% 68,5% D4
TEB SH A Serbia Full 100% 50,0% Full 100% 50,0% D4
Ukrainian Leasing Company Ukraine S3
UkrSibbank Ukraine Full 85,0% 100% Full 85,0% 100%
Union Bancaire pour le Commerce et l'Industrie Tunisia Full 50,1% 50,1% Full 50,1% 50,1% V1
Special Purpose Entities
K-Kollect LLC Ukraine S2
Investment Solutions
BNP Paribas Suisse SA Switzerland Full 100% 100% Full 100% 100%
BNP Paribas Suisse SA (Guernsey branch) Guernsey Full 100% 100% Full 100% 100%
BNP Paribas Suisse SA (Jersey branch) Jersey Full 100% 100% Full 100% 100%
Insurance
AG Insurance (Group) Belgium Equity 25,0% 25,0% Equity 25,0% 25,0% V1
BNP Paribas Cardif France Full (2) 100% 100% Full (2) 100% 100%
BNP Paribas Cardif BV Netherlands Full (2) 100% 100% Full (2) 100% 100%
BNP Paribas Cardif Emeklilik Anonim Sirketi Turkey Equity * 100% 100% Equity * 100% 100%
BNP Paribas Cardif Levensverzekeringen NV Netherlands Full (2) 100% 100% Full (2) 100% 100%
BNP Paribas Cardif Pojistovna A.S Czech Republic Full (2) 100% 100% Full (2) 100% 100%
BNP Paribas Cardif PSC Ltd. UK Equity * 100% 100% Equity * 100% 100%
BNP Paribas Cardif Seguros Generales SA Chile Full (2) 100% 100% Full (2) 100% 100%
BNP Paribas Cardif Seguros de Vida SA Chile Full (2) 100% 100% Full (2) 100% 100%
BNP Paribas Cardif Schadeverzekeringen NV Netherlands Full (2) 100% 100% Full (2) 100% 100%
BNP Paribas Cardif TCB Life Insurance Company
Ltd.Taiwan Equity 49,0% 49,0% Equity 49,0% 49,0%
BNP Paribas Cardif Vita Compagnia di
Assicurazione E Riassicurazione S.P.A.Italy S4
BNP Paribas Cardif Vita Compagnia di
Assicurazione E Riassicurazione S.P.A. (ex-
Cardif Assicurazioni SPA)
Italy Full (2) 100% 100% Full (2) 100% 100%
BNP Paribas General Insurance Co. Ltd. Rep. of Korea Equity * 75,0% 75,0% E3
BOB-Cardif Life Insurance Company Ltd. China Equity 50,0% 50,0% E3
Cardif Assurances Risques Divers France Full (2) 100% 100% Full (2) 100% 100%
Cardif Assurances Risques Divers (Austria branch) Austria Full (2) 100% 100% Full (2) 100% 100%
Cardif Assurances Risques Divers (Belgium
branch)Belgium Full (2) 100% 100% Full (2) 100% 100%
Cardif Assurances Risques Divers (Bulgaria
branch)Bulgaria Full (2) 100% 100% Full (2) 100% 100%
Cardif Assurances Risques Divers (Germany
branch)Germany Full (2) 100% 100% Full (2) 100% 100%
31 December 2014 31 December 2013
Changes in the scope of consolidation
Equity * Controlled but non material entities consolidated under the equity method as associates
New entries (E) in the scope of consolidation
E1 Passing qualifying thresholds as defined by the Group (see note 1.b) Miscellaneous
E2 Incorporation D1 Consolidation method change not related to fluctuation in voting or ownership interest
E3 Purchase, gain of control or significant influence D2 96 Construction-Sale Companies (Real Estate programmes) of which 86 fully and 10 equity method consolidated
E4 Entities newly consolidated in accordance with IFRS10 (see note 2) D3 Entities previously under proportional consolidation, which become consolidated under the equity method in accordance with IFRS 11 (see note 2.)
Removals (S) from the scope of consolidation D4
S1 Cessation of activity (including dissolution, liquidation)
S2 Disposal, loss of control or loss of significant influence D5
S3 Entities removed from the scope because < qualifying thresholds (see note 1.b)
S4 Merger, Universal transfer of assets and liabilities
Variance (V) in voting or ownership interest Prudential scope of consolidation
V1 Additional purchase (1)
V2 Partial disposal
V3 Dilution (2) Entites consolidated under the equity method for prudential purposes
V4 Increase in % (3) Jointly controlled entities under proportional consolidation for prudential purposes.
French subsidiaries whose supervision of prudential requirements is complied with through the supervision on a consolidated basis of BNP Paribas SA, in
accordance with article 7.1 of Regulation n°575/2013 of the European Parliament and of the Council.
The TEB group, previously proportionally consolidated, was consolidated under the equity method in accordance with IFRS 11, then fully consolidated as of 31
December 2013 (see note 2).
The LaSer group was consolidated under the equity method until 25 July 2014. Following the additional purchase of interest by BNP Paribas Group, the LaSer group
has been fully consolidated (see note 8.c.)
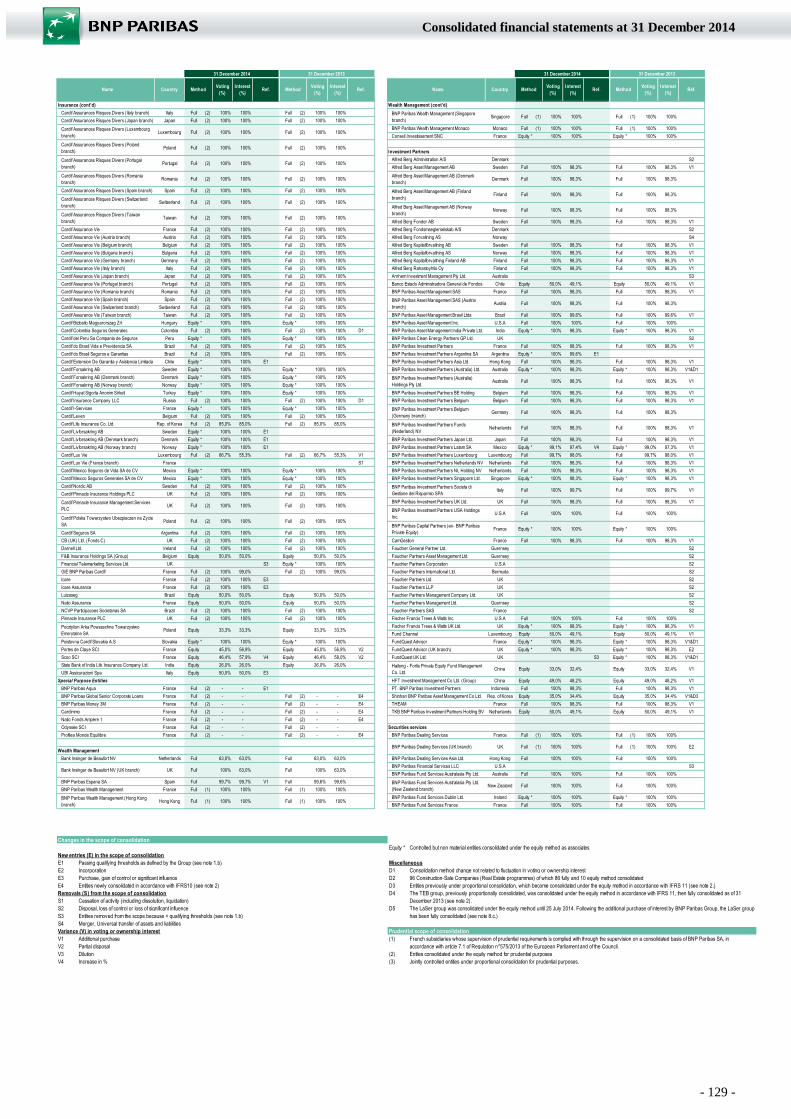
- 129 -
Consolidated financial statements at 31 December 2014
Name Country Method Voting
(%)
Interest
(%)Ref. Method
Voting
(%)
Interest
(%)Ref.
Insurance (cont'd)
Cardif Assurances Risques Divers (Italy branch) Italy Full (2) 100% 100% Full (2) 100% 100%
Cardif Assurances Risques Divers (Japan branch) Japan Full (2) 100% 100% Full (2) 100% 100%
Cardif Assurances Risques Divers (Luxembourg
branch)Luxembourg Full (2) 100% 100% Full (2) 100% 100%
Cardif Assurances Risques Divers (Poland
branch)Poland Full (2) 100% 100% Full (2) 100% 100%
Cardif Assurances Risques Divers (Portugal
branch)Portugal Full (2) 100% 100% Full (2) 100% 100%
Cardif Assurances Risques Divers (Romania
branch)Romania Full (2) 100% 100% Full (2) 100% 100%
Cardif Assurances Risques Divers (Spain branch) Spain Full (2) 100% 100% Full (2) 100% 100%
Cardif Assurances Risques Divers (Switzerland
branch)Switzerland Full (2) 100% 100% Full (2) 100% 100%
Cardif Assurances Risques Divers (Taiwan
branch)Taiwan Full (2) 100% 100% Full (2) 100% 100%
Cardif Assurance Vie France Full (2) 100% 100% Full (2) 100% 100%
Cardif Assurance Vie (Austria branch) Austria Full (2) 100% 100% Full (2) 100% 100%
Cardif Assurance Vie (Belgium branch) Belgium Full (2) 100% 100% Full (2) 100% 100%
Cardif Assurance Vie (Bulgaria branch) Bulgaria Full (2) 100% 100% Full (2) 100% 100%
Cardif Assurance Vie (Germany branch) Germany Full (2) 100% 100% Full (2) 100% 100%
Cardif Assurance Vie (Italy branch) Italy Full (2) 100% 100% Full (2) 100% 100%
Cardif Assurance Vie (Japan branch) Japan Full (2) 100% 100% Full (2) 100% 100%
Cardif Assurance Vie (Portugal branch) Portugal Full (2) 100% 100% Full (2) 100% 100%
Cardif Assurance Vie (Romania branch) Romania Full (2) 100% 100% Full (2) 100% 100%
Cardif Assurance Vie (Spain branch) Spain Full (2) 100% 100% Full (2) 100% 100%
Cardif Assurance Vie (Switzerland branch) Switzerland Full (2) 100% 100% Full (2) 100% 100%
Cardif Assurance Vie (Taiwan branch) Taiwan Full (2) 100% 100% Full (2) 100% 100%
Cardif Biztosito Magyarorszag Zrt Hungary Equity * 100% 100% Equity * 100% 100%
Cardif Colombia Seguros Generales Colombia Full (2) 100% 100% Full (2) 100% 100% D1
Cardif del Peru Sa Compania de Seguros Peru Equity * 100% 100% Equity * 100% 100%
Cardif do Brasil Vida e Previdencia SA Brazil Full (2) 100% 100% Full (2) 100% 100%
Cardif do Brasil Seguros e Garantias Brazil Full (2) 100% 100% Full (2) 100% 100%
Cardif Extension De Garantia y Asistencia Limitada Chile Equity * 100% 100% E1
Cardif Forsakring AB Sweden Equity * 100% 100% Equity * 100% 100%
Cardif Forsakring AB (Denmark branch) Denmark Equity * 100% 100% Equity * 100% 100%
Cardif Forsakring AB (Norway branch) Norway Equity * 100% 100% Equity * 100% 100%
Cardif Hayat Sigorta Anonim Sirketi Turkey Equity * 100% 100% Equity * 100% 100%
Cardif Insurance Company LLC Russia Full (2) 100% 100% Full (2) 100% 100% D1
Cardif I-Services France Equity * 100% 100% Equity * 100% 100%
Cardif Leven Belgium Full (2) 100% 100% Full (2) 100% 100%
Cardif Life Insurance Co. Ltd. Rep. of Korea Full (2) 85,0% 85,0% Full (2) 85,0% 85,0%
Cardif Livforsakring AB Sweden Equity * 100% 100% E1
Cardif Livforsakring AB (Denmark branch) Denmark Equity * 100% 100% E1
Cardif Livforsakring AB (Norway branch) Norway Equity * 100% 100% E1
Cardif Lux Vie Luxembourg Full (2) 66,7% 55,3% Full (2) 66,7% 55,3% V1
Cardif Lux Vie (France branch) France S1
Cardif Mexico Seguros de Vida SA de CV Mexico Equity * 100% 100% Equity * 100% 100%
Cardif Mexico Seguros Generales SA de CV Mexico Equity * 100% 100% Equity * 100% 100%
Cardif Nordic AB Sweden Full (2) 100% 100% Full (2) 100% 100%
Cardif Pinnacle Insurance Holdings PLC UK Full (2) 100% 100% Full (2) 100% 100%
Cardif Pinnacle Insurance Management Services
PLCUK Full (2) 100% 100% Full (2) 100% 100%
Cardif Polska Towarzystwo Ubezpieczen na Zycie
SAPoland Full (2) 100% 100% Full (2) 100% 100%
Cardif Seguros SA Argentina Full (2) 100% 100% Full (2) 100% 100%
CB (UK) Ltd. (Fonds C) UK Full (2) 100% 100% Full (2) 100% 100%
Darnell Ltd. Ireland Full (2) 100% 100% Full (2) 100% 100%
F&B Insurance Holdings SA (Group) Belgium Equity 50,0% 50,0% Equity 50,0% 50,0%
Financial Telemarketing Services Ltd. UK S3 Equity * 100% 100%
GIE BNP Paribas Cardif France Full (2) 100% 99,0% Full (2) 100% 99,0%
Icare France Full (2) 100% 100% E3
Icare Assurance France Full (2) 100% 100% E3
Luizaseg Brazil Equity 50,0% 50,0% Equity 50,0% 50,0%
Natio Assurance France Equity 50,0% 50,0% Equity 50,0% 50,0%
NCVP Participacoes Societarias SA Brazil Full (2) 100% 100% Full (2) 100% 100%
Pinnacle Insurance PLC UK Full (2) 100% 100% Full (2) 100% 100%
Pocztylion Arka Powszechne Towarzystwo
Emerytalne SAPoland Equity 33,3% 33,3% Equity 33,3% 33,3%
Poistovna Cardif Slovakia A.S Slovakia Equity * 100% 100% Equity * 100% 100%
Portes de Claye SCI France Equity 45,0% 56,9% Equity 45,0% 56,9% V2
Scoo SCI France Equity 46,4% 57,9% V4 Equity 46,4% 58,0% V2
State Bank of India Life Insurance Company Ltd. India Equity 26,0% 26,0% Equity 26,0% 26,0%
UBI Assicurazioni Spa Italy Equity 50,0% 50,0% E3
Special Purpose Entities
BNP Paribas Aqua France Full (2) - - E1
BNP Paribas Global Senior Corporate Loans France Full (2) - - Full (2) - - E4
BNP Paribas Money 3M France Full (2) - - Full (2) - - E4
Cardimmo France Full (2) - - Full (2) - - E4
Natio Fonds Ampère 1 France Full (2) - - Full (2) - - E4
Odyssée SCI France Full (2) - - Full (2) - -
Profilea Monde Equilibre France Full (2) - - Full (2) - - E4
Wealth Management
Bank Insinger de Beaufort NV Netherlands Full 63,0% 63,0% Full 63,0% 63,0%
Bank Insinger de Beaufort NV (UK branch) UK Full 100% 63,0% Full 100% 63,0%
BNP Paribas Espana SA Spain Full 99,7% 99,7% V1 Full 99,6% 99,6%
BNP Paribas Wealth Management France Full (1) 100% 100% Full (1) 100% 100%
BNP Paribas Wealth Management (Hong Kong
branch)Hong Kong Full (1) 100% 100% Full (1) 100% 100%
31 December 201331 December 2014
Name Country Method Voting
(%)
Interest
(%)Ref. Method
Voting
(%)
Interest
(%)Ref.
Wealth Management (cont'd)
BNP Paribas Wealth Management (Singapore
branch)Singapore Full (1) 100% 100% Full (1) 100% 100%
BNP Paribas Wealth Management Monaco Monaco Full (1) 100% 100% Full (1) 100% 100%
Conseil Investissement SNC France Equity * 100% 100% Equity * 100% 100%
Investment Partners
Alfred Berg Administration A/S Denmark S2
Alfred Berg Asset Management AB Sweden Full 100% 98,3% Full 100% 98,3% V1
Alfred Berg Asset Management AB (Denmark
branch)Denmark Full 100% 98,3% Full 100% 98,3%
Alfred Berg Asset Management AB (Finland
branch)Finland Full 100% 98,3% Full 100% 98,3%
Alfred Berg Asset Management AB (Norway
branch)Norway Full 100% 98,3% Full 100% 98,3%
Alfred Berg Fonder AB Sweden Full 100% 98,3% Full 100% 98,3% V1
Alfred Berg Fondsmaeglerselskab A/S Denmark S2
Alfred Berg Forvaltning AS Norway S4
Alfred Berg Kapitalförvaltning AB Sweden Full 100% 98,3% Full 100% 98,3% V1
Alfred Berg Kapitalforvaltning AS Norway Full 100% 98,3% Full 100% 98,3% V1
Alfred Berg Kapitalforvaltning Finland AB Finland Full 100% 98,3% Full 100% 98,3% V1
Alfred Berg Rahastoyhtio Oy Finland Full 100% 98,3% Full 100% 98,3% V1
Arnhem Investment Management Pty Ltd. Australia S3
Banco Estado Administradora General de Fondos Chile Equity 50,0% 49,1% Equity 50,0% 49,1% V1
BNP Paribas Asset Management SAS France Full 100% 98,3% Full 100% 98,3% V1
BNP Paribas Asset Management SAS (Austria
branch)Austria Full 100% 98,3% Full 100% 98,3%
BNP Paribas Asset Management Brasil Ltda Brazil Full 100% 99,6% Full 100% 99,6% V1
BNP Paribas Asset Management Inc. U.S.A Full 100% 100% Full 100% 100%
BNP Paribas Asset Management India Private Ltd. India Equity * 100% 98,3% Equity * 100% 98,3% V1
BNP Paribas Clean Energy Partners GP Ltd. UK S2
BNP Paribas Investment Partners France Full 100% 98,3% Full 100% 98,3% V1
BNP Paribas Investment Partners Argentina SA Argentina Equity * 100% 99,6% E1
BNP Paribas Investment Partners Asia Ltd. Hong Kong Full 100% 98,3% Full 100% 98,3% V1
BNP Paribas Investment Partners (Australia) Ltd. Australia Equity * 100% 98,3% Equity * 100% 98,3% V1&D1
BNP Paribas Investment Partners (Australia)
Holdings Pty Ltd.Australia Full 100% 98,3% Full 100% 98,3% V1
BNP Paribas Investment Partners BE Holding Belgium Full 100% 98,3% Full 100% 98,3% V1
BNP Paribas Investment Partners Belgium Belgium Full 100% 98,3% Full 100% 98,3% V1
BNP Paribas Investment Partners Belgium
(Germany branch)Germany Full 100% 98,3% Full 100% 98,3%
BNP Paribas Investment Partners Funds
(Nederland) NVNetherlands Full 100% 98,3% Full 100% 98,3% V1
BNP Paribas Investment Partners Japan Ltd. Japan Full 100% 98,3% Full 100% 98,3% V1
BNP Paribas Investment Partners Latam SA Mexico Equity * 99,1% 97,4% V4 Equity * 99,0% 97,3% V1
BNP Paribas Investment Partners Luxembourg Luxembourg Full 99,7% 98,0% Full 99,7% 98,0% V1
BNP Paribas Investment Partners Netherlands NV Netherlands Full 100% 98,3% Full 100% 98,3% V1
BNP Paribas Investment Partners NL Holding NV Netherlands Full 100% 98,3% Full 100% 98,3% V1
BNP Paribas Investment Partners Singapore Ltd. Singapore Equity * 100% 98,3% Equity * 100% 98,3% V1
BNP Paribas Investment Partners Societa di
Gestione del Risparmio SPAItaly Full 100% 99,7% Full 100% 99,7% V1
BNP Paribas Investment Partners UK Ltd. UK Full 100% 98,3% Full 100% 98,3% V1
BNP Paribas Investment Partners USA Holdings
Inc.U.S.A Full 100% 100% Full 100% 100%
BNP Paribas Capital Partners (ex- BNP Paribas
Private Equity)France Equity * 100% 100% Equity * 100% 100%
CamGestion France Full 100% 98,3% Full 100% 98,3% V1
Fauchier General Partner Ltd. Guernsey S2
Fauchier Partners Asset Management Ltd. Guernsey S2
Fauchier Partners Corporation U.S.A S2
Fauchier Partners International Ltd. Bermuda S2
Fauchier Partners Ltd. UK S2
Fauchier Partners LLP UK S2
Fauchier Partners Management Company Ltd. UK S2
Fauchier Partners Management Ltd. Guernsey S2
Fauchier Partners SAS France S2
Fischer Francis Trees & Watts Inc. U.S.A Full 100% 100% Full 100% 100%
Fischer Francis Trees & Watts UK Ltd. UK Equity * 100% 98,3% Equity * 100% 98,3% V1
Fund Channel Luxembourg Equity 50,0% 49,1% Equity 50,0% 49,1% V1
FundQuest Advisor France Equity * 100% 98,3% Equity * 100% 98,3% V1&D1
FundQuest Advisor (UK branch) UK Equity * 100% 98,3% Equity * 100% 98,3% E2
FundQuest UK Ltd. UK S3 Equity * 100% 98,3% V1&D1
Haitong - Fortis Private Equity Fund Management
Co. Ltd.China Equity 33,0% 32,4% Equity 33,0% 32,4% V1
HFT Investment Management Co Ltd. (Group) China Equity 49,0% 48,2% Equity 49,0% 48,2% V1
PT. BNP Paribas Investment Partners Indonesia Full 100% 98,3% Full 100% 98,3% V1
Shinhan BNP Paribas Asset Management Co Ltd. Rep. of Korea Equity 35,0% 34,4% Equity 35,0% 34,4% V1&D3
THEAM France Full 100% 98,3% Full 100% 98,3% V1
TKB BNP Paribas Investment Partners Holding BV Netherlands Equity 50,0% 49,1% Equity 50,0% 49,1% V1
Securities services
BNP Paribas Dealing Services France Full (1) 100% 100% Full (1) 100% 100%
BNP Paribas Dealing Services (UK branch) UK Full (1) 100% 100% Full (1) 100% 100% E2
BNP Paribas Dealing Services Asia Ltd. Hong Kong Full 100% 100% Full 100% 100%
BNP Paribas Financial Services LLC U.S.A S3
BNP Paribas Fund Services Australasia Pty Ltd. Australia Full 100% 100% Full 100% 100%
BNP Paribas Fund Services Australasia Pty Ltd.
(New Zealand branch)New Zealand Full 100% 100% Full 100% 100%
BNP Paribas Fund Services Dublin Ltd. Ireland Equity * 100% 100% Equity * 100% 100%
BNP Paribas Fund Services France France Full 100% 100% Full 100% 100%
31 December 2014 31 December 2013
Changes in the scope of consolidation
Equity * Controlled but non material entities consolidated under the equity method as associates
New entries (E) in the scope of consolidation
E1 Passing qualifying thresholds as defined by the Group (see note 1.b) Miscellaneous
E2 Incorporation D1 Consolidation method change not related to fluctuation in voting or ownership interest
E3 Purchase, gain of control or significant influence D2 96 Construction-Sale Companies (Real Estate programmes) of which 86 fully and 10 equity method consolidated
E4 Entities newly consolidated in accordance with IFRS10 (see note 2) D3 Entities previously under proportional consolidation, which become consolidated under the equity method in accordance with IFRS 11 (see note 2.)
Removals (S) from the scope of consolidation D4
S1 Cessation of activity (including dissolution, liquidation)
S2 Disposal, loss of control or loss of significant influence D5
S3 Entities removed from the scope because < qualifying thresholds (see note 1.b)
S4 Merger, Universal transfer of assets and liabilities
Variance (V) in voting or ownership interest Prudential scope of consolidation
V1 Additional purchase (1)
V2 Partial disposal
V3 Dilution (2) Entites consolidated under the equity method for prudential purposes
V4 Increase in % (3) Jointly controlled entities under proportional consolidation for prudential purposes.
French subsidiaries whose supervision of prudential requirements is complied with through the supervision on a consolidated basis of BNP Paribas SA, in
accordance with article 7.1 of Regulation n°575/2013 of the European Parliament and of the Council.
The TEB group, previously proportionally consolidated, was consolidated under the equity method in accordance with IFRS 11, then fully consolidated as of 31
December 2013 (see note 2).
The LaSer group was consolidated under the equity method until 25 July 2014. Following the additional purchase of interest by BNP Paribas Group, the LaSer group
has been fully consolidated (see note 8.c.)
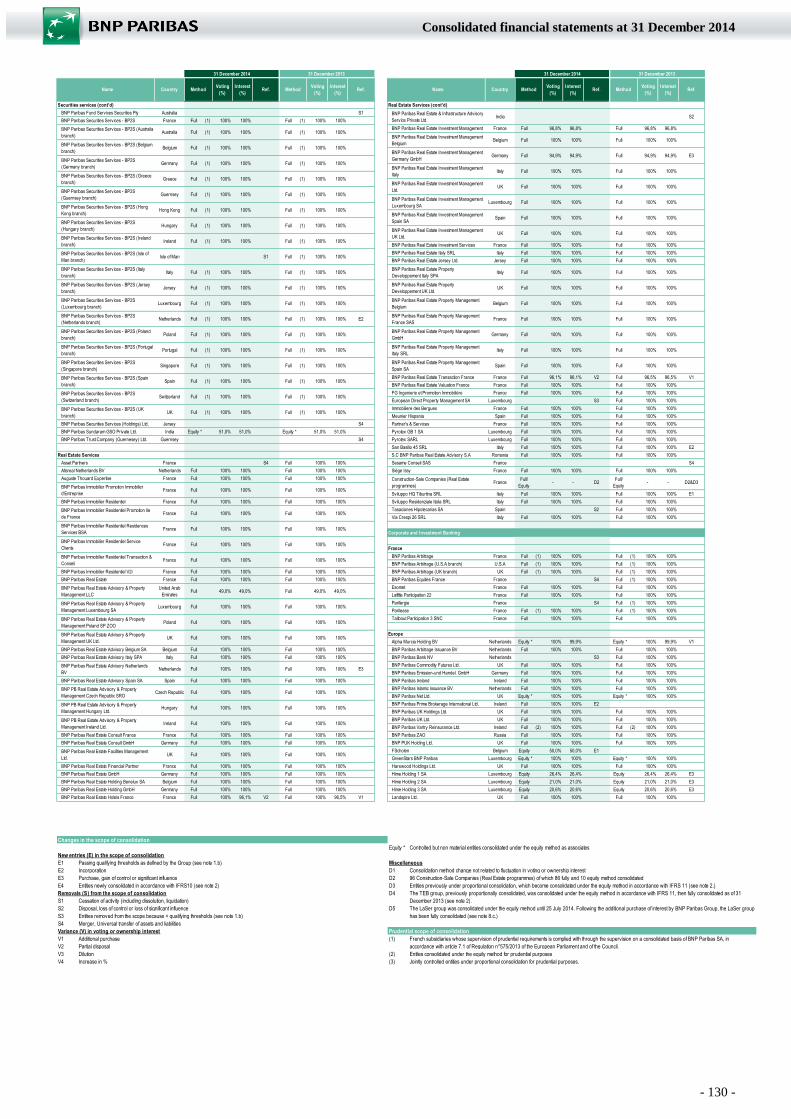
- 130 -
Consolidated financial statements at 31 December 2014
Name Country Method Voting
(%)
Interest
(%)Ref. Method
Voting
(%)
Interest
(%)Ref.
Securities services (cont'd)
BNP Paribas Fund Services Securities Pty Australia S1
BNP Paribas Securities Services - BP2S France Full (1) 100% 100% Full (1) 100% 100%
BNP Paribas Securities Services - BP2S (Australia
branch)Australia Full (1) 100% 100% Full (1) 100% 100%
BNP Paribas Securities Services - BP2S (Belgium
branch)Belgium Full (1) 100% 100% Full (1) 100% 100%
BNP Paribas Securities Services - BP2S
(Germany branch)Germany Full (1) 100% 100% Full (1) 100% 100%
BNP Paribas Securities Services - BP2S (Greece
branch)Greece Full (1) 100% 100% Full (1) 100% 100%
BNP Paribas Securities Services - BP2S
(Guernsey branch)Guernsey Full (1) 100% 100% Full (1) 100% 100%
BNP Paribas Securities Services - BP2S (Hong
Kong branch)Hong Kong Full (1) 100% 100% Full (1) 100% 100%
BNP Paribas Securities Services - BP2S
(Hungary branch)Hungary Full (1) 100% 100% Full (1) 100% 100%
BNP Paribas Securities Services - BP2S (Ireland
branch)Ireland Full (1) 100% 100% Full (1) 100% 100%
BNP Paribas Securities Services - BP2S (Isle of
Man branch)Isle of Man S1 Full (1) 100% 100%
BNP Paribas Securities Services - BP2S (Italy
branch)Italy Full (1) 100% 100% Full (1) 100% 100%
BNP Paribas Securities Services - BP2S (Jersey
branch)Jersey Full (1) 100% 100% Full (1) 100% 100%
BNP Paribas Securities Services - BP2S
(Luxembourg branch)Luxembourg Full (1) 100% 100% Full (1) 100% 100%
BNP Paribas Securities Services - BP2S
(Netherlands branch)Netherlands Full (1) 100% 100% Full (1) 100% 100% E2
BNP Paribas Securities Services - BP2S (Poland
branch)Poland Full (1) 100% 100% Full (1) 100% 100%
BNP Paribas Securities Services - BP2S (Portugal
branch)Portugal Full (1) 100% 100% Full (1) 100% 100%
BNP Paribas Securities Services - BP2S
(Singapore branch)Singapore Full (1) 100% 100% Full (1) 100% 100%
BNP Paribas Securities Services - BP2S (Spain
branch)Spain Full (1) 100% 100% Full (1) 100% 100%
BNP Paribas Securities Services - BP2S
(Switzerland branch)Switzerland Full (1) 100% 100% Full (1) 100% 100%
BNP Paribas Securities Services - BP2S (UK
branch)UK Full (1) 100% 100% Full (1) 100% 100%
BNP Paribas Securities Services (Holdings) Ltd. Jersey S4
BNP Paribas Sundaram GSO Private Ltd. India Equity * 51,0% 51,0% Equity * 51,0% 51,0%
BNP Paribas Trust Company (Guernesey) Ltd. Guernsey S4
Real Estate Services
Asset Partners France S4 Full 100% 100%
Atisreal Netherlands BV Netherlands Full 100% 100% Full 100% 100%
Auguste Thouard Expertise France Full 100% 100% Full 100% 100%
BNP Paribas Immobilier Promotion Immobilier
d'EntrepriseFrance Full 100% 100% Full 100% 100%
BNP Paribas Immobilier Residentiel France Full 100% 100% Full 100% 100%
BNP Paribas Immobilier Residentiel Promotion Ile
de FranceFrance Full 100% 100% Full 100% 100%
BNP Paribas Immobilier Residentiel Residences
Services BSAFrance Full 100% 100% Full 100% 100%
BNP Paribas Immobilier Residentiel Service
ClientsFrance Full 100% 100% Full 100% 100%
BNP Paribas Immobilier Residentiel Transaction &
ConseilFrance Full 100% 100% Full 100% 100%
BNP Paribas Immobilier Residentiel V2i France Full 100% 100% Full 100% 100%
BNP Paribas Real Estate France Full 100% 100% Full 100% 100%
BNP Paribas Real Estate Advisory & Property
Management LLC
United Arab
EmiratesFull 49,0% 49,0% Full 49,0% 49,0%
BNP Paribas Real Estate Advisory & Property
Management Luxembourg SALuxembourg Full 100% 100% Full 100% 100%
BNP Paribas Real Estate Advisory & Property
Management Poland SP ZOOPoland Full 100% 100% Full 100% 100%
BNP Paribas Real Estate Advisory & Property
Management UK Ltd.UK Full 100% 100% Full 100% 100%
BNP Paribas Real Estate Advisory Belgium SA Belgium Full 100% 100% Full 100% 100%
BNP Paribas Real Estate Advisory Italy SPA Italy Full 100% 100% Full 100% 100%
BNP Paribas Real Estate Advisory Netherlands
BVNetherlands Full 100% 100% Full 100% 100% E3
BNP Paribas Real Estate Advisory Spain SA Spain Full 100% 100% Full 100% 100%
BNP PB Real Estate Advisory & Property
Management Czech Republic SROCzech Republic Full 100% 100% Full 100% 100%
BNP PB Real Estate Advisory & Property
Management Hungary Ltd.Hungary Full 100% 100% Full 100% 100%
BNP PB Real Estate Advisory & Property
Management Ireland Ltd.Ireland Full 100% 100% Full 100% 100%
BNP Paribas Real Estate Consult France France Full 100% 100% Full 100% 100%
BNP Paribas Real Estate Consult GmbH Germany Full 100% 100% Full 100% 100%
BNP Paribas Real Estate Facilities Management
Ltd.UK Full 100% 100% Full 100% 100%
BNP Paribas Real Estate Financial Partner France Full 100% 100% Full 100% 100%
BNP Paribas Real Estate GmbH Germany Full 100% 100% Full 100% 100%
BNP Paribas Real Estate Holding Benelux SA Belgium Full 100% 100% Full 100% 100%
BNP Paribas Real Estate Holding GmbH Germany Full 100% 100% Full 100% 100%
BNP Paribas Real Estate Hotels France France Full 100% 96,1% V2 Full 100% 96,5% V1
31 December 201331 December 2014
Name Country Method Voting
(%)
Interest
(%)Ref. Method
Voting
(%)
Interest
(%)Ref.
Real Estate Services (cont'd)
BNP Paribas Real Estate & Infrastructure Advisory
Service Private Ltd.India S2
BNP Paribas Real Estate Investment Management France Full 96,8% 96,8% Full 96,8% 96,8%
BNP Paribas Real Estate Investment Management
BelgiumBelgium Full 100% 100% Full 100% 100%
BNP Paribas Real Estate Investment Management
Germany GmbHGermany Full 94,9% 94,9% Full 94,9% 94,9% E3
BNP Paribas Real Estate Investment Management
ItalyItaly Full 100% 100% Full 100% 100%
BNP Paribas Real Estate Investment Management
Ltd.UK Full 100% 100% Full 100% 100%
BNP Paribas Real Estate Investment Management
Luxembourg SALuxembourg Full 100% 100% Full 100% 100%
BNP Paribas Real Estate Investment Management
Spain SASpain Full 100% 100% Full 100% 100%
BNP Paribas Real Estate Investment Management
UK Ltd.UK Full 100% 100% Full 100% 100%
BNP Paribas Real Estate Investment Services France Full 100% 100% Full 100% 100%
BNP Paribas Real Estate Italy SRL Italy Full 100% 100% Full 100% 100%
BNP Paribas Real Estate Jersey Ltd. Jersey Full 100% 100% Full 100% 100%
BNP Paribas Real Estate Property
Developpement Italy SPAItaly Full 100% 100% Full 100% 100%
BNP Paribas Real Estate Property
Developpement UK Ltd.UK Full 100% 100% Full 100% 100%
BNP Paribas Real Estate Property Management
Belgium Belgium Full 100% 100% Full 100% 100%
BNP Paribas Real Estate Property Management
France SASFrance Full 100% 100% Full 100% 100%
BNP Paribas Real Estate Property Management
GmbHGermany Full 100% 100% Full 100% 100%
BNP Paribas Real Estate Property Management
Italy SRLItaly Full 100% 100% Full 100% 100%
BNP Paribas Real Estate Property Management
Spain SASpain Full 100% 100% Full 100% 100%
BNP Paribas Real Estate Transaction France France Full 96,1% 96,1% V2 Full 96,5% 96,5% V1
BNP Paribas Real Estate Valuation France France Full 100% 100% Full 100% 100%
FG Ingenierie et Promotion Immobilière France Full 100% 100% Full 100% 100%
European Direct Property Management SA Luxembourg S3 Full 100% 100%
Immobiliere des Bergues France Full 100% 100% Full 100% 100%
Meunier Hispania Spain Full 100% 100% Full 100% 100%
Partner's & Services France Full 100% 100% Full 100% 100%
Pyrotex GB 1 SA Luxembourg Full 100% 100% Full 100% 100%
Pyrotex SARL Luxembourg Full 100% 100% Full 100% 100%
San Basilio 45 SRL Italy Full 100% 100% Full 100% 100% E2
S.C BNP Paribas Real Estate Advisory S.A Romania Full 100% 100% Full 100% 100%
Sesame Conseil SAS France S4
Siège Issy France Full 100% 100% Full 100% 100%
Construction-Sale Companies (Real Estate
programmes)France
Full/
Equity- - D2
Full/
Equity- - D2&D3
Sviluppo HQ Tiburtina SRL Italy Full 100% 100% Full 100% 100% E1
Sviluppo Residenziale Italia SRL Italy Full 100% 100% Full 100% 100%
Tasaciones Hipotecarias SA Spain S2 Full 100% 100%
Via Crespi 26 SRL Italy Full 100% 100% Full 100% 100%
Corporate and Investment Banking
France
BNP Paribas Arbitrage France Full (1) 100% 100% Full (1) 100% 100%
BNP Paribas Arbitrage (U.S.A branch) U.S.A Full (1) 100% 100% Full (1) 100% 100%
BNP Paribas Arbitrage (UK branch) UK Full (1) 100% 100% Full (1) 100% 100%
BNP Paribas Equities France France S4 Full (1) 100% 100%
Esomet France Full 100% 100% Full 100% 100%
Laffitte Participation 22 France Full 100% 100% Full 100% 100%
Parifergie France S4 Full (1) 100% 100%
Parilease France Full (1) 100% 100% Full (1) 100% 100%
Taitbout Participation 3 SNC France Full 100% 100% Full 100% 100%
Europe
Alpha Murcia Holding BV Netherlands Equity * 100% 99,9% Equity * 100% 99,9% V1
BNP Paribas Arbitrage Issuance BV Netherlands Full 100% 100% Full 100% 100%
BNP Paribas Bank NV Netherlands S3 Full 100% 100%
BNP Paribas Commodity Futures Ltd. UK Full 100% 100% Full 100% 100%
BNP Paribas Emission-und Handel. GmbH Germany Full 100% 100% Full 100% 100%
BNP Paribas Ireland Ireland Full 100% 100% Full 100% 100%
BNP Paribas Islamic Issuance BV Netherlands Full 100% 100% Full 100% 100%
BNP Paribas Net Ltd. UK Equity * 100% 100% Equity * 100% 100%
BNP Paribas Prime Brokerage International Ltd. Ireland Full 100% 100% E2
BNP Paribas UK Holdings Ltd. UK Full 100% 100% Full 100% 100%
BNP Paribas UK Ltd. UK Full 100% 100% Full 100% 100%
BNP Paribas Vartry Reinsurance Ltd. Ireland Full (2) 100% 100% Full (2) 100% 100%
BNP Paribas ZAO Russia Full 100% 100% Full 100% 100%
BNP PUK Holding Ltd. UK Full 100% 100% Full 100% 100%
FScholen Belgium Equity 50,0% 50,0% E1
GreenStars BNP Paribas Luxembourg Equity * 100% 100% Equity * 100% 100%
Harewood Holdings Ltd. UK Full 100% 100% Full 100% 100%
Hime Holding 1 SA Luxembourg Equity 26,4% 26,4% Equity 26,4% 26,4% E3
Hime Holding 2 SA Luxembourg Equity 21,0% 21,0% Equity 21,0% 21,0% E3
Hime Holding 3 SA Luxembourg Equity 20,6% 20,6% Equity 20,6% 20,6% E3
Landspire Ltd. UK Full 100% 100% Full 100% 100%
31 December 2014 31 December 2013
Changes in the scope of consolidation
Equity * Controlled but non material entities consolidated under the equity method as associates
New entries (E) in the scope of consolidation
E1 Passing qualifying thresholds as defined by the Group (see note 1.b) Miscellaneous
E2 Incorporation D1 Consolidation method change not related to fluctuation in voting or ownership interest
E3 Purchase, gain of control or significant influence D2 96 Construction-Sale Companies (Real Estate programmes) of which 86 fully and 10 equity method consolidated
E4 Entities newly consolidated in accordance with IFRS10 (see note 2) D3 Entities previously under proportional consolidation, which become consolidated under the equity method in accordance with IFRS 11 (see note 2.)
Removals (S) from the scope of consolidation D4
S1 Cessation of activity (including dissolution, liquidation)
S2 Disposal, loss of control or loss of significant influence D5
S3 Entities removed from the scope because < qualifying thresholds (see note 1.b)
S4 Merger, Universal transfer of assets and liabilities
Variance (V) in voting or ownership interest Prudential scope of consolidation
V1 Additional purchase (1)
V2 Partial disposal
V3 Dilution (2) Entites consolidated under the equity method for prudential purposes
V4 Increase in % (3) Jointly controlled entities under proportional consolidation for prudential purposes.
French subsidiaries whose supervision of prudential requirements is complied with through the supervision on a consolidated basis of BNP Paribas SA, in
accordance with article 7.1 of Regulation n°575/2013 of the European Parliament and of the Council.
The TEB group, previously proportionally consolidated, was consolidated under the equity method in accordance with IFRS 11, then fully consolidated as of 31
December 2013 (see note 2).
The LaSer group was consolidated under the equity method until 25 July 2014. Following the additional purchase of interest by BNP Paribas Group, the LaSer group
has been fully consolidated (see note 8.c.)
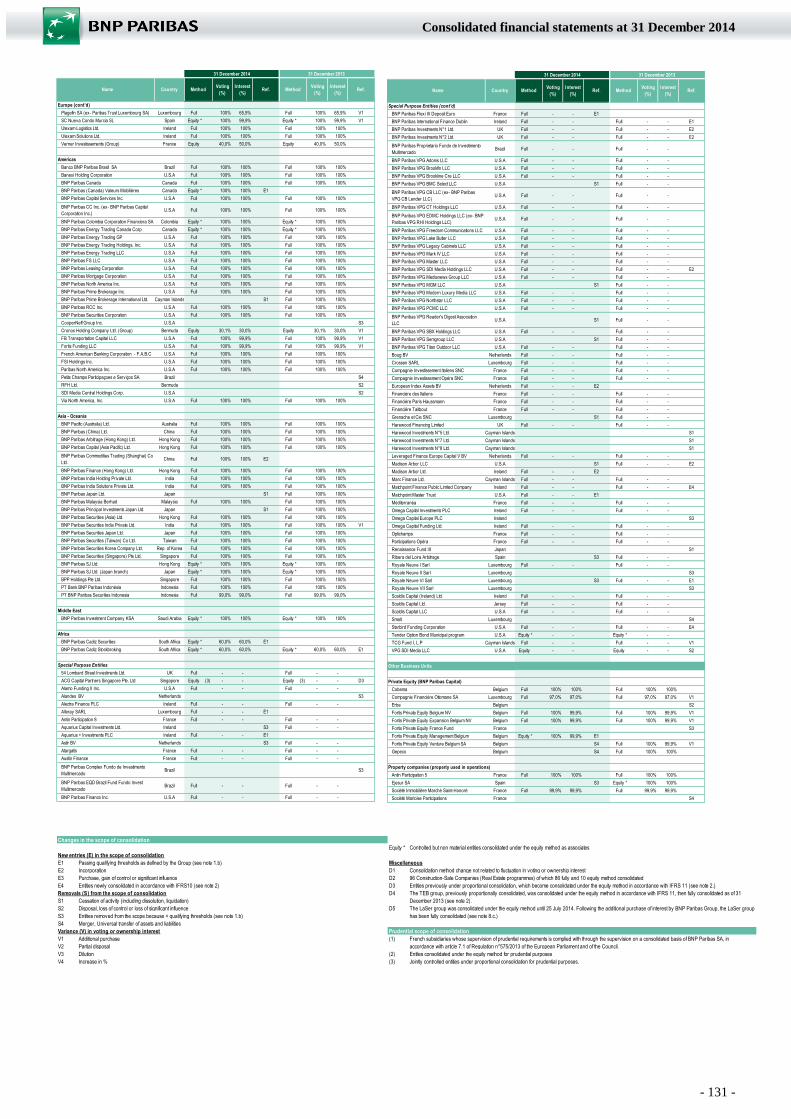
- 131 -
Consolidated financial statements at 31 December 2014
Name Country Method Voting
(%)
Interest
(%)Ref. Method
Voting
(%)
Interest
(%)Ref.
Europe (cont'd)
Plagefin SA (ex- Paribas Trust Luxembourg SA) Luxembourg Full 100% 65,9% Full 100% 65,9% V1
SC Nueva Condo Murcia SL Spain Equity * 100% 99,9% Equity * 100% 99,9% V1
Utexam Logistics Ltd. Ireland Full 100% 100% Full 100% 100%
Utexam Solutions Ltd. Ireland Full 100% 100% Full 100% 100%
Verner Investissements (Group) France Equity 40,0% 50,0% Equity 40,0% 50,0%
Americas
Banco BNP Paribas Brasil SA Brazil Full 100% 100% Full 100% 100%
Banexi Holding Corporation U.S.A Full 100% 100% Full 100% 100%
BNP Paribas Canada Canada Full 100% 100% Full 100% 100%
BNP Paribas (Canada) Valeurs Mobilières Canada Equity * 100% 100% E1
BNP Paribas Capital Services Inc. U.S.A Full 100% 100% Full 100% 100%
BNP Paribas CC Inc. (ex- BNP Paribas Capital
Corporation Inc.)U.S.A Full 100% 100% Full 100% 100%
BNP Paribas Colombia Corporation Financiera SA Colombia Equity * 100% 100% Equity * 100% 100%
BNP Paribas Energy Trading Canada Corp Canada Equity * 100% 100% Equity * 100% 100%
BNP Paribas Energy Trading GP U.S.A Full 100% 100% Full 100% 100%
BNP Paribas Energy Trading Holdings, Inc. U.S.A Full 100% 100% Full 100% 100%
BNP Paribas Energy Trading LLC U.S.A Full 100% 100% Full 100% 100%
BNP Paribas FS LLC U.S.A Full 100% 100% Full 100% 100%
BNP Paribas Leasing Corporation U.S.A Full 100% 100% Full 100% 100%
BNP Paribas Mortgage Corporation U.S.A Full 100% 100% Full 100% 100%
BNP Paribas North America Inc. U.S.A Full 100% 100% Full 100% 100%
BNP Paribas Prime Brokerage Inc. U.S.A Full 100% 100% Full 100% 100%
BNP Paribas Prime Brokerage International Ltd. Cayman Islands S1 Full 100% 100%
BNP Paribas RCC Inc. U.S.A Full 100% 100% Full 100% 100%
BNP Paribas Securities Corporation U.S.A Full 100% 100% Full 100% 100%
CooperNeff Group Inc. U.S.A S3
Cronos Holding Company Ltd. (Group) Bermuda Equity 30,1% 30,0% Equity 30,1% 30,0% V1
FB Transportation Capital LLC U.S.A Full 100% 99,9% Full 100% 99,9% V1
Fortis Funding LLC U.S.A Full 100% 99,9% Full 100% 99,9% V1
French American Banking Corporation - F.A.B.C U.S.A Full 100% 100% Full 100% 100%
FSI Holdings Inc. U.S.A Full 100% 100% Full 100% 100%
Paribas North America Inc. U.S.A Full 100% 100% Full 100% 100%
Petits Champs Participaçoes e Serviços SA Brazil S4
RFH Ltd. Bermuda S2
SDI Media Central Holdings Corp. U.S.A S2
Via North America, Inc. U.S.A Full 100% 100% Full 100% 100%
Asia - Oceania
BNP Pacific (Australia) Ltd. Australia Full 100% 100% Full 100% 100%
BNP Paribas (China) Ltd. China Full 100% 100% Full 100% 100%
BNP Paribas Arbitrage (Hong Kong) Ltd. Hong Kong Full 100% 100% Full 100% 100%
BNP Paribas Capital (Asia Pacific) Ltd. Hong Kong Full 100% 100% Full 100% 100%
BNP Paribas Commodities Trading (Shanghai) Co
Ltd. China Full 100% 100% E2
BNP Paribas Finance (Hong Kong) Ltd. Hong Kong Full 100% 100% Full 100% 100%
BNP Paribas India Holding Private Ltd. India Full 100% 100% Full 100% 100%
BNP Paribas India Solutions Private Ltd. India Full 100% 100% Full 100% 100%
BNP Paribas Japan Ltd. Japan S1 Full 100% 100%
BNP Paribas Malaysia Berhad Malaysia Full 100% 100% Full 100% 100%
BNP Paribas Principal Investments Japan Ltd. Japan S1 Full 100% 100%
BNP Paribas Securities (Asia) Ltd. Hong Kong Full 100% 100% Full 100% 100%
BNP Paribas Securities India Private Ltd. India Full 100% 100% Full 100% 100% V1
BNP Paribas Securities Japan Ltd. Japan Full 100% 100% Full 100% 100%
BNP Paribas Securities (Taiwan) Co Ltd. Taiwan Full 100% 100% Full 100% 100%
BNP Paribas Securities Korea Company Ltd. Rep. of Korea Full 100% 100% Full 100% 100%
BNP Paribas Securities (Singapore) Pte Ltd. Singapore Full 100% 100% Full 100% 100%
BNP Paribas SJ Ltd. Hong Kong Equity * 100% 100% Equity * 100% 100%
BNP Paribas SJ Ltd. (Japan branch) Japan Equity * 100% 100% Equity * 100% 100%
BPP Holdings Pte Ltd. Singapore Full 100% 100% Full 100% 100%
PT Bank BNP Paribas Indonésia Indonesia Full 100% 100% Full 100% 100%
PT BNP Paribas Securities Indonesia Indonesia Full 99,0% 99,0% Full 99,0% 99,0%
Middle East
BNP Paribas Investment Company KSA Saudi Arabia Equity * 100% 100% Equity * 100% 100%
Africa
BNP Paribas Cadiz Securities South Africa Equity * 60,0% 60,0% E1
BNP Paribas Cadiz Stockbroking South Africa Equity * 60,0% 60,0% Equity * 60,0% 60,0% E1
Special Purpose Entities
54 Lombard Street Investments Ltd. UK Full - - Full - -
ACG Capital Partners Singapore Pte. Ltd Singapore Equity (3) - - Equity (3) - - D3
Alamo Funding II Inc. U.S.A Full - - Full - -
Alandes BV Netherlands S3
Alectra Finance PLC Ireland Full - - Full - -
Alleray SARL Luxembourg Full - - E1
Antin Participation 8 France Full - - Full - -
Aquarius Capital Investments Ltd. Ireland S3 Full - -
Aquarius + Investments PLC Ireland Full - - E1
Astir BV Netherlands S3 Full - -
Atargatis France Full - - Full - -
Austin Finance France Full - - Full - -
BNP Paribas Complex Fundo de Investimento
MultimercadoBrazil S3
BNP Paribas EQD Brazil Fund Fundo Invest
MultimercadoBrazil Full - - Full - -
BNP Paribas Finance Inc. U.S.A Full - - Full - -
31 December 201331 December 2014
Name Country Method Voting
(%)
Interest
(%)Ref. Method
Voting
(%)
Interest
(%)Ref.
Special Purpose Entities (cont'd)
BNP Paribas Flexi III Deposit Euro France Full - - E1
BNP Paribas International Finance Dublin Ireland Full - - Full - - E1
BNP Paribas Investments N°1 Ltd. UK Full - - Full - - E2
BNP Paribas Investments N°2 Ltd. UK Full - - Full - - E2
BNP Paribas Proprietario Fundo de Investimento
Multimercado Brazil Full - - Full - -
BNP Paribas VPG Adonis LLC U.S.A Full - - Full - -
BNP Paribas VPG Brookfin LLC U.S.A Full - - Full - -
BNP Paribas VPG Brookline Cre LLC U.S.A Full - - Full - -
BNP Paribas VPG BMC Select LLC U.S.A S1 Full - -
BNP Paribas VPG CB LLC (ex- BNP Paribas
VPG CB Lender LLC)U.S.A Full - - Full - -
BNP Paribas VPG CT Holdings LLC U.S.A Full - - Full - -
BNP Paribas VPG EDMC Holdings LLC (ex- BNP
Paribas VPG RHI Holdings LLC)U.S.A Full - - Full - -
BNP Paribas VPG Freedom Communications LLC U.S.A Full - - Full - -
BNP Paribas VPG Lake Butler LLC U.S.A Full - - Full - -
BNP Paribas VPG Legacy Cabinets LLC U.S.A Full - - Full - -
BNP Paribas VPG Mark IV LLC U.S.A Full - - Full - -
BNP Paribas VPG Master LLC U.S.A Full - - Full - -
BNP Paribas VPG SDI Media Holdings LLC U.S.A Full - - Full - - E2
BNP Paribas VPG Medianews Group LLC U.S.A Full - - Full - -
BNP Paribas VPG MGM LLC U.S.A S1 Full - -
BNP Paribas VPG Modern Luxury Media LLC U.S.A Full - - Full - -
BNP Paribas VPG Northstar LLC U.S.A Full - - Full - -
BNP Paribas VPG PCMC LLC U.S.A Full - - Full - -
BNP Paribas VPG Reader's Digest Association
LLCU.S.A S1 Full - -
BNP Paribas VPG SBX Holdings LLC U.S.A Full - - Full - -
BNP Paribas VPG Semgroup LLC U.S.A S1 Full - -
BNP Paribas VPG Titan Outdoor LLC U.S.A Full - - Full - -
Boug BV Netherlands Full - - Full - -
Crossen SARL Luxembourg Full - - Full - -
Compagnie Investissement Italiens SNC France Full - - Full - -
Compagnie Investissement Opéra SNC France Full - - Full - -
European Index Assets BV Netherlands Full - - E2
Financière des Italiens France Full - - Full - -
Financière Paris Haussmann France Full - - Full - -
Financière Taitbout France Full - - Full - -
Grenache et Cie SNC Luxembourg S1 Full - -
Harewood Financing Limited UK Full - - Full - -
Harewood Investments N°5 Ltd. Cayman Islands S1
Harewood Investments N°7 Ltd. Cayman Islands S1
Harewood Investments N°8 Ltd. Cayman Islands S1
Leveraged Finance Europe Capital V BV Netherlands Full - - Full - -
Madison Arbor LLC U.S.A S1 Full - - E2
Madison Arbor Ltd. Ireland Full - - E2
Marc Finance Ltd. Cayman Islands Full - - Full - -
Matchpoint Finance Public Limited Company Ireland Full - - Full - - E4
Matchpoint Master Trust U.S.A Full - - E1
Méditerranéa France Full - - Full - -
Omega Capital Investments PLC Ireland Full - - Full - -
Omega Capital Europe PLC Ireland S3
Omega Capital Funding Ltd. Ireland Full - - Full - -
Optichamps France Full - - Full - -
Participations Opéra France Full - - Full - -
Renaissance Fund III Japan S1
Ribera del Loira Arbitrage Spain S3 Full - -
Royale Neuve I Sarl Luxembourg Full - - Full - -
Royale Neuve II Sarl Luxembourg S3
Royale Neuve VI Sarl Luxembourg S3 Full - - E1
Royale Neuve VII Sarl Luxembourg S3
Scaldis Capital (Ireland) Ltd. Ireland Full - - Full - -
Scaldis Capital Ltd. Jersey Full - - Full - -
Scaldis Capital LLC U.S.A Full - - Full - -
Smalt Luxembourg S4
Starbird Funding Corporation U.S.A Full - - Full - - E4
Tender Option Bond Municipal program U.S.A Equity * - - Equity * - -
TCG Fund I, L.P Cayman Islands Full - - Full - - V1
VPG SDI Media LLC U.S.A Equity - - Equity - - S2
Other Business Units
Private Equity (BNP Paribas Capital)
Cobema Belgium Full 100% 100% Full 100% 100%
Compagnie Financière Ottomane SA Luxembourg Full 97,0% 97,0% Full 97,0% 97,0% V1
Erbe Belgium S2
Fortis Private Equity Belgium NV Belgium Full 100% 99,9% Full 100% 99,9% V1
Fortis Private Equity Expansion Belgium NV Belgium Full 100% 99,9% Full 100% 99,9% V1
Fortis Private Equity France Fund France S3
Fortis Private Equity Management Belgium Belgium Equity * 100% 99,9% E1
Fortis Private Equity Venture Belgium SA Belgium S4 Full 100% 99,9% V1
Gepeco Belgium S4 Full 100% 100%
Property companies (property used in operations)
Antin Participation 5 France Full 100% 100% Full 100% 100%
Ejesur SA Spain S3 Equity * 100% 100%
Société Immobilière Marché Saint-Honoré France Full 99,9% 99,9% Full 99,9% 99,9%
Société Marloise Participations France S4
31 December 2014 31 December 2013
Changes in the scope of consolidation
Equity * Controlled but non material entities consolidated under the equity method as associates
New entries (E) in the scope of consolidation
E1 Passing qualifying thresholds as defined by the Group (see note 1.b) Miscellaneous
E2 Incorporation D1 Consolidation method change not related to fluctuation in voting or ownership interest
E3 Purchase, gain of control or significant influence D2 96 Construction-Sale Companies (Real Estate programmes) of which 86 fully and 10 equity method consolidated
E4 Entities newly consolidated in accordance with IFRS10 (see note 2) D3 Entities previously under proportional consolidation, which become consolidated under the equity method in accordance with IFRS 11 (see note 2.)
Removals (S) from the scope of consolidation D4
S1 Cessation of activity (including dissolution, liquidation)
S2 Disposal, loss of control or loss of significant influence D5
S3 Entities removed from the scope because < qualifying thresholds (see note 1.b)
S4 Merger, Universal transfer of assets and liabilities
Variance (V) in voting or ownership interest Prudential scope of consolidation
V1 Additional purchase (1)
V2 Partial disposal
V3 Dilution (2) Entites consolidated under the equity method for prudential purposes
V4 Increase in % (3) Jointly controlled entities under proportional consolidation for prudential purposes.
French subsidiaries whose supervision of prudential requirements is complied with through the supervision on a consolidated basis of BNP Paribas SA, in
accordance with article 7.1 of Regulation n°575/2013 of the European Parliament and of the Council.
The TEB group, previously proportionally consolidated, was consolidated under the equity method in accordance with IFRS 11, then fully consolidated as of 31
December 2013 (see note 2).
The LaSer group was consolidated under the equity method until 25 July 2014. Following the additional purchase of interest by BNP Paribas Group, the LaSer group
has been fully consolidated (see note 8.c.)
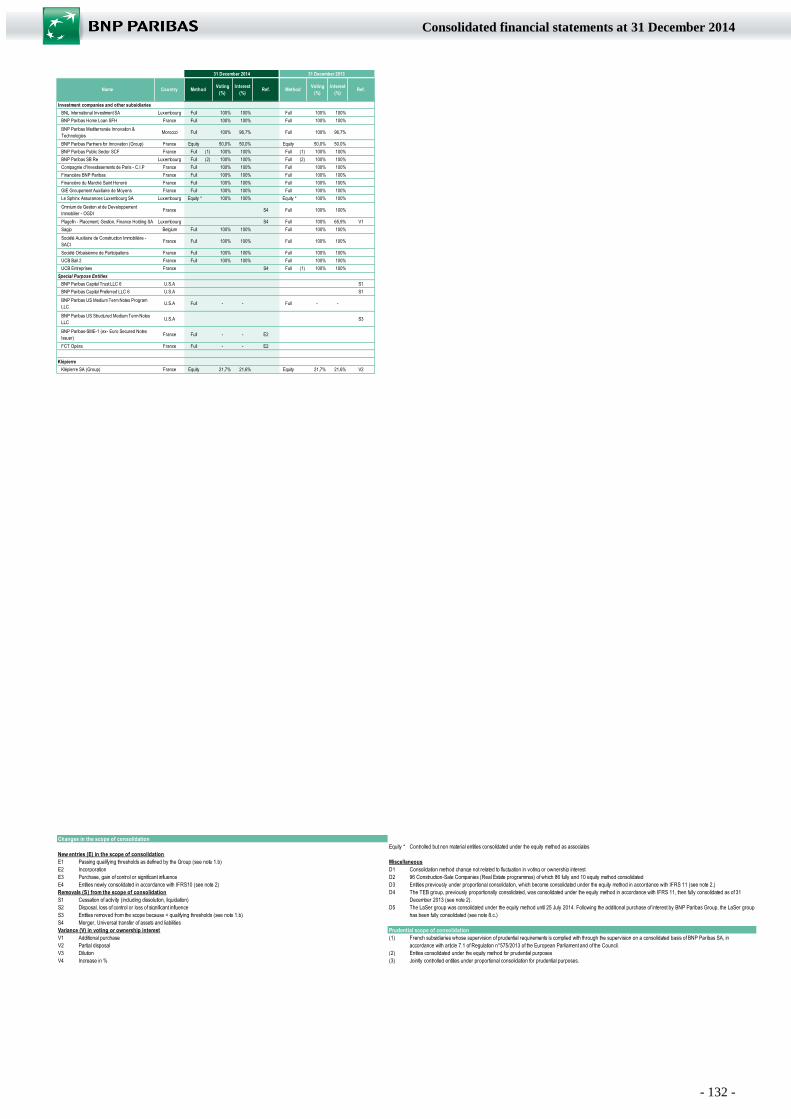
- 132 -
Consolidated financial statements at 31 December 2014
Name Country Method Voting
(%)
Interest
(%)Ref. Method
Voting
(%)
Interest
(%)Ref.
Investment companies and other subsidiaries
BNL International Investment SA Luxembourg Full 100% 100% Full 100% 100%
BNP Paribas Home Loan SFH France Full 100% 100% Full 100% 100%
BNP Paribas Mediterranée Innovation &
TechnologiesMorocco Full 100% 96,7% Full 100% 96,7%
BNP Paribas Partners for Innovation (Group) France Equity 50,0% 50,0% Equity 50,0% 50,0%
BNP Paribas Public Sector SCF France Full (1) 100% 100% Full (1) 100% 100%
BNP Paribas SB Re Luxembourg Full (2) 100% 100% Full (2) 100% 100%
Compagnie d'Investissements de Paris - C.I.P France Full 100% 100% Full 100% 100%
Financière BNP Paribas France Full 100% 100% Full 100% 100%
Financière du Marché Saint Honoré France Full 100% 100% Full 100% 100%
GIE Groupement Auxiliaire de Moyens France Full 100% 100% Full 100% 100%
Le Sphinx Assurances Luxembourg SA Luxembourg Equity * 100% 100% Equity * 100% 100%
Omnium de Gestion et de Developpement
Immobilier - OGDIFrance S4 Full 100% 100%
Plagefin - Placement, Gestion, Finance Holding SA Luxembourg S4 Full 100% 65,9% V1
Sagip Belgium Full 100% 100% Full 100% 100%
Société Auxiliaire de Construction Immobilière -
SACIFrance Full 100% 100% Full 100% 100%
Société Orbaisienne de Participations France Full 100% 100% Full 100% 100%
UCB Bail 2 France Full 100% 100% Full 100% 100%
UCB Entreprises France S4 Full (1) 100% 100%
Special Purpose Entities
BNP Paribas Capital Trust LLC 6 U.S.A S1
BNP Paribas Capital Preferred LLC 6 U.S.A S1
BNP Paribas US Medium Term Notes Program
LLCU.S.A Full - - Full - -
BNP Paribas US Structured Medium Term Notes
LLCU.S.A S3
BNP Paribas-SME-1 (ex- Euro Secured Notes
Issuer)France Full - - E2
FCT Opéra France Full - - E2
Klépierre
Klépierre SA (Group) France Equity 21,7% 21,6% Equity 21,7% 21,6% V2
31 December 201331 December 2014
Changes in the scope of consolidation
Equity * Controlled but non material entities consolidated under the equity method as associates
New entries (E) in the scope of consolidation
E1 Passing qualifying thresholds as defined by the Group (see note 1.b) Miscellaneous
E2 Incorporation D1 Consolidation method change not related to fluctuation in voting or ownership interest
E3 Purchase, gain of control or significant influence D2 96 Construction-Sale Companies (Real Estate programmes) of which 86 fully and 10 equity method consolidated
E4 Entities newly consolidated in accordance with IFRS10 (see note 2) D3 Entities previously under proportional consolidation, which become consolidated under the equity method in accordance with IFRS 11 (see note 2.)
Removals (S) from the scope of consolidation D4
S1 Cessation of activity (including dissolution, liquidation)
S2 Disposal, loss of control or loss of significant influence D5
S3 Entities removed from the scope because < qualifying thresholds (see note 1.b)
S4 Merger, Universal transfer of assets and liabilities
Variance (V) in voting or ownership interest Prudential scope of consolidation
V1 Additional purchase (1)
V2 Partial disposal
V3 Dilution (2) Entites consolidated under the equity method for prudential purposes
V4 Increase in % (3) Jointly controlled entities under proportional consolidation for prudential purposes.
French subsidiaries whose supervision of prudential requirements is complied with through the supervision on a consolidated basis of BNP Paribas SA, in
accordance with article 7.1 of Regulation n°575/2013 of the European Parliament and of the Council.
The TEB group, previously proportionally consolidated, was consolidated under the equity method in accordance with IFRS 11, then fully consolidated as of 31
December 2013 (see note 2).
The LaSer group was consolidated under the equity method until 25 July 2014. Following the additional purchase of interest by BNP Paribas Group, the LaSer group
has been fully consolidated (see note 8.c.)
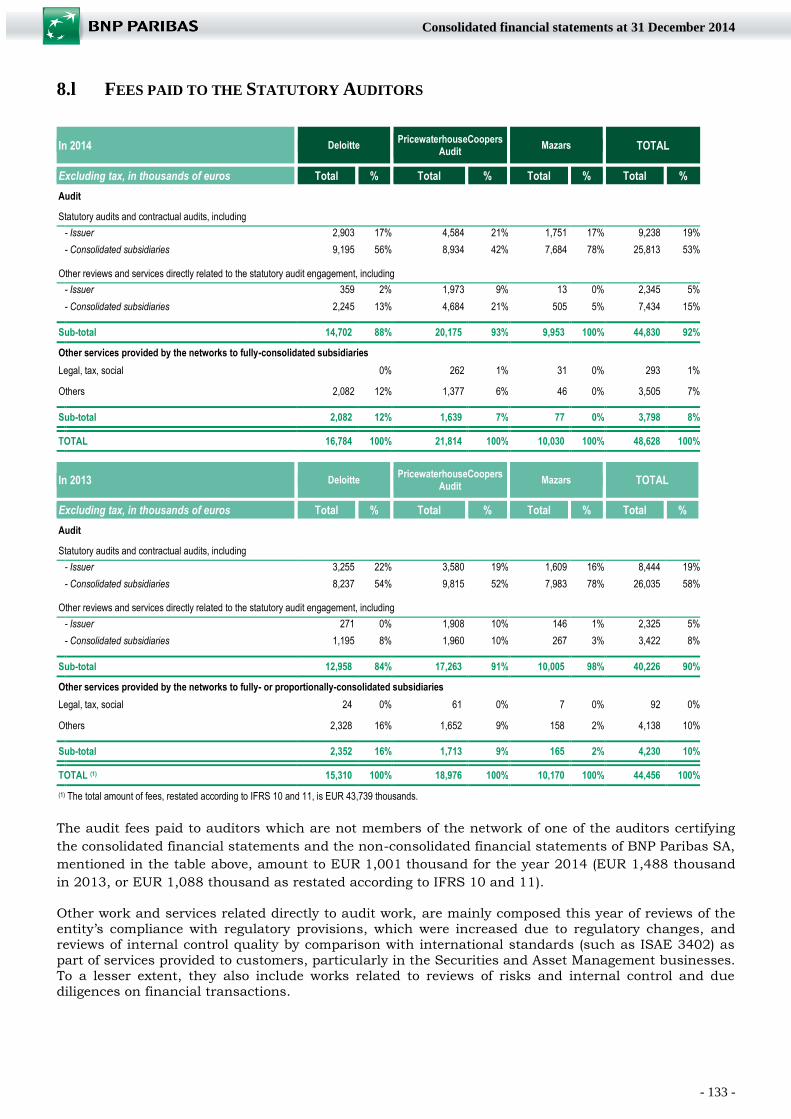
- 133 -
Consolidated financial statements at 31 December 2014
8.l FEES PAID TO THE STATUTORY AUDITORS
In 2014 Deloitte PricewaterhouseCoopers Audit
Mazars TOTAL
Excluding tax, in thousands of euros Total % Total % Total % Total % Audit
Statutory audits and contractual audits, including
- Issuer 2,903 17% 4,584 21% 1,751 17% 9,238 19%
- Consolidated subsidiaries 9,195 56% 8,934 42% 7,684 78% 25,813 53%
Other reviews and services directly related to the statutory audit engagement, including
- Issuer 359 2% 1,973 9% 13 0% 2,345 5%
- Consolidated subsidiaries 2,245 13% 4,684 21% 505 5% 7,434 15%
Sub-total 14,702 88% 20,175 93% 9,953 100% 44,830 92%
Other services provided by the networks to fully-consolidated subsidiaries Legal, tax, social 0% 262 1% 31 0% 293 1%
Others 2,082 12% 1,377 6% 46 0% 3,505 7%
Sub-total 2,082 12% 1,639 7% 77 0% 3,798 8%
TOTAL 16,784 100% 21,814 100% 10,030 100% 48,628 100%
In 2013 Deloitte PricewaterhouseCoopers Audit
Mazars TOTAL
Excluding tax, in thousands of euros Total % Total % Total % Total % Audit
Statutory audits and contractual audits, including
- Issuer 3,255 22% 3,580 19% 1,609 16% 8,444 19%
- Consolidated subsidiaries 8,237 54% 9,815 52% 7,983 78% 26,035 58%
Other reviews and services directly related to the statutory audit engagement, including
- Issuer 271 0% 1,908 10% 146 1% 2,325 5%
- Consolidated subsidiaries 1,195 8% 1,960 10% 267 3% 3,422 8%
Sub-total 12,958 84% 17,263 91% 10,005 98% 40,226 90%
Other services provided by the networks to fully- or proportionally-consolidated subsidiaries Legal, tax, social 24 0% 61 0% 7 0% 92 0%
Others 2,328 16% 1,652 9% 158 2% 4,138 10%
Sub-total 2,352 16% 1,713 9% 165 2% 4,230 10%
TOTAL (1) 15,310 100% 18,976 100% 10,170 100% 44,456 100%
(1) The total amount of fees, restated according to IFRS 10 and 11, is EUR 43,739 thousands.
The audit fees paid to auditors which are not members of the network of one of the auditors certifying
the consolidated financial statements and the non-consolidated financial statements of BNP Paribas SA,
mentioned in the table above, amount to EUR 1,001 thousand for the year 2014 (EUR 1,488 thousand
in 2013, or EUR 1,088 thousand as restated according to IFRS 10 and 11).
Other work and services related directly to audit work, are mainly composed this year of reviews of the
entity’s compliance with regulatory provisions, which were increased due to regulatory changes, and
reviews of internal control quality by comparison with international standards (such as ISAE 3402) as
part of services provided to customers, particularly in the Securities and Asset Management businesses.
To a lesser extent, they also include works related to reviews of risks and internal control and due
diligences on financial transactions.