consumption of sugary drinks · greater consumption of sugary drinks.9 globally, the u.s. is a...
TRANSCRIPT

Public Health Law Center 875 Summit Avenue St. Paul, Minnesota 55105 www.publichealthlawcenter.org 651.290.7506
Sickly Sweet Why the Focus on Sugary DrinksAlthough many factors influence rates of obesity and overweight, sugary drinks play a significant role. Some argue that singling out one type of food is not appropriate because any treat can be consumed in moderation. The fact is, however, that sugary drinks are no longer consumed as a special treat. Instead, they have become a regular and large contributor of daily calories to our diet. This is why efforts to reduce sugary drink consumption are widely supported by public health experts.1
Consumption of Sugary DrinksAlmost all of the sugar that Americans consume comes from added sugars (sugars added to food during processing, preparation, or at the table), and these added sugars account for about 16% of all the calories in the U.S. diet.2 Just under half of all these added sugars comes from sugary drinks such as soda, energy drinks, sports drinks, and “fruit” drinks (see Figure 1), prompting experts at the Institute of Medicine to identify sugary drinks as the single largest contributor of calories and added sugars to the U.S. diet.3
While sugary drink consumption varies by age, sex, income, race and ethnicity, on any given day about half the U.S. population consumes a sugary drink and 25% consumes more than one.4 Males consume
The Public Health Law Center has created a series of resources designed to inform and support efforts to promote healthy beverage choices within Minnesota workplace settings, with a special focus on healthcare. This fact sheet explains how sugary drinks contribute to obesity.
HEALTHY HEALTHCARE

Sickly Sweet | 2
Public Health Law Center 875 Summit Avenue St. Paul, Minnesota 55105 www.publichealthlawcenter.org 651.290.7506
more than females, and teens and young adults consume more than other age groups5 — for example, 70% of boys ages 2-19 years consume sugary drinks on any given day.6 According to Minnesota Student Survey data from 2010, about one-third of Minnesota 6th and 9th-graders and one-quarter of 12th-graders reported that they drank one or more sports drink a day.7 Additionally, nearly 50% of 6th-, 9th-, and 12th-graders surveyed reported that they drank one or more pop or soda drinks in a day.8 While this number has declined from 2001 figures (when about two-thirds or more of students in all age groups reported consuming one or more pop or soda drinks a day), it still remains high.
Americans consume about 250–300 more daily calories today compared to several decades ago (see Figure 2 showing how portion sizes have increased) and nearly half of this increase can be explained by greater consumption of sugary drinks.9 Globally, the U.S. is a leading consumer of soft drinks.10 The U.S. annual average per capita consumption of carbonated soft drinks was 716 eight-ounce servings in 2011,11 or about 44.75 gallons per person. This calculation doesn’t include all types of sugary drinks (and does include some diet drinks); however, it is notable that four out of the five top-selling carbonated soft drink brands are sugary drinks (as opposed to diet brands).12 Almost
FIGURE 2: Illustration of how soda and other portion sizes have increased dramatically since the 1950s
Source: http://makinghealtheasier.org/newabnormal.
Source: U.S. Dep’t of Agric. AnD U.S. Dep’t of HeAltH AnD HUmAn ServS., DietAry gUiDelineS for AmericAnS, 2010 29 (7th ed. 2010).
35.7%
10.5%
3.5%
19.4%
3.8%
17.5%
3.5%
6.1%
Soda, energy drinks, and sports drinks
Fruit drinks
Tea
Grain and dairy-based desserts
Candy
All other foods
Ready-to-eat cereal
Sugars and honey
FIGURE 1: Sources of Added Sugars in Americans’s Diets
Sickly Sweet | 3
Public Health Law Center 875 Summit Avenue St. Paul, Minnesota 55105 www.publichealthlawcenter.org 651.290.7506
half (48%) of sugary drinks are consumed away from home.13 Most sugary drinks, including soda, offer
“empty” calories, meaning they have no nutritional value and do nothing to support health. While liquid calories are not as filling as calories from solid food, studies indicate that people who add calories to their diet through sugary drinks do not tend to reduce the number of calories they consume from other sources.14 Instead, sugary drink consumption is associated with increased energy intake, increased consumption of less healthy food choices, as well as lower intake of healthier choices such as fruit and milk.15 As a result, more total calories tend to be consumed by those drinking liquid calories from sugary drinks than those who do not. Furthermore, in order to burn off the 150 calories found in a 12-ounce soda, an adult must walk briskly for 30 minutes. Because so few people engage in this amount of exercise regularly, consuming sugary drinks makes
it even harder for the average person to achieve the necessary energy balance to maintain a healthy weight.
Sugary Drinks Contribute to Diabetes and ObesityNumerous studies indicate that higher consumption of sugary drinks is associated both with higher risk of weight gain16 but also with higher risk of developing type 2 diabetes,17 heart disease,18 and metabolic syndrome.19 One meta-analysis of eight studies examining the impact of sugary drink consumption on health found that consumption was significantly associated with type 2 diabetes based on over 15,000 reported cases.20
Another meta-analysis of 30 studies on sugary drink consumption ranging from 1966 to 2005 found that sugary drink consumption was associated with weight gain and obesity.21 A similar review of 88 studies found that sugary drink consumption was positively associated with weight.22 One meta-analysis even concluded that sugary drinks likely
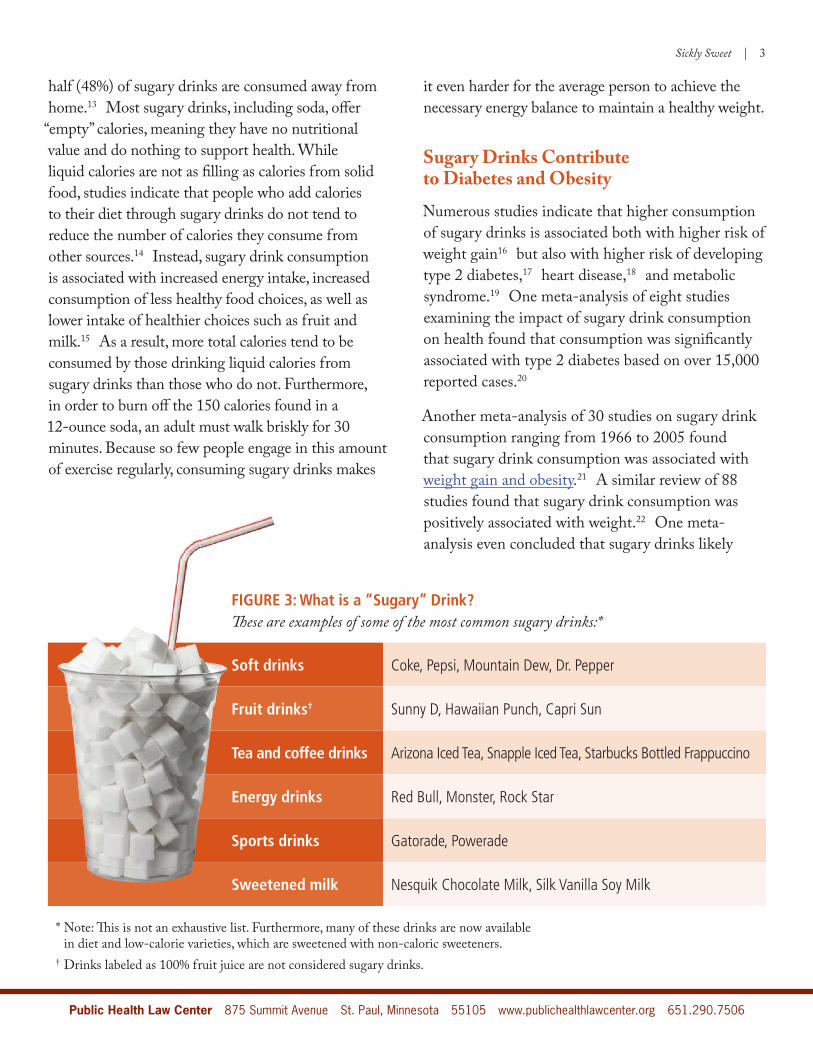
FIGURE 3: What is a “Sugary” Drink? These are examples of some of the most common sugary drinks:*
Soft drinks Coke, Pepsi, Mountain Dew, Dr. Pepper
Fruit drinks† Sunny D, Hawaiian Punch, Capri Sun
Tea and coffee drinks Arizona Iced Tea, Snapple Iced Tea, Starbucks Bottled Frappuccino
Energy drinks Red Bull, Monster, Rock Star
Sports drinks Gatorade, Powerade
Sweetened milk Nesquik Chocolate Milk, Silk Vanilla Soy Milk
* Note: This is not an exhaustive list. Furthermore, many of these drinks are now available in diet and low-calorie varieties, which are sweetened with non-caloric sweeteners.
† Drinks labeled as 100% fruit juice are not considered sugary drinks.

Sickly Sweet | 4
Public Health Law Center 875 Summit Avenue St. Paul, Minnesota 55105 www.publichealthlawcenter.org 651.290.7506
accounted for at least 20% of the weight gained by Americans between 1977 and 2007.23 The evidence supporting a link between sugary drink consumption and weight gain is strong and continues to grow.24
ConclusionReducing sugary drink consumption is a key strategy for reducing obesity and improving health. Hospitals and other healthcare facilities can play a key leadership role in these efforts by implementing food and beverage policies that promote healthy choices.
Additional ResourcesThe other resources in this series can be found on the Public Health Law Center’s website at www.
publichealthlawcenter.org and at Health Care Without Harm’s website at www.healthyfoodinhealthcare.org.
The Commons Health Hospital Challenge program, led by the Institute for a Sustainable Future, also has resources and technical assistance geared towards communities, clinicians and Minnesota hospitals committed to leading obesity prevention efforts in their communities. Health Care Without Harm, through its national Healthy Food in Health Care Program, provides technical assistance and educational programming to support a national network of healthcare organizations in creating healthy food and beverage environments in their facilities. The American Heart Association also has several policy position statements on obesity prevention, and related resources to support healthy food and beverage environments in a variety of settings.
Last updated: March 2013
This publication was prepared by the Public Health Law Center at William Mitchell College of Law, St. Paul, Minnesota, and Health Care Without Harm, with assistance from Jamie Harvie with the Institute for a Sustainable Future.
The Boston Public Health Commission Healthy Beverage Toolkit was utilized with permission in the development of these resources.
Financial support for this series was provided by Blue Cross and Blue Shield of Minnesota. Financial support was also provided by the Minnesota Cancer Alliance with funding from the Centers for Disease Control and Prevention (CDC) (Cooperative Agreement Number 5U55DP003045). The contents are solely the responsibility of the authors and do not necessarily represent the official views of the CDC or those of any other person.
The Public Health Law Center provides information and technical assistance on issues related to public health. The Center does not provide legal representation or advice. This document should not be considered legal advice. For specific legal questions, consult with an attorney.
Endnotes1 See, e.g., Ctrs. for Disease Control and Prevention [CDC],The CDC Guide to Strategies for Reducing the
Consumption of Sugary Drinks (2010); Inst. of Med., Accelerating Progress in Obesity Prevention, Solv-ing the Weight of the Nation 166-84 (Dan Glickman et al. eds., 2012) [hereinafter 2012 IOM Obesity Report].
2 U.S. Dep’t of Agric. and U.S. Dep’t of Health and Human Servs., Dietary Guidelines for Americans, 2010 27 (7th ed. 2010) [hereinafter 2010 U.S. Dietary Guidelines].
3 2012 IOM Obesity Report, supra note 1, at 167.
Sickly Sweet | 5
Public Health Law Center 875 Summit Avenue St. Paul, Minnesota 55105 www.publichealthlawcenter.org 651.290.7506
4 Cynthia L. Ogden et al., Consumption of Sugar Drinks in the United States, 2005-2008 5 (Nat’l Ctr. for Health Statistics Data Brief No. 71) (2011).
5 Id. at 5.6 Id. at 2.7 Minn. Dep’ts of Educ., Health, Human Servs., and Pub. Safety, Minnesota Student Survey 1992-2010
Trends 38 (2010), available at http://www.health.state.mn.us/divs/chs/mss/trendreports/msstrendteport2010.pdf. 8 Id.9 Kelly D. Brownell and Thomas R. Frieden, Ounces of Prevention — the Public Policy Case For Taxes on Sugared Bever-
ages, 360 New Engl. J. Med. 1805, 1806 (2009).10 Dan Check et al., Americans Consume More Soda Than Anyone Else, Slate.com, http://www.slate.com/articles/health_
and_science/map_of_the_week/2012/07/map_of_soda_consumption_americans_drink_more_than_anyone_else_.html ( July 12, 2012). See also Noreen O’Leary, Soft-Drink Consumption Continues to Decline, Adweek, http://www.adweek.com/news/advertising-branding/soft-drink-consumption-continues-decline-107218 (Mar. 30. 2010).
11 U.S. Beverage Results for 2011, 61 Beverage-Digest (Special Issue) 2 ( John Sicher ed., 2012), http://www.beverage-digest.com/pdf/top-10_2012.pdf.
12 Id. at 1.13 Ogden et al., supra note 4, at 5.14 See, e.g., D.P. DiMeglio and R.D. Mattes, Liquid Versus Solid Carbohydrate: Effects on Food Intake and Body Weight, 24
Int’l J. Obesity Related Metabolic Disorders 794 (2000); Kevin C. Mathias et al., Foods and Beverages Associ-ated with Higher Intake of Sugar-Sweetened Beverages, 44 Am. J. Prev. Med. 351 (2013); and Gordana Mrdjenovic and David A. Levitsky, Nutritional and Energetic Consequences of Sweetened Drink Consumption in 6- to 13-year-old Children, 142 J. Pediatrics 604 (2003).
15 See Carol D. Frary et al., Children and Adolescents’ Choices of Foods and Beverages High in Added Sugars Are Associated with Intakes of Key Nutrients and Food Groups, 34 J. Adolescent Health 56, 61(2004); Mathias et al., supra note 14; and Lenny R. Vartanian et al., Effects of Soft Drink Consumption on Nutrition and Health: A Systematic Review and Meta-analysis, 97Am. J. Pub. Health 667 (2007).
16 See Mrdjenovic and Levitsky, supra note 14; Matthias B. Schulze et al., Sugary Drinks, Weight Gain, and Incidence of Type 2 Diabetes in Young and Middle-aged Women, 292 JAMA 927 (2004); and Vartanian et al., supra note 15.
17 Julie R. Palmer et al., Sugar-Sweetened Beverages and Incidence of Type 2 Diabetes Mellitus in African American Women, 168 Archives of Internal Med. 1487 (2008); and Schulze et al., supra note 16.
18 Lawrence de Koning et al., Sweetened Beverage Consumption, Incident Coronary Heart Disease and Biomarkers of Risk in Men, Circulation (published online ahead of print March 12, 2012), http://circ.ahajournals.org/content/ear-ly/2012/03/09/CIRCULATIONAHA.111.067017.full.pdf and Teresa T. Fung et al., Sweetened Beverage Consump-tion and Risk of Coronary Heart Disease in Women, 89 Am. J. Clinical Nutrition 1037 (2009).
19 Ravi Dhingra et al., Soft Drink Consumption and Risk of Developing Cardiometabolic Risk Factors and the Metabolic Syndrome in Middle-aged Adults in the Community, 116 Circulation 480 (2007).
20 Vasanti S. Malik et al., Sugary Drinks and Risk of Metabolic Syndrome and Type 2 Diabetes: A Meta-Analysis, 33 Dia-betes Care 2477 (2010).
21 Vasanti S. Malik et al., Intake of Sugary Drinks and Weight Gain: A Systematic Review, 84 Am. J. Clinical Nutri-tion 274 (2006).
22 Vartanian et al., supra note 15.23 Gail Woodward-Lopez et al., To What Extent Have Sweetened Beverages Contributed to the Obesity Epidemic, 14 Pub.
Health Nutrition 499, 505 (2011). 24 Janne C. deRuyter et al., A Trial of Sugar-Free or Sugar-Sweetened Beverages and Body Weight in Children, 367 N.
Engl. J Med. 1397 (2012); and Cara B. Ebbeling et al., A Randomized Trial of Sugar-Sweetened Beverages and Ado-lescent Body Weight, 367 N. Engl. J. Med. 1407 (2012).