consultant report securing australia’s future stem ...€¦ · consultant report securing...
TRANSCRIPT
1
Consultant Report Securing Australia’s Future STEM: Country Comparisons This report can be found at www.acola.org.au © Australian Council of Learned Academies … a critical examination of existing solutions to the STEM skills shortage in comparable [European] countries Country report: Finland1 Ian R Dobson Honorary Senior Research Fellow School of Education and Arts University of Ballarat Adjunct Professional Staff Member Monash University Table of contents Introduction and background ................................................................................................. 2 Education in Finland ............................................................................................................. 3 Compulsory education (basic education; comprehensive education) .................................... 5 Post-compulsory education ................................................................................................... 6 1. Vocational education and training ..................................................................................... 6 2. Upper secondary general education ................................................................................. 8 STEM and the school curriculum - basic education ............................................................... 8 STEM and the school curriculum - upper secondary education ............................................. 8 Matriculation ......................................................................................................................... 9 The international standing of Finnish school education ....................................................... 10 Higher education – introduction ........................................................................................... 10 The National Science Education Centre LUMA ................................................................... 21 Activities for children and young people .............................................................................. 22 Activities for teachers .......................................................................................................... 24 Other related matters .......................................................................................................... 25 A final word ......................................................................................................................... 26 References ......................................................................................................................... 27
1 A note on layout and sources: the referencing used here follows the style recommended by the American Psychological Society
(APA), sixth edition, but URLs have been supplied as footnotes for the major reports and other information accessed as they are mentioned in the text.
2
Introduction and background Finland is different from other European countries, even the other Nordic welfare states, for reasons other than its language. Overall uptake of studies in the STEM disciplines (science, mathematics, engineering and technology) is higher than in most countries in Europe, considerably so in many cases. The reasons for this are a function of history, culture and government policy support for education and equality. Perhaps an indication of this difference comes out in Kearney’s survey-based study of STEM activities in 21 European countries, in which it was noted that Finland is one of four countries surveyed (the others being Austria, the Slovak Republic and Slovenia) that ‘no longer consider STEM-related educational issues as an important priority at national level. … Finland is concentrating on other priority areas, including the teaching and learning of foreign languages’ (Kearney, 2011, p. 6)2. This is an important point, and has meant that relatively little specific policy has been built on the educational aspects of preparing a future STEM-prepared workforce. However, this does not mean that Finns and Finnish authorities are unmindful of issues relating to the STEM disciplines and their importance in the knowledge economy, but issues tend to be couched in terms of the whole labour force. Consideration of STEM-related matters in Finland seems to have been built into education and policy at all levels. Evidence of Finland’s keen interest in matters relating to education (including the STEM disciplines) is confirmed by its participation in many European STEM-related programmes and initiatives. However, when compared with some countries, Finland has few separate national or regional programmes. In one sense, STEM has been mainstreamed through its education system, and in any case, the Finnish rates of STEM discipline uptake is ahead of most countries. The positive role model that Finland could provide in considerations about improving STEM uptake elsewhere are drawn less from STEM-specific programmes than from the Finnish system of education itself. Perhaps the STEM disciplines inadvertently gained a higher profile in Finland than elsewhere because of Finland’s situation after World War II. Hefty war reparations were required by the Soviet Union. Finland ceded about 10 per cent of its former territory along parts of its eastern border with Soviet Union, and was required to make in-kind payments of US$300,000,000 (1938 values) in the form of heavy machinery (for the pulp and paper, and metals industries), and ships (such as ice-breakers) (Solstem & Meditz, 1988). The fact that engineering products were required of a country in which the focus had been on the wood industry meant that capital, labour, and technical capacity had to be diverted to the metals industries, and this helped speed up what proved to be a beneficial structural change in industry (Taivalkoski, 2002). This meant the early development of a strong industrial and ‘STEM’ culture in education and labour markets. Another indirectly related measure was the establishment of new universities in regional Finland from the late 1950s and 1960s. Among the aims of this policy were to provide higher education to regions beyond the capital for reasons of equality of opportunity, and to try to limit the ‘magnet’ effect of Helsinki to young people. The establishment of regional universities meant that study was possible in those regions, and industries attracted to university towns provided a source of employment for new graduates. Among the universities established during this period, the Universities of Oulu and Vaasa (1958 and 1968, respectively) and the Lappeenranta University of Technology (1969) offer STEM discipline programmes. More recently, Finland made its higher education system binary by creating polytechnics through the amalgamation and redirection of myriad former vocational colleges. The 2 http://spice.eun.org/c/document_library/get_file?p_l_id=16292&folderId=16435&name=DLFE-9323.pdf
3
polytechnics’ role is to ‘train professionals in response to labour market needs and conduct R&D which supports instruction and promotes regional development in particular’ (Ministry of Education and Culture, n.d.). Polytechnics (from 1991/1992) were seen to be an important part of the so-called massification of Finnish higher education (Aarrevaara, 2007). Another major factor that makes Finland different is its much lauded system of education at primary and secondary levels. Briefly, Finland's schooling has received international acclaim because of the performance of its students. It is a system that promotes equality of opportunity for all students and has been built on cooperation rather than competition and respect for its highly-qualified teachers, whilst eschewing rankings of students, teachers and schools (see Sahlberg, 2011). It should also be noted that Finland is officially a bilingual country: Finnish and Swedish, with speakers of the latter numbering about 275,000. Speakers of Sami, the language of about 1,800 also have legislated rights to use their mother tongue in some circumstances. Finland’s future labour force, whether in STEM-dependent occupations or other, will be shaped by both supply and demand issues. On the supply side, Finnish higher education seems relatively well placed, because it already produces a higher proportion of STEM-qualified workers than other countries. The secondary school system, dealt with in more detail below, bifurcates after nine years, and some students go into three years of vocational education. After that, they are workforce ready, typically at age 18 or 19. Others continue along an academic track, towards higher education in a university or a polytechnic. On the demand side, Finland is an ageing society, and there will be large scale retirements in coming years. Discussion on these matters follows later. Education in Finland This section provides background information about the various levels of education in Finland. Statistics have been provided primarily to indicate potential throughput of students into later study or to the workforce. Education was mentioned in the introduction as an explanation of why Finland’s efforts to ensure a technically competent labour force might differ from those in other western countries. The Finnish education system is mentioned only in outline, based largely on information from the websites of the Ministry of Education and Culture and the National Board of Education. Education in Finland comprises pre-school (one year), compulsory (basic/comprehensive education) (9 years), senior secondary education (three years) and higher education (universities and polytechnics). Access to education and culture are guaranteed in the Finnish Constitution, with ‘education’ incorporating pre-school education, primary education, secondary education, vocational education, higher education and ‘liberal adult’ education. The government’s stated objectives are ‘to raise the level of education among the population and the labour force, to improve the efficiency of the education system, to prevent children's and young people's exclusion and to enlarge adults' opportunities in education and training’ (Ministry of Education and Culture, n.d). In Finland everyone has the right to free basic education, including necessary equipment and text books, school transportation (where needed), and adequate free meals. Private schools are all but non-existent in Finland. The education system also caters for minorities and migrant groups. The biggest ‘minority’ are the Swedish-speaking Finns, about 5.5 per cent of the total population, but to be found in highest proportions on the west coast and to the south-east of Helsinki.
4
There are many Swedish-language schools, and it is possible to go from pre-school to higher education predominantly in Swedish. Various immigrant language groups are provided with language teaching of their own language. This latter provision is not compulsory, but is common at larger schools, subject to funding (Helsingin Kaupunki, n.d.). At the policy level, ‘the aims of immigrant education, for both children and adults, include equality, functional bilingualism and multiculturalism. The objective of immigrant education provided by different educational institutions is to prepare immigrants for integration into the Finnish education system and society, to support their cultural identity and to provide them with as well-functioning bilingualism as possible so that, in addition to Finnish (or Swedish), they will also have a command of their own native language’ (OPH, n.d-a.)3. Material for immigrants about study in Finland is also available on the National Board of Education’s Website, including brochures in several languages. 4 In contrast with the development of school ‘administration’ in most countries, In Finland efforts were taken to reduce the role of central administration in deciding on the contents and aims of teaching the providers of education and teachers more and more, and their judgement to choose the best possible teaching materials. By the beginning of the 1990s the system of school inspection was discontinued. Finnish education is organised and provided through the efforts of the Ministry, the National Board of Education and local authorities. The involvement of local authorities and the nature of that involvement are matters that lead to Finnish education differing from the systems in many countries. The education providers, usually the local education authorities and the schools themselves, draw up their own curricula for pre-primary and basic education within the framework of the national core curriculum. Teachers in Finland command enormous respect, and teaching is a sought-after profession. Applications for direct entry to teacher training programmes outnumber places available by about ten to one. The process leading to becoming a teacher depends whether one is applying to become a class teacher (typically to teach grades 1-6), or a subject teacher (typically to teach grades 7–9 of lower secondary level and at upper secondary school 10-12). Teacher training for both is provided by university teacher education departments (OPH, n.d-b.). Class teacher training is provided by university faculties of education or other equivalent teacher education units. Teacher education units have teacher training school(s) for teaching practice, experiments, research and continuing education. Subject teacher training is provided by the university faculties or departments that teach the different subjects. Pedagogical studies are provided by teacher education units within faculties of education. The periods of teaching practice included in pedagogical studies are organised at university teacher training schools. It takes three years to become a kindergarten teacher, and five years to become a class teacher. Students wishing to undertake subject teacher training usually first apply to study a particular subject/s at the relevant university faculty and after one or two years of study, they can apply for subject teacher education. At some universities and faculties, students can also apply directly for subject teacher education; in such cases, education is provided in co-operation between the department of teacher education, the relevant subject departments and teacher training schools. The department of teacher education
3 http://www.oph.fi/english/education/language_and_cultural_minorities 4 http://www.oph.fi/english/education/language_and_cultural_minorities/education_for_immigrants

5
is responsible for providing pedagogical studies, whereas subject departments of different faculties provide education in the teaching subjects. These studies are taken in parallel and in interaction with each other. The length of subject teacher education is 5-6 years (OPH, n.d-b). Perusal of the University of Helsinki Faculty of Science website will provide further information.5 Teachers’ pedagogical studies comprise a minimum of 60 study points, 20 points of which is attributed to teaching practice. The whole degree is defined as 300 study points for class and subject teachers (180 for kindergarten teachers) (OPH, n.d-b). There are no differentials in the salaries paid to teachers; for example, a teacher of mathematics or physics is paid according to the same scale as a history or language teacher. Teachers are trusted and have the autonomy to choose the teaching methods they use in order to achieve the objectives stated in the national core curriculum. The national core curriculum includes the guidelines for choosing teaching methods. The schools and teachers themselves decide on the material and textbooks used. Finnish teachers are treated like the experts that they are, and they have autonomy to meet their responsibilities. Teachers are required to meet continuous professional development requirements, and attend programmes chosen by the school or by local authorities. Compulsory education (basic education; comprehensive education) Finnish education starts with nine years of basic education in comprehensive schools, preceded by one year of voluntary pre-primary education (taken by 96 per cent of students). These first years of education are co-financed by the national government and local authorities, with the latter providing 54.7 per cent of the total (in Finland, a portion of income tax is paid directly to local authorities). Local authorities are also involved in funding vocational secondary education and training, general upper secondary education, and polytechnic education. Upper secondary education, comprising streams of vocational education and general education follows. Schooling is compulsory and starts in the year when a child turns seven. Legislation assures citizens the right to free pre-primary and basic education. However, most other qualification-producing education is also free, including upper secondary general education, vocational education and training and undergraduate and postgraduate higher education. Nearly all children (99.7 per cent) complete the comprehensive school syllabus. The principle underlying pre-primary, basic and vocational or upper secondary education is to guarantee equal opportunities and basic educational security for all, irrespective of their place of residence, language and economic standing. Completion of the basic education syllabus does not lead to any qualification, but presents students with a decision point at which they leave school, move on to vocational education and training, or move on to upper secondary education. The latter provides the direct route to higher education at a university or a polytechnic. Around 63,200 students completed the 9th grade of comprehensive school in 2011. Forty-one per cent of them (33 per cent of women and 49 per cent of men) went on to attend upper secondary level vocational education and 50 per cent of them (58 per cent of women and 42 per cent of men) went on to study in upper secondary general school. 5 http://www.helsinki.fi/ml/valinnat/aineenopettajaksi.html
6
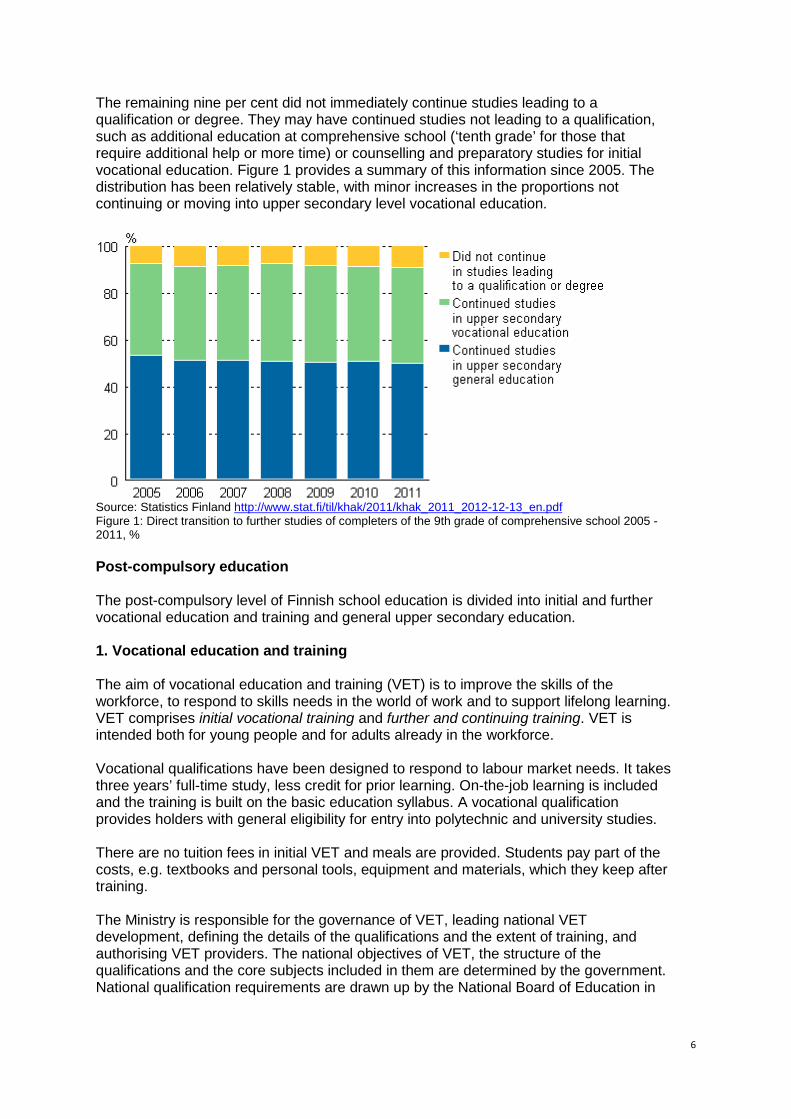
The remaining nine per cent did not immediately continue studies leading to a qualification or degree. They may have continued studies not leading to a qualification, such as additional education at comprehensive school (‘tenth grade’ for those that require additional help or more time) or counselling and preparatory studies for initial vocational education. Figure 1 provides a summary of this information since 2005. The distribution has been relatively stable, with minor increases in the proportions not continuing or moving into upper secondary level vocational education.
Source: Statistics Finland http://www.stat.fi/til/khak/2011/khak_2011_2012-12-13_en.pdf Figure 1: Direct transition to further studies of completers of the 9th grade of comprehensive school 2005 - 2011, % Post-compulsory education The post-compulsory level of Finnish school education is divided into initial and further vocational education and training and general upper secondary education. 1. Vocational education and training The aim of vocational education and training (VET) is to improve the skills of the workforce, to respond to skills needs in the world of work and to support lifelong learning. VET comprises initial vocational training and further and continuing training. VET is intended both for young people and for adults already in the workforce. Vocational qualifications have been designed to respond to labour market needs. It takes three years’ full-time study, less credit for prior learning. On-the-job learning is included and the training is built on the basic education syllabus. A vocational qualification provides holders with general eligibility for entry into polytechnic and university studies. There are no tuition fees in initial VET and meals are provided. Students pay part of the costs, e.g. textbooks and personal tools, equipment and materials, which they keep after training. The Ministry is responsible for the governance of VET, leading national VET development, defining the details of the qualifications and the extent of training, and authorising VET providers. The national objectives of VET, the structure of the qualifications and the core subjects included in them are determined by the government. National qualification requirements are drawn up by the National Board of Education in
7
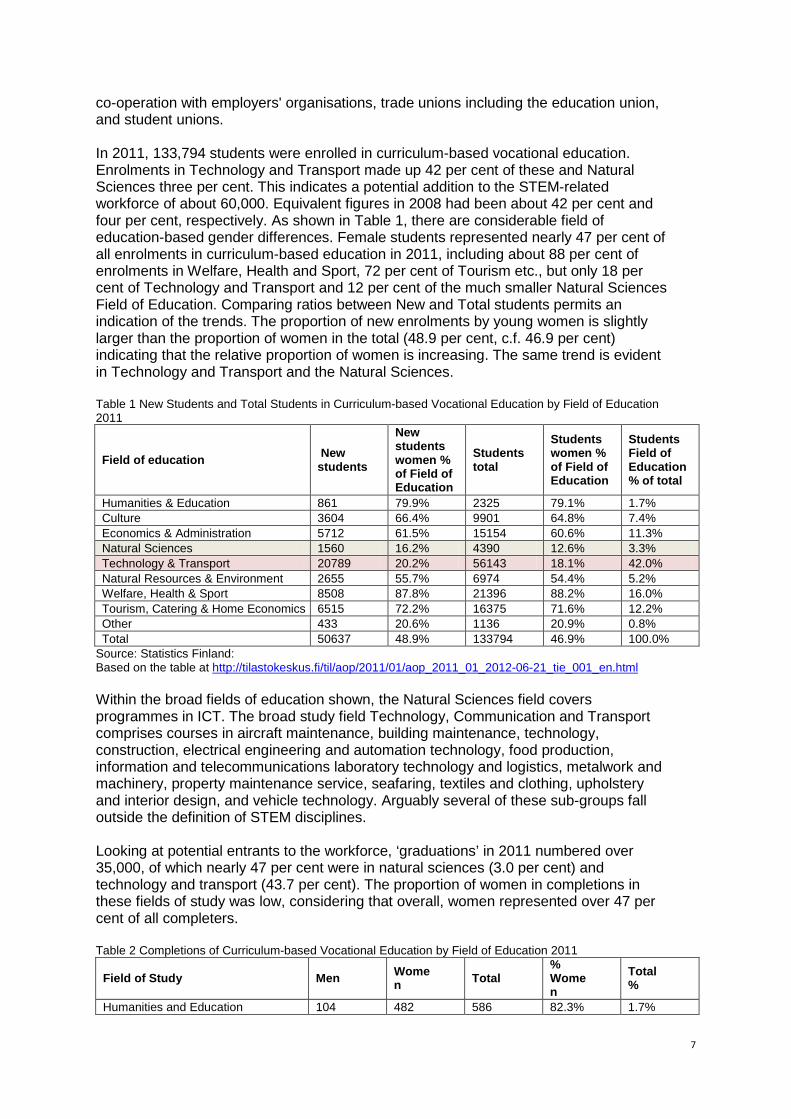
co-operation with employers' organisations, trade unions including the education union, and student unions. In 2011, 133,794 students were enrolled in curriculum-based vocational education. Enrolments in Technology and Transport made up 42 per cent of these and Natural Sciences three per cent. This indicates a potential addition to the STEM-related workforce of about 60,000. Equivalent figures in 2008 had been about 42 per cent and four per cent, respectively. As shown in Table 1, there are considerable field of education-based gender differences. Female students represented nearly 47 per cent of all enrolments in curriculum-based education in 2011, including about 88 per cent of enrolments in Welfare, Health and Sport, 72 per cent of Tourism etc., but only 18 per cent of Technology and Transport and 12 per cent of the much smaller Natural Sciences Field of Education. Comparing ratios between New and Total students permits an indication of the trends. The proportion of new enrolments by young women is slightly larger than the proportion of women in the total (48.9 per cent, c.f. 46.9 per cent) indicating that the relative proportion of women is increasing. The same trend is evident in Technology and Transport and the Natural Sciences. Table 1 New Students and Total Students in Curriculum-based Vocational Education by Field of Education 2011
Field of education New students
New students women % of Field of Education
Students total
Students women % of Field of Education
Students Field of Education % of total
Humanities & Education 861 79.9% 2325 79.1% 1.7% Culture 3604 66.4% 9901 64.8% 7.4% Economics & Administration 5712 61.5% 15154 60.6% 11.3% Natural Sciences 1560 16.2% 4390 12.6% 3.3% Technology & Transport 20789 20.2% 56143 18.1% 42.0% Natural Resources & Environment 2655 55.7% 6974 54.4% 5.2% Welfare, Health & Sport 8508 87.8% 21396 88.2% 16.0% Tourism, Catering & Home Economics 6515 72.2% 16375 71.6% 12.2% Other 433 20.6% 1136 20.9% 0.8% Total 50637 48.9% 133794 46.9% 100.0%
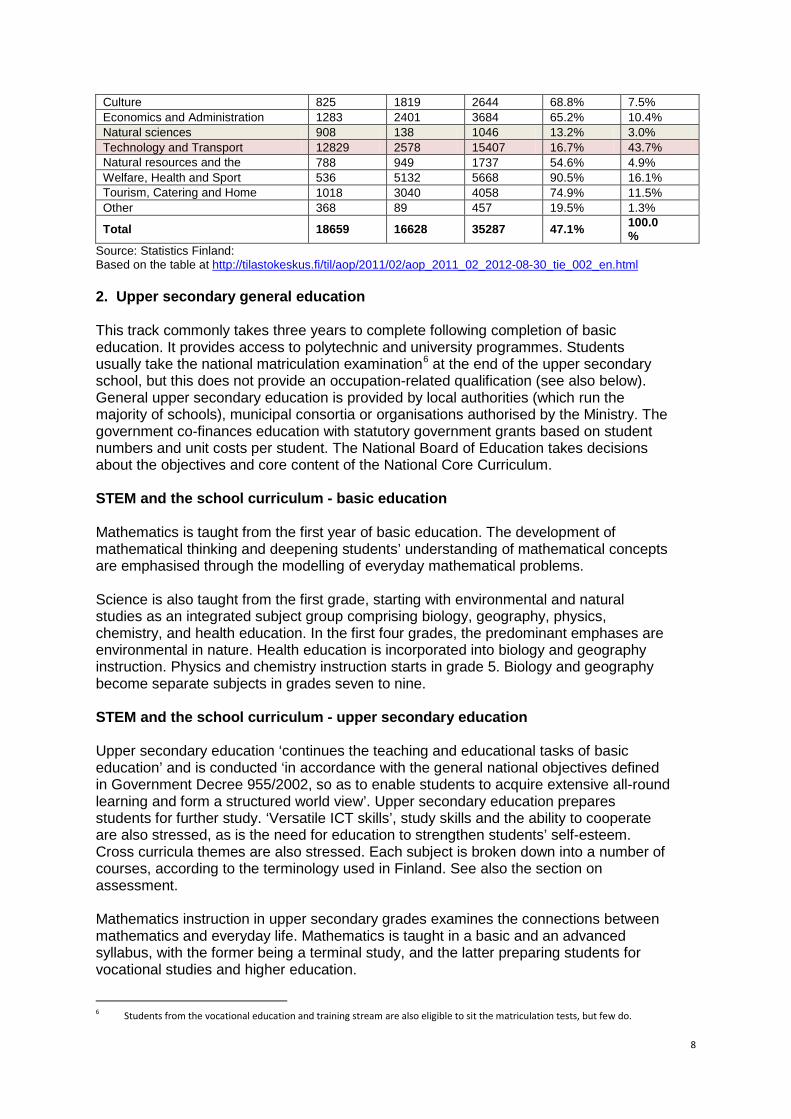
Source: Statistics Finland: Based on the table at http://tilastokeskus.fi/til/aop/2011/01/aop_2011_01_2012-06-21_tie_001_en.html Within the broad fields of education shown, the Natural Sciences field covers programmes in ICT. The broad study field Technology, Communication and Transport comprises courses in aircraft maintenance, building maintenance, technology, construction, electrical engineering and automation technology, food production, information and telecommunications laboratory technology and logistics, metalwork and machinery, property maintenance service, seafaring, textiles and clothing, upholstery and interior design, and vehicle technology. Arguably several of these sub-groups fall outside the definition of STEM disciplines. Looking at potential entrants to the workforce, ‘graduations’ in 2011 numbered over 35,000, of which nearly 47 per cent were in natural sciences (3.0 per cent) and technology and transport (43.7 per cent). The proportion of women in completions in these fields of study was low, considering that overall, women represented over 47 per cent of all completers. Table 2 Completions of Curriculum-based Vocational Education by Field of Education 2011
Field of Study Men Women Total
% Women
Total %
Humanities and Education 104 482 586 82.3% 1.7%
8
Culture 825 1819 2644 68.8% 7.5% Economics and Administration 1283 2401 3684 65.2% 10.4% Natural sciences 908 138 1046 13.2% 3.0% Technology and Transport 12829 2578 15407 16.7% 43.7% Natural resources and the
788 949 1737 54.6% 4.9%
Welfare, Health and Sport 536 5132 5668 90.5% 16.1% Tourism, Catering and Home
1018 3040 4058 74.9% 11.5%
Other 368 89 457 19.5% 1.3%
Total 18659 16628 35287 47.1% 100.0%
Source: Statistics Finland: Based on the table at http://tilastokeskus.fi/til/aop/2011/02/aop_2011_02_2012-08-30_tie_002_en.html 2. Upper secondary general education This track commonly takes three years to complete following completion of basic education. It provides access to polytechnic and university programmes. Students usually take the national matriculation examination6 at the end of the upper secondary school, but this does not provide an occupation-related qualification (see also below). General upper secondary education is provided by local authorities (which run the majority of schools), municipal consortia or organisations authorised by the Ministry. The government co-finances education with statutory government grants based on student numbers and unit costs per student. The National Board of Education takes decisions about the objectives and core content of the National Core Curriculum. STEM and the school curriculum - basic education Mathematics is taught from the first year of basic education. The development of mathematical thinking and deepening students’ understanding of mathematical concepts are emphasised through the modelling of everyday mathematical problems. Science is also taught from the first grade, starting with environmental and natural studies as an integrated subject group comprising biology, geography, physics, chemistry, and health education. In the first four grades, the predominant emphases are environmental in nature. Health education is incorporated into biology and geography instruction. Physics and chemistry instruction starts in grade 5. Biology and geography become separate subjects in grades seven to nine. STEM and the school curriculum - upper secondary education Upper secondary education ‘continues the teaching and educational tasks of basic education’ and is conducted ‘in accordance with the general national objectives defined in Government Decree 955/2002, so as to enable students to acquire extensive all-round learning and form a structured world view’. Upper secondary education prepares students for further study. ‘Versatile ICT skills’, study skills and the ability to cooperate are also stressed, as is the need for education to strengthen students’ self-esteem. Cross curricula themes are also stressed. Each subject is broken down into a number of courses, according to the terminology used in Finland. See also the section on assessment. Mathematics instruction in upper secondary grades examines the connections between mathematics and everyday life. Mathematics is taught in a basic and an advanced syllabus, with the former being a terminal study, and the latter preparing students for vocational studies and higher education.
6 Students from the vocational education and training stream are also eligible to sit the matriculation tests, but few do.
9
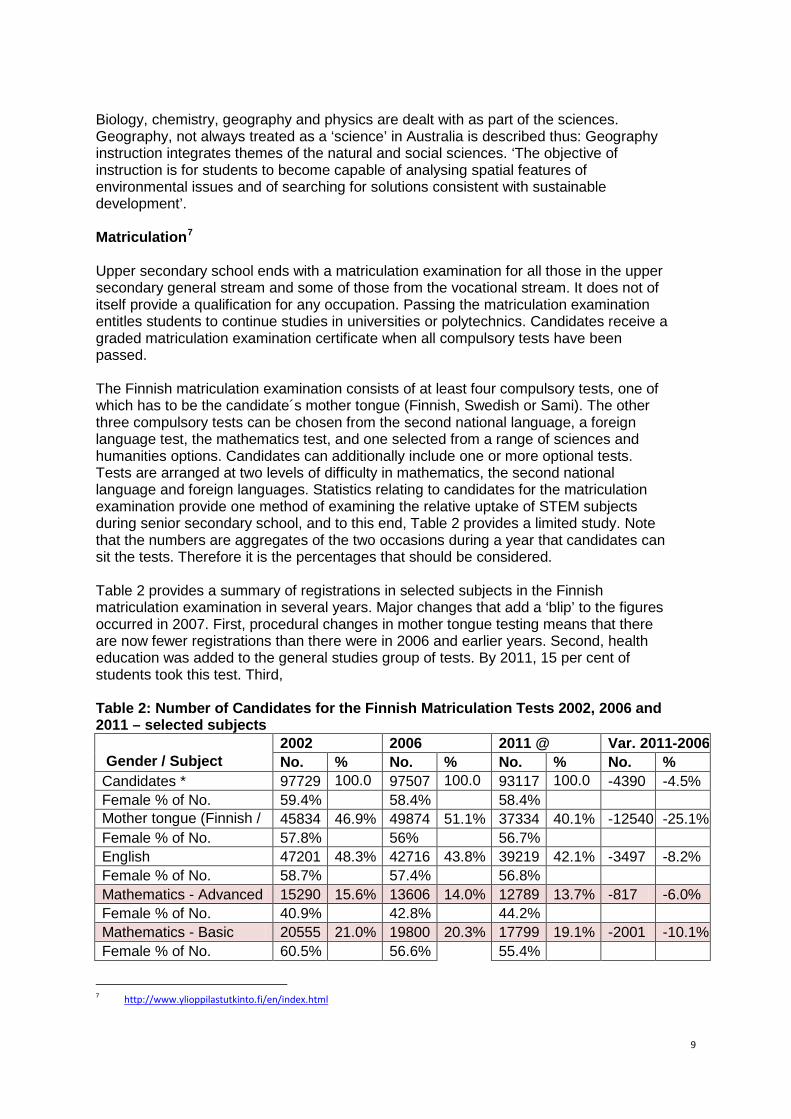
Biology, chemistry, geography and physics are dealt with as part of the sciences. Geography, not always treated as a ‘science’ in Australia is described thus: Geography instruction integrates themes of the natural and social sciences. ‘The objective of instruction is for students to become capable of analysing spatial features of environmental issues and of searching for solutions consistent with sustainable development’. Matriculation7 Upper secondary school ends with a matriculation examination for all those in the upper secondary general stream and some of those from the vocational stream. It does not of itself provide a qualification for any occupation. Passing the matriculation examination entitles students to continue studies in universities or polytechnics. Candidates receive a graded matriculation examination certificate when all compulsory tests have been passed. The Finnish matriculation examination consists of at least four compulsory tests, one of which has to be the candidate´s mother tongue (Finnish, Swedish or Sami). The other three compulsory tests can be chosen from the second national language, a foreign language test, the mathematics test, and one selected from a range of sciences and humanities options. Candidates can additionally include one or more optional tests. Tests are arranged at two levels of difficulty in mathematics, the second national language and foreign languages. Statistics relating to candidates for the matriculation examination provide one method of examining the relative uptake of STEM subjects during senior secondary school, and to this end, Table 2 provides a limited study. Note that the numbers are aggregates of the two occasions during a year that candidates can sit the tests. Therefore it is the percentages that should be considered. Table 2 provides a summary of registrations in selected subjects in the Finnish matriculation examination in several years. Major changes that add a ‘blip’ to the figures occurred in 2007. First, procedural changes in mother tongue testing means that there are now fewer registrations than there were in 2006 and earlier years. Second, health education was added to the general studies group of tests. By 2011, 15 per cent of students took this test. Third, Table 2: Number of Candidates for the Finnish Matriculation Tests 2002, 2006 and 2011 – selected subjects Gender / Subject
2002 2006 2011 @ Var. 2011-2006 No. % No. % No. % No. %
Candidates * 97729 100.0
97507 100.0
93117 100.0
-4390 -4.5% Female % of No. 59.4% 58.4% 58.4% Mother tongue (Finnish /
45834 46.9% 49874 51.1% 37334 40.1% -12540 -25.1%
Female % of No. 57.8% 56% 56.7% English 47201 48.3% 42716 43.8% 39219 42.1% -3497 -8.2% Female % of No. 58.7% 57.4% 56.8% Mathematics - Advanced 15290 15.6% 13606 14.0% 12789 13.7% -817 -6.0% Female % of No. 40.9% 42.8% 44.2% Mathematics - Basic 20555 21.0% 19800 20.3% 17799 19.1% -2001 -10.1% Female % of No. 60.5% 56.6% 55.4%
7 http://www.ylioppilastutkinto.fi/en/index.html

10
Chemistry 5404 5.5% 5802 6.2% 398 7.4% Female % of No. 41.2% 43.5% Biology @ 7836 8.0% 6707 7.2% -1129 -14.4% Female % of No. 68.2% 66.2% Physics 5058 5.2% 6106 6.6% 1048 20.7% Female % of No. 17.8% 23.5%
# Much of the apparent decline in Mother Tongue from 2007 is due to procedural changes and requirements * Students may be candidates multiple times; the number of matriculation passes in 2011 was about 33,000. § Plus about 15 Sami speakers @ From 2007, a new Health Studies study was added, which by 2011 represented 15 per cent of non-compulsory subjects. This may account for some of the apparent decline in biology. advanced mathematics test was extended by adding two topics that made it more difficult than in earlier years. Shown are raw registrations for the mother tongue subject, English and mathematics, which are included in the compulsory tests, and biology, chemistry and physics, which are among the general non-compulsory tests, and percentages of total registrations. Also shown are percentages of female registrants, as these are relevant to some of the gender-related observations below. Looking at STEM subjects in the matriculation tests, mathematics is compulsory, but can be taken at an advanced or basic level. More students sit the basic examination, and the proportion of female students is higher than it is in advanced mathematics (55.4 per cent of basic mathematics registrations, and 44.2 per cent in advanced mathematics). In biology, the proportion of total representations has declined, but female students are in a clear majority. In chemistry and physics, the number and proportion of registrants increased over recent years, as did the proportion of all registrations. Female students are in the minority in both these subjects, considerably so in the case of physics. The international standing of Finnish school education Finland’s school system is one of the factors that makes Finland different from other countries, and therefore more difficult to deal with in a comparative sense. The internet is replete with stories of Finland’s education system and the performance of its students in international tests such as TIMSS and PISA. Finnish school students excel in an environment in which they receive fewer hours of direct tuition in a year and have less homework than students in countries known for long school days, high-pressure standardised testing, and competitiveness-boosting after-hours tutoring sessions. In Finland, there are no rankings, competition, or comparisons between students, schools, teachers, or regions. Parents and employers tend not to express adverse opinions about Finnish education, precisely because of the results it produces. This is part of the trust that pervades Finnish society. To sum up Finnish school education, paraphrasing Sahlberg (2009), he notes five main points: there is the same comprehensive schooling for all; teachers are well-trained; there is ‘intelligent accountability’ (that is, there is no assumption that making schools and teachers more accountable is the key to raising student achievement), and there are no external tests before the matriculation tests; there is a culture of trust; and there is ‘distributed moral leadership’, with continual adjustment of schooling to the changing needs of individuals and society. There are many sources of information about the Finnish school system. For more information, see Sahlberg (2009, 2011) and many sources from the internet, such as Hancock (2011), among others. Higher education – introduction
11
Finnish higher education is provided via a binary system of universities (yliopisto in the singular) and polytechnics (ammattikorkeakoulu), the latter introduced in 1991/1992. The admission requirement for both is a matriculation certificate or less commonly, a vocational diploma from the end of post-compulsory schooling. The mission of universities is to conduct scholarly research and provide instruction and postgraduate education based on it. Polytechnics train professionals in response to labour market needs and conduct R&D which supports instruction and promotes regional development (EHEA, 2012). Universities underwent a major set of reforms from 2010 (see Aarrevaara et al., 2009). From 2013, there are 14 universities and 25 polytechnics. Most polytechnics refer to themselves as ‘universities of applied sciences’, but this terminology is not used by the Ministry. Universities confer bachelor's degrees, master's degrees, licentiate degrees and doctoral degrees. Under the Bologna 3+2 system, nominally, the bachelor’s degree takes three years to complete, followed by two years for the master’s. Few areas of the labour market accept a completed three-year bachelor degree as sufficient to get over the barrier to entry. Pharmacy, social work and kindergarten teaching are among the exceptions. A polytechnic bachelor degree requires 3.5 - 4.5 years of full-time study. A small but increasing number eventually continue on to a polytechnic master's degree. The requirement for master's studies in polytechnics is a bachelor’s level polytechnic degree and at least three years’ work experience. The polytechnic master's degree is equivalent to a university master's in the labour market. Relatively few Finnish students complete in minimum time and as a consequence, they tend to be among the oldest graduates in Europe (Eurostudent, 2008). This point is an important variable in determining the supply of labour in Finland’s ageing society. The Ministry’s Education and Research 2011–2016 Development Plan specifically considers matters relating to getting students labour market ready in a shorter time than at present by looking at the length of time students spend and students’ welfare needs to reduce current delays.8 Some higher education statistics follow. Universities had over 168,000 enrolments in 2011, and about 145,000 were enrolled in programmes at polytechnics (all levels). Table 3 provides a summary back to academic year 2005 of enrolments in ‘science’, ‘engineering’ and all other fields of study. Given this time period, the statistics show enrolments according to both the pre- and post-Bologna arrangements. When considering enrolments, subtotalling bachelor’s and master’s enrolments provides an approximation of how many university students are enrolled in each field of education. However, where course completions are concerned, one must exclude bachelor’s degree completions, because such graduates are not considered to be qualified to enter the labour market as professionals in Finland. The table shows that the number of enrolments in bachelor degrees increased considerably over the period, as students enter the system, then remain as bachelor’s degree students for three or more years, before continuing to the master’s. A complicating factor in this analysis is that the enrolments described as ‘engineering’ represent such a high proportion of all enrolments. It has been reported that the Europe-wide average of uptake of STEM is around two per cent, with minor variations between countries. In Asia, it has also been reported, the uptake is around 20 per cent (European 8 http://www.minedu.fi/export/sites/default/OPM/Julkaisut/2012/liitteet/okm03.pdf
12
Schoolnet, n.d).9 However, Table 3 indicates that university enrolments in science and engineering exceed one-third. Most of the students shown as bachelor’s degree students in 2005 were newly enrolled students that year. In fact, over 18,000 fitted this description (about three-quarters). The table also shows the number of master’s enrolments declining. The reason for this is that students no longer start university studies by enrolling in a master’s degree. Rather, post-Bologna (2005 in the case of Finland), students enrol first for three or more years in a bachelor’s degree, before enrolling for two or more years in a master’s degree programme. The decline of about 7,000 between 2005 and 2011 in the subtotal of bachelor’s and master’s degree enrolments COULD indicate a decline in the number of students being prepared for the labour market by universities, but it could also be a quirk of the advent of the Bologna Process.
9 http://ingenious-science.eu/c/document_library/get_file?uuid=3252e85a-125c-49c2-a090-eaeb3130737a&groupId=10136
13
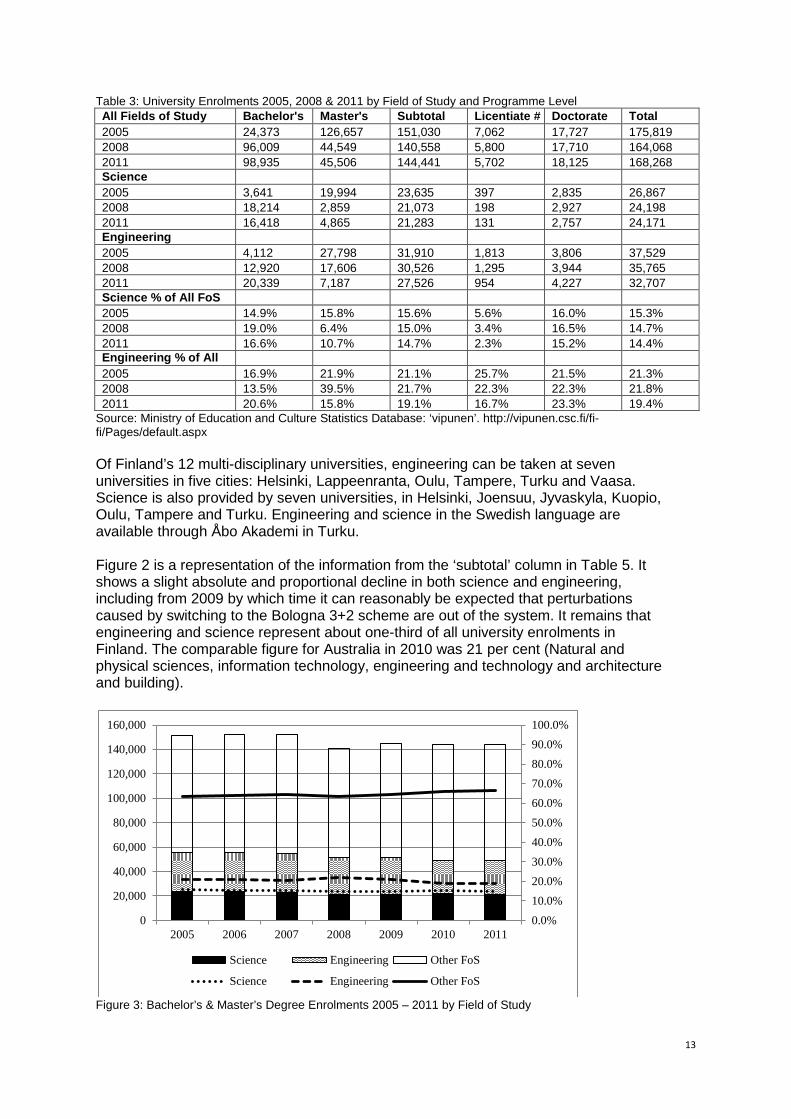
Table 3: University Enrolments 2005, 2008 & 2011 by Field of Study and Programme Level All Fields of Study Bachelor's Master's Subtotal Licentiate # Doctorate Total 2005 24,373 126,657 151,030 7,062 17,727 175,819 2008 96,009 44,549 140,558 5,800 17,710 164,068 2011 98,935 45,506 144,441 5,702 18,125 168,268 Science 2005 3,641 19,994 23,635 397 2,835 26,867 2008 18,214 2,859 21,073 198 2,927 24,198 2011 16,418 4,865 21,283 131 2,757 24,171 Engineering 2005 4,112 27,798 31,910 1,813 3,806 37,529 2008 12,920 17,606 30,526 1,295 3,944 35,765 2011 20,339 7,187 27,526 954 4,227 32,707 Science % of All FoS 2005 14.9% 15.8% 15.6% 5.6% 16.0% 15.3% 2008 19.0% 6.4% 15.0% 3.4% 16.5% 14.7% 2011 16.6% 10.7% 14.7% 2.3% 15.2% 14.4% Engineering % of All
2005 16.9% 21.9% 21.1% 25.7% 21.5% 21.3% 2008 13.5% 39.5% 21.7% 22.3% 22.3% 21.8% 2011 20.6% 15.8% 19.1% 16.7% 23.3% 19.4%
Source: Ministry of Education and Culture Statistics Database: ‘vipunen’. http://vipunen.csc.fi/fi-fi/Pages/default.aspx Of Finland’s 12 multi-disciplinary universities, engineering can be taken at seven universities in five cities: Helsinki, Lappeenranta, Oulu, Tampere, Turku and Vaasa. Science is also provided by seven universities, in Helsinki, Joensuu, Jyvaskyla, Kuopio, Oulu, Tampere and Turku. Engineering and science in the Swedish language are available through Åbo Akademi in Turku. Figure 2 is a representation of the information from the ‘subtotal’ column in Table 5. It shows a slight absolute and proportional decline in both science and engineering, including from 2009 by which time it can reasonably be expected that perturbations caused by switching to the Bologna 3+2 scheme are out of the system. It remains that engineering and science represent about one-third of all university enrolments in Finland. The comparable figure for Australia in 2010 was 21 per cent (Natural and physical sciences, information technology, engineering and technology and architecture and building).
Figure 3: Bachelor’s & Master’s Degree Enrolments 2005 – 2011 by Field of Study
0.0%10.0%20.0%30.0%40.0%50.0%60.0%70.0%80.0%90.0%100.0%
0
20,000
40,000
60,000
80,000
100,000
120,000
140,000
160,000
2005 2006 2007 2008 2009 2010 2011
Science Engineering Other FoS
Science Engineering Other FoS
14
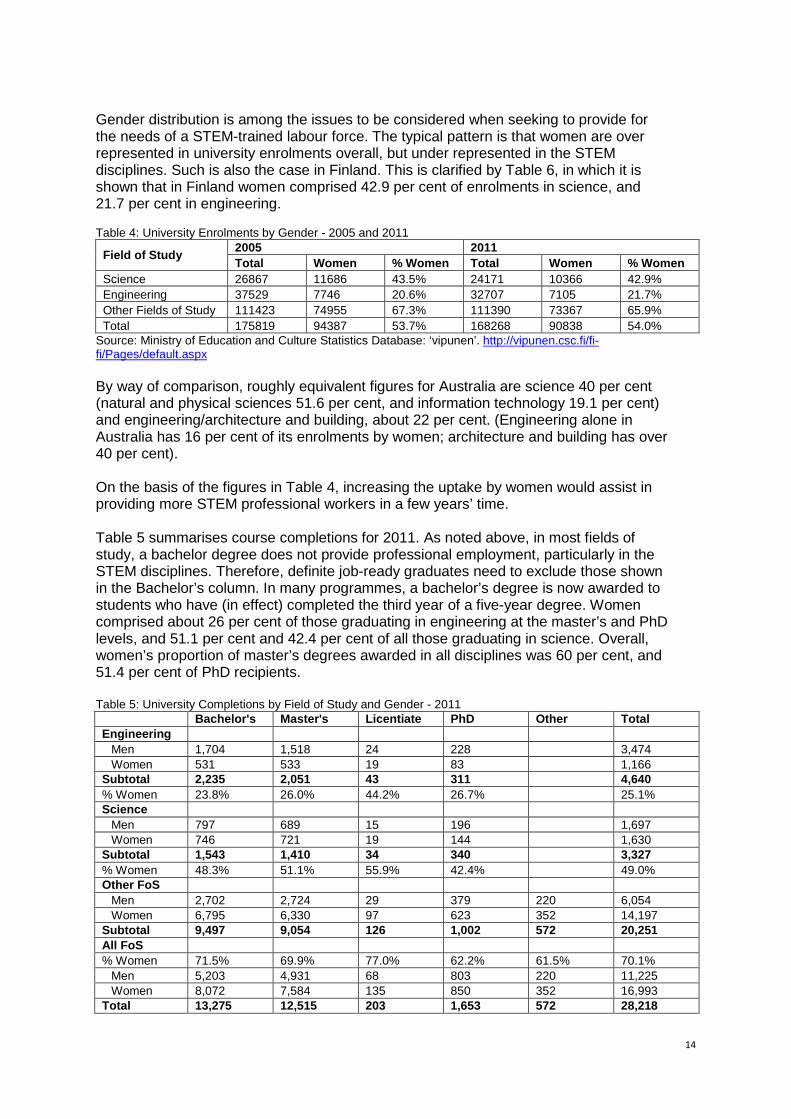
Gender distribution is among the issues to be considered when seeking to provide for the needs of a STEM-trained labour force. The typical pattern is that women are over represented in university enrolments overall, but under represented in the STEM disciplines. Such is also the case in Finland. This is clarified by Table 6, in which it is shown that in Finland women comprised 42.9 per cent of enrolments in science, and 21.7 per cent in engineering. Table 4: University Enrolments by Gender - 2005 and 2011
Field of Study 2005 2011 Total Women % Women Total Women % Women
Science 26867 11686 43.5% 24171 10366 42.9% Engineering 37529 7746 20.6% 32707 7105 21.7% Other Fields of Study 111423 74955 67.3% 111390 73367 65.9% Total 175819 94387 53.7% 168268 90838 54.0%
Source: Ministry of Education and Culture Statistics Database: ‘vipunen’. http://vipunen.csc.fi/fi-fi/Pages/default.aspx By way of comparison, roughly equivalent figures for Australia are science 40 per cent (natural and physical sciences 51.6 per cent, and information technology 19.1 per cent) and engineering/architecture and building, about 22 per cent. (Engineering alone in Australia has 16 per cent of its enrolments by women; architecture and building has over 40 per cent). On the basis of the figures in Table 4, increasing the uptake by women would assist in providing more STEM professional workers in a few years’ time. Table 5 summarises course completions for 2011. As noted above, in most fields of study, a bachelor degree does not provide professional employment, particularly in the STEM disciplines. Therefore, definite job-ready graduates need to exclude those shown in the Bachelor’s column. In many programmes, a bachelor’s degree is now awarded to students who have (in effect) completed the third year of a five-year degree. Women comprised about 26 per cent of those graduating in engineering at the master’s and PhD levels, and 51.1 per cent and 42.4 per cent of all those graduating in science. Overall, women’s proportion of master’s degrees awarded in all disciplines was 60 per cent, and 51.4 per cent of PhD recipients. Table 5: University Completions by Field of Study and Gender - 2011 Bachelor's Master's Licentiate PhD Other Total Engineering
Men 1,704 1,518 24 228 3,474 Women 531 533 19 83 1,166
Subtotal 2,235 2,051 43 311 4,640 % Women 23.8% 26.0% 44.2% 26.7% 25.1% Science
Men 797 689 15 196 1,697 Women 746 721 19 144 1,630
Subtotal 1,543 1,410 34 340 3,327 % Women 48.3% 51.1% 55.9% 42.4% 49.0% Other FoS
Men 2,702 2,724 29 379 220 6,054 Women 6,795 6,330 97 623 352 14,197
Subtotal 9,497 9,054 126 1,002 572 20,251 All FoS % Women 71.5% 69.9% 77.0% 62.2% 61.5% 70.1%
Men 5,203 4,931 68 803 220 11,225 Women 8,072 7,584 135 850 352 16,993
Total 13,275 12,515 203 1,653 572 28,218
15
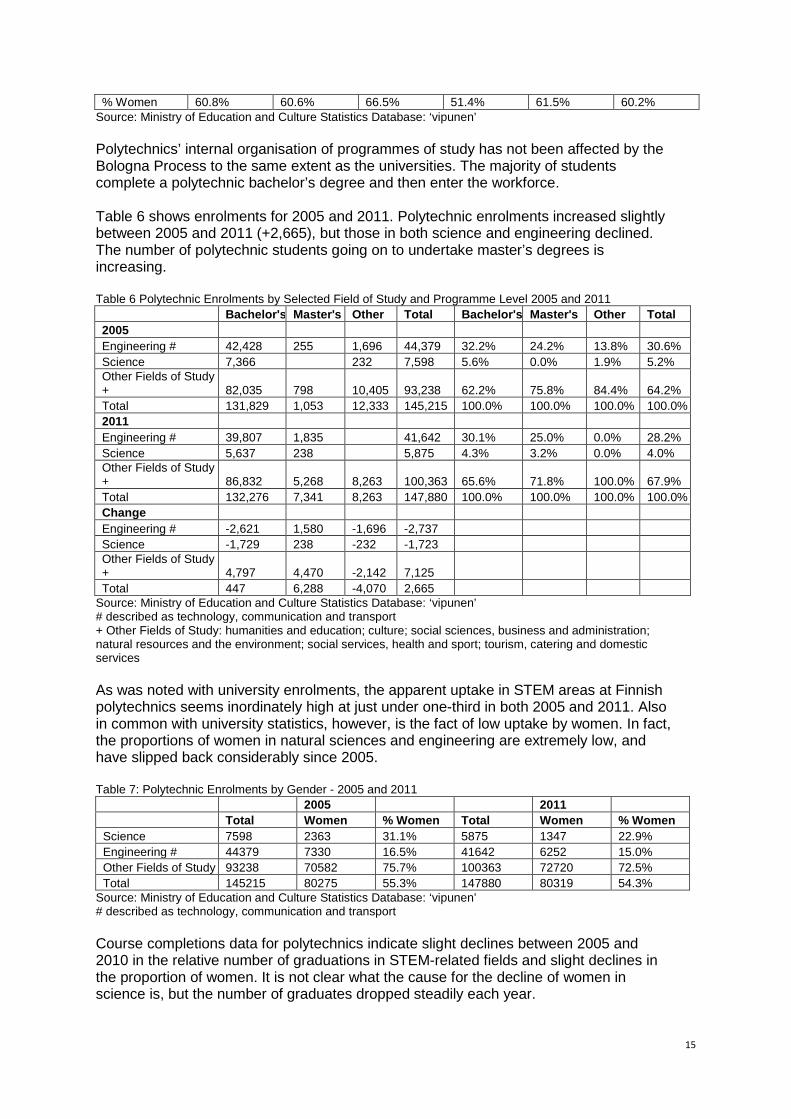
% Women 60.8% 60.6% 66.5% 51.4% 61.5% 60.2% Source: Ministry of Education and Culture Statistics Database: ‘vipunen’ Polytechnics’ internal organisation of programmes of study has not been affected by the Bologna Process to the same extent as the universities. The majority of students complete a polytechnic bachelor’s degree and then enter the workforce. Table 6 shows enrolments for 2005 and 2011. Polytechnic enrolments increased slightly between 2005 and 2011 (+2,665), but those in both science and engineering declined. The number of polytechnic students going on to undertake master’s degrees is increasing. Table 6 Polytechnic Enrolments by Selected Field of Study and Programme Level 2005 and 2011 Bachelor's Master's Other Total Bachelor's Master's Other Total 2005 Engineering # 42,428 255 1,696 44,379 32.2% 24.2% 13.8% 30.6% Science 7,366 232 7,598 5.6% 0.0% 1.9% 5.2% Other Fields of Study + 82,035 798 10,405 93,238 62.2% 75.8% 84.4% 64.2% Total 131,829 1,053 12,333 145,215 100.0% 100.0% 100.0% 100.0% 2011 Engineering # 39,807 1,835 41,642 30.1% 25.0% 0.0% 28.2% Science 5,637 238 5,875 4.3% 3.2% 0.0% 4.0% Other Fields of Study + 86,832 5,268 8,263 100,363 65.6% 71.8% 100.0% 67.9% Total 132,276 7,341 8,263 147,880 100.0% 100.0% 100.0% 100.0% Change Engineering # -2,621 1,580 -1,696 -2,737 Science -1,729 238 -232 -1,723 Other Fields of Study + 4,797 4,470 -2,142 7,125 Total 447 6,288 -4,070 2,665
Source: Ministry of Education and Culture Statistics Database: ‘vipunen’ # described as technology, communication and transport + Other Fields of Study: humanities and education; culture; social sciences, business and administration; natural resources and the environment; social services, health and sport; tourism, catering and domestic services As was noted with university enrolments, the apparent uptake in STEM areas at Finnish polytechnics seems inordinately high at just under one-third in both 2005 and 2011. Also in common with university statistics, however, is the fact of low uptake by women. In fact, the proportions of women in natural sciences and engineering are extremely low, and have slipped back considerably since 2005. Table 7: Polytechnic Enrolments by Gender - 2005 and 2011
2005 2011 Total Women % Women Total Women % Women Science 7598 2363 31.1% 5875 1347 22.9% Engineering # 44379 7330 16.5% 41642 6252 15.0% Other Fields of Study 93238 70582 75.7% 100363 72720 72.5% Total 145215 80275 55.3% 147880 80319 54.3%
Source: Ministry of Education and Culture Statistics Database: ‘vipunen’ # described as technology, communication and transport Course completions data for polytechnics indicate slight declines between 2005 and 2010 in the relative number of graduations in STEM-related fields and slight declines in the proportion of women. It is not clear what the cause for the decline of women in science is, but the number of graduates dropped steadily each year.
16
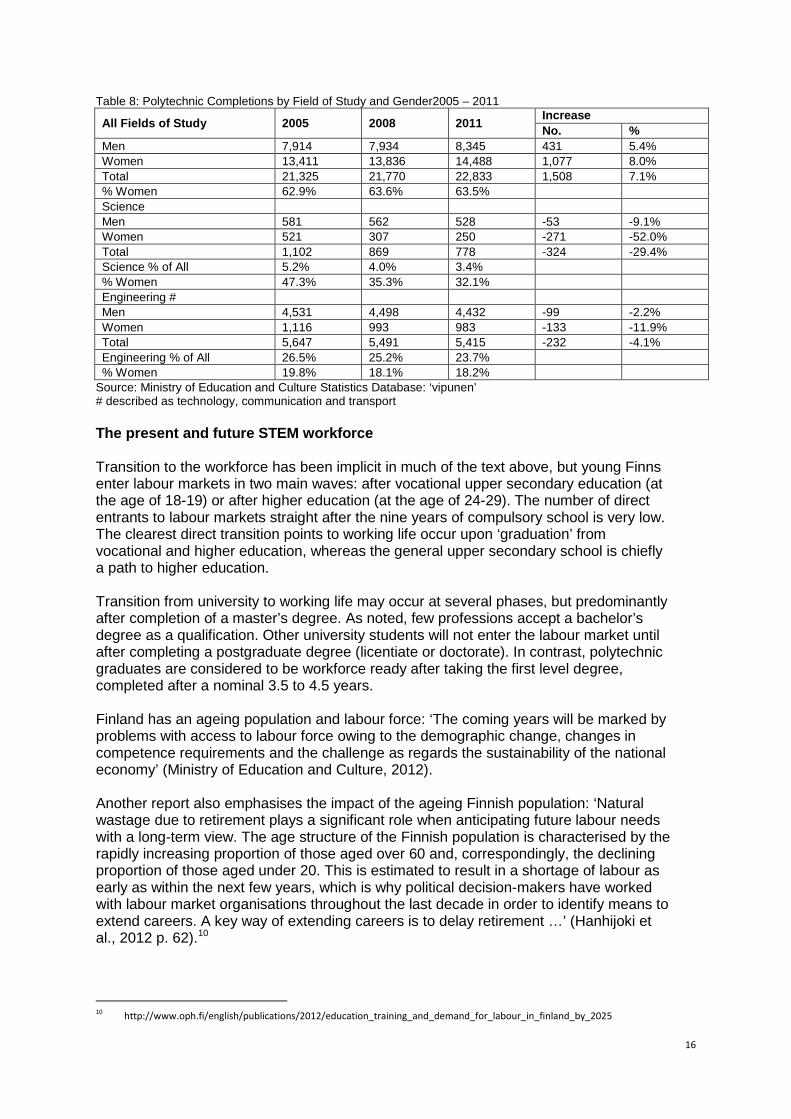
Table 8: Polytechnic Completions by Field of Study and Gender2005 – 2011
All Fields of Study 2005 2008 2011 Increase No. %
Men 7,914 7,934 8,345 431 5.4% Women 13,411 13,836 14,488 1,077 8.0% Total 21,325 21,770 22,833 1,508 7.1% % Women 62.9% 63.6% 63.5% Science Men 581 562 528 -53 -9.1% Women 521 307 250 -271 -52.0% Total 1,102 869 778 -324 -29.4% Science % of All 5.2% 4.0% 3.4% % Women 47.3% 35.3% 32.1% Engineering # Men 4,531 4,498 4,432 -99 -2.2% Women 1,116 993 983 -133 -11.9% Total 5,647 5,491 5,415 -232 -4.1% Engineering % of All 26.5% 25.2% 23.7% % Women 19.8% 18.1% 18.2%
Source: Ministry of Education and Culture Statistics Database: ‘vipunen’ # described as technology, communication and transport The present and future STEM workforce Transition to the workforce has been implicit in much of the text above, but young Finns enter labour markets in two main waves: after vocational upper secondary education (at the age of 18-19) or after higher education (at the age of 24-29). The number of direct entrants to labour markets straight after the nine years of compulsory school is very low. The clearest direct transition points to working life occur upon ‘graduation’ from vocational and higher education, whereas the general upper secondary school is chiefly a path to higher education. Transition from university to working life may occur at several phases, but predominantly after completion of a master’s degree. As noted, few professions accept a bachelor’s degree as a qualification. Other university students will not enter the labour market until after completing a postgraduate degree (licentiate or doctorate). In contrast, polytechnic graduates are considered to be workforce ready after taking the first level degree, completed after a nominal 3.5 to 4.5 years. Finland has an ageing population and labour force: ‘The coming years will be marked by problems with access to labour force owing to the demographic change, changes in competence requirements and the challenge as regards the sustainability of the national economy’ (Ministry of Education and Culture, 2012). Another report also emphasises the impact of the ageing Finnish population: ‘Natural wastage due to retirement plays a significant role when anticipating future labour needs with a long-term view. The age structure of the Finnish population is characterised by the rapidly increasing proportion of those aged over 60 and, correspondingly, the declining proportion of those aged under 20. This is estimated to result in a shortage of labour as early as within the next few years, which is why political decision-makers have worked with labour market organisations throughout the last decade in order to identify means to extend careers. A key way of extending careers is to delay retirement …’ (Hanhijoki et al., 2012 p. 62).10
10 http://www.oph.fi/english/publications/2012/education_training_and_demand_for_labour_in_finland_by_2025
17
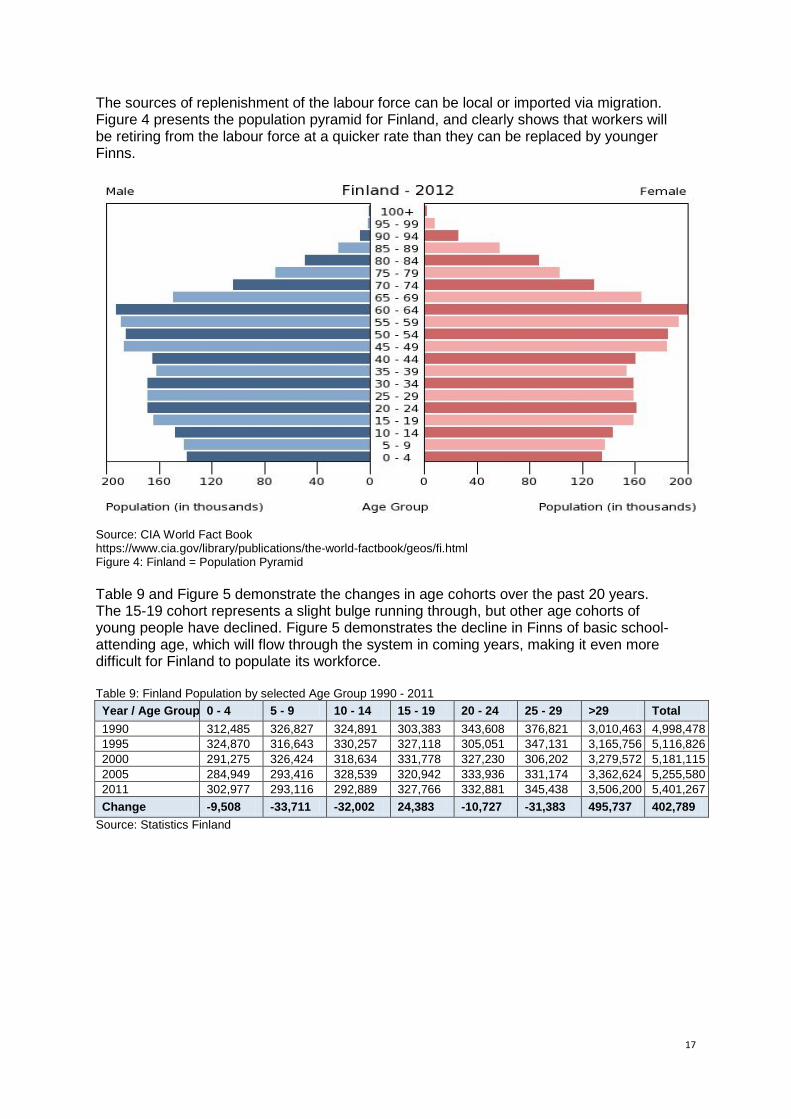
The sources of replenishment of the labour force can be local or imported via migration. Figure 4 presents the population pyramid for Finland, and clearly shows that workers will be retiring from the labour force at a quicker rate than they can be replaced by younger Finns.
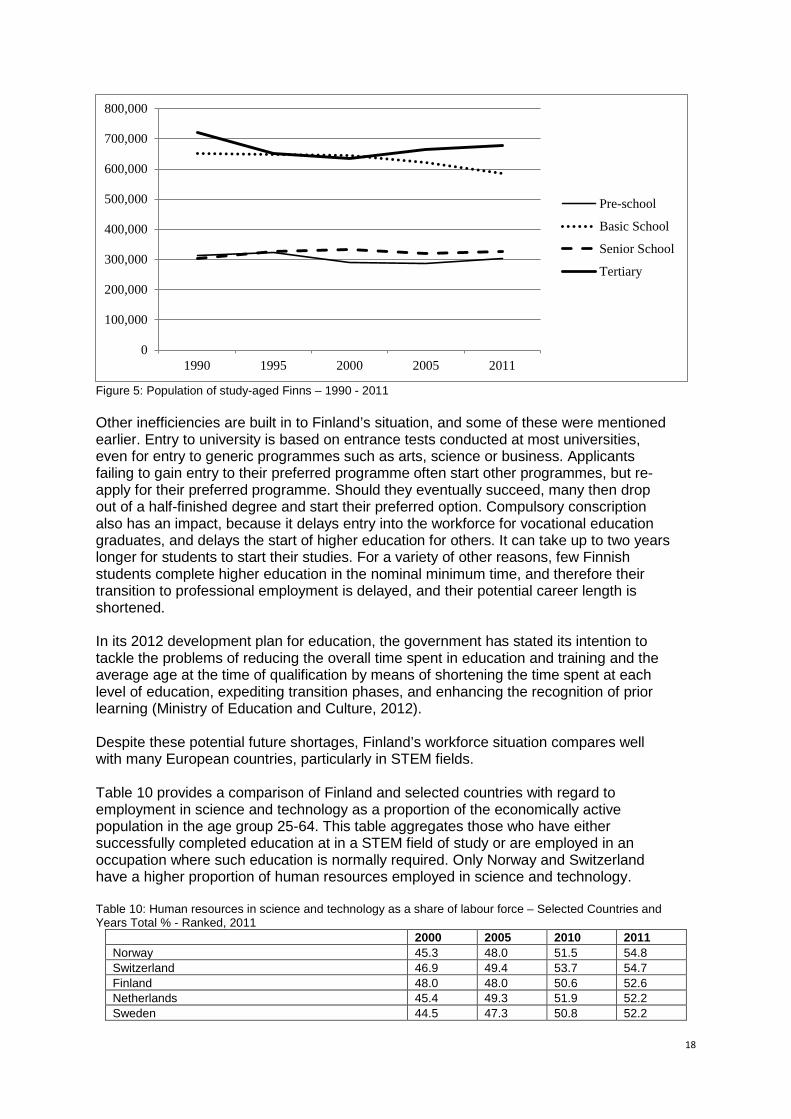
Source: CIA World Fact Book https://www.cia.gov/library/publications/the-world-factbook/geos/fi.html Figure 4: Finland = Population Pyramid Table 9 and Figure 5 demonstrate the changes in age cohorts over the past 20 years. The 15-19 cohort represents a slight bulge running through, but other age cohorts of young people have declined. Figure 5 demonstrates the decline in Finns of basic school-attending age, which will flow through the system in coming years, making it even more difficult for Finland to populate its workforce. Table 9: Finland Population by selected Age Group 1990 - 2011 Year / Age Group 0 - 4 5 - 9 10 - 14 15 - 19 20 - 24 25 - 29 >29 Total 1990 312,485 326,827 324,891 303,383 343,608 376,821 3,010,463 4,998,478 1995 324,870 316,643 330,257 327,118 305,051 347,131 3,165,756 5,116,826 2000 291,275 326,424 318,634 331,778 327,230 306,202 3,279,572 5,181,115 2005 284,949 293,416 328,539 320,942 333,936 331,174 3,362,624 5,255,580 2011 302,977 293,116 292,889 327,766 332,881 345,438 3,506,200 5,401,267 Change -9,508 -33,711 -32,002 24,383 -10,727 -31,383 495,737 402,789
Source: Statistics Finland
18
Figure 5: Population of study-aged Finns – 1990 - 2011 Other inefficiencies are built in to Finland’s situation, and some of these were mentioned earlier. Entry to university is based on entrance tests conducted at most universities, even for entry to generic programmes such as arts, science or business. Applicants failing to gain entry to their preferred programme often start other programmes, but re-apply for their preferred programme. Should they eventually succeed, many then drop out of a half-finished degree and start their preferred option. Compulsory conscription also has an impact, because it delays entry into the workforce for vocational education graduates, and delays the start of higher education for others. It can take up to two years longer for students to start their studies. For a variety of other reasons, few Finnish students complete higher education in the nominal minimum time, and therefore their transition to professional employment is delayed, and their potential career length is shortened. In its 2012 development plan for education, the government has stated its intention to tackle the problems of reducing the overall time spent in education and training and the average age at the time of qualification by means of shortening the time spent at each level of education, expediting transition phases, and enhancing the recognition of prior learning (Ministry of Education and Culture, 2012). Despite these potential future shortages, Finland’s workforce situation compares well with many European countries, particularly in STEM fields. Table 10 provides a comparison of Finland and selected countries with regard to employment in science and technology as a proportion of the economically active population in the age group 25-64. This table aggregates those who have either successfully completed education at in a STEM field of study or are employed in an occupation where such education is normally required. Only Norway and Switzerland have a higher proportion of human resources employed in science and technology. Table 10: Human resources in science and technology as a share of labour force – Selected Countries and Years Total % - Ranked, 2011
2000 2005 2010 2011 Norway 45.3 48.0 51.5 54.8 Switzerland 46.9 49.4 53.7 54.7 Finland 48.0 48.0 50.6 52.6 Netherlands 45.4 49.3 51.9 52.2 Sweden 44.5 47.3 50.8 52.2
0
100,000
200,000
300,000
400,000
500,000
600,000
700,000
800,000
1990 1995 2000 2005 2011
Pre-school
Basic School
Senior School
Tertiary
19
Denmark 42.7 49.1 51.0 51.5 United Kingdom 36.9 41.2 45.1 51.2 Belgium 41.7 46.2 49.3 49.6 Ireland 32.4 39.1 45.9 48.8 France 34.7 40.2 43.8 48.1 Estonia 39.8 44.8 45.0 47.0 Germany 41.5 43.1 44.8 44.9 Slovenia 30.6 37.3 40.8 42.4 EU (27 countries) 34.0 37.8 40.5 42.3 Austria 31.4 37.9 39.2 40.5 Czech Republic 31.5 34.5 37.8 36.0 Slovakia 27.7 30.7 33.5 34.1 Greece 25.3 29.3 32.4 33.6 Portugal 17.3 21.5 23.9 27.0
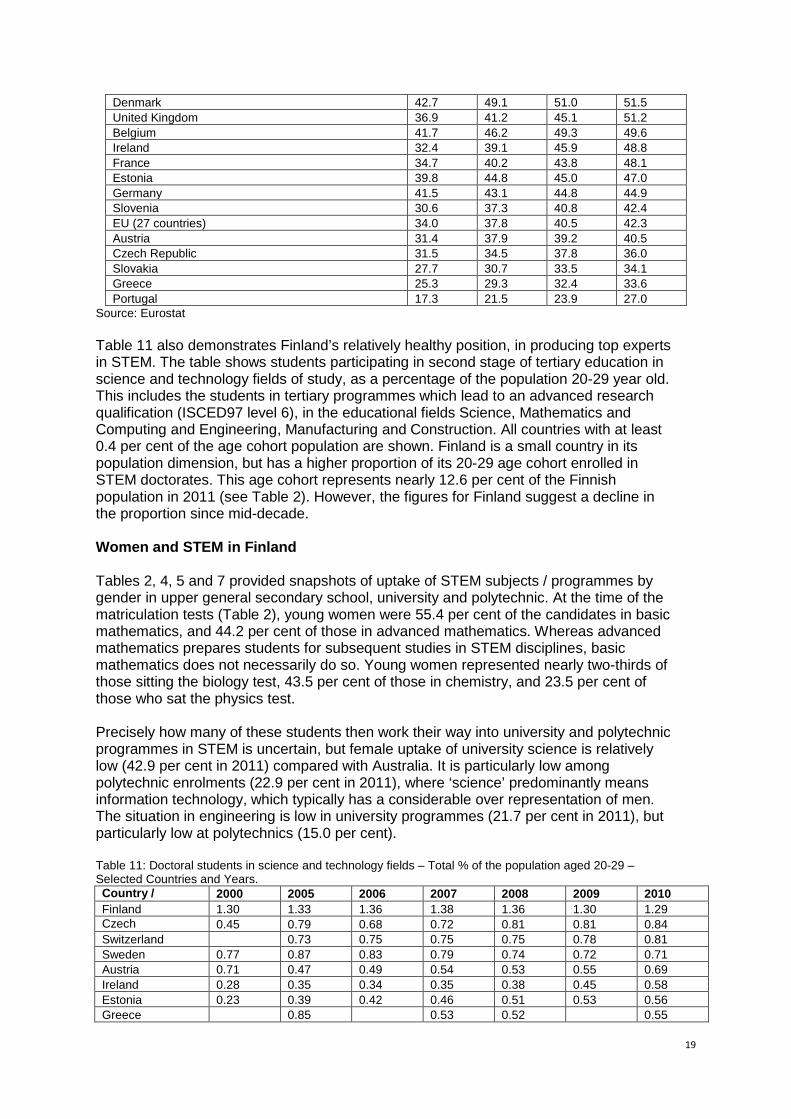
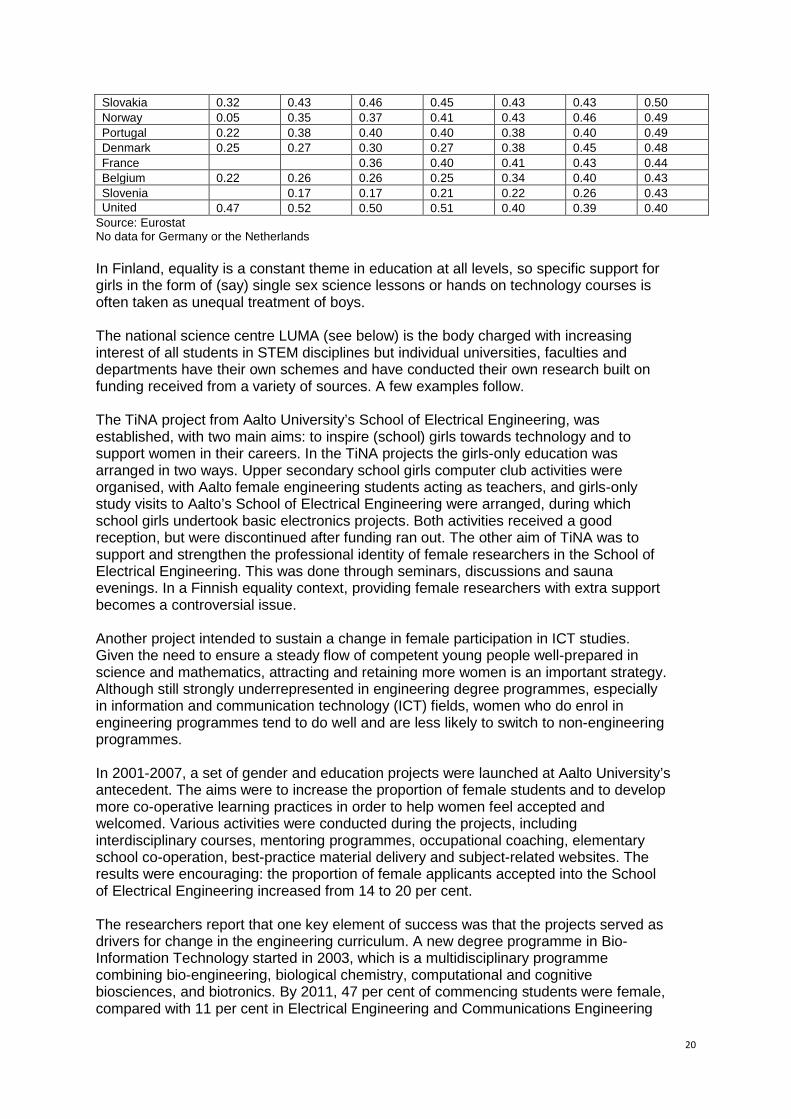
Source: Eurostat Table 11 also demonstrates Finland’s relatively healthy position, in producing top experts in STEM. The table shows students participating in second stage of tertiary education in science and technology fields of study, as a percentage of the population 20-29 year old. This includes the students in tertiary programmes which lead to an advanced research qualification (ISCED97 level 6), in the educational fields Science, Mathematics and Computing and Engineering, Manufacturing and Construction. All countries with at least 0.4 per cent of the age cohort population are shown. Finland is a small country in its population dimension, but has a higher proportion of its 20-29 age cohort enrolled in STEM doctorates. This age cohort represents nearly 12.6 per cent of the Finnish population in 2011 (see Table 2). However, the figures for Finland suggest a decline in the proportion since mid-decade. Women and STEM in Finland Tables 2, 4, 5 and 7 provided snapshots of uptake of STEM subjects / programmes by gender in upper general secondary school, university and polytechnic. At the time of the matriculation tests (Table 2), young women were 55.4 per cent of the candidates in basic mathematics, and 44.2 per cent of those in advanced mathematics. Whereas advanced mathematics prepares students for subsequent studies in STEM disciplines, basic mathematics does not necessarily do so. Young women represented nearly two-thirds of those sitting the biology test, 43.5 per cent of those in chemistry, and 23.5 per cent of those who sat the physics test. Precisely how many of these students then work their way into university and polytechnic programmes in STEM is uncertain, but female uptake of university science is relatively low (42.9 per cent in 2011) compared with Australia. It is particularly low among polytechnic enrolments (22.9 per cent in 2011), where ‘science’ predominantly means information technology, which typically has a considerable over representation of men. The situation in engineering is low in university programmes (21.7 per cent in 2011), but particularly low at polytechnics (15.0 per cent). Table 11: Doctoral students in science and technology fields – Total % of the population aged 20-29 – Selected Countries and Years. Country /
2000 2005 2006 2007 2008 2009 2010
Finland 1.30 1.33 1.36 1.38 1.36 1.30 1.29 Czech
0.45 0.79 0.68 0.72 0.81 0.81 0.84
Switzerland 0.73 0.75 0.75 0.75 0.78 0.81 Sweden 0.77 0.87 0.83 0.79 0.74 0.72 0.71 Austria 0.71 0.47 0.49 0.54 0.53 0.55 0.69 Ireland 0.28 0.35 0.34 0.35 0.38 0.45 0.58 Estonia 0.23 0.39 0.42 0.46 0.51 0.53 0.56 Greece 0.85 0.53 0.52 0.55
20
Slovakia 0.32 0.43 0.46 0.45 0.43 0.43 0.50 Norway 0.05 0.35 0.37 0.41 0.43 0.46 0.49 Portugal 0.22 0.38 0.40 0.40 0.38 0.40 0.49 Denmark 0.25 0.27 0.30 0.27 0.38 0.45 0.48 France 0.36 0.40 0.41 0.43 0.44 Belgium 0.22 0.26 0.26 0.25 0.34 0.40 0.43 Slovenia 0.17 0.17 0.21 0.22 0.26 0.43 United
0.47 0.52 0.50 0.51 0.40 0.39 0.40
Source: Eurostat No data for Germany or the Netherlands In Finland, equality is a constant theme in education at all levels, so specific support for girls in the form of (say) single sex science lessons or hands on technology courses is often taken as unequal treatment of boys. The national science centre LUMA (see below) is the body charged with increasing interest of all students in STEM disciplines but individual universities, faculties and departments have their own schemes and have conducted their own research built on funding received from a variety of sources. A few examples follow. The TiNA project from Aalto University’s School of Electrical Engineering, was established, with two main aims: to inspire (school) girls towards technology and to support women in their careers. In the TiNA projects the girls-only education was arranged in two ways. Upper secondary school girls computer club activities were organised, with Aalto female engineering students acting as teachers, and girls-only study visits to Aalto’s School of Electrical Engineering were arranged, during which school girls undertook basic electronics projects. Both activities received a good reception, but were discontinued after funding ran out. The other aim of TiNA was to support and strengthen the professional identity of female researchers in the School of Electrical Engineering. This was done through seminars, discussions and sauna evenings. In a Finnish equality context, providing female researchers with extra support becomes a controversial issue. Another project intended to sustain a change in female participation in ICT studies. Given the need to ensure a steady flow of competent young people well-prepared in science and mathematics, attracting and retaining more women is an important strategy. Although still strongly underrepresented in engineering degree programmes, especially in information and communication technology (ICT) fields, women who do enrol in engineering programmes tend to do well and are less likely to switch to non-engineering programmes. In 2001-2007, a set of gender and education projects were launched at Aalto University’s antecedent. The aims were to increase the proportion of female students and to develop more co-operative learning practices in order to help women feel accepted and welcomed. Various activities were conducted during the projects, including interdisciplinary courses, mentoring programmes, occupational coaching, elementary school co-operation, best-practice material delivery and subject-related websites. The results were encouraging: the proportion of female applicants accepted into the School of Electrical Engineering increased from 14 to 20 per cent. The researchers report that one key element of success was that the projects served as drivers for change in the engineering curriculum. A new degree programme in Bio-Information Technology started in 2003, which is a multidisciplinary programme combining bio-engineering, biological chemistry, computational and cognitive biosciences, and biotronics. By 2011, 47 per cent of commencing students were female, compared with 11 per cent in Electrical Engineering and Communications Engineering
21
that year. Similarly, the female proportion in Information Networks was 36 per cent in 2011, compared with 15 per cent in more traditional programmes. While the projects have clearly succeeded in attracting more women into ICT fields, they have also created a positive and friendly atmosphere where girls feel welcomed. The GISEL project11 (Gender Issues, Science Education and Learning), conducted between 2002 and 2005 sought to find ways to influence the attitudes of girls towards science and technology when choosing a career. Finnish ninth grade comprehensive school students’ were surveyed about their interest in and experiences of science and science education. According to the findings, boys and girls, on average, have different interests and everyday experiences in the various school subjects or scientific disciplines. A specific wish expressed about the teaching of science was to increase the number of visits to industry and museums as well as to involve experts in science classes. Specifically, this wish was expressed by girls. Most of the survey questions were adopted from the international ROSE (Relevance of Science Education) survey, a transnational project with about 40 countries involved and anchored by the University of Oslo, Norway. A related project was the ASTeL (Arithmetic, Science, Technology, and e-Learning) design research project. The goal of this project was to develop a gender sensitive web-based science and technology learning environment for primary school and teacher education. The National Science Education Centre LUMA12 (LU = luonnontieteet, ‘natural science’ in Finnish, and MA for matematiikka) Much of civic life in Finland is centralised in its organisation, but with a clear view to ensuring equality of access and opportunity across the whole of Finland. So it is with the national science centre. LUMA has been Finland’s Science Education Centre since 2003 and is coordinated by the University of Helsinki. However, it had a same-named antecedent in the form of a 1996 Ministry of Education / National Board of Education project to improve skills in mathematics and natural sciences. In that project, 24 municipalities participated in a pilot project, in addition to 10 teacher training schools. Later the project spread to almost 80 schools in addition to the teacher training schools. One of the objectives was to raise mathematics and natural sciences skills to the top quarter in the OECD countries, and to arouse pupils’ interest in these subjects. Many of the quantitative objectives of the project were not reached, but many signs of qualitative improvements were seen as the project spread in the year 2000 (LUMA Support Group, 2002)13. Central to the LUMA project were the promotion of effective continuing education, e-learning and creating materials to support learning. Furthermore, LUMA brought together researchers from universities, school teaching staff, Ministry education bureaucrats and professionals working in industry. The media also showed interest in instruction in mathematics and natural sciences. Improving mathematics and natural sciences skills also became a joint venture on the municipal level and many actions were taken to further this cause. One of the goals was to raise students’ interest in learning mathematics and natural sciences among girls.
11 http://roseproject.no/network/countries/finland/fin-lavonen-2005.pdf 12 http://www.oph.fi/english/sources_of_information/projects/luma
http://www.helsinki.fi/luma/english/ 13 http://www.oph.fi/download/48078_Luma_final_report.pdf
22
The final evaluation report for the project was presented in December 2002. The subsequent outcome was the establishment of LUMA as Finland’s Science Education Centre. It exists as an umbrella organisation which aims to promote the learning, studying and teaching of natural science, mathematics, computer science and technology at all levels by bringing together schools, universities, industry, teachers and others. LUMA’s aim is to get children and youth inspired by LUMA subjects and technology. The activities of the LUMA Centre bring together a range of subjects, institutions and educational levels from primary education to higher education. LUMA was founded in December 2003 and inaugurated in February 2004, through the interactions of the Ministry of Education, the National Board of Education, three ‘science-related’ faculties of the University of Helsinki, the City of Helsinki Education Department (which represents Finnish municipalities in the Centre) and several industry organisations. The activities of the centre are funded by cooperating institutions, grant-providing foundations, the University of Helsinki and university departments. The Helsinki University of Technology joined the management team from 1 January 2007. (HUT became part of Aalto University during 2009 following institutional mergers). Aalto is the only university provider of engineering and architectural programmes in the capital region. LUMA has seven subject-specific resource centres, five interactive online magazines and four free learning environments for schools at the university (F2k Physics Laboratory, Chemistry Lab Gadolin, Computer Science Lab Linkki and Mathematics Lab Origo). The LUMA Centre cooperates with a range of partners on both national and international levels. Networking is an important function of the centre. The activities of the centre are planned, drafted and implemented by a working group made up of twenty expert members and a coordinator acting as the leader of the group. Most of the members are teacher training professionals. The members are responsible for the visibility of their own discipline in the activities of the centre. The working group convenes twice a year. Working with teachers is essential in the life of the centre. Teachers’ ideas and wishes are listened to on a continuous basis. Interaction with pupils, teachers, researchers and cooperation partners offers new approaches to teacher training and the development of teacher training methods. Students of mathematical and scientific subjects occupy the roles of both actors and learners in the activities of the centre. Most of them are training to become subject teachers or primary school teachers. In teacher training, the activities are either integrated into degree studies and research, or students take part in them in conjunction with their studies and acquire valuable work experience at the same time. The contact persons for the resource centres are usually students about to finish their teacher training or postgraduate students in subject departments. Students in teacher training are actively involved in organising different kinds of events. For example, dozens of students from various departments and students of primary education have volunteered as group leaders for children and families at the annual science fair. A network of science education centres has been set up with other Finnish universities, for example, at Aalto University, Tampere University of Technology and the Universities of Eastern Finland, Jyväskylä and Oulu. Other centres are located in the regional cities of Kokkola and Lappeenranta. Swedish-language activities have been developed with the Resurscenter för matematik, naturvetenskap och teknik i skolan project, of which more is written below (located in Turku). New centres open up from time to time. Activities for children and young people
23
Supporting lifelong learning for children and young people is centred on activity clubs, summer camps and the Ksenonit virtual club, Science Day and the Luova webzine for young people. The activities aim at providing children and young people with positive experiences in the LUMA subjects. At the same time, natural interaction with the scientific community at the university is fostered. A range of club activities take place in the LUMA Centre. For example, Summamutikka clubs (mathematics) are activity clubs aimed at primary school children which take place in schools in different parts of the Greater Helsinki area. The clubs acquaint children with mathematics using handicrafts, sports and games. The clubs offer positive experiences for both mathematically talented children and children who face difficulties and motivation problems in learning mathematics in school. Science clubs are arranged every school year. There are separate clubs for 1st to 3rd graders, 4th to 6th graders and 7th to 9th graders. Each science club typically provides five two-hour sessions once a week in the Department of Chemistry’s ChemistryLab Gadolin. Each club is designed according to the age group of the participants. The clubs provide introduction into research and chemical experiments. The leaders of the clubs are typically pre-teachers of chemistry about to complete their studies. Science camps, technology camps and Summamutikka mathematics camps are held during the summer holidays. The LUMA Centre arranges several camps each summer. The activities take place during the day on weekdays. The camps, just like the clubs, are led by students in teacher training. The Millennium Youth Camp is an international activity which LUMA has been arranging in partnership with the Technology Academy Finland since 2010. The aim is to increase the youth’s interest towards natural sciences, mathematics, and technology, as well as to spread information on Finnish expertise and innovations, and familiarise the campers with the study and career opportunities in Finland. The camp is divided into ten theme-groups. There were 1,600 international applications for the 30 places in 2012. (Technology Academy Finland includes the Finnish Academy of Technology (TTA), the Swedish Academy of Engineering Sciences in Finland (STV) and the Industry Council, whose members represent leading Finnish industrial companies). There are several webzines. For example, the aim of the Jippo (in Finnish) is to provide information, fun facts and experiments to children aged from 7 to 12. The goal is to encourage children to take up scientific pastimes and to lower the threshold for asking and wondering about things. Even though the information on the site consists of scientific facts, the point is to make it fun and comprehensible for the children. The Luova (in Finnish) and MyScience (in English) webzines for young people are recent innovations from the LUMA Centre. The aim of the science webzine is to give young people the opportunity to take part in the joys of discovery, invention and creativity associated with science, research and innovation. The goal is to support interest in science and open up new perspectives on natural science, mathematics and technology. Jippo Science Day is held every spring at the Kumpula Science Campus. During the event, guests can attend lectures (suitable for children), try out ‘real science’ in laboratories and take part in playful competitions. The instructors of the activities are typically pre-service teachers of mathematics and natural sciences at the end of their studies.
24
Several other science and STEM competitions have been held, or are conducted on-going. The Tämä Toimii (This works!) competition has young children designing something that ‘works’ from a box of ‘bits’ supplied by competition organisers. Activities for teachers LUMA supports teachers’ lifelong learning. Workshops, summer courses and an annual LUMA Science Fair are organised for subject teachers and primary school teachers. For example, almost a hundred workshops on various issues have been organised for teachers on weekdays during the school terms. Information on coming events, new teaching materials and research findings is available in a monthly email newsletter and on the LUMA Sanomat webzine. About 10,000 teachers, students in teacher training and education researchers subscribe to the newsletter as well as other specialists in areas ranging from primary education to business and industry. Several resource centres support subject-specific activities with the material available on their websites. BioPop promotes biology teaching and encourages the study of biology at all grade levels. It works in co-operation with interested partners at the University of Helsinki, in schools and in other organisations. BioPop is a part of the LUMA centre and is co-ordinated by the University of Helsinki’s Department of Biological and Environmental Sciences. It provides courses and workshops for biology and class teachers, organises science clubs for children and provides different kinds of activities for biology schoolteachers, children and young people. F2k (est. 2006 from antecedent arrangements) has a general aim to promote understanding of and interest in physics and technology among Finns. This aim is approached primarily by developing physics education; the centre operates within Physics Teacher Education in the Department of Physics of the University of Helsinki. F2k provides in-service teacher training by offering workshops and summer courses for both physics teachers and class teachers. Science clubs and summer camps for children aged 8-14 years have been held since 2004. For secondary school students, the F2k-laboratory offers hands-on experimentation in modern physics and a grasp of contemporary research in physics. It also organises outreach events in co-operation with the organisations whose purpose is to make science better known. Geopiste is a national resource for teaching geography point, which serves the geography and biology teachers, class teachers, student teachers, and others interested in the teaching of geography. Geopiste brings together key geography teaching materials, as well as collecting and disseminating information about new teaching ideas and methods. Kemma has as its main objectives to support in-service and pre-service chemistry teachers in increasing the standard of learning and competence in chemistry, and also to develop chemistry education and chemistry education research, keeping in mind the need to increase the interest towards the subject itself. Summamutikka is the resource centre for teaching and learning of mathematics as a part of the National LUMA Centre and the Department of Mathematics and Statistics. Summamutikka offers ideas and advice on how to teach activity-based mathematics. It supports and develops the teaching and learning of mathematics and to promote the interest of mathematics among all ages.
25
Lumo Centre is an expert service, influencing the teaching of LUMA subjects at school and fostering co-operation between various fields of study and learning Resurscenter för matematik, naturvetenskap och teknik i skolan The Resource Centre for Mathematics, Science and Engineering at School is a resource for Finland’s Swedish-speaking population. It is a collaboration between the Swedish Academy of Engineering in Finland (STV) in collaboration with the Centre for Lifelong Learning at Åbo Akademi University and the Swedish language polytechnic in Åbo (the Swedish name for Turku). (STV is a Swedish technical-scientific academy, founded in 1921. Its Purpose is to extend the technological know-how to better promote the industry, sustainable development and a positive outlook on technology in our society, with a special responsibility to promote this activity in Swedish in Finland. Among its activities is promoting interest and education in mathematics, science and technology in schools and colleges). LUMA: some conclusions Within the LUMA Centre itself, many of the practices within the University of Helsinki STEM departments start from ideas from teachers and students. Practices that start within one discipline area are often transported to other disciplines. Teachers are typically interested in what works, and they are motivated to improve their teaching. Usually there are no top-down demands relating to how a teacher teaches; teachers are allowed to improve their own teaching. New LUMA centres are being started progressively across Finland, often through the interest of academics in regional universities and polytechnics. Other related matters Finnish Science Centre: Heureka In common with many countries, Finland has a permanent science centre that hosts visits from the general public and schools. It has regular and changing themed displays and is located in the Helsinki region. A planetarium was added a few years ago. Much as it is an excellent facility, it is no more remarkable than say Science Works in Melbourne or Questacom in Canberra. As was noted earlier, one of the findings of the GISEL survey was that year nine students appreciated the opportunity to visit such facilities. The Kearney report14 mentions several other matters reported by the Finnish respondents to the survey: • inquiry based learning has been a principle underlying all curriculum subjects,
including STEM in Finland it has since 2004; • In Finland rather than organising for STEM higher education students or
professionals to come into the school, there are programmes in place allowing teachers and students to visit industrial organizations to increase their knowledge of STEM professions.
• in Finland, ICT is in fact used significantly more in other subjects (as illustrated by the results of SITES 2006 - Second Information Technology in Education Studies15), and STEM teachers are said to be very critical about the use of ICT and educational software.
14 http://spice.eun.org/c/document_library/get_file?p_l_id=16292&folderId=16435&name=DLFE-9323.pdf 15 http://www.iea.nl/fileadmin/user_upload/Publications/Electronic_versions/SITES_2006_Technical_Report.pdf
26
• in some countries, including Finland specific guidelines are given for its use in STEM teaching and learning. The use of technology is a cross-curricular theme, which has to be respected in the teaching of all subjects, including STEM.
A final word Finland is different. Particularly in the context of its school education, many matters relating to teaching, learning and persistence are dealt with as part of overall policies and goals of education for the Finnish population. In some ways, therefore, is not necessarily a good country to look at when seeking specific programmes or projects that might increase the uptake of STEM disciplines by students, including female students, elsewhere. The studies undertaken in Finland, typically with financial support from Finnish or European funding agencies, and Finnish input into European and international projects on STEM uptake do not reveal any ‘silver bullet’ solutions to flagging demand for undertaking STEM-related studies in other countries. It is also not clear that programmes and projects that come through LUMA have been assessed for success or failure; rather continuous change occurs as teachers try to improve their own teaching and their students’ learning. This practice is unlikely to be different in other countries, but the status of teachers, their autonomy and the fact that they are spared much of the ‘bureaucracy’ and testing regimes that are in place in other countries mean improve the chance of having a highly motivated teaching workforce. Finland perhaps finds itself ahead of the game in many regards. Tables and commentary above indicate that Finland already has higher rates of study in STEM fields than are typical in most countries, higher rates of persistence to the end of schooling and into higher education, the highest proportion in Europe of doctoral enrolments in science and technology disciplines (Table 11), and one of the highest proportions of its human resources in science and technology (Table 10). One area in which Finnish STEM uptake is not notably advanced compared with elsewhere is in the gender distribution. Women are in the majority in higher education overall (about 54 per cent), but there are extreme gender disparities within fields of study. Within universities, health and related areas are highly feminised (medicine 62 per cent, veterinary science 90 per cent, dentistry 67 per cent and pharmacy 74 per cent), as are the humanities (74 per cent) and education (82 per cent). Only in business, sports science, natural sciences and engineering are women not in the majority. At the polytechnics, women are in the majority in most fields of study, but not so in science and engineering. Given the demographic situation with an ageing population and workforce, low natural replacement and low rate of migration, it will be important for the ‘production’ of science and technology workers in Finland to continue. Perhaps the main potential source is to lure young women away from fields in which they are greatly over represented.
27
References Aarrevaara, T. (2007). Enhancing universities in Finland. Journal of Finance and
Management in Colleges and Universities, 4, 261-292. Aarrevaara, T., Dobson, I. & Elander, C. (2009). Brave new world: Higher education
reform in Finland. Higher Education Management and Policy, 21(2, 89 – 106). CIA. (2012). World Fact Book Retrieved from
https://www.cia.gov/library/publications/the-world-factbook/geos/fi.html EHEA. National Report regarding the Bologna Process implementation 2009-2012.
Retrieved from http://www.ehea.info/Uploads/National%20reports/Finland.pdf Eurostudent. (2008). Social and economic conditions of student life in Europe. Final
Report. Eurostudent III 2005 – 2008. European Schoolnet. (n.d.). Science, technology, engineering and mathematics
education. Overcoming the challenges in Europe. Retrieved from http://ingenious-science.eu/c/document_library/get_file?uuid=3252e85a-125c-49c2-a090-eaeb3130737a&groupId=10136
Hanhijoki, I., Katajisto, J., Kimari, M., & Savioja, H. (2012). Education, training and demand for labour in Finland by 2025. Retrieved from http://www.oph.fi/english/publications/2012/education_training_and_demand_for_labour_in_finland_by_2025
Hancock, L. (2011). Why are Finland’s schools so successful? Smithsonian Magazine, September. Retrieved from http://www.smithsonianmag.com/people-places/Why-Are-Finlands-Schools-Successful.html?c=y&page=1
Helsingin Kaupunki. (n.d.) Oman äidinkielen, kotikielen ja ylläpitokielen opetus – opas kouluille. (Author: City of Helsinki. Mother tongue, home language…)
Kearney, C. (2011). Efforts to increase students’ interest in pursuing science, technology, engineering and mathematics studies and careers. National measures taken by 21 of European Schoolnet’s member countries – 2011 Report.
LUMA Support Group. (2002). Finnish knowledge in mathematics and sciences in 2002. Final report of Luma programme. Retrieved from http://www.oph.fi/download/48078_Luma_final_report.pdf
Ministry of Education and Culture. (n.d.). [website]. Retrieved from http://www.minedu.fi/OPM/Koulutus/koulutuspolitiikka/linjaukset_ohjelmat_ja_hankkeet/?lang=en
Ministry of Education and Culture. (2012). Education and Research 2011–2016. A development plan. Reports of the Ministry of Education and Culture, Finland 2012:3. Retrieved from http://www.minedu.fi/export/sites/default/OPM/Julkaisut/2012/liitteet/okm03.pdf
OPH (National Board of Education) (n.d-a). Education. Retrieved from http://www.oph.fi/english/education/
OPH (National Board of Education) (n.d-b). Teachers in General Education. Retrieved from http://www.oph.fi/english/education/teachers/teachers_in_general_education
Sahlberg, P. (2009). A short history of educational reform in Finland. Retrieved from http://192.192.169.112/filedownload/%E8%8A%AC%E8%98%AD%E6%95%99%E8%82%B2/A%20short%20history%20of%20educational%20reform%20in%20Finland%20FINAL.pdf
Sahlberg, P. (2011). Finnish Lessons. Teachers College Press, Teachers College, Columbia University, New York, USA.
Solsten E., & Meditz, S. (Eds.) (1988). Finland: A Country Study. Washington: GPO for the Library of Congress, 1988. Retrieved from http://countrystudies.us/finland/
Taivalkoski, M. (2002). Background: War reparations proved beneficial for Finnish economic development. Helsingin Sanomat, 3 September 2002. Retrieved from http://www2.hs.fi/english/archive/news.asp?id=20020903IE12

28