construction roundtable may 4, 2004 newark, nj fta risk assessment
TRANSCRIPT
Construction RoundtableMay 4, 2004Newark, NJ
FTA Risk Assessment
Agenda
Definitions of Risk Assessment Outline Risk Analysis Process Outline Risk Mitigation Process FTA Risk Assessment Status
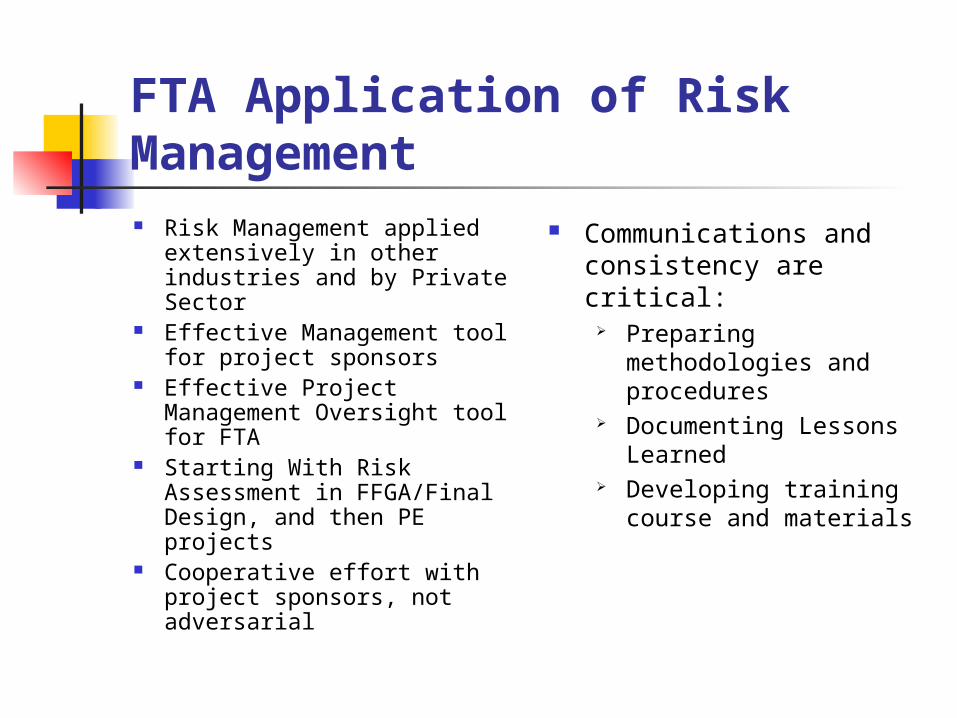
FTA Application of Risk Management Risk Management applied
extensively in other industries and by Private Sector
Effective Management tool for project sponsors
Effective Project Management Oversight tool for FTA
Starting With Risk Assessment in FFGA/Final Design, and then PE projects
Cooperative effort with project sponsors, not adversarial
Communications and consistency are critical:
Preparing methodologies and procedures
Documenting Lessons Learned
Developing training course and materials
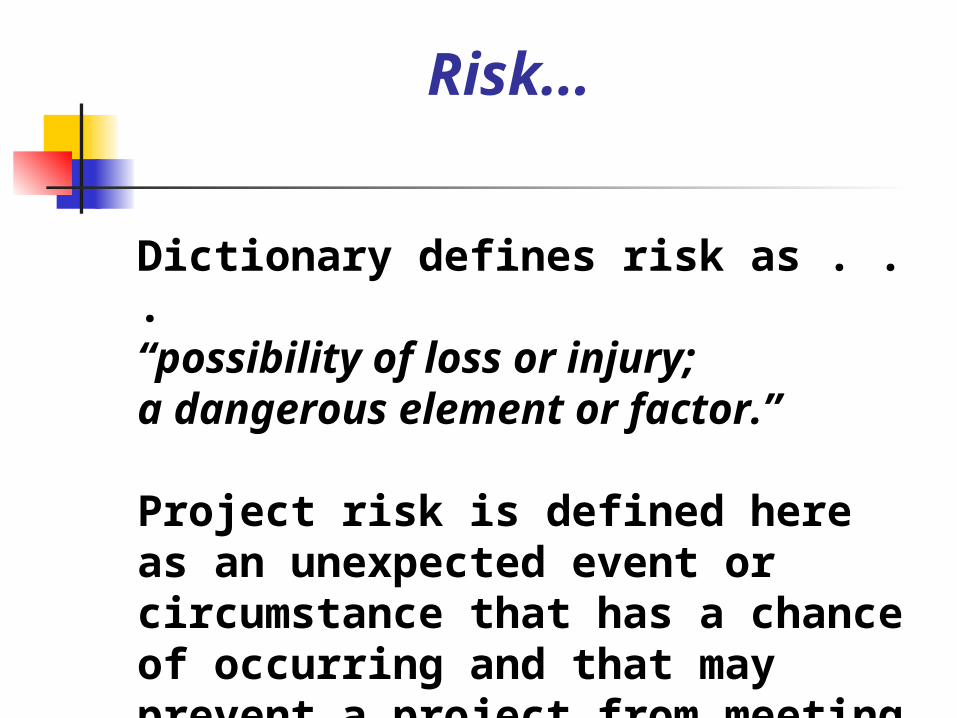
Risk...
Dictionary defines risk as . . . “possibility of loss or injury;a dangerous element or factor.”
Project risk is defined here as an unexpected event or circumstance that has a chance of occurring and that may prevent a project from meeting its schedule and cost estimate.
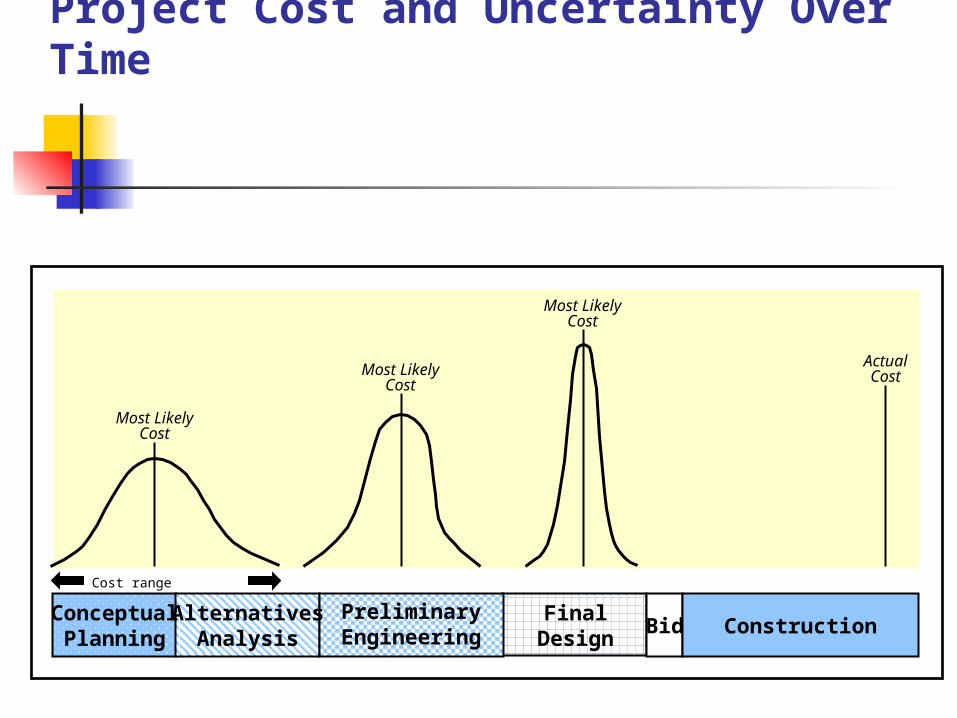
ConceptualPlanning
AlternativesAnalysis
ConstructionFinal
DesignBid
PreliminaryEngineering
Most LikelyCost
Most LikelyCost
Most LikelyCost
ActualCost
Cost range
Project Cost and Uncertainty Over Time
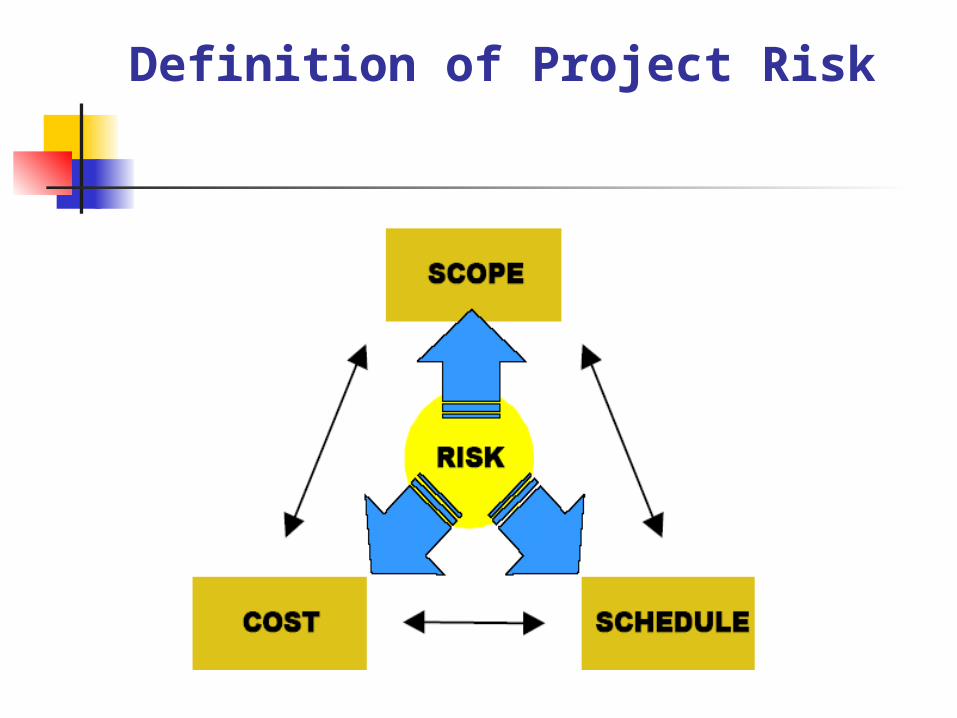
Definition of Project Risk
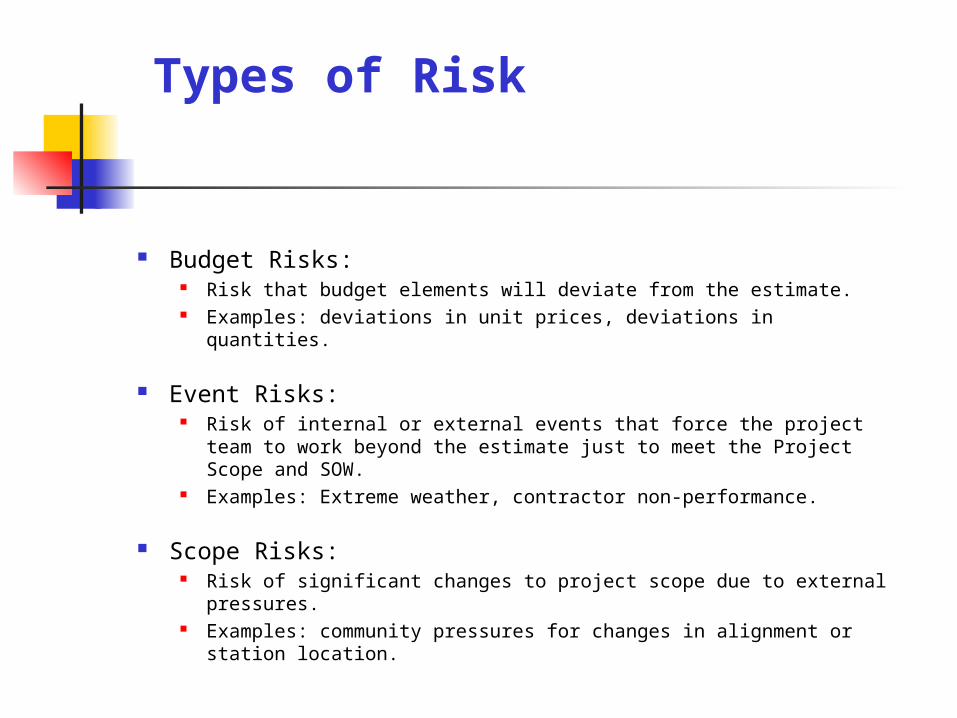
Budget Risks: Risk that budget elements will deviate from the estimate. Examples: deviations in unit prices, deviations in quantities.
Event Risks: Risk of internal or external events that force the project team to
work beyond the estimate just to meet the Project Scope and SOW.
Examples: Extreme weather, contractor non-performance.
Scope Risks: Risk of significant changes to project scope due to external
pressures. Examples: community pressures for changes in alignment or
station location.
Types of Risk
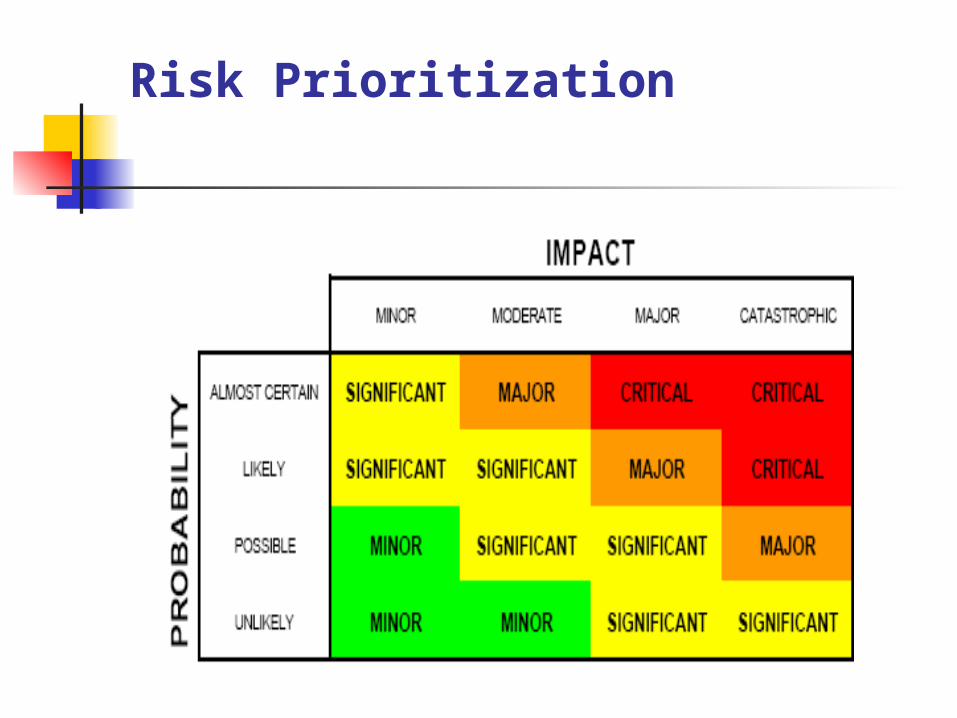
Risk Prioritization
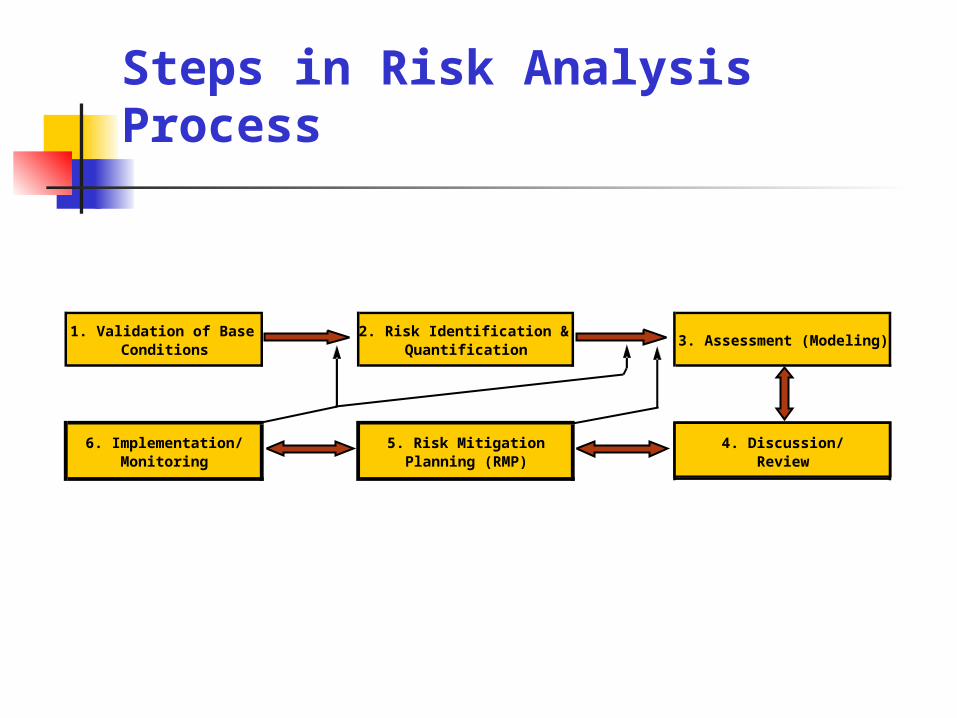
1. Validation of Base Conditions
2. Risk Identification & Quantification
3. Assessment (Modeling)
6. Implementation/Monitoring
5. Risk MitigationPlanning (RMP)
4. Discussion/Review
Steps in Risk Analysis Process
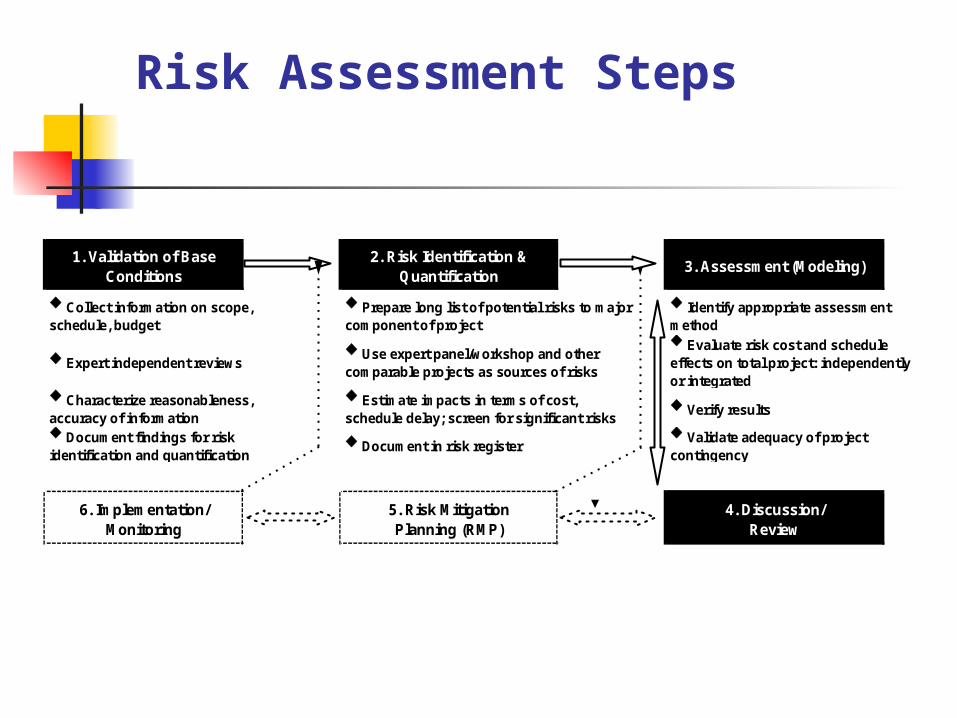
1. Validation of Base Conditions
2. Risk Identification & Quantification
3. Assessment (Modeling)
u Verify results
6. Implementation/Monitoring
5. Risk MitigationPlanning (RMP)
4. Discussion/Review
u Expert independent reviews
u Identify appropriate assessment methodu Evaluate risk cost and schedule effects on total project: independently or integrated
u Validate adequacy of project contingency
u Collect information on scope, schedule, budget
u Characterize reasonableness, accuracy of informationu Document findings for risk identification and quantification
u Prepare long list of potential risks to major component of project
u Use expert panel/workshop and other comparable projects as sources of risks
u Estimate impacts in terms of cost, schedule delay; screen for significant risks
u Document in risk register
Risk Assessment Steps
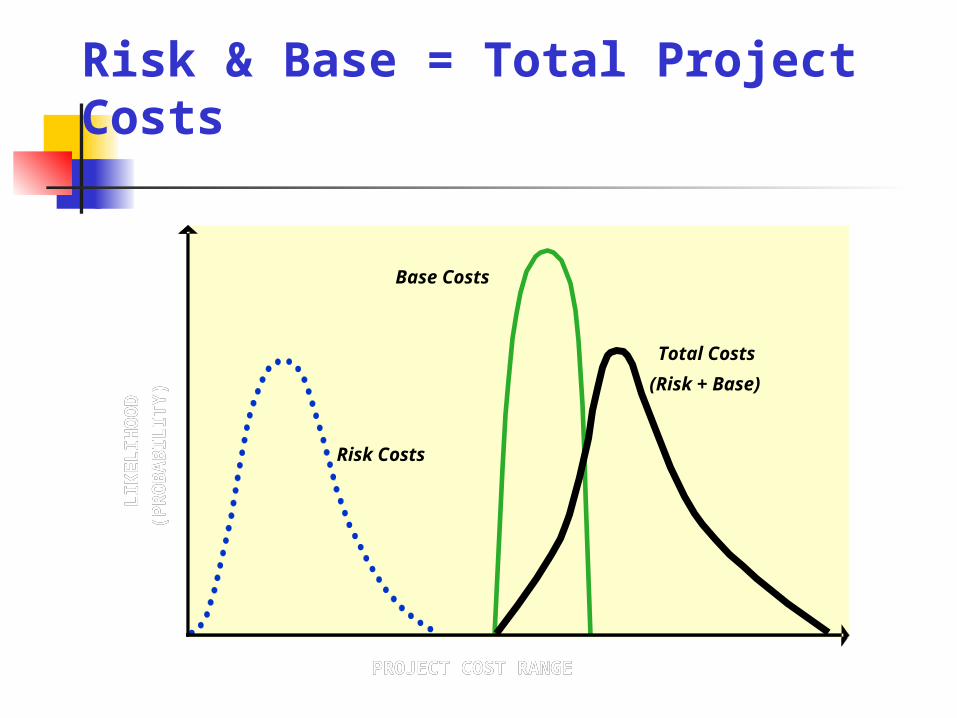
Base Costs
Risk Costs
Total Costs
(Risk + Base)
PROJECT COST RANGE
LIK
EL
IHO
OD
(PR
OB
AB
ILIT
Y)
Base Costs
Risk Costs
Total Costs
(Risk + Base)
PROJECT COST RANGE
LIK
EL
IHO
OD
(PR
OB
AB
ILIT
Y)
Risk & Base = Total Project Costs
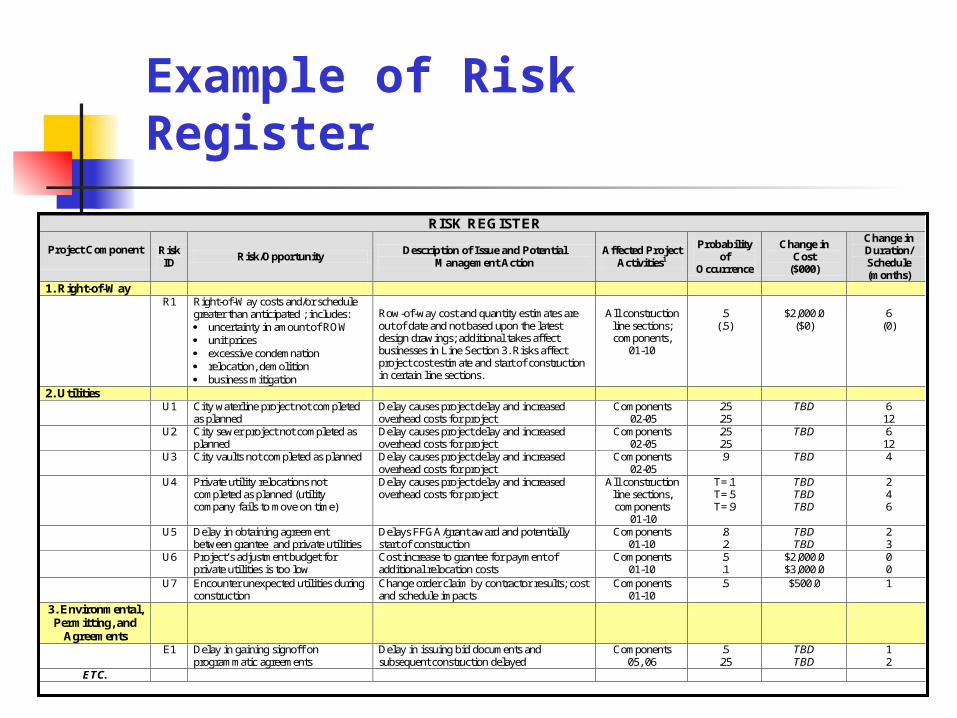
RISK REGISTER
Project Component
Risk ID
Risk/Opportunity Description of Issue and Potential
Management Action Affected Project
Activities1
Probability of
Occurrence
Change in Cost
($000)
Change in Duration/ Schedule (months)
1. Right-of-Way R1 Right-of-Way costs and/or schedule
greater than anticipated ; includes: uncertainty in amount of ROW unit prices excessive condemnation relocation, demolition business mitigation
Row-of-way cost and quantity estimates are out of date and not based upon the latest design drawings; additional takes affect businesses in Line Section 3. Risks affect project cost estimate and start of construction in certain line sections.
All construction line sections; components,
01-10
.5 (.5)
$2,000.0 ($0)
6 (0)
2. Utilities U1 City waterline project not completed
as planned Delay causes project delay and increased overhead costs for project
Components 02-05
.25
.25 TBD 6
12 U2 City sewer project not completed as
planned Delay causes project delay and increased overhead costs for project
Components 02-05
.25
.25 TBD 6
12 U3 City vaults not completed as planned Delay causes project delay and increased
overhead costs for project Components
02-05 .9 TBD 4
U4 Private utility relocations not completed as planned (utility company fails to move on time)
Delay causes project delay and increased overhead costs for project
All construction line sections, components
01-10
T=.1 T=.5 T=.9
TBD TBD TBD
2 4 6
U5 Delay in obtaining agreement between grantee and private utilities
Delays FFGA/grant award and potentially start of construction
Components 01-10
.8
.2 TBD TBD
2 3
U6 Project’s adjustment budget for private utilities is too low
Cost increase to grantee for payment of additional relocation costs
Components 01-10
.5
.1 $2,000.0 $3,000.0
0 0
U7 Encounter unexpected utilities during construction
Change order claim by contractor results; cost and schedule impacts
Components 01-10
.5
$500.0 1
3. Environmental, Permitting, and
Agreements
E1 Delay in gaining signoff on programmatic agreements
Delay in issuing bid documents and subsequent construction delayed
Components 05, 06
.5 .25
TBD TBD
1 2
ETC.
Example of Risk Register

Each cost estimate line item and each risk item is assigned a probability curve.
Probability curves are chosen by evaluating the behavior of each risk item.
Probability curves whose parameters can easily be understood and estimated by project participants are preferred.
Commonly-used distributions are shown here. Clockwise, from top left: Cumulative, Triangular, Exponential, Discrete, and Pert
probability distributions.
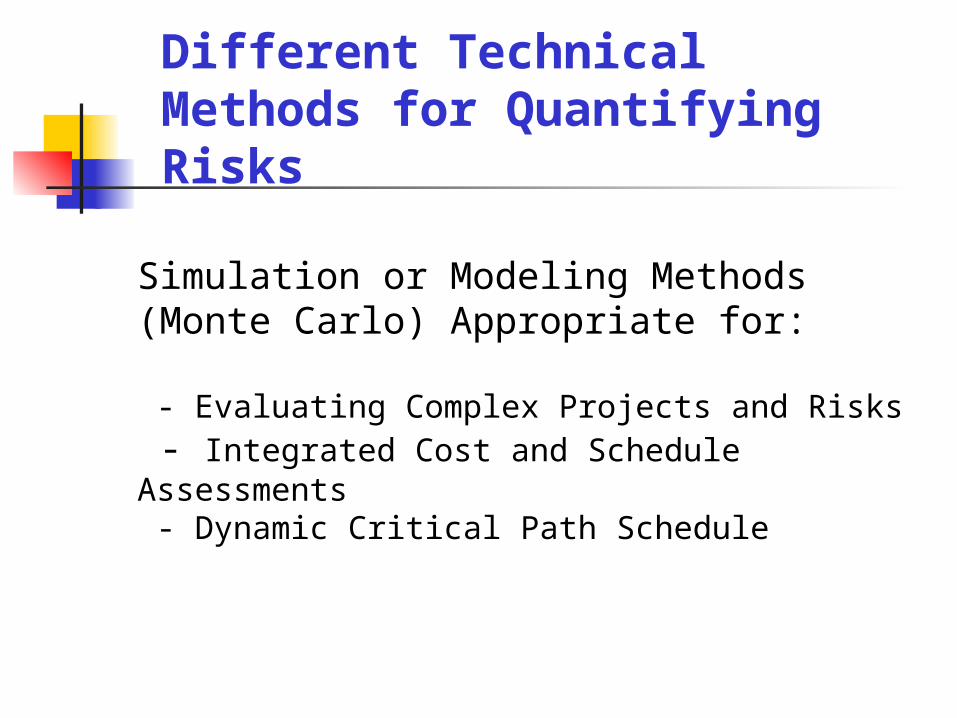
Different Technical Methods for Quantifying Risks
Simulation or Modeling Methods (Monte Carlo) Appropriate for:
- Evaluating Complex Projects and Risks - Integrated Cost and Schedule Assessments - Dynamic Critical Path Schedule
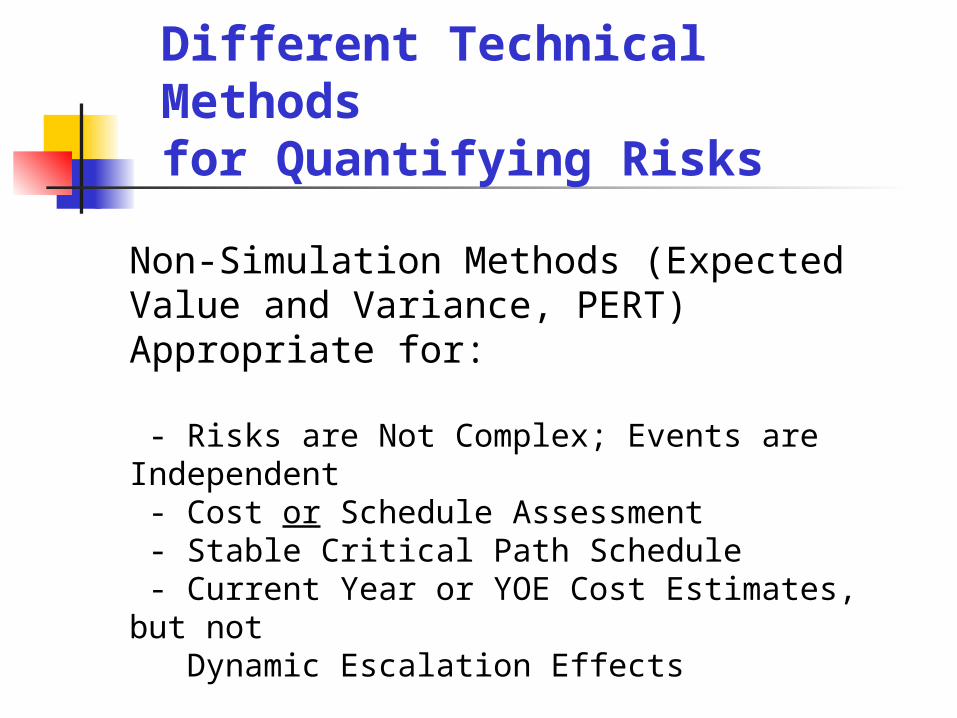
Different Technical Methodsfor Quantifying Risks
Non-Simulation Methods (Expected Value and Variance, PERT) Appropriate for:
- Risks are Not Complex; Events are Independent - Cost or Schedule Assessment - Stable Critical Path Schedule - Current Year or YOE Cost Estimates, but not Dynamic Escalation Effects
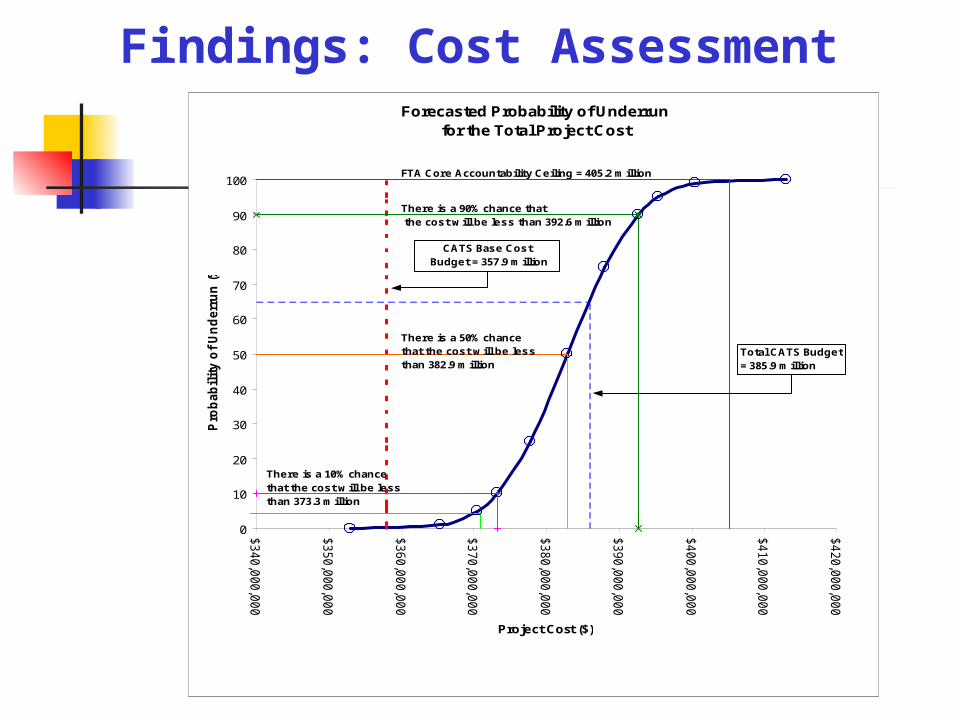
Forecasted Probability of Underrun for the Total Project Cost
0
10
20
30
40
50
60
70
80
90
100
$340,0
00,0
00
$350,0
00,0
00
$360,0
00,0
00
$370,0
00,0
00
$380,0
00,0
00
$390,0
00,0
00
$400,0
00,0
00
$410,0
00,0
00
$420,0
00,0
00
Project Cost ($)
Pro
bab
ilit
y o
f U
nd
err
un
(%
)
There is a 50% chance that the cost w ill be less than 382.9 million
There is a 90% chance that the cost will be less than 392.6 million
There is a 10% chance that the cost w ill be less than 373.3 million
Total CATS Budget = 385.9 million
CATS Base Cost Budget = 357.9 million
FTA Core Accountability Ceiling = 405.2 million
Findings: Cost Assessment
-
0%10%20%30%40%50%60%70%80%90%
100%
4/12
/08
6/1/
08
7/21
/08
9/9/
08
10/2
9/08
12/1
8/08
2/6/
09
3/28
/09
5/17
/09
7/6/
09
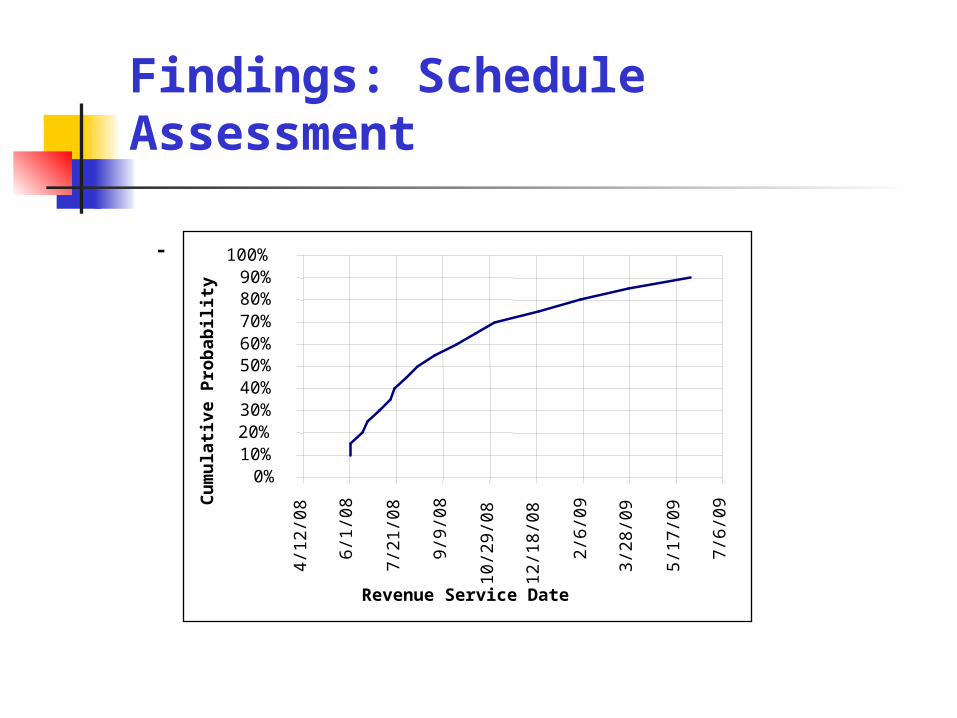
Revenue Service Date
Cu
mu
lati
ve P
rob
abili
ty
Findings: Schedule Assessment
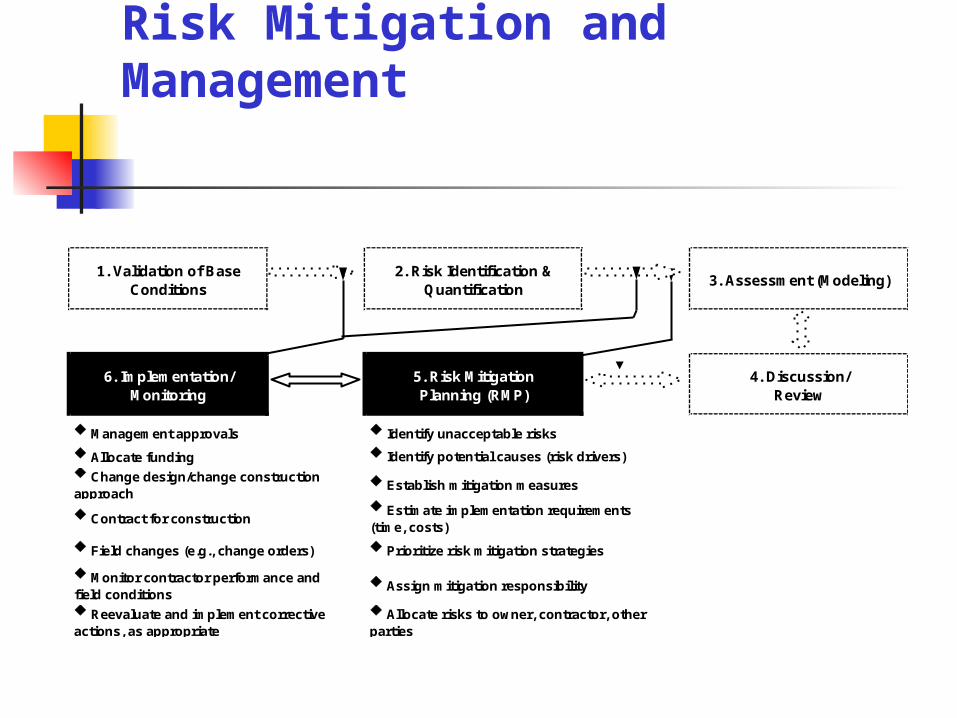
Risk Mitigation and Management
1. Validation of Base Conditions
2. Risk Identification & Quantification
3. Assessment (Modeling)
6. Implementation/Monitoring
5. Risk MitigationPlanning (RMP)
4. Discussion/Review
u Allocate funding
u Monitor contractor performance and field conditionsu Reevaluate and implement corrective actions, as appropriate
u Identify unacceptable risks
u Identify potential causes (risk drivers)
u Establish mitigation measures
u Estimate implementation requirements (time, costs)
u Prioritize risk mitigation strategies
u Assign mitigation responsibility
u Allocate risks to owner, contractor, other parties
u Management approvals
u Change design/change construction approach
u Contract for construction
u Field changes (e.g., change orders)
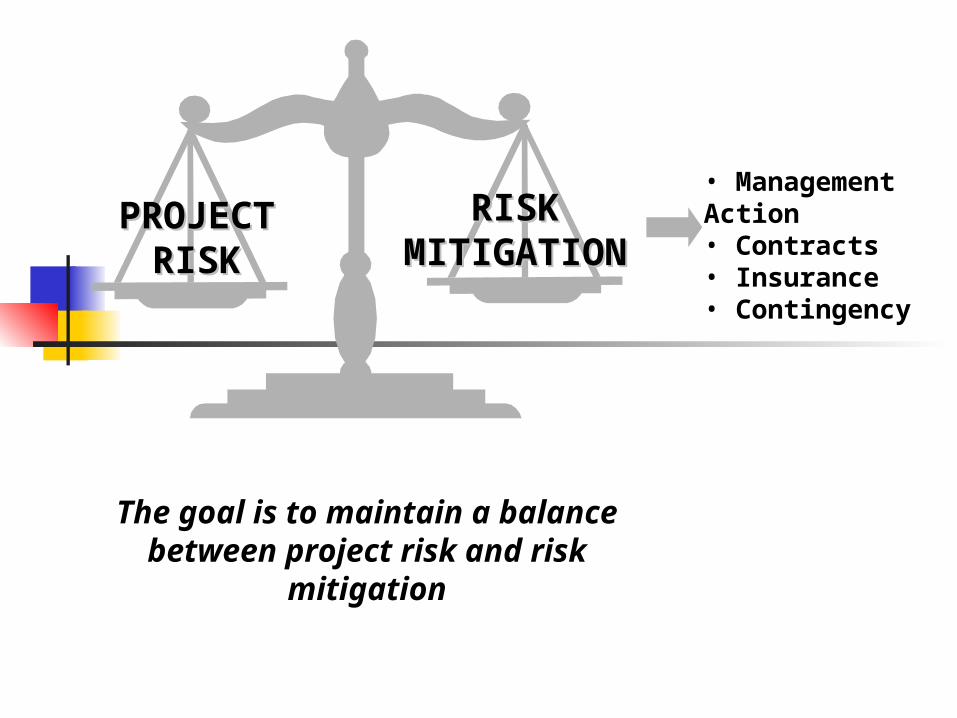
The goal is to maintain a balance between project risk and risk mitigation
PROJECTPROJECTRISKRISK
RISKRISKMITIGATIONMITIGATION
• Management Action• Contracts• Insurance• Contingency
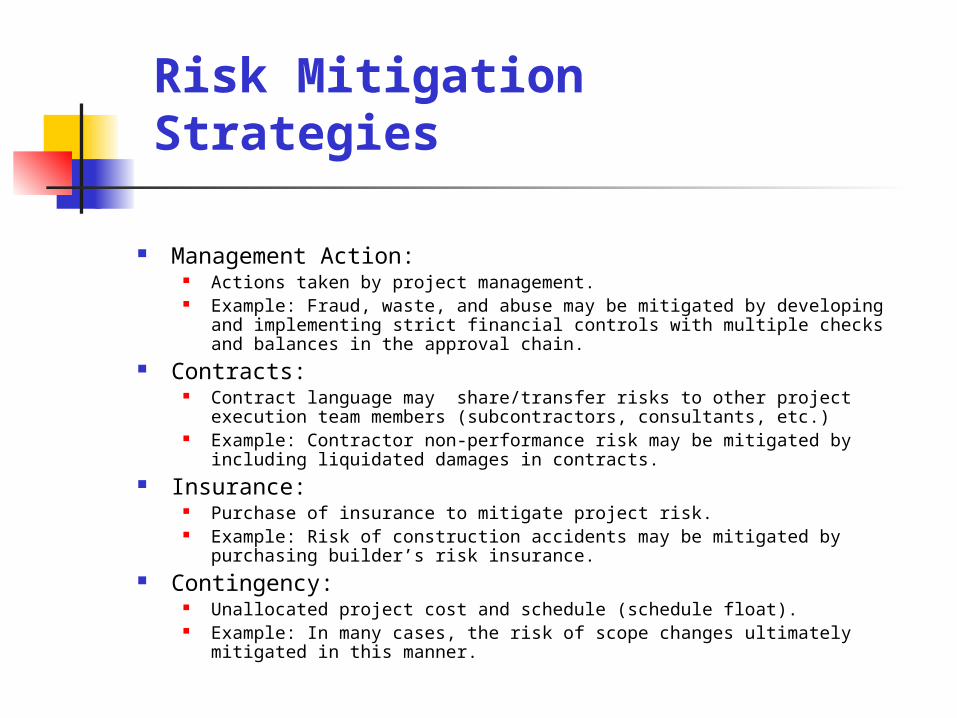
Management Action: Actions taken by project management. Example: Fraud, waste, and abuse may be mitigated by developing and
implementing strict financial controls with multiple checks and balances in the approval chain.
Contracts: Contract language may share/transfer risks to other project execution
team members (subcontractors, consultants, etc.) Example: Contractor non-performance risk may be mitigated by including
liquidated damages in contracts. Insurance:
Purchase of insurance to mitigate project risk. Example: Risk of construction accidents may be mitigated by purchasing
builder’s risk insurance. Contingency:
Unallocated project cost and schedule (schedule float). Example: In many cases, the risk of scope changes ultimately mitigated in
this manner.
Risk Mitigation Strategies
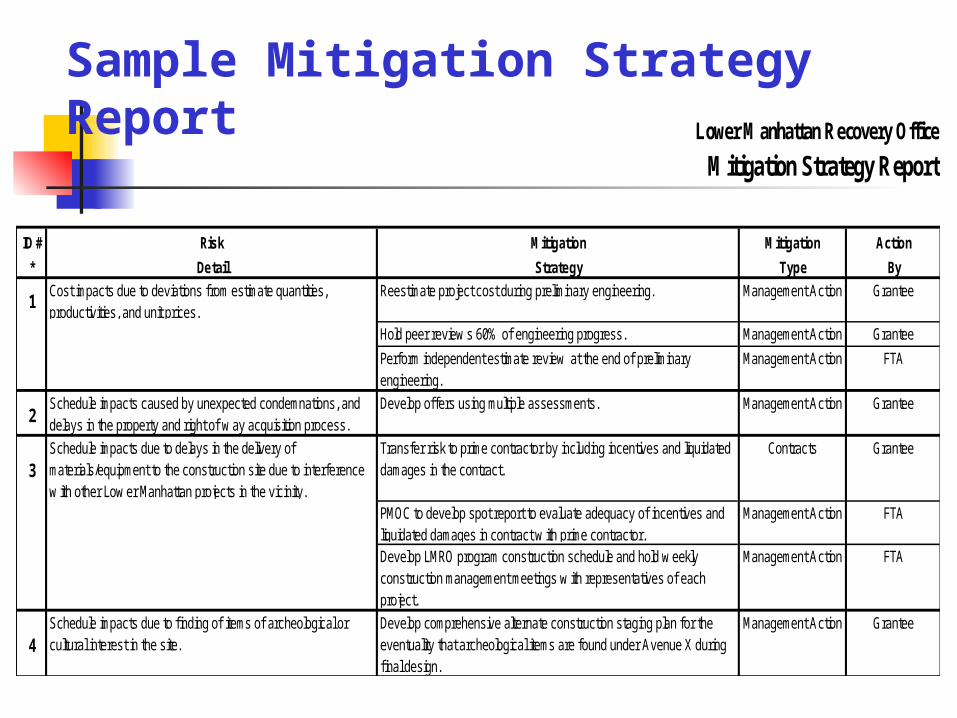
Lower Manhattan Recovery Office
Mitigation Strategy Report
ID # Risk Mitigation Mitigation Action
* Detail Strategy Type By
1Cost impacts due to deviations from estimate quantities, productivities, and unit prices.
Reestimate project cost during preliminary engineering. Management Action Grantee
Hold peer review s 60% of engineering progress. Management Action Grantee
Perform independent estimate review at the end of preliminary engineering.
Management Action FTA
2Schedule impacts caused by unexpected condemnations, and delays in the property and right of w ay acquisition process.
Develop offers using multiple assessments. Management Action Grantee
3Schedule impacts due to delays in the delivery of materials/equipment to the construction site due to interference w ith other Low er Manhattan projects in the vicinity.
Transfer risk to prime contractor by including incentives and liquidated damages in the contract.
Contracts Grantee
PMOC to develop spot report to evaluate adequacy of incentives and liquidated damages in contract w ith prime contractor.
Management Action FTA
Develop LMRO program construction schedule and hold w eekly construction management meetings w ith representatives of each project.
Management Action FTA
4Schedule impacts due to f inding of items of archeological or cultural interest in the site.
Develop comprehensive alternate construction staging plan for the eventuality that archeological items are found under Avenue X during f inal design.
Management Action Grantee
Sample Mitigation Strategy Report
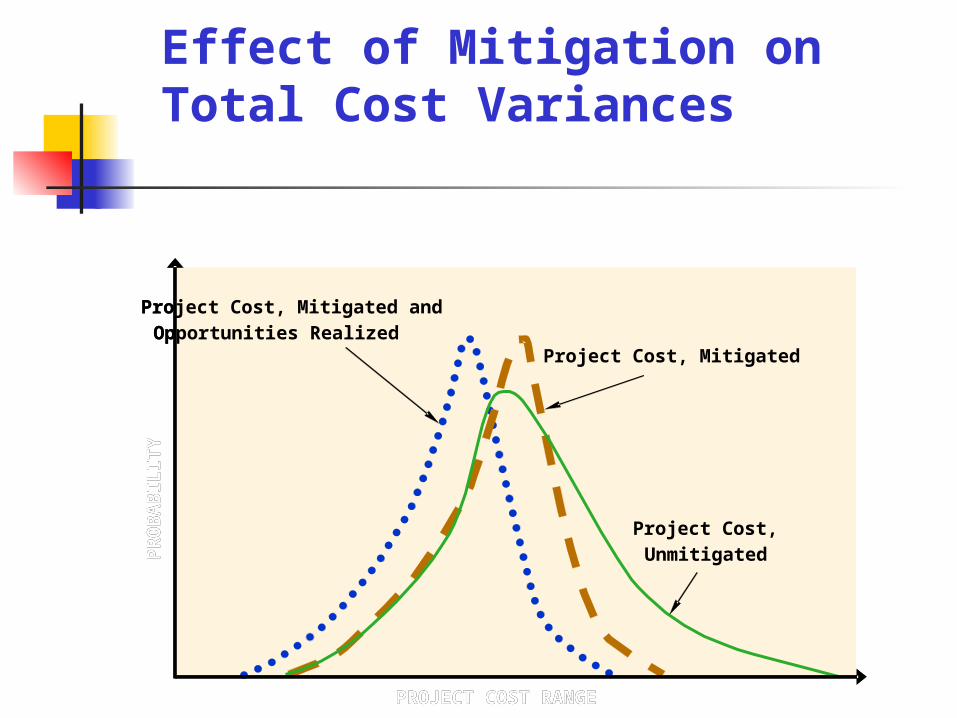
Project Cost, Mitigated andOpportunities Realized
Project Cost, Mitigated
Project Cost, Unmitigated
PROJECT COST RANGE
PR
OB
AB
ILIT
Y
Project Cost, Mitigated andOpportunities Realized
Project Cost, Mitigated
Project Cost, Unmitigated
PROJECT COST RANGE
PR
OB
AB
ILIT
Y
Effect of Mitigation on Total Cost Variances
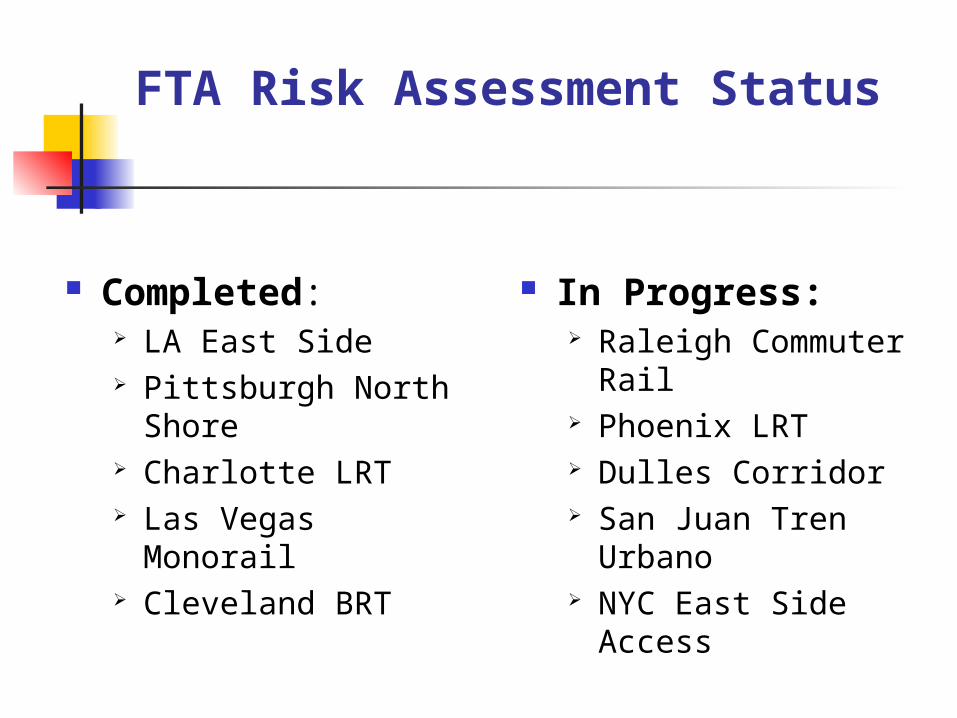
FTA Risk Assessment Status
Completed: LA East Side Pittsburgh North
Shore Charlotte LRT Las Vegas Monorail Cleveland BRT
In Progress: Raleigh Commuter
Rail Phoenix LRT Dulles Corridor San Juan Tren
Urbano NYC East Side
Access

Lesson Learned: Los Angeles
Subsequent to the initial risk assessment, the tunnel and the station excavation contract (Design/Build) was bid and the price of the lowest bid exceeded the Full Funding Grant Agreement (FFGA) budget by more than 25%.
The Grantee undertook mitigation measures and a follow-up risk assessment. This established a confidence level to enable FTA to approve the FFGA.
Lesson Learned: Pittsburgh
Resulted in a confidence level of about 70%, which FTA felt was adequate at 30% design completion level.
Helped the grantee to establish mitigation strategies to save additional $9 million.
Lesson Learned: Charlotte
The risk assessment is very constructive when performed during early design phase. Many issues that were identified may have been overlooked if the risk assessment were not done.
Risk Mitigation Plan most effective when developed jointly with the Grantee
Lesson Learned: Las Vegas
Grantee schedule may be overly optimistic and not have reliable Revenue Operations Date.
Schedule issues identified in risk assessment. The outcome helps both Grantee and FTA.
FTA Lower Manhattan Recovery Risk Assessment
In Progress:
PATH World Trade Center Terminal
MTA Fulton Street Transit Center
MTA South Ferry Subway Terminal
LMRO Risk Based Oversight
• Oversight Program Focused on Risk Assessment and Mitigation
• Early and Ongoing Risk Analysis as Management Tool for Project Sponsors and FTA
• Multi-Disciplinary Oversight Team Focused on Risk Management and Mitigation
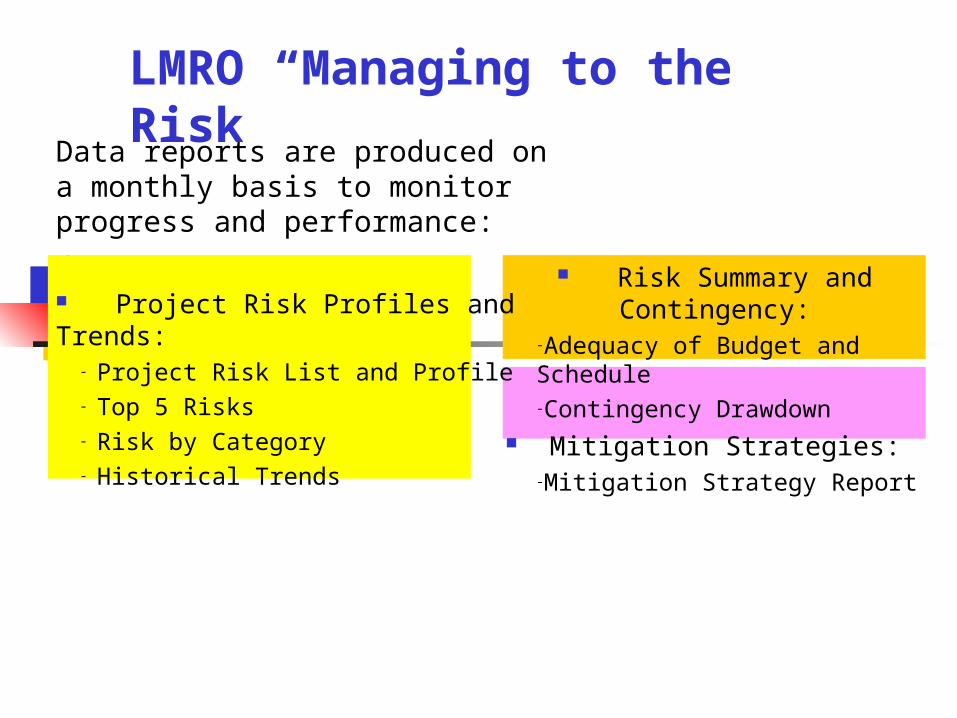
Data reports are produced on a monthly basis to monitor progress and performance:
Project Risk Profiles and Trends:- Project Risk List and Profile- Top 5 Risks- Risk by Category- Historical Trends
Risk Summary and Contingency:
-Adequacy of Budget and Schedule-Contingency Drawdown
Mitigation Strategies:-Mitigation Strategy Report
LMRO “Managing to the Risk”

Sample Management Tool:Top 5 Risks-Schedule
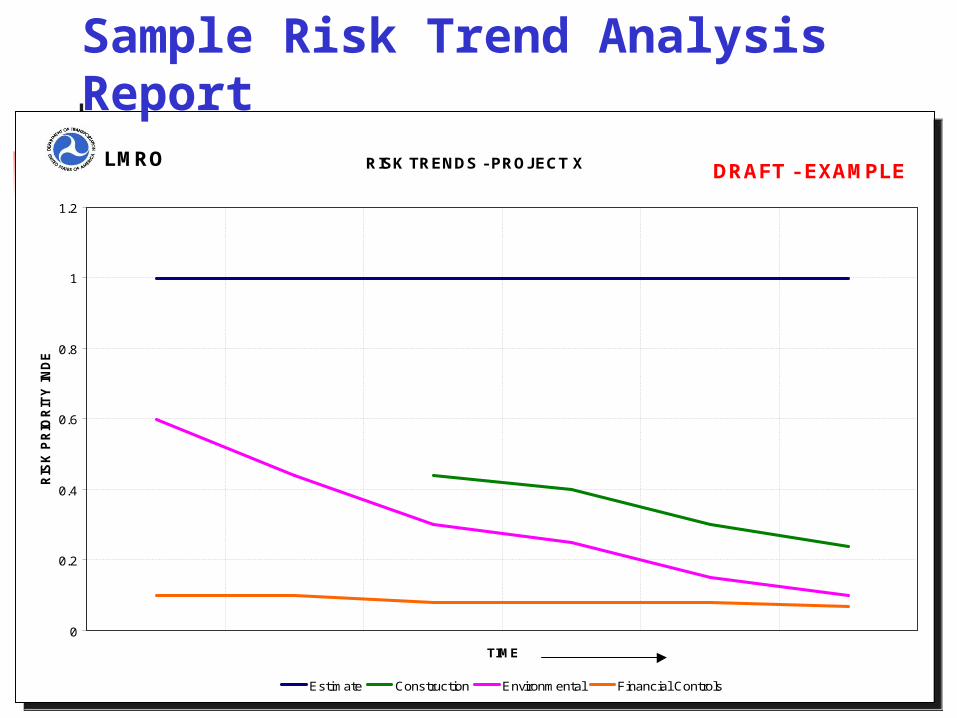
RISK TRENDS - PROJECT X
0
0.2
0.4
0.6
0.8
1
1.2
TIME
RIS
K P
RIO
RIT
Y I
ND
EX
Estimate Construction Environmental Financial Controls
DRAFT - EXAMPLELMRO RISK TRENDS - PROJECT X
0
0.2
0.4
0.6
0.8
1
1.2
TIME
RIS
K P
RIO
RIT
Y I
ND
EX
Estimate Construction Environmental Financial Controls
DRAFT - EXAMPLELMRO
Sample Risk Trend Analysis Report

CONTINGENCY DRAW DOWN - PROJECT X
0
50,000
100,000
150,000
200,000
250,000
Time
Co
nti
ng
en
cy
($
00
0)
Balance of Contingency Required Contingency
LMRO THIS IS A SAMPLECONTINGENCY DRAW DOWN - PROJECT X
0
50,000
100,000
150,000
200,000
250,000
Time
Co
nti
ng
en
cy
($
00
0)
Balance of Contingency Required Contingency
LMRO THIS IS A SAMPLE
Sample Management-Oversight Report
Conclusion
FTA and project sponsors have already benefited from risk assessment and mitigation in less than 1.5 years.
FTA is improving methodologies, guidance, and training.
Risk assessment and mitigation will help alleviate many uncertainties, resulting in completed projects on time and within budget.

ConceptualPlanning
AlternativesAnalysis
ConstructionFinal
DesignBid
PreliminaryEngineering
Most LikelyCost
Most LikelyCost
Most LikelyCost
ActualCost
Cost range
Project Cost and Uncertainty Over Time