construction-friendly ductile shear …399307/plse2015_75... · the tests were carried out in...
TRANSCRIPT

CONSTRUCTION-FRIENDLY DUCTILE SHEAR JOINTS FOR PRECAST CONCRETE PANELS
Jesper H. Sørensen, Linh C. Hoang, Gregor Fischer and John F. Olesen Technical University of Denmark (DTU), Department of Civil Engineering, Brovej, Building 118,
2800 Kgs. Lyngby, Denmark, Email: [email protected]
ABSTRACT
The scope of this paper is the shear capacity of in-situ cast joints between precast concrete panels. Current practice with vertical lowering of the wall panels experiences difficulties in the assembly phase, since the traditional U-bar connection requires an overlap in a horizontal plane to allow for the mounting of a vertical locking bar. Where limited space is available bending and subsequent straightening of the U-bars are required to assemble the adjacent panels, a procedure which imposes substantial ductility requirements on the reinforcement as well as some manual workload. This paper introduces a construction-friendly design with U-bars overlapping in the same plane as the panel itself. The design allows for a trouble-free vertical lowering of the panels without pre or post processing of the preinstalled reinforcement loops. Furthermore, an overall more ductile behavior of the joint is obtained. The solution is tested in a push-off experimental setup and the influence of important geometric parameters of the keyed shear joint is investigated. The first peak load carrying capacity is assessed using plasticity models, and the failure modes are identified by the use of digital image correlation. The upper bound models produce satisfactory results capturing the experimental tendencies and predicting the mode of shear failure in the shear keys.
KEYWORDS
Precast Structures, Shear Walls, Keyed Shear Joints, Loop Connections, Ductility, Plasticity, Upper Bound Theo- rem, Digital Image Correlation.
INTRODUCTION
In precast concrete structures, shear walls play an important role in the global stabilizing system for the support of horizontal loads. The connectivity between the shear wall panels is ensured by narrow in-situ cast joints in which mortar with low aggregate sizes is generally preferred as the filling material. Reinforcement loops, laps, or similar, grouted by mortar are thereby the tools at hand to design a strong ductile joint. Not surprisingly the geometry of the connection and the interface properties of the joint play an important role for structural performance. The layout of the interface of the joint has been investigated widely since the introduction of precast concrete structures in the 1950's. The strongest and subsequently most investigated solution is an indented interface, also called a keyed shear joint. However, it turned out that the classical keyed joints constitute a limiting factor in design where ductility and deformation capacity are among the crucial design aspects. In addition the typical/classical solution gives rise to challenges in the construction phase because of the risk of rebars clashing when assembling the precast panels.
Horizontal section Vertical section
(a) Classical joint layout
Horizontal section Vertical section
(b) Construction-friendly joint layout
Figure 1 Geometrical comparison of layout between classical joint and developed joint.
The problem of rebars clashing can be seen in Figure 1, which schematically shows the classical solution (left) and the recently developed construction-friendly solution (right). The main difference appears in the orientation and the positioning of the reinforcing loops. As can be seen, the new solution allows for a trouble-free vertical lowering of the precast panels and subsequent installation of transverse lacer bar reinforcement in shape of a double T- headed bar providing increased anchorage in the out of plane direction of the panels. The reinforcement loops are positioned outside the indented area as strut action is active between the keys. In this way the mortar is not utilized for multiple actions. Furthermore, the new design allows for installation of a vertical locking bar similar
640

to the classical solution. An experimental study of the behavior of the new design has recently been conducted revealing a significant increase in ductility, and furthermore the design allows for the use of larger dimensions of U-bars, applicable for larger panel thicknesses compared to the classical solution. The ultimate behavior of the new design has been analyzed applying rigid-plastic upper bound models. It is found that the shear capacity as well as the critical failure mode can be predicted with satisfactory accuracy.
PREVIOUS INVESTIGATIONS
The classical keyed shear joint has been experimentally investigated intensively since the 1960's. The focus has mainly been on the load carrying capacity and the design aspects of the joint configuration. The report by Hansen et al. (1976) summarizes the work of the CIB commission W23A and the experimental programs that served as basis for the commissions work, including the work of Cholewicki (1971), Pommeret (1972), and Fauchart and Cortini (1972) who used similar test setups as presented in this work. Later on Nimityongskul and Liu (1980), Chakrabarti et al. (1981), Abdul-Wahab (1986), and Serrette et al. (1989) performed tests with different test setups also investigating factors influencing the load carrying capacity. It is generally agreed that the ultimate load carry- ing capacity is influenced by the number of shear keys and the corresponding cross sectional area of the keys, the strength of the joint mortar, the reinforcement degree and presence of transverse confinement stresses. Deformabil- ity and stiffness properties have been investigated by Bhatt (1973) and Bljuger (1976), the former found properties similar to monolithic walls while the latter gave design characteristics of a vertical shear joint depending on the joint type.
The formulas available for prediction of the ultimate load carrying capacity vary widely and are influenced by empirical factors. Most formulas are related to the shear friction hypothesis. However, Chakrabarti et al. (1988) concluded that a theory based on the Mohr-Coulomb failure criterion should be used in preference to the shear friction theory. Abdul-Wahab and Sarsam (1991) confirmed this and concluded that the empirical formulas are limited in application to the method of loading. Jensen (1975) established a formula for the load carrying capacity of a vertical keyed shear joint, based on the theory of plasticity. These findings have been the basis for several for- mulas introducing empirical factors to fit test results with theory. Christoffersen (1997) expanded the application of plastic theory to include both upper and lower bound solutions in the description of the capacity of a keyed joint.
EXPERIMENTAL PROGRAM
In the present study a total of 23 push off tests were carried out. The program included both a reference investigation of 5 specimens comparing the classical design to the developed design with identical geometrical joint properties (Pedersen and Herløv, 2015). The remaining 18 specimens were subdivided into two investigations related to the geometry of the indentation, see Figure 2, and using the reinforcement configuration seen in Figure 1b. In 8 specimens, the length of the keys, Lk , was varied while the key height was kept constant to half of the panel thickness, t (Svejgaard, 2015). In the remaining 10 specimens the depth of the indentation, dk , was varied while the key area and the key height were kept constant, with keys protruding into the surface of the panel (Øvrelid, 2015). The tests were carried out in static deformation control and conducted in the lab of DTU.
Figure 2 General geometry of push off specimens, thickness equals 200 mm.
641

Specimens and Geometry
The general geometry of the push off test specimens can be seen in Figure 2 and the geometry and material properties are given in Table 1. Specimens R and P refer to reference and pilot specimens, respectively, where the reference specimens were designed with a reinforcement orientation as given in Figure 1a (noting that the loops were placed outside the indented area) and the pilot specimens were designed with an identical minimum reinforcement area per loop (a 2-on-1 loop design), referred to as As in Table 1, and with identical key dimensions. For specimens type I to IX twice the reinforcement area was used in a symmetric design and in order to eliminate the edge effect, anchorage plates were mounted at each end of the locking bar. Each design was tested with 2 replicates and the material properties were found from tensile tests on the steel reinforcement and compression tests on cylinders of the mortar used to fill the joint, with a diameter of 100 mm and a height of 200 mm.
Parameters kept constant for designs I to IX are the U-bar diameter (ϕ = 8 mm), the yield strength of the U- bars (fy = 487 MPa) the internal bend diameter of the loops (60 mm), the overlapping circular area of the loops, the distance between the outermost loops (30 mm), the lacer reinforcement (16 mm double t-headed bar), the longi- tudinal locking bar (ϕL = 12 mm, fyL = 584 MPa), the thickness of the panels (t = 200 mm), an average precast concrete strength (49.6 MPa), and the width of the joint (b = 100 mm).
Table 1 Geometric values and strength properties of the joints for the specimens in the experimental program. No. fc [MPa] hk [mm] Lk [mm] Ak [mm2] dk [mm] As [mm2] PFP [kN] PU [kN]
R 1 34.6 85 160 13600 16 101 282.43 N/A 2 35.7 85 160 13600 16 101 303.80 N/A 3 35.7 85 160 13600 16 101 337.42 N/A
P 1 38.1 85 160 13600 16 101 344.24 357.45 2 38.1 85 160 13600 16 101 347.04 368.12
I 1 31.2 100 120 12000 28 201 379.02 441.21 2 34.2 100 120 12000 28 201 416.59 472.92 II 1 31.2 100 140 14000 28 201 366.40 463.78
2 34.2 100 140 14000 28 201 414.46 462.48 III 1 31.2 100 160 16000 28 201 393.04 494.70
2 34.2 100 160 16000 28 201 473.52 514.87 IV 1 31.2 100 180 18000 28 201 439.44 470.89
2 34.2 100 180 18000 28 201 478.17 515.31
V 1 31.2 200 140 28000 10 201 475.24 488.97 2 34.2 200 140 28000 10 201 492.86 535.61 VI 1 30.6 200 140 28000 16 201 527.09 502.55
2 30.6 200 140 28000 16 201 523.82 550.98 VII 1 30.6 200 140 28000 20 201 549.17 451.58
2 30.6 200 140 28000 20 201 524.46 527.85 VIII 1 30.6 200 140 28000 25 201 507.05 528.67
2 30.6 200 140 28000 25 201 516.97 545.33 IX 1 30.6 200 140 28000 28 201 526.53 534.19
2 30.6 200 140 28000 28 201 527.59 527.07
Digital Image Correlation
During the tests, the deformations on the surface of the specimens were monitored using the digital image cor- relation software, Aramis (GOM, 2009). The method has been use by e.g. Pereira et al. (2011) who studied the cracking behavior of cement, mortar, concrete, and fiber reinforced concrete. Pereira referred that it was possible to monitor relatively small displacements and to see cracks at small crack openings for all materials. For this case the method allows for accurate reporting of the cracking behavior on the surface of the joint. The 2D analysis was performed using photos taken with a 36.3 megapixel digital camera. The high number of pixels allowed for accurate measurement and early detection of crack initiation over the entire length of the joint.
642

Forc
e [k
N]
Forc
e [k
N]
Test Results
Figure 3 contains the comparison of the load-displacement curves for the reference design, Figure 3a, and also some examples of the typical load-displacement curves for the developed joint design, Figure 3b. Figure 3a shows the direct comparison where the results from the classical design comply with previous investigations, e.g. described in details by Hansen et al. (1976). The first (and global) peak is described as the maximum load of the joint followed by a decrease in load with increasing shear displacement. It is highlighted that the response curve of specimen R1 represents a test where the reinforcement loops are shoved away from each other whereas specimen R2 and R3 are shoved towards each other. This demonstrates the effect of reversing the loading direction on the classical design and it may very well be due to this matter that the post peak behavior in literature is reported both as brittle and as ductile.
The comparison reveals the main difference between the two designs. The first peak capacities for the similar configurations are comparable, however the post peak behavior differs significantly as the new design exhibits a far more pronounced ductile behavior. In general the behavior up to first peak is similar. Before cracking, the joint behaves with a stiffness similar to a monolithic wall. At a relatively small load level cracks at the interface between the joint mortar and the precast concrete develop, decreasing the stiffness slightly. At a higher load level diagonal cracks between the corners of each pair of opposite shear keys start to emerge on the surface, as indications of diagonal strut action. After diagonal cracking the stiffness of the joint decreases until the first peak on the load- displacement curve is reached, which corresponds to the value of PFP given in Table 1. For the developed design a drop in the response is observed after the first peak . However, as the displacement increases, the load rapidly increases again until approximately the same level as the first peak. Then, an almost constant load is observed until rupture of the U-bars starts to take place at a displacement in the order of 15-20 mm. The ultimate load of the joint, indicated as PU in Table 1, is typically found at large displacements, see Figure 3b which presents examples of the main findings of the test series. The load level in Figure 3b is higher than the load level in Figure 3a due to the difference in reinforcement area per loop, however the tendencies are similar.
550
500
450
400 P2
350 P1
300 R3
250
200 R2
150
550
500
450
400
350
300
250
200
150
V 2
VIII 2
II 2
PF P PU
100
R1 50
0
100
50
0
II 2 Peaks V 2 Peaks VIII 2 Peaks
0 5 10 15 20 25 30 Measured longitudinal displacement [mm]
(a) Comparison of classical design to developed design.
0 5 10 15 20 25 30 Measured longitudinal displacement [mm]
(b) Examples of load displacement curves for the developed design.
Figure 3 Examples of performance of shear keyed joints
The value of PFP depends on the geometric properties of the shear keys and generally a larger key area results in a higher first peak capacity. Specimen II2 has a smaller key area compared to V2 and VIII2. This explains the lower first peak capacity for II2, however the post first peak development shows the same tendencies as specimen VIII2. Furthermore, it is seen that the first peak capacities of V2 and VIII2 are rather similar as the keyed areas are identical, however the post first peak behavior is different as the governing failure mechanisms are different, refer- ring to mechanism B and C introduced in Figure 4. The small key depth of specimen V2 favors shearing/crushing of the key corners whereas the larger key depth of specimen VIII2 results in complete shearing of the key. These partly or complete key shearing failure mechanisms are in agreement with the findings for the classical keyed joint described in Hansen et al. (1976).
It is clear that the test results reveal the ability of the developed design to utilize the joint mortar until rupture of reinforcement at large displacements. The design also proves unaffected by the loading direction, which con-
643

f
I,j I
W s
W sL
I
= t
L
+ L 2 , A = h b2
stitutes a significant difference to the classical design. The improved overall response is favorable concerning structural robustness. The development after first peak, leading to the very ductile behavior, is governed by the reinforcement configuration, the properties of the reinforcement, the properties of the joint mortar and the precast concrete, and finally the geometry of the key, and the frictional properties of the joint mortar.
FAILURE MECHANISM AND UPPER BOUND SOLUTION
In this paper, the load carrying capacity, related to the first peak load, of keyed joints is calculated by use of the theory of plasticity assuming concrete and reinforcement steel to be rigid-perfect plastic materials obeying the associated flow rule. The concrete is considered as a modified Coulomb material with zero tensile strength. For plain strain problems, the energy dissipated per unit area of a failure surface may be determined as follows (Nielsen and Hoang, 2011):
WA = νfc (1 − sin(α)) |u|, α ≥ φ (1)
Where α is the angle of the displacement vector with the yield line and φ is the internal angle of friction, in this study φ = 30◦ is assumed for the mortar material in the joint. The effectiveness factor ν is introduced to account for concrete not being a perfectly plastic material. The factor is dependent on the problem and in the case of shear in keyed joints no distinctive factor has been developed. Jørgensen (2014) suggests to adopt the effectiveness factor used for beams in shear without shear reinforcement modified to the geometric layout of the keyed shear joint and ignoring the dowel effects of the transverse reinforcement since it is utilized to tensile yielding. The proposed factor is adopted in this work:
0.88 (
1 )
ν = √
c 1 + √
k , (fc in MPa, Lk in m) (2)
It is noted that the length of the key influences the concrete contribution to the load carrying capacity. It is found that a decrease in key length increases the effectiveness factor, explaining why identical key areas may lead to different load carrying capacities depending on the ratio of the dimensions. In the test series the effectiveness factor ranges from 0.51 to 0.61.
Failure Mechanisms
The load carrying capacity of the joint, Pcal, is found by minimizing the energy required to obtain a given failure mechanism. This is obtained from the rate of work performed by the external forces and the rate of internal work dissipated in the yield lines. Figure 4 shows the simplest and also the theoretically most critical failure modes. For all three failure mechanisms the external work is given by:
WE = P ul (3)
The internal work of the three mechanisms may in general be written as:
WI = W c + W s + W sL (4)
I,j I I W c
where W c
I,j = WAAj (5)
I = Asfy ut (6)
I = AsLfyLul (7) is the contribution from a concrete yield line with area Aj , W s is the contribution from the U-bars yield-
ing and W sL is the contribution from yielding of the locking bar, if present in the mechanism. The displacement vector for the element in motion and the relations to the relative displacements in the transverse and longitudinal direction for mechanism A and B are given as:
u = (ut
) ul
(8)
ul = |u| cos (α) (9) ut = |u| sin (α) (10)
For a general description the following parameters are introduced:
Φ = n + 1 Asfy , Φ = AsLfyL , tan β = b , A = L h , A dk
n Ak fc L nAk fc Lk
k k k d k i k sin γ
644

Element in motion
ut α
ul u
Element at rest
at rest Element at rest Element
−
u
P P P
Element in motion
Element in motion
ut ut α γ α ul u ul
β
P (a) Mechanism A - Key cut off
P (b) Mechanism B - One diagonal yield line
P (c) Mechanism C - Inclined key cut off
Figure 4 Presentation of the most critical failure mechanisms.
where As refers to the total cross sectional area of reinforcement crossing the joint in a single loop, e.g. for
the specimen given in Figure 1b. The concrete area Ak refers to the area of a single key, Ad refers to the area of a diagonal yield line and Ai refers to the area of an inclined yield line in a key, see Figure 4. The first peak load carrying capacity in terms of a normalized shear stress is defined as:
τ = Pcal fc nAk fc
(11)
In the following, formulas for the failure mechanisms shown in Figure 4 are given for a general design with n shear keys and (n + 1) pairs of U-bar loops crossing the joint. It is noted that the presented loop design ensures yielding of the U-bars and not failure of the joint mortar in the overlapping loop area.
Mechanism A - Key cut off
For failure mechanism A, the rate of internal work is found as a sum of the contribution from n shear keys being sheared off using Aj = Ak and (n + 1) reinforcement loops yielding. When solving the work equation, WE = WI , an upper bound solution is found:
τ 1 1 sin (α) = ν + Φ tan (α) (12) fc 2 cos (α)
The optimal solution is found by minimizing the expression with respect to the angle of displacement α. The optimal angle is found as:
α = arcsin 1 − 2Φ ν
≥ φ (13)
From Eq. 13 it is implicitly given that the key area influences the optimal angle of displacement. It is noted that the expression with only slight change of notation is similar to the findings of Jensen (1975) and Christoffersen (1997).
Mechanism B - One diagonal yield line In failure mechanism B, the rate of internal work is given by (n − 1) times with Aj = Ad, and for the reinforcement (n + 1) reinforcement loops yielding and one contribution from the
645

ν
locking bar. The expression for the load carrying capacity is given by:
(14)
The optimal angle of displacement is given as:
n − 1 +
t Φ − 2n
Mechanism C - Inclined key cut
α = arcsin
For mechanism C, the rate of internal work is found as n times with Aj = Ai and (n + 1) reinforcement loops yielding. In this mechanism the angle γ is introduced representing the angle between vertical and the inclined yield line. The relative displacements related to the (t, l) coordinate system are given by:
ul = |u| cos (γ + α) (16) ut = |u| sin (γ + α) (17)
As the relation between the transverse and the longitudinal displacement is dependent on the sum of γ and α, the lower limit of the condition α ≥ φ is reached at low reinforcement degrees. In the following it is assumed that α = φ. The optimization of the upper bound solution is then limited to an optimization of γ, which is governed by the key dimensions and the internal angle of friction φ. The load carrying capacity is given by:
τ 1 dk = ν
1 − sin (φ) + Φ tan (γ + φ) (18)
fc 2 Lk sin (γ) cos (γ + φ)
The optimal angle of the inclined yield line is found as:
γ = arctan
√ sin (φ)+ 1+ 2Φ Lk cos (φ) (19)
ν dk 1 − sin (φ)
It appears that the internal angle of friction of the joint mortar influences the failure mode significantly and to a large extent dictates, in combination with the key depth, which of the failure mechanisms that constitutes the critical mechanism.
INFLUENCE OF GEOMETRY ON FAILURE MODE
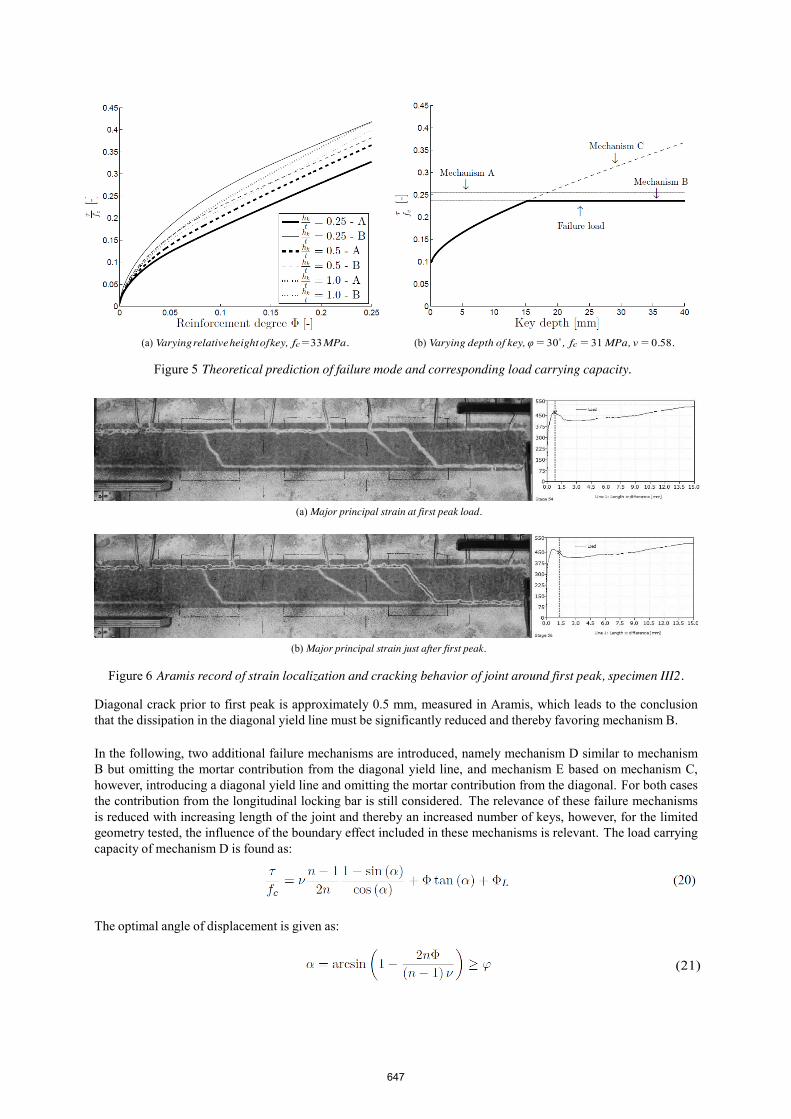
From the load carrying capacities given in Eqs. 12, 14 and 18 and the corresponding optimal displacement angles, it is evident that the geometry of the joint and in particular the geometry of the keys play an important role in deciding, which failure mechanism is governing. Figure 5 contains the results of the theoretical comparison of the three presented failure mechanisms with reinforcement arrangements similar to the experimental program only varying the geometric parameters of the keys. Figure 5a demonstrates the influence of the key height as a function of reinforcement degree, revealing that a higher relative key height favors failure mechanism B compared to a small relative height which favors failure mechanism A. Figure 5b demonstrates the influence of the key depth on the failure mechanism of a joint configuration similar to specimens V to IX, corresponding to a relative key height of 1. Not surprisingly the smaller key depths favor failure mechanism C. In this context the transition point between the failure mechanisms is of particular interest as the deformation characteristics of the joint change with changing failure mechanism.
FAILURE MECHANISMS BASED ON EXPERIMENTAL OBSERVATIONS
Based on the experimental observations, the theoretical failure mechanisms are evaluated. It appears that a failure mechanism similar to mechanism B with a relatively large crack opening in one diagonal crack prior to the first peak load is governing independent of the height of the key. Figure 6 shows Aramis recordings of the failure process of specimen III2 which according to calculations should reach the first peak load carrying capacity corresponding to mechanism A. It appears that diagonal cracks develop before first peak, as described earlier, and the relative displacements during the failure is taking place in the already existing cracks. The crack opening of the governing
646
hk
hk
hk
hk
hk
hk
τ f c [-]
τ f c [-]
0.45 0.45
0.4
0.35
0.4
0.35
Mechanism C
0.3
0.25
0.3
0.25
Mechanism A
Mechanism B
0.2
0.15
0.1
0.05
0
t = 0.25 - A t = 0.25 - B t = 0.5 - A t = 0.5 - B t = 1.0 - A t = 1.0 - B
0.2
0.15
0.1
0.05
0
Failure load
0 0.05 0.1 0.15 0.2 0.25 Reinforcement degree Φ [-]
(a) Varying relative height of key, fc = 33 MPa.
0 5 10 15 20 25 30 35 40 Key depth [mm]
(b) Varying depth of key, φ = 30◦, fc = 31 MPa, ν = 0.58.
Figure 5 Theoretical prediction of failure mode and corresponding load carrying capacity.
(a) Major principal strain at first peak load.
(b) Major principal strain just after first peak.
Figure 6 Aramis record of strain localization and cracking behavior of joint around first peak, specimen III2.
Diagonal crack prior to first peak is approximately 0.5 mm, measured in Aramis, which leads to the conclusion that the dissipation in the diagonal yield line must be significantly reduced and thereby favoring mechanism B.
In the following, two additional failure mechanisms are introduced, namely mechanism D similar to mechanism B but omitting the mortar contribution from the diagonal yield line, and mechanism E based on mechanism C, however, introducing a diagonal yield line and omitting the mortar contribution from the diagonal. For both cases the contribution from the longitudinal locking bar is still considered. The relevance of these failure mechanisms is reduced with increasing length of the joint and thereby an increased number of keys, however, for the limited geometry tested, the influence of the boundary effect included in these mechanisms is relevant. The load carrying capacity of mechanism D is found as:
τ = ν n − 1 1 − sin (α) + Φ tan (α) + Φ (20) fc 2n cos (α) L
The optimal angle of displacement is given as:
α = arcsin
1 − (n
− 1) ν
≥ φ (21)
647

τ f c [-]
τ f c [-]
For the mechanism E, partly consisting of inclined key cut off and partly a diagonal yield line, the load carrying capacity, assuming α = φ, is found as:
τ = ν n − 1 dk 1 − sin (φ) + Φ tan (γ + φ) + Φ
(22)
fc 2n Lk sin (γ) cos (γ + φ) L
The optimal angle γ of the inclined yield line in the keys is found as:
γ = arctan
cos (φ) √ 2nΦ Lk
cos (φ)
(23)
COMPARISON OF TESTS WITH THEORY
Figure 7 contains a comparison of the presented upper bound models with the test results of the first peak load carrying capacity. It is seen that the refined mechanism D captures the behavior and predicts the load carrying capacity of the specimens with varying key area. It is also seen that mechanism E explains the cracking behavior of the specimens with small key depths before mechanism D becomes the governing mechanism for larger key depths. An overall acceptable correlation is obtained using the proposed effectiveness factor. Better correlation can be found by reducing this factor, e.g. as suggested by Jørgensen (2014) for the shear capacity of shear joint cast with mortar and reinforced with wire ropes.
0.45 0.45
0.4
0.35
0.3
0.25
Mechanism B
0.4
0.35
0.3
0.25
Mechanism D
Mechanism C
Mechanism E
1.2 Mechanism A
0.15
Failure load
Mechanism D
0.2
0.15
Failure load
0.1 0.1
0.05
0.05
0 0 0.05 0.1 0.15 0.2 0.25 0.3 0.35 0.4
Reinforcement degree Φ [-]
(a) Comparison for specimens I-IV, fc = 33 MPa.
0 0 5 10 15 20 25 30 35 40
Key depth [mm]
(b) Comparison for specimens V-IX, fc = 31 MPa.
Figure 7 Comparison of theory with results, using φ = 30◦ for the joint mortar.
CONCLUSION
A construction-friendly design of loop connection for joints between precast concrete panels has been developed and presented. It has been shown that the overall performance in terms of ductility of the joint is superior compared to the commonly used classical design. The load carrying capacity related to the first peak on the response curve has been predicted by use of an upper bound plasticity model. The theoretical failure mechanisms have been refined based on observations from the experiments and an overall good agreement has been obtained. The influence of the key area has been addressed and the theoretical influence of the key height on the failure mode has been outlined. The refined mechanisms D and E, based on the experimental tendencies, predict the load carrying capacity well and allow for prediction of the transition between failure modes of complete key cut off or inclined key cut off, see Figure 5b.
ACKNOWLEDGEMENT
The experimental research presented in this paper has been financially supported by the Danish Association for Precast Concrete Elements and the Cowi Foundation. The test elements have been produced at the concrete element factory Expan and the experimental work has been conducted with support from B.Eng. Rune Pedersen, B.Eng. Mads Herløv, M.Sc. J. Svejgaard and M.Sc. L. Øvrelid. The authors gratefully acknowledge these valuable contributions.
648

REFERENCES
Abdul-Wahab, H. M. (1986). An Experimental Investigation of Vertical Castellated Joints between Large Concrete Panels. Struct. Eng., 64B(4):93--99. Abdul-Wahab, H. M. and Sarsam, S. Y. H. (1991). Prediction of Ultimate Shear Strength of Vertical Joints in Large Panel Structures. ACI Struct. J., 88(2):204--213. Bhatt, P. (1973). Influence of Vertical Joints on the Behaviour of Precast Shear Walls. Build. Sci., 8(21):221--224. Bljuger, F. (1976). Determination of Deformability Characteristics of Vertical Shear Joints in Precast Buildings.Build. Environ., 11:277--282. Chakrabarti, S. C., Bhise, N. N., and Sharma, K. N. (1981). Failure Criterion of Vertical Shear Key Joints in Prefabricated Wall Panels. Indian Concr. J., 55(3):63--67. Chakrabarti, S. C., Nayak, G. C., and Paul, D. K. (1988). Shear Characteristics of Cast-in-Place Vertical Joints in Story-High Precast Wall Assembly. ACI Struct. J., 85(1):30--45. Cholewicki, A. (1971). Loadbearing Capacity and Deformability of Vertical Joints in Structural Walls of Large Panel Buildings. Build. Sci., 6(9):163--184. Christoffersen, J. (1997). Ultimate Capacity of Joints in Precast Large Panel Concrete Buldings. Department of Structural Engineering and Materials, Technical University of Denmark, Series R No 25, Lyngby. Fauchart, J. and Cortini, P. (1972). Étude expérimentale de joints horizonraux entre panneaux préfabriqués pour murs de batiments. Annales de L'institut Technique du Batiment et Des Travaux Publics. GOM (2009). Aramis User Manual - Software v6.1 and higher. GOM Optical Measuring Techniques, Braun- schweig, Germany. Hansen, K., Kavyrchine, M., Melhorn, G., Olesen, S. O., Pume, D., and Schwing, H. (1976). Keyed shear joints – SBI rapport 97. Technical report, Danish Building Research Institute. Jensen, B. C. (1975). On the Ultimate Load of Vertical, Keyed Shear Joints in Large Panel Buildings. Technical report, Institute of Building Design, Technical University of Denmark. Jørgensen, H. B. (2014). Strength of Loop Connections between Precast Concrete Elements. PhD thesis, University of Southern Denmark, Department of Technnology and Innovation. Nielsen, M. P. and Hoang, L. C. (2011). Limit Analysis and Concrete Plasticity. CRC Press, Taylor & Francis Group, 3rd edition. Nimityongskul, P. and Liu, H. Y. (1980). Vertical Shear Strength of Joints in Prefabricated Loadbearing Walls.
Hous. Sci., 4(2):137--157. Pedersen, R. H. and Herløv, M. E. (2015). Forskydningsbæreevnen af montagevenlige elementsamlinger (english: Shear capacity of construction-friendly element joints). Bachelor Thesis, Technical University of Denmark, Department of Civil Engineering. Pereira, E. B., Fischer, G., and Barros, J. A. O. (2011). Image-based Detection and Analysis of Crack Propagation in Cementitious Composites. In Leung, C. and Wan, K. T., editors, Proc. Int. RILEM Conf. Adv. Constr.
Mater. Through Sci. Eng., pages 1--8, Hong Kong, China. Pommeret, M. (1972). Le comportement sous charges ou déformations répétées alternées des joints verticaux entre panneaux préfabriqués. Technical report, Centre expérimental de recherches et d'études du bastiment et des travaux publics, Saint Remy les Chevreuxe. Serrette, R. L., Rizkalla, S., and Heuvel, J. (1989). Multiple Shear Key Connections for Load-bearing Shear Wall Panels. PCI J. Svejgaard, J. (2015). Test and analysis of keyed shear joints between precast concrete walls - influence of indent area on the load bearing capacity. Master's thesis, Technical University of Denmark, Department of Civil Engineering. Øvrelid, L. H. (2015). Test and analysis of keyed shear joints between precast concrete walls - influence of key depth on failure mode. Master's thesis, Technical University of Denmark, Department of Civil Engineering.
649