constraints faced by industry in punjab, pakistan...working paper constraints faced by industry in...
TRANSCRIPT

Working paper
Constraints faced by Industry in Punjab, Pakistan
Syed Turab Hussain Usman Khan Kashif Zaheer Malik Adeel Faheem
January 2012
When citing this paper, please use the title and the following reference number: F-37030-PAK-1

2
Contents
1 Performance, Structure and Impediments to Industry in Punjab ................................................ 5
1.1 Performance of the Economy - Stagnating growth............................................................ 5
1.2 Constraints to Investment and Productivity – A short review ............................................. 7
1.3 Main Industrial Clusters in Punjab and their Importance ................................................... 9
2 Methodology....................................................................................................................... 12
3 Constraints Faced by Industries in Seven Key Regions of Punjab ........................................... 16
3.1 Introduction................................................................................................................. 16
3.2 Major constraints and challenges faced by manufacturers located in key industrial zones – 2006-07.................................................................................................................................. 16
3.3 Major constraints and challenges faced by manufacturers located in the Lahore zone, 2012. 17
3.4 Electricity.................................................................................................................... 20
3.4.1 Introduction ......................................................................................................... 20
3.4.2 Across clusters impact of electricity ....................................................................... 21
3.4.3 Across sector impact of electricity ......................................................................... 23
3.4.4 The current situation - Analysis based on the Lahore survey .................................... 24
3.5 Macroeconomic Instability ........................................................................................... 39
3.6 Corruption: .................................................................................................................. 43
3.6.1 Findings from Lahore Pilot Survey ........................................................................ 45
3.7 Access to Finance ........................................................................................................ 47
3.7.1 Introduction ......................................................................................................... 47
3.7.2 The Issue ............................................................................................................. 48
3.7.3 Impact on Industry................................................................................................ 49
3.8 Inadequate Workforce .................................................................................................. 49
3.8.1 Coping Mechanism ............................................................................................... 52
4 Policy Brief......................................................................................................................... 53
4.1 Electricity.................................................................................................................... 54
4.2 Corruption ................................................................................................................... 55
4.3 Access to Finance ........................................................................................................ 56
4.4 Inadequately Trained Workforce ................................................................................... 57
References ................................................................................................................................. 59
3
List of Figures Figure 1-1: Industrial and GDP growth .......................................................................................... 6 Figure 1-2: Industrial Performance- Punjab .................................................................................... 7 Figure 2-1: Sector Coverage of the Pilot Survey (%) ..................................................................... 13 Figure 2-2: Survey Coverage by Size of Industries (%) ................................................................. 14 Figure 2-3: Survey Coverage by Ownership Structure (%)............................................................. 14 Figure 2-4: Survey Coverage by Location within or outside an Industrial Zone (%) ........................ 15 Figure 3-1: Summary of overall constraints faced by all firms in Punjab......................................... 17 Figure 3-2: Major Constraints of Punjab’s firms ........................................................................... 17 Figure 3-3: Top Most Serious Constraint (% of Firms) .................................................................. 19 Figure 3-4: Second Most Serious Constraint (% of Firms) ............................................................. 19 Figure 3-5: Third Most Serious Constraint (% of Firms)................................................................ 20 Figure 3-6: Firms reporting electricity as most serious constraint (%)............................................. 21 Figure 3-7: All firms average loss due to power outage (%) ........................................................... 22 Figure 3-8: Sales loss due to power outage across zones (%) ......................................................... 22 Figure 3-9: Highest annual sales loss due to power outages (%) ..................................................... 23 Figure 3-10: Loss as percent of total annual sales due to power outages.......................................... 24 Figure 3-11: Average Number of Outages during a Month ............................................................ 25 Figure 3-12: Average Number of Outages per Month per Sector .................................................... 25 Figure 3-13: Number of Outages per Month per Sector (Small Firms) ............................................ 26 Figure 3-14: Number of Outages per Month per Sector (Medium Firms) ........................................ 26 Figure 3-15: Number of Outages per Month per Sector (Large Firms) ............................................ 27 Figure 3-16: Percentage of Sales Lost due to Power Outages (%)................................................... 28 Figure 3-17: Percentage of Sales Lost due to Power Outages by Sectors (%) .................................. 28 Figure 3-18: Percentage of Sales Lost due to Power Outages per Sector (Small Firms) % ............... 29 Figure 3-19: Percentage of Sales Lost due to Power Outages per Sector (Medium Firms) % ........... 30 Figure 3-20: Percentage of Sales Lost due to Power Outages per Sector (Large Firms) % ............... 30 Figure 3-21: Gas Load-Shedding (% of Firms) ............................................................................. 31 Figure 3-22: Gas Load-Shedding per Sector (% of Firms) ............................................................. 31 Figure 3-23: Percentage of Sales Lost due to Gas Load-Shedding (%)............................................ 32 Figure 3-24: Percentage of Sales Lost due to Gas Load-Shedding Per Sector (%)............................ 32 Figure 3-25: Number of Production Days Lost due to Power Shortage (%) ..................................... 33 Figure 3-26: Number of Production Days Lost due to Power Shortage per Sector (%) ..................... 34 Figure 3-27: Use of Generator to Support Power Shortage (% of Firms) ......................................... 34 Figure 3-28: Use of Generator to Support Power Shortage per Sector (%) ...................................... 34 Figure 3-29: Are the Generators Gas Fuelled (%).......................................................................... 35 Figure 3-30: Coping Mechanisms (% of Firms) ............................................................................ 36 Figure 3-31: Coping Mechanisms per Sector (% of Firms) ............................................................ 36 Figure 3-32: Impact on Overhead Costs of Implementing Coping Mechanisms (%) ........................ 37 Figure 3-33: Impact on Overhead Costs of Implementing Coping Mechanisms per Sector (%) ........ 37 Figure 3-34: Impact on Overhead Costs of Implementing Coping Mechanisms per Sector (Small Firms) (%) ................................................................................................................................. 38 Figure 3-35: Impact on Overhead Costs of Implementing Coping Mechanisms Per Sector (Medium Firms) (%) ................................................................................................................................. 38

4
Figure 3-36: Impact on Overhead Costs of Implementing Coping Mechanisms per Sector (Large Firms) (%) ................................................................................................................................. 39 Figure 3-37: Firms Reporting Macroeconomic Instability as a Constraint (%)................................. 40 Figure 3-38: Macroeconomic Instability as an Obstacle (All Firms) ............................................... 40 Figure 3-39: Incidence of corruption across clusters ...................................................................... 43 Figure 3-40: Percent of total annual sales paid as informal payment ............................................... 44 Figure 3-41: Percent of total annual sales paid as informal payment ............................................... 45 Figure 3-42: Do Government Officers Interpret & Implement Rules Consistently (%)..................... 46 Figure 3-43: Wastage of Time due to Over Bureaucratic Procedures (%)........................................ 46 Figure 3-44: Percentage of Sales Given as Bribe to Get Things Done (%) ...................................... 46 Figure 3-45: Most Bribes Given to Officials (%)........................................................................... 47 Figure 3-46: Inadequate Workforce as an Obstacle (%) ................................................................. 50 Figure 3-47: Average Education Attainment (%) .......................................................................... 51 Figure 3-48: Firms Running Training Programmes (%) ................................................................. 52
List of Tables
Table 1-1: Firm Perceptions have changed dramatically since 2002 ................................................. 7 Table 3-1: Aggregate Constraint Prioritization (% of Firms) .......................................................... 18 Table 3-2: Macroeconomic & Political Instability Impacting Industrial Performance....................... 41 Table 3-3: Inadequate Workforce as an Obstacle (%) .................................................................... 50

5
1 Performance, Structure and Impediments to Industry in Punjab
1.1 Performance of the Economy - Stagnating growth
The province of Punjab is the largest in the country both in terms of population and size of the
economy. It accounts for almost 60 percent of Pakistan’s annual production of goods and services and
55 percent of its population.1 Since partition, Punjab has arguably been the most economically
dynamic and vibrant province contributing significantly to the national economy. However, in the past
five years GDP growth in the province decreased alarmingly and now has stagnated to an anaemic 2.5
percent. During the last decade the Gross Provincial Product (GPP) of Punjab grew at an average of
5.5 percent, slightly higher than the 4% growth rate of the Gross Domestic Product (GDP) of the
country.2 The growth performance of Pakistan has been in tandem with that of Punjab indicative of
the fact that the country’s economic health is inextricably linked to its largest province.3 As
industrialization is imperative for income and employment generation and is a necessary condition for
sustained economic growth and development, the performance and issues facing Punjab’s industry
need to be analyzed in order to address the problem of low growth in the province in particular and
the country in general.
The objective of this report is to identify the main impediments to investment and industrial
productivity in Punjab which have contributed to this unprecedented decline in growth. This is done
by analyzing the 2007 Investment Climate Assessment (ICA) data at the level of the seven main
industrial zones of Punjab. The World Bank report based on this data had analyzed the impediments
and constraints to productivity and investment at the country and the provincial level. This report
focuses on the top constraints in the seven industrial zones of Punjab - analyzing the key constraint
across different clusters, sectors and firm size which hamper industrial growth and productivity. This
industrial zone analysis is followed by an analysis of a pilot survey of 100 firms conducted by the
LUMS team in the Lahore district. This is meant to gauge the current situation of the industry in terms
of the major constraints being faced, the cost of these constraints to firms and the coping mechanisms
employed by these in response.
In terms of overall economic performance there has been a secular decline in the GDP growth rate of
the country since 2007-2008. Looking at figure1-1 below what is clearly evident is the positive
correlation between overall industrial growth and GDP growth. After an impressive surge in 2002,
1 Punjab Bureau of Statistics 2 Punjab Bureau of Statistics 3 Punjab Bureau of Statistics

6
industrial growth waned and fell drastically in 2007 pulling down GDP growth rate of the country
within a period of two years from 6 percent to just above 2 percent. There have been structural
reasons behind the fragility of economic growth in Pakistan leading inexorably to the periodic boom
and bust cycles. Some of the underlying structural weaknesses are a narrow and domestically oriented
industrial base and a highly concentrated export basket i.e., textiles and garments account for almost
50 percent of exports. However, this time it was a mixture of many factors which have perversely
contributed towards a prolonged recession - the main ones being a deteriorating political and security
environment, a binding energy constraint and macro-economic instability4.
Figure 1-1: Industrial and GDP growth
The province of Punjab reflects the conditions in the country at large. The growth rate in industrial
sector remained strong from 2003 to 2007 with growth in the large scale sector peaking at almost 20
percent in 2005. Since 2007 there has been a sharp decline in industrial growth, in particular, large-
scale manufacturing in the province saw a decrease of 6.7 percent during 2008-09. As mentioned
above, a number of factors including political instability, chronic energy shortages, rising input cost,
as well as lower domestic and external demand on account of recessionary conditions both locally and
globally, were responsible for this decline. Export-oriented industries also suffered due to loss in
competitiveness and a fall in external demand.
4 Macroeconomic instability results in inflation, exchange rate depreciation and depletion of foreign exchange reserves.

7
Figure 1-2: Industrial Performance- Punjab
Source: Punjab Bureau of Statistics
1.2 Constraints to Investment and Productivity – A short review
The economy of Punjab is currently going through a critical period - while population growth remains
high there has been a dramatic slowdown in the growth rate of output. The sluggishness in growth and
productivity in manufacturing is fast eroding competitiveness of the industry which is bound to have
serious implications on future employment, income and export earnings of the country. A substantive
improvement in the investment climate and a drastic enhancement in industrial productivity are now
essential prerequisites to compete in an increasingly globalised and competitive environment of
production and trade. In order to shift from the current low growth equilibrium onto a sustained high
growth path of economic recovery it is therefore imperative to reinvigorate the private sector by
removing impediments to investment and boosting industrial productivity.
Table 1-1: Firm Perceptions have changed dramatically since 2002
(Percentage of firms who view issue as a severe constraint)
Deterioration Electricity Corruption Macro Instability Political Instability Crime, theft and disorder
2007 2002 79.6 39.3 56.7 40.3 56.6 34.5 46.8 40.4 32.5 21.4

8
Improvements Tax administration Access to finance Anti-competitive practices Labor Regulations Customs Regulations
23.2 39.3 17.6 38.3 14.1 21.4 5.9 15.8 5.8 24.4
Source: Investment Climate survey 2002 and 2007, WB.
The table above depicts changes in firms’ perception on constraints identified in the World Bank ICA
survey in 2002 and 2007. In 2007, more than three quarters of the firms interviewed ranked electricity
(power shortages) as the most serious obstacle as compared to 2002, when less than 40 percent of
firms considered electricity to be a major constraint. Similarly, macroeconomics instability was
identified by more than half of the firms in 2007 as a serious constraint as compared to one third of
the firms in 2002. Despite some improvement in business environment, perceptions on crime and
corruption worsened in 2007. The results clearly show that governance issues (political, corruption
and crime) coupled with power outages and macroeconomic instability were the major constraints
affecting investment climate in 2007. On the other hand, constraints which in 2007 became relatively
less important for firms were tax administration, access to finance, anti-competitive practices and
labour and custom regulations.
The results of 2007 ICA were also consistent with other surveys such as the Global Competitiveness
Report (GCR). In 2008 GCR, government instability, corruption, inefficient bureaucracy and inflation
were listed as major constraints faced by the private sector in Pakistan.
Power sector issues have been identified as the most important obstacle facing Pakistan’s investment
climate. In Punjab almost 77 percent of the firms identified electricity to be the major impediment to
growth. Electricity outages per month were by far the largest in Punjab compared to other provinces.
Firms in Punjab have suffered severe financial losses due to power interruptions, with small firms and
the textile industry bearing the highest loss. Most of the firms had to resort to other means of power
generation which mitigated the impact somewhat, however, it increased the cost of the firms and the
resultant financial loss was estimated to be 9 percent of sales in Punjab.
According to ICA 2007 and Private Sector Development Strategy for Punjab (PSDS) macroeconomic,
political and governance issues, all of which play a crucial role in strengthening investment climate,
were identified as the second most important set of constraints. Macroeconomic instability, political
instability, corruption and crime, theft and disorder were ranked after power shortages. More than half
of the manufacturing firms’ ranked macroeconomic instability and political instability as a major
constraint while 43 percent of the manufacturing firms considered it to be among the top 3 constraints.
Corruption was listed as a major constraint by more than half of the firms surveyed and a third ranked
it among the top three obstacles. Though there was improvement in certain areas but corruption in
9
business-government interface remained high. Industrial zones, while solving many other problems,
have apparently failed to provide a corruption-free business environment.
Some of the other important constraints which have been hampering investment in Punjab are tax
rates and tax administration, business licensing and permits, access to finance and functioning of the
courts.
1.3 Main Industrial Clusters in Punjab and their Importance
Punjab’s centuries old agrarian dominance tends to eclipse the province’s contribution and potential
towards industrial development in the country. Manufacturing industries in Punjab contribute almost
58 percent to the overall industrial productions of Pakistan and account for about 60 percent of value
added in the country’s manufacturing sector. According to the Economic Census of 2005, there were
about 3.3 million economic establishments operating in Pakistan, 95 percent of them in the private
sector. The overall industrial structure in Punjab is dominated by Small and Medium Enterprise
(SME) clusters. Almost 90 percent of the private enterprises are SMEs which employ 78 percent of
the non-agricultural workforce and contribute approximately 40 percent to the GDP. 5
Punjab has numerous large industrial concentrations such as in textiles, leather and light engineering
goods. There are also geographically distinct industrial clusters in the province, the most famous of
which is the ‘industrial triangle’ which includes Gujranwala, Sialkot and Gujrat. In total there are
seven industrials zones/clusters in Punjab, these are, Lahore, Gujranwala, Faisalabad, Sialkot,
Sheikhupura, Wazirabad and Islamabad/Rawalpindi.
Lahore district is one of the most diversified with industries ranging from food, carpets, auto parts,
textile, machinery and equipment, furniture and printing. Faisalabad is the textile centre of the country
with concentration also in light engineering products. Gujranwala specializes in electronics and textile
while Wazirabad in the manufacturing of cutlery.
5 World Bank Survey 2010

10
Sialkot, is perhaps the most dynamic and competitive of all the industrial clusters in the province. The
district is the manufacturing and export hub of the country, concentrating in leather, surgical and
sports goods. Finally, the three main industries in Sheikhupura district are textile, food and machinery
and equipment. The map of Punjab above shows six of these seven industrial zones and their three
major industries.
Clusters are a fundamental economic unit in the economy and an important driver of competitiveness.
The importance of clusters stem from the fact that these play a ‘fundamental role in knowledge
creation, innovation, the accumulation of skills, and the development of pools of employees with
specialized expertise’.6 In Pakistan, clusters have been contributing significantly towards the overall
industrial development of the country. However, more recently, cluster level development and
industrial competitiveness has been seriously hampered due to chronic electricity shortages and
continued macroeconomic and political instability.
Cluster and sector level analysis is particularly important since some constraints and issues are only
sector or cluster specific. For instance, process based industries incur relatively larger losses as a
consequence of power outages while other industries are crucially dependant on a trained workforce.
A constraint important for one particular industry might therefore be not as binding for another.
Hence cluster-level studies by identifying sector-specific obstacles or constraints help in designing
more specific and targeted policy interventions.
In the following section we briefly outline the methodology of the ICA survey 2007 and the Lahore
pilot survey 2012. This is followed by section 3 which identifies the top four major constraints faced
6 Clusters and Economic Policy: Aligning Public Policy with New Economics of Competition. by Porter, Michael. E, HBS, 2007.

11
by the seven industrial clusters/zones in Punjab and analyses their impact on industrial productivity
and output using the ICA 2006-07 data. In addition, the analysis is supplemented by the results from
the Lahore pilot survey of 101 firms across various sectors, to assess the current constraints and their
impact, albeit on a smaller sample of industry. The report concludes with a short policy brief for the
Punjab government derived from the analysis of both the ICA, 2007 cluster level data and the recent
pilot survey in Lahore.

12
2 Methodology
The main objective of the ICA survey was to identify key constraints faced by industry and ascertain
their impact on output and productivity. The methodology was based on a two pronged approach – a
perception based survey of firm managers and an econometric analysis of the impact of the constraints
on firm level productivity. There were sixteen constraints identified in the survey which were
categorized into four broad areas – infrastructure, economic governance, finance and labour market
and skills. The results of the perception based survey were corroborated by the more rigorous
empirical analysis, that is, the top constraints perceived by firms were also the statistically significant
constraints effecting productivity of firms.
The World Bank conducted the ICA survey in 2002 and then subsequently in 2007 in 13 major cities
of Pakistan.7 The report based on this data analysed the constraints facing industry at the national and
provincial level. The analysis did not go deeper into the industrial clusters within each province. This
particular report aims to fill that gap by focusing exclusively on the Punjab and its seven major
industrial clusters by using the ICA 2006-07 data and supplementing it by a recent pilot survey of
industries in Lahore.
The Punjab’s main industrial clusters contain a diverse range of sectors, from low value added food
products to high value added products like machinery and equipments. The identification of
constraints hampering growth and productivity of firms at the cluster level is imperative for designing
appropriate and targeted policy interventions. Since these clusters are heterogeneous in terms of type
of industries, average size of firms, legal status, and geographical locations, an identical ‘one size fit
all’ industrial policy might not be suited for all of these. Therefore the identification of constraints at
the cluster level serves two important purposes. Firstly, it will help policy makers identify and
prioritize constraints at the cluster and sector level. Secondly, this more ‘microscopic’ view would
assist in customizing policy for clusters and sectors in order to spur industrial growth and
productivity.
In order to assess the current extent and severity of constraints faced by industries this report has
conducted a fresh pilot survey in the Lahore region. The survey questionnaire is available separately
to this report. The survey covered 101 enterprises and focused mainly in and around the Lahore
region. The purpose of conducting a fresh survey was firstly to verify the prioritization of constraints
identified by the Investment Climate Assessment (ICA – 2006-07) conducted by the World Bank.
Secondly, it was done to identify and evaluate any changes in impact of these constraints on industry
7 World Bank, Investment Climate Assessment II, Washington, DC, 2009.

13
since 2007. Finally, the survey helped explore and assess the cost and effectiveness of the coping
mechanisms adopted by enterprises in the Lahore zone.
Figure 2-1 below provides the sector composition density of the survey respondents. The survey
comprised ten key sectors with maximum concentration in Textiles, Non-Metallic Mineral,
Chemicals, Manufacturing and Garments.
Figure 2-1: Sector Coverage of the Pilot Survey (%)
Building sector diversity in the sample was crucial as it helps highlight the relative severity of
constraints faced by different types of industries. For example, the sectors which are heavy consumers
of power are likely to suffer more due to load-shedding as compared to those sectors that are not high
energy consumers. Furthermore, within each sector the scale and size of the firm also matter in
determining the impact of constraints. In order to make the data sensitive to size the survey splits each
sector into small, medium and large scale units. As shown in Figure 2-2 below the survey comprised
around 50% large scale manufacturers and around 25% medium and small enterprises. Moreover,
figure 2-3 shows that the enterprise coverage was mainly privately owned and sole proprietorship
(78%) enterprises.

14
Figure 2-2: Survey Coverage by Size of Industries (%)
Figure 2-3: Survey Coverage by Ownership Structure (%)
Finally, the data collected is also sensitive to location of firms within an established industrial zone
and outside an industrial zone. This information can help in identifying if there are any significant
merits for firms to locate inside an established zone. Figure 2-4 below presents the coverage of the
survey in terms of location inside and outside an industrial zone.

15
Figure 2-4: Survey Coverage by Location within or outside an Industrial Zone (%)

16
3 Constraints Faced by Industries in Seven Key Regions of Punjab
3.1 Introduction
The objective of this analysis is to identify the major constraints impeding the output and productivity
of firms in the major industrial clusters/zones of Punjab. By using the ICA 2006-07 data, the World
Bank report had analyzed the impediments and constraints to productivity and investment at the
country and the provincial level. This section focuses on the Punjab by taking the analysis deeper into
industrial zones in the province – identifying the key constraints hampering growth and productivity
across various clusters, industries and firm sizes and estimating, where possible, the impact of these
constraints on firm/industry output. Given the fact that most of the constraints faced by Industry
persist today and in some cases have even worsened, this analysis is further supplemented by the
Lahore zone analysis of 101 manufacturing firms. This is done to identify the key constraints which
are currently inhibiting growth and productivity of firms and to reassess the impact of these on the
manufacturing sector in the Lahore zone.
3.2 Major constraints and challenges faced by manufacturers located in key industrial zones – analysis of 2006-07 ICA survey
Electricity, macroeconomic instability, and corruption emerge as the highest rated constraints by the
firms surveyed in the Punjab (Figure 2-1) in 2006-07. Among the list of constraints, the lack of
electricity is considered the first and the most serious issue by firms in the province. More than 50
percent of total firms identified electricity shortages as the most serious obstacle out of the given list
of 16 business environment obstacles. The huge gap of rating between electricity and the other
obstacles identified in the list is quite evident.
Macroeconomic instability emerges as the second highest rated constraint by all firms in the Punjab.
In this category about 15 percent of firms rated macroeconomic instability as the most serious
constraint while 16 percent and 13 percent of firms reported it as their second and third most serious
constraint respectively.
Corruption is considered the third highest rated constraint selected by 10 percent as the most serious
obstacle. Around 12 percent chose it as the second most serious constraint and 12 percent as the third
most serious. The other notable constraints identified by firms are access to finance, tax rates and
crime, theft and disorder.
Figure 3-1 shows the major constraints in each of the six industrial clusters in the Punjab.

17
Figure 3-1: Summary of overall constraints faced by all firms in Punjab
Figure 3-2: Major Constraints of Punjab’s firms
Source: Authors’ calculation based on ICA 2007 survey data
3.3 Major constraints and challenges faced by manufacturers located in the Lahore zone – pilot survey 2012.
At the aggregate level the survey asked the respondents to rank their top most constraint, second most
serious constraint and the third most serious constraint. The results show that at the aggregate level
electricity is by far the most critical constraint with over 70% of the firms classifying it as most
18
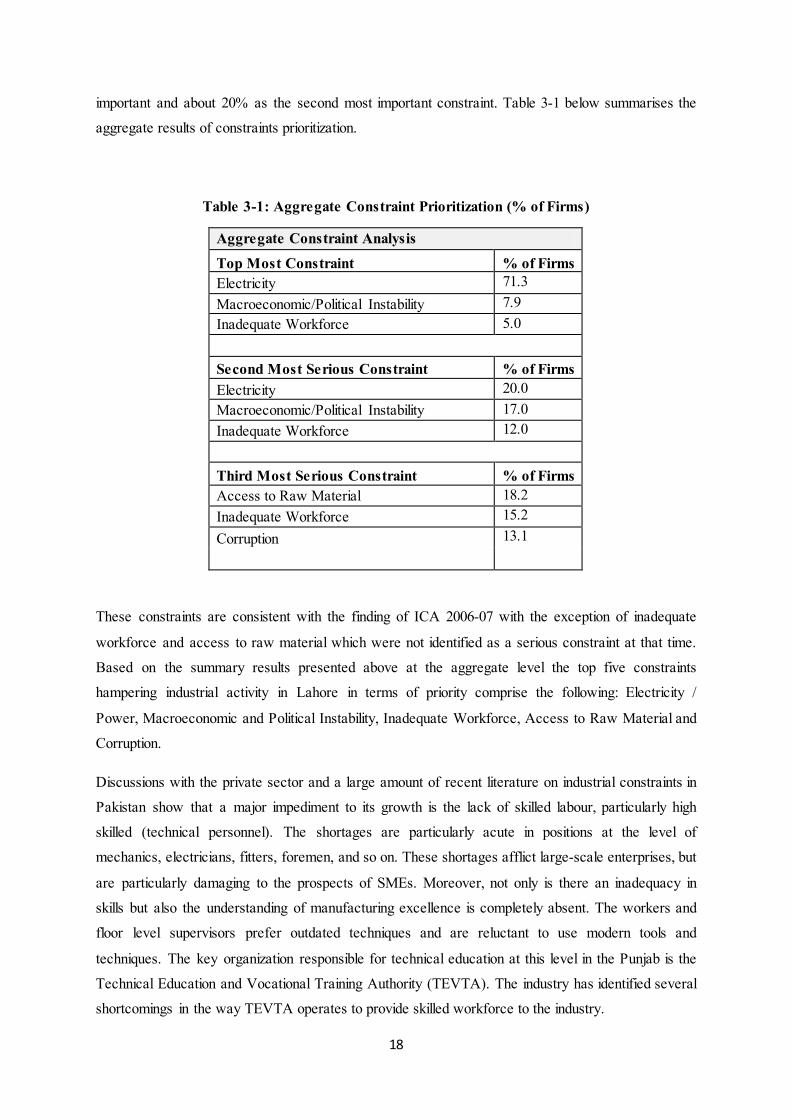
important and about 20% as the second most important constraint. Table 3-1 below summarises the
aggregate results of constraints prioritization.
Table 3-1: Aggregate Constraint Prioritization (% of Firms)
Aggregate Constraint Analysis
Top Most Constraint % of Firms Electricity 71.3 Macroeconomic/Political Instability 7.9 Inadequate Workforce 5.0
Second Most Serious Constraint % of Firms Electricity 20.0 Macroeconomic/Political Instability 17.0 Inadequate Workforce 12.0
Third Most Serious Constraint % of Firms Access to Raw Material 18.2 Inadequate Workforce 15.2 Corruption 13.1
These constraints are consistent with the finding of ICA 2006-07 with the exception of inadequate
workforce and access to raw material which were not identified as a serious constraint at that time.
Based on the summary results presented above at the aggregate level the top five constraints
hampering industrial activity in Lahore in terms of priority comprise the following: Electricity /
Power, Macroeconomic and Political Instability, Inadequate Workforce, Access to Raw Material and
Corruption.
Discussions with the private sector and a large amount of recent literature on industrial constraints in
Pakistan show that a major impediment to its growth is the lack of skilled labour, particularly high
skilled (technical personnel). The shortages are particularly acute in positions at the level of
mechanics, electricians, fitters, foremen, and so on. These shortages afflict large-scale enterprises, but
are particularly damaging to the prospects of SMEs. Moreover, not only is there an inadequacy in
skills but also the understanding of manufacturing excellence is completely absent. The workers and
floor level supervisors prefer outdated techniques and are reluctant to use modern tools and
techniques. The key organization responsible for technical education at this level in the Punjab is the
Technical Education and Vocational Training Authority (TEVTA). The industry has identified several
shortcomings in the way TEVTA operates to provide skilled workforce to the industry.

19
Moreover, the quality, availability and price variance of raw material are key factors that distort input
costs and decisions of manufacturers. Industries have to invest heavily to store sufficient amounts of
inputs to guard against frequent price hikes and issues of non-availability. This is more so the case for
imported raw material.
Figures 3-3,3-4 and 3-5 present the prioritisation of all the key constraints faced by the industrialists
in Lahore.
Figure 3-3: Top Most Serious Constraint (% of Firms)
Figure 3-4: Second Most Serious Constraint (% of Firms)

20
Figure 3-5: Third Most Serious Constraint (% of Firms)
The following discussion focuses on the five major constraints identified in the ICA 2006-07 survey
and in the recent pilot survey of firms in the Lahore zone. For each of the constraints there is a
detailed comparison of their incidence and impact across the seven clusters, sectors and firm size
using both the ICA 2006-07 data and the current Lahore survey.
3.4 Electricity
3.4.1 Introduction
The nationwide shortage in electricity is the most damaging and chronic problem facing industry
across the country. The impact of electricity shortages on Industry in Punjab is very acute and needs
immediate attention and redress by both the provincial and the federal government. This section is
divided into two parts, the first looks at the impact of electricity shortages at the cluster and sector
level in the Punjab province using the ICA survey 2006-07. The second part uses the latest Lahore
zone pilot survey of firms to analyse and assess the current situation of industry vis-a vis electricity
shortages.
In the data collected for the World Bank Investment Climate Survey in 2006-07 electricity shortage
has been consistently reported as the most important obstacle to industrial growth in Punjab across
different clusters, sectors and firm sizes. This is evident from the figure below which shows that five

21
out of the six industrial zones in the Punjab reported electricity as the most severe constraint
hampering their growth and productivity. Across Punjab as a whole almost 80 percent of firms
considered electricity as being amongst the top three most serious constraints out of which 52 percent
identified it as the most serious one. Across clusters, Sheikhupura and Faisalabad are clear outliers;
more than 80 percent of the firms in these industrial zones reported electricity shortages to be the most
serious obstacle to their business. This is followed by Wazirabad, Gujranwala and Lahore, where
more than 40 percent of firms regarded electricity as the most severe constraint. Interestingly in both
Sialkot and Rawalpindi, only a quarter of firms reported electricity as the most serious obstacle,
although more than 50 percent of firms in both these cluster still considered it amongst the top three
most severe constraints.
Figure 3-6: Firms reporting electricity as most serious constraint (%)
3.4.2 Impact of electricity across clusters
The severity of electricity can be judged by the fact that on average firms in Punjab lost more than 10
percent of total annual sales as a result of outages. The sales loss was most acute in firms located in
the Gujranwala zone with an average loss of around 14 percent which is almost half a standard
deviation above the Punjab mean. This is followed by Wazirabad, Faisalabad and Sialkot where
average firm losses were more than 10 percent of annual sales (see Figure below). Although more
than 80 percent of firms in Sheikhupura reported electricity as the most serious constraint, the losses
reported by firms in that zone were on average around 7 percent which is the lowest in the Punjab.
Firms in Lahore and Rawalpindi fared relatively better with reported losses less that 8 percent of
annual sales.

22
Figure 3-7: All firms average loss due to power outage (%)
Figure 3-8: Sales loss due to power outage across zones (%)
Source: Author’s calculation based on ICA 2007 survey

23
From the figure above it is clear that across different industrial zones, the small and medium sized
firms are more vulnerable to electricity shortage than large firms. In Gujranwala, Faisalabad and
Wazirabad, which constitute the ‘golden triangle’ of Punjab’s industry, losses incurred by small and
medium sized firms were substantially higher as compared to the large firms within these zones. This
result is not surprising, small and medium sized firms generally do not have the financial capacity to
generate their own power and hence are much more reliant on the national grid.
3.4.3 Impact of electricity across sectors
The following figure shows the sector within each of the six clusters worst effected by electricity
shortages. For example, in Lahore, it’s the Pharmaceutical sector which suffered the most, with
almost 20 percent of annual sales lost as a consequence of electricity outages. In Sialkot, Gujranwala
and Rawalpindi, the garments industry was a clear outlier. In fact, the garment industry in Gujranwala
reported on average 50 percent loss as a result of electricity shortages, which is by far the highest
amongst industrial sectors. The food sector, in both Wazirabad and Faisalabad was the worst hit with
average losses of 26 percent and 40 percent respectively. Other sectors, not shown in the figure, but
which also suffered significant losses were Electronics and Cutlery in Gujranwala and Cutlery and
Machinery Equipment in Wazirabad.
Figure 3-9: Highest annual sales loss due to power outages (%)
The figure below compares losses due to electricity shortages in the five major sectors of Punjab
reported in the 2007 ICA survey. These sectors are Textiles, Garments, Pharmaceuticals, Food and
Machinery and Equipment. According to the survey the Pharmaceutical industry and the Garments
industry report the highest losses in terms of annual sales. Interestingly, within the Pharmaceutical

24
industry it’s the large firms which report the highest annual losses amounting to 20 percent of annual
sales. On the other hand in the Garments industry it’s the small and medium enterprises which bear
the highest loss as a consequence of electricity shortages. Machinery and Equipment, Textiles and the
Food sector report on average losses of around 10 percent of annual sales and the variation of losses
across firm size in these industries is not significant. It is worth noting that the industries which report
the highest losses due to electricity outages are primarily process based where an unscheduled outage,
even for a short duration, is likely to have a large impact on costs of production.
Figure 3-10: Loss as percent of total annual sales due to power outages
Therefore according to the 2007 ICA survey, the zones which suffered the most as a result of
electricity shortages were Gujranwala, Wazirabad and Faisalabad. Within these zones the sectors
which registered the highest annual sales loss were Pharmaceutical, Garments and Food. Across the
five major industrial sectors of Punjab, the Pharmaceuticals industry reported the highest annual
losses followed by the Garment industry and the Textile sector. Machinery and Equipment and the
Food sector were fourth and fifth in terms of average annual sales loss.
The following sub-section analyses the current situation of the industry located in the Lahore zone in
terms of electricity shortages.
3.4.4 The current situation - Analysis based on the Lahore survey Power is the dominating issue that has emerged even more strongly since the ICA survey back in
2006-07. Power shortage has multiple impacts on the performance of industries. Non-availability
results in loss of production reducing the amount of output produced by firms. Unannounced outages
have increased wastages and wear and tear of machines, especially in sectors where there is more
25
automation such as plastics, chemicals, etc. Sudden power outages result in breakdown of more
sensitive equipment of machines. In some cases the damaged equipment requires repair by suppliers
located outside Pakistan resulting in significant loss of production time. Moreover, lack of power at
homes has a negative impact on workforce efficiency and productivity. Firms have reported that over
the summer months the productivity of workers goes down significantly as they feel more tired due to
lack of sleep. Finally, it is not only the availability but the increased cost of power that is causing
issues for firms especially in the SME sector.
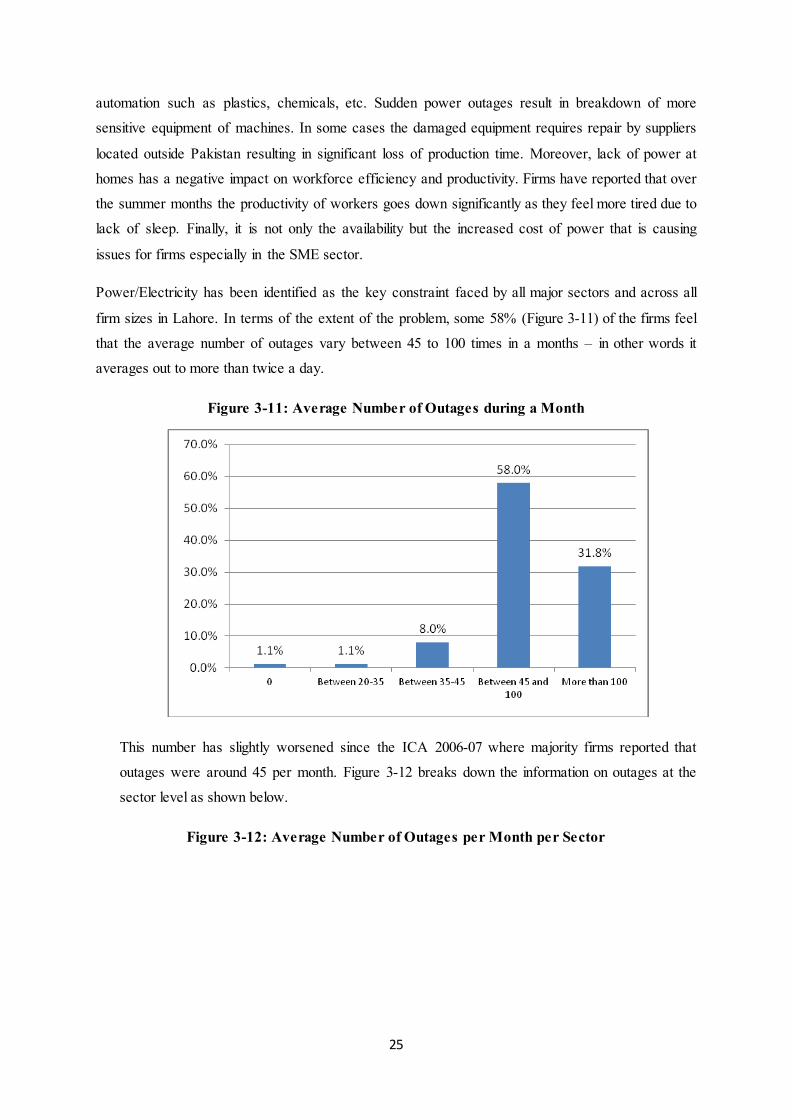
Power/Electricity has been identified as the key constraint faced by all major sectors and across all
firm sizes in Lahore. In terms of the extent of the problem, some 58% (Figure 3-11) of the firms feel
that the average number of outages vary between 45 to 100 times in a months – in other words it
averages out to more than twice a day.
Figure 3-11: Average Number of Outages during a Month
This number has slightly worsened since the ICA 2006-07 where majority firms reported that
outages were around 45 per month. Figure 3-12 breaks down the information on outages at the
sector level as shown below.
Figure 3-12: Average Number of Outages per Month per Sector

26
All the sectors with the exception of printing, food and textiles reported that number of outages
per month was between 45-100. Majority of the firms in the printing and the food sector reported
that number of outages were greater than 100, whereas in textiles the response was evenly split
between greater than 100, between 45-100 and between 35-45.
Figure 3-13: Number of Outages per Month per Sector (Small Firms)
Interestingly, across all sectors small firms report the highest number of outages, averaging more
than a 100 per month. As small firms are more likely to be located outside industrial zones it can
be inferred that outages are much higher and also more random in areas outside these zones.
Figure 3-14: Number of Outages per Month per Sector (Medium Firms)

27
Figure 3-15: Number of Outages per Month per Sector (Large Firms)
In case of medium and large firms majority firms report outages to be between 45 and 100, except
for food and chemical industry where around 50% of firms report outages to be greater than 100.
3.4.4.1 Impact of Power Outages In order to assess the impact of the power outages on the performance of the industry the survey
estimates the losses to sales experienced by firms in Lahore. As it was not possible for the firms

28
to estimate the exact amount of loss the survey reports losses as a broad range to identify the
maximum and the minimum possible losses experienced.
Figure 3-16: Percentage of Sales Lost due to Power Outages (%)
Figure 3-16 above shows percentage of sales lost due to power outages at the aggregate level.
About 43.8% of the firms reported that the loss was less than 10%, about 19% reported losses
between 10-20% and around 37% firms reported losses of greater than 20%. Using conservative
weights this translates into an average of loss of 15% of sales. This loss is twice as much
compared to 2007, when it was around 7% in the Lahore zone.
Figure 3-17: Percentage of Sales Lost due to Power Outages by Sectors (%)

29
The reported data (Figure 3-17) above shows that chemicals, non-metallic minerals (includes
plastic), printing and others suffer the most from power outages. More than 50% of the firms in
each of these sectors have reported that losses due to power outages were greater than 20% of the
sales. This is to be expected as the manufacturing processes of all these three industries require
uninterrupted power supply. Interruptions either result in loss of material or a significant loss as a
consequence of increased production downtime.
Figure 3-18: Percentage of Sales Lost due to Power Outages per Sector
(Small Firms) %
Figure 3-18 reports data on small firms in various industrial sectors. Textiles, manufacturing,
chemicals, non-metallic minerals and printing are most affected by power outages.
30
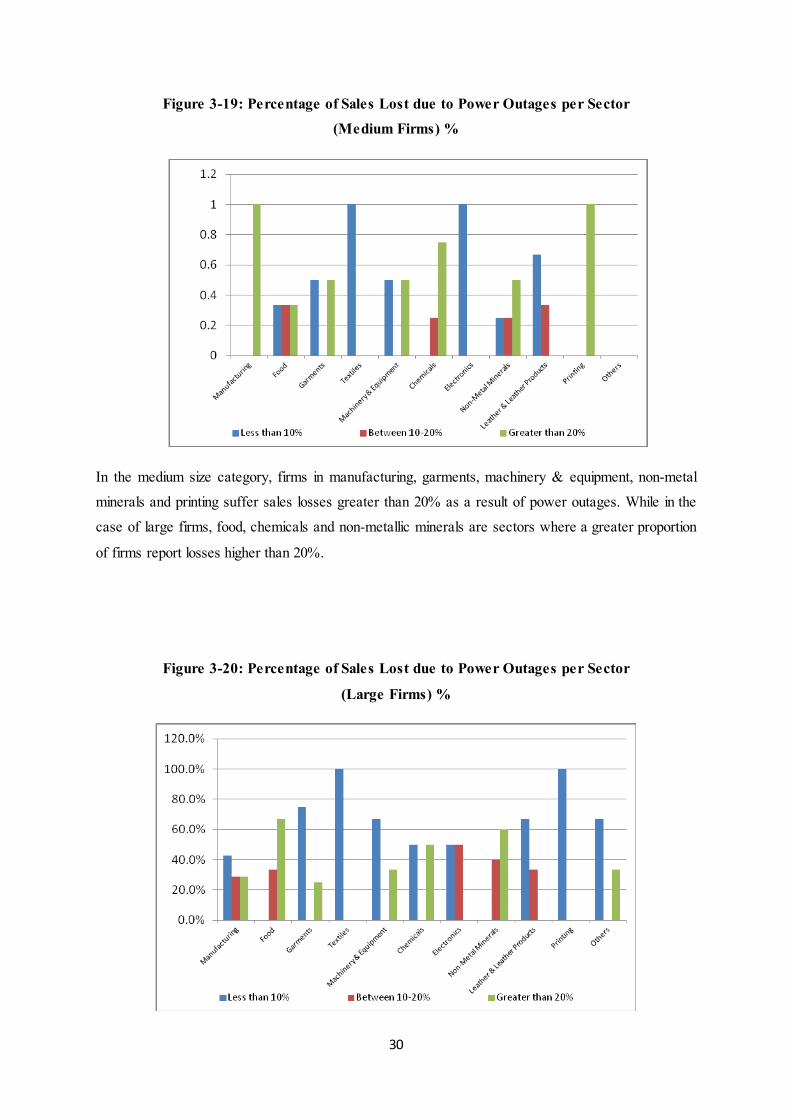
Figure 3-19: Percentage of Sales Lost due to Power Outages per Sector
(Medium Firms) %
In the medium size category, firms in manufacturing, garments, machinery & equipment, non-metal
minerals and printing suffer sales losses greater than 20% as a result of power outages. While in the
case of large firms, food, chemicals and non-metallic minerals are sectors where a greater proportion
of firms report losses higher than 20%.
Figure 3-20: Percentage of Sales Lost due to Power Outages per Sector
(Large Firms) %
31
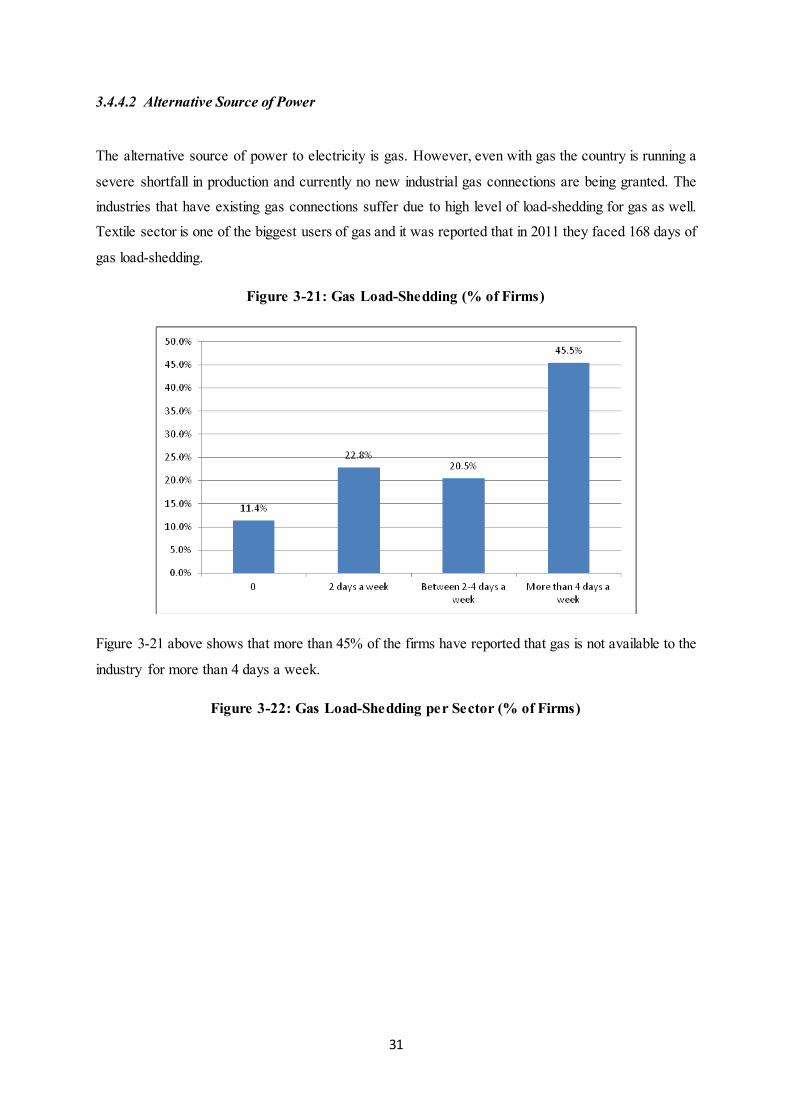
3.4.4.2 Alternative Source of Power
The alternative source of power to electricity is gas. However, even with gas the country is running a
severe shortfall in production and currently no new industrial gas connections are being granted. The
industries that have existing gas connections suffer due to high level of load-shedding for gas as well.
Textile sector is one of the biggest users of gas and it was reported that in 2011 they faced 168 days of
gas load-shedding.
Figure 3-21: Gas Load-Shedding (% of Firms)
Figure 3-21 above shows that more than 45% of the firms have reported that gas is not available to the
industry for more than 4 days a week.
Figure 3-22: Gas Load-Shedding per Sector (% of Firms)

32
In terms of sectors, more than 50% of the firms in the manufacturing, garments, electronics and non-
metallic minerals sectors reported that gas load shedding was more than 4 days a week. The above
data represents the perspective of large firms as the survey data reports that 90% of the small and
medium firms do not have industrial gas connection, whereas around 55% of the large firms were
operating their factories on industrial gas connections.
Figure 3-23: Percentage of Sales Lost due to Gas Load-Shedding (%)
Majority of the firms report (35%) that the losses due to gas non-availability is less than 10% of their
sales, about 22.5% of the firms report that losses were greater than 20% of the sales.
Figure 3-24: Percentage of Sales Lost due to Gas Load-Shedding Per Sector (%)

33
Around 50% of the firms in the manufacturing and in the printing sectors reported losses due to gas
shortage greater than 20%. Based on discussions with the industry it is more likely that losses are less
than 10% due to gas shortages. The information above is at the aggregate level but is more
representative of large firms as there were hardly any medium or small firms in the survey which had
industrial gas connections.
In order to further assess the impact of power shortages the survey also reports data on number of
production days lost.
Figure 3-25: Number of Production Days Lost due to Power Shortage (%)
According to the data, more than 28% of the firms report losing 7-10 days of production time due to
power shortfall. The same percentage reports that they lose 2-7 days of production time. On average
around 5-7 days are lost due to power issues.

34
Figure 3-26: Number of Production Days Lost due to Power Shortage per Sector (%)
3.4.4.3 Key Coping Mechanism The key coping mechanism for power shortage is self generation of power by using generators.
Figure 3-27: Use of Generator to Support Power Shortage (% of Firms)
73% of the firms reported that they use generators as a key coping mechanism to meet the power
shortfall.
Figure 3-28: Use of Generator to Support Power Shortage per Sector (%)

35
The data reports that except for chemicals, leather & leather products and printing in all other sectors
more that 70% of the firms own generators. Moreover, majority of the generators (90%) are fuelled by
diesel and very few by gas.
Figure 3-29: Are the Generators Gas Fuelled (%)
This has an important implication for cost of power generation. The power generation cost using a
generator fuelled by diesel is around Rs. 48 per unit of electricity, whereas the same unit if consumed
from the national grid costs Rs. 13. So the costs increase more than 3 folds if generators are used as an
alternative source. This cost does not vary across size or sectors.

36
3.4.4.4 Other Coping Mechanisms
In addition to using generators, firms have to resort to alternative means to meet their production
targets in the wake of electricity shortfall.
Figure 3-30: Coping Mechanisms (% of Firms)
Figure 3-31: Coping Mechanisms per Sector (% of Firms)
Over 55% of firms at an aggregate level across all sectors have to rely on overtime to meet the
production shortfall due to power outages. Other mechanisms include increased work week
(moving to 7 days working) or increased standard shift timing. All of this results in higher worker
costs and also larger overheads.

37
Figure 3-32: Impact on Overhead Costs of Implementing Coping Mechanisms (%)
Figure 3-33: Impact on Overhead Costs of Implementing Coping Mechanisms per Sector (%)
Around 38% of the firms reported that in implementing these coping mechanisms the overhead
costs have increased by more than 20%. In terms of sectors, majority of the firms in the
manufacturing, garments, textiles, machinery & equipment, non-metallic minerals and printing
report the greatest increase in overhead costs as a result of implementing these coping
mechanisms.
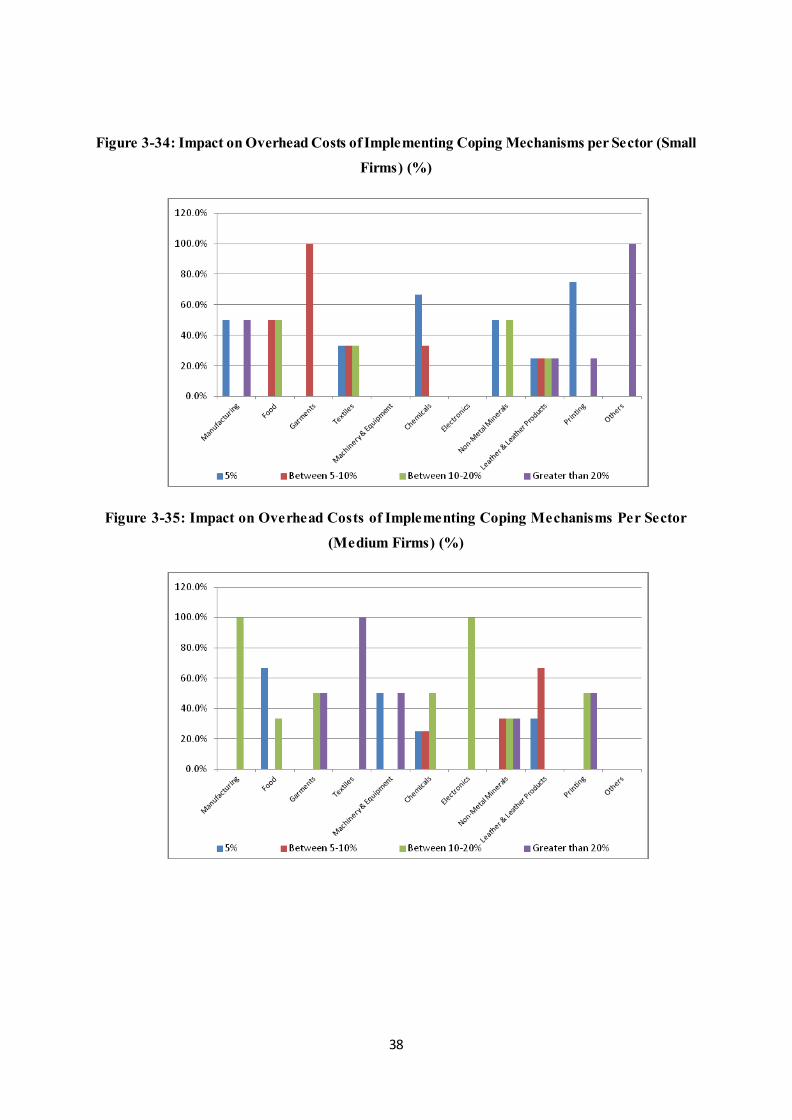
For small firms across all sectors the impact on costs due to coping mechanisms mostly varies
between 5% and 10%. For medium firms the impact on cost for almost all sectors varies between
10% and 20%, whereas, for large firms the impact on costs across most sectors is greater than
20%.
38
Figure 3-34: Impact on Overhead Costs of Implementing Coping Mechanisms per Sector (Small
Firms) (%)
Figure 3-35: Impact on Overhead Costs of Implementing Coping Mechanisms Per Sector
(Medium Firms) (%)

39
Figure 3-36: Impact on Overhead Costs of Implementing Coping Mechanisms per Sector (Large
Firms) (%)
The increasing extent and magnitude of power shortages faced by industry is fast eroding its
competitiveness. Industries are not only losing valuable production time, but due to the additional
costs associated with the coping mechanisms, are facing significantly higher costs of production.
Given the severity of the problems the industries visited during the survey were running close to
full capacity which demonstrates their resilience to face these challenges. The industry continues
to be innovative in developing techniques to reduce the impact of power shortage on their
business. Some have moved to more energy efficient technology, some use more outsourcing,
whilst others just work harder to keep the ‘ball rolling’.
3.5 Macroeconomic Instability
A strong and viable macroeconomic environment in the country is critically linked with investment
and growth in the manufacturing sector. On the other hand a volatile macroeconomic environment
with rising inflation, burgeoning budget deficits, increasing external debt obligations and an unstable
exchange rate threatens to retard investments, manufacturing and output growth in the country. The
overall investment climate in a country is negatively affected by macroeconomic instability as it
increases uncertainty of future returns. This uncertainty which comes in the form of instability and
volatility in demand and relative prices adds to the cost of doing business.

40
Figure 3-37: Firms Reporting Macroeconomic Instability as a Constraint (%)
Authors’ calculation based in ICA (2007) survey Figure 3-38: Macroeconomic Instability as an Obstacle (All Firms)
Authors’ calculation based in ICA (2007) survey
Macroeconomic instability has been identified after electricity as the top constraint obstructing
productivity and output growth in the ICA (2007).

41
At the Punjab level almost 46 percent of firms declared macroeconomic instability among the top
three obstacles. Looking at the variation across seven industrial clusters, Gujranwala-cluster seems to
have been the most affected by macroeconomic instability - 67 percent of the respondents stated it to
be among the top three constraints. This is followed by Islamabad and Rawalpindi with 35 percent of
the businesses declaring macroeconomic instability as the top constraint to productivity and business
growth. Lahore, Sheikhupura and Faisalabad were among the least affected by macroeconomic
instability. For instance, in Faisalabad only 5 percent of businesses reported macroeconomic
instability as the top constraint. Thus, industrial clusters in Gujranwala, Sialkot, Wazirabad and
Islamabad/Rawalpindi were the most affected zones.
In terms of sectoral variation of the constraint, across Punjab, the Pharmaceutical industry
overwhelmingly declared macroeconomic instability as one of the major constraints. Pharmaceutical
industry relies heavily on imported raw material (chemicals) as a primary input. Continued
depreciation of the rupee has significantly increased the price of chemicals which in turn has
increased the costs of production. Garments and Machinery & Equipment were the other two
important sectors identifying macroeconomic instability as the most important constraints. Finally
almost 30 percent manufactures in the Food and Textile sectors see macroeconomic instability as a
moderate constraint.
Though there is no specific information given in the data regarding macroeconomic variables
affecting business growth, it can be inferred that inflation and exchange rate volatility are perhaps
affecting business environment the most. Higher inflation increases the cost of production and also
decreases demand due to an increase in general price levels. Exchange rate volatility particularly
affects the price of tradables. Firms using imported raw material as intermediate good pay higher
prices which increases the costs of production. Also due to instability in exchange rate, expected
prices of the goods to be exported may vary which might discourage the demand for domestically
produced goods in the foreign markets.
In the pilot survey of firms in Lahore, macroeconomic stability continues to be identified as one of the
major impediments to industrial growth. In the Lahore district, 25 percent of the businesses identified
macroeconomic instability among the top two constraints.
Table 3-2: Macroeconomic & Political Instability Impacting Industrial Performance
Industry
Does Not Apply
Minor Obstacle
Moderate obstacle
Major Obstacle
Manufacturing Size Small 100.0% Large 50.0% 50.0% Total 66.7% 33.3%

42
Food Size Small 100.0% Medium 100.0% Large 100.0% Total 100.0% Garments Size Small 100.0% Large 100.0% Total 33.3% 66.7% Textiles Size Medium 100.0% Large 100.0% Total 20.0% 80.0% Machinery & equipment
Size Medium 50.0% 50.0%
Total 50.0% 50.0% Chemicals Size Small 100.0% Total 100.0% Non-metallic minerals
Size Medium 100.0%
Total 100.0% Leather & Leather products
Size Small 100.0%
Total 100.0% Other Manufacturing
Size Small 50.0% 50.0%
Medium 100.0% Total 33.3% 33.3% 33.3%
Table 3-2 above shows that chemical sector and machinery & equipment both view macroeconomic
and political instability as a key impediment to industrial growth. A reason for this perhaps is low
levels of investment in these sectors as businesses perceive it to be risky in an unstable economic
environment characterised by variable and high rates of inflation, uncertain exchange rate and high
mark-up rates. Most of the other sectors view macroeconomic and political instability as moderate
obstacles. The survey results estimates that on average around 15% of productivity is lost due to
macroeconomic and political uncertainty. This impact is quite consistent across sectors as well as firm
size.
A caveat to the reporting of numbers on perceived losses is that firms, in particular smaller
enterprises, surveyed had little capacity to understand the exact implications of macroeconomic and
political instability. It is quite likely that firms when responding would have considered poor security
condition as part of macroeconomic and political instability in the country. The security situation has
significantly hurt the industry especially the exporter manufacturers. Due to poor security conditions
in the country the importers are becoming increasingly sceptical about Pakistan’s capacity to supply
goods in a timely manner. This has resulted in several export orders (especially in textiles) shifting
from Pakistan to other countries.

43
3.6 Corruption:
After electricity and macroeconomic instability, corruption emerges as the third most critical
constraint faced by the manufacturing industries of Punjab. Government officials interfacing with
industry normally exploit the lack of awareness on the part of industry about technical issues in
regulations to extract rents. The industry reports that it bears high costs which come in the form of
informal payments to concerned officials. The ICA 2007 survey as well as Lahore based survey 2012
had specific questions designed to gauge the degree and extent of corruption related to Industry in
Punjab. In the discussion below, the report elaborates the extent of corruption as well as informal
payments made to officials across key clusters and industries.
Across the seven key industrial hubs in Punjab, more than one third of the firms identified corruption
as first, second or third most serious constraint (Figure below). Rawalpindi (50%) and Gujranwala
(42%) are reported to suffer most from corruption followed by Sialkot and Lahore.
Figure 3-39: Incidence of corruption across clusters
Source: Author’s calculation based on ICA 2007 survey
The firms report that the most common method of corruption is through inconsistent interpretation
and ad-hoc application of government regulation and policies related to tax, labor, and other licensing
issues. An overwhelming majority of Punjab’s manufacturers believe that officials interpret policies
and regulations inconsistently. The application of policies by government officials is purposely
complicated to extract as much rent as possible by threats or even harassment.
Moreover, the evidence from the survey suggests that there is a strong positive correlation between
firm size and contact with various levels of bureaucracy. Hence, medium and large sized firms report
a much greater contact both in terms of time and number of offices that they have to deal with as

44
compared to the small sized firms. A slight anomaly in the ICA 2007 data is that it is the medium and
small sized firms rather than the large ones that end up paying more bribes and informal payments to
get things done. This may be the case because it’s relatively easier for the lower bureaucracy to
extract rents from poorly informed smaller manufacturers than it is from larger businesses.
The reported data by firms also suggest variation in cost of corruption across key sectors. The Textile
sector reportedly pays around 7% of its annual sales as informal payments to get things done, with
smaller firms in the sector spending almost 13% of annual sales. The Food sector, especially the small
sized firms, bears the second highest costs due to corruption. The results are not surprising – the
textile sector is the biggest employer of labour and has the highest frequency of visits by labour
inspectors. While the food industry faces most visits by health and quality regulators.
Figure 3-40: Percent of total annual sales paid as informal payment
Source: Author’s calculation based on ICA survey 2007
In terms of cluster averages, firms in Wazirabad report the highest cost of corruption paying on
average 14% of their annual sales as informal payments and gifts to get things done. In terms of size,
small firms in textiles and furniture located in Faisalabad and Rawalpindi respectively bear the
maximum cost of corruption (all above 25%). While medium sized cutlery industry in Wazirabad
pays around 20% of their annual sales as informal payments. Textile sector in Faisalabad pays most to
labour inspectors whereas small and medium scale industry in Wazirabad and Rawalpindi seems to
suffer due to high levels of illiteracy which facilitates exploitation by government officials.

45
Figure 3-41: Percent of total annual sales paid as informal payment
Source: Author’s calculation based on ICA 2007 survey
The section below uses the evidence from the new pilot survey done in Lahore to support the findings
from ICA, 2007 presented above.
3.6.1 Findings from Lahore Pilot Survey
The fourth key obstacle to industrial growth identified in the Lahore based survey was corruption. As
mentioned before, the major source of this corruption is government officers not interpreting rules and
regulations clearly in order to create room and opportunity for corruption.

46
Figure 3-42: Do Government Officers Interpret & Implement Rules Consistently (%)
Figure 3-42 shows that all the sectors unanimously feel that government is weak in interpreting
and implementing regulations. And this is the case for all firm sizes across all sectors.
Figure 3-43: Wastage of Time due to Over Bureaucratic Procedures (%)
A key impact of the above behaviour by the government officials is the loss of productive time of
factories. All sectors feel that engaging repeatedly with government officials for simple matters
wastes precious time and resources that could have been used more productively. Most of the
sectors feel that anywhere between 3-7 days are wasted in dealing with any single issue with a
government department. The data does not vary much across firm size.
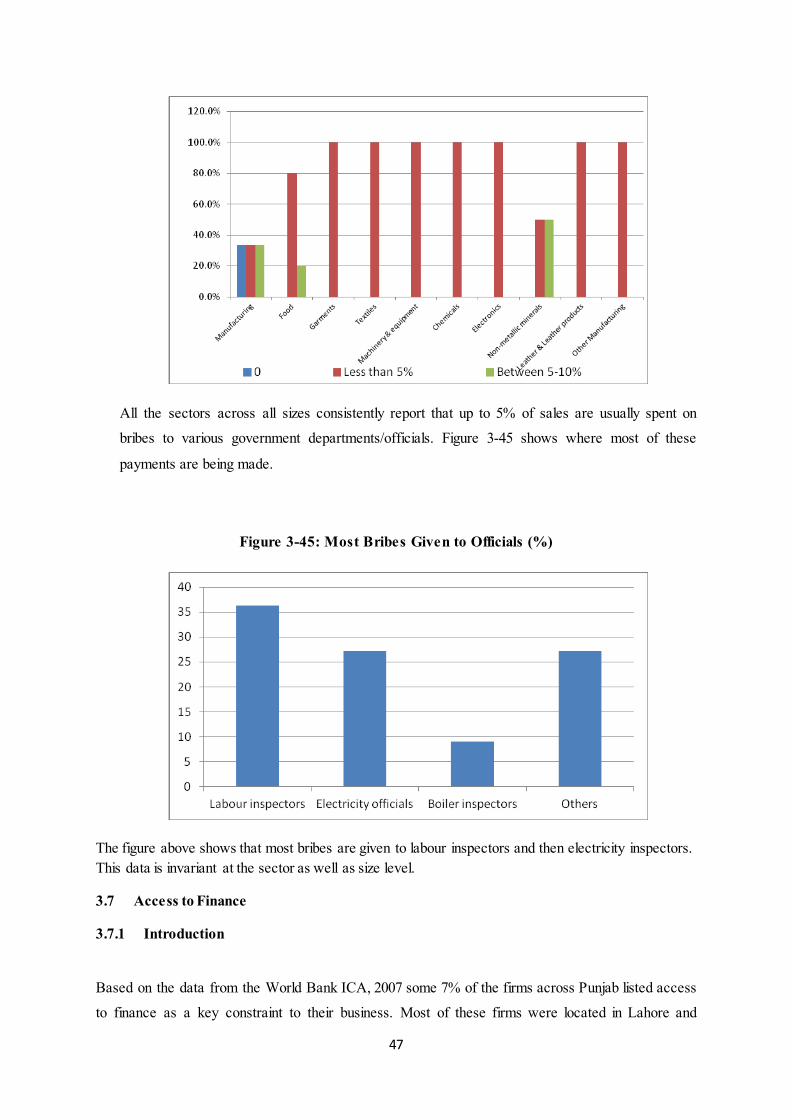
Figure 3-44: Percentage of Sales Given as Bribe to Get Things Done (%)
47
All the sectors across all sizes consistently report that up to 5% of sales are usually spent on
bribes to various government departments/officials. Figure 3-45 shows where most of these
payments are being made.
Figure 3-45: Most Bribes Given to Officials (%)
The figure above shows that most bribes are given to labour inspectors and then electricity inspectors. This data is invariant at the sector as well as size level.
3.7 Access to Finance
3.7.1 Introduction
Based on the data from the World Bank ICA, 2007 some 7% of the firms across Punjab listed access
to finance as a key constraint to their business. Most of these firms were located in Lahore and

48
Sialkot. Moreover, the pilot survey done for Lahore based firms reported that around 3% firms
categorized access to finance as a key constraint. The World Bank ICA, 2007 data and the Lahore
survey data had significant number of missing entries for questions on access to finance and hence it
was not possible to provide a quantitative analysis of the problem. However, the report provides a
qualitative analysis of the issue and makes a case on how lack of access to finance is impeding
industrial performance.
3.7.2 The Issue
The pilot survey done for Lahore suggest that it is more of the medium and small sized firms that
complain about access to viable finance as compared to large firms. The problem of larger firms is
more to do with the higher mark-up costs than access to finance. Through discussions with the SME
industrial sector and commercial banks it is clear that the issues of capital availability and its
appropriate utilization stem from inadequate capacities both at the level of firms and commercial
banks. The firms suffer from typical SME related asymmetric information issues and limited capacity
to manage and provide reliable financial and balance sheet data. Most of the financial transactions of
the firms are recorded informally with much of this information residing only with the owner. The
banks generally refuse to trust even audited statements as they are assumed to be fictitious. Hence, in
most cases the banks secure lending against 100 per cent collateral which is not always available with
the small and medium enterprises.
Even in cases where firms want to disclose their information fully they do not have the capacity to
comply with a bank’s documentation requirements. Moreover, the sector is not that disciplined or
scrupulous when it comes to the use of credit. In several cases the working capital limits or short term
business loans are utilized for personal expenditure. This inappropriate use of capital puts further
pressure on businesses as they add up on debt without any addition to revenue generation capacity.
However, the issue is not only with the capacity of the industry, the commercial banks also have
limited capacity to serve the requirements of SME credit in Pakistan. Commercial banks do not have
any special schemes for SME development finance and all lending is done on commercial basis,
which is too expensive for the SME sector.
Secondly, there has never been any pressure on commercial banks to extend development/long-term
credit to the SME sector. With large fiscal deficits of the federal and provincial governments and the
presence of attractive spreads the commercial banks are comfortably maintaining large exposures to
AAA rated debt.

49
The commercial banks also use the broad nature of the SME definition/classification to their
advantage.8 Most of the lending done to SMEs includes clients that are at the margin of being
classified as an SME.
3.7.3 Impact on Industry
The lack of access to finance has resulted in industry following non-innovative and low technology
production techniques. The major production of small and medium sector is low value added products
with little intra industry differentiation; there is hardly any innovation resulting in limited
international competitiveness. Moreover, lack of access to long term loans has resulted in limited
investment if any in technology; hence most of the medium and the small sector in Punjab use
outdated machinery and technology. A key consequence of this is that industry has failed to grow
and remains uncompetitive due to diseconomies of scale. If this patters persists, industry in Punjab is
likely to fall behind international competitors and over time lose its domestic and export market share
to low cost and more innovative producers in India, China and Vietnam.
3.8 Inadequate Workforce
Notwithstanding acute shortage of electricity/power and uncertain macroeconomic conditions a factor
that can still drive competitiveness is skilled labour force. Punjab is endowed with a young and a fast
growing labour force. This demographic trend presents an immense challenge for the economy which
is to both educate and train this young labour force and to produce enough jobs to absorb their
growing numbers. Keeping this challenge in mind the Government of Punjab has recently formulated
the Youth Skills Development Council that will work as a regulatory authority in tandem with
TEVTA to train the workforce of Punjab.
The survey conducted for this report has identified inadequately trained workforce as one of the key
impediments to industrial performance.
8 To be categorized as an SME in Pakistan, a concern must not employ more than 250 persons in the case of a manufacturing or service concern, and 50 persons in the case of a trading concern. Moreover, its net sales should not exceed Rs 300 million and it must not possess assets worth more than Rs 50 million for a trading concern and Rs 100 million in the case of a manufacturing concern. The State Bank is now working on revising this definition.

50
Figure 3-46: Inadequate Workforce as an Obstacle (%)
Figure 3-46 above shows that almost all sectors list inadequate workforce as a moderate to major
obstacle. More specifically table 3-3 below shows the diversity of this problem across sectors and
across various sizes of the firms. Textiles and leather and leather products are the two main sectors
where, regardless of the size of the firm, inadequate workforce is considered a major obstacle to
industrial performance. Most of the other sectors across different sizes view it as a moderate obstacle.
Table 3-3: Inadequate Workforce as an Obstacle (%)
Industry
No obstacle
Minor Obstacle
Moderate obstacle
Major Obstacle
Manufacturing Size Small 100.0% Medium 100.0% Large 100.0% Total 20.0% 60.0% 20.0% Garments Size Medium 100.0% Large 50.0% 50.0% Total 66.7% 33.3% Textiles Size Small 100.0% Medium 100.0% Large 100.0% Total 50.0% 50.0% Machinery & equipment
Size Large 100.0%
Total 100.0% Chemicals Size Medium 50.0% 50.0% Large 100.0% Total 33.3% 66.7%
51
Electronics Size Large 50.0% 50.0% Total 50.0% 50.0% Non-metallic minerals
Size Small 50.0% 50.0%
Total 50.0% 50.0% Leather & Leather products
Size Small 66.7% 33.3%
Total 66.7% 33.3% Other Manufacturing
Size Medium 100.0%
Large 100.0% Total 50.0% 50.0%
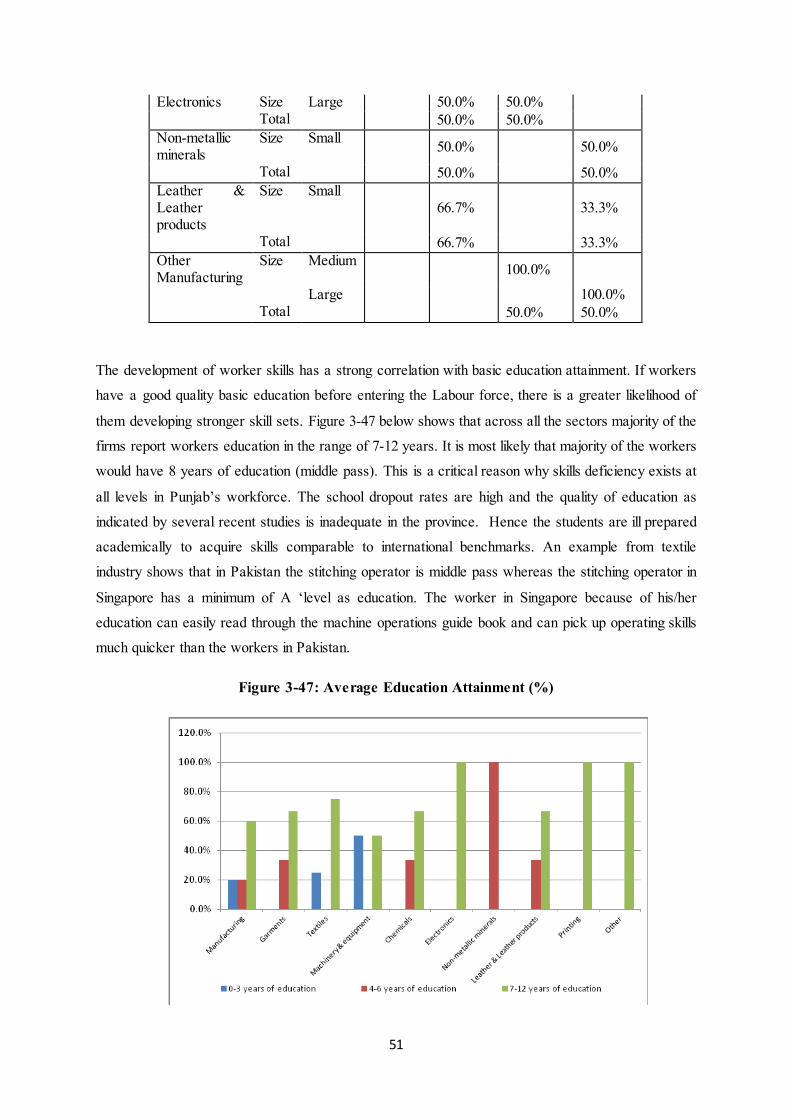
The development of worker skills has a strong correlation with basic education attainment. If workers
have a good quality basic education before entering the Labour force, there is a greater likelihood of
them developing stronger skill sets. Figure 3-47 below shows that across all the sectors majority of the
firms report workers education in the range of 7-12 years. It is most likely that majority of the workers
would have 8 years of education (middle pass). This is a critical reason why skills deficiency exists at
all levels in Punjab’s workforce. The school dropout rates are high and the quality of education as
indicated by several recent studies is inadequate in the province. Hence the students are ill prepared
academically to acquire skills comparable to international benchmarks. An example from textile
industry shows that in Pakistan the stitching operator is middle pass whereas the stitching operator in
Singapore has a minimum of A ‘level as education. The worker in Singapore because of his/her
education can easily read through the machine operations guide book and can pick up operating skills
much quicker than the workers in Pakistan.
Figure 3-47: Average Education Attainment (%)

52
3.8.1 Coping Mechanism
The key coping mechanism that is used by firms to address the issue of inadequate workforce is to
offer own or in house training programmes.
Figure 3-48: Firms Running Training Programmes (%)
The data clearly suggests that majority of the firms across all sectors offer some form of training to
their workers to address the issues of inadequately trained workforce. Textiles, garments and
electronics are the sectors where all the firms in the survey offered some form of training to their
workers.

53
4 Policy Brief
The population of Punjab has grown rapidly over the past three decades and according to some
projections by 2025 it will increase to 128 million. A key challenge facing the province is to create
sufficient number of jobs every year to absorb the increasingly large number of entrants into the
labour force. A significant and sustained increase in investment and productivity in the manufacturing
sector is therefore imperative to create employment and income for the provinces burgeoning
population.
Currently the industrial sector of Punjab employs around 23 percent of the provinces labour force and
contributes just over 24% in the provincial GPP. Over the last 10 years average growth in the
manufacturing sector has been over 5% per annum with highest growth registered in the early years of
the last decade. However, since 2006-07, industrial performance has shown an unprecedented
deterioration contributing negatively to provincial GPP. This abysmal performance is a consequence
of serious domestic issues and constraints which have stunted the sector’s contribution to the
economy. The ICA 2007 WB report identified power shortages, macroeconomic and political
instability along with bureaucratic corruption as the most important constraints to investment and
industrial productivity at both the national and provincial level.
The objective of this particular report was an in depth analysis of industry in Punjab through the
identification of the major constraints impeding the output and productivity of firms located in the
seven major industrial clusters/zones of the province. By using the data from ICA 2007 this study
closely analyzed each of the seven major industrial zones in Punjab – identifying in each of these the
key constraints hampering growth and productivity across various industries and firm sizes, and,
estimating, where possible, the impact of these constraints on firm/industry output.
Moreover, to reassess the findings of the ICA 2007 data, the study conducted a pilot survey in the
Lahore region covering 101 firms across 10 different sectors. The results of the pilot survey were not
significantly different from the findings of ICA 2007. Electricity has been identified as the most
severe obstacle faced by the industries in the Lahore region. Almost 71 percent of the firms declared
electricity as the most important constraint. Macroeconomic stability has been identified as the second
important constraint by 8 percent of the firm’s surveyed. Inadequate workforce, access to raw material
and corruption were ranked third, fourth and fifth constraints respectively.
The most chronic and binding constraint to industry in Punjab is thus the nationwide energy crisis. As
evident from the recent pilot survey on firms in Lahore, the shortfall in power has worsened over the
past year and a half with an increase not only in the number of outages but also in the duration of each
shutdown. These irregular and unannounced power cuts have an adverse impact on firm output and

54
productivity affecting process based industries relatively more than others due to increased wastage of
raw material. Macroeconomic and political instability which manifest itself in the form of high
investment risk, inflation and increased interest rates, are the other two important factors contributing
to industrial slowdown. Moreover, industries in Punjab remain hostage to bureaucratic inefficiency
and rent seeking. This is especially the case with labour inspectors and low tier customs officers.
Inadequately trained labour has also been identified in the recent pilot survey as a critical factor
impeding industrial performance.
For sustainable industrial growth it is imperative for the government to frame appropriate policy
interventions which would resolve these issues over the long term. At the same time the government
needs to take immediate steps to mitigate the negative impact of these constraints on output and
productivity of the industry in the short run. This policy note puts forward the main contours of the
government of Punjab’s strategy to address the problems which falls under its ambit. However, some
of the key constraints faced by the industries do not directly fall under the jurisdiction of the Punjab
government; for instance, fiscal and monetary policy and energy policy are in the domain of the
federal government. The Punjab government therefore should maintain a permanent contact/dialogue
with the federal authorities to advise and play an active advocacy role on such issues. The constraint
wise policy recommendations for the Punjab government are given below:
4.1 Electricity
In the Lahore zone, industrial sectors that suffer the highest loss due to electricity outages include
food processing, plastics, pharmaceuticals, printing and chemicals. These sectors have reported that
they lose up to 15% of their annual sales due to power outages and unscheduled power cuts. All these
sectors have continuous manufacturing processes and at any one point in time significant amount of
raw material is under process. A sudden unannounced tripping of electricity can result in wastage of
raw materials and increased time of operation due to cleaning and restarting of processes. Moreover,
sectors that are more automated face high repair and maintenance costs as sudden electricity outages
damage the more sensitive and costly electronic parts. Most of these parts have to be sent abroad for
repairs which add significantly to costs. This is not a Lahore specific issue but is also present in the
other industrial hubs of Punjab. For example in Faisalabad, Food and Machining sectors suffer most
due to electricity. In Gujranwala it is the Electronics and Cutlery sectors that are worst hit while in
Sialkot it’s the Leather Garments industry. Food Processing suffers the most due to outages in
Sheikhupura and Wazirabad.

55
Policy Recommendation
In the short term the Punjab Government should work closely with Electric Supply Companies and
continuous process sectors to work out a harmonized load-shedding schedule. The sectors, especially
those worst hit, should be provided electricity for a continuous stretch depending on their
requirements. This schedule must be worked out sector by sector for all process based industries
identified above.
Provincial government should facilitate linkages between the Electronics Department of the
University of Engineering and Technology, Lahore and Lahore University of Management Sciences
to work closely with sectors on prefabricating and developing complicated Programmable Logic
Controllers (PLC’s) that are used in all automatic machinery. Factories can provide access to
researchers from universities and the Government may fund research grants to work on developing
the PLC technology casted to local requirements.
The Lahore firms pilot survey suggests that firms located in industrial zones, to some extent, suffer
fewer losses due to electricity shortages as compared to those located outside industrial zones. A key
reason for this is strict scheduling of load management in industrial zones. The Punjab Government
based on industrial concentration should declare major industrial areas as zones and provide priority
treatment to these.
4.2 Corruption
Almost all the industrial sectors in the seven industrial hubs have identified corruption by government
officials as a key cost to business and an impediment to industrial growth. In Lahore, Pharmaceutical
and Chemical sectors complain the most about undue contact with government officials. They receive
the most visits by labour inspectors and drug regulatory inspectors. All these contacts with inspectors
entail some form of gift or even a direct payment to the inspectors. In Faisalabad, textile industries
receive the highest number of visits by labour inspectors and boiler inspectors. The other regions have
complained about unnecessary visits by labour inspectors and in most cases have reported that
inspectors directly ask for bribes or compensation. On average the industry loses anywhere between
3-7 days resolving a single issue with government officials. The survey also reports that bribes and
gifts given throughout the year amount to around 1%-5% of total annual sales. In terms of degree of
corruption amongst officials - labour inspectors are considered to be the most corrupt, followed by
electricity officials (mostly lineman and XEN) and boiler inspectors. The electricity officials often
threaten cutting power supplies if not compensated appropriately by the firm. Moreover, over billing
is a common problem and cases remain unresolved for several months meanwhile every month the
industry owner has to pay bribes to get the bill corrected.

56
Policy Recommendations:
The Government of Punjab in the short term should set up an effective monitoring mechanism for
labour inspectors devised in consultation with the private sector to reduce the incidence of harassment
and bribery.
Over the medium term, the Government of Punjab will have to devise a more transparent mechanism
of collecting labour related taxes. The system should be fair and simple so that it is easily
understandable by the industry, increases incentives to pay taxes and reduces the interaction of
industry with the lower bureaucracy (labour inspector). One way of simplifying the existing system is
to categories industries in broad bands and then charge a fixed tax based on the upper value of the
band. This will reduce incentives for industries to hide information and will also make it easier to pay
taxes. The broader band range would also facilitate verification of industry status for tax collection
purposes.
The Industries Commerce and Investment Department, Government of Punjab already has a consumer
complaints cell. The role of this cell can be further enhanced to also cater for violations of rights of
industrial consumers. The cell should collect and receive information from industry on unfair
treatment and corruption by government inspectors. Where the cases pertain to the provincial domain
the provincial government should take direct action and where they pertain to the federal domain they
should use the evidence to advocate appropriate action.
The Government of Punjab needs to develop minimum service standards for industries and these
should be displayed in all government offices and circulated widely through mass advertisement
campaign. This will help the industry understand their rights and obligations and will also give clarity
on the obligations and standards the government has to meet, making it easy to evaluate the
performance of government service delivery.
4.3 Access to Finance
Given that the provision of finance and managing the banking sector falls under purview of the State
Bank, the provincial government of Punjab can take some direct measures and also strongly advocate
measures which would improve and enhance the provision of finance to its industry. Some of the
policy interventions are suggested below.
Policy Recommendations
The Government of Punjab through its Department of Industries, Commerce and Investment and the
Punjab Small Industries Corporation can conduct a credit and product need assessment of key sectors

57
located in the seven main industrial hubs of Punjab. Based on this information it can suggest to the
State Bank to initiate product and programme based lending at single digit mark-ups in these sectors.
Through its Department of Industries, Commerce and Investment, Punjab Government can run
training and capacity building courses for the small and medium sized industry on formulating
financial information in templates that are acceptable to commercial banks for loan processing.
Punjab Government should strongly advocate to the State Bank the following regulatory
changes to improve access to finance:
• Loans of up to Rs15 million for plant, machinery and equipment for registered industries
should be approved through a ‘one window’ operation.
• The State Bank should make it mandatory that at least 50% of their lending requirement to
SME’s must be fulfilled by including small accounts. The maximum size for an account to
qualify as a small account may be set at Rs 20 Million.
• Borrowing may be facilitated against guaranteed export orders.
• State Bank should work with commercial banks to improve and enhance service provision to
all industry. This may involve developing new lending guidelines for different sectors and
different sizes of firms. These guidelines should also include lending principles which clearly
set out the minimum standards for small-sized, medium-sized and large businesses.
• Set up lending targets in each of the key industries located in Punjab and progress should be
monitored for targets to be achieved over the next three years.
4.4 Inadequately Trained Workforce
Textiles, garments and leather are the three main sectors across all seven regions that have identified
inadequate workforce as a key constraint to industrial growth. All these sectors are labour intensive
and also require specific levels of skills. Inadequately trained workforce has become a more serious
problem over time. As evident from the survey results, in 2006 it was viewed as less important
compared to 2012, when it has been reported as one of the most critical issues. A key reason for this is
both declining quality and level of school education in Pakistan and the introduction of technically
advanced and more complicated machinery in factories. As the workers entering into industry have
low educational attainment their ability to understand complex machines is fairly limited. The firms
have to spend significant amount of resources to train labour on these newer machines. The TEVTA
model has failed as it has not been able to keep pace with the advancement in technology at the

58
industry level. Without appropriately trained workforce, industry in Punjab will find it increasingly
difficult to remain competitive internationally.
Recommendations:
The Punjab government should start pilot programmes for the Textile and Leather sectors which
suffer the most due to shortage of skilled workforce. Punjab Government can develop a model on the
framework of the Machine Operators Stitcher Training (MOST) programme of the Ministry of
Textiles, Government of Pakistan. The TEVTA trainer should work on factory floors with a group of
workers to provide them with class room based training while the factory provides on the job training.
The workers trained under the programme are contracted to continue working in the factory for a
certain amount of time after the training. The programme was piloted for women stitcher’s and proved
to be one of the most successful modelsof labour training. A similar model can be worked out for the
leather sector.
Over the medium term the Government of Punjab will have to restructure TEVTA’s model entirely by
closing down outdated service centers and by using the saved resources to upgrade curricula, develop
international linkages and integrate courses with on the job (factory floor) trainings.

59
References
Department for International Development, Private Sector Development Strategy for Punjab, June 2010. Government of the Punjab, Punjab Economic Report 2007, Lahore 2007. Government of the Punjab, A Strategy for Accelerating Economic Growth and Improving Service Delivery, June 2009. Small and Medium Enterprise Development Authority, Industrial Clusters, Investors Guide, SMEDA, 2010. World Bank, Growth and Export Competitiveness, Washington, D.C., 2006. World Bank, Pakistan: Investment Climate Assessment II (3 parts), Washington, D.C., 2010. Porter, Michael., Clusters and Economic Policy: Aligning Public Policy with New Economics of Competition. by E, HBS, 2007.

Designed by soapbox.co.uk
The International Growth Centre (IGC) aims to promote sustainable growth in developing countries by providing demand-led policy advice based on frontier research.
Find out more about our work on our website www.theigc.org
For media or communications enquiries, please contact [email protected]
Subscribe to our newsletter and topic updates www.theigc.org/newsletter
Follow us on Twitter @the_igc
Contact us International Growth Centre, London School of Economic and Political Science, Houghton Street, London WC2A 2AE