constrained curriculum in high schools- the changing math standards and student achievement, high sc
TRANSCRIPT
Available in: http://www.redalyc.org/articulo.oa?id=275022797005
Red de Revistas Científicas de América Latina, el Caribe, España y Portugal
Sistema de Información Científica
Nathan Daun-Barnett, Edward P. St. John
Constrained Curriculum in High Schools: The Changing Math Standards and Student Achievement, High
School Graduation and College Continuation
Education Policy Analysis Archives/Archivos Analíticos de Políticas Educativas, vol. 20, 2012, pp. 1-25,
Arizona State University
Estados Unidos
How to cite Complete issue More information about this article Journal's homepage
Education Policy Analysis Archives/Archivos
Analíticos de Políticas Educativas,
ISSN (Printed Version): 1068-2341
Arizona State University
Estados Unidos
www.redalyc.orgNon-Profit Academic Project, developed under the Open Acces Initiative

Manuscript received: 01/26/2011 Revisions received: 10/13/2011
Accepted: 10/24/2011
education policy analysis archives A peer-reviewed, independent, open access, multilingual journal
Arizona State University
Volume 20 Number 5 February 20, 2012 ISSN 1068-2341
Constrained Curriculum in High Schools: The Changing Math
Standards and Student Achievement, High School Graduation and College Continuation
Nathan Daun-Barnett
University at Buffalo
Edward P. St. John University of Michigan
Citation: Daun-Barnett, N. & St. John, E.P. (2012). Constrained curriculum in high Schools: The changing math standards and student achievement, high school graduation and college continuation. Education Policy Analysis Archives, 20(5). Retrieved [date], from http://epaa.asu.edu/ojs/article/view/907 Abstract: Mathematics education is a critical public policy issue in the U.S. and the pressures facing students and schools are compounded by increasing expectations for college attendance after high school. In this study, we examine whether policy efforts to constrain the high school curriculum in terms of course requirements and mandatory exit exams affects three educational outcomes – test scores on SAT math, high school completion, and college continuation rates. We employ two complementary analytic methods – fixed effects and difference in differences (DID) – on panel data for all 50 states from 1990 to 2008. Our findings suggest that within states both policies may prevent some students from completing high school, particularly in the near term, but both policies appear to increase the proportion of students who continue on to college if they do graduate from high school. The DID analyses provide more support for math

Education Policy Analysis Archives Vol. 20 No. 5 2
course requirement policies than mandatory exit exams, but the effects are modest. Both the DID and fixed effects analyses confirm the importance of school funding in the improvement of high school graduation rates and test scores. Keywords: high school; education policy; college access. Currículos restringidos en las escuelas secundarias cambios en los estándares de matemáticas, rendimiento académico, graduación de la escuela secundaria y la continuación de los estudios universitarios de los estudiantes Resumen: La educación matemática es una cuestión de política pública en los EE.UU. y las presiones que enfrentan los estudiantes y las escuelas se ven agravadas por las crecientes expectativa de asistir a la universidad después de graduarse en la secundaria. En este estudio se investigó si los esfuerzos políticos para restringir el plan de estudios de secundaria en términos de requisitos de los cursos y los exámenes de graduación influyen tres resultados educativos - los resultados de las pruebas de matemáticas, la graduación de secundaria y las tasas de continuación de estudios universitarios. Empleamos dos métodos complementarios de análisis - de efectos fijos y la diferencia en diferencias (DID)- en un panel de datos para todos los 50 estados de 1990 a 2008. Nuestros resultados sugieren que las dos políticas en los estados pueden impedir que algunos estudiantes completen la escuela secundaria, particularmente en el corto plazo, pero las dos políticas parecen aumentar la proporción de estudiantes que van a la universidad directamente después de terminar la escuela secundaria. El análisis DID ofrece mayor apoyo a las políticas de los prerrequisitos de los cursos de matemáticas que los exámenes de egreso obligatorio, pero los efectos son modestos. Tanto el DID como el análisis de efectos fijos confirman la importancia del financiamiento escolar en la mejora de las tasas de graduación y los resultados de las pruebas escolares. Palabras clave: escuela; política de educación; acceso a la universidad. Curriculum resumido no Ensino Médio: as mudanças nos padrões de matemática e os ganhos acadêmicos, formatura do Ensino Médio e a continuação dos estudos universitários dos alunos Resumo: A educação Matemática é uma questão de política pública nos EUA e as pressões que enfrentam os alunos e as escolas são agravados pela crescente expectativa de comparecimento a universidade após o ensino médio. Neste estudo examinamos se os esforços políticos para limitar o currículo do ensino médio em termos de exigências de cursos e exames de egressos obrigatórios afetam três resultados educacionais - os resultados dos testes em matemática, a conclusão do ensino médio e as taxas de continuação para a universidade. Nós empregamos dois métodos analíticos complementares - efeitos fixos e diferença em diferenças (DID) - em um painel de dados para todos os 50 estados de 1990 a 2008. Nossos resultados sugerem que ambas as políticas nos estados podem impedir alguns estudantes de completar o ensino secundário, particularmente no curto prazo, mas ambas as políticas parecem aumentar a proporção de estudantes que continuam para a universidade diretamente do Ensino Médio. A DID análise oferece mais apoio às políticas de pré-requisitos aos cursos de matemática do que aos exames de saída obrigatória, mas os efeitos são modestos. Tanto o DID quanto a análise de efeitos fixos confirmam a importância do financiamento das escolas na melhoria das taxas de graduação do ensino médio e nos resultados dos testes. Palavras-chave: ensino médio; política de educação, acesso à universidade.

Examining the Constrained Curriculum Hypothesis 3
Introduction
Mathematics education continues to be a critical public policy priority in the U.S. For many years, the U.S. lagged behind their international counterparts in terms of math proficiency. Recent reports suggest the gaps are closing, but the U.S. still trails other leading nations (Gonzales et al., 2009). There is a well-documented gap in prior preparation between low-income and minority students and majority students (Balfanz & Byrnes, 2006; Vanneman, Hamilton, Baldwin Anderson, & Rahman, 2009). The need to improve preparation in math while in high school may remove one barrier to college access among these same groups of students, as noted by the Spellings Commission on the Future of Higher Education (U.S. Department of Education, 2006). Further, the National Governors Association has recommended states adopt higher graduation standards (Conklin & Curran, 2005), and many states have followed these recommendations.
This study examines the relationship between implementation of policies requiring greater rigor in high school graduation requirements and three outcomes: average state math scores, state high school graduation rates, and state college continuation rates for high school graduates, the three indicators thought to be related to these policies. We argue college continuation may be the most important outcome to consider because increasingly these policies are targeted to increasing postsecondary opportunities. The next section presents our framework for linking reform policies to these access-related outcomes. The second section discusses the data utilized for this study, the fixed effects and difference of differences analytic approaches to analyze state-year panel data, and the study’s limitations. We then report our findings followed by a concluding section which returns to a discussion of the implications of the findings for both policy and the professional discretion of educators in schools.
Framing the Study
Our research is designed to test the “constrained curriculum” hypothesis, where the
constraints are state policy. Past research examines the constrained curriculum as a function of course requirement policies (Clune & White, 1992; Lee, Croninger, & Smith, 1997). The findings suggest that students complete more courses in the core subjects and achievement increases, but researchers caution that students tend to increase course-taking at the lower end of the math sequence meaning that requiring more courses alone may not result in a more rigorous math curriculum for students. This type of research has had an influence on policy rationales requiring more demanding math content (e.g. Algebra, Geometry, or Algebra II) as a minimum standard for high school graduation (e.g. Conklin & Curran, 2005) in addition to the number of courses completed. We suggest that the curriculum is actually constrained in three ways – through course requirements, content standards, and mandatory exit exams. To test the constrained curriculum hypothesis, we suggest it is necessary to consider state contexts, including demographic and historical differences, along with the range of policies that influence student outcomes.
Assumptions
We make two assumptions: First, requiring more math courses constrains the discretion of teachers and administrators, particularly when working with students who perform poorly in math. Teachers maintain discretion over how to teach the standards, but teachers and administrators have less control over what is taught and when. Second, as state requirements rise, schools have less space available for elective courses and, for students who are challenged by more rigorous standards, there is less time to provide remediation. High school completion rates, which declined during the

Education Policy Analysis Archives Vol. 20 No. 5 4
period under investigation, provide some support for this concern. Some educators and policy advocates caution that added requirements will make it more difficult for a subset of students to finish high school. Lillard and DeCicca (2001) found that course requirement policies were related to higher attrition rates in high school; while their analysis is instructive, state policies have changed considerably since 1994 (the last year of data in their analysis).
Like other studies, we use average SAT math scores as a proxy for math achievement, an outcome that links directly to the level of math completed (St. John & Musoba, 2010), along with college continuation rates of high school graduates, an indicator related to both academic preparation and ability to pay. Our college continuation measure is adapted from Tom Mortenson’s Postsecondary Opportunity data and is a measure of the proportion of public and private high school graduates enrolled in college the following fall. (We note the limitations of these two assumptions in our methods section.) Policies Related to Academic Preparation
State policy makers attempt to influence students’ academic preparation, particularly in math, by setting higher expectations and utilizing a number of the policy levers at their disposal. These changes may be appropriately traced to the Opportunity to Learn (OTL) standards advocated during the 1980s and earlier. Unfortunately, the policies informed by OTL increased standards, but they did not necessarily bring to bear the resources or professional development necessary for schools to achieve the promise. Since 1983, 44 states have either adopted state-level high school graduation requirements or increased existing requirements (Council of Chief State School Officers, 2008). Early iterations of the policy were modeled after the New Basics curriculum articulated in A Nation at Risk that called for students to complete: “(a) 4 years of English; (b) 3 years of mathematics; (c) 3 years of science; (d) 3 years of social studies; and (e) one-half year of computer science” (National Commission on Excellence in Education, 1983).
More recent iterations of course requirement policies specify both the number of courses to be completed and the content of those courses, especially in math and science (National Center for Education Statistics, 2005). In 1988 for example, Arkansas required high school graduates to complete three math and two science courses to earn a high school diploma; by 2004 the state had increased the number of courses required (four math and three science) and stipulated that students must complete both Algebra and Geometry in the math sequence and both biology and a physical science course. Increasing the number of courses and the content of those courses imposes constraints on the curriculum, which we suggest limits professional discretion among school leadership and teachers.
Course requirements are only one of the constraints placed on the high school curriculum. Educators, policymakers, and researchers recognize that not all courses with the same title and number result in equivalent opportunities to learn. The same courses offered in two separate buildings or across two different states may lead to different outcomes for students. To counteract this challenge, states have set out to adopt, refine, and clarify course content standards at all grade levels in primary and secondary education. Recent efforts by the National Governors Association (NGA) and the Council of Chief State School Officers (CCSSO) underscore this trend (Common Core State Standards Initiative, 2010). State level leaders and policymakers are not the only forces pushing for stronger, clearer, and more consistent standards across the curriculum; organizations like the National Council of Teachers of Mathematics (NCTM) and the National Council of Teachers of English (NCTE) have established similar guidelines for the development of state content standards.
Testing is another policy used to constrain the curriculum. In the era of No Child Left Behind (NCLB), state standardized tests play an important role in education policy. According to

Examining the Constrained Curriculum Hypothesis 5
the law, all students are tested in the core academic subjects in grades 3-8 and again in high school. These tests are intended to assess student achievement relative to the state standards but increasingly states have required students pass these tests (demonstrate proficiency) as a condition of high school graduation. Mandatory exit exams have become a high stakes barrier for high school completion, which makes the path to college much more difficult. Because states are evaluated on both student achievement and high school completion, the test imposes a de facto standard that all students are expected to achieve, even if that standard is set at the lowest common denominator. It becomes a constraint on the curriculum for students who might either prefer an alternative curriculum like career technical education (CTE) or who find it difficult to demonstrate proficiency and require remedial work as a consequence. Linkages to Outcomes
Four linkages are particularly important in order to understand the degree to which course requirements and mandatory exit exams are likely to affect college continuation. In this study, college continuation refers specifically to the subset of high school graduates who attend college directly after high school (Mortenson, 2010). We explicitly consider four sets of linkages: Linkage 1: High School Requirements Influence Course Taking Patterns.
One of the concerns implicit in A Nation at Risk was that expectations for students were too low and that students could complete more rigorous coursework if they were required to do so (Chaney, Burgdorf, & Atash, 1997). Powell, Farrar and Cohen (1985) found that in comprehensive high schools where there was no clear curriculum or strong guidance, students did only what was necessary to get by. Clune and White (1992) found that, in low performing schools in policy adopting states, student course-taking patterns changed both in terms of the number of courses completed in core content areas and the rigor of those courses, though more improvement was observed in lower level courses. The largest gains were made in mathematics course taking, both in terms of the numbers of courses and in the level of rigor. By testing curricular changes in schools with low expectations, Clune and White were testing the assumption that changes in graduation requirements impacted course taking in schools with a lower minimum standard prior to the policy, and their evidence suggests the policy may have had the desired effect. Linkage 2: Course Taking Affects Test Scores.
Chaney, Burgdorf, and Atash (1997) extended Clune and White’s work by suggesting that not only do these policies increase course-taking in core courses, they also affect student achievement. They utilized National Assessment of Educational Progress (NAEP) data and hierarchical linear modeling to examine the relationship between course requirements and student achievement. They found that a majority of students complete more courses than required, a finding consistent with Clune and White (1992). The authors also suggested that, while more ‘college preparatory’ courses were taken, those courses were largely at the introductory rather than the advanced level. For every additional year of college preparatory math completed, NAEP scores increased by an average of 18 points. Notably, the authors considered the negative consequence that some students will fail in more rigorous courses and found a small minority (4%) of students fell into this category, concluding the benefits outweighed the potential risks.
A number of researchers have attempted to test and improve upon the findings of these earlier studies. Lee, Croninger, and Smith (1997) suggest that if educators and policymakers narrow the range of courses students take to the core academic subjects and control the level of rigor expected in these courses, student outcomes will improve. They tested the constrained curriculum hypothesis using NAEP data and HLM analytic techniques and found that schools offering a

Education Policy Analysis Archives Vol. 20 No. 5 6
narrower curriculum (made up mostly of core academic subjects) improved student overall test scores without exacerbating achievement gaps by socioeconomic status (SES). Finn, Gerber, and Wang (2002) recognized that not all schools offer the same set of curricular course options and found that the number and rigor of math courses offered by the school was positively related to both course-taking and achievement, which were also related to the size of the school. They also found that assignment to a vocational track limited a student’s likelihood of taking a rigorous math course.
Teitelbaum (2003) extended the dialogue to include both math and science courses and cautioned that taking more courses does not necessarily lead to greater math achievement, pointing to the lack of preparation of teachers. Schiller and Muller (2003) indicated similar findings regarding increased course-taking patterns, but suggested that added measures of accountability testing did not, of themselves, improve student outcomes. Finally, Sipple, Killeen, and Monk (2004) examined changes in the New York State requirements and concluded that district level adoption of the policies had an important effect on student course-taking; schools that adopted the course requirements were more likely to demonstrate gains relative to schools that chose to adapt their practices in ways that circumvented the policy. Linkage 3: Course Taking Patterns and Achievement Affect High School Graduation Rates.
The evidence on this linkage is less definitive. Hoffer (1997) considers the effects of math course requirements on course taking patterns, test scores, and graduation rates. He cautions that while his findings are similar to earlier studies, the connection between the policy and test scores may not be as strong as one might expect, suggesting schools lack adequate resources and highly qualified teachers. He also suggests these policies do not appear to have any effect on high school graduation rates. Lillard and DeCicca (2001) found that state curriculum graduation requirements increased high school attrition rates during the 1980s and early 1990s. More recently, St. John (2006) found that, when more math courses are required in states that have adopted NCTM content standards in math, high school graduation rates declined.
Challenges exist, however, that limit the claims on both sides of the high school graduation debate. Lee, Croninger, and Smith (1997) considered the constrained curriculum at the school level; as such, they did not account for the possible selection bias attributable to the school district’s opportunity to choose what courses to require of students. It is possible that high schools serving wealthier and better prepared students are in a position to constrain the curriculum more easily. More recent work by Lee and others (Allensworth, Nomi, Montgomery, & Lee, 2009) attempted to address this form of bias by examining similar patterns across a large urban district. Their findings suggest modest improvements in 9th grade course-taking, but declines in high school completion and no effect on college enrollments. We extend the work of Allensworth and colleagues on high school completion by considering the state over time as the unit of analysis. While the district continues to play an important role in shaping expectations for students, we argue that state policies limit the exercise of local discretion for an increasing number of districts and, as a result, the effects of these policies are likely to be more appropriately observed at the level of the state. Linkage 4: Policies Affecting Math Course Taking Patterns also Affect the Rate at which High School Graduates Continue on to College. Researchers including Pelavin and Kane (1990), Berkner and Chavez (1997) and Perna and Titus (2004) have demonstrated a positive relationship between the number of math courses students take in high school and their likelihood of continuing on to college and succeeding. St John (2006) tested this hypothesis and found that among three separate policies designed to improve math outcomes—content standards, number of math courses required, and local control of math

Examining the Constrained Curriculum Hypothesis 7
requirements—none were significant predictors of college continuation. The only policy variable related to whether students continued on to college was the presence of an advanced or honors diploma option in the state. In this study, we examine this linkage with three modifications: more recent years of data to the analysis, inclusion of rigor (Algebra I or above) as a dimension of the course requirement policy, and the difference in differences method borrowed from econometrics to assess whether the policy may be causally linked to the outcomes under investigation.
There is a possible limitation in this study. Conceptually, it may be a stretch to suggest that a high school curriculum policy designed to constrain student course options will, in fact, have a direct and independent effect on whether they attend college. As the linkages described above suggest, there are a number of intermediate steps that the policy is more likely to affect. As such, the effects of these policies may be overestimated because those intermediate variables are not included in the prediction equations. In our final analysis of college continuation, we control for high school completion rates in an effort to address this potential source of bias. Completing high school is an important step toward college enrollment, and any policy that potentially reduces the chances for some to finish high school may appear to exert a large effect on college continuation. By adjusting for high school completion rates we reduce the bias and provide more conservative estimates of the effects of the policies on students’ continuation on to college.
Methodology
This study expands upon earlier analyses by St. John (2006) and utilizes measures of
constraint on the curriculum related to both the breadth and depth in math requirements. State policies seldom address math in isolation from other academic subjects, so our identification of math requirements only reflects part of the constraints placed upon high schools. However, as others have noted, mathematics is appropriate for this state level analysis because the courses are sequentially ordered, research on math course taking has been utilized by researchers and policy makers to advocate for constraining the high school curriculum, and math serves as a critical gateway to a number of postsecondary major opportunities, particularly in business, engineering and the health professions. Data
The unit of analysis for this investigation is the state and the findings should be interpreted as changes within states over time (fixed effects) and net differences between policy and non-policy adopting states (difference in differences) over time. The data are drawn from a set of demographic and policy indicators compiled by the authors that approximate characteristics of states, particularly with respect to education funding and academic preparation. The data have been collected for the years 1990-2008, extrapolated from publicly available sources including the College Board, the Integrated Postsecondary Education Data System (IPEDS), the Common Core of Data (CCD), the Census Bureau, and Mortenson’s (2010) Postsecondary Opportunities. Both IPEDS and CCD data were aggregated at the state level and census bureau demographic characteristics were pulled as state level variables. Mortenson uses many of the same sources of data and compiles specific metrics for state level analyses; his data are available as part of a subscription to his publication. Because many of these factors change over time and states adopt different policies at different times and for different reasons, each state-year represents one case, with a full sample of 950 state-year cases (a 19-year panel of 50 states). When attempting to evaluate the impact of policy changes over time, panel data is more appropriate than the large scale federal data bases like the National Education Longitudinal Study (NELS) and the more recent Education Longitudinal Study (ELS). Those sources have many advantages, particularly when examining individual level outcomes, but they are cross-sectional with

Education Policy Analysis Archives Vol. 20 No. 5 8
respect to the implementation of policy and only allow for a comparison of state differences at that moment in time. Statistical Methods
In this study, we use two separate analytic strategies. The fixed-effects method allows us to hold fixed the effects a state may have over time that are not accounted for by factors in the model; we have not explained that variance, but we have controlled for it in a way that allows us to consider factors affecting high school graduation, SAT scores, and college continuation rates within states. Conceptually, it is plausible that x causes y, but it is equally possible that y may in fact cause x or they may vary concurrently, caused by something else entirely. Fixed effects regression modeling provides a useful alternative when examining changes over time. By controlling for time invariant characteristics of the state, we focus our attention on how changes within a state influence outcomes over time. As Allison (2009) notes, there are two key requirements to employ fixed effects: (1) the sample must have two or more measurements on the same dependent variable, and (2) the values of the independent variables of interest must be different for at least some cases in the sample on at least two time points (p. 2). The fixed effects model takes the form:
yit = β0 + β1 xit + θi + εit (1) In the fixed effects model, the coefficient of interest is β1 where x is the dichotomous
variable for the adoption of the policy by group i in time t and θ is the fixed effect for the group. The fixed effects model assumes state characteristics do not vary over time. In this analysis, we add controls for characteristics that are likely to vary. The final model takes the form:
yit = β0 + β1 (RACE)it + β2 (EDUC)it + β3 (POP.)it + β4 (K12Exp)it + β5 (HONORS)it + β6 (AP)it + β4 (SATpart.)it + β4 (Policy)it + θi + εit (2)
where the racial demographics, proportion of the adult population with a bachelor degree, population size, average K12 expenditures per student, availability of an honors diploma, percentage of students taking the SAT and proportion of schools offering AP across the state are included as controls in the model. Consistent with Allison (2009), θi represents the combined effect of all unobserved variables that are constant over time on y and εit represents purely random variation at each point in time.
The fixed effects model is limited in two ways. First, we lose the ability to consider variation between groups, which accounts for a substantial portion of the total variation in the outcomes. Second, the fixed effects model cannot account for the degree to which early adopting institutions and regions are systematically different from other institutions and regions. This sort of selection bias is common and problematic when attempting to evaluate the impact of policies on intended outcomes.
To address these limitations we use a difference in differences (DID) analysis to consider whether the policy accounts for differences across states. The DID method is an econometric tool that allows researchers to more closely approximate experimental treatment and control groups when random assignment is not possible. A simple time series difference analysis considers the outcome both before and after the policy is implemented and assumes any difference is a result of the policy. However, it is possible there is something unique about policy adopting states relative to other states. The difference in differences approach allows researchers to use non-treated groups as a counterfactual, where the difference between the treatment and control groups before the treatment is removed and the observed difference post-treatment is attributed to the intervention. The DID model assumes that the trajectories of the treatment and control groups are parallel in the absence of the policy and that differences between the two groups after the pre-treatment

Examining the Constrained Curriculum Hypothesis 9
differences are removed are attributable to the policy. The difference in differences model takes the form:
yit = β0 + β1Xi + β2 Tt + β3 Xi *Tt + εit (3) where X is a dummy variable for assignment to the treatment group, T indicates time period where a value of 1 is assigned to the post-treatment period, and the coefficient of interest (β3) is the interaction of treatment group assignment and the treatment period. Because the policy is adopted during different years for each state, we match adopters and non-adopters by region. We consider difference in differences for both the mandatory exit exam and the course requirement policy.
DID has been used to analyze the effects of a number of higher education policies (Zhang, 2010), notably to evaluate the Georgia HOPE scholarship and the federal tax credit (Dynarski, 2000). Assessing course requirement policies and mandatory exit exams differ in two ways. First, states adopt multiple variations of course requirements, but we had to focus on one level of the policy – whether states that specify the minimum content of math courses (Algebra I or above) differ from states that did not indicate level of rigor. Second, we had to pay particular attention to the assignment of control states to treatment years because there are several years of adoption of the policies. We draw on the innovation literature to make these assignments. Research on the spread of policies across state boundaries suggests that interstate competition may fuel emulation to a certain degree (McLendon, Hearn, & Deaton, 2006). As bellwether states adopt a particular policy, contiguous states may adopt similar policy preferences to compete with early adopters. We assume contiguous states are similar in important ways and when possible we assign non-adopting states the same pre- and post-treatment years as the adopting states with which they share a border (see Table 1 for complete list of treatment and control year assignments for both policies).
The analysis is sensitive to the specification of treatment and control year assignments. We tested three alternative assignments: all control states assigned to the first year of adoption (1990) of any state; all control states assigned the last year of adoption (2008); and all control states assigned to the year 2000. All three models were poorer fits to the data than regional proximity and none of the relationships were significant.

Education Policy Analysis Archives Vol. 20 No. 5 10
Table 1. Treatment and Control Assignments by State and Year Mandatory Exit Exams Course Requirement Policies State Year Comparison State Year Comparison AL 1990 AR TN 1994 MD 1990 DE, PA GA 1997 MS 1990 MD 1997 VA, DE NC 1990 FL 1998 NM 1990 CO NC 1998 SC GA 1994 TX 1998 MN 1996 WI, IA AL 2000 IN 2000 IL KY 2000 IL FL 2001 MO MS 2000 NY 2001 RI, VT WV 2000 OH, PA LA 2003 NM 2001 WY, CO, UT MA 2003 NH, ME NY 2001 VT, CT, MA, ME, NH, RI, NJ NJ 2003 CT AR 2002 MO NV 2003 AZ OK 2002 KS, NE OH 2004 MI CA 2003 AZ, NV, OR, HI TX 2004 IN 2005 MI VA 2004 WV LA 2005 AK 2005 MN 2008 WI, IA, ND, SD CA 2006 HI WA 2008 ID, MT, AK ID 2006 MT ND 2006 SD SC 2006 TN 2006 KY UT 2006 WY OK 2008 KS, NE WA 2008 OR Dependent Variables
This study considers three outcomes, reflecting the four linkages: achievement as approximated by average SAT math scores, percent of high school graduates, or percent of high school graduates who continue directly to college (college continuation rate). SAT math scores lend themselves to this sort of analysis because they have many test takers in a given year, and their data are readily available. Given that some state systems give preference to ACT rather than SAT, we include a measure of the percentage of students taking the test in a given year in the model.
Our second outcome is a measure of high school graduation rates, among the most contentious measurement issues in education research (Balfanz, Almeida, Steinberg, Santos, & Fox, 2009; Barton, 2005; Cataldi, Laird, Kewal Ramani, & Chapman, 2009; Heckman & LaFontaine, 2010; Swanson, 2004; Warren & Halpern-Manners, 2007). At issue is whether diploma equivalencies are counted, whether it is appropriate to limit completion to a period of four years, and if interstate

Examining the Constrained Curriculum Hypothesis 11
migration patterns are considered (Warren & Halpern-Manners, 2007). In this study, we utilize the completion numbers reported by Mortenson (2010) which reflect a more conservative estimation of high school completion rates because we are interested in students’ chances for successful entry into postsecondary education. We assume that variation in graduation rates over time will be similar across the various methodologies for calculating graduation rates.
Our final outcome is a measure of the rate at which high school graduates continue in postsecondary education using Mortenson’s (2010) measure of college continuation defined as “…the share of public and private high school graduates enrolled in college somewhere in the U.S. by the following fall” (p. 8). The college continuation rate for a state is the proportion of the total number of first time, full-time college freshmen from public and private high schools in the state enrolled in any college in the U.S. divided by the total number of graduates in the state from the previous year. In order to maintain the benefits of 19 years of data, we impute college continuation rates for odd number years with the average of the year prior and the year after. For example, the imputed value for college continuation in Alabama in 2003 is the sum of the Alabama rate for 2002 and 2004 divided by two. We tested the sensitivity of the analysis to the imputation and found the relationships all operated in the same direction and the only differences were found in levels of significance reported.
Independent Variables
Demographic Characteristics. Both race and socioeconomic status are relevant state level characteristics included in these analyses. To describe these characteristics at the state level, Census data and the American Community Surveys (ACS) were utilized to approximate the percentages of residents in the state who live below the poverty rate and the percentages of African American, Hispanic, and Native American students (compared to White and Asian students as the Referent group). The level of education is an important consideration as well, so we include the percentage of residents over the age of 25 who have a Bachelor’s degree or above. Finally, the total number of students enrolled in high schools is used as a control for differences attributed to the size of the state population. K-12 Finance. Funding for education is a critical policy issue, and we include measures of spending per full-time equivalent (FTE) student on instruction as reported by the National Center for Education Statistics (2010) in the annual digest of education statistics. These numbers are adjusted for inflation according to the consumer price index (CPI). Academic Policy Variables. There are a number of policy levers utilized by state policy makers in efforts to improve student achievement and college continuation. Specific to math, states have moved in at least three directions. The first approach is to address the number of math courses required. We use data from CCSSO biannual reports in combination with data reported by NCES in the annual digest of education statistics. When discrepancies occurred, we returned to state web resources to correct the problem. The second policy lever is the adoption of content standards. The National Center for the Teaching of Math (NCTM) published and recommended a set of curricular standards for states, and many states have adopted some or all of their recommendations. We include this measure in the fixed effects analysis because it reflects an important change within states over time, but it was not included in the DID model because there is little variation between states – all 50 states have reported adopting NCTM standards since 2000. Third, states began to recognize the rigor of the course mattered above and beyond the content or the number of courses. Rigor in this analysis is derived from the same sources for published state requirements as discussed above. States are coded as zero when no specific math course was listed in the policy and one if the state specified at least one math course at or above Algebra I. Alternative specifications for this variable

Education Policy Analysis Archives Vol. 20 No. 5 12
were tested, including setting Geometry or above as the minimum criteria for rigor, but few states adopt that standard.
There are several additional academic policies considered in the model. For example, a number of states have adopted mandatory exit exams. We utilize reports from CCSSO and a report by the Center on Education Policy (2007) to identify policy adoption by states and by years. If the policy was in place in the state during a given year, it is coded a one; when the policy was not in place, it is coded zero. Finally, the percentage of schools participating in the Advanced Placement (AP) program is included because it reflects one common policy lever designed to improve the types of curricular opportunities students possess.
Limitations
As with any regression study, there are variables omitted from our statistical model. For example, we do not consider state student aid policies in these analyses, and there is a great deal of evidence that state financial aid influences college enrollment (Heller, 2004; St. John & Musoba, 2010), a factor overlooked in most of the studies on math and college access (Heller, 2004). We recognize that student aid constrains college access for low-income students, a factor we discuss. In fixed-effects regression, omitted variables approximating differences between states are essentially accounted for when we control for states in the model. Since student aid policies vary between states but remain relatively stable within states, this is an acceptable remedy to the problem of omitting variables related to student aid.
Another interesting problem with regression studies in general and this study in particular is that model specification and framing do not easily permit testing of alternative hypotheses or explanations. The specific problem we face in this study is that the constrained curriculum replaced local discretion. Essentially, local discretion in math education was removed from policy debates in 2000, by which point all states had adopted math standards consistent with NCTM. In our study, we reframe the problem of local discretion by thinking differently about the constrained curriculum. Since outcomes differed from those that would be expected given the overly positivist policy literature that argues for constraints as means of improving outcomes, we decided to also ponder why the outcomes might be different than expected. We do not argue for reversing existing policy, but instead reflect on the ways professional action and development has been overlooked and the implications of idealistic notions of using policy levers to improve outcomes. Local discretion plays a role and should be considered when interpreting findings that run counter to the new policy propositions about math requirements.
Third, state-year panel data offers a unique and important type of data to test the effects of policy changes over time, but data aggregated at this level mask the very real differences between districts at the local level. Many districts have adopted more constraining policies than those adopted by the states, and we are not able to address that source of variation in this analysis. A possible implication is that districts in a state like Massachusetts that has no course requirements may adopt more demanding requirements on their own. In that case, we would underestimate the effects of course requirements because Massachusetts would look very much like a comparable state with the course requirement policies in place. Finally, it is important to note that our measure of college enrollment is “continuation,” a rate that compares the number of first-time freshmen students from a state to the number of high school graduates the prior year. This rate slightly inflates the rate of enrollment because some students who do not have high school diplomas enter certificate programs in community colleges and proprietary schools. However, the broader measure of participation by students in the cohort would include a large number of dropouts, biasing the results in another direction. Thus, continuation is the best available measure of the rate of college enrollment by high school graduates.

Examining the Constrained Curriculum Hypothesis 13
Findings
We compare two approaches to the analysis of the impact of state policies that constrain
high school curriculum on three outcomes related to preparation and college enrollment. First, we describe differences in the controls for state contexts in the two methods, a key factor in interpreting fining. Next, we discuss the differences in effects of independent variables also related to these outcomes and then discuss and compare differences in the findings about the impact of state policies that constrain high school curriculum.
Methods of Specifying State Effects
Fixed-effects regression and DID have two different methods of controlling for state effects. In the fixed effects models, state effects are “fixed” or specified so that factors related to the state are controlled for. The findings provide a measure of “within-state” effects of independent-control and policy variables. This approach allows us to consider greater variation in the policies under investigation, but does not allow us to consider whether the effects are attributable to the policy or might otherwise have occurred over time. In contrast, the DID approach allows us to make causal inferences because we effectively partial out the expected effects attributed to time. That is to say, when comparing the trajectories of both “policy adopting” and control states, if we subtract the differences in outcomes prior to the policy from the differences observed after policy adoption, the remaining effect is attributable to the policy. The drawback to the DID is that in order to test the effects of the course requirement policies, we were forced to simplify the policy to a single dimension. We compare results using the two methods. The Impact of State Contexts
Fixed-effects regressions are presented in Table 2, DID regressions for DID analyses of effects high school courses are presented in Table 3, and DID regressions for implementation of high school exit exams are presented in Table 4. There were substantial differences in the significance of independent variables included as controls. Poverty. The percent poverty within states was negatively associated with high school graduation rates and college continuation rates, but was not significant in SAT scores controlling for other factors (Table 2). This means that the higher the rate of poverty in a state, the lower the rates of high school graduation and college continuation. However, when we control for high school graduation rates in the college continuation model, differences by poverty rates disappear, suggesting that the primary effects of poverty on college continuation are mediated through high school completion. When we examine differences between states, the results change. The state poverty rate was negatively associated with SAT scores and positively associated with college continuation in both DID analyses (Tables 3 and 4). A simple bivariate correlation shows that the relationship between poverty rates and college continuation is weak and negative. The positive relationship indicated in the analyses suggests that when other controls are considered, the relationship reverses and is significant. It is not surprising that changes in poverty rates within states would exert a negative effect on college continuation. The fact that, when comparing differences between states, poverty rates are positively related to college continuation is not easily explained. It may be that states with higher average rates of poverty provide more opportunities for students to attend college or keep college costs lower. This finding will require more research.
Education Policy Analysis Archives Vol. 20 No. 5 14
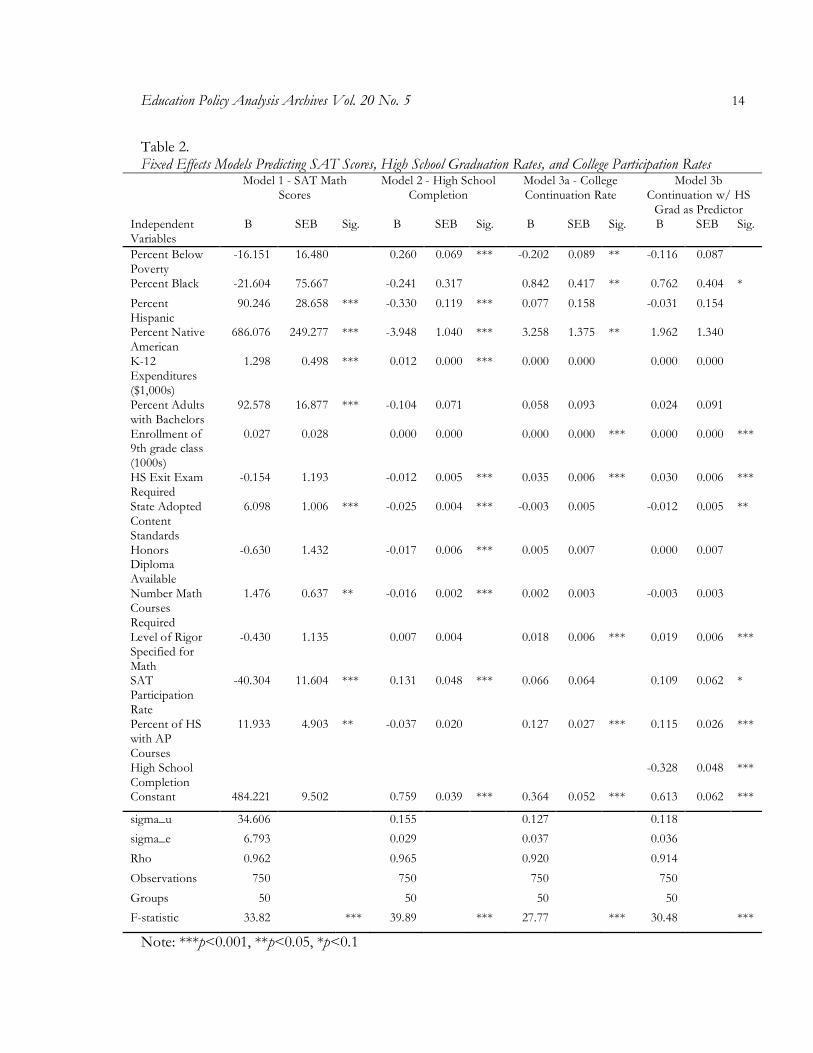
Table 2. Fixed Effects Models Predicting SAT Scores, High School Graduation Rates, and College Participation Rates
Model 1 - SAT Math Scores
Model 2 - High School Completion
Model 3a - College Continuation Rate
Model 3b Continuation w/ HS
Grad as Predictor Independent Variables
B SEB Sig. B SEB Sig. B SEB Sig. B SEB Sig.
Percent Below Poverty
-16.151 16.480 0.260 0.069 *** -0.202 0.089 ** -0.116 0.087
Percent Black -21.604 75.667 -0.241 0.317 0.842 0.417 ** 0.762 0.404 *
Percent Hispanic
90.246 28.658 *** -0.330 0.119 *** 0.077 0.158 -0.031 0.154
Percent Native American
686.076 249.277 *** -3.948 1.040 *** 3.258 1.375 ** 1.962 1.340
K-12 Expenditures ($1,000s)
1.298 0.498 *** 0.012 0.000 *** 0.000 0.000 0.000 0.000
Percent Adults with Bachelors
92.578 16.877 *** -0.104 0.071 0.058 0.093 0.024 0.091
Enrollment of 9th grade class (1000s)
0.027 0.028 0.000 0.000 0.000 0.000 *** 0.000 0.000 ***
HS Exit Exam Required
-0.154 1.193 -0.012 0.005 *** 0.035 0.006 *** 0.030 0.006 ***
State Adopted Content Standards
6.098 1.006 *** -0.025 0.004 *** -0.003 0.005 -0.012 0.005 **
Honors Diploma Available
-0.630 1.432 -0.017 0.006 *** 0.005 0.007 0.000 0.007
Number Math Courses Required
1.476 0.637 ** -0.016 0.002 *** 0.002 0.003 -0.003 0.003
Level of Rigor Specified for Math
-0.430 1.135 0.007 0.004 0.018 0.006 *** 0.019 0.006 ***
SAT Participation Rate
-40.304 11.604 *** 0.131 0.048 *** 0.066 0.064 0.109 0.062 *
Percent of HS with AP Courses
11.933 4.903 ** -0.037 0.020 0.127 0.027 *** 0.115 0.026 ***
High School Completion
-0.328 0.048 ***
Constant 484.221 9.502 0.759 0.039 *** 0.364 0.052 *** 0.613 0.062 ***
sigma_u 34.606 0.155 0.127 0.118
sigma_e 6.793 0.029 0.037 0.036
Rho 0.962 0.965 0.920 0.914
Observations 750 750 750 750
Groups 50 50 50 50
F-statistic 33.82 *** 39.89 *** 27.77 *** 30.48 ***
Note: ***p<0.001, **p<0.05, *p<0.1

Examining the Constrained Curriculum Hypothesis 15
Table 3. Difference in Differences Estimation of the Effects of Course Requirement Policies on SAT Math, High School Graduation, and College Participation SAT Math H. S. Completion College Continuation
B SEB Sig. B SEB Sig. B SEB Sig. African American (%) -29.496 6.229 *** -.541 .028 *** .029 .025 Hispanic (%) -61.894 6.916 *** -.386 .032 *** -.071 .028 *** Native American (%) -67.718 18.374 *** -.566 .084 *** -.297 .073 *** Below Poverty (%) -39.065 17.599 * .005 .080 .236 .070 *** Bachelor Attainment (%) 250.961 11.857 *** .330 .054 *** .208 .047 *** Total Student Population .000 .000 *** .000 .000 *** .000 .000 K12 Expenditures per FTE .002 .000 *** .000 .000 * .000 .000 *** Rate of SAT Participation (%) -129.828 2.242 *** Mandatory Exit Exam 2.615 1.299 * .003 .006 .021 .005 *** Honors Degree Option -.951 1.028 -.042 .005 *** -.002 .004 Schools Offering AP (%) -9.218 3.311 *** -.070 .013 *** -.021 .011 ~ Algebra I (treatment group) -1.639 1.367 -.005 .006 -.010 .005 ~ Year of Policy Adoption .483 1.250 -.007 .006 -.002 .005 * DID Estimator (Course Req.) 1.843 1.771 -.009 .008 .016 .007 * High School Completion .061 .028 * (Constant) 516.094 4.436 *** .760 .020 *** .466 .017 *** R2 0.868 0.597 0.133 F-test 448.390 *** 109.24 *** 11.52 ***
Note: ***p<0.001, **p<0.01, *p<0.05, ~p<0.10 Table 4. Difference in Differences Estimation of the Effects of Mandatory Exit Exam Policies on SAT Math, High School Graduation, and College Participation SAT Math H. S. Completion College Continuation
B SEB Sig. B SEB Sig. B SEB Sig. African American (%) -32.309 6.667 *** -.572 .030 *** .047 .027 ~ Hispanic (%) -63.893 6.911 *** -.397 .032 *** -.061 .028 * Native American (%) -61.730 19.279 *** -.596 .088 *** -.225 .077 *** Below Poverty (%) -46.661 16.719 * .011 .076 .188 .067 *** Bachelor Attainment (%) 250.778 11.487 *** .293 .052 *** .188 .046 *** Total Student Population .000 .000 *** .000 .000 *** .000 .000 K12 Expenditures per FTE .002 .000 *** .000 .000 * .000 .000 *** Rate of SAT Participation (%) -128.838 2.284 *** No. Math Courses Required .391 .527 -.002 .002 -.005 .002 * Algebra or Above Required 1.217 1.339 -.018 .006 * .013 .005 * Honors Degree Option -.805 1.040 -.043 .005 *** .000 .004 Schools Offering AP (%) -10.561 3.324 *** -.074 .013 *** -.015 .012 States adopting Mandatory Exam -.231 1.231 .016 .006 *** -.006 .005 Year of Policy Adoption 3.997 1.249 *** .017 .006 *** .002 .005 DID Estimator (Exit Exam) -.533 1.702 -.015 .008 * .020 .007 *** High School Completion .062 .028 * (Constant) 516.503 4.455 *** .761 .020 *** .478 .017 *** R2 0.87 0.602 0.133 F-test 423.810 *** 103.64 *** 11.11 ***
Note: ***p<0.001, **p<0.01, *p<0.05, ~p<0.10

Education Policy Analysis Archives Vol. 20 No. 5 16
The contrast between the two types of models illustrates differences in the roles of poverty and other economic factors when states are compared without controlling for state differences. In the fixed effects model, the poverty rate is negatively related to college continuation – when poverty increases fewer people can afford to pay for college. In contrast, the comparison of poverty rates across states provides an indicator of the relative rates of enrollment; however, one wonders about the role of correlations with diverse groups in this approach.1 Ethnic Diversity. The effects of racial and ethnic diversity differed across the two sets of analyses (Tables 3 and 4). The percentage of African Americans, Hispanics and Native Americans were positively associated with outcomes or not significant in the fixed effects models (Table 2), which means increases in the percentage of minorities within a state, possibly from immigration, were associated with improved outcomes. In contrast, in the DID analyses the percentages of these minority groups had a negative association with enrollment related outcomes (Tables 3 and 4), illustrating that in state comparisons, the percentage of minorities negatively corresponds to higher scores, graduation rates, and continuation rates.
States that attract minority immigrants from other states probably have better employment opportunities; a within-state increase in the percentage of minorities could be an indicator of short term gains in employment. This explanation is consistent with the findings on poverty above. Educational Attainment. The percentage of the population with college degrees was either positively associated with the enrollment-related outcomes or was not significant across all of the models for all of the outcomes. These findings were consistent whether looking at differences within states over time or between states, suggesting that all else being equal, educational outcomes increase as more adults in the state are college educated. This finding is consistent with research on educational, occupational and status attainment. Cohort Size. The size of student cohorts, the indicator controlling for the size of states, was either neutral or positively associated with outcomes across the models. It is feasible the larger states have greater capacity to support educational improvement by virtue of their size, a form of economies of scale within and across state systems. Educational Expenditures. Per pupil educational expenditures were positively associated with tests scores, high school graduation, and college enrollment rates in analyses using both methods. The only non-significant finding was for college continuation controlling for high school graduation rates in the fixed effects model (Table 2), meaning the effects of funding are mediated by high school graduation rates. These analyses demonstrate the importance of school funding, a finding contradictory to claims from early proponents of the standards movement (e.g. Finn, 1990).
Policy Variables
Both sets of analyses examine a range of policy variables related to constrained curriculum. We compare significant findings across the models below. Mandatory Exit Exams. In both the fixed effects (Table 2) and DID analysis (Table 4), mandatory exit exams did not affect SAT math scores. In the different fixed-effects models, in contrast, these exams
1 The variables included as controls in the DID analyses are treated somewhat like independent variables in the ordinary least squares regression analysis or in logistic regression without fixed effects. Controlling for the effects of states appears to make a substantial difference in building an understanding of the roles of poverty and race within states.
Examining the Constrained Curriculum Hypothesis 17
had a significant negative association with graduation rates and a significant positive association with both analyses of college continuation rates (Table 2). In the DID analysis of exits exams, the DID estimator for exams suggests a negative effect of the policy on high school graduation, but a significant positive effect on college continuation (Table 4), consistent with the fixed-effects model. The latter relationship held even after controlling for the high school graduation rate. However, the timing indicator in this model was positive, a finding discussed below in the comparison of models. Thus, the findings of the effects of policy implementation are similar across models, but there are differences relative to timing.
Before the mandatory exit exam policy went into effect, high school graduation rates were two percentage points (78% v. 76%) higher in policy adopting states (treatment group) than in the comparison group. After the policy was adopted, graduation rates declined in treatment states and improved slightly in control states – the average completion rates in both treatment and control states after the policy was approximately 77.5%. Neither policy alternative resulted in net gains in high school completion, but it appears mandatory exit exams serve as a barrier to high school completion. The positive effect of the policy on college continuation requires some interpretation. Treatment states had a slightly lower rate of college continuation before the policy went into place than control states, but after the policy, rates grew by more than two percentage points (from 47.2% to 49.4%) and actually exceeded the rates of non-adopting states by 1.4%. Part of this finding is the result of the definition of college continuation, which is determined, in part, by the percentage of high school graduates the previous year. However, even after controlling for state high school graduation rates, the difference persisted. The only plausible mechanism by which this might occur is that the test increases the academic expectations for students, which leads to better preparation for college. More work is needed examine this relationship more fully. State Math Standards. In the fixed-effects regression, the adoption of state math standards was positively associated with state test scores, negatively associated with high school graduation rates, not significant for college continuation, and negative for college continuation when high school graduation rate was also considered (Table 2). State standards were not considered in the DID models because there has been no variation on this measure in the past decade; by 2000, all fifty states had adopted NCTM standards according to the CCSSO. Honors Diplomas. The honors diploma option was significant and negatively associated with high school graduation rates, but was not significant for the other outcomes in all three sets of analyses (Tables 2, 3 & 4). This could be an indicator that targeting resources within schools on a specialized group does not work well. Interestingly, the honors diploma differentiates students at the very same time that graduation requirements are attempting to homogenize the curriculum. Percentage of Schools Offering AP. The percentage of schools offering AP courses was significant and negatively associated with test scores and high school graduation rates in the two sets of DID analyses (Table 3 & 4). This could be attributable to the costs of concentrating resources on high achieving groups. In contrast, the percentage of schools with AP was positively associated with SAT scores and college continuation rates in the fixed effects analyses (Table 2). It appears that expanding access to AP within a state has a positive effect on SAT math scores and college continuation, but when comparing between states, greater emphasis on AP does not confer the same benefits and is actually related to lower SAT math scores and high school completion rates. This may be the consequence of recent efforts to expand AP participation through financial incentive programs for students and teachers. This model has been promoted through the National

Education Policy Analysis Archives Vol. 20 No. 5 18
Math and Science Initiative (NMSI) sponsored by Exxon Mobil, and has been particularly popular in Southern states. More analysis is required to understand this conflicting finding. Rigor of Math Courses Required for Graduation. Requiring a higher level math course (e.g. Algebra, Geometry, Algebra II) was positively associated with college continuation rates in the fixed effects model (Table 2), but not the other two outcomes. There are some contradictory findings that require consideration. While the DID analysis suggests a positive effect on college continuation, when rigor is included as a control in the exit exam DID model, a negative effect on high school graduation was found. The only difference between the two models is that we are not able to account for the number of courses required by the policy in the DID analysis. Perhaps the omission of the number of courses required underestimates the effect of the policy on high school graduation. On average, non-adopting states experienced a slight decline in college continuation, which is what we expected in treatment states as well. However, the policy appears to exert a positive effect on college continuation with a difference of 4 percentage points between policy and non-policy adopting states. Contrasting Methods
The results above compare fixed-effects regression analyses with the use of DID estimators. The general findings were similar in the two sets of analyses. The direction of effect was the same for adoption of high school exit exam and different on one outcome (high school graduation) for the rigor of courses. In this case, the fixed-effects model indicated a positive association between rigor and graduation while the DID Estimator had a negative association. There were two major differences between the methods.
First, while the models only differed slightly with respect to findings on the significance and direction of effects, the DID models allowed us to consider the degree to which the policy has an effect over and above what would be expected over time. Second, while the difference in the significance of policy variables was not substantial, there were substantial differences in the significance of independent variables related to state context. The fixed-effects approach not only controls for state effects, but also provides insights into the ways demographic and economic factors influence educational outcomes. Specifically, the findings about poverty and diversity in the fixed-effects analysis illustrate that changes in poverty and diversity within states have different effects when you compare states. In combination, the two methods give us a clearer indication of the ways in which these two key policies may affect students’ opportunities to prepare for and participate in college.
Conclusions
This study compared two approaches to the use of state-level indicators in the analyses of the impact of state education policies. We reach the following conclusions.
First, the comparison of methods has some advantages over one single method in policy studies. While the findings on policy variables were similar for the DID and fixed-effects regression approaches, the differences in analyses were revealing with respect to interpretations of the role of diversity and poverty in relation to educational outcomes. Specifically, the fixed-effects approach that considered within-state effects better differentiated between the role of poverty and race. The analyses illustrated that increases in poverty within a state have a detrimental impact on educational outcomes, while increases in diversity have positive effects and may serve as an indicator of economic development (i.e. jobs causing immigration across states). In contrast, the comparative approach embedded in the DID analyses does not deal adequately with correlations between race

Examining the Constrained Curriculum Hypothesis 19
and poverty. States have histories in the treatment of diverse groups (e.g. segregation of schools) that are essentially controlled for in the fixed effects approach when states are coded as the fixed units, but not controlled for using DID.
Second, there was a difference across the two sets of analyses regarding the percentage of schools with AP courses: The effects were negative when treated as an independent variable in the DID models; the fixed-effects models indicated expanding access to AP within states improves outcomes, consistent with prior analyses using this method (St. John 2006). We suggest it is more appropriate to consider fixed effects with respect to changes in AP participation because, unlike the other policy changes, the percentage of schools offering AP courses changes slowly over time.
Third, there was some support for constraining the curriculum. Both types of policies (increased math requirements and exit exams) have grown in popularity, in large part as tools to improve postsecondary opportunities. It appears that while the policies may deter some students from completing high school, a greater proportion of those who do graduate go on to college right after high school. It was surprising to us that exit exam policies would have this sort of impact on college continuation, but to the extent that it represents an emphasis on the core academic courses, it may help better prepare students for college. The finding was consistent whether we considered within or between state variations. The fact that the course requirement policy exhibited mixed effects within states (negative on high school graduation and positive on college continuation) and modest but positive effects in the DID model is equally surprising because this has been a policy closely linked to and rationalized as a tool to increase access to college. It appears to have that effect on college continuation, but we would have expected the policy to increase SAT math scores as well. This finding is, however, consistent with Allensworth and colleague’s findings in Chicago (2009). The negative effects of both exit exams and course requirements on high school graduation should give policy makers pause. Even if graduation rates continue to recover and improve, the data at the very least suggest it takes a good deal of time for state systems to adapt to changes, which has implications for current students. Greater care needs to be taken to ensure that any potential long-term gains do not come at the expense of current students.
While both policies appear to exert a positive influence on college continuation, there is one important difference between the two. Mandatory exit exams exert a negative effect on high school completion rates where the rigorous math curriculum does not. On balance, our research supports the policy trend toward adding more specific levels of academic rigor to the state math requirements. We suggest the negative effect of rigor on high school completion in the fixed effects model is an indication that completion declined in the near term because the system had not prepared students adequately for the new standards. However, we suspect that as the system adjusts, completion rates will increase again in states with more rigorous math course requirements.
Finally, it is crucial to reconsider the role of school funding. It was evident that the amount of expenditures per student was positively associated with high school graduation rates, test scores, and college continuation. Increases and decreases in school funding within states had an impact on graduation rates and test scores (fixed effects analyses) and differences in funding across states had an impact on all three outcomes (DID analyses). This strongly counters the conservative, anti-tax reformist myth that funding does matter with respect to student outcomes. Greater attention to funding of education is indeed necessary to resolve the educational challenges facing the nation.
References
Allensworth, E., Nomi, T., Montgomery, N., & Lee, V. (2009). College Preparatory Curriculum for All: Academic Consequences of Requiring Algebra and English I for Ninth Graders in

Education Policy Analysis Archives Vol. 20 No. 5 20
Chicago. Educational Evaluation and Policy Anlaysis, 31(4), 367-391. Allison, P. (2009). Fixed Effects Regression models (Vol. 160). Thousand Oaks, CA: Sage Publications. Balfanz, R., Almeida, C., Steinberg, A., Santos, J., & Fox, J. H. (2009). Graduating America: Meeting the
Challenge of Low Graduation-Rate High Schools. Boston, MA: Jobs for the Future. Balfanz, R. & Byrnes, V. (2006). Closing the Mathematics Achievement Gaps in High Poverty:
Enablers and Constraints Journal of Education for Students Placed at Risk, 11(2), 143-159. Barton, P. E. (2005). The Elusive and Rising High School Dropout Rate. Princeton: Educational Testing
Service. Berkner, L. & Chavez, L. (1997). Access to postsecondary education for the 1992 high school graduates.
Washington, DC: U.S. Dept. of Education, Office of Educational Research and Improvement.
Cataldi, E. F., Laird, J., KewalRamani, A., & Chapman, C. (2009). High School Dropout and Completion Rates in the United States: 2007 (NCES 2009-064). Washington, DC: National Center for Education Statistics, Institute of Education Sciences, U.S. Department of Education.
Center on Education Policy. (2007). State high school exit exams: Working to raise test scores. Washington, DC: author.
Chaney, B., Burgdorf, K., & Atash, N. (1997). Influencing achievement through high school graduation requirements. Educational Evaluation and Policy Analysis, 19(3), 229-244.
Conklin, K. D. & Curran, B. K (2005). Action agenda for improving America’s high schools. Sponsored by Achieve, Inc., and the National Governors Association: www.achieve.org/achieve.nsf/ActionAgenda_Overview?Open Form.
Clune, W. H. & White, P. A. (1992). Education reform in the trenches: Increased academic course taking in high schools with lower achieving students in states with higher graduation requirements. Educational Evaluation and Policy Analysis, 14(1), 2-20.
Common Core State Standards Initiative. (2010). Common Core State Standards for Mathematics: National Governors Association
Council of Chief State School Officers. (2008). Key State Policies on PK-12 Education: 2008. Washington, DC.
Dynarski, S. (2000). Hope for whom? Financial aid for the middle class and its impact on college attendance. National Tax Journal, 53(3), 629-661.
Finn, C. E. (1990). The Biggest Reform of All. Phi Delta Kappan, 71(8), 584-592. Finn, J. D., Gerber, S. B., & Wang, M. C. (2002). Course Offerings, Course Requirements, and
Course Taking in Mathematics, Journal of Curriculum and Supervision (Vol. 17, pp. 336-366). check this one as well
Gonzales, P., Williams, T., Jocelyn, L., Roey, S., Kastberg, D., & Brenwald, S. (2009). Highlights from TIMMS: Mathematics and Science Achievement of U.S. Fourth- and Eighth-Grade Students in an International Context. Washington, DC: Institute of Education Sciences.
Heckman, J. J. & LaFontaine, P. A. (2010). The American High School Graduation Rate: Trends and Levels. Review of Economics and Statistics, 92(2), 244-262.
Heller, D. E. (2004). State Merit Scholarship Programs. In E. P. St. John (Ed.), Public Policy and College Access: Investigating the Federal and State Roles in Equalizing Postsecondary Opportunity (Vol. 19, pp. 29-64). New York: AMS Press, Inc.
Hoffer, T. B. (1997). High School Graduation Requirements: Effects on Dropping Out and Student Achievement. Teachers College Record, 98(Summer), 584-607.
Lee, V. E., Croninger, R. G., & Smith, J. B. (1997). Course-taking, equity, and mathematics learning: Testing the constrained curriculum hypothesis in U.S. secondary schools. Educational Evaluation and Policy Analysis, 19(2), 99-121.
Lillard, D. R. & DeCicca, P. P. (2001). Higher standards, more dropouts? Evidence within and

Examining the Constrained Curriculum Hypothesis 21
across time. Economics of Education Review, 20, 459-473. McLendon, M. K., Hearn, J. C., & Deaton, R. (2006). Called to account: Analyzing the origins and
spread of state performance-accountability policies for higher education. Educational Evaluation and Policy Analysis, 28(1), 1-24.
Mortenson, T. G. (2010, August). Chance for College by Age 19 by State 1986 to 2008. Postsecondary Education Opportunity. Retrieved May 17, 2010, from http://www.postsecondary.org/last12/218_810pg1_16.pdf.
National Center for Education Statistics. (2005). Table 154 - State requirements for high school graduation, in Carnegie units: 2004 Retrieved June 1, 2006, from http://www.nces.ed.gov/pubs2005/digest2005/
National Center for Education Statistics. (2010). Digest of Education Statistics, 2009. Retrieved October 11, 2010, from http://nces.ed.gov/pubs2010/2010013.pdf
National Commission on Excellence in Education. (1983). A nation at risk: Recommendations. Retrieved September 20, 2010, from http://www2.ed.gov/pubs/NatAtRisk/recomm.html
Pelavin, S. H. & Kane, M. B. (1990). Changing the odds: Factors increasing access to college. New York: College Board.
Perna, L. W. & Titus, M. (2004). Understanding difference in the choice of college attended: The role of state public policies. Review of Higher Education, 27(4), 501-525.
Powell, A. G., Farrar, E., & Cohen, D. K. (1985). The shopping mall high school: Winners and losers in the educational marketplace. Boston: Houghton Mifflin.
Schiller, K. S. & Muller, C. (2003). Raising the bar and equity? Effects of state high school graduation requirements and accountability policies on students' mathematics coursetaking. Educational Evaluation and Policy Analysis, 25(3), 299-318.
Sipple, J. W., Killeen, K., & Monk, D. H. (2004). Adoption and adaptation: School district responses to state imposed learning and graduation requirements. Educational Evaluation and Policy Analysis, 26(2), 143-168.
St. John, E. P. (2006). Education and the Public Interest: School Reform, Public Finance, and Access to Higher Education. New York: Springer.
St. John, E. P. & G. D. Musoba (2010). Pathways to academic success: Expanding opportunity for underrepresented students. New York: Routledge.
Swanson, C. B. (2004). The Real Truth about Low Graduation Rates, An Evidence-Based Commentary. Washington: The Urban Institute Education Policy Center.
Teitelbaum, P. (2003). The influence of high school graduation requirement policies in mathematics and science on student course-taking patterns and achievement. Educational Evaluation and Policy Analysis, 25(1), 31-57.
U.S. Department of Education (2006) A Test of Leadership: Changing the Future of U. S. Higher Education. Washington, DC: authors.
Vanneman, A., Hamilton, L., Baldwin Anderson, J., & Rahman, T. (2009). Achievement Gaps: How Black and White Students in Public Schools Perform in Mathematics and Reading on the National Assessment of Educational Progress. Washington, DC: National Center for Education Statistics.
Warren, J. R., & Halpern-Manners, A. (2007). Is the Glass Emptying or Filling Up? Reconciling Divergent Trends in High School Completion and Dropout. Educational Researcher, 36(6), 335-343.
Zhang, L. (2010). The Use of Panel Data Models in Higher Education Policy Studies. In J. Smart (Ed.), Higher Education: Handbook of Theory and Research (Vol. 25, pp. 307-350). New York: Springer.

Education Policy Analysis Archives Vol. 20 No. 5 22
About the Authors
Nathan Daun-Barnett University at Buffalo Email: [email protected] Nathan Daun-Barnett is an assistant professor of higher education administration at the University at Buffalo. His research examines the effects of state policies and local programs, and practices on students’ transitions from high school to college. Edward P. St. John University of Michigan Email: [email protected] Edward P. St. John is the Algo D. Henderson Collegiate Professor of Higher Education at the University of Michigan. His research focuses on topics related to inequality in educational opportunity.
education policy analysis archives Volume 20 Number 5 February 20, 2012 ISSN 1068-2341
Readers are free to copy, display, and distribute this article, as long as the work is attributed to the author(s) and Education Policy Analysis Archives, it is distributed for non-commercial purposes only, and no alteration or transformation is made in the work. More details of this Creative Commons license are available at http://creativecommons.org/licenses/by-nc-sa/3.0/. All other uses must be approved by the author(s) or EPAA. EPAA is published by the Mary Lou Fulton Institute and Graduate School of Education at Arizona State University Articles are indexed in CIRC (Clasificación Integrada de Revistas Científicas, Spain) DIALNET (Spain), Directory of Open Access Journals, EBSCO Education Research Complete, , ERIC, H.W. WILSON & Co, QUALIS A2 (Brazil), Redalyc, SCImago Journal Rank; SCOPUS, SOCOLAR (China)
Please contribute commentaries at http://epaa.info/wordpress/ and send errata notes to Gustavo E. Fischman [email protected]
Examining the Constrained Curriculum Hypothesis 23
education policy analysis archives editorial board
Editor Gustavo E. Fischman (Arizona State University) Associate Editors: David R. Garcia & Jeanne M. Powers (Arizona State University)
Jessica Allen University of Colorado, Boulder Christopher Lubienski University of Illinois,
Urbana-Champaign Gary Anderson New York University Sarah Lubienski University of Illinois, Urbana-
Champaign Michael W. Apple University of Wisconsin,
Madison Samuel R. Lucas University of California,
Berkeley Angela Arzubiaga Arizona State University Maria Martinez-Coslo University of Texas,
Arlington David C. Berliner Arizona State University William Mathis University of Colorado, Boulder Robert Bickel Marshall University Tristan McCowan Institute of Education, London Henry Braun Boston College Heinrich Mintrop University of California,
Berkeley Eric Camburn University of Wisconsin, Madison Michele S. Moses University of Colorado, Boulder Wendy C. Chi* University of Colorado, Boulder Julianne Moss University of Melbourne Casey Cobb University of Connecticut Sharon Nichols University of Texas, San Antonio Arnold Danzig Arizona State University Noga O'Connor University of Iowa Antonia Darder University of Illinois, Urbana-
Champaign João Paraskveva University of Massachusetts,
Dartmouth Linda Darling-Hammond Stanford University Laurence Parker University of Illinois, Urbana-
Champaign Chad d'Entremont Strategies for Children Susan L. Robertson Bristol University
John Diamond Harvard University John Rogers University of California, Los Angeles Tara Donahue Learning Point Associates A. G. Rud Purdue University Sherman Dorn University of South Florida Felicia C. Sanders The Pennsylvania State
University Christopher Joseph Frey Bowling Green State
University Janelle Scott University of California, Berkeley
Melissa Lynn Freeman* Adams State College Kimberly Scott Arizona State University Amy Garrett Dikkers University of Minnesota Dorothy Shipps Baruch College/CUNY Gene V Glass Arizona State University Maria Teresa Tatto Michigan State University Ronald Glass University of California, Santa Cruz Larisa Warhol University of Connecticut Harvey Goldstein Bristol University Cally Waite Social Science Research Council Jacob P. K. Gross Indiana University John Weathers University of Colorado, Colorado
Springs Eric M. Haas WestEd Kevin Welner University of Colorado, Boulder Kimberly Joy Howard* University of Southern
California Ed Wiley University of Colorado, Boulder
Aimee Howley Ohio University Terrence G. Wiley Arizona State University Craig Howley Ohio University John Willinsky Stanford University Steve Klees University of Maryland Kyo Yamashiro University of California, Los Angeles
Jaekyung Lee SUNY Buffalo * Members of the New Scholars Board

Education Policy Analysis Archives Vol. 20 No. 5 24
archivos analíticos de políticas educativas consejo editorial
Editor: Gustavo E. Fischman (Arizona State University) Editores. Asociados Alejandro Canales (UNAM) y Jesús Romero Morante (Universidad de Cantabria)
Armando Alcántara Santuario Instituto de
Investigaciones sobre la Universidad y la Educación, UNAM México
Fanni Muñoz Pontificia Universidad Católica de Perú
Claudio Almonacid Universidad Metropolitana de Ciencias de la Educación, Chile
Imanol Ordorika Instituto de Investigaciones Economicas – UNAM, México
Pilar Arnaiz Sánchez Universidad de Murcia, España
Maria Cristina Parra Sandoval Universidad de Zulia, Venezuela
Xavier Besalú Costa Universitat de Girona, España Miguel A. Pereyra Universidad de Granada, España Jose Joaquin Brunner Universidad Diego Portales,
Chile Monica Pini Universidad Nacional de San Martín,
Argentina Damián Canales Sánchez Instituto Nacional para
la Evaluación de la Educación, México Paula Razquin UNESCO, Francia
María Caridad García Universidad Católica del Norte, Chile
Ignacio Rivas Flores Universidad de Málaga, España
Raimundo Cuesta Fernández IES Fray Luis de León, España
Daniel Schugurensky Universidad de Toronto-Ontario Institute of Studies in Education, Canadá
Marco Antonio Delgado Fuentes Universidad Iberoamericana, México
Orlando Pulido Chaves Universidad Pedagógica Nacional, Colombia
Inés Dussel FLACSO, Argentina José Gregorio Rodríguez Universidad Nacional de Colombia
Rafael Feito Alonso Universidad Complutense de Madrid, España
Miriam Rodríguez Vargas Universidad Autónoma de Tamaulipas, México
Pedro Flores Crespo Universidad Iberoamericana, México
Mario Rueda Beltrán Instituto de Investigaciones sobre la Universidad y la Educación, UNAM México
Verónica García Martínez Universidad Juárez Autónoma de Tabasco, México
José Luis San Fabián Maroto Universidad de Oviedo, España
Francisco F. García Pérez Universidad de Sevilla, España
Yengny Marisol Silva Laya Universidad Iberoamericana, México
Edna Luna Serrano Universidad Autónoma de Baja California, México
Aida Terrón Bañuelos Universidad de Oviedo, España
Alma Maldonado Departamento de Investigaciones Educativas, Centro de Investigación y de Estudios Avanzados, México
Jurjo Torres Santomé Universidad de la Coruña, España
Alejandro Márquez Jiménez Instituto de Investigaciones sobre la Universidad y la Educación, UNAM México
Antoni Verger Planells University of Amsterdam, Holanda
José Felipe Martínez Fernández University of California Los Angeles, USA
Mario Yapu Universidad Para la Investigación Estratégica, Bolivia

Examining the Constrained Curriculum Hypothesis 25
arquivos analíticos de políticas educativas conselho editorial
Editor: Gustavo E. Fischman (Arizona State University) Editores Associados: Rosa Maria Bueno Fisher e Luis A. Gandin
(Universidade Federal do Rio Grande do Sul)
Dalila Andrade de Oliveira Universidade Federal de
Minas Gerais, Brasil Jefferson Mainardes Universidade Estadual de
Ponta Grossa, Brasil Paulo Carrano Universidade Federal Fluminense,
Brasil Luciano Mendes de Faria Filho Universidade
Federal de Minas Gerais, Brasil Alicia Maria Catalano de Bonamino Pontificia
Universidade Católica-Rio, Brasil Lia Raquel Moreira Oliveira Universidade do
Minho, Portugal Fabiana de Amorim Marcello Universidade
Luterana do Brasil, Canoas, Brasil Belmira Oliveira Bueno Universidade de São Paulo,
Brasil Alexandre Fernandez Vaz Universidade Federal de
Santa Catarina, Brasil António Teodoro Universidade Lusófona, Portugal
Gaudêncio Frigotto Universidade do Estado do Rio de Janeiro, Brasil
Pia L. Wong California State University Sacramento, U.S.A
Alfredo M Gomes Universidade Federal de Pernambuco, Brasil
Sandra Regina Sales Universidade Federal Rural do Rio de Janeiro, Brasil
Petronilha Beatriz Gonçalves e Silva Universidade Federal de São Carlos, Brasil
Elba Siqueira Sá Barreto Fundação Carlos Chagas, Brasil
Nadja Herman Pontificia Universidade Católica –Rio Grande do Sul, Brasil
Manuela Terrasêca Universidade do Porto, Portugal
José Machado Pais Instituto de Ciências Sociais da Universidade de Lisboa, Portugal
Robert Verhine Universidade Federal da Bahia, Brasil
Wenceslao Machado de Oliveira Jr. Universidade Estadual de Campinas, Brasil
Antônio A. S. Zuin Universidade Federal de São Carlos, Brasil