consolidated financial statements - … · this annual report and consolidated financial statements...
TRANSCRIPT
CLN
Gro
up
gruppocln.com
ANN
UAL
REPO
RT 2
014
Corso Susa, 13/15 • 10040 Caselette (TO) • Italy
ANNUAL REPORT
CONSOLIDATED
FINANCIAL STATEMENTS
for the year ended 31 December 2014
Disclaimer
This Annual Report and Consolidated Financial Statements for the year ended 31 December 2014 have been translated into English solely for the convenience of the international reader. In the event of inconsistency or conflict between the terms used in the Italian version of the report and the English version, the Italian version shall prevail.
C.L.N. Coils Lamiere Nastri S.p.A.Corso Susa, 13/15 • 10040 Caselette (TO) • ItalyCapital € 235.000.000 i.v.R.E.A n. 400722 C.C.I.A.A. ToM TO 000538 • Registro ImpreseC.F. 00521230011VAT IT00521230011

CONTENTS
1BOARD OF DIRECTORS & AUDITORS
REPORT ON OPERATIONS
GROUP ACTIVITIES AND OPERATIONS
2014 HIGHLIGHTS
ECONOMIC AND FINANCIAL TRENDS
RE-DETERMINED STATEMENTS
MAIN RISKS AND UNCERTAINTIES
ENVIRONMENTAL AND SAFETY REVIEW
RESEARCH AND DEVELOPMENT ACTIVITIES
RELATED PARTIES TRANSACTIONS
SUBSEQUENT EVENTS
OUTLOOK ON 2015
10
14
16
18
23
24
28
30
31
33
34
2REPORT ON OPERATIONS
CONSOLIDATED STATEMENT OF FINANCIAL POSITION
CONSOLIDATED INCOME STATEMENT
36
40
3CONSOLIDATED FINANCIAL STATEMENTS
C.L.N. S.P.A. BOARD OF DIRECTORS & AUDITORS07
NOTES TO THE CONSOLIDATED FINANCIAL STATEMENTS FOR THE YEAR ENDED 31 DECEMBER 2014
CORE BUSINESS
FORM AND CONTENT OF THE CONSOLIDATED FINANCIAL STATEMENTS
ACCOUNTING POLICIES
NOTES TO THE CONSOLIDATED STATEMENT OF FINANCIAL POSITION AS AT 31 DECEMBER 2014
NON-CURRENT ASSETS
CURRENT ASSETS
PREPAID EXPENSES AND ACCRUED INCOME
SHAREHOLDERS’ EQUITY AND LIABILITIES
MEMORANDUM ACCOUNTS
NOTES TO THE CONSOLIDATED INCOME STATEMENT FOR 2014
PRODUCTION VALUE
PRODUCTION COSTS
FINANCE INCOME AND EXPENSES
ADJUSTMENTS TO FINANCIAL ASSETS
EXTRAORDINARY ITEMS
INCOME TAXES
AUDIT FEES
CONSOLIDATED CASH FLOW STATEMENT
SUBSIDIARIES – CONSOLIDATED ON A LINE BY LINE BASIS
ASSOCIATES – ACCOUNTED FOR USING THE EQUITY METHOD
OTHER COMPANIES
44
52
71
76
78
80
81
44
44
46
52
58
61
62
70
71
72
74
74
74
75
75
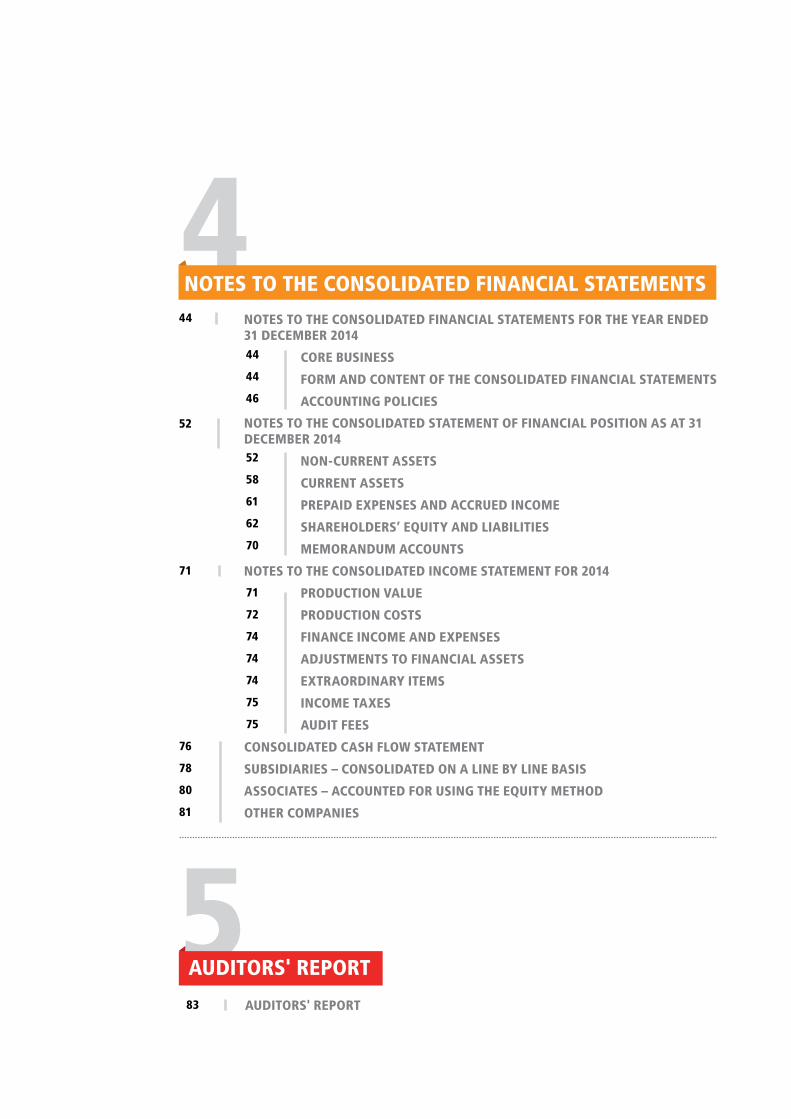
4NOTES TO THE CONSOLIDATED FINANCIAL STATEMENTS
AUDITORS' REPORT83
5AUDITORS' REPORT

6 I
CLn Group
1C.L.N. S.p.A. BOARD OF DIRECTORS & AUDITORS

ANNUAL REPORT 2014
Board of dIrectors I 7
BOARD OF DIRECTORS
Chairman
Aurora Magnetto
Managing Directors
Aurora Magnetto
Gabriele Perris Magnetto
Board Managers
Amulio Cipriani
Gianni Coda
Nishio Fumitaka
Vijay Goyal
Alain Marie Legrix de la Salle
Giulio Pampuro
Raffaella Perris Magnetto
Vincenzo Perris
Jurgen Gunter Schachler
BOARD OF AUDITORS
President
Colin Johnston
Acting Auditors
Vittorino Pizzoni
Giovanni Sala
Alternate Auditors
Alessandra Odorisio
Riccardo Ronchi
INDEPENDENT AUDITOR
PricewaterhouseCoopers S.p.A.
2REPORT ON OPERATIONS
10 I
CLn Group
REPORT ON OPERATIONSDear Shareholders,
2014 represented for the CLN Group a time of significant changes. Relevant transactions have occurred on the business perimeter at the end of which the Group is now, even more than in the past, oriented towards the automotive market and, within it, at OEM’s productions in Europe and South Africa. A new business model is being implemented, which provides the direct and exclusive management of the activities of the historical “Automotive” divisions MA and MW (to which the newly-established MFB division dedicated to fine blanking in Italy was added during the year) and the joint management with ArcelorMittal of the steel distribution business in Italy.
A key step in this regard was, in October, the definition of the binding terms for the creation of a joint venture (ArcelorMittal CLN Distribuzione Italia – “AMCLN”) that stands out as the market leader in steel distribution in Italy; the agreement provides for the transfer to AMCLN of the business concerning the Italian distribution centres owned by the Group that will be managed with those held in Italy by ArcelorMittal. The transaction involves the generation of significant synergies that the Group will achieve in accordance with the stake held in the JV (51%).
Looking at the macroeconomic scenario, 2014 was characterized by different performances in the major world economies. Standing out amongst all, the robust growth of the North Ameri-can economy, the basic stability of the Eurozone and the first signs of a slowdown in emerging countries and in particular in Brazil and Russia.
As a natural reflection of the macroeconomic scenario, the global automotive market has expe-rienced an overall growth of about 3% over the previous year, mainly driven by China (+ 8%) and the US (+ 6%); a downturn instead for Brazil (-7%) and Russia (-10%).
Moving on to the results of the Group, the financial year 2014 was not significantly affected by the mentioned operations on the business perimeter given that they were only partially implemented at year end. The economic results are therefore almost entirely attributable to the existing perimeter at the end of 2013. They show an Ebitda of € 107 million and a net loss of € 54 million, of which € 34 million attributable to non-operating items (mainly restruc-turing costs, losses from joint/non-controlled entities, foreign exchange losses). Despite the net loss incurred at the end of the year, financial debt was lower compared to the end of 2013.
Looking to the immediate future, the projections for 2015, confirmed by the results achieved in the first quarter of the year, expect a return to a break-even result. 2015 will also be strategic for the Group since, in addition to the startup of the new JV AMCLN, it will involve investments in growth projects mainly in Germany (Daimler) and Italy (FCA) that will represent the basis for sustained development in subsequent years.
THE MACROECONOMIC ENVIRONMENT
2014 was characterized by uneven and fragmented economic performance. The United States confirmed itself as the locomotive of global growth, while Europe has experienced difficulties in connecting with a concrete and lasting recovery. As for emerging markets, these have revealed the first signs of a slowdown, maintaining in any case attractive levels of growth.
rePort oN oPeratIoNs I 11
AnnuAl REPORT 2014
In general, as published by the International Monetary Fund, in 2014 the global GDP showed an increase of 3.3%, while forecasts for 2015 indicate a growth of 3.5%.
In 2014, the Eurozone recorded a GDP growth of 0.8% with a slight further improvement expected for 2015 (estimated growth of 1.2%). Within the European context, the Italian eco-nomy ended 2014 with a GDP contraction of 0.4% with forecasts of a return to growth in 2015 (+ 0.6%).
In the rest of the world the situation varies diversified.
According to the latest estimates (January 2015) of the IMF, in 2014 the United States GDP should have increased by 2.4% and in 2015 it is expected to grow by 3.6%.
In Japan, the latest IMF estimates indicate a stagnation of GDP in 2014 (+ 0.1%) and a slight growth in 2015 of 0.6%.
With reference to the BRICS countries, 2014 showed signs of a reduction of the growth rate compared to the previous years.
Particularly in China, GDP increased by 7.4%, the lowest level in the last 24 years; in Brazil growth estimates have suffered in recent months of constant downward revisions. The IMF has predicted a substantial break-even situation in the Brazilian GDP in 2014 and 0.3% in 2015. The 2014 annual growth of India and South Africa was rather in line with the previous year at 6% and 2% with forecasts of further improvement in 2015.
Russia deserves specific notice because of the severe devaluation of the ruble and the collapse in oil prices. The GDP in 2014 was basically unchanged from the previous year with forecasted contraction of around 4% for the year 2015.
AUTOMOTIVE MARKET
The automotive market saw encouraging signs in 2014 in terms of global sales. Over the past year 85 million new cars (with an increase of 3.5% over the previous year) were sold in the world and this trend seems to be confirmed for the first months of 2015.
In Europe in 2014 (EU 27 + EFTA) the Passengers Cars (“PSC”) market marked an increase in terms of registrations of 5.6% (13 million against 12.3 the previous year), giving an encouraging restart sign after a period of negative trend that began in 2007.
Signs of recovery have emerged in all of the most important countries of the continent, in particular in Germany (+ 2.9%) and in Italy (+ 4.2%); exceptionally positive instead the UK market (+ 9.3%) and Spain (+ 18.4%), while France remains substantially stable (+ 0.3%).
The increase in the market also reflects the performance of the main CLN Group customers that, over the previous year, recorded sharp increases in registrations: the Fiat Group (+ 3.5%) mainly due to the excellent performance of the Jeep brand, PSA (+ 3.7%), BMW (+ 4.9%) and Renault/Nissan (+ 13%).
12 I
CLn Group
As for the segment of Light Commercial Vehicles (“LCV”) in Europe (EU 27 + EFTA), in the year 2014 the registrations increased by 10.7% to 1,594,960 units.
Regarding the PSC segment, all the major countries have contributed positively to growth, in particular Spain (+ 33.2%), the UK (+ 18.7%), Italy (+16.4 %), Germany (+ 7.3%) and France (+ 1.5%).
With reference to the main non-European markets in which the Group operates:
• the Turkish automotive industry fell by 13.0% in 2014, confirming its down trend in recent years;
• the Russian market recorded a decrease of 11.9%, confirming a new negative trend that also characterized last year;
• in Brazil, the market was characterized by a decrease in registrations of 10.5%;
• India (sixth market in the world for volumes) returned to growth after a small setback of 2013 (+ 4.7%);
• China maintained an important and stable trend of growth in 2014, with an increase of 12.0% over the previous year.
STEEL MARKET
In 2014 the world steel production was worth 1.637 billion tons with an increase of approxima-tely 1.1% compared to 2013. Asian productions are of absolute importance representing appro-ximately 68% of the total world production and China stand alone representing about 50% of it.
In Italy domestic production has decreased compared to the previous year (-1.4%) while con-sumption recorded a reversal trend compared to the previous two years with a growth of about 4%. Such growth is characterized by different trends between the various months of the year and majorly concerning cold instead of hot rolled products.
In Italy, despite the increase in demand, the purchase prices of coils fell on average of about 40 €/t. This drop is mainly originated by the structure of the distribution in Italy with a level of overcapacity that could reduce the operating margins.
Even in this respect, the “AMCLN” project turns out to be strategic in order to ensure adequate margins to the business through the optimization of plant locations and fixed costs.
OPERATIONS ON THE CONSOLIDATION PERIMETER
As mentioned above, during the year, the Group completed certain extraordinary operations within the consolidation perimeter with relevant impacts on the current and future economic and financial situation. In particular:
• In June, C.L.N. S.p.A. acquired from Prorena Canessa all the shares in the GRB S.r.l. and changed its name into MFB S.r.l.; afterwards this latter purchased
rePort oN oPeratIoNs I 13
AnnuAl REPORT 2014
the productive branches of San Carlo (TO) and Val Greghentino (LC) of Algat Industries S.r.l. in bankruptcy giving life to a fine blanking centre which is in fact a new line of business for the Group.
• In October 2014, the investment in MA Automotive Brasil was diluted from 60 to 45% due to a share capital increase subscribed and paid by Simest in the Brazilian company. This change determined the exit of MA Automotive Brasil from the perimeter of companies consolidated by the Group on a line by line basis.
• As previously reported, in October 2014, CLN Group defined along with its partner ArcelorMittal the binding terms for the creation of a joint venture operating in the steel service centres market in Italy. C.L.N. S.p.A. contributes its operating branch together with the investments in Prorena Canessa Srl, in Delna SpA (through the contribution of its holding company Pro-Can S.r.l.) and Tamagnone Srl. The transaction was executed on 30 March, 2015 with effectiveness from 1 April 2015.
• In December 2014, the Group obtained control over ITLA Srl fulfilling the requi-rements for line by line consolidation.
Given the materiality of the impacts arising from such operations, this report provides disclosu-res on the main elements of inconsistency (mainly at the balance sheet level), by showing the comparison with the prior year financial statements. In addition, a Re-Determined Statement is reported prepared assuming that all such transactions were effective since January 1, 2014.
OUTLOOK ON 2015 RESULTS
With reference to the new perimeter outlined through the steps described in the previous pa-ragraph, the forecasts for 2015 show a growth in sales compared to 2014 (assuming the same perimeter) mainly driven by new orders for FCA in Italy and for Daimler in South Africa. In terms of Ebitda, the margin on sales is expected to be in line with 2014 at around 9%.
Due to the growth of profitability from operations and to a lower impact of non recurring items (mainly restructuring costs and forex), a break-even result is expected at year-end, representing a relevant improvement compared to 2014.
At the same time, despite the projected capex for growth projects in 2015, especially in Germany for the new plant in Bremen for Daimler and Italy for FCA, the financial debt is forecasted to remain stable compared to 2014, with an improved “leverage” driven by the Ebitda increase.
Furthermore, 2015 may represent for the Group a first consolidation of recovery and the starting point for a further growth in the medium term driven by investments made and by the newly awarded projects with start of production in 2016/2018.
In this direction, the results already achieved in the first quarter of 2015, above the budget ex-pectations, are encouraging.
14 I
CLn Group
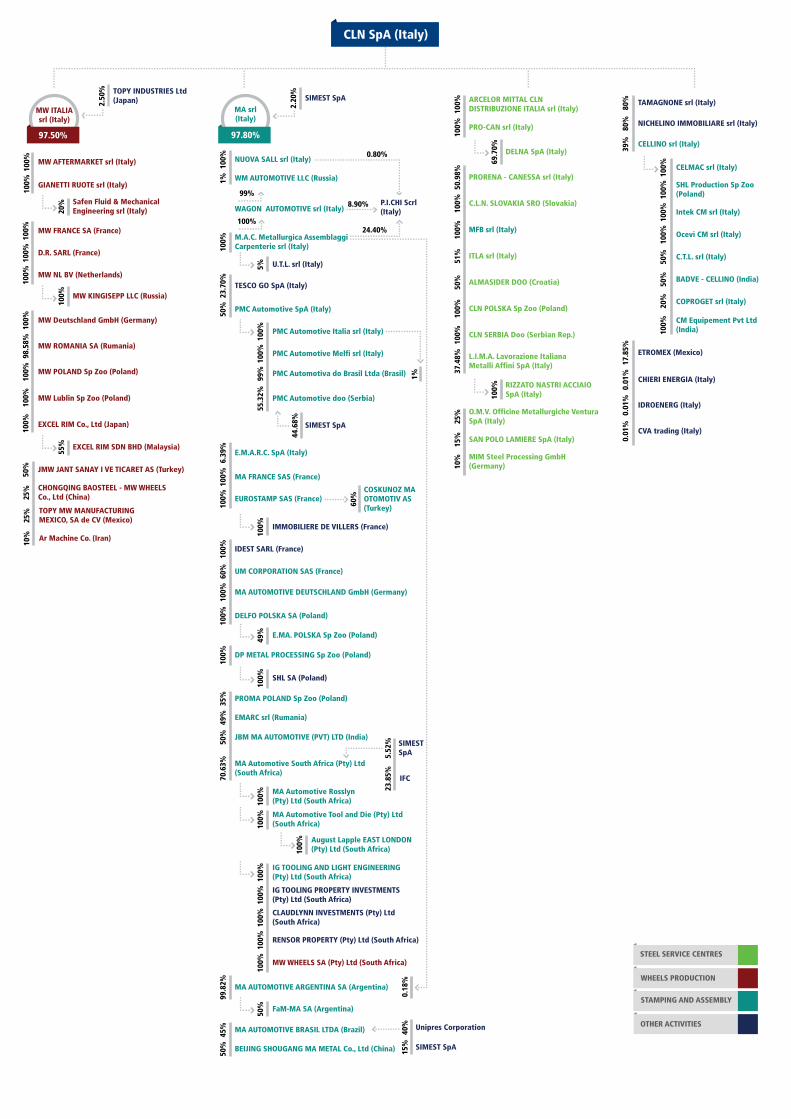
GROUP ACTIVITIES AND OPERATIONSThe CLN Group operates in four different business sectors organized into four different business units: steel service centres (SSC Division), steel wheel production for cars, motorcycles, commer-cial and industrial vehicles (MW/Wheels Division), production of stamped components for cars and commercial vehicles (MA/Automotive Division) and since 2014 Fine Blanking parts (MFB Division).
The following table illustrates the Group’s legal structure as at 31 December 2014.
100%
TOPY INDUSTRIES Ltd(Japan)
MW ITALIAsrl (Italy)
MW AFTERMARKET srl (Italy)
100%
GIANETTI RUOTE srl (Italy)
100%
MW FRANCE SA (France)
100%
D.R. SARL (France)
100%
Safen Fluid & Mechanical Engineering srl (Italy)20
%
MW KINGISEPP LLC (Russia)
100%
EXCEL RIM SDN BHD (Malaysia)
55%
MW NL BV (Netherlands)
100%
MW Deutschland GmbH (Germany)
100%
MW POLAND Sp Zoo (Poland)
100%
MW Lublin Sp Zoo (Poland)
100%
TOPY MW MANUFACTURING MEXICO, SA de CV (Mexico)25
%
Ar Machine Co. (Iran)
10%
EXCEL RIM Co., Ltd (Japan)
100%
MW ROMANIA SA (Rumania)
98.5
8%
JMW JANT SANAY I VE TICARET AS (Turkey)
50%
CHONGQING BAOSTEEL - MW WHEELS Co., Ltd (China)25
%
2.50
%
NICHELINO IMMOBILIARE srl (Italy)
80%
TAMAGNONE srl (Italy)
80%
CELLINO srl (Italy)
39%
ETROMEX (Mexico)
17.8
5%
CHIERI ENERGIA (Italy)
0.01
%
IDROENERG (Italy)
0.01
%
CVA trading (Italy)
0.01
%
CELMAC srl (Italy)
100%
SHL Production Sp Zoo (Poland)10
0%
Intek CM srl (Italy)
100%
Ocevi CM srl (Italy)
100%
CM Equipement Pvt Ltd (India)10
0%
C.T.L. srl (Italy)
50%
BADVE - CELLINO (India)
50%
COPROGET srl (Italy)20%
C.L.N. SLOVAKIA SRO (Slovakia)
ARCELOR MITTAL CLN DISTRIBUZIONE ITALIA srl (Italy)
PRO-CAN srl (Italy)
100%
100%
50.9
8% PRORENA - CANESSA srl (Italy)
100%
MFB srl (Italy)
100%
ITLA srl (Italy)
51%
ALMASIDER DOO (Croatia)
50%
CLN POLSKA Sp Zoo (Poland)
100%
CLN SERBIA Doo (Serbian Rep.)
100%
O.M.V. Officine Metallurgiche Ventura SpA (Italy)25
%
SAN POLO LAMIERE SpA (Italy)
15%
MIM Steel Processing GmbH(Germany)10
%
L.I.M.A. Lavorazione Italiana Metalli Affini SpA (Italy)
37.4
8%
DELNA SpA (Italy)
69.7
0%
RIZZATO NASTRI ACCIAIO SpA (Italy)10
0%
WHEELS PRODUCTION
OTHER ACTIVITIES
STAMPING AND ASSEMBLY
STEEL SERVICE CENTRES
EUROSTAMP SAS (France)COSKUNOZ MAOTOMOTIV AS(Turkey)
WAGON AUTOMOTIVE srl (Italy)P.I.CHI Scrl(Italy)
M.A.C. Metallurgica Assemblaggi Carpenterie srl (Italy)
TESCO GO SpA (Italy)
U.T.L. srl (Italy)
PMC Automotive SpA (Italy)
PMC Automotive Italia srl (Italy)
PMC Automotive Melfi srl (Italy)
PMC Automotiva do Brasil Ltda (Brasil)
PMC Automotive doo (Serbia)
E.M.A.R.C. SpA (Italy)
MA FRANCE SAS (France)
IMMOBILIERE DE VILLERS (France)
IDEST SARL (France)
UM CORPORATION SAS (France)
MA AUTOMOTIVE DEUTSCHLAND GmbH (Germany)
DELFO POLSKA SA (Poland)
E.MA. POLSKA Sp Zoo (Poland)
SHL SA (Poland)
DP METAL PROCESSING Sp Zoo (Poland)
MA Automotive South Africa (Pty) Ltd(South Africa)
MA Automotive Rosslyn (Pty) Ltd (South Africa)
August Lapple EAST LONDON (Pty) Ltd (South Africa)
MA AUTOMOTIVE ARGENTINA SA (Argentina)
MA AUTOMOTIVE BRASIL LTDA (Brazil)
BEIJING SHOUGANG MA METAL Co., Ltd (China)
FaM-MA SA (Argentina)
Unipres Corporation
SIMEST SpA
NUOVA SALL srl (Italy)
MA srl(Italy)
WM AUTOMOTIVE LLC (Russia)1%
99%
100%
6.39
%50
%23
.70%
100%
100%
100%
24.40%
0.80%
2.20
%
SIMEST SpA
8.90%
5%10
0%10
0%99
%
1%
55.3
2%
44.6
8%
100%
49%
100%
60%
SIMEST SpA
60%
100%
100%
100%
100%
70.6
3%99
.82%
45%
50%
PROMA POLAND Sp Zoo (Poland)
EMARC srl (Rumania)
JBM MA AUTOMOTIVE (PVT) LTD (India)
49%
35%
50%
5.52
% SIMEST SpA
23.8
5% IFC
100%
100% MA Automotive Tool and Die (Pty) Ltd
(South Africa)
IG TOOLING AND LIGHT ENGINEERING (Pty) Ltd (South Africa)10
0%
IG TOOLING PROPERTY INVESTMENTS (Pty) Ltd (South Africa)10
0%
CLAUDLYNN INVESTMENTS (Pty) Ltd (South Africa)10
0%
RENSOR PROPERTY (Pty) Ltd (South Africa)
100%
MW WHEELS SA (Pty) Ltd (South Africa)
100%
100%
50%
40%
0.18
%15
%
97.50% 97.80%
CLN SpA (Italy)
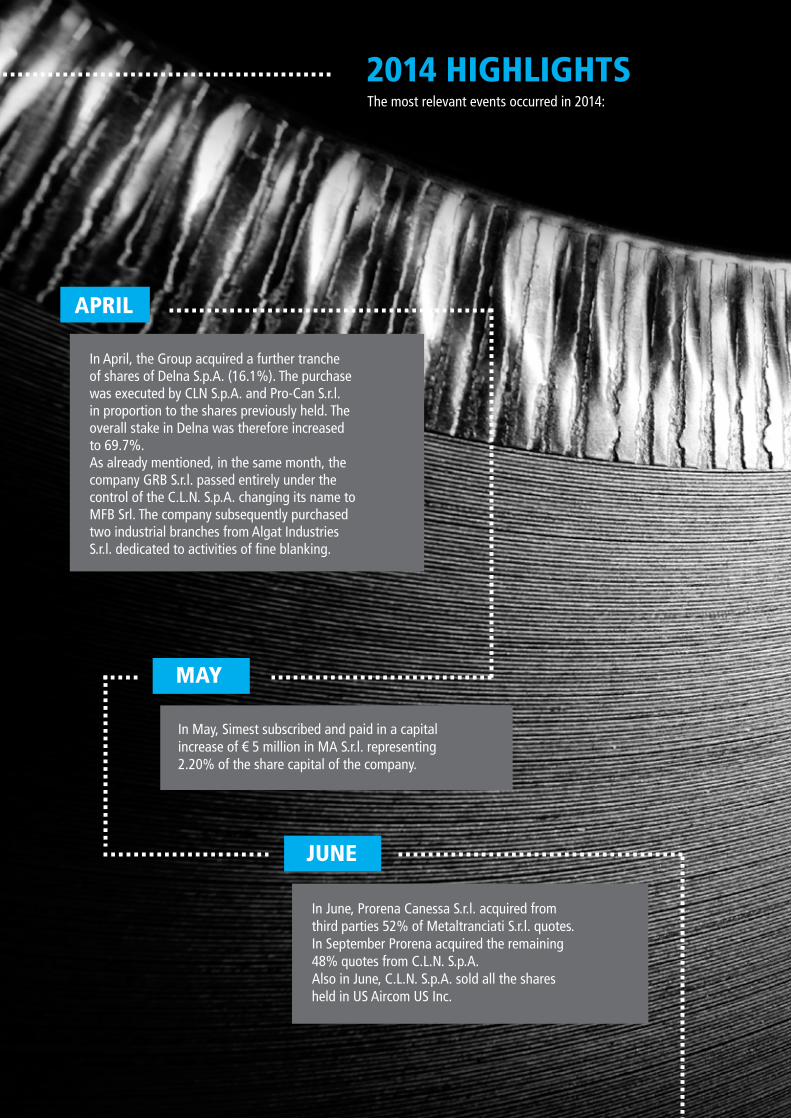
2014 HIGHLIGHTSThe most relevant events occurred in 2014:
In April, the Group acquired a further tranche of shares of Delna S.p.A. (16.1%). The purchase was executed by CLN S.p.A. and Pro-Can S.r.l. in proportion to the shares previously held. The overall stake in Delna was therefore increased to 69.7%.As already mentioned, in the same month, the company GRB S.r.l. passed entirely under the control of the C.L.N. S.p.A. changing its name to MFB Srl. The company subsequently purchased two industrial branches from Algat Industries S.r.l. dedicated to activities of fine blanking.
In June, Prorena Canessa S.r.l. acquired from third parties 52% of Metaltranciati S.r.l. quotes. In September Prorena acquired the remaining 48% quotes from C.L.N. S.p.A.Also in June, C.L.N. S.p.A. sold all the shares held in US Aircom US Inc.
In May, Simest subscribed and paid in a capital increase of € 5 million in MA S.r.l. representing 2.20% of the share capital of the company.
APRIL
JUNE
MAY
SEPTEMBER
OCTOBER
DECEMBER
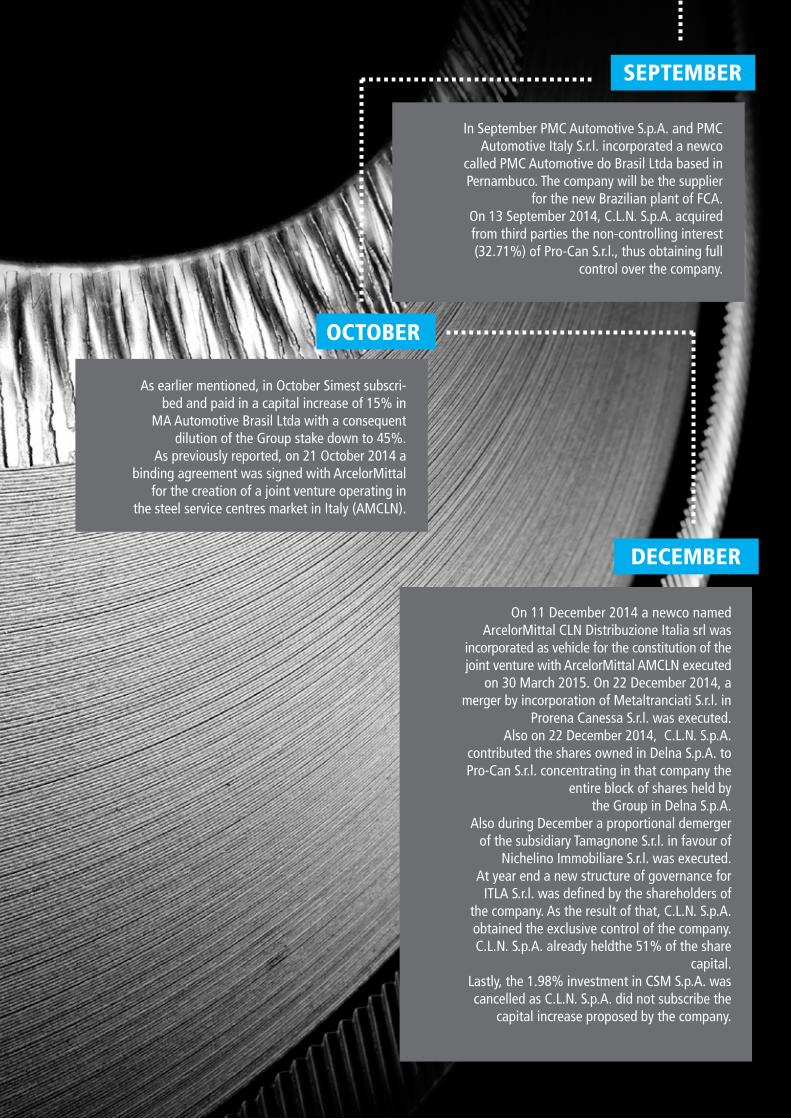
In September PMC Automotive S.p.A. and PMC Automotive Italy S.r.l. incorporated a newco
called PMC Automotive do Brasil Ltda based in Pernambuco. The company will be the supplier
for the new Brazilian plant of FCA.On 13 September 2014, C.L.N. S.p.A. acquired from third parties the non-controlling interest (32.71%) of Pro-Can S.r.l., thus obtaining full
control over the company.
As earlier mentioned, in October Simest subscri-bed and paid in a capital increase of 15% in
MA Automotive Brasil Ltda with a consequent dilution of the Group stake down to 45%.
As previously reported, on 21 October 2014 a binding agreement was signed with ArcelorMittal
for the creation of a joint venture operating in the steel service centres market in Italy (AMCLN).
On 11 December 2014 a newco named ArcelorMittal CLN Distribuzione Italia srl was
incorporated as vehicle for the constitution of the joint venture with ArcelorMittal AMCLN executed
on 30 March 2015. On 22 December 2014, a merger by incorporation of Metaltranciati S.r.l. in
Prorena Canessa S.r.l. was executed.Also on 22 December 2014, C.L.N. S.p.A.
contributed the shares owned in Delna S.p.A. to Pro-Can S.r.l. concentrating in that company the
entire block of shares held bythe Group in Delna S.p.A.
Also during December a proportional demerger of the subsidiary Tamagnone S.r.l. in favour of
Nichelino Immobiliare S.r.l. was executed.At year end a new structure of governance for
ITLA S.r.l. was defined by the shareholders of the company. As the result of that, C.L.N. S.p.A. obtained the exclusive control of the company. C.L.N. S.p.A. already heldthe 51% of the share
capital.Lastly, the 1.98% investment in CSM S.p.A. was cancelled as C.L.N. S.p.A. did not subscribe the
capital increase proposed by the company.

18 I
CLn Group
ECONOMIC AND FINANCIAL TRENDSCLN GROUP RECLASSIFIED INCOME STATEMENT
€/000 2014 2013 2012 2011
Sales Revenue 1,509,544 1,538,623 1,744,322 1,892,373
EBITDA 106,874 115,260 136,066 160,330
% sales revenue 7.1 7.5 7.8 8.5
EBIT 24,921 34,534 52,668 73,240
% sales revenue 1.7 2.2 3.0 3.9
Finance income/(expenses) (36,160) (34,847) (36,057) (32,892)
Foreign exchange gains/(losses) (4,702) (14,474) (6,937) 7,112
Result of equity investments (12,943) (6,911) (571) (769)
Extraordinary income/(expenses) (16,904) (16,690) (21,922) (7,778)
EBT (45,789) (38,388) (12,819) 38,913
% sales revenue -3.0 -2.5 -0.7 2.1
Tax charges (8,517) (3,246) (7,876) (21,794)
EAT (54,305) (41,634) (20,695) 17,119
% sales revenue -3.6 -2.7 -1.2 0.9
CLN GroupThe financial year 2014 ended with a turnover of € 1,510 million and an Ebidta of € 106.9 million. Both values are in contraction compared to the previous year. Contractions in sales and Ebitda are mainly attributable to the negative performance of the South American market partially offset by higher volumes in Europe and South Africa. In particular:
• South America (Brazil and Argentina): decrease in sales of € 62 million (of which € 9 million arising from change in scope) and a consequent reduction in Ebidta of € 11 million.
• Europe: revenue growth of € 24 million (with benefit of € 12 million arising from the new business MFB) and Ebitda increase of € 1 million.
• South Africa: sales growth of € 9 million providing approximately € 2 million of higher Ebitda.
In addition, the Group net result in 2014 was affected by the following main non-operating items:
• Results of equity investments (joint controlled and associated companies): € 13 million mainly attributable to PMC Group and MA Automotive Brasil (result of last three months of the year not consolidated line by line).
• Reorganization and restructuring costs: € 13 million incurred mainly in Argentina and Italy to facilitate the release of redundant staff.
• Forex: € 5 million primarily resulting from the significant depreciation of the Ruble against the Euro occurred in the last months of the year.
rePort oN oPeratIoNs I 19
AnnuAl REPORT 2014
SSC Division
€/000 2014 2013 Variation
Sales Revenue 387,672 397,338 (9,666)
EBITDA 5,856 7,425 (1,569)
% sales revenue 1.5 1.9
The steel service centres division suffered a fall compared to the previous year’s turnover of approximately € 10 million, mainly due to the decline in the average selling prices previously mentioned (volumes are in fact higher than the previous year). This decline negatively affects the marginality that is in fact lower than 2013 by approximately € 2 million.
Wheels Division
€/000 2014 2013 Variation
Sales Revenue 209,928 234,711 (24,783)
EBITDA 16,934 12,271 4,663
% sales revenue 8.1 5.2
A downturn also results for revenues of the Wheels Division compared to the previous year due to the reduction in volumes of wheels sold (12.2 million compared to 13.2 sold in 2013), mainly in Romania.
On the other hand, Ebitda is higher than the previous year, mainly reflecting the solved ineffi-ciencies generated in 2013 in France by the transfer of some productions from Italy.
Automotive Division
€/000 2014 2013 Variation
Sales Revenue 976,192 978,433 (2,241)
EBITDA 83,941 95,565 (11,624)
% sales revenue 8.6 9.8
In 2014 the Automotive Division was affected by the aforementioned decline in the South Ame-rican market (€ 62 million of lower sales and € 11 million of lower Ebitda compared to 2013 including impact from change in scope). In terms of turnover this reduction is substantially offset by the simultaneous growth in volumes in Europe and South Africa.
20 I
CLn Group
MFB Division
€/000 2014 2013 Variation
Sales Revenue 12,477 n/a 12,477
EBITDA 143 n/a 143
% sales revenue 0.1
The results of the newly incorporated MFB Division refer to the period from June to December 2014 and completely represent a change in scope compared to those of 2013.
RECLASSIFIED BALANCE SHEET
€/000 31.12.2014 31.12.2013 31.12.2012 31.12.2011
Net trade receivables 149,111 133,201 193,351 239,665
(Net trade payables) (404,711) (382,251) (324,091) (294,641)
Ending inventory 251,301 304,035 331,134 291,351
Other current assets /(liabilities) (85.506) (96,893) (69,670) (39,622)
NET WORKING CAPITAL (89,805) (41,908) 130,724 196,753
Net Property, plant and equipment 591,146 641,608 626,534 624,450
Net Intangible assets 37,216 34,047 25,665 15,311
Investments and other fin. fix. Assets 84,863 84,816 78,676 65,250
Provisions (54,424) (57,595) (55,718) (65,173)
Deferred tax assets / (liabilities) 10,102 7,750 (981) (5,823)
NET CAPITAL EMPLOYED 579,097 668,718 804,900 830,768
EQUITY 274,355 338,683 382,395 398,569
(Cash at bank and on hand) (97,544) (129,265) (71,077) (63,582)
(Investment securities) (22,990) (19,134) (19,204) (19,442)
(Marketable securities) (98) - (5,092) (3,965)
(Net receiv., fin. accr. and deferrals) (48,708) (23,374) (11,014) 3,497
Short-term financial payables 225,389 204,501 289,728 365,933
Long-term financial payables 248,693 297,308 239,164 149,758
NET FINANCIAL DEBT 304,742 330,036 422,505 432,199
NET CAPITAL INVESTED 579,097 668,718 804,900 830,768
At December 2014, the Group’s working capital decreased by € 48 million compared to the pre-vious year. This reduction stems, for € 24 million, from the reduced exposure on tooling projects due to the natural evolution of the order backlog occurred during the year and for € 12 million from a higher amount of outstanding trade receivables sold through factoring agreements wi-thout recourse (€ 231 million against € 219 million in 2013). The remaining element of reduction originates in actions to optimize working capital net of impacts from change in scope (€ 9 million of additional net assets).
rePort oN oPeratIoNs I 21
AnnuAl REPORT 2014
In terms of net capital invested, the decrease compared to the previous year (€ 90 million) is due, in addition to the aforementioned reduction in working capital, to impacts from change in scope estimated in approximately € 37 million (mainly MA Automotive Brasil).
The decrease of the total equity (approximately € 65 million), mainly arose from the loss for the year (€ 54 million). Representing additional element of reduction are negative differences from the conversion in Euro of the equity of the main subsidiaries outside Europe denominated in fo-reign currencies (€ 5 million), dividends paid during the year to non-controlling interests of some subsidiaries (€ 4 million) and change in scope (€ 2 million).
Net Financial Debt at year end is lower than 2013 by € 25 million. Such reduction was positively impacted by change in scope (€ 20 million).
MAIN ECONOMIC AND FINANCIAL INDICATORS
The main economic indicator for the CLN Group is Ebitda while the main financial indicator is the Net Financial Debt (as above represented in the Reclassified Balance Sheet and Income Sta-tement). Further key economic and financial indicators are reported as follows:
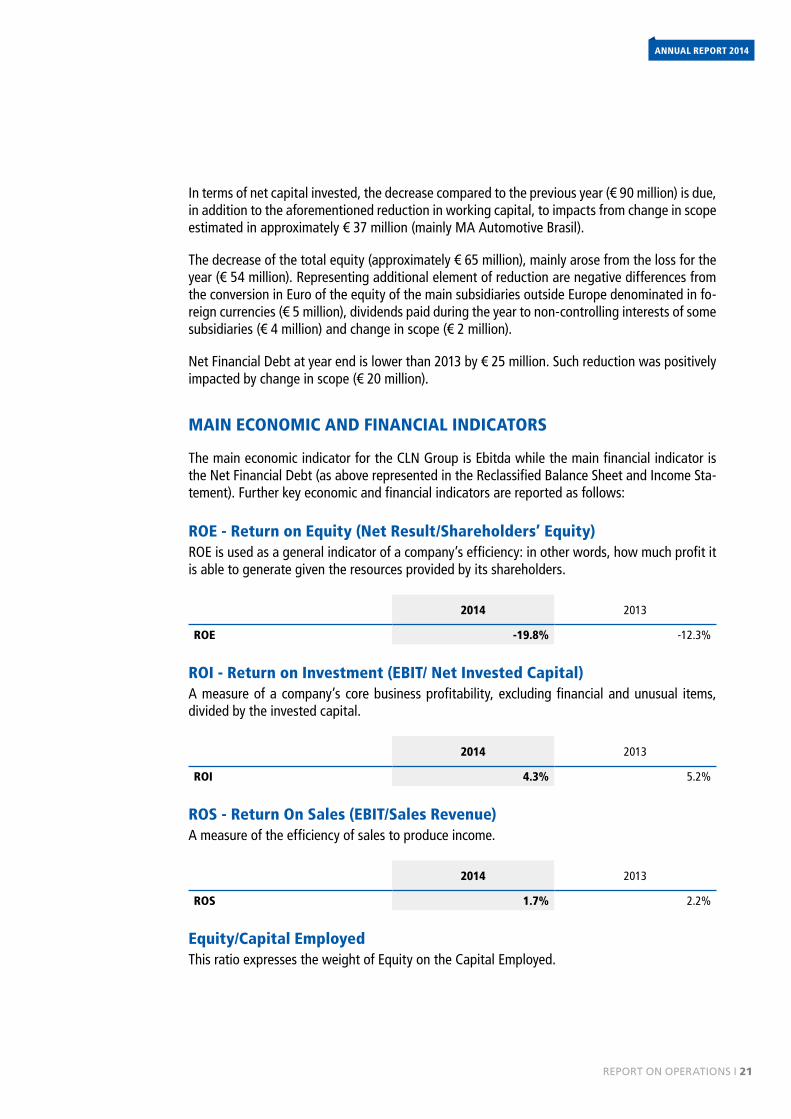
ROE - Return on Equity (Net Result/Shareholders’ Equity)ROE is used as a general indicator of a company’s efficiency: in other words, how much profit it is able to generate given the resources provided by its shareholders.
2014 2013
ROE -19.8% -12.3%
ROI - Return on Investment (EBIT/ Net Invested Capital)A measure of a company’s core business profitability, excluding financial and unusual items, divided by the invested capital.
2014 2013
ROI 4.3% 5.2%
ROS - Return On Sales (EBIT/Sales Revenue)A measure of the efficiency of sales to produce income.
2014 2013
ROS 1.7% 2.2%
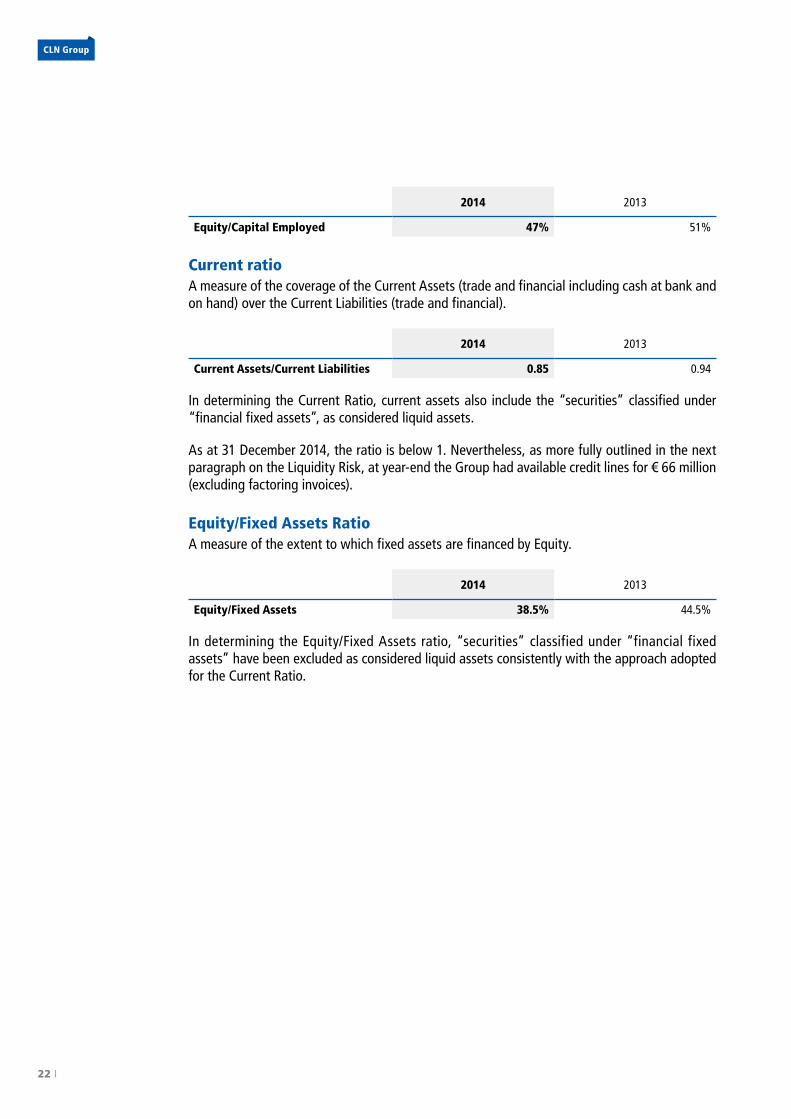
Equity/Capital Employed This ratio expresses the weight of Equity on the Capital Employed.
22 I
CLn Group
2014 2013
Equity/Capital Employed 47% 51%
Current ratioA measure of the coverage of the Current Assets (trade and financial including cash at bank and on hand) over the Current Liabilities (trade and financial).
2014 2013
Current Assets/Current Liabilities 0.85 0.94
In determining the Current Ratio, current assets also include the “securities” classified under “financial fixed assets”, as considered liquid assets.
As at 31 December 2014, the ratio is below 1. Nevertheless, as more fully outlined in the next paragraph on the Liquidity Risk, at year-end the Group had available credit lines for € 66 million (excluding factoring invoices).
Equity/Fixed Assets RatioA measure of the extent to which fixed assets are financed by Equity.
2014 2013
Equity/Fixed Assets 38.5% 44.5%
In determining the Equity/Fixed Assets ratio, “securities” classified under “financial fixed assets” have been excluded as considered liquid assets consistently with the approach adopted for the Current Ratio.
rePort oN oPeratIoNs I 23
AnnuAl REPORT 2014
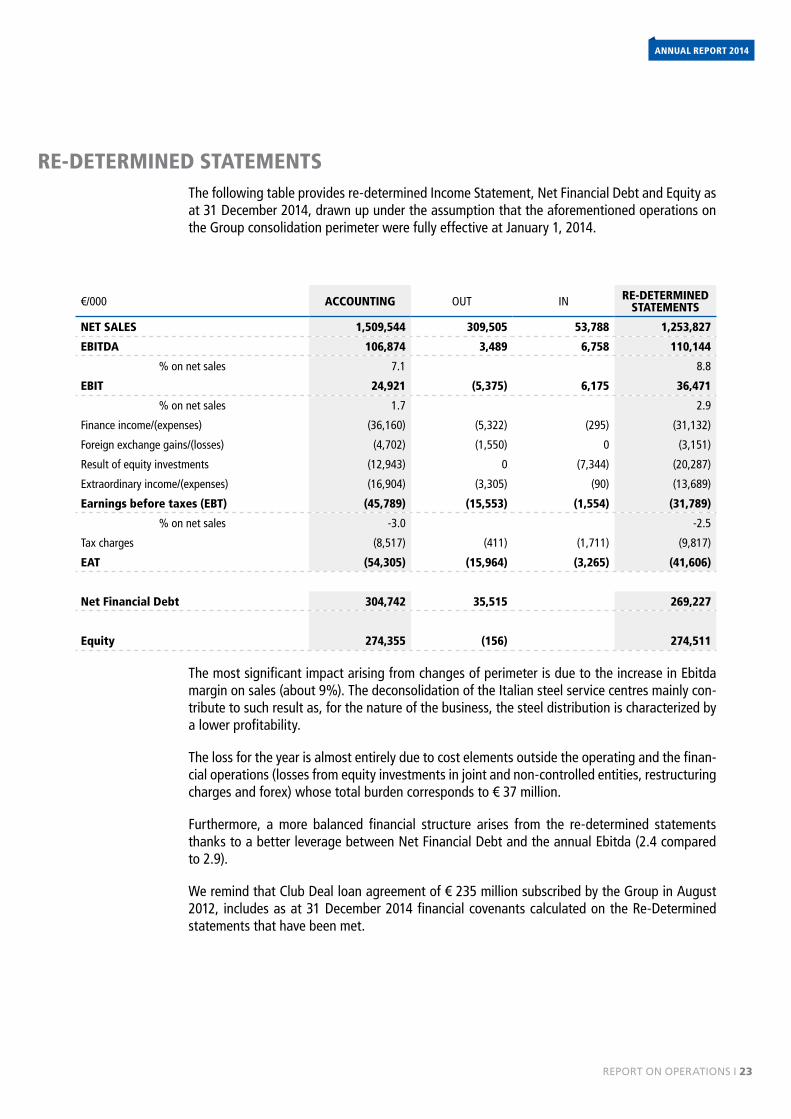
RE-DETERMINED STATEMENTSThe following table provides re-determined Income Statement, Net Financial Debt and Equity as at 31 December 2014, drawn up under the assumption that the aforementioned operations on the Group consolidation perimeter were fully effective at January 1, 2014.
€/000 ACCOUNTING OUT IN RE-DETERMINED STATEMENTS
NET SALES 1,509,544 309,505 53,788 1,253,827
EBITDA 106,874 3,489 6,758 110,144
% on net sales 7.1 8.8
EBIT 24,921 (5,375) 6,175 36,471
% on net sales 1.7 2.9
Finance income/(expenses) (36,160) (5,322) (295) (31,132)
Foreign exchange gains/(losses) (4,702) (1,550) 0 (3,151)
Result of equity investments (12,943) 0 (7,344) (20,287)
Extraordinary income/(expenses) (16,904) (3,305) (90) (13,689)
Earnings before taxes (EBT) (45,789) (15,553) (1,554) (31,789)
% on net sales -3.0 -2.5
Tax charges (8,517) (411) (1,711) (9,817)
EAT (54,305) (15,964) (3,265) (41,606)
Net Financial Debt 304,742 35,515 269,227
Equity 274,355 (156) 274,511
The most significant impact arising from changes of perimeter is due to the increase in Ebitda margin on sales (about 9%). The deconsolidation of the Italian steel service centres mainly con-tribute to such result as, for the nature of the business, the steel distribution is characterized by a lower profitability.
The loss for the year is almost entirely due to cost elements outside the operating and the finan-cial operations (losses from equity investments in joint and non-controlled entities, restructuring charges and forex) whose total burden corresponds to € 37 million.
Furthermore, a more balanced financial structure arises from the re-determined statements thanks to a better leverage between Net Financial Debt and the annual Ebitda (2.4 compared to 2.9).
We remind that Club Deal loan agreement of € 235 million subscribed by the Group in August 2012, includes as at 31 December 2014 financial covenants calculated on the Re-Determined statements that have been met.
24 I
CLn Group
MAIN RISKS AND UNCERTAINTIES FINANCIAL RISKS
The CLN Group is exposed to some financial risks arising from normal operational activities, which are constantly monitored in an effort to mitigate possible negative effects. These include:
• credit risks, both in relation to day-to-day commercial business with customers and funding provided to companies within the Group;
• liquidity risks, related in particular to the availability of financial resources and access to the credit market;
• currency risks, (mainly related to exchange and interest rates) as the Group operates internationally in various currency areas and is potentially exposed to fluctuations in exchange rates and relative interest rates.
Credit Risks The theoretical maximum risk of insolvency for receivables and other financial assets as at 31 December 2014 is represented by their year-end book value.
The CLN Group adopts creditworthiness policies designed towards monitoring the solvency of its customers, and enters into factoring transactions (sales of trade receivables) without re-course, thereby transferring the relative risk.
Receivables are subject to specific accruals to the bad debt provision if there is an effective risk of collection (total or partial). Based on past experience, provisions are sometimes prudentially accrued also to cover the generic insolvency risk.
Liquidity RiskThe principal factors influencing the liquidity of the CLN Group include the resources generated by or absorbed in operations, and the resources deployed in servicing debt and those invested toward strategy and production development. The levels of cash flows (actual and forecasted), credit lines and liquidity of the Group are constantly monitored by the Group through treasury reports. In particular, at year end liquidity (including the securities) amounted to € 120 million and the available financial credit lines amounted to € 66 million, whilst the lines available for invoice discounting with recourse amounted to € 138 million.
Currency Risks The CLN Group is subject to foreign currency risk due to exchange rate fluctuations affecting international transaction costs, revenues and funding, including the conversion of the financial statements of consolidated companies located outside the Euro Zone.
These fluctuations can affect the Group’s net profit (loss) and equity.
In 2014, the principal exchange rates to which the CLN Group was exposed were the following:
- EUR/Zloty
- EUR/Rublo
- EUR/Pesos Argentino
rePort oN oPeratIoNs I 25
AnnuAl REPORT 2014
- EUR/Real
- EUR/Leu
- EUR/Rand
Interest Rate RisksThe CLN Group regularly performs factoring transactions (sales of trade receivables) with or wi-thout recourse and uses other forms of funding, whether short-term (hot money, and advances on import/export) or medium to long-term usually at variable rates of interest. Therefore chan-ges in market interest rates can affect the level of net financial charges.
The Group in order to hedge such a risk has subscribed interest rate swap contracts in connec-tion with the most important medium long term loan agreements.
BUSINESS RISKS
The CLN Group is exposed to some risks of the sectors in which it operates including:
Risks associated with steel pricesThe steel prices are sharply affected by “global” market dynamics (carbon and iron costs and steel demand from emerging markets, particularly Asia). In the Wheels and Automotive Divi-sions, price variations in raw materials are normally directly transferred to final customers. The SSC Division is instead particularly influenced by local market situations; in particular, a sudden and significant rise in raw material (coils) prices may expose the SSC Division to the risk of not being able to recover such costs from final customers. Over the last three years, the market in which the SSC Division operates has been (and will be) structurally characterized by a volatile price market with rapid and violent repeated oscillations throughout the year. These micro-cycles lead to increased speculation in purchase decision-taking (formation of demand), whether in terms of distribution or final users, active primarily in the “general industry” segment, and hence increase the risk associated with our business activities.
Automotive Market Trend RisksGroup performance is significantly affected by the automotive market and in particular those in Europe, South America and South Africa. These markets are highly competitive in terms of pro-duct quality, innovation and, especially in recent years, price. Furthermore, due to the shrinking demand for new cars, major carmakers worldwide are struggling with production overcapacity. It is well known that the car industry suffers far more than other market segments from risk factors and market uncertainties such as GDP upturns or downturns, corporate and/or consumer confidence and consumer credit interest rates, all of which constantly affect the demand for durable goods. The Automotive market is also notoriously cyclic, though it is always difficult to predict extent and duration. The current economic weakness of the countries in the Euro zone, including Italy, is generating uncertainties regarding the possible evolution of business activities in general, not only in the car industry. Though many governments, the EU, monetary authori-ties and private corporations have endeavoured to provide financial support to EU member in difficulty and helped to offset default by a number of European countries, reserves regarding the burden of debt carried by certain Euro zone countries and their capacity to honour future
26 I
CLn Group
financial commitments are obtained.
Furthermore, global uncertainties regarding European finances have resulted in worsening inte-rest rates on loans to businesses and general shrinking of available credit.
Developments in this direction could have a negative impact on the Group’s activities and ope-rations.
The CLN Group endeavours to take measures, where possible, to offset these risks by broa-dening its customer base and heightening geographical diversification. Business initiatives set forth by carmakers are closely followed and the range of products and processes within the Group are in constant evolution. So, past initiatives, undertaken by the Group in South Africa, India, Russia and more recently in Serbia, Turkey and China, should have been framed.
Risks associated with sales in international marketsA significant portion of the Group’s production activities are conducted and located outside of Italy and the Group expects that revenues from sales outside Italy will account for a continually increasing portion of its total revenues in the foreseeable future. All of this exposes the Group to risks inherent to operating globally, including those related to exposure to local economic and political conditions, import and/or export restrictions, and multiple tax regimes.
Risks associated with market footprint in emerging economiesThe Group operates across a broad spectrum of emerging economies, whether directly (Ar-gentina, South Africa and Russia) or through Joint Venture agreements or other cooperation agreements (Brazil, Turkey, India, Serbia and China). The Group’s exposure to the economic trends in these countries has heightened in recent years. Unfavourable economic or political developments in any one of these areas (which may vary from country to country) could have a material adverse effect on the Group’s activities and future prospects, as well as its earnings and financial position.
Many of our main OEM customers have established globalization policies in the past and intend to continue in the future aimed at reaching emerging markets. In each case, our Group has follo-wed our customers’ initiatives. Our customers’ capacity to reach their objectives and their level of success is a prime factor influencing the profitability of our subsequent initiatives.
Risks associated with Joint Venture AgreementsThe Group currently pursues a policy designed toward seeking out alliance and Joint Ventu-re opportunities aimed at achieving objectives including vertical integration, customer loyalty and business expansion, capital deployment optimization and risk mitigation, particularly when entering emerging economies. Joint Venture agreements are often effected through majority, par-venture and even minority acquisitions.
Multiple factors affect the outcome of Joint Venture agreements such as relationships with re-spective partners, a shared vision of future strategies to be pursued, technical and/or financial difficulties and possible problems with local laws and regulations.
As previously reported, in addition to the existing main alliances with Unipres in France and
rePort oN oPeratIoNs I 27
AnnuAl REPORT 2014
Brazil, Coskunoz and Jantsa in Turkey, JBM in India, since April 1, 2015 the Italian steel service centres have been jointly managed with ArcelorMittal inside the new JV AMCLN.
Competition Risks The automotive supply market of both wheels and moulded components is highly competitive. The CLN Group is obliged to compete with numerous other suppliers of wheels and components of various entities. Some of these hold a more dominant position in certain areas than ours while others are having to undergo drastic restructuring and reorganization. New suppliers are also appearing from emerging markets that could further increase levels of competition.
Risks regarding OEM Outsourcing Policies The automotive components supply market, regarding both wheels and steel stamped parts, is strongly affected by OEM outsourcing policies. Multiple factors influence decisions including: internal production capacity, perception of strategic relevance of certain components, finan-cial resources, production costs, quality, delivery times and expertise. These choices/strategies adopted by OEMs determine the size of current/potential markets for all those operating in the automotive components sector.

28 I
CLn Group
ENVIRONMENTAL AND SAFETY REVIEWThe Group conducts its business in compliance with current regulations regarding the protection of the environment with respect to the areas of origin. In particular, it is emphasized that the work carried out, both for the treated materials and for energy consumption and waste, can be considered environmentally friendly.
Considering the REACH Regulation, based on the European Regulation EC No. 1907/2006 (in-troduction of a system of registration, evaluation and authorization of chemicals circulating on the territory of the European Union), the Group has continued - even in year 2014 - to monitor the evolution of the legislation. In particular, it has continued to monitor the Candidate List (list issued by ECHA about banned substances) in order that the substances contained in the list are not presented neither in the products manufactured nor in those purchased by Group compa-nies.
As for the aspects of Health and Safety at Work during 2014, work and training related to the Safety Project launched in 2009 continued, with the extension of the same to other companies of the Group recently acquired (both controlled and subsidiaries) in order to create a homo-geneity of objectives and methodology on the health and safety topic at work to improve the performance of each division of the Group.
The mentioned project has the primary purpose to:
• Ensure the protection of health and the prevention of risks in accordance with local regulations.
• Identify appropriate measures of prevention and protection in order to minimize the accident events.
• Provide company management with an efficient and effective management system that enables a permanent activity of identification and management of emerging problems and the orderly flow of information to support decision-making and operational responsibilities properly.
• Increase the involvement, motivation and staff awareness.
• Increase efficiency and performance to continuous improvement.
• Contribute to improve levels of health and safety at work.
• Improve their internal and external image, so as to have a higher reliability towards customers, suppliers and institutions/authorities.
• Progressively reduce the costs of health and safety at work.
In addition, the safety policy adopted and disclosed among the CLN Group companies states that the protection of occupational health and safety (including the Industrial Security) must be considered a priority and a clear responsibility of the entire corporate hierarchy and an ongoing commitment to apply in all activities. The objective of the CLN Group aims at reducing and pre-venting accidents and occupational diseases.
These principles are put into effect through the identification of annual targets of reduction - constant and gradual - of accidents and related indexes of less than 30% over the previous year up to the ultimate goal of zero accidents.
rePort oN oPeratIoNs I 29
AnnuAl REPORT 2014
In this regard, we point out that in 2014 the Frequency Index of certain plants in the Group decreased compared to the previous year, while in others, especially the Italian ones, have esta-blished the goal of zero accidents.
The commitment of the CLN Group Management to achieve and maintain results also involves continuous improvement and continuous identification of new instruments to be adopted and applied.
With a view to continuous improvement, we point out that in 2014 the parent company (C.L.N. S.p.A.) - certified OSHAS 18001 - passed the surveillance audit of the Certifier DEKRA.
The consolidation of the good results in this field should not represent a point of arrival but of departure. In fact, it will be necessary to continue to work on the behavioural aspect that is now the most significant added value in addressing the issue safety and health in the various plants. In fact, the involvement of employees and, in particular, safety officers (link between the company management and workers), is the direct channel so that safety does not remain an abstract issue but becomes something real, concrete and tangible, also and especially on behalf of employees. Only in this way, the latter will be able to believe in this project and become a fundamental and essential part of it to reduce the risk to zero accidents.
The Group conducts internal research and development activities on products, processes and
30 I
CLn Group
RESEARCH AND DEVELOPMENT ACTIVITIESproduction methods. In particular, these activities cover the following main areas.
• The selection of materials: study of solutions to optimize weights and performance of products and reduce costs.
• Optimization of production processes: research for new production techniques aimed at improving production performance in terms of efficiency, workload and safety.
• Definition of new product concepts: solutions aimed at specific applications for style or type of product (e.g. multi-material/component solutions for electric vehicles).
• Identification of new simulation procedures: analysis aimed at improving the efficiency and accuracy of the simulation process / product testing.
• Identification of new product approval procedures: activities aimed at defining new specifications and test methods to counter shared with customers to validate the absolute reliability of the products.
In connection with these activities, the Group has also initiated collaborative projects and part-nership with suppliers, customers, universities and research centres aimed at creating synergies and new growth opportunities.
Costs arising from R&D activities are capitalized as intangible fixed assets if the requirements of recoverability required by the accounting principles are met.
rePort oN oPeratIoNs I 31
AnnuAl REPORT 2014
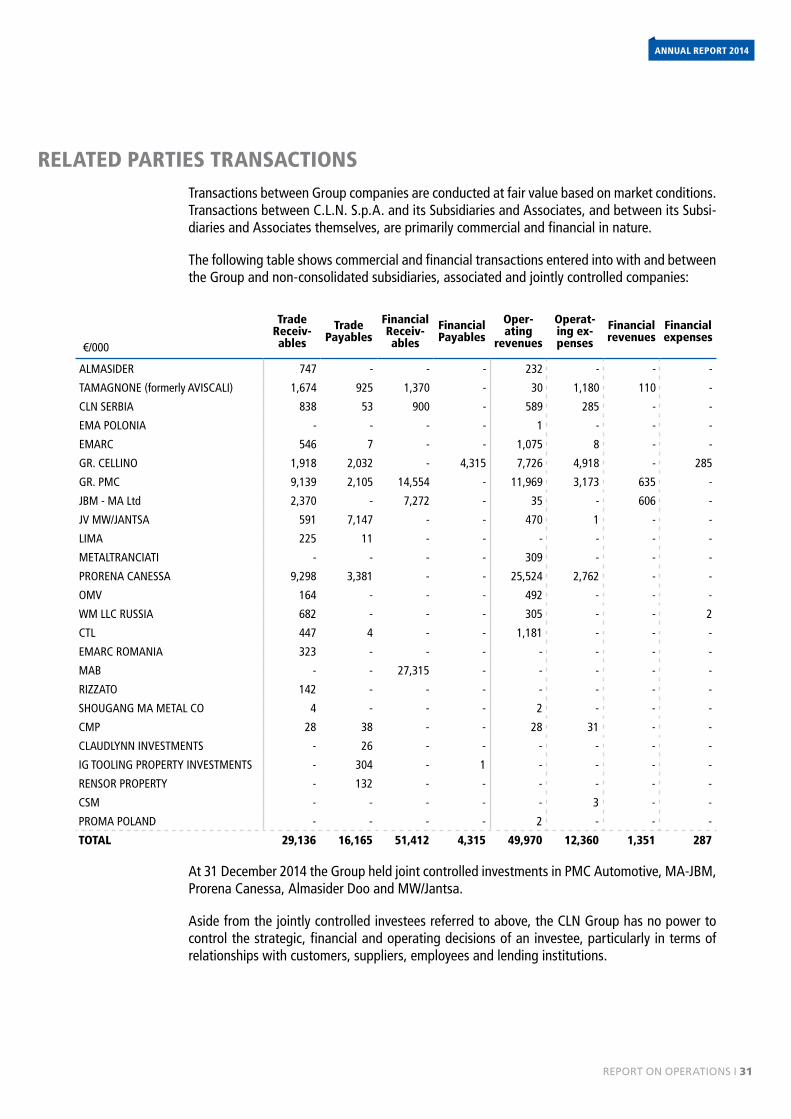
RELATED PARTIES TRANSACTIONSTransactions between Group companies are conducted at fair value based on market conditions. Transactions between C.L.N. S.p.A. and its Subsidiaries and Associates, and between its Subsi-diaries and Associates themselves, are primarily commercial and financial in nature.
The following table shows commercial and financial transactions entered into with and between the Group and non-consolidated subsidiaries, associated and jointly controlled companies:
€/000
Trade Receiv-ables
Trade Payables
Financial Receiv-ables
Financial Payables
Oper-ating
revenues
Operat-ing ex-penses
Financial revenues
Financial expenses
ALMASIDER 747 - - - 232 - - -
TAMAGNONE (formerly AVISCALI) 1,674 925 1,370 - 30 1,180 110 -
CLN SERBIA 838 53 900 - 589 285 - -
EMA POLONIA - - - - 1 - - -
EMARC 546 7 - - 1,075 8 - -
GR. CELLINO 1,918 2,032 - 4,315 7,726 4,918 - 285
GR. PMC 9,139 2,105 14,554 - 11,969 3,173 635 -
JBM - MA Ltd 2,370 - 7,272 - 35 - 606 -
JV MW/JANTSA 591 7,147 - - 470 1 - -
LIMA 225 11 - - - - - -
METALTRANCIATI - - - - 309 - - -
PRORENA CANESSA 9,298 3,381 - - 25,524 2,762 - -
OMV 164 - - - 492 - - -
WM LLC RUSSIA 682 - - - 305 - - 2
CTL 447 4 - - 1,181 - - -
EMARC ROMANIA 323 - - - - - - -
MAB - - 27,315 - - - - -
RIZZATO 142 - - - - - - -
SHOUGANG MA METAL CO 4 - - - 2 - - -
CMP 28 38 - - 28 31 - -
CLAUDLYNN INVESTMENTS - 26 - - - - - -
IG TOOLING PROPERTY INVESTMENTS - 304 - 1 - - - -
RENSOR PROPERTY - 132 - - - - - -
CSM - - - - - 3 - -
PROMA POLAND - - - - 2 - - -
TOTAL 29,136 16,165 51,412 4,315 49,970 12,360 1,351 287
At 31 December 2014 the Group held joint controlled investments in PMC Automotive, MA-JBM, Prorena Canessa, Almasider Doo and MW/Jantsa.
Aside from the jointly controlled investees referred to above, the CLN Group has no power to control the strategic, financial and operating decisions of an investee, particularly in terms of relationships with customers, suppliers, employees and lending institutions.
32 I
CLn Group
Assuming a wider definition of related parties, also the purchases of steel from companies belonging to ArcelorMittal and Marubeni Itochu, as Group shareholders, could fall inside the relationships with related parties.
Such transactions, although material, are not disclosed as conducted at market values and con-ditions.
rePort oN oPeratIoNs I 33
AnnuAl REPORT 2014
SUBSEQUENT EVENTSThe most important subsequent events are summarized as follows:
• On January 15, 2015 MA S.r.l. sold its 35% stake in Proma Poland Sp Zoo achie-ving a capital gain of € 580 thousand.
• As preliminary step for the contributions into the JV AMCLN, on 25 February 2015, C.L.N. S.p.A. purchased the remaining shares (49%) of Prorena Canessa S.r.l. and carried out the spin-off of the real estate branch of the company in favour of the newco Immobiliare Grassobbio.
• In the same date, C.L.N. S.p.A. also acquired from third parties an additional 2% ITLA shares.
• On March 30, 2015 the AMCLN project was finally executed. On that date a capi-tal increase was subscribed in the joint venture through the contribution in kind of the businesses of the two partners CLN and ArcelorMittal. The amount subscribed by CLN, € 30.6 million, refers to the operational branch of C.L.N. S.p.A. including the production facilities and controlling investments in Prorena Canessa S.r.l, Delna S.p.A. (through the contribution of its holding company Pro-Can S.r.l.) and Tamagnone S.r.l. The effectiveness of the contribution started on April 1, 2015.
34 I
CLn Group
As mentioned above the first quarter of 2015 showed signs of recovery compared to 2014. In particular, regarding the European Passengers Cars market (EU 27 + EFTA), in the first quarter of 2015, registrations were up 8.5% compared to the same period last year, surpassing the 3.5 million units.
Referring to major markets, good performance is recorded in Germany (+ 6.4%), France (+ 6.9%), Italy (+ 13.5%) and the UK (+ 6.8%). Excellent performances were also recorded in Spain (+ 32.2%).
All major CLN Group customers in Europe recorded an increase in registrations higher than the market average in the first quarter of 2015, and in particular: FCA (+ 11.6%) due to the effect of new models Jeep Renegade and 500X, BMW (11.6%), Daimler (+ 16.8%), Renault (+ 10.2%) and VW (+ 9.4%). The only exception is PSA whose increase compared to 2014 is 3.5%.
The same trend has the segment of Light Commercial Vehicles (LCV) that in Europe (EU + EFTA), in the first quarter 2015, registered an encouraging performance. Registrations were up overall by 13.5%, mainly in Spain (+ 44.5%), the UK (+ 22.3%), Italy (+ 6.1%) and Germany (+ 10.5%). It is to point out that in this segment France maintained a breakeven compared to the same period last year.
Lastly, concerning the steel market, the forecasts of the main trade associations, such as Eurofer (for producers) and Eurometal (for distribution), highlight that consumption in the EU-27 area is gradually improving compared to 2014.
The positive signals of the reference markets are reflected in the results achieved by the Group in the first quarter of the year, up from the previous year and above the estimates included in the budget. Such elements lead to an optimistic view of the evolution of the results for the re-maining part of the year.
May 7, 2015
Board of Directors
The Chairman
Aurora Magnetto
OUTLOOK ON 2015
3CONSOLIDATED FINANCIALSTATEMENTS
36 I
CLn Group
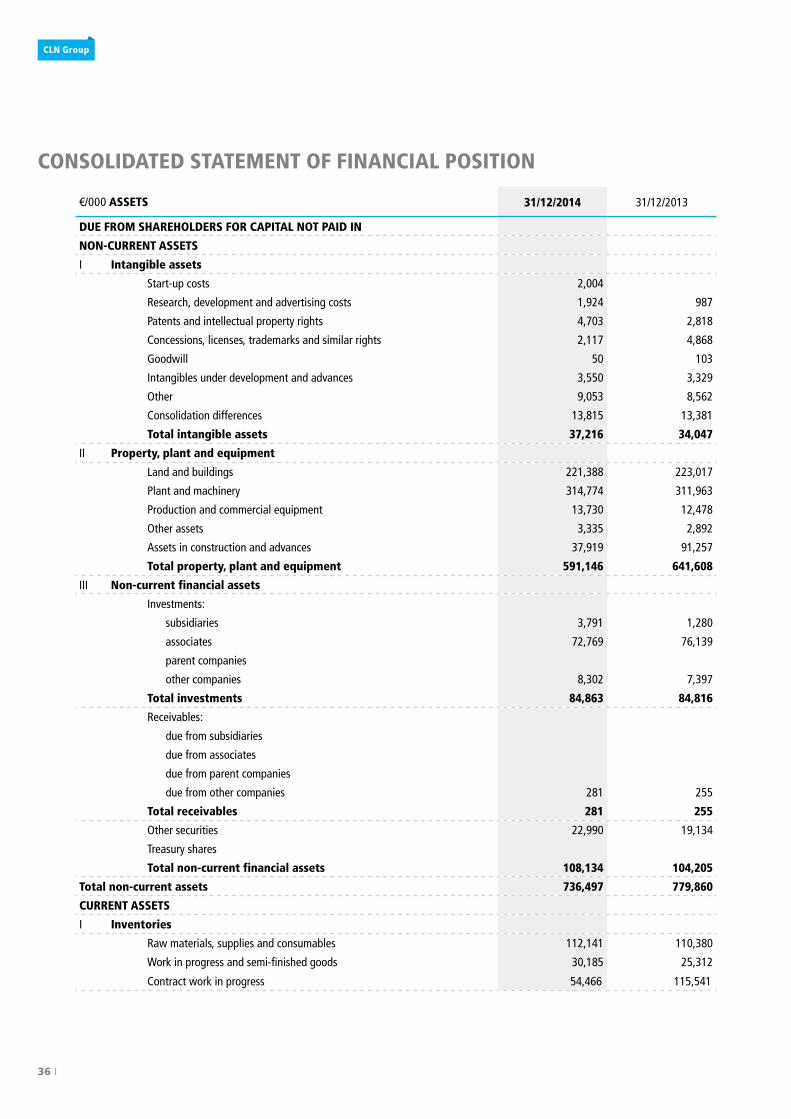
CONSOLIDATED STATEMENT OF FINANCIAL POSITION
€/000 ASSETS 31/12/2014 31/12/2013
DUE FROM SHAREHOLDERS FOR CAPITAL NOT PAID IN
NON-CURRENT ASSETS
I Intangible assets
Start-up costs 2,004
Research, development and advertising costs 1,924 987
Patents and intellectual property rights 4,703 2,818
Concessions, licenses, trademarks and similar rights 2,117 4,868
Goodwill 50 103
Intangibles under development and advances 3,550 3,329
Other 9,053 8,562
Consolidation differences 13,815 13,381
Total intangible assets 37,216 34,047
II Property, plant and equipment
Land and buildings 221,388 223,017
Plant and machinery 314,774 311,963
Production and commercial equipment 13,730 12,478
Other assets 3,335 2,892
Assets in construction and advances 37,919 91,257
Total property, plant and equipment 591,146 641,608
III Non-current financial assets
Investments:
subsidiaries 3,791 1,280
associates 72,769 76,139
parent companies
other companies 8,302 7,397
Total investments 84,863 84,816
Receivables:
due from subsidiaries
due from associates
due from parent companies
due from other companies 281 255
Total receivables 281 255
Other securities 22,990 19,134
Treasury shares
Total non-current financial assets 108,134 104,205
Total non-current assets 736,497 779,860
CURRENT ASSETS
I Inventories
Raw materials, supplies and consumables 112,141 110,380
Work in progress and semi-finished goods 30,185 25,312
Contract work in progress 54,466 115,541
AnnuAl REPORT 2014
coNsolIdated fINaNcIal statemeNts I 37
AnnuAl REPORT 2014
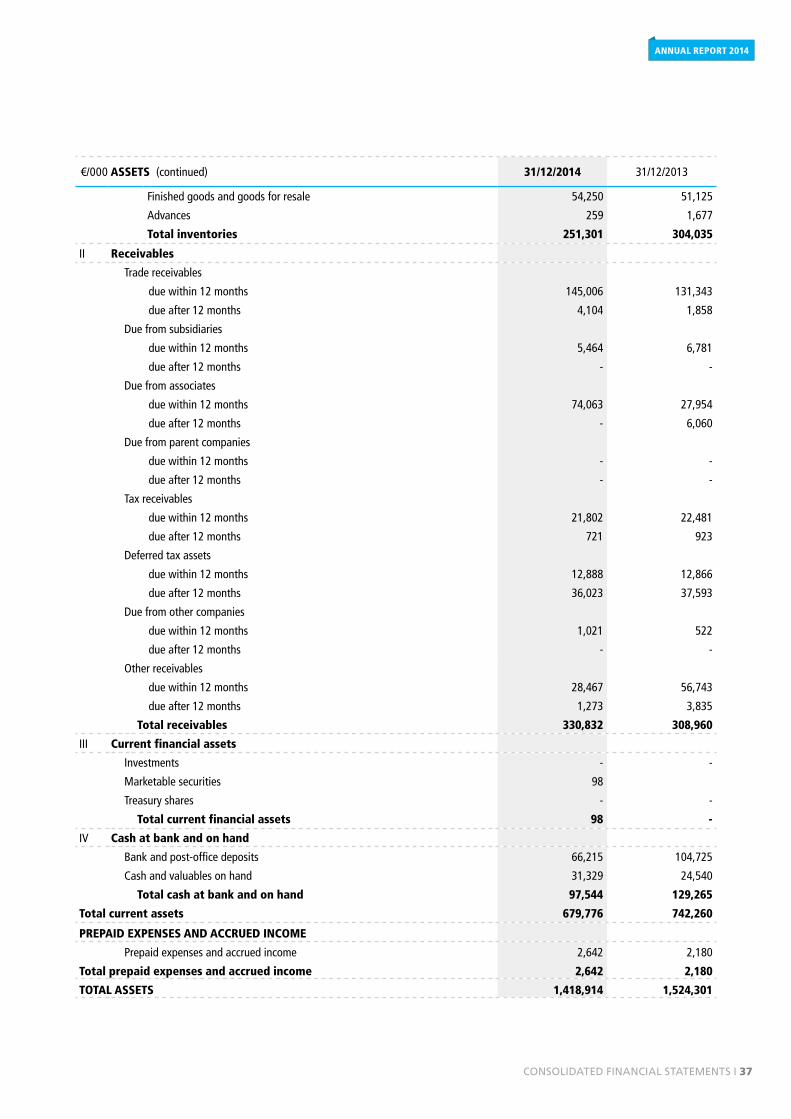
€/000 ASSETS (continued) 31/12/2014 31/12/2013
Finished goods and goods for resale 54,250 51,125
Advances 259 1,677
Total inventories 251,301 304,035
II Receivables
Trade receivables
due within 12 months 145,006 131,343
due after 12 months 4,104 1,858
Due from subsidiaries
due within 12 months 5,464 6,781
due after 12 months - -
Due from associates
due within 12 months 74,063 27,954
due after 12 months - 6,060
Due from parent companies
due within 12 months - -
due after 12 months - -
Tax receivables
due within 12 months 21,802 22,481
due after 12 months 721 923
Deferred tax assets
due within 12 months 12,888 12,866
due after 12 months 36,023 37,593
Due from other companies
due within 12 months 1,021 522
due after 12 months - -
Other receivables
due within 12 months 28,467 56,743
due after 12 months 1,273 3,835
Total receivables 330,832 308,960
III Current financial assets
Investments - -
Marketable securities 98
Treasury shares - -
Total current financial assets 98 -
IV Cash at bank and on hand
Bank and post-office deposits 66,215 104,725
Cash and valuables on hand 31,329 24,540
Total cash at bank and on hand 97,544 129,265
Total current assets 679,776 742,260
PREPAID EXPENSES AND ACCRUED INCOME
Prepaid expenses and accrued income 2,642 2,180
Total prepaid expenses and accrued income 2,642 2,180
TOTAL ASSETS 1,418,914 1,524,301
38 I
CLn Group
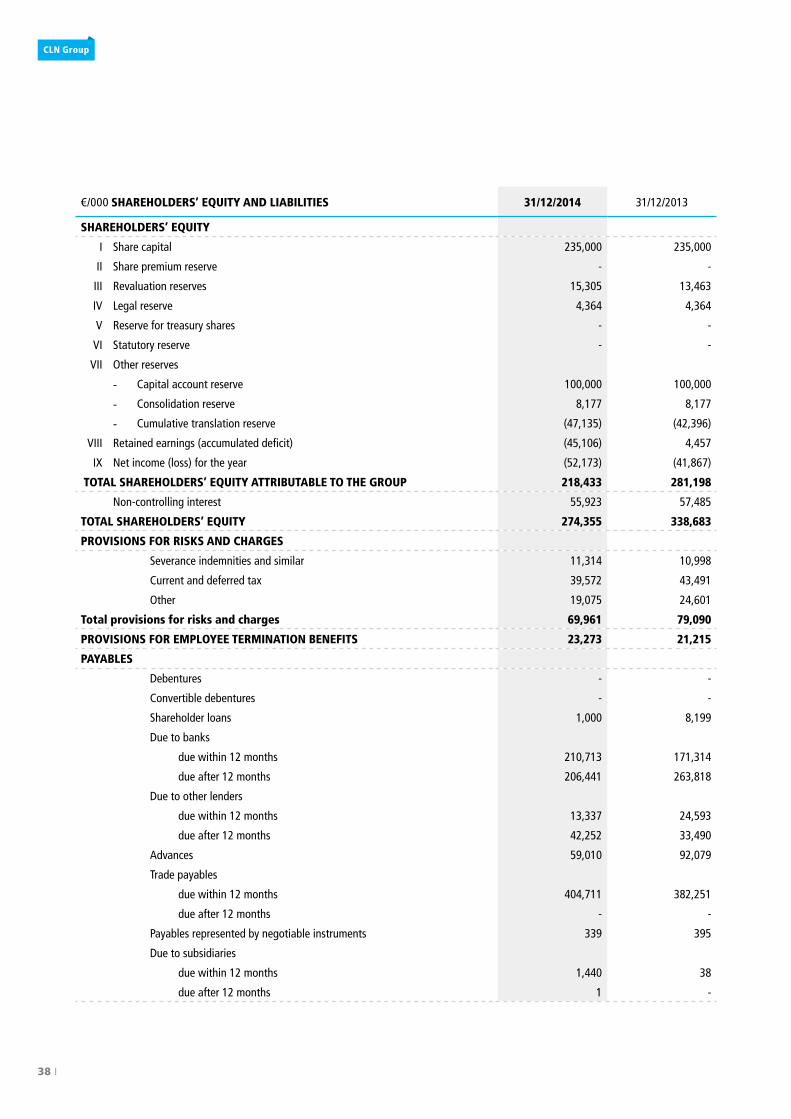
€/000 SHAREHOLDERS’ EQUITY AND LIABILITIES 31/12/2014 31/12/2013
SHAREHOLDERS’ EQUITY
I Share capital 235,000 235,000
II Share premium reserve - -
III Revaluation reserves 15,305 13,463
IV Legal reserve 4,364 4,364
V Reserve for treasury shares - -
VI Statutory reserve - -
VII Other reserves
- Capital account reserve 100,000 100,000
- Consolidation reserve 8,177 8,177
- Cumulative translation reserve (47,135) (42,396)
VIII Retained earnings (accumulated deficit) (45,106) 4,457
IX Net income (loss) for the year (52,173) (41,867)
TOTAL SHAREHOLDERS’ EQUITY ATTRIBUTABLE TO THE GROUP 218,433 281,198
Non-controlling interest 55,923 57,485
TOTAL SHAREHOLDERS’ EQUITY 274,355 338,683
PROVISIONS FOR RISKS AND CHARGES
Severance indemnities and similar 11,314 10,998
Current and deferred tax 39,572 43,491
Other 19,075 24,601
Total provisions for risks and charges 69,961 79,090
PROVISIONS FOR EMPLOYEE TERMINATION BENEFITS 23,273 21,215
PAYABLES
Debentures - -
Convertible debentures - -
Shareholder loans 1,000 8,199
Due to banks
due within 12 months 210,713 171,314
due after 12 months 206,441 263,818
Due to other lenders
due within 12 months 13,337 24,593
due after 12 months 42,252 33,490
Advances 59,010 92,079
Trade payables
due within 12 months 404,711 382,251
due after 12 months - -
Payables represented by negotiable instruments 339 395
Due to subsidiaries
due within 12 months 1,440 38
due after 12 months 1 -
AnnuAl REPORT 2014
coNsolIdated fINaNcIal statemeNts I 39
AnnuAl REPORT 2014
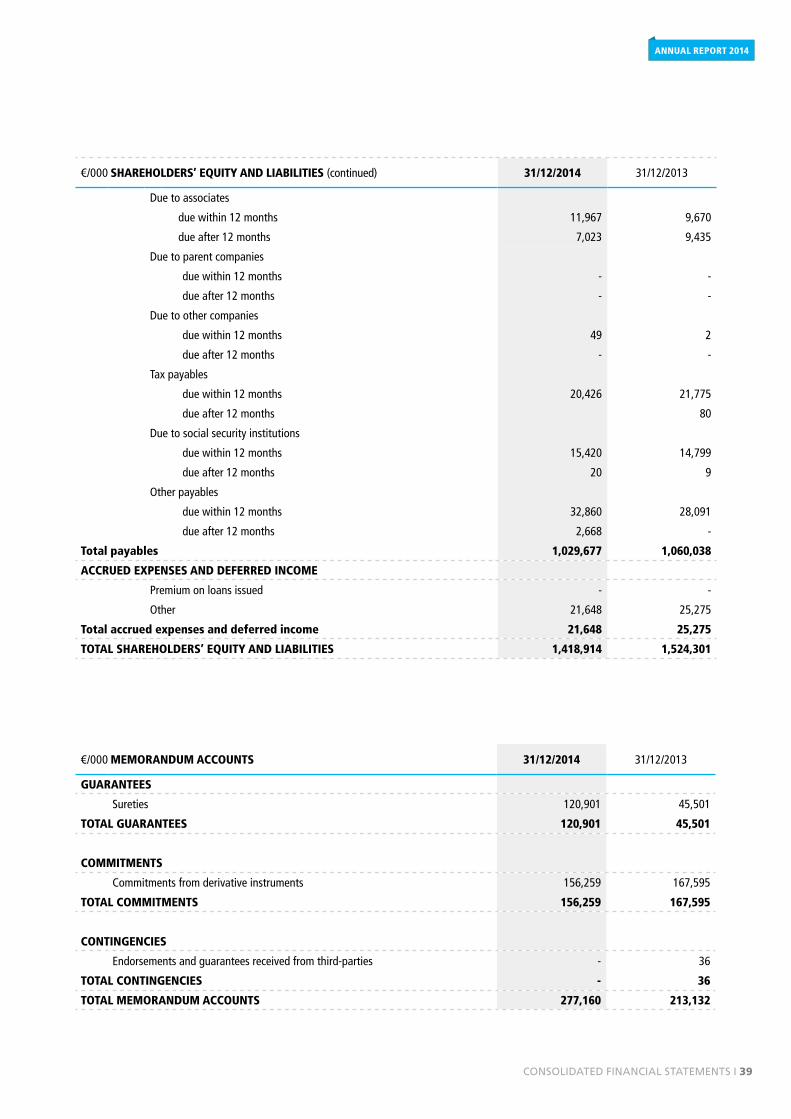
€/000 SHAREHOLDERS’ EQUITY AND LIABILITIES (continued) 31/12/2014 31/12/2013
Due to associates
due within 12 months 11,967 9,670
due after 12 months 7,023 9,435
Due to parent companies
due within 12 months - -
due after 12 months - -
Due to other companies
due within 12 months 49 2
due after 12 months - -
Tax payables
due within 12 months 20,426 21,775
due after 12 months 80
Due to social security institutions
due within 12 months 15,420 14,799
due after 12 months 20 9
Other payables
due within 12 months 32,860 28,091
due after 12 months 2,668 -
Total payables 1,029,677 1,060,038
ACCRUED EXPENSES AND DEFERRED INCOME
Premium on loans issued - -
Other 21,648 25,275
Total accrued expenses and deferred income 21,648 25,275
TOTAL SHAREHOLDERS’ EQUITY AND LIABILITIES 1,418,914 1,524,301
€/000 MEMORANDUM ACCOUNTS 31/12/2014 31/12/2013
GUARANTEES
Sureties 120,901 45,501
TOTAL GUARANTEES 120,901 45,501
COMMITMENTS
Commitments from derivative instruments 156,259 167,595
TOTAL COMMITMENTS 156,259 167,595
CONTINGENCIES
Endorsements and guarantees received from third-parties - 36
TOTAL CONTINGENCIES - 36
TOTAL MEMORANDUM ACCOUNTS 277,160 213,132
40 I
CLn Group
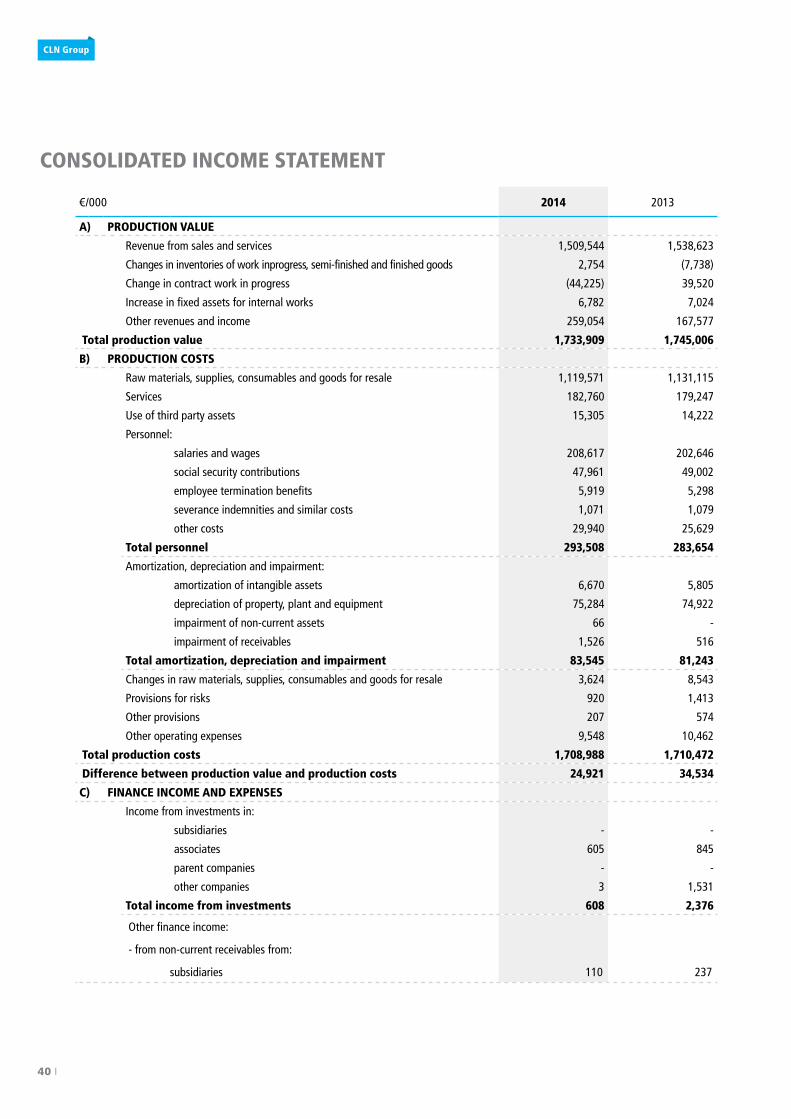
CONSOLIDATED INCOME STATEMENT
€/000 2014 2013
A) PRODUCTION VALUE
Revenue from sales and services 1,509,544 1,538,623
Changes in inventories of work inprogress, semi-finished and finished goods 2,754 (7,738)
Change in contract work in progress (44,225) 39,520
Increase in fixed assets for internal works 6,782 7,024
Other revenues and income 259,054 167,577
Total production value 1,733,909 1,745,006
B) PRODUCTION COSTS
Raw materials, supplies, consumables and goods for resale 1,119,571 1,131,115
Services 182,760 179,247
Use of third party assets 15,305 14,222
Personnel:
salaries and wages 208,617 202,646
social security contributions 47,961 49,002
employee termination benefits 5,919 5,298
severance indemnities and similar costs 1,071 1,079
other costs 29,940 25,629
Total personnel 293,508 283,654
Amortization, depreciation and impairment:
amortization of intangible assets 6,670 5,805
depreciation of property, plant and equipment 75,284 74,922
impairment of non-current assets 66 -
impairment of receivables 1,526 516
Total amortization, depreciation and impairment 83,545 81,243
Changes in raw materials, supplies, consumables and goods for resale 3,624 8,543
Provisions for risks 920 1,413
Other provisions 207 574
Other operating expenses 9,548 10,462
Total production costs 1,708,988 1,710,472
Difference between production value and production costs 24,921 34,534
C) FINANCE INCOME AND EXPENSES
Income from investments in:
subsidiaries - -
associates 605 845
parent companies - -
other companies 3 1,531
Total income from investments 608 2,376
Other finance income:
- from non-current receivables from:
subsidiaries 110 237
AnnuAl REPORT 2014
coNsolIdated fINaNcIal statemeNts I 41
AnnuAl REPORT 2014
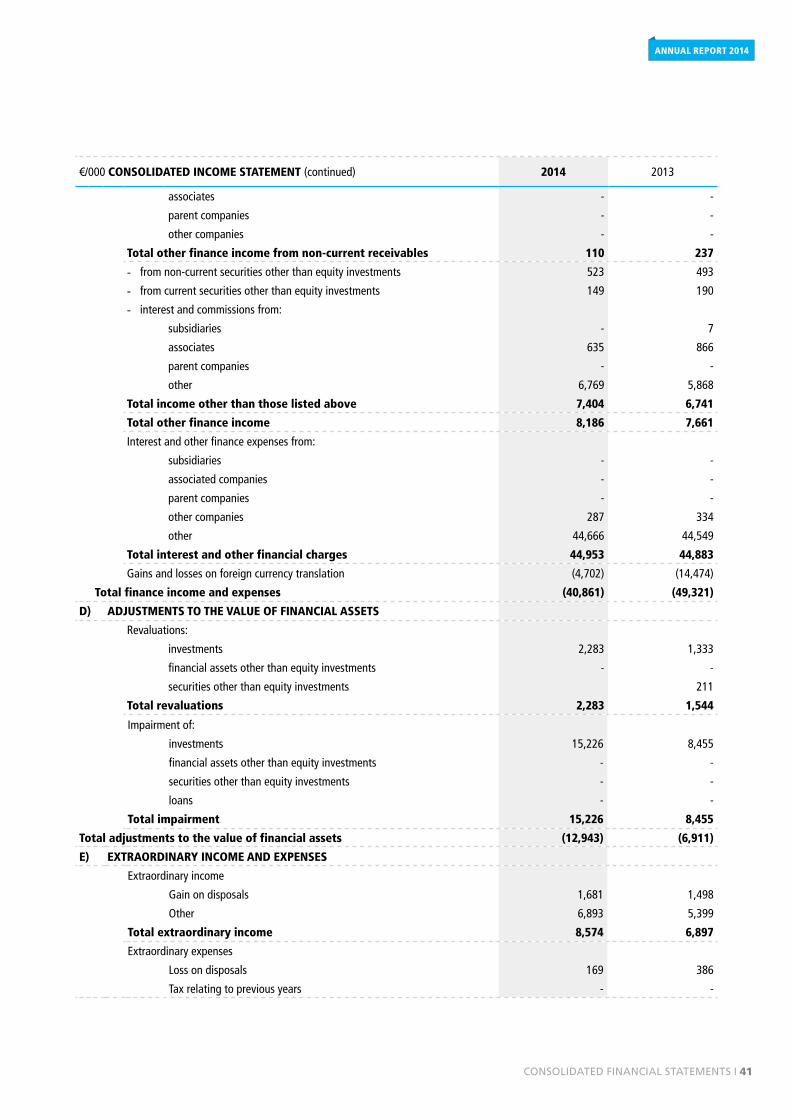
€/000 CONSOLIDATED INCOME STATEMENT (continued) 2014 2013
associates - -
parent companies - -
other companies - -
Total other finance income from non-current receivables 110 237
- from non-current securities other than equity investments 523 493
- from current securities other than equity investments 149 190
- interest and commissions from:
subsidiaries - 7
associates 635 866
parent companies - -
other 6,769 5,868
Total income other than those listed above 7,404 6,741
Total other finance income 8,186 7,661
Interest and other finance expenses from:
subsidiaries - -
associated companies - -
parent companies - -
other companies 287 334
other 44,666 44,549
Total interest and other financial charges 44,953 44,883
Gains and losses on foreign currency translation (4,702) (14,474)
Total finance income and expenses (40,861) (49,321)
D) ADJUSTMENTS TO THE VALUE OF FINANCIAL ASSETS
Revaluations:
investments 2,283 1,333
financial assets other than equity investments - -
securities other than equity investments 211
Total revaluations 2,283 1,544
Impairment of:
investments 15,226 8,455
financial assets other than equity investments - -
securities other than equity investments - -
loans - -
Total impairment 15,226 8,455
Total adjustments to the value of financial assets (12,943) (6,911)
E) EXTRAORDINARY INCOME AND EXPENSES
Extraordinary income
Gain on disposals 1,681 1,498
Other 6,893 5,399
Total extraordinary income 8,574 6,897
Extraordinary expenses
Loss on disposals 169 386
Tax relating to previous years - -
42 I
CLn Group
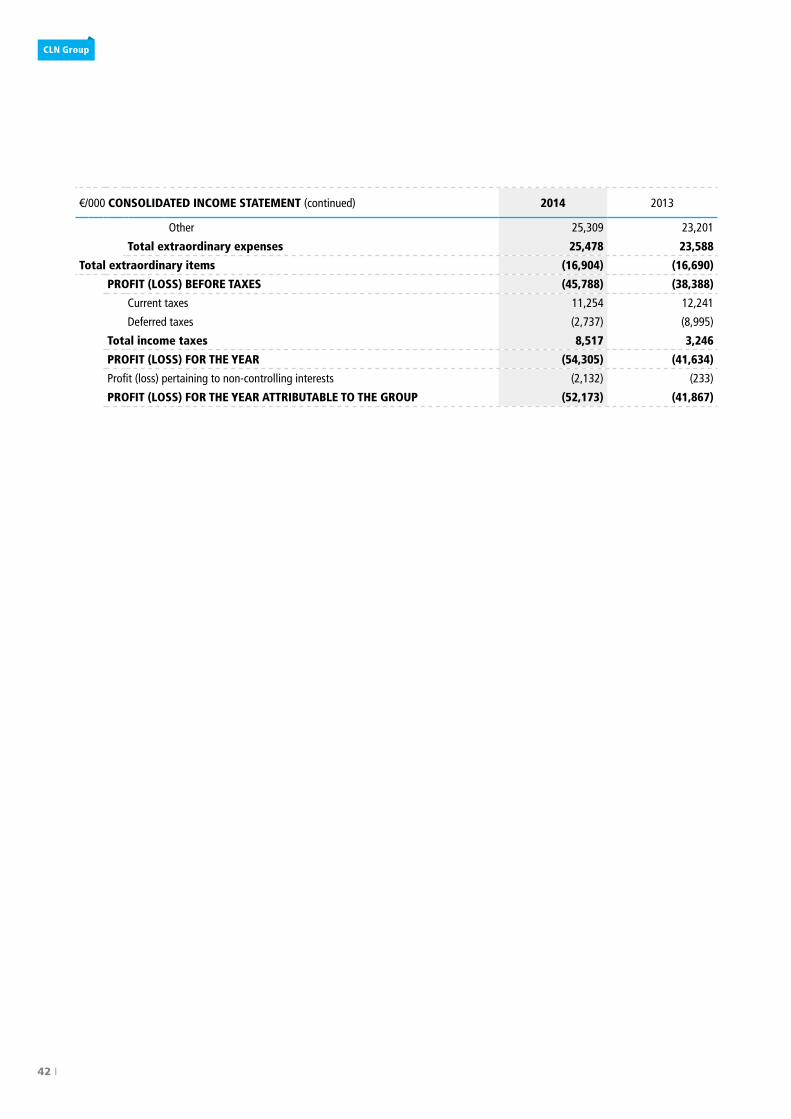
€/000 CONSOLIDATED INCOME STATEMENT (continued) 2014 2013
Other 25,309 23,201
Total extraordinary expenses 25,478 23,588
Total extraordinary items (16,904) (16,690)
PROFIT (LOSS) BEFORE TAXES (45,788) (38,388)
Current taxes 11,254 12,241
Deferred taxes (2,737) (8,995)
Total income taxes 8,517 3,246
PROFIT (LOSS) FOR THE YEAR (54,305) (41,634)
Profit (loss) pertaining to non-controlling interests (2,132) (233)
PROFIT (LOSS) FOR THE YEAR ATTRIBUTABLE TO THE GROUP (52,173) (41,867)

4NOTES TO THE CONSOLIDATEDFINANCIAL STATEMENTS
CLn Group
44 I
1. CORE BUSINESS
C.L.N. S.p.A. is incorporated under the laws of Italy. C.L.N. S.p.A. and its subsidiaries (the “Group”) operate in 17 countries with four diverse business lines: steel service centres (steel coil slitting, cut-to-length and distribution), steel automotive structural parts production and assembly, steel wheel production and fine blanking.
Related party transactions, which form part of the Group’s normal operations, are mainly of a commercial nature and are conducted based on prevailing market conditions.
2. FORM AND CONTENT OF THE CONSOLIDATED FINANCIAL STATEMENTS
The consolidated financial statements have been prepared in accordance with Section III of Italian legislative decree 127/1991 and subsequent amendments and interpretations introduced by Italian legislative decree no. 6 of 17 January 2003 (the Corporate Governance Reform Act), as well as the accounting principles issued by the Italian Accounting Profession (Consiglio Na-zionale dei Dottori Commercialisti e dei Ragionieri) and the Italian Accounting Standards Board (Organismo Italiano di Contabilità) and in the absence of guidance and when not in contrast to the previously mentioned, International Financial Reporting Standards issued by the Internatio-nal Accounting Standards Board (IASB).
These have been applied with prudence and on a going concern basis while also taking into account the economic substance of the asset or liability component in consideration.
The consolidated financial statements include the consolidated statement of financial position, the consolidated income statement and the notes to the consolidated financial statements (the “Notes”).
The subsequent events, illustrated in the Report on Operations section, form an integral part of these Notes.
The consolidated financial statements (the “Consolidated Financial Statements”) include C.L.N. S.p.A (the “Company”), together with Italian and overseas subsidiaries where the Company holds, either directly or indirectly, majority voting rights.
Companies included in the Group, along with their registered business name and location, share capital and percentage of direct or indirect ownership are listed in an attachment to these Notes.
All entities included in consolidation have the same financial period closing date as the Company of 31 December.
No situations occurred in the Consolidated Financial Statements requiring derogation under Article 2423 of the Italian Civil Code.
These Consolidated Financial Statements include comparative year figures.
All amounts are expressed in thousands of Euro except where otherwise noted.
NOTES TO THE CONSOLIDATED FINANCIAL STATEMENTSFOR THE YEAR ENDED 31 DECEMBER 2014
Notes I 45
AnnuAl REPORT 2014
Consolidation Principles
The financial statements of companies within the scope of consolidation, prepared and appro-ved by the respective companies’ board of directors and adjusted where necessary to conform to the accounting policies adopted by the Company, have been included in the Consolidated Financial Statements for the year ended 31 December 2014.
The income statements of foreign subsidiaries denominated in foreign currency have been con-verted into Euro at the respective average rate of exchange for the year whereas the related statements of financial position have been converted into Euro at the applicable year end foreign exchange rates.
Exchange differences resulting from the conversion of opening shareholders’ equity at the year-end exchange rate have been recorded within currency translation reserves within shareholders’ equity.
The exchange rates applied are reported within the “Other information” section of these Notes.
All subsidiaries included in the scope of consolidation have been consolidated using the line-by-line method summarized as follows:
a. assets, liabilities, revenues and expenses of subsidiaries, regardless of shareholdings have been included in the Consolidated Financial Statements, after eliminating the book value of the investments held by the Company, or by other consolidated companies against the related shareholders’ equity. Non-controlling interests in the net equity and the net result for the year of the consolidated subsidiaries are shown separately in the consolidated statement of financial position and the consolidated income statement.
b. Upon acquisition, any difference between the purchase price and the net equity acquired is allocated, wherever possible, to the assets and liabilities of the acquired company. Any remaining difference is:
- if positive, recognized as a “consolidation difference” within intangible assets and amortized on a straight-line basis over the expected recovery period of the investment;
- if negative, recognized within consolidated shareholders’ equity within “consolidation reserve”, or, when future losses are expected, in “consolidation provision for risks and future charges”.
c. Intercompany receivables and payables, costs and revenues are eliminated.
The following items are also eliminated on consolidation:
- capital gains arising from or relating to non-current assets transferred between consolidated companies;
- intragroup profits, where considered material, arising from transactions
46 I
CLn Group
between consolidated companies involving the transfer of assets where the assets transferred remain as inventory of the acquirer at the reporting date;
- impairment and recovery of investments held by consolidated companies including intragroup receivables and dividends.
3. ACCOUNTING POLICIES
In accordance with Article 2426 of the Italian Civil Code, a brief description is provided below of the accounting policies and principles adopted in preparing the Consolidated Financial State-ments, which have been consistently applied with the prior year.
Intangible assetsIntangible assets are initially recorded at purchase price or production cost, including directly re-lated costs incurred to prepared the relevant asset for use. The costs incurred, as defined above, may not exceed the recoverable amount of the asset.
Intangible assets with a finite life are amortized on a straight-line basis over the asset’s estima-ted remaining useful economic life.
Amortized intangible assets are registered at their amortized value, and, with the exception of goodwill, cannot be maintained in subsequent financial statements when the reasons for the adjustment exist.
Where the impairment is due to an extraordinary nature, production reconversion, restructuring or production resizing, the impairment is registered as an extraordinary loss.
The amortization rates applied to intangible assets with a finite useful life are between 10 and 20%.
Property, plant and equipmentProperty, plant and equipment are initially recorded at purchase price or production cost, adju-sted where applicable for the application of specific monetary revaluation laws or gains arising from the difference between the cost of new acquisitions and purchased net equity, less accu-mulated depreciation and any impairment adjustments.
Property, plant and equipment are depreciated based on economic life/technical rates determi-ned according to the remaining economic useful lives of the related assets.
The depreciation rates applied are as follows:
Buildings 3% to 10%
Plant and machinery 6.7% to 17.5%
Production and commercial equipment 5% to 25%Other assets 12% to 25%
Notes I 47
AnnuAl REPORT 2014
Depreciation commences when the assets are available for use and is charged at 50% of the regular rate in the year of acquisition.
If the fair value of the tangible asset at the end of the reporting period appears to be lower than its net book value, this tangible asset is a subject to impairment. Should the impairment result from permanent losses arising from exceptional in nature transactions, or production reconver-sion, restructuring or production downsizing, these are classified as extraordinary expenses.
Maintenance costs and the costs of routine repairs are charged directly to the consolidated in-come statement as incurred. Costs incurred for the expansion, modernization or improvement of owned or leased assets are capitalized and are depreciated according to the remaining economic useful life of the asset.
Assets in construction and advances are recorded separately within property, plant and equipment.
Leasing arrangements are recorded under the finance method whereby the capital value of assets, including the portion of lease rentals on inception considered as “prepaid expenses”, is recorded within property, plant and equipment, whilst lease rentals payable by the way of principal are recorded within non-current financial payables. The lease rentals accounted for in the statutory accounts are replaced by depreciation determined in relation to the estimated economic useful life of the assets held under lease, classifying the related interest expense under financial charges and the related deferred taxation provisioned.
In accordance with generally accepted accounting principles in Italy and where permitted by specific monetary revaluation laws, the Group has recorded revaluations (pursuant to limits defined by legislation) and corresponding equity reserves. Revalued amounts do not exceed the recoverable amounts of the assets.
Non-current financial assetsInactive subsidiaries (start-ups) are not included in the consolidation, as their impact on the assets, liabilities, net financial position and results reported by the Group is considered insigni-ficant.
Investments in associates are accounted for using the equity method whereby the Group’s share of profit or loss from the year is recorded in the income statement. When accounting for Group investments in associates under the equity method, the holdings in subsidiaries or associates by Group associates are considered.
Investments in other companies are recorded at cost net of adjustments to reflect any perma-nent impairment in value.
Receivables are accounted for at amortized cost net of any impairment adjustments.
Securities are accounted for at cost net of adjustments to reflect any permanent impairment in value.
48 I
CLn Group
InventoriesInventories are recorded at the lower of (i) production/purchase cost, determined using the first in first out (FIFO) method, and (ii) net realizable value based on market conditions. The value of inventory obtained under FIFO does not significantly differ from current costs for the same inventory.
Manufacturing costs include the cost of raw materials, direct costs and the portion of indirect costs that can be attributed to the production process. Provisions are recorded against slow-moving and obsolete inventories based on their estimated use or realizable value.
Contract work in progress, mainly represented by the development of tooling and dies for clients, is accounted using the completed contract method and therefore the related margin is only re-corded at the time of completion of the contract.
ReceivablesReceivables are stated at their nominal value and trade receivables are adjusted as necessary to their presumed realizable value, as required under Article 2426 of the Italian Civil Code, by recording allowances for doubtful accounts.
The Group enters into factoring and/or securitization transactions involving the sale and securiti-zation of its trade receivables. Certain factoring arrangements involve the sale of trade receiva-bles with recourse, whereby the Group remains exposed to insolvency risk of the debtor. In such cases, the factored receivables continue to be reported in the Group’s statement of financial position, until they have been collected by the factor, and any advances obtained from the factor are recognized as a financial liability.
Prepaid expenses and accrued expensesPrepaid expenses and accrued expenses include the portion of revenues and expenses covering two or more periods, in accordance with the matching or accrual basis of accounting. Under this basis, the effects of transactions and other events are recognized when they occur (and not when cash or its equivalent is received or paid) and they are recorded in the accounting records and reported in the financial statements in the periods to which they relate.
Dividends to shareholdersDividends payable to shareholders are recognized in the period in which they have been appro-ved by the shareholders.
Provisions for risks and chargesProvisions for risks and charges are provided to cover certain or probable losses or liabilities for which the exact value and effective date are not determinable at the reporting date. The provi-sions represent the best estimate based on the current information available.
Provisions for current and deferred taxes are also included in this item.
Notes I 49
AnnuAl REPORT 2014
Provision for employee termination benefitsAs accrued by the Italian companies of the Group, the provision for employee termination bene-fits is provided to cover the full liability due to employees in conformity with current legislation, national labour contracts and payroll agreements prevailing in Italy. Law No. 296 enacted on 27 December 2006 (Italian Financial Act 2007) introduced pension reform regulations (establi-shment of agreed-upon supplementary pension fund) in respect of employee termination bene-fits (TFR) allocations maturing after 1 January 2007.
The effects of the reform include the following:
• TFR allocations maturing up to 31 December 2006 remain within the Company.
• TFR allocations maturing as of 1 January 2007 are, as designated by the employee, transferred or directed to:
a. agreed upon second-pillar pension funds;
b. held within the Company, which transfers the TFR allocations to the National Social Security Institute (INPS).
At the consolidated statement of financial position level, “Provision for employee termination benefits” represents the residual balance existing at 31 December 31 2014. Classified under “Amounts due to social security institutions” is the liability accrued on 31 December 2014 in respect of TFR allocations yet to be transferred to the pension funds or provident institutes.
PayablesPayables are stated at their nominal value.
Commitments, guarantees and contingenciesThe amount of commitments, guarantees and contingencies outstanding at the statement of financial position date are reported in the memorandum accounts.
The notional amount of derivative financial instruments is shown among the memorandum ac-counts while its mark to market value is disclosed among the notes to the financial statements. In the case of instrument not qualifying for the definition of “hedging”, any negative mark to market value is accrued as a liability.
Revenue recognitionRevenue is accounted for in accordance with the accrual basis of accounting, less returns, trade discounts, rebates and premiums. Revenue from the sale of goods is recognized when the title of ownership passes to a customer, which generally coincides with shipping or consignment. Revenue from the provision of services is recognized when the services are rendered.
Costs and expense recognitionCosts and expenses are recognized in accordance with the accrual basis of accounting.
50 I
CLn Group
Finance income and expensesFinance income and expenses are recorded in accordance with the accrual basis of accounting.
TaxesIncome taxes are accounted for according to the tax laws and regulations prevailing in the countries in which the Group companies operate.
As of 2004, the Group’s Italian companies have elected to adhere to the National Tax Consolida-tion programme pursuant to Article 117/129 of the Italian Tax Code (T.U.I.R).
The company C.L.N. S.p.A. acts as a consolidating entity and determines a single taxable base for the group of companies adhering to the tax consolidation programme, thereby benefitting from the possibility to compensate taxable income with tax losses with a single income tax return.
Each company adhering to the tax consolidation programme deposits its entire taxable income with the tax consolidating entity, recording an account payable, for an amount equal to the “IRES” corporation tax payable, the companies contributing tax losses register an accounts receivable vis-à-vis the consolidating entity, for an amount equal to the “IRES” corporation tax receivable effectively offset by the Group.
Furthermore, deferred tax assets and deferred tax liabilities are determined for the more signifi-cant consolidation transactions and all temporary differences between the consolidated assets and the consolidated liabilities and the corresponding amounts for the purposes of taxation are shown in the statutory accounts of the consolidated companies.
In particular, deferred tax assets are recognized only if their future recovery is certain. Deferred tax liabilities are not recognized if there is a remote possibility that a future liability will rise.
A deferred tax asset is recognized for the carry forward of the unused tax losses, where they exist, to the extent that it is probable that future taxable profits will be available against which the unused tax losses can be utilized.
Dividends from associatesDividends distributed by companies not included in the scope of consolidation are accounted for in the year in which they are declared.
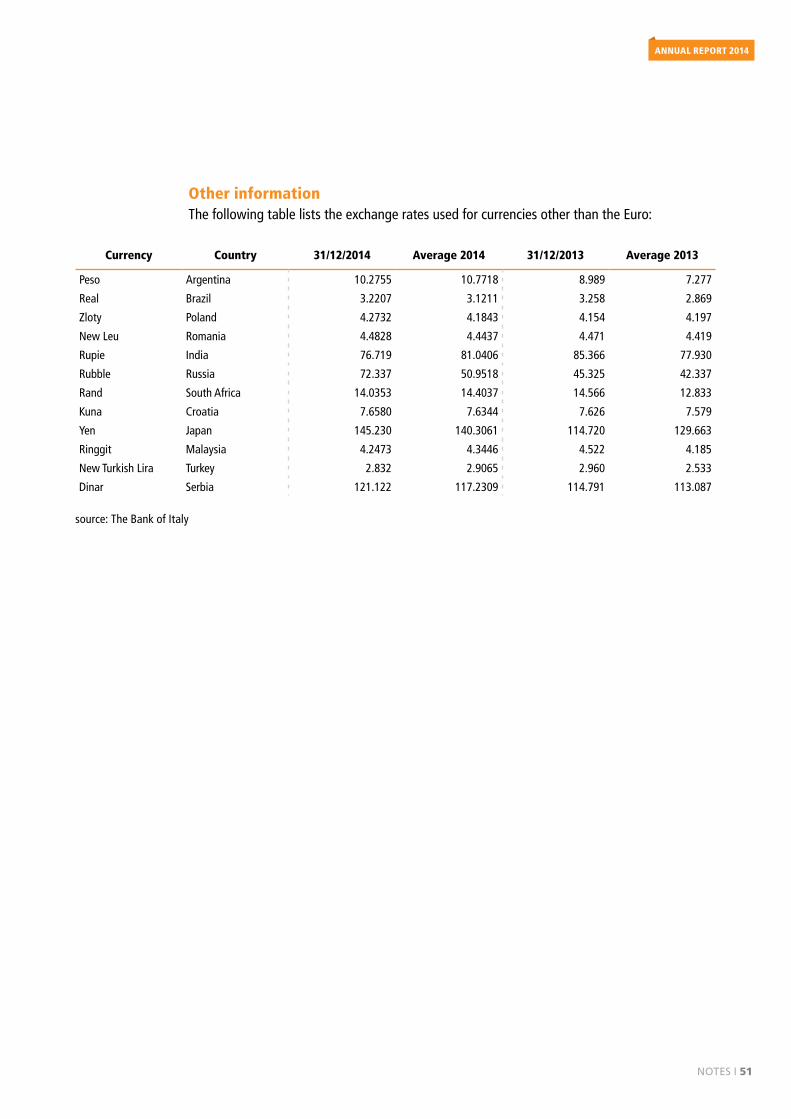
Notes I 51
AnnuAl REPORT 2014
Other information The following table lists the exchange rates used for currencies other than the Euro:
Currency Country 31/12/2014 Average 2014 31/12/2013 Average 2013
Peso Argentina 10.2755 10.7718 8.989 7.277
Real Brazil 3.2207 3.1211 3.258 2.869
Zloty Poland 4.2732 4.1843 4.154 4.197
New Leu Romania 4.4828 4.4437 4.471 4.419
Rupie India 76.719 81.0406 85.366 77.930
Rubble Russia 72.337 50.9518 45.325 42.337
Rand South Africa 14.0353 14.4037 14.566 12.833
Kuna Croatia 7.6580 7.6344 7.626 7.579
Yen Japan 145.230 140.3061 114.720 129.663
Ringgit Malaysia 4.2473 4.3446 4.522 4.185
New Turkish Lira Turkey 2.832 2.9065 2.960 2.533
Dinar Serbia 121.122 117.2309 114.791 113.087
source: The Bank of Italy
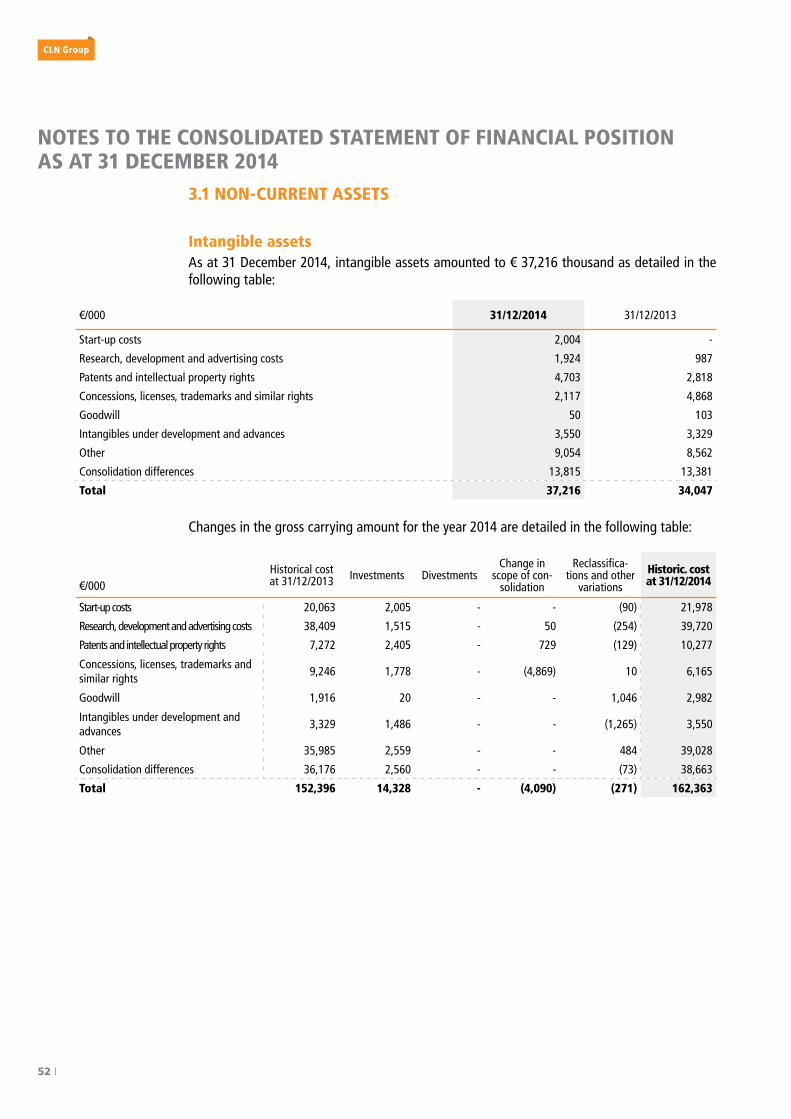
52 I
CLn Group
NOTES TO THE CONSOLIDATED STATEMENT OF FINANCIAL POSITION AS AT 31 DECEMBER 2014
3.1 NON-CURRENT ASSETS
Intangible assetsAs at 31 December 2014, intangible assets amounted to € 37,216 thousand as detailed in the following table:
€/000 31/12/2014 31/12/2013
Start-up costs 2,004 -
Research, development and advertising costs 1,924 987
Patents and intellectual property rights 4,703 2,818
Concessions, licenses, trademarks and similar rights 2,117 4,868
Goodwill 50 103
Intangibles under development and advances 3,550 3,329
Other 9,054 8,562
Consolidation differences 13,815 13,381
Total 37,216 34,047
Changes in the gross carrying amount for the year 2014 are detailed in the following table:
€/000 Historical cost at 31/12/2013 Investments Divestments
Change in scope of con-
solidation
Reclassifica-tions and other
variations
Historic. cost at 31/12/2014
Start-up costs 20,063 2,005 - - (90) 21,978
Research, development and advertising costs 38,409 1,515 - 50 (254) 39,720
Patents and intellectual property rights 7,272 2,405 - 729 (129) 10,277
Concessions, licenses, trademarks and similar rights
9,246 1,778 - (4,869) 10 6,165
Goodwill 1,916 20 - - 1,046 2,982
Intangibles under development and advances
3,329 1,486 - - (1,265) 3,550
Other 35,985 2,559 - - 484 39,028
Consolidation differences 36,176 2,560 - - (73) 38,663
Total 152,396 14,328 - (4,090) (271) 162,363
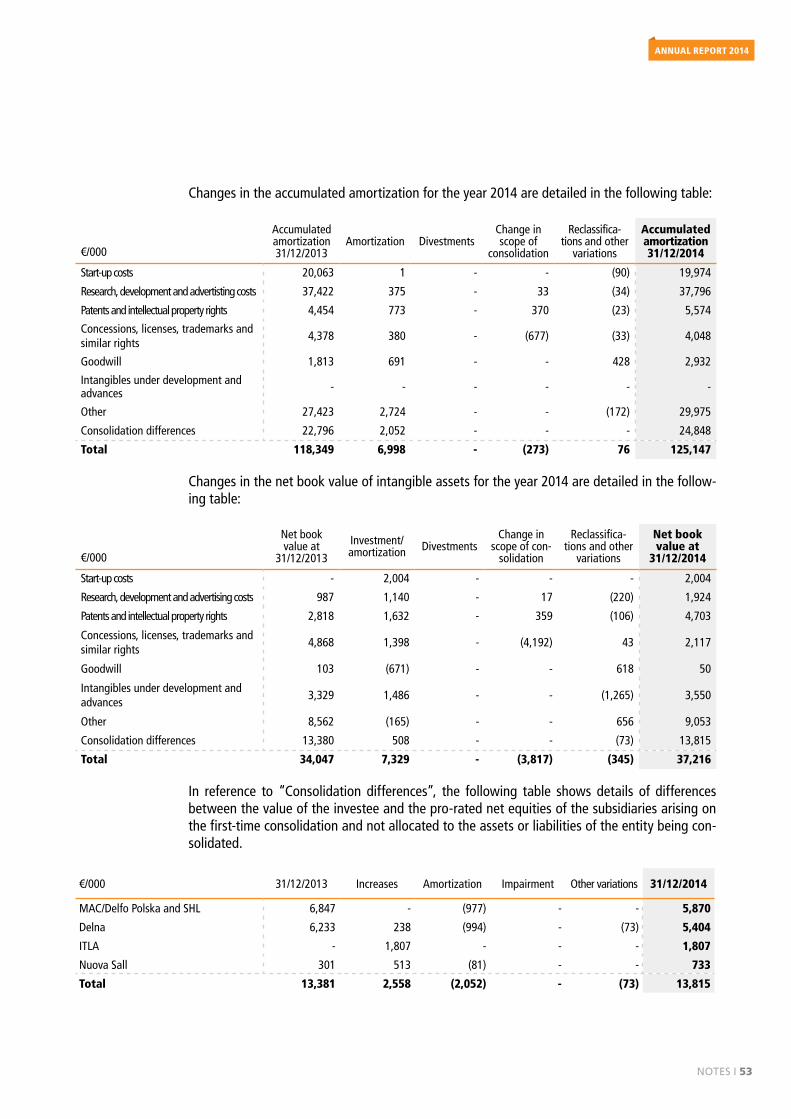
Notes I 53
AnnuAl REPORT 2014
Changes in the accumulated amortization for the year 2014 are detailed in the following table:
€/000
Accumulated amortization 31/12/2013
Amortization DivestmentsChange in scope of
consolidation
Reclassifica-tions and other
variations
Accumulated amortization 31/12/2014
Start-up costs 20,063 1 - - (90) 19,974
Research, development and advertisting costs 37,422 375 - 33 (34) 37,796
Patents and intellectual property rights 4,454 773 - 370 (23) 5,574
Concessions, licenses, trademarks and similar rights
4,378 380 - (677) (33) 4,048
Goodwill 1,813 691 - - 428 2,932
Intangibles under development and advances - - - - - -
Other 27,423 2,724 - - (172) 29,975
Consolidation differences 22,796 2,052 - - - 24,848
Total 118,349 6,998 - (273) 76 125,147
Changes in the net book value of intangible assets for the year 2014 are detailed in the follow-ing table:
€/000
Net book value at
31/12/2013
Investment/ amortization Divestments
Change in scope of con-
solidation
Reclassifica-tions and other
variations
Net book value at
31/12/2014
Start-up costs - 2,004 - - - 2,004
Research, development and advertising costs 987 1,140 - 17 (220) 1,924
Patents and intellectual property rights 2,818 1,632 - 359 (106) 4,703
Concessions, licenses, trademarks and similar rights
4,868 1,398 - (4,192) 43 2,117
Goodwill 103 (671) - - 618 50
Intangibles under development and advances
3,329 1,486 - - (1,265) 3,550
Other 8,562 (165) - - 656 9,053
Consolidation differences 13,380 508 - - (73) 13,815
Total 34,047 7,329 - (3,817) (345) 37,216
In reference to “Consolidation differences”, the following table shows details of differences between the value of the investee and the pro-rated net equities of the subsidiaries arising on the first-time consolidation and not allocated to the assets or liabilities of the entity being con-solidated.
€/000 31/12/2013 Increases Amortization Impairment Other variations 31/12/2014
MAC/Delfo Polska and SHL 6,847 - (977) - - 5,870
Delna 6,233 238 (994) - (73) 5,404
ITLA - 1,807 - - - 1,807
Nuova Sall 301 513 (81) - - 733
Total 13,381 2,558 (2,052) - (73) 13,815
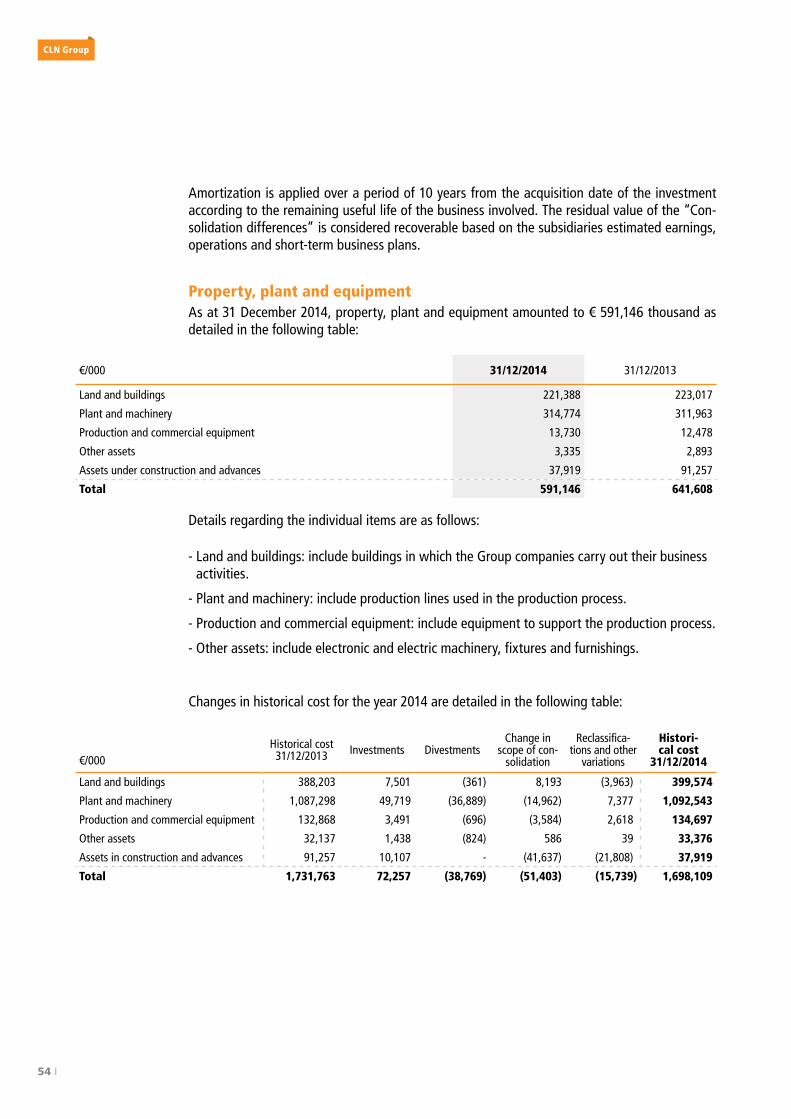
54 I
CLn Group
Amortization is applied over a period of 10 years from the acquisition date of the investment according to the remaining useful life of the business involved. The residual value of the “Con-solidation differences” is considered recoverable based on the subsidiaries estimated earnings, operations and short-term business plans.
Property, plant and equipmentAs at 31 December 2014, property, plant and equipment amounted to € 591,146 thousand as detailed in the following table:
€/000 31/12/2014 31/12/2013
Land and buildings 221,388 223,017
Plant and machinery 314,774 311,963
Production and commercial equipment 13,730 12,478
Other assets 3,335 2,893
Assets under construction and advances 37,919 91,257
Total 591,146 641,608
Details regarding the individual items are as follows:
- Land and buildings: include buildings in which the Group companies carry out their business activities.
- Plant and machinery: include production lines used in the production process.
- Production and commercial equipment: include equipment to support the production process.
- Other assets: include electronic and electric machinery, fixtures and furnishings.
Changes in historical cost for the year 2014 are detailed in the following table:
€/000 Historical cost 31/12/2013 Investments Divestments
Change in scope of con-
solidation
Reclassifica-tions and other
variations
Histori-cal cost
31/12/2014
Land and buildings 388,203 7,501 (361) 8,193 (3,963) 399,574
Plant and machinery 1,087,298 49,719 (36,889) (14,962) 7,377 1,092,543
Production and commercial equipment 132,868 3,491 (696) (3,584) 2,618 134,697
Other assets 32,137 1,438 (824) 586 39 33,376
Assets in construction and advances 91,257 10,107 - (41,637) (21,808) 37,919
Total 1,731,763 72,257 (38,769) (51,403) (15,739) 1,698,109
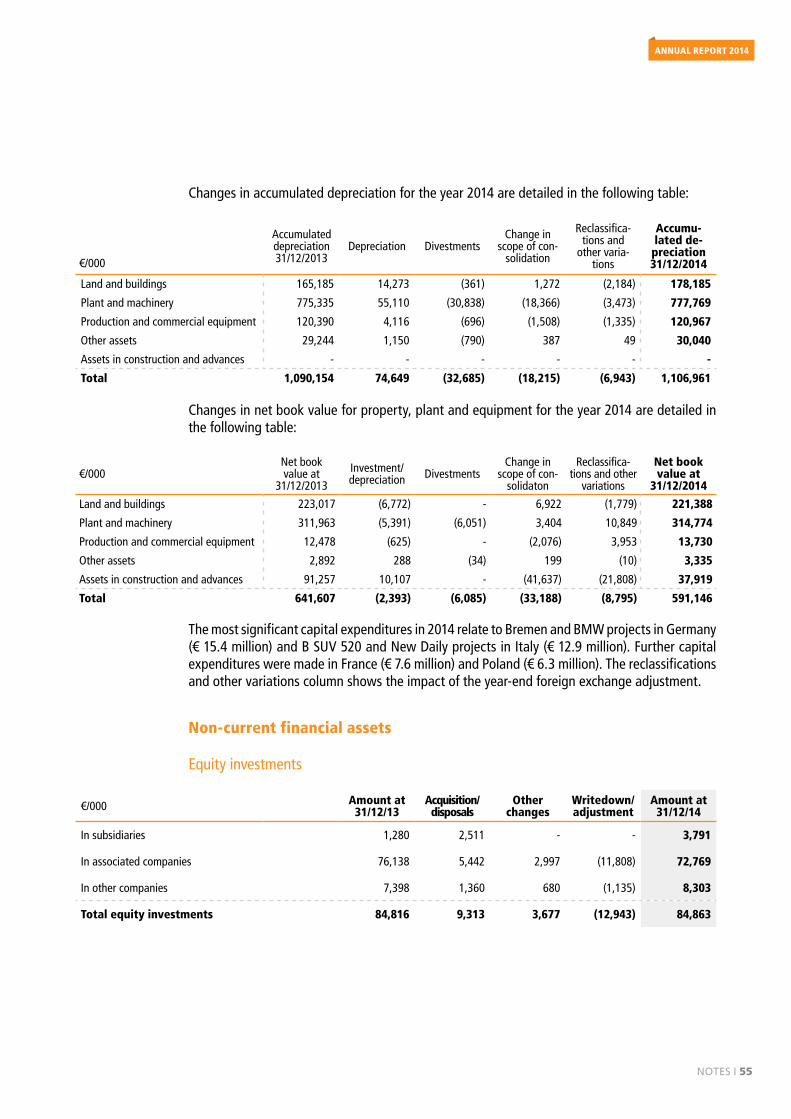
Notes I 55
AnnuAl REPORT 2014
Changes in accumulated depreciation for the year 2014 are detailed in the following table:
€/000
Accumulated depreciation 31/12/2013
Depreciation DivestmentsChange in
scope of con-solidation
Reclassifica-tions and
other varia-tions
Accumu-lated de-preciation 31/12/2014
Land and buildings 165,185 14,273 (361) 1,272 (2,184) 178,185
Plant and machinery 775,335 55,110 (30,838) (18,366) (3,473) 777,769
Production and commercial equipment 120,390 4,116 (696) (1,508) (1,335) 120,967
Other assets 29,244 1,150 (790) 387 49 30,040
Assets in construction and advances - - - - - -
Total 1,090,154 74,649 (32,685) (18,215) (6,943) 1,106,961
Changes in net book value for property, plant and equipment for the year 2014 are detailed in the following table:
€/000Net book value at
31/12/2013
Investment/ depreciation Divestments
Change in scope of con-
solidaton
Reclassifica-tions and other
variations
Net book value at
31/12/2014
Land and buildings 223,017 (6,772) - 6,922 (1,779) 221,388
Plant and machinery 311,963 (5,391) (6,051) 3,404 10,849 314,774
Production and commercial equipment 12,478 (625) - (2,076) 3,953 13,730
Other assets 2,892 288 (34) 199 (10) 3,335
Assets in construction and advances 91,257 10,107 - (41,637) (21,808) 37,919
Total 641,607 (2,393) (6,085) (33,188) (8,795) 591,146
The most significant capital expenditures in 2014 relate to Bremen and BMW projects in Germany (€ 15.4 million) and B SUV 520 and New Daily projects in Italy (€ 12.9 million). Further capital expenditures were made in France (€ 7.6 million) and Poland (€ 6.3 million). The reclassifications and other variations column shows the impact of the year-end foreign exchange adjustment.
Non-current financial assets
Equity investments
€/000 Amount at 31/12/13
Acquisition/disposals
Other changes
Writedown/ adjustment
Amount at 31/12/14
In subsidiaries 1,280 2,511 - - 3,791
In associated companies 76,138 5,442 2,997 (11,808) 72,769
In other companies 7,398 1,360 680 (1,135) 8,303
Total equity investments 84,816 9,313 3,677 (12,943) 84,863
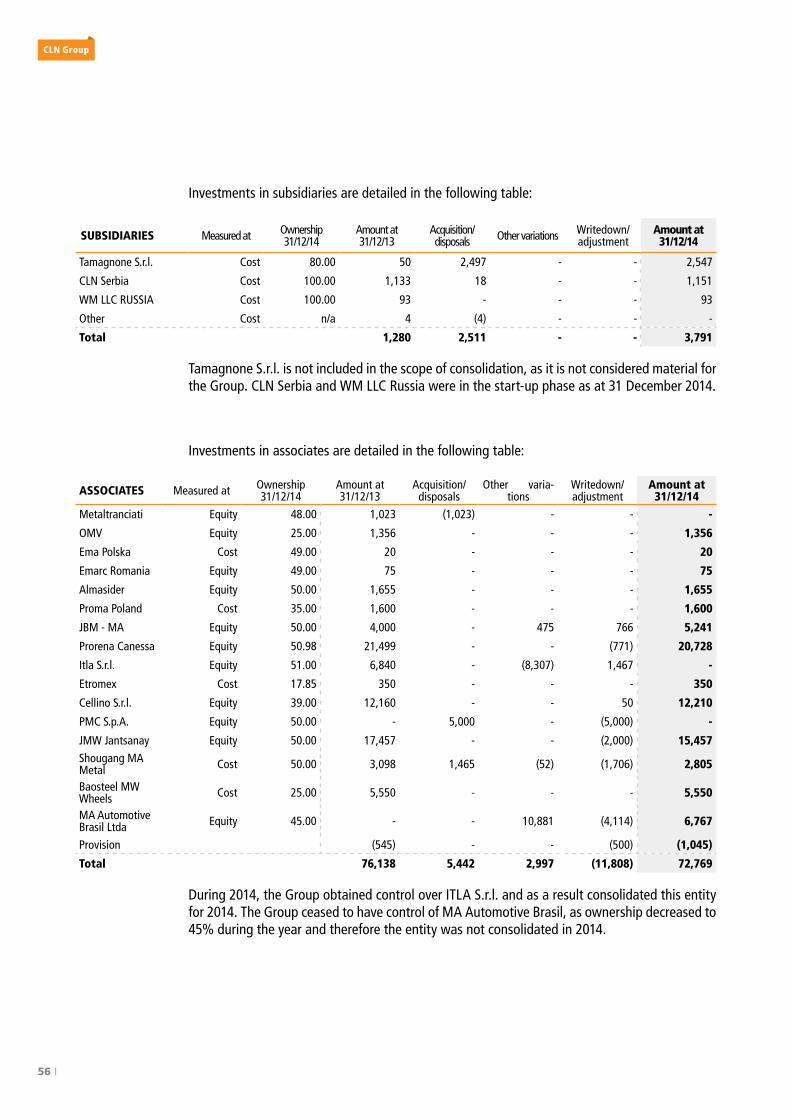
56 I
CLn Group
Investments in subsidiaries are detailed in the following table:
SUBSIDIARIES Measured at Ownership 31/12/14
Amount at 31/12/13
Acquisition/disposals Other variations Writedown/
adjustmentAmount at 31/12/14
Tamagnone S.r.l. Cost 80.00 50 2,497 - - 2,547
CLN Serbia Cost 100.00 1,133 18 - - 1,151
WM LLC RUSSIA Cost 100.00 93 - - - 93
Other Cost n/a 4 (4) - - -
Total 1,280 2,511 - - 3,791
Tamagnone S.r.l. is not included in the scope of consolidation, as it is not considered material for the Group. CLN Serbia and WM LLC Russia were in the start-up phase as at 31 December 2014.
Investments in associates are detailed in the following table:
ASSOCIATES Measured at Ownership 31/12/14
Amount at 31/12/13
Acquisition/disposals
Other varia-tions
Writedown/ adjustment
Amount at 31/12/14
Metaltranciati Equity 48.00 1,023 (1,023) - - -
OMV Equity 25.00 1,356 - - - 1,356
Ema Polska Cost 49.00 20 - - - 20
Emarc Romania Equity 49.00 75 - - - 75
Almasider Equity 50.00 1,655 - - - 1,655
Proma Poland Cost 35.00 1,600 - - - 1,600
JBM - MA Equity 50.00 4,000 - 475 766 5,241
Prorena Canessa Equity 50.98 21,499 - - (771) 20,728
Itla S.r.l. Equity 51.00 6,840 - (8,307) 1,467 -
Etromex Cost 17.85 350 - - - 350
Cellino S.r.l. Equity 39.00 12,160 - - 50 12,210
PMC S.p.A. Equity 50.00 - 5,000 - (5,000) -
JMW Jantsanay Equity 50.00 17,457 - - (2,000) 15,457Shougang MA Metal Cost 50.00 3,098 1,465 (52) (1,706) 2,805
Baosteel MW Wheels Cost 25.00 5,550 - - - 5,550
MA Automotive Brasil Ltda Equity 45.00 - - 10,881 (4,114) 6,767
Provision (545) - - (500) (1,045)
Total 76,138 5,442 2,997 (11,808) 72,769
During 2014, the Group obtained control over ITLA S.r.l. and as a result consolidated this entity for 2014. The Group ceased to have control of MA Automotive Brasil, as ownership decreased to 45% during the year and therefore the entity was not consolidated in 2014.
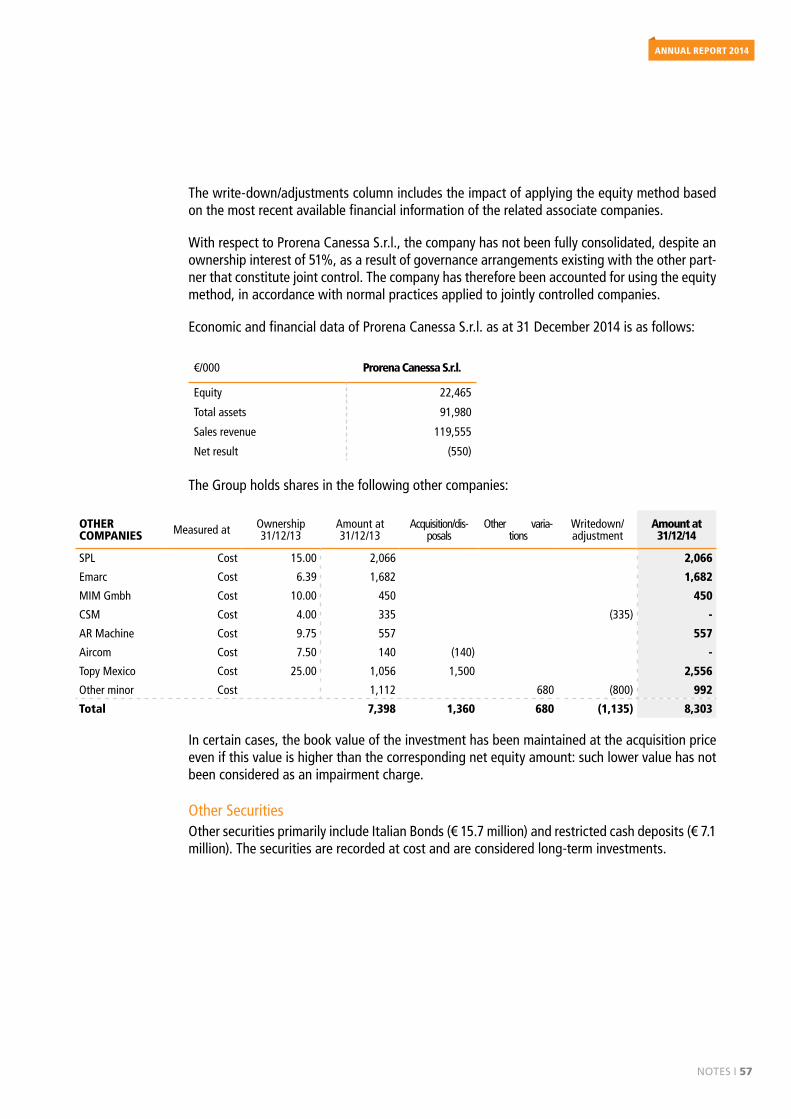
Notes I 57
AnnuAl REPORT 2014
The write-down/adjustments column includes the impact of applying the equity method based on the most recent available financial information of the related associate companies.
With respect to Prorena Canessa S.r.l., the company has not been fully consolidated, despite an ownership interest of 51%, as a result of governance arrangements existing with the other part-ner that constitute joint control. The company has therefore been accounted for using the equity method, in accordance with normal practices applied to jointly controlled companies.
Economic and financial data of Prorena Canessa S.r.l. as at 31 December 2014 is as follows:
€/000 Prorena Canessa S.r.l.
Equity 22,465
Total assets 91,980
Sales revenue 119,555
Net result (550) The Group holds shares in the following other companies:
OTHER COMPANIES Measured at Ownership
31/12/13Amount at 31/12/13
Acquisition/dis-posals
Other varia-tions
Writedown/ adjustment
Amount at 31/12/14
SPL Cost 15.00 2,066 2,066
Emarc Cost 6.39 1,682 1,682
MIM Gmbh Cost 10.00 450 450
CSM Cost 4.00 335 (335) -
AR Machine Cost 9.75 557 557
Aircom Cost 7.50 140 (140) -
Topy Mexico Cost 25.00 1,056 1,500 2,556
Other minor Cost 1,112 680 (800) 992
Total 7,398 1,360 680 (1,135) 8,303
In certain cases, the book value of the investment has been maintained at the acquisition price even if this value is higher than the corresponding net equity amount: such lower value has not been considered as an impairment charge.
Other SecuritiesOther securities primarily include Italian Bonds (€ 15.7 million) and restricted cash deposits (€ 7.1 million). The securities are recorded at cost and are considered long-term investments.
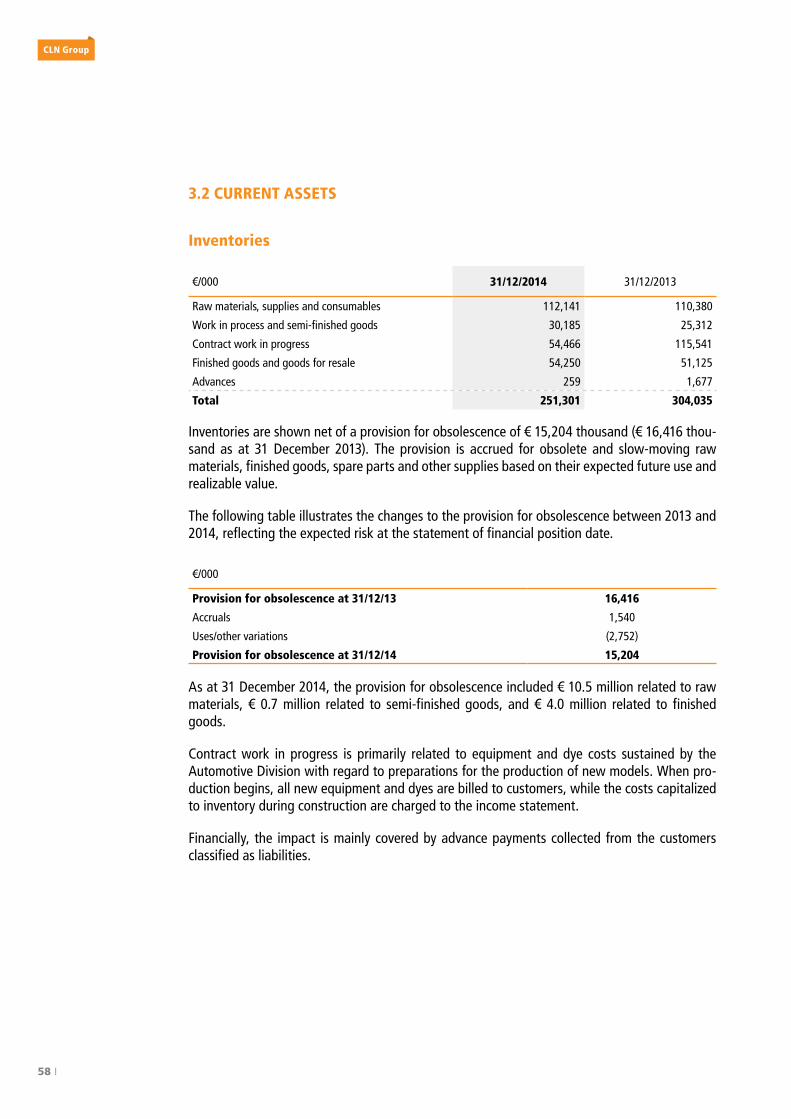
58 I
CLn Group
3.2 CURRENT ASSETS
Inventories
€/000 31/12/2014 31/12/2013
Raw materials, supplies and consumables 112,141 110,380
Work in process and semi-finished goods 30,185 25,312
Contract work in progress 54,466 115,541
Finished goods and goods for resale 54,250 51,125
Advances 259 1,677
Total 251,301 304,035
Inventories are shown net of a provision for obsolescence of € 15,204 thousand (€ 16,416 thou-sand as at 31 December 2013). The provision is accrued for obsolete and slow-moving raw materials, finished goods, spare parts and other supplies based on their expected future use and realizable value.
The following table illustrates the changes to the provision for obsolescence between 2013 and 2014, reflecting the expected risk at the statement of financial position date.
€/000
Provision for obsolescence at 31/12/13 16,416
Accruals 1,540
Uses/other variations (2,752)
Provision for obsolescence at 31/12/14 15,204
As at 31 December 2014, the provision for obsolescence included € 10.5 million related to raw materials, € 0.7 million related to semi-finished goods, and € 4.0 million related to finished goods.
Contract work in progress is primarily related to equipment and dye costs sustained by the Automotive Division with regard to preparations for the production of new models. When pro-duction begins, all new equipment and dyes are billed to customers, while the costs capitalized to inventory during construction are charged to the income statement.
Financially, the impact is mainly covered by advance payments collected from the customers classified as liabilities.
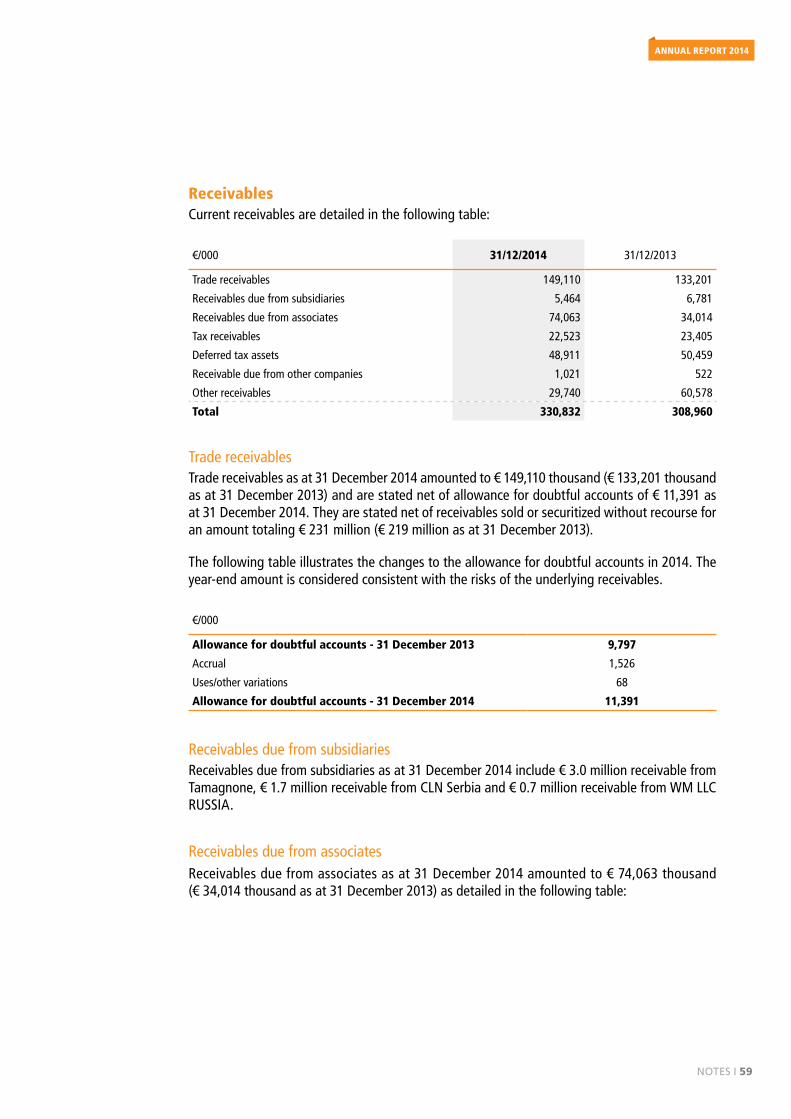
Notes I 59
AnnuAl REPORT 2014
ReceivablesCurrent receivables are detailed in the following table:
€/000 31/12/2014 31/12/2013
Trade receivables 149,110 133,201
Receivables due from subsidiaries 5,464 6,781
Receivables due from associates 74,063 34,014
Tax receivables 22,523 23,405
Deferred tax assets 48,911 50,459
Receivable due from other companies 1,021 522
Other receivables 29,740 60,578
Total 330,832 308,960
Trade receivablesTrade receivables as at 31 December 2014 amounted to € 149,110 thousand (€ 133,201 thousand as at 31 December 2013) and are stated net of allowance for doubtful accounts of € 11,391 as at 31 December 2014. They are stated net of receivables sold or securitized without recourse for an amount totaling € 231 million (€ 219 million as at 31 December 2013).
The following table illustrates the changes to the allowance for doubtful accounts in 2014. The year-end amount is considered consistent with the risks of the underlying receivables.
€/000
Allowance for doubtful accounts - 31 December 2013 9,797
Accrual 1,526
Uses/other variations 68
Allowance for doubtful accounts - 31 December 2014 11,391
Receivables due from subsidiariesReceivables due from subsidiaries as at 31 December 2014 include € 3.0 million receivable from Tamagnone, € 1.7 million receivable from CLN Serbia and € 0.7 million receivable from WM LLC RUSSIA.
Receivables due from associatesReceivables due from associates as at 31 December 2014 amounted to € 74,063 thousand (€ 34,014 thousand as at 31 December 2013) as detailed in the following table:
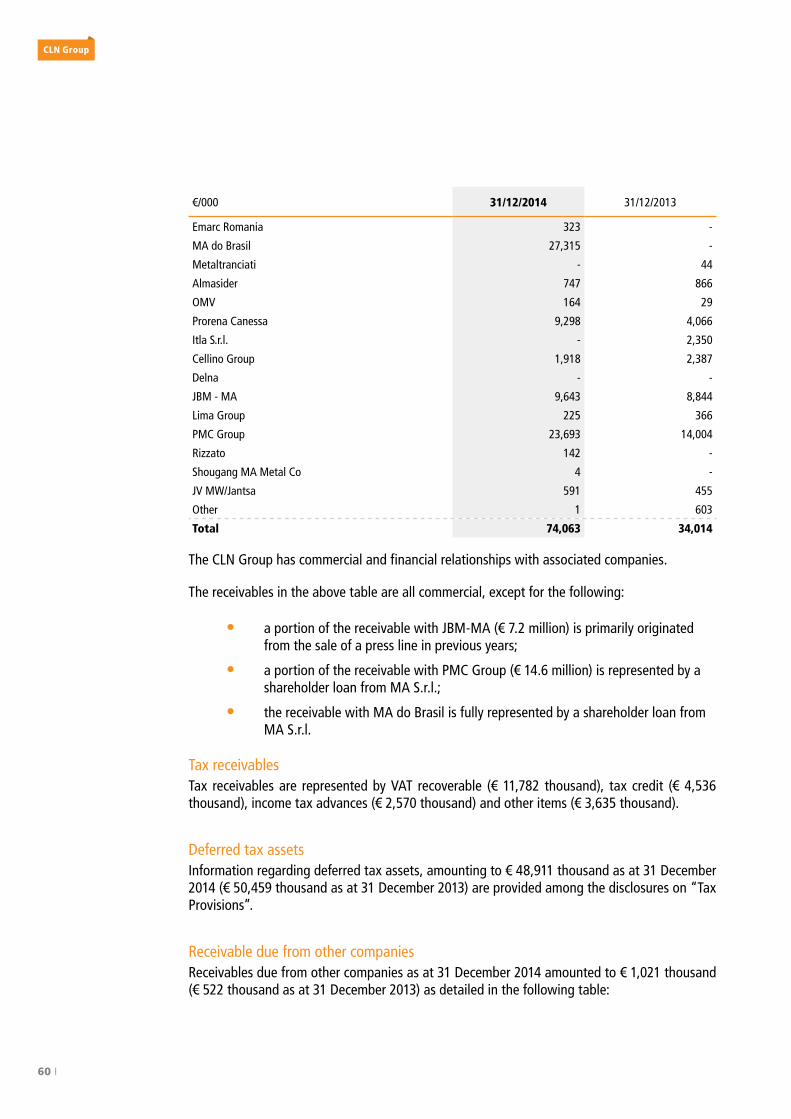
60 I
CLn Group
€/000 31/12/2014 31/12/2013
Emarc Romania 323 -
MA do Brasil 27,315 -
Metaltranciati - 44
Almasider 747 866
OMV 164 29
Prorena Canessa 9,298 4,066
Itla S.r.l. - 2,350
Cellino Group 1,918 2,387
Delna - -
JBM - MA 9,643 8,844
Lima Group 225 366
PMC Group 23,693 14,004
Rizzato 142 -
Shougang MA Metal Co 4 -
JV MW/Jantsa 591 455
Other 1 603
Total 74,063 34,014
The CLN Group has commercial and financial relationships with associated companies.
The receivables in the above table are all commercial, except for the following:
• a portion of the receivable with JBM-MA (€ 7.2 million) is primarily originated from the sale of a press line in previous years;
• a portion of the receivable with PMC Group (€ 14.6 million) is represented by a shareholder loan from MA S.r.l.;
• the receivable with MA do Brasil is fully represented by a shareholder loan from MA S.r.l.
Tax receivablesTax receivables are represented by VAT recoverable (€ 11,782 thousand), tax credit (€ 4,536 thousand), income tax advances (€ 2,570 thousand) and other items (€ 3,635 thousand).
Deferred tax assetsInformation regarding deferred tax assets, amounting to € 48,911 thousand as at 31 December 2014 (€ 50,459 thousand as at 31 December 2013) are provided among the disclosures on “Tax Provisions”.
Receivable due from other companiesReceivables due from other companies as at 31 December 2014 amounted to € 1,021 thousand (€ 522 thousand as at 31 December 2013) as detailed in the following table:
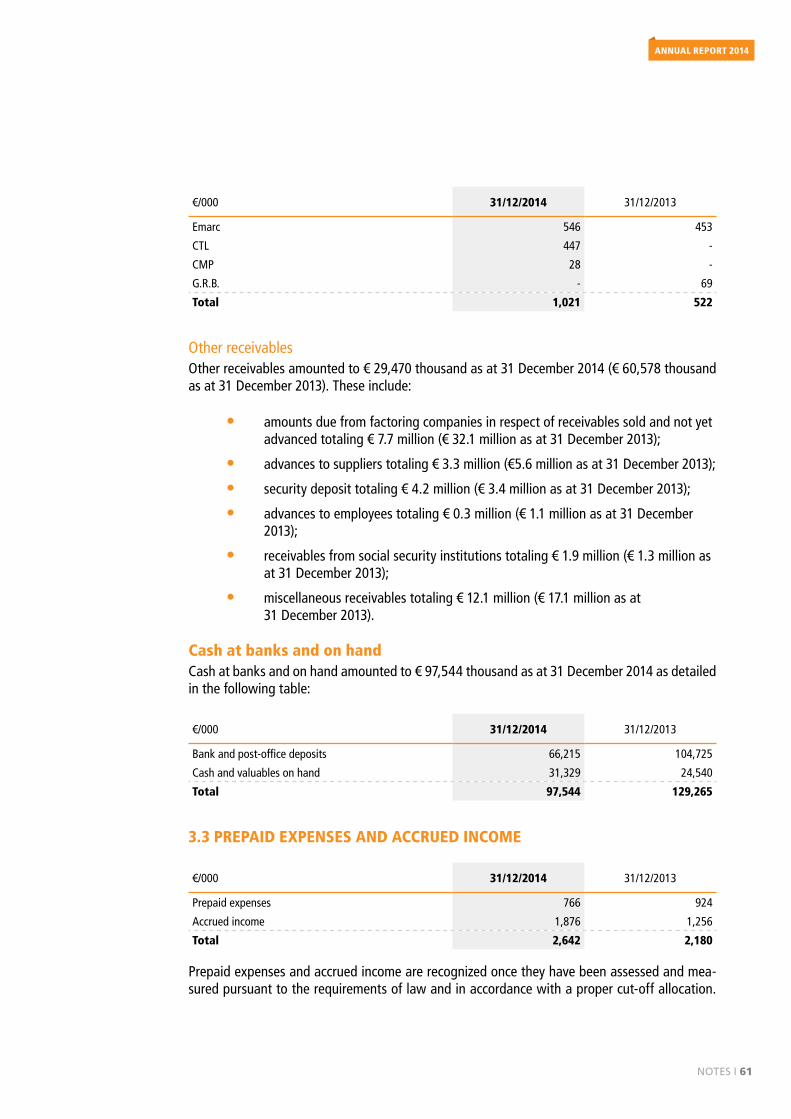
Notes I 61
AnnuAl REPORT 2014
€/000 31/12/2014 31/12/2013
Emarc 546 453
CTL 447 -
CMP 28 -
G.R.B. - 69
Total 1,021 522
Other receivablesOther receivables amounted to € 29,470 thousand as at 31 December 2014 (€ 60,578 thousand as at 31 December 2013). These include:
• amounts due from factoring companies in respect of receivables sold and not yet advanced totaling € 7.7 million (€ 32.1 million as at 31 December 2013);
• advances to suppliers totaling € 3.3 million (€5.6 million as at 31 December 2013);
• security deposit totaling € 4.2 million (€ 3.4 million as at 31 December 2013);
• advances to employees totaling € 0.3 million (€ 1.1 million as at 31 December 2013);
• receivables from social security institutions totaling € 1.9 million (€ 1.3 million as at 31 December 2013);
• miscellaneous receivables totaling € 12.1 million (€ 17.1 million as at 31 December 2013).
Cash at banks and on handCash at banks and on hand amounted to € 97,544 thousand as at 31 December 2014 as detailed in the following table:
€/000 31/12/2014 31/12/2013
Bank and post-office deposits 66,215 104,725
Cash and valuables on hand 31,329 24,540
Total 97,544 129,265
3.3 PREPAID EXPENSES AND ACCRUED INCOME
€/000 31/12/2014 31/12/2013
Prepaid expenses 766 924
Accrued income 1,876 1,256
Total 2,642 2,180
Prepaid expenses and accrued income are recognized once they have been assessed and mea-sured pursuant to the requirements of law and in accordance with a proper cut-off allocation.
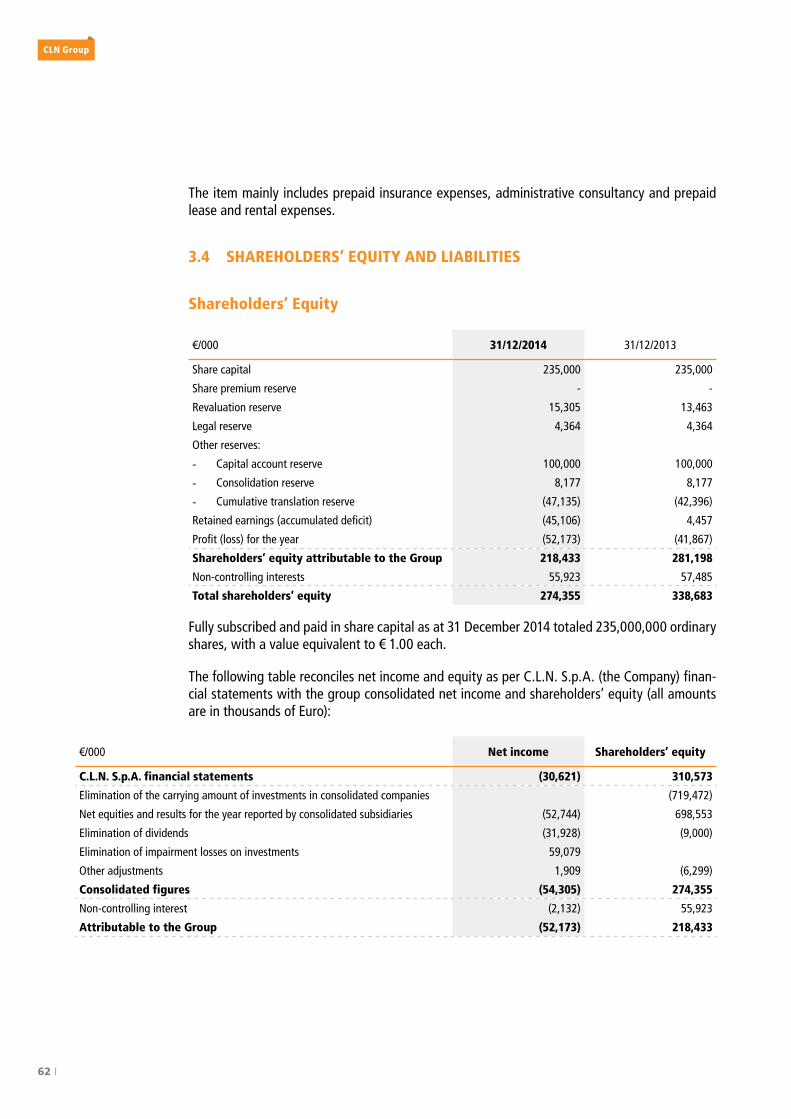
62 I
CLn Group
The item mainly includes prepaid insurance expenses, administrative consultancy and prepaid lease and rental expenses.
3.4 SHAREHOLDERS’ EQUITY AND LIABILITIES
Shareholders’ Equity
€/000 31/12/2014 31/12/2013
Share capital 235,000 235,000
Share premium reserve - -
Revaluation reserve 15,305 13,463
Legal reserve 4,364 4,364
Other reserves:
- Capital account reserve 100,000 100,000
- Consolidation reserve 8,177 8,177
- Cumulative translation reserve (47,135) (42,396)
Retained earnings (accumulated deficit) (45,106) 4,457
Profit (loss) for the year (52,173) (41,867)
Shareholders’ equity attributable to the Group 218,433 281,198
Non-controlling interests 55,923 57,485
Total shareholders’ equity 274,355 338,683
Fully subscribed and paid in share capital as at 31 December 2014 totaled 235,000,000 ordinary shares, with a value equivalent to € 1.00 each.
The following table reconciles net income and equity as per C.L.N. S.p.A. (the Company) finan-cial statements with the group consolidated net income and shareholders’ equity (all amounts are in thousands of Euro):
€/000 Net income Shareholders’ equity
C.L.N. S.p.A. financial statements (30,621) 310,573
Elimination of the carrying amount of investments in consolidated companies (719,472)
Net equities and results for the year reported by consolidated subsidiaries (52,744) 698,553
Elimination of dividends (31,928) (9,000)
Elimination of impairment losses on investments 59,079
Other adjustments 1,909 (6,299)
Consolidated figures (54,305) 274,355
Non-controlling interest (2,132) 55,923
Attributable to the Group (52,173) 218,433
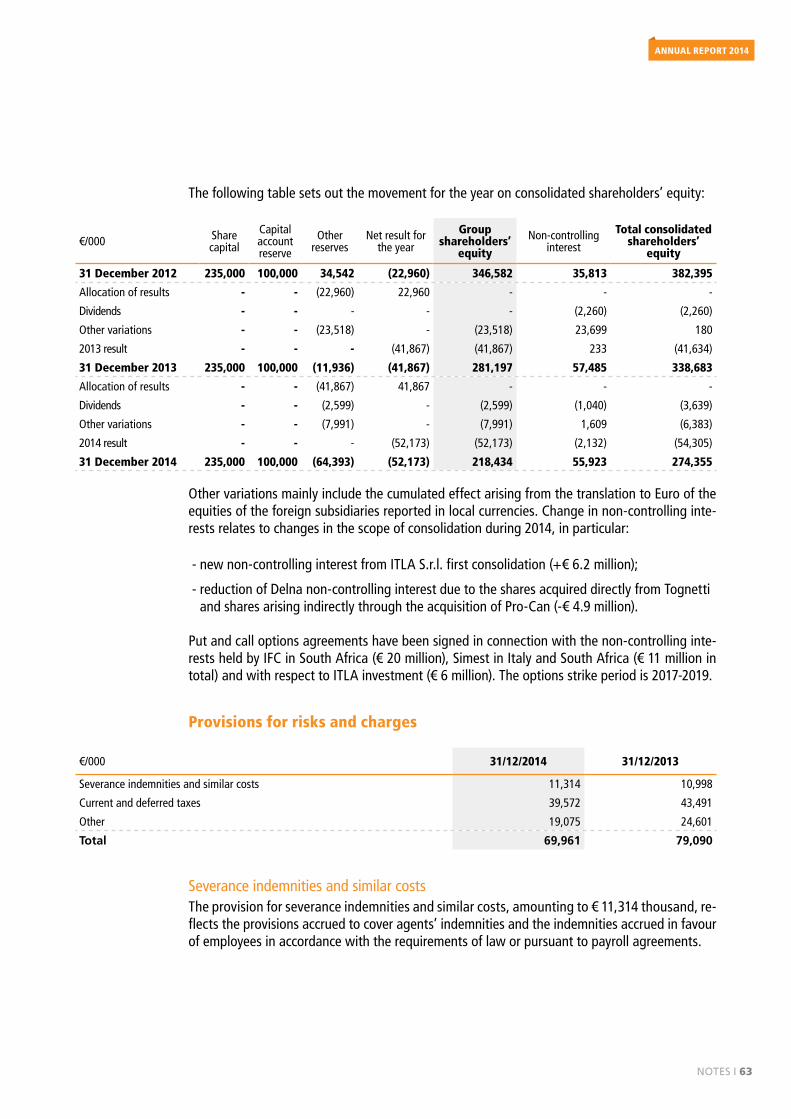
Notes I 63
AnnuAl REPORT 2014
The following table sets out the movement for the year on consolidated shareholders’ equity:
€/000 Share capital
Capital account reserve
Other reserves
Net result for the year
Group shareholders’
equity
Non-controlling interest
Total consolidated shareholders’
equity
31 December 2012 235,000 100,000 34,542 (22,960) 346,582 35,813 382,395
Allocation of results - - (22,960) 22,960 - - -
Dividends - - - - - (2,260) (2,260)
Other variations - - (23,518) - (23,518) 23,699 180
2013 result - - - (41,867) (41,867) 233 (41,634)
31 December 2013 235,000 100,000 (11,936) (41,867) 281,197 57,485 338,683
Allocation of results - - (41,867) 41,867 - - -
Dividends - - (2,599) - (2,599) (1,040) (3,639)
Other variations - - (7,991) - (7,991) 1,609 (6,383)
2014 result - - - (52,173) (52,173) (2,132) (54,305)
31 December 2014 235,000 100,000 (64,393) (52,173) 218,434 55,923 274,355
Other variations mainly include the cumulated effect arising from the translation to Euro of the equities of the foreign subsidiaries reported in local currencies. Change in non-controlling inte-rests relates to changes in the scope of consolidation during 2014, in particular:
- new non-controlling interest from ITLA S.r.l. first consolidation (+€ 6.2 million);
- reduction of Delna non-controlling interest due to the shares acquired directly from Tognetti and shares arising indirectly through the acquisition of Pro-Can (-€ 4.9 million).
Put and call options agreements have been signed in connection with the non-controlling inte-rests held by IFC in South Africa (€ 20 million), Simest in Italy and South Africa (€ 11 million in total) and with respect to ITLA investment (€ 6 million). The options strike period is 2017-2019.
Provisions for risks and charges
€/000 31/12/2014 31/12/2013
Severance indemnities and similar costs 11,314 10,998
Current and deferred taxes 39,572 43,491
Other 19,075 24,601
Total 69,961 79,090
Severance indemnities and similar costsThe provision for severance indemnities and similar costs, amounting to € 11,314 thousand, re-flects the provisions accrued to cover agents’ indemnities and the indemnities accrued in favour of employees in accordance with the requirements of law or pursuant to payroll agreements.
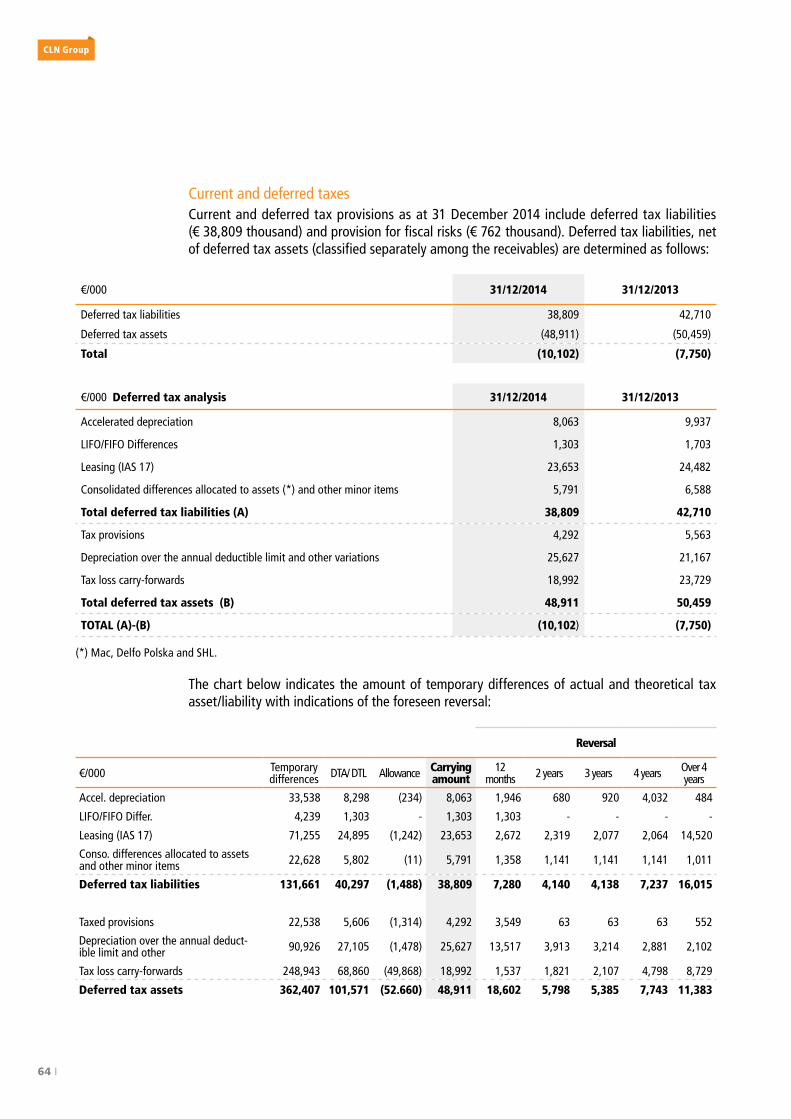
64 I
CLn Group
Current and deferred taxesCurrent and deferred tax provisions as at 31 December 2014 include deferred tax liabilities (€ 38,809 thousand) and provision for fiscal risks (€ 762 thousand). Deferred tax liabilities, net of deferred tax assets (classified separately among the receivables) are determined as follows:
€/000 31/12/2014 31/12/2013
Deferred tax liabilities 38,809 42,710
Deferred tax assets (48,911) (50,459)
Total (10,102) (7,750)
€/000 Deferred tax analysis 31/12/2014 31/12/2013
Accelerated depreciation 8,063 9,937
LIFO/FIFO Differences 1,303 1,703
Leasing (IAS 17) 23,653 24,482
Consolidated differences allocated to assets (*) and other minor items 5,791 6,588
Total deferred tax liabilities (A) 38,809 42,710
Tax provisions 4,292 5,563
Depreciation over the annual deductible limit and other variations 25,627 21,167
Tax loss carry-forwards 18,992 23,729
Total deferred tax assets (B) 48,911 50,459
TOTAL (A)-(B) (10,102) (7,750)
(*) Mac, Delfo Polska and SHL.
The chart below indicates the amount of temporary differences of actual and theoretical tax asset/liability with indications of the foreseen reversal:
Reversal
€/000 Temporary differences DTA/ DTL Allowance Carrying
amount12
months 2 years 3 years 4 years Over 4 years
Accel. depreciation 33,538 8,298 (234) 8,063 1,946 680 920 4,032 484
LIFO/FIFO Differ. 4,239 1,303 - 1,303 1,303 - - - -
Leasing (IAS 17) 71,255 24,895 (1,242) 23,653 2,672 2,319 2,077 2,064 14,520
Conso. differences allocated to assets and other minor items 22,628 5,802 (11) 5,791 1,358 1,141 1,141 1,141 1,011
Deferred tax liabilities 131,661 40,297 (1,488) 38,809 7,280 4,140 4,138 7,237 16,015
Taxed provisions 22,538 5,606 (1,314) 4,292 3,549 63 63 63 552
Depreciation over the annual deduct-ible limit and other 90,926 27,105 (1,478) 25,627 13,517 3,913 3,214 2,881 2,102
Tax loss carry-forwards 248,943 68,860 (49,868) 18,992 1,537 1,821 2,107 4,798 8,729
Deferred tax assets 362,407 101,571 (52.660) 48,911 18,602 5,798 5,385 7,743 11,383
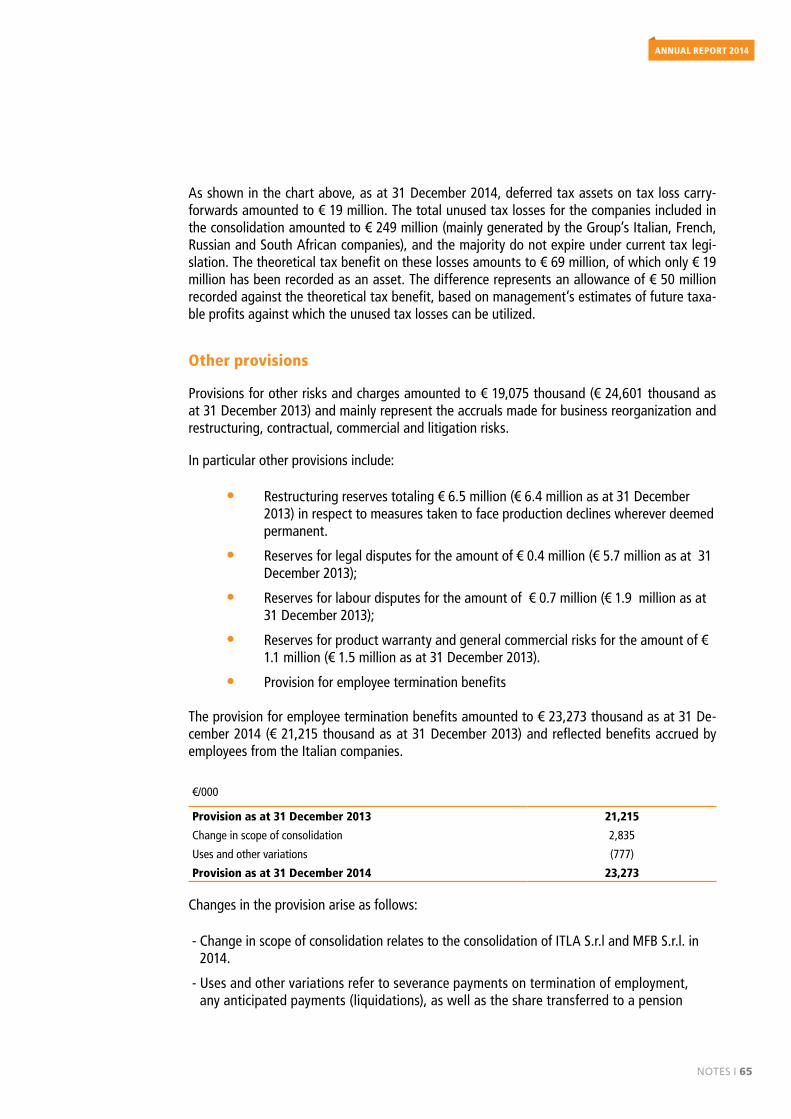
Notes I 65
AnnuAl REPORT 2014
As shown in the chart above, as at 31 December 2014, deferred tax assets on tax loss carry-forwards amounted to € 19 million. The total unused tax losses for the companies included in the consolidation amounted to € 249 million (mainly generated by the Group’s Italian, French, Russian and South African companies), and the majority do not expire under current tax legi-slation. The theoretical tax benefit on these losses amounts to € 69 million, of which only € 19 million has been recorded as an asset. The difference represents an allowance of € 50 million recorded against the theoretical tax benefit, based on management’s estimates of future taxa-ble profits against which the unused tax losses can be utilized.
Other provisions
Provisions for other risks and charges amounted to € 19,075 thousand (€ 24,601 thousand as at 31 December 2013) and mainly represent the accruals made for business reorganization and restructuring, contractual, commercial and litigation risks.
In particular other provisions include:
• Restructuring reserves totaling € 6.5 million (€ 6.4 million as at 31 December 2013) in respect to measures taken to face production declines wherever deemed permanent.
• Reserves for legal disputes for the amount of € 0.4 million (€ 5.7 million as at 31 December 2013);
• Reserves for labour disputes for the amount of € 0.7 million (€ 1.9 million as at 31 December 2013);
• Reserves for product warranty and general commercial risks for the amount of € 1.1 million (€ 1.5 million as at 31 December 2013).
• Provision for employee termination benefits
The provision for employee termination benefits amounted to € 23,273 thousand as at 31 De-cember 2014 (€ 21,215 thousand as at 31 December 2013) and reflected benefits accrued by employees from the Italian companies.
€/000
Provision as at 31 December 2013 21,215
Change in scope of consolidation 2,835
Uses and other variations (777)
Provision as at 31 December 2014 23,273
Changes in the provision arise as follows:
- Change in scope of consolidation relates to the consolidation of ITLA S.r.l and MFB S.r.l. in 2014.
- Uses and other variations refer to severance payments on termination of employment, any anticipated payments (liquidations), as well as the share transferred to a pension
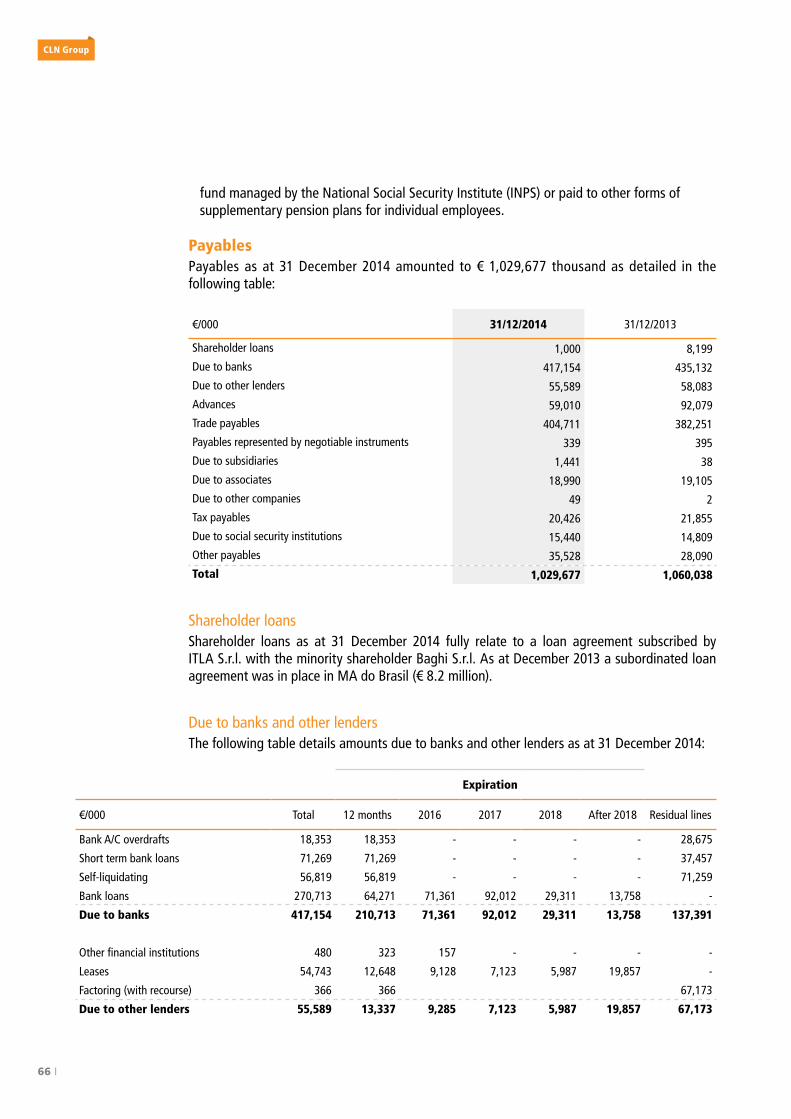
66 I
CLn Group
fund managed by the National Social Security Institute (INPS) or paid to other forms of supplementary pension plans for individual employees.
PayablesPayables as at 31 December 2014 amounted to € 1,029,677 thousand as detailed in the following table:
€/000 31/12/2014 31/12/2013
Shareholder loans 1,000 8,199
Due to banks 417,154 435,132
Due to other lenders 55,589 58,083
Advances 59,010 92,079
Trade payables 404,711 382,251
Payables represented by negotiable instruments 339 395
Due to subsidiaries 1,441 38
Due to associates 18,990 19,105
Due to other companies 49 2
Tax payables 20,426 21,855
Due to social security institutions 15,440 14,809
Other payables 35,528 28,090
Total 1,029,677 1,060,038
Shareholder loans Shareholder loans as at 31 December 2014 fully relate to a loan agreement subscribed by ITLA S.r.l. with the minority shareholder Baghi S.r.l. As at December 2013 a subordinated loan agreement was in place in MA do Brasil (€ 8.2 million).
Due to banks and other lendersThe following table details amounts due to banks and other lenders as at 31 December 2014:
Expiration
€/000 Total 12 months 2016 2017 2018 After 2018 Residual lines
Bank A/C overdrafts 18,353 18,353 - - - - 28,675
Short term bank loans 71,269 71,269 - - - - 37,457
Self-liquidating 56,819 56,819 - - - - 71,259
Bank loans 270,713 64,271 71,361 92,012 29,311 13,758 -
Due to banks 417,154 210,713 71,361 92,012 29,311 13,758 137,391
Other financial institutions 480 323 157 - - - -
Leases 54,743 12,648 9,128 7,123 5,987 19,857 -
Factoring (with recourse) 366 366 67,173
Due to other lenders 55,589 13,337 9,285 7,123 5,987 19,857 67,173
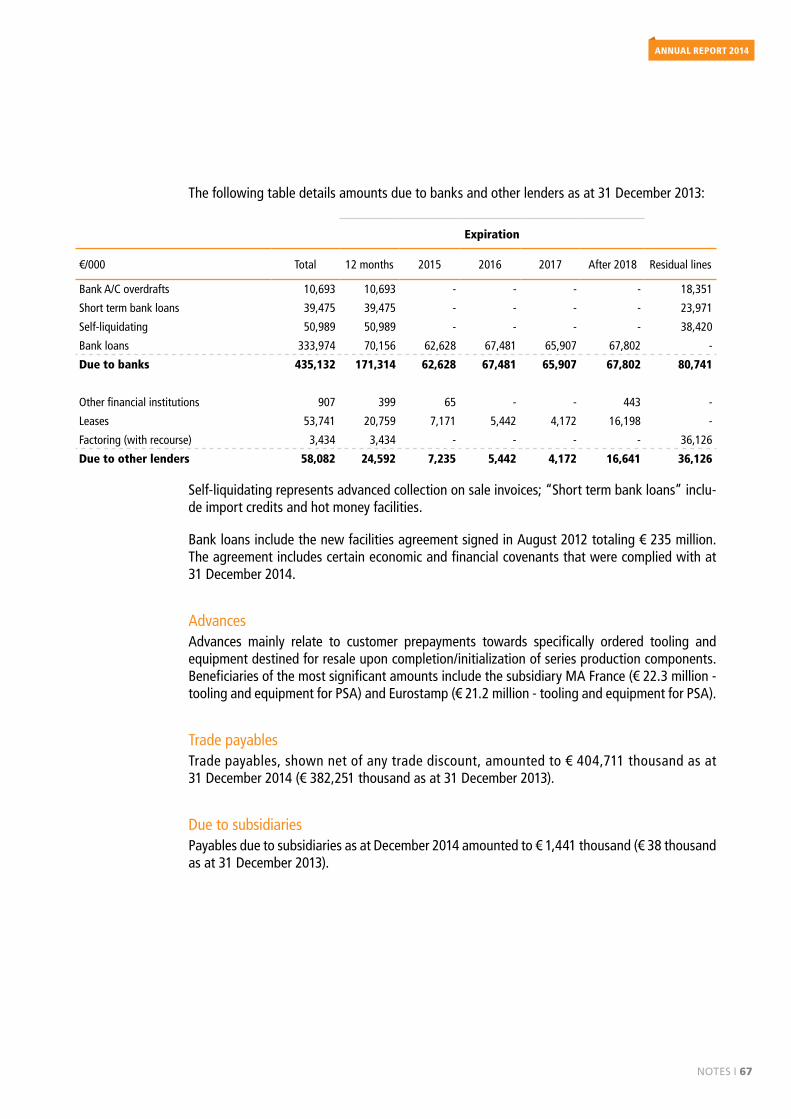
Notes I 67
AnnuAl REPORT 2014
The following table details amounts due to banks and other lenders as at 31 December 2013:
Expiration
€/000 Total 12 months 2015 2016 2017 After 2018 Residual lines
Bank A/C overdrafts 10,693 10,693 - - - - 18,351
Short term bank loans 39,475 39,475 - - - - 23,971
Self-liquidating 50,989 50,989 - - - - 38,420
Bank loans 333,974 70,156 62,628 67,481 65,907 67,802 -
Due to banks 435,132 171,314 62,628 67,481 65,907 67,802 80,741
Other financial institutions 907 399 65 - - 443 -
Leases 53,741 20,759 7,171 5,442 4,172 16,198 -
Factoring (with recourse) 3,434 3,434 - - - - 36,126
Due to other lenders 58,082 24,592 7,235 5,442 4,172 16,641 36,126
Self-liquidating represents advanced collection on sale invoices; “Short term bank loans” inclu-de import credits and hot money facilities.
Bank loans include the new facilities agreement signed in August 2012 totaling € 235 million. The agreement includes certain economic and financial covenants that were complied with at 31 December 2014.
AdvancesAdvances mainly relate to customer prepayments towards specifically ordered tooling and equipment destined for resale upon completion/initialization of series production components. Beneficiaries of the most significant amounts include the subsidiary MA France (€ 22.3 million - tooling and equipment for PSA) and Eurostamp (€ 21.2 million - tooling and equipment for PSA).
Trade payablesTrade payables, shown net of any trade discount, amounted to € 404,711 thousand as at 31 December 2014 (€ 382,251 thousand as at 31 December 2013).
Due to subsidiariesPayables due to subsidiaries as at December 2014 amounted to € 1,441 thousand (€ 38 thousand as at 31 December 2013).

68 I
CLn Group
€/000 31/12/2014 31/12/2013
Tamagnone 925 -
Claudlynn Investments (Pty) Ltd 26 -
IG Tooling Property Investments (Pty) ltd 305 -
Rensor Property (Pty) Ltd 133 -
CLN Serbia 53 38
Total 1,441 38
Due to associatesPayables due to associates as at 31 December 2014 amounted to € 18,990 thousand (€ 19,105 thousand as at 31 December 2013) as detailed in the following table:
€/000 31/12/2014 31/12/2013
Cellino Group 6,346 7,136
Itla - 277
Gruppo PMC 2,105 2,172
Lima 11 11
JV MW/JANTSA 7,147 9,475
PRORENA CANESSA 3,381 20
Other - 15
Total 18,990 19,105
The payable towards Cellino for € 4,314 thousand includes the liability arising from a financial lease agreement underwritten by Wagon Automotive S.r.l.
Other companiesPayables due to other companies as at 31 December 2014 amounted to € 49 thousand (€ 2 thousand as at 31 December 2013).
€/000 31/12/2014 31/12/2013
Emarc 7 2
CTL 4 -
CMP 38 -
Total 49 2
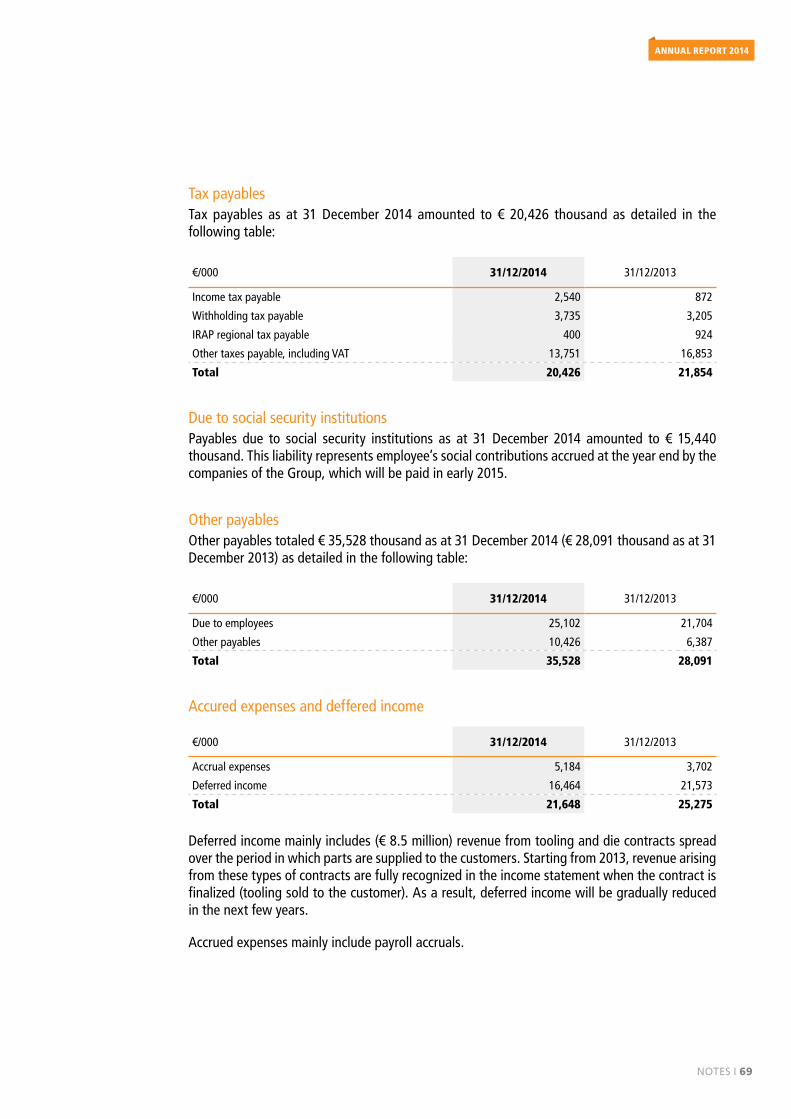
Notes I 69
AnnuAl REPORT 2014
Tax payablesTax payables as at 31 December 2014 amounted to € 20,426 thousand as detailed in the following table:
€/000 31/12/2014 31/12/2013
Income tax payable 2,540 872
Withholding tax payable 3,735 3,205
IRAP regional tax payable 400 924
Other taxes payable, including VAT 13,751 16,853
Total 20,426 21,854
Due to social security institutions Payables due to social security institutions as at 31 December 2014 amounted to € 15,440 thousand. This liability represents employee’s social contributions accrued at the year end by the companies of the Group, which will be paid in early 2015.
Other payablesOther payables totaled € 35,528 thousand as at 31 December 2014 (€ 28,091 thousand as at 31 December 2013) as detailed in the following table:
€/000 31/12/2014 31/12/2013
Due to employees 25,102 21,704
Other payables 10,426 6,387
Total 35,528 28,091
Accured expenses and deffered income
€/000 31/12/2014 31/12/2013
Accrual expenses 5,184 3,702
Deferred income 16,464 21,573
Total 21,648 25,275
Deferred income mainly includes (€ 8.5 million) revenue from tooling and die contracts spread over the period in which parts are supplied to the customers. Starting from 2013, revenue arising from these types of contracts are fully recognized in the income statement when the contract is finalized (tooling sold to the customer). As a result, deferred income will be gradually reduced in the next few years.
Accrued expenses mainly include payroll accruals.
70 I
CLn Group
3.5 MEMORANDUM ACCOUNTS
Memorandum accounts are fully disclosed in the Consolidated Financial Statements.
Corporate guarantees amounted to € 120.9 million and have been provided to the following third parties:
• banks and other lenders: € 75.7 million;
• Simest: € 40.4 million;
• others (mainly VAT and customs agencies): € 4.8 million.
Commitments from derivative instruments relate mainly to the following:
• interest rate swap agreements (notional amount of € 128 million; mark to market value of negative € 2.3 million) entered into by C.L.N. S.p.A. in connection with the club deal loan agreement subscribed in 2012;
• interest rate swap agreement subscribed by C.L.N. S.p.A. in connection with a loan agreement with BPM signed in late 2014 (notional amount of € 7.3 million);
• forward currency agreements (€ 21 million) subscribed by Delfo Polska and UMC to hedge the risk of foreign exchange on payments of steel supplies.
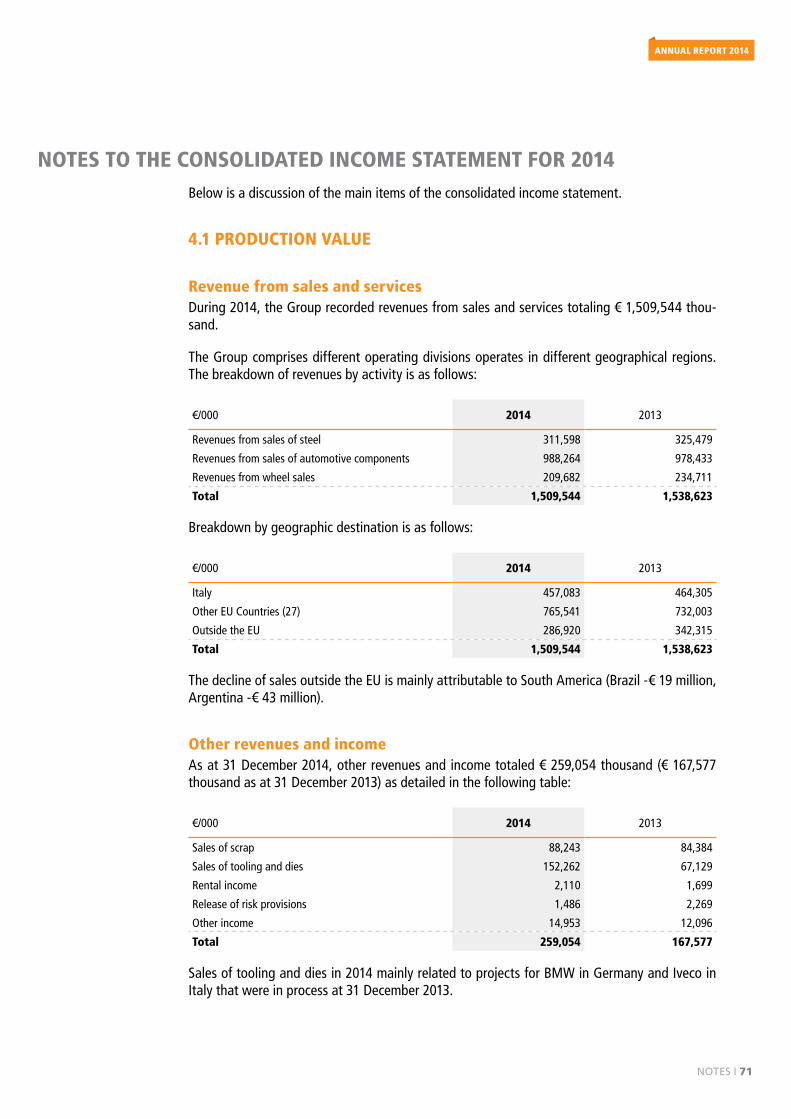
Notes I 71
AnnuAl REPORT 2014
NOTES TO THE CONSOLIDATED INCOME STATEMENT FOR 2014Below is a discussion of the main items of the consolidated income statement.
4.1 PRODUCTION VALUE
Revenue from sales and servicesDuring 2014, the Group recorded revenues from sales and services totaling € 1,509,544 thou-sand.
The Group comprises different operating divisions operates in different geographical regions. The breakdown of revenues by activity is as follows:
€/000 2014 2013
Revenues from sales of steel 311,598 325,479
Revenues from sales of automotive components 988,264 978,433
Revenues from wheel sales 209,682 234,711
Total 1,509,544 1,538,623
Breakdown by geographic destination is as follows:
€/000 2014 2013
Italy 457,083 464,305
Other EU Countries (27) 765,541 732,003
Outside the EU 286,920 342,315
Total 1,509,544 1,538,623
The decline of sales outside the EU is mainly attributable to South America (Brazil -€ 19 million, Argentina -€ 43 million).
Other revenues and incomeAs at 31 December 2014, other revenues and income totaled € 259,054 thousand (€ 167,577 thousand as at 31 December 2013) as detailed in the following table:
€/000 2014 2013
Sales of scrap 88,243 84,384
Sales of tooling and dies 152,262 67,129
Rental income 2,110 1,699
Release of risk provisions 1,486 2,269
Other income 14,953 12,096
Total 259,054 167,577
Sales of tooling and dies in 2014 mainly related to projects for BMW in Germany and Iveco in Italy that were in process at 31 December 2013.
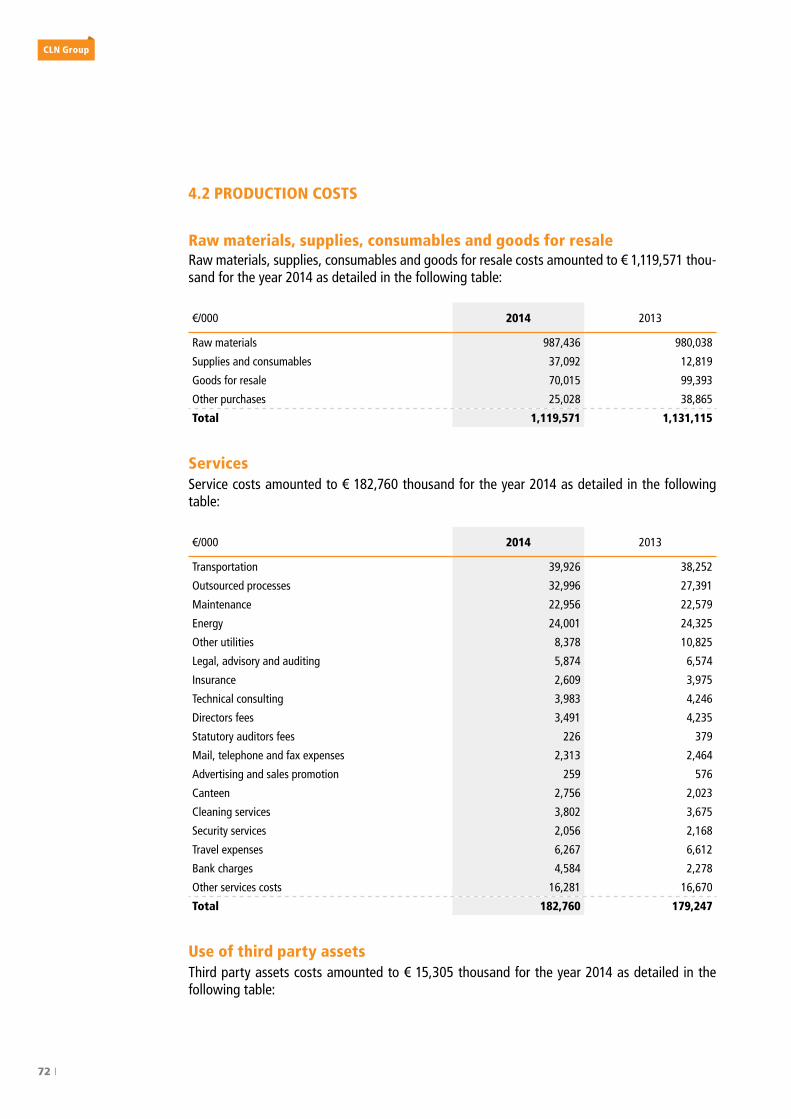
72 I
CLn Group
4.2 PRODUCTION COSTS
Raw materials, supplies, consumables and goods for resaleRaw materials, supplies, consumables and goods for resale costs amounted to € 1,119,571 thou-sand for the year 2014 as detailed in the following table:
€/000 2014 2013
Raw materials 987,436 980,038
Supplies and consumables 37,092 12,819
Goods for resale 70,015 99,393
Other purchases 25,028 38,865
Total 1,119,571 1,131,115
ServicesService costs amounted to € 182,760 thousand for the year 2014 as detailed in the following table:
€/000 2014 2013
Transportation 39,926 38,252
Outsourced processes 32,996 27,391
Maintenance 22,956 22,579
Energy 24,001 24,325
Other utilities 8,378 10,825
Legal, advisory and auditing 5,874 6,574
Insurance 2,609 3,975
Technical consulting 3,983 4,246
Directors fees 3,491 4,235
Statutory auditors fees 226 379
Mail, telephone and fax expenses 2,313 2,464
Advertising and sales promotion 259 576
Canteen 2,756 2,023
Cleaning services 3,802 3,675
Security services 2,056 2,168
Travel expenses 6,267 6,612
Bank charges 4,584 2,278
Other services costs 16,281 16,670
Total 182,760 179,247
Use of third party assetsThird party assets costs amounted to € 15,305 thousand for the year 2014 as detailed in the following table:
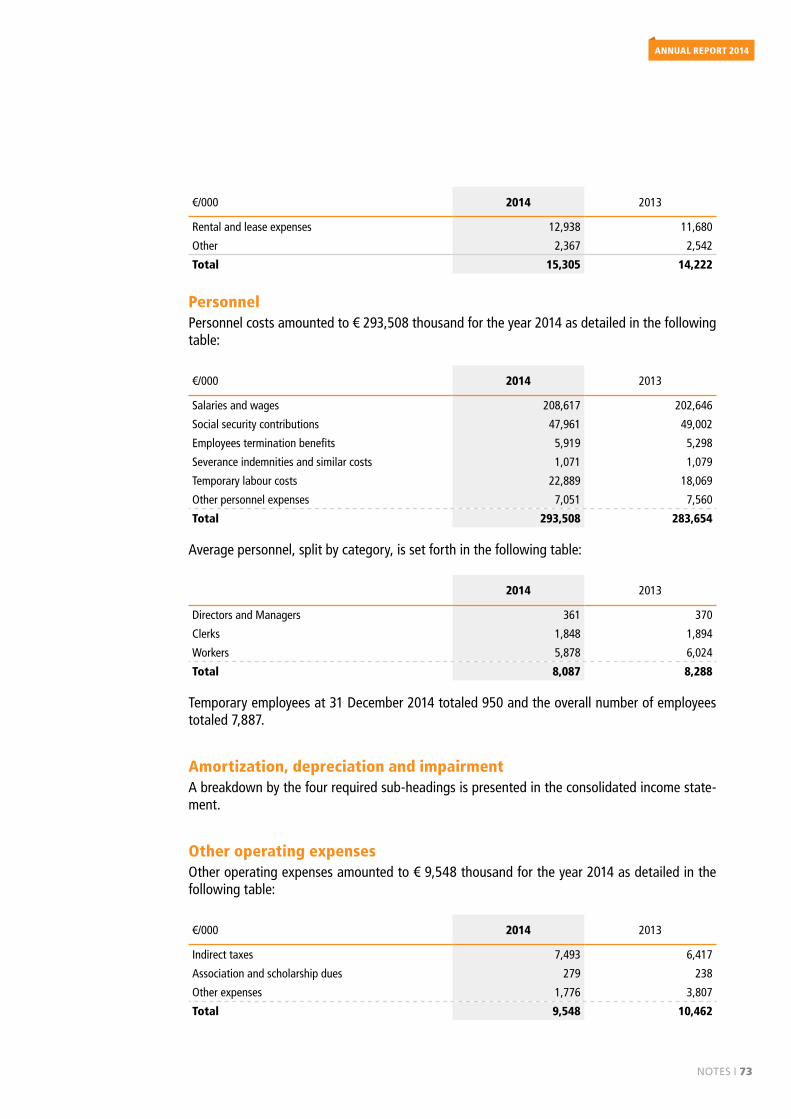
Notes I 73
AnnuAl REPORT 2014
€/000 2014 2013
Rental and lease expenses 12,938 11,680
Other 2,367 2,542
Total 15,305 14,222
PersonnelPersonnel costs amounted to € 293,508 thousand for the year 2014 as detailed in the following table:
€/000 2014 2013
Salaries and wages 208,617 202,646
Social security contributions 47,961 49,002
Employees termination benefits 5,919 5,298
Severance indemnities and similar costs 1,071 1,079
Temporary labour costs 22,889 18,069
Other personnel expenses 7,051 7,560
Total 293,508 283,654
Average personnel, split by category, is set forth in the following table:
2014 2013
Directors and Managers 361 370
Clerks 1,848 1,894
Workers 5,878 6,024
Total 8,087 8,288
Temporary employees at 31 December 2014 totaled 950 and the overall number of employees totaled 7,887.
Amortization, depreciation and impairmentA breakdown by the four required sub-headings is presented in the consolidated income state-ment.
Other operating expenses Other operating expenses amounted to € 9,548 thousand for the year 2014 as detailed in the following table:
€/000 2014 2013
Indirect taxes 7,493 6,417
Association and scholarship dues 279 238
Other expenses 1,776 3,807
Total 9,548 10,462
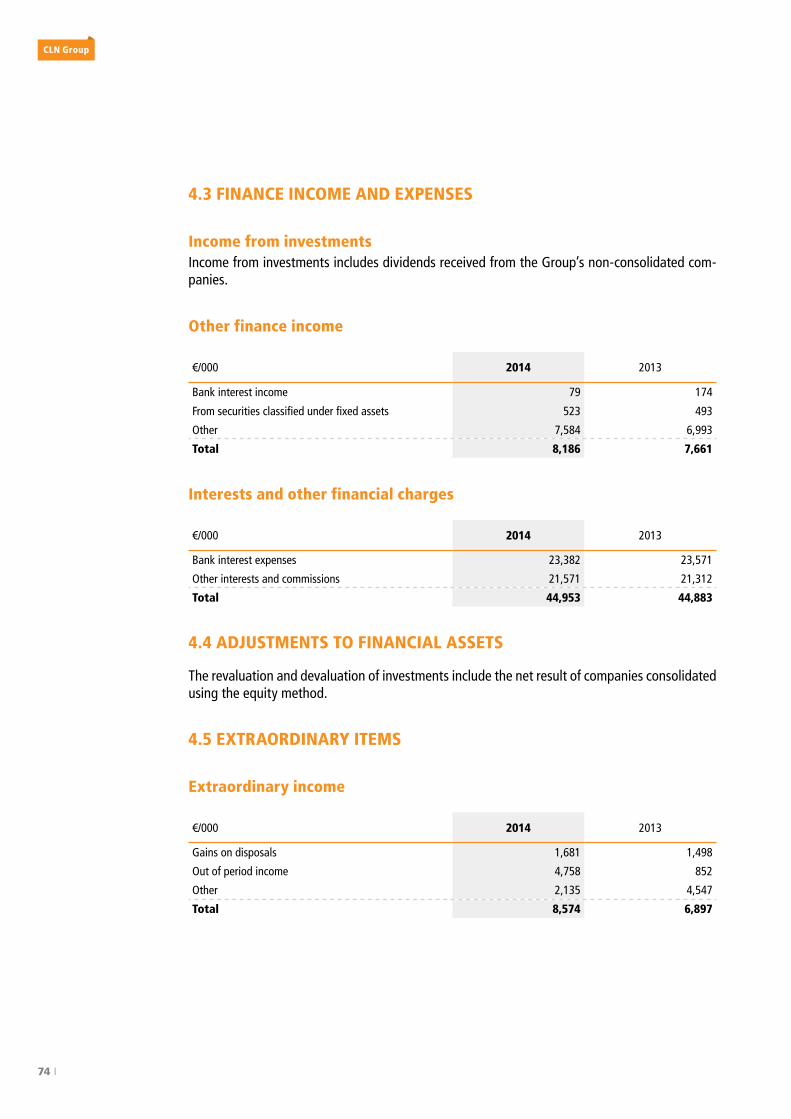
74 I
CLn Group
4.3 FINANCE INCOME AND EXPENSES
Income from investmentsIncome from investments includes dividends received from the Group’s non-consolidated com-panies.
Other finance income
€/000 2014 2013
Bank interest income 79 174
From securities classified under fixed assets 523 493
Other 7,584 6,993
Total 8,186 7,661
Interests and other financial charges
€/000 2014 2013
Bank interest expenses 23,382 23,571
Other interests and commissions 21,571 21,312
Total 44,953 44,883
4.4 ADJUSTMENTS TO FINANCIAL ASSETS
The revaluation and devaluation of investments include the net result of companies consolidated using the equity method.
4.5 EXTRAORDINARY ITEMS
Extraordinary income
€/000 2014 2013
Gains on disposals 1,681 1,498
Out of period income 4,758 852
Other 2,135 4,547
Total 8,574 6,897
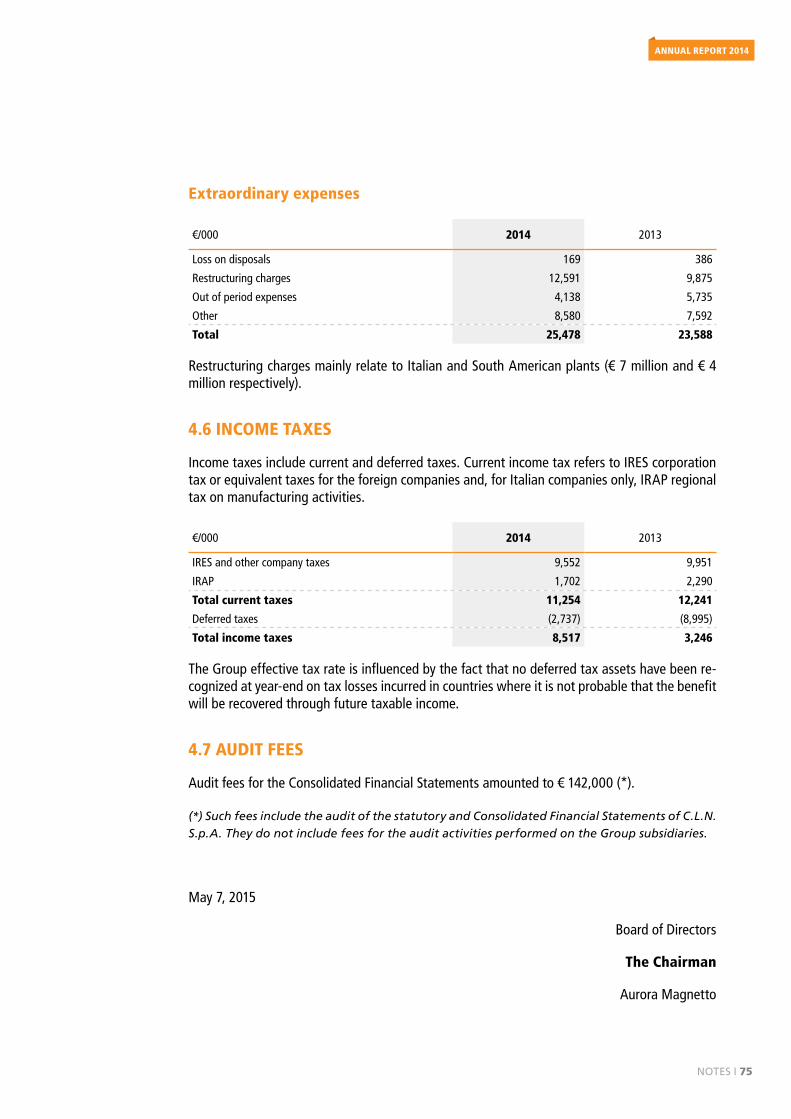
Notes I 75
AnnuAl REPORT 2014
Extraordinary expenses
€/000 2014 2013
Loss on disposals 169 386
Restructuring charges 12,591 9,875
Out of period expenses 4,138 5,735
Other 8,580 7,592
Total 25,478 23,588
Restructuring charges mainly relate to Italian and South American plants (€ 7 million and € 4 million respectively).
4.6 INCOME TAXES
Income taxes include current and deferred taxes. Current income tax refers to IRES corporation tax or equivalent taxes for the foreign companies and, for Italian companies only, IRAP regional tax on manufacturing activities.
€/000 2014 2013
IRES and other company taxes 9,552 9,951
IRAP 1,702 2,290
Total current taxes 11,254 12,241
Deferred taxes (2,737) (8,995)
Total income taxes 8,517 3,246
The Group effective tax rate is influenced by the fact that no deferred tax assets have been re-cognized at year-end on tax losses incurred in countries where it is not probable that the benefit will be recovered through future taxable income.
4.7 AUDIT FEES
Audit fees for the Consolidated Financial Statements amounted to € 142,000 (*).
(*) Such fees include the audit of the statutory and Consolidated Financial Statements of C.L.N. S.p.A. They do not include fees for the audit activities performed on the Group subsidiaries.
May 7, 2015
Board of Directors
The Chairman
Aurora Magnetto
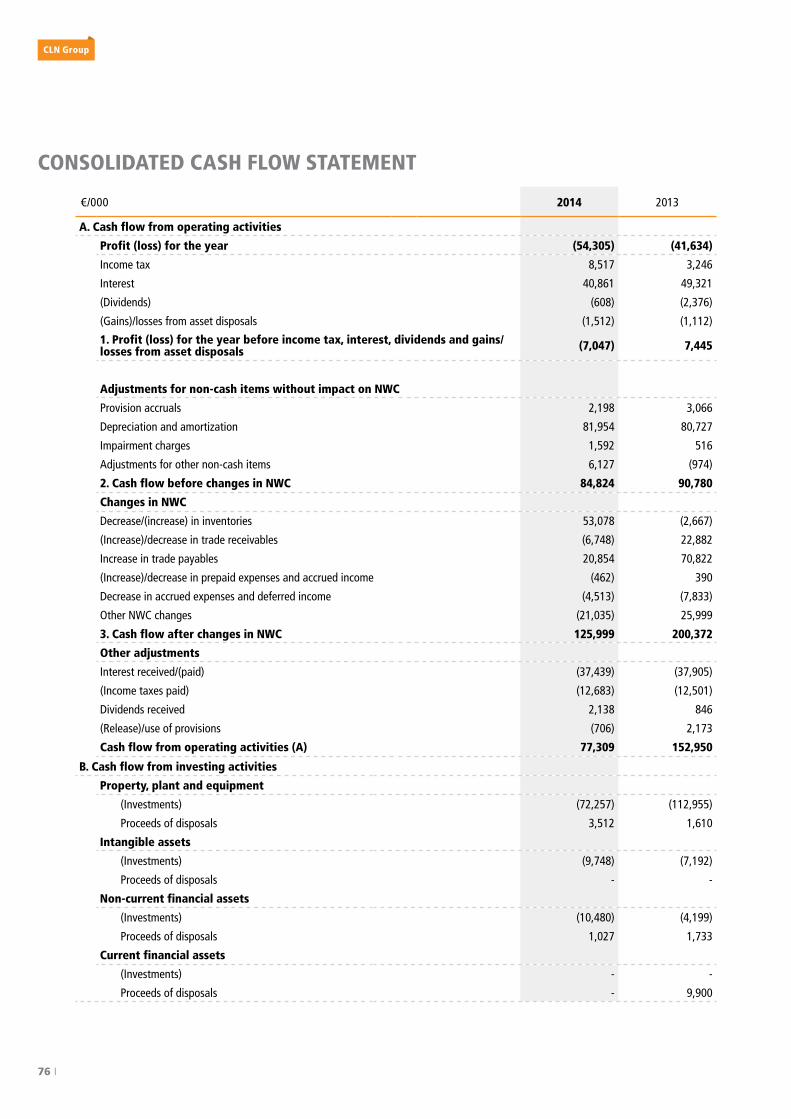
76 I
CLn Group
CONSOLIDATED CASH FLOW STATEMENT
€/000 2014 2013
A. Cash flow from operating activities
Profit (loss) for the year (54,305) (41,634)
Income tax 8,517 3,246
Interest 40,861 49,321
(Dividends) (608) (2,376)
(Gains)/losses from asset disposals (1,512) (1,112)
1. Profit (loss) for the year before income tax, interest, dividends and gains/losses from asset disposals (7,047) 7,445
Adjustments for non-cash items without impact on NWC
Provision accruals 2,198 3,066
Depreciation and amortization 81,954 80,727
Impairment charges 1,592 516
Adjustments for other non-cash items 6,127 (974)
2. Cash flow before changes in NWC 84,824 90,780
Changes in NWC
Decrease/(increase) in inventories 53,078 (2,667)
(Increase)/decrease in trade receivables (6,748) 22,882
Increase in trade payables 20,854 70,822
(Increase)/decrease in prepaid expenses and accrued income (462) 390
Decrease in accrued expenses and deferred income (4,513) (7,833)
Other NWC changes (21,035) 25,999
3. Cash flow after changes in NWC 125,999 200,372
Other adjustments
Interest received/(paid) (37,439) (37,905)
(Income taxes paid) (12,683) (12,501)
Dividends received 2,138 846
(Release)/use of provisions (706) 2,173
Cash flow from operating activities (A) 77,309 152,950
B. Cash flow from investing activities
Property, plant and equipment
(Investments) (72,257) (112,955)
Proceeds of disposals 3,512 1,610
Intangible assets
(Investments) (9,748) (7,192)
Proceeds of disposals - -
Non-current financial assets
(Investments) (10,480) (4,199)
Proceeds of disposals 1,027 1,733
Current financial assets
(Investments) - -
Proceeds of disposals - 9,900
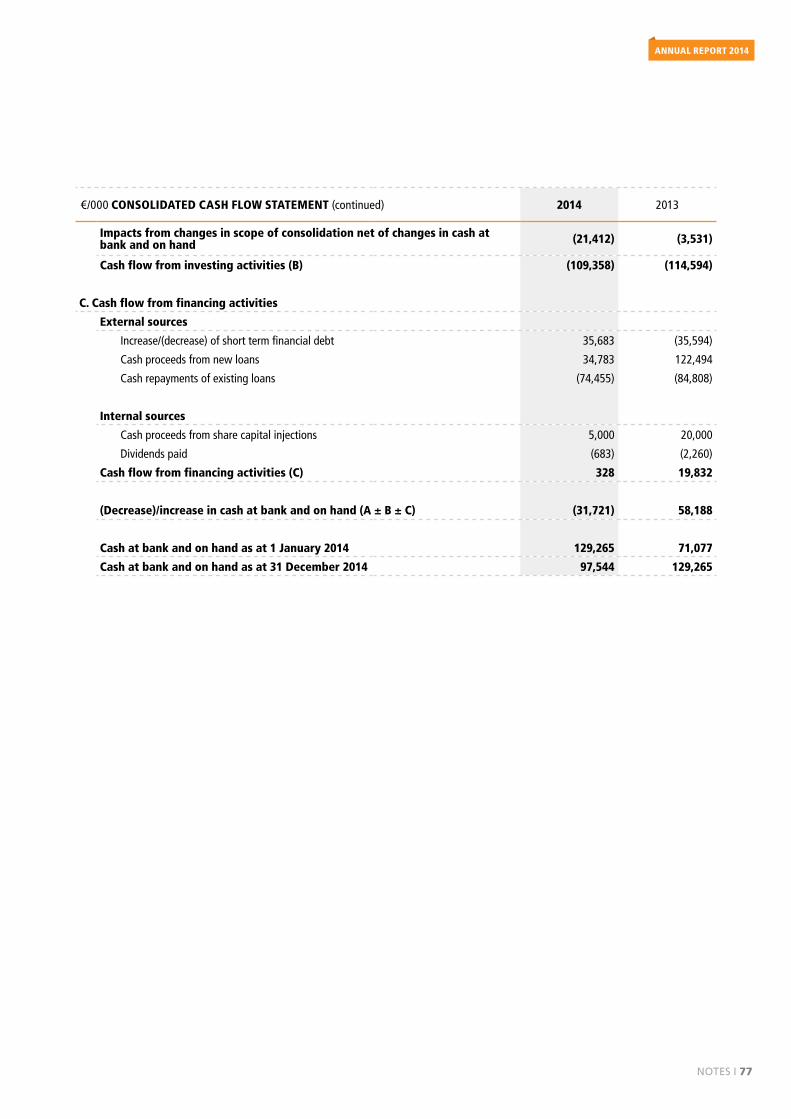
Notes I 77
AnnuAl REPORT 2014
€/000 CONSOLIDATED CASH FLOW STATEMENT (continued) 2014 2013
Impacts from changes in scope of consolidation net of changes in cash at bank and on hand (21,412) (3,531)
Cash flow from investing activities (B) (109,358) (114,594)
C. Cash flow from financing activities
External sources
Increase/(decrease) of short term financial debt 35,683 (35,594)
Cash proceeds from new loans 34,783 122,494
Cash repayments of existing loans (74,455) (84,808)
Internal sources
Cash proceeds from share capital injections 5,000 20,000
Dividends paid (683) (2,260)
Cash flow from financing activities (C) 328 19,832
(Decrease)/increase in cash at bank and on hand (A ± B ± C) (31,721) 58,188
Cash at bank and on hand as at 1 January 2014 129,265 71,077
Cash at bank and on hand as at 31 December 2014 97,544 129,265
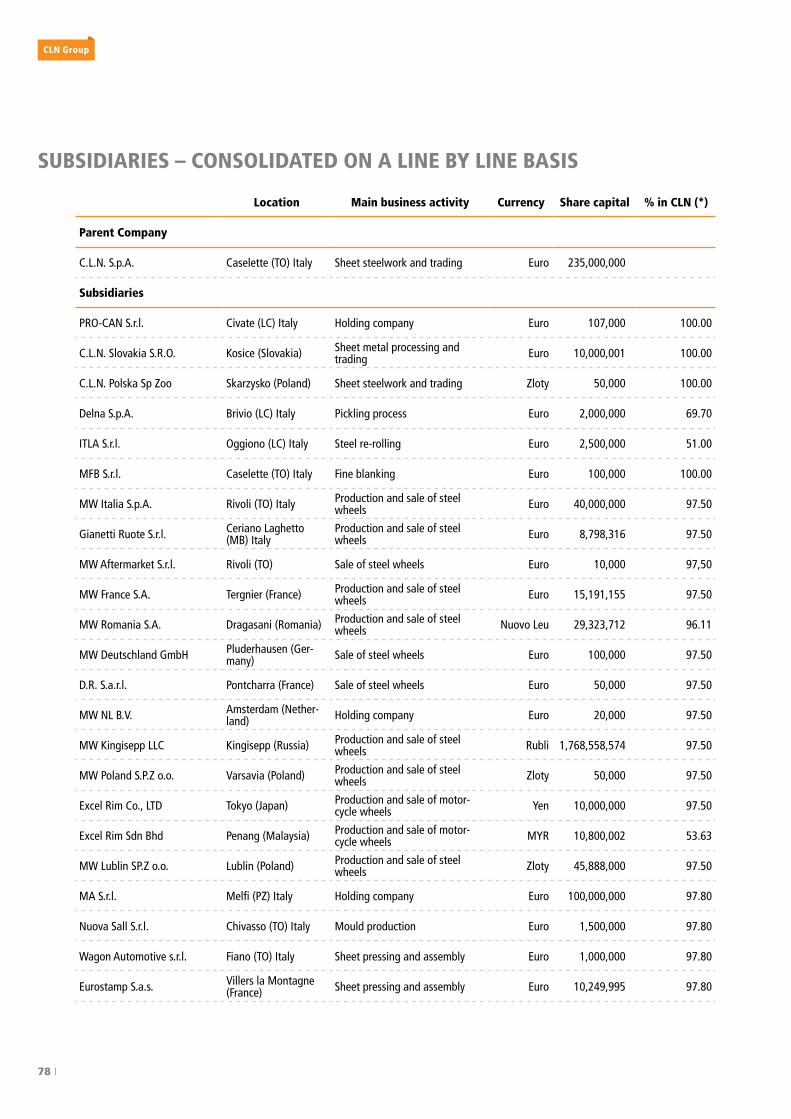
78 I
CLn Group
SUBSIDIARIES – CONSOLIDATED ON A LINE BY LINE BASIS
Location Main business activity Currency Share capital % in CLN (*)
Parent Company
C.L.N. S.p.A. Caselette (TO) Italy Sheet steelwork and trading Euro 235,000,000
Subsidiaries
PRO-CAN S.r.l. Civate (LC) Italy Holding company Euro 107,000 100.00
C.L.N. Slovakia S.R.O. Kosice (Slovakia) Sheet metal processing and trading Euro 10,000,001 100.00
C.L.N. Polska Sp Zoo Skarzysko (Poland) Sheet steelwork and trading Zloty 50,000 100.00
Delna S.p.A. Brivio (LC) Italy Pickling process Euro 2,000,000 69.70
ITLA S.r.l. Oggiono (LC) Italy Steel re-rolling Euro 2,500,000 51.00
MFB S.r.l. Caselette (TO) Italy Fine blanking Euro 100,000 100.00
MW Italia S.p.A. Rivoli (TO) Italy Production and sale of steel wheels Euro 40,000,000 97.50
Gianetti Ruote S.r.l. Ceriano Laghetto (MB) Italy
Production and sale of steel wheels Euro 8,798,316 97.50
MW Aftermarket S.r.l. Rivoli (TO) Sale of steel wheels Euro 10,000 97,50
MW France S.A. Tergnier (France) Production and sale of steel wheels Euro 15,191,155 97.50
MW Romania S.A. Dragasani (Romania) Production and sale of steel wheels Nuovo Leu 29,323,712 96.11
MW Deutschland GmbH Pluderhausen (Ger-many) Sale of steel wheels Euro 100,000 97.50
D.R. S.a.r.l. Pontcharra (France) Sale of steel wheels Euro 50,000 97.50
MW NL B.V. Amsterdam (Nether-land) Holding company Euro 20,000 97.50
MW Kingisepp LLC Kingisepp (Russia) Production and sale of steel wheels Rubli 1,768,558,574 97.50
MW Poland S.P.Z o.o. Varsavia (Poland) Production and sale of steel wheels Zloty 50,000 97.50
Excel Rim Co., LTD Tokyo (Japan) Production and sale of motor-cycle wheels Yen 10,000,000 97.50
Excel Rim Sdn Bhd Penang (Malaysia) Production and sale of motor-cycle wheels MYR 10,800,002 53.63
MW Lublin SP.Z o.o. Lublin (Poland) Production and sale of steel wheels Zloty 45,888,000 97.50
MA S.r.l. Melfi (PZ) Italy Holding company Euro 100,000,000 97.80
Nuova Sall S.r.l. Chivasso (TO) Italy Mould production Euro 1,500,000 97.80
Wagon Automotive s.r.l. Fiano (TO) Italy Sheet pressing and assembly Euro 1,000,000 97.80
Eurostamp S.a.s. Villers la Montagne (France) Sheet pressing and assembly Euro 10,249,995 97.80
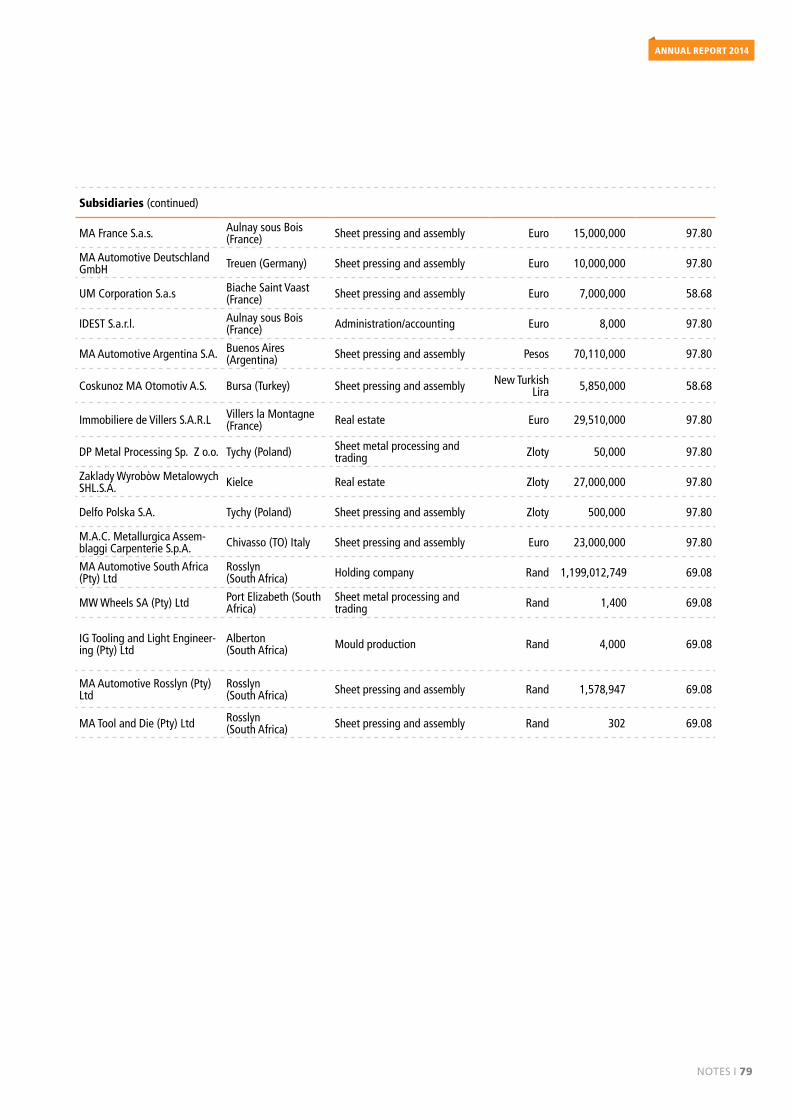
Notes I 79
AnnuAl REPORT 2014
Subsidiaries (continued)
MA France S.a.s. Aulnay sous Bois (France) Sheet pressing and assembly Euro 15,000,000 97.80
MA Automotive Deutschland GmbH Treuen (Germany) Sheet pressing and assembly Euro 10,000,000 97.80
UM Corporation S.a.s Biache Saint Vaast (France) Sheet pressing and assembly Euro 7,000,000 58.68
IDEST S.a.r.l. Aulnay sous Bois (France) Administration/accounting Euro 8,000 97.80
MA Automotive Argentina S.A. Buenos Aires (Argentina) Sheet pressing and assembly Pesos 70,110,000 97.80
Coskunoz MA Otomotiv A.S. Bursa (Turkey) Sheet pressing and assembly New Turkish Lira 5,850,000 58.68
Immobiliere de Villers S.A.R.L Villers la Montagne (France) Real estate Euro 29,510,000 97.80
DP Metal Processing Sp. Z o.o. Tychy (Poland) Sheet metal processing and trading Zloty 50,000 97.80
Zaklady Wyrobòw Metalowych SHL.S.A. Kielce Real estate Zloty 27,000,000 97.80
Delfo Polska S.A. Tychy (Poland) Sheet pressing and assembly Zloty 500,000 97.80
M.A.C. Metallurgica Assem-blaggi Carpenterie S.p.A. Chivasso (TO) Italy Sheet pressing and assembly Euro 23,000,000 97.80
MA Automotive South Africa (Pty) Ltd
Rosslyn (South Africa) Holding company Rand 1,199,012,749 69.08
MW Wheels SA (Pty) Ltd Port Elizabeth (South Africa)
Sheet metal processing and trading Rand 1,400 69.08
IG Tooling and Light Engineer-ing (Pty) Ltd
Alberton (South Africa) Mould production Rand 4,000 69.08
MA Automotive Rosslyn (Pty) Ltd
Rosslyn (South Africa) Sheet pressing and assembly Rand 1,578,947 69.08
MA Tool and Die (Pty) Ltd Rosslyn (South Africa) Sheet pressing and assembly Rand 302 69.08
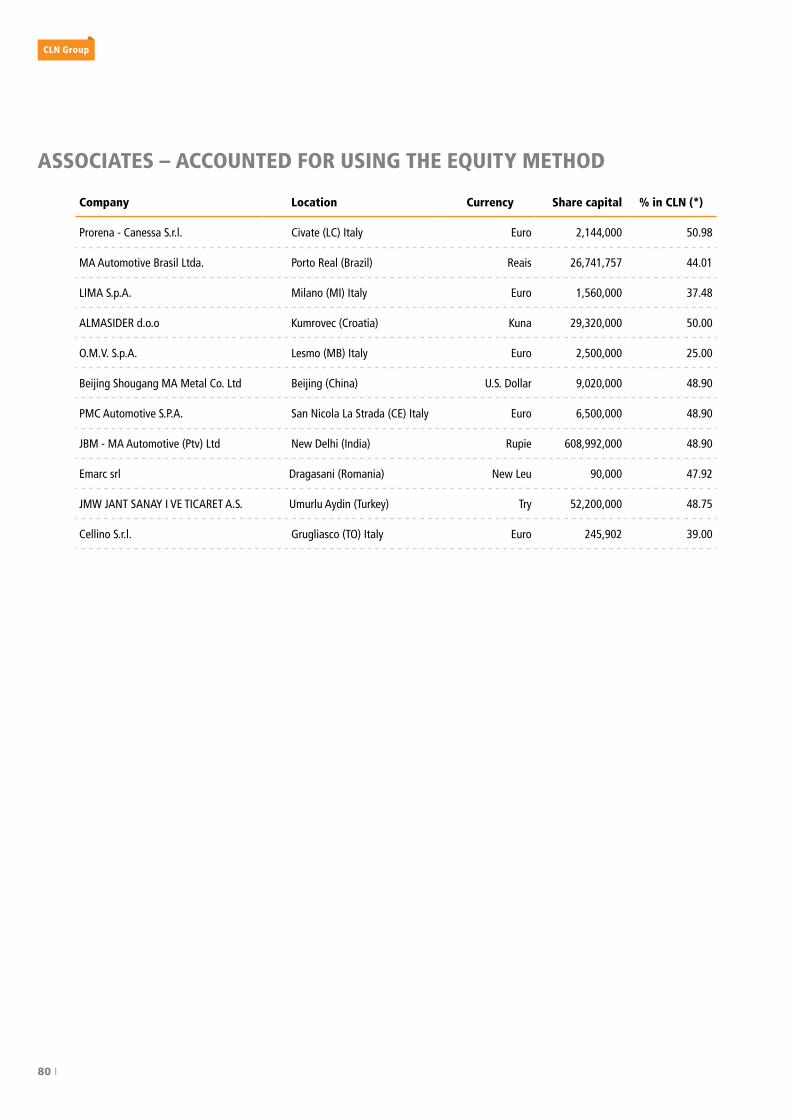
80 I
CLn Group
ASSOCIATES – ACCOUNTED FOR USING THE EQUITY METHOD
Company Location Currency Share capital % in CLN (*)
Prorena - Canessa S.r.l. Civate (LC) Italy Euro 2,144,000 50.98
MA Automotive Brasil Ltda. Porto Real (Brazil) Reais 26,741,757 44.01
LIMA S.p.A. Milano (MI) Italy Euro 1,560,000 37.48
ALMASIDER d.o.o Kumrovec (Croatia) Kuna 29,320,000 50.00
O.M.V. S.p.A. Lesmo (MB) Italy Euro 2,500,000 25.00
Beijing Shougang MA Metal Co. Ltd Beijing (China) U.S. Dollar 9,020,000 48.90
PMC Automotive S.P.A. San Nicola La Strada (CE) Italy Euro 6,500,000 48.90
JBM - MA Automotive (Ptv) Ltd New Delhi (India) Rupie 608,992,000 48.90
Emarc srl Dragasani (Romania) New Leu 90,000 47.92
JMW JANT SANAY I VE TICARET A.S. Umurlu Aydin (Turkey) Try 52,200,000 48.75
Cellino S.r.l. Grugliasco (TO) Italy Euro 245,902 39.00
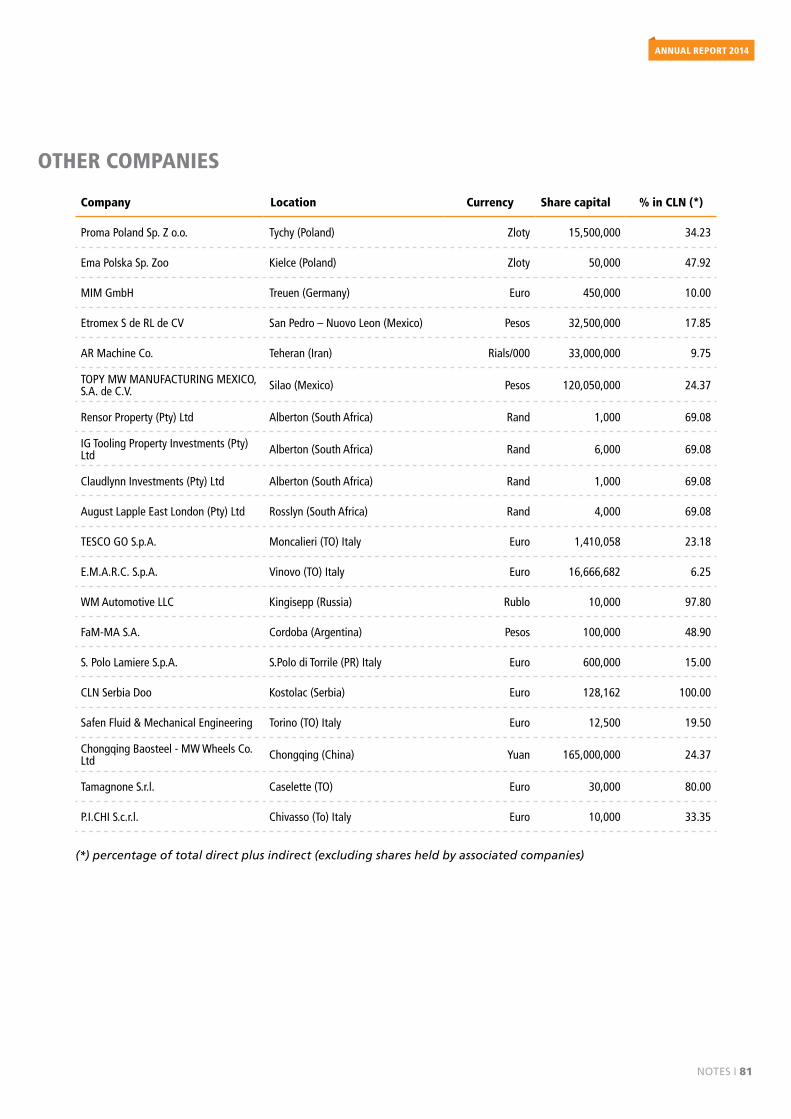
Notes I 81
AnnuAl REPORT 2014
OTHER COMPANIES
Company Location Currency Share capital % in CLN (*)
Proma Poland Sp. Z o.o. Tychy (Poland) Zloty 15,500,000 34.23
Ema Polska Sp. Zoo Kielce (Poland) Zloty 50,000 47.92
MIM GmbH Treuen (Germany) Euro 450,000 10.00
Etromex S de RL de CV San Pedro – Nuovo Leon (Mexico) Pesos 32,500,000 17.85
AR Machine Co. Teheran (Iran) Rials/000 33,000,000 9.75
TOPY MW MANUFACTURING MEXICO, S.A. de C.V. Silao (Mexico) Pesos 120,050,000 24.37
Rensor Property (Pty) Ltd Alberton (South Africa) Rand 1,000 69.08
IG Tooling Property Investments (Pty) Ltd Alberton (South Africa) Rand 6,000 69.08
Claudlynn Investments (Pty) Ltd Alberton (South Africa) Rand 1,000 69.08
August Lapple East London (Pty) Ltd Rosslyn (South Africa) Rand 4,000 69.08
TESCO GO S.p.A. Moncalieri (TO) Italy Euro 1,410,058 23.18
E.M.A.R.C. S.p.A. Vinovo (TO) Italy Euro 16,666,682 6.25
WM Automotive LLC Kingisepp (Russia) Rublo 10,000 97.80
FaM-MA S.A. Cordoba (Argentina) Pesos 100,000 48.90
S. Polo Lamiere S.p.A. S.Polo di Torrile (PR) Italy Euro 600,000 15.00
CLN Serbia Doo Kostolac (Serbia) Euro 128,162 100.00
Safen Fluid & Mechanical Engineering Torino (TO) Italy Euro 12,500 19.50
Chongqing Baosteel - MW Wheels Co. Ltd Chongqing (China) Yuan 165,000,000 24.37
Tamagnone S.r.l. Caselette (TO) Euro 30,000 80.00
P.I.CHI S.c.r.l. Chivasso (To) Italy Euro 10,000 33.35
(*) percentage of total direct plus indirect (excluding shares held by associated companies)
5AUDITORS' REPORT
AUDITORS’ REPORT IN ACCORDANCE WITH ARTICLE 14OF LEGISLATIVE DECREE N° 39 OF 27 JANUARY 2010
CLN GROUP
CONSOLIDATED FINANCIAL STATEMENTSAS OF 31 DECEMBER 2014
AUDITORS’ REPORT IN ACCORDANCE WITH ARTICLE 14 OF LEGISLATIVE DECREEN° 39 OF 27 JANUARY 2010
To the Shareholders ofC.L.N. SpA
1 We have audited the consolidated financial statements of C.L.N. SpA and its subsidiaries(“CLN Group”) as of 31 December 2014. The directors of C.L.N. SpA are responsible for thepreparation of these consolidated financial statements in compliance with the laws governingthe criteria for their preparation. Our responsibility is to express an opinion on theseconsolidated financial statements based on our audit.
2 We conducted our audit in accordance with the auditing standards issued by the ItalianAccounting Profession (Consiglio Nazionale dei Dottori Commercialisti e degli EspertiContabili) and recommended by Consob, the Italian Commission for listed Companies and theStock Exchange. Those standards require that we plan and perform the audit to obtain thenecessary assurance about whether the consolidated financial statements are free of materialmisstatement and, taken as a whole, are presented fairly. An audit includes examining, on atest basis, evidence supporting the amounts and disclosures in the financial statements. Anaudit also includes assessing the accounting principles used and significant estimates made bythe directors. We believe that our audit provides a reasonable basis for our opinion.
For the opinion on the consolidated financial statements of the prior period, which arepresented for comparative purposes as required by law, reference is made to our report dated24 April 2014.
3 In our opinion, the consolidated financial statements of the CLN Group as of 31 December2014 comply with the laws governing the criteria for their preparation; accordingly, they havebeen prepared clearly and give a true and fair view of the financial position and result ofoperations of the CLN Group.
2 of 2
4 The directors of C.L.N. SpA are responsible for the preparation of a report on operations incompliance with the applicable laws. Our responsibility is to express an opinion on theconsistency of the report on operations with the consolidated financial statements, as requiredby law. For this purpose, we have performed the procedures required under Italian AuditingStandard n° 001 issued by Consiglio Nazionale dei Dottori Commercialisti e degli EspertiContabili and recommended by Consob. In our opinion, the report on operations is consistentwith the consolidated financial statements of CLN Group as of 31 December 2014.
Turin, 29 May 2015
PricewaterhouseCoopers SpA
Signed by
Piero De Lorenzi(Partner)
This report has been translated into the English language from the original, which was issued inItalian, solely for the convenience of international readers.

edited by
CLN Group
Communications
printed in Italy © 2015
graphic design
Massi Corporation

CLN
Gro
up
gruppocln.com
ANN
UAL
REPO
RT 2
014
Corso Susa, 13/15 • 10040 Caselette (TO) • Italy
ANNUAL REPORT
CONSOLIDATED
FINANCIAL STATEMENTS
for the year ended 31 December 2014
+