consolidated financial statements -...
TRANSCRIPT
PUBLIC
SAMBA FINANCIAL GROUP
CONSOLIDATED FINANCIAL STATEMENTS
AND AUDITORS’ REPORT FOR THE
YEAR ENDED DECEMBER 31, 2017
Samba Financial Group
PUBLIC
12
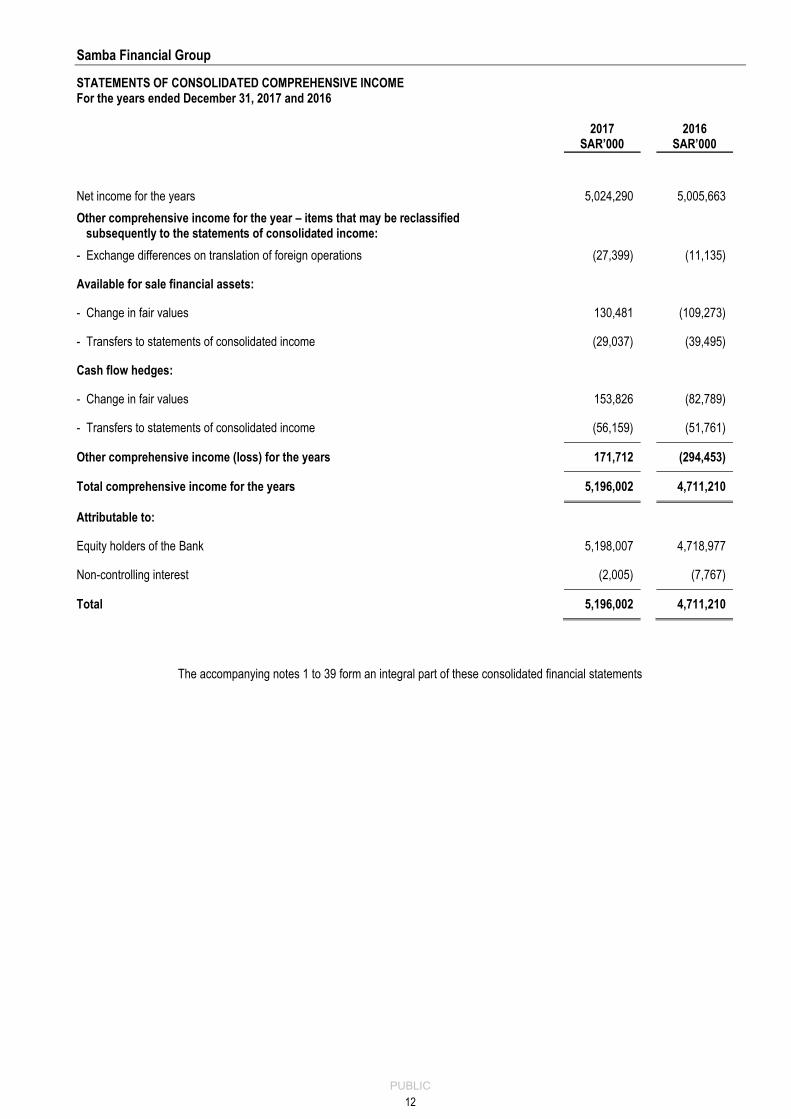
STATEMENTS OF CONSOLIDATED COMPREHENSIVE INCOME For the years ended December 31, 2017 and 2016
2017
SAR’000 2016
SAR’000
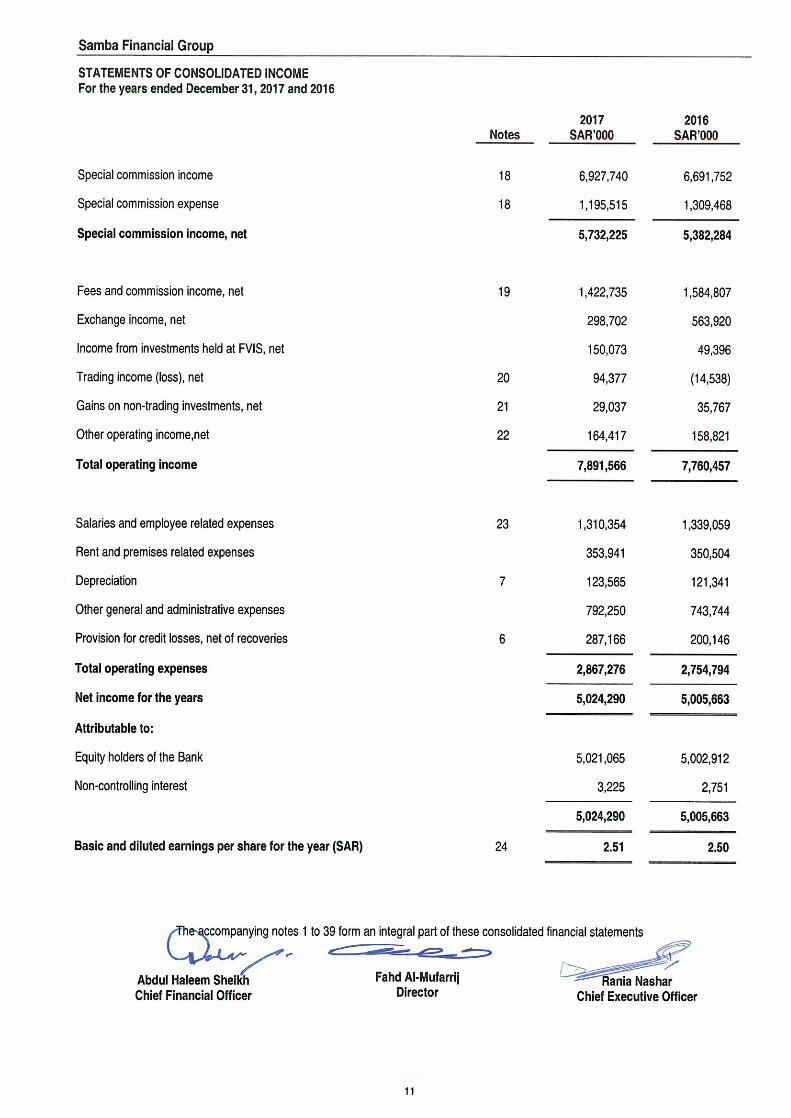
Net income for the years 5,024,290 5,005,663
Other comprehensive income for the year – items that may be reclassified subsequently to the statements of consolidated income:
- Exchange differences on translation of foreign operations (27,399) (11,135)
Available for sale financial assets:
- Change in fair values 130,481 (109,273)
- Transfers to statements of consolidated income (29,037) (39,495)
Cash flow hedges:
- Change in fair values 153,826 (82,789)
- Transfers to statements of consolidated income (56,159) (51,761)
Other comprehensive income (loss) for the years 171,712 (294,453)
Total comprehensive income for the years 5,196,002 4,711,210
Attributable to:
Equity holders of the Bank 5,198,007 4,718,977
Non-controlling interest (2,005) (7,767)
Total 5,196,002 4,711,210
The accompanying notes 1 to 39 form an integral part of these consolidated financial statements
Samba Financial Group
PUBLIC
13
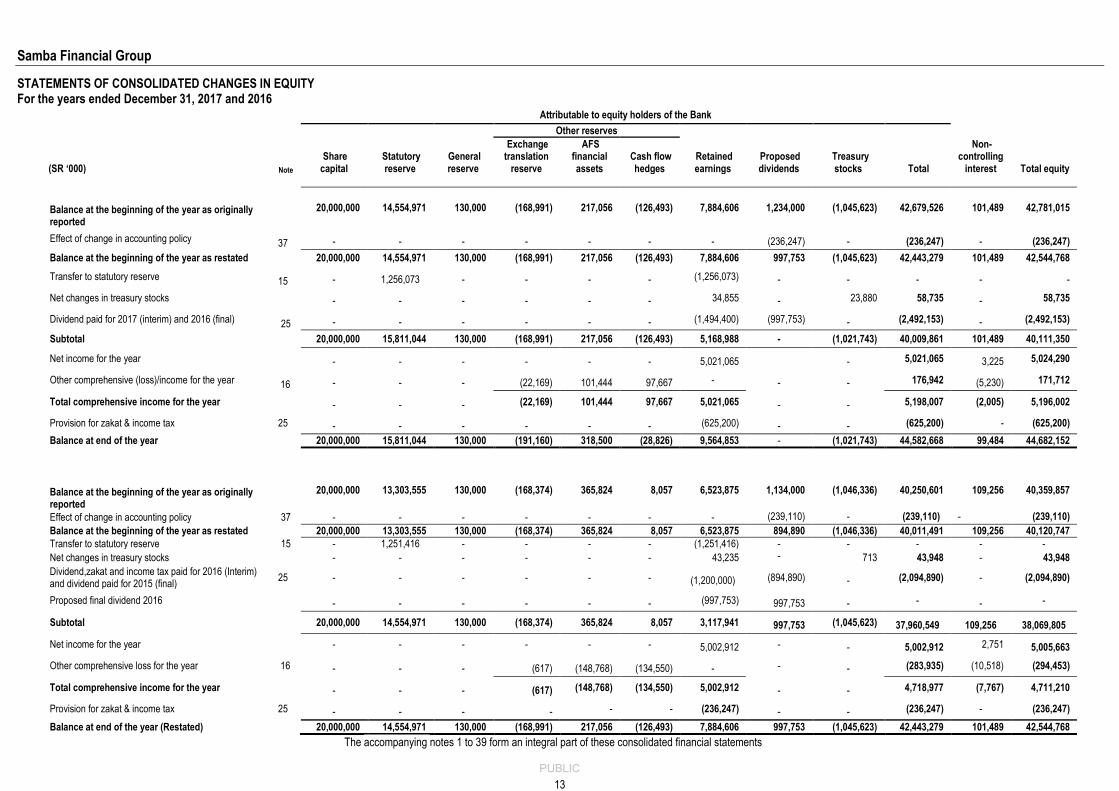
STATEMENTS OF CONSOLIDATED CHANGES IN EQUITY For the years ended December 31, 2017 and 2016
Attributable to equity holders of the Bank
Other reserves
(SR ‘000)
Share capital
Statutory reserve
General reserve
Exchange translation
reserve
AFS financial assets
Cash flow hedges
Retained earnings
Proposed dividends
Treasury stocks Total
Non-controlling
interest Total equity Note
Balance at the beginning of the year as originally reported
20,000,000 14,554,971 130,000 (168,991) 217,056 (126,493) 7,884,606 1,234,000 (1,045,623) 42,679,526 101,489 42,781,015
Effect of change in accounting policy 37 - - - - - - - (236,247) - (236,247) - (236,247)
Balance at the beginning of the year as restated 20,000,000 14,554,971 130,000 (168,991) 217,056 (126,493) 7,884,606 997,753 (1,045,623) 42,443,279 101,489 42,544,768
Transfer to statutory reserve 15 - 1,256,073 - - - - (1,256,073) - - - - - Net changes in treasury stocks
- - - - - - 34,855 - 23,880 58,735 - 58,735
Dividend paid for 2017 (interim) and 2016 (final) 25 - - - - - - (1,494,400) (997,753) - (2,492,153) - (2,492,153)
Subtotal 20,000,000 15,811,044 130,000 (168,991) 217,056 (126,493) 5,168,988 - (1,021,743) 40,009,861 101,489 40,111,350
Net income for the year - - - - - - 5,021,065 - 5,021,065 3,225 5,024,290
Other comprehensive (loss)/income for the year 16 - - - (22,169) 101,444 97,667 - - - 176,942 (5,230) 171,712
Total comprehensive income for the year
- - - (22,169) 101,444 97,667 5,021,065 - - 5,198,007 (2,005) 5,196,002
Provision for zakat & income tax 25 - - - - - - (625,200) - - (625,200) - (625,200)
Balance at end of the year 20,000,000 15,811,044 130,000 (191,160) 318,500 (28,826) 9,564,853 - (1,021,743) 44,582,668 99,484 44,682,152
Balance at the beginning of the year as originally reported
20,000,000 13,303,555 130,000 (168,374) 365,824 8,057 6,523,875 1,134,000 (1,046,336) 40,250,601 109,256 40,359,857
Effect of change in accounting policy 37 - - - - - - - (239,110) - (239,110) - (239,110)
Balance at the beginning of the year as restated 20,000,000 13,303,555 130,000 (168,374) 365,824 8,057 6,523,875 894,890 (1,046,336) 40,011,491 109,256 40,120,747
Transfer to statutory reserve 15 - 1,251,416 - - - - (1,251,416) - - - - -
Net changes in treasury stocks - - - - - - 43,235 - 713 43,948 - 43,948
Dividend,zakat and income tax paid for 2016 (Interim) and dividend paid for 2015 (final)
25 - - - - - - (1,200,000) (894,890) - (2,094,890) - (2,094,890)
Proposed final dividend 2016 - - - - - - (997,753) 997,753 - - - -
Subtotal
20,000,000 14,554,971 130,000 (168,374) 365,824 8,057 3,117,941 997,753 (1,045,623) 37,960,549 109,256 38,069,805
Net income for the year - - - - - - 5,002,912 - - 5,002,912 2,751 5,005,663
Other comprehensive loss for the year 16 - - - (617) (148,768) (134,550) - - - (283,935) (10,518) (294,453)
Total comprehensive income for the year - - - (617) (148,768) (134,550) 5,002,912 - - 4,718,977 (7,767) 4,711,210
Provision for zakat & income tax 25 - - - - - - (236,247) - - (236,247) - (236,247)
Balance at end of the year (Restated) 20,000,000 14,554,971 130,000 (168,991) 217,056 (126,493) 7,884,606 997,753 (1,045,623) 42,443,279 101,489 42,544,768
The accompanying notes 1 to 39 form an integral part of these consolidated financial statements
Samba Financial Group
PUBLIC
15
NOTES TO THE CONSOLIDATED FINANCIAL STATEMENTS For the years ended December 31, 2017 and 2016 1. General
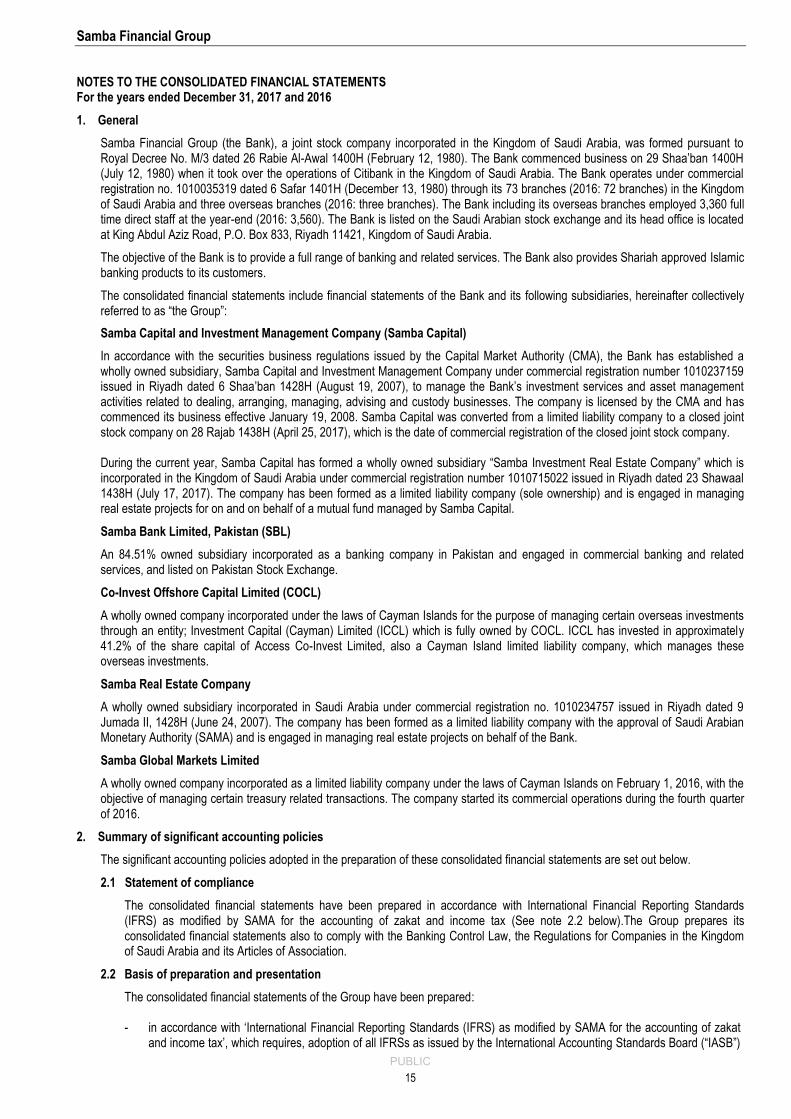
Samba Financial Group (the Bank), a joint stock company incorporated in the Kingdom of Saudi Arabia, was formed pursuant to Royal Decree No. M/3 dated 26 Rabie Al-Awal 1400H (February 12, 1980). The Bank commenced business on 29 Shaa’ban 1400H (July 12, 1980) when it took over the operations of Citibank in the Kingdom of Saudi Arabia. The Bank operates under commercial registration no. 1010035319 dated 6 Safar 1401H (December 13, 1980) through its 73 branches (2016: 72 branches) in the Kingdom of Saudi Arabia and three overseas branches (2016: three branches). The Bank including its overseas branches employed 3,360 full time direct staff at the year-end (2016: 3,560). The Bank is listed on the Saudi Arabian stock exchange and its head office is located at King Abdul Aziz Road, P.O. Box 833, Riyadh 11421, Kingdom of Saudi Arabia. The objective of the Bank is to provide a full range of banking and related services. The Bank also provides Shariah approved Islamic banking products to its customers. The consolidated financial statements include financial statements of the Bank and its following subsidiaries, hereinafter collectively referred to as “the Group”: Samba Capital and Investment Management Company (Samba Capital) In accordance with the securities business regulations issued by the Capital Market Authority (CMA), the Bank has established a wholly owned subsidiary, Samba Capital and Investment Management Company under commercial registration number 1010237159 issued in Riyadh dated 6 Shaa’ban 1428H (August 19, 2007), to manage the Bank’s investment services and asset management activities related to dealing, arranging, managing, advising and custody businesses. The company is licensed by the CMA and has commenced its business effective January 19, 2008. Samba Capital was converted from a limited liability company to a closed joint stock company on 28 Rajab 1438H (April 25, 2017), which is the date of commercial registration of the closed joint stock company. During the current year, Samba Capital has formed a wholly owned subsidiary “Samba Investment Real Estate Company” which is incorporated in the Kingdom of Saudi Arabia under commercial registration number 1010715022 issued in Riyadh dated 23 Shawaal 1438H (July 17, 2017). The company has been formed as a limited liability company (sole ownership) and is engaged in managing real estate projects for on and on behalf of a mutual fund managed by Samba Capital. Samba Bank Limited, Pakistan (SBL) An 84.51% owned subsidiary incorporated as a banking company in Pakistan and engaged in commercial banking and related services, and listed on Pakistan Stock Exchange. Co-Invest Offshore Capital Limited (COCL) A wholly owned company incorporated under the laws of Cayman Islands for the purpose of managing certain overseas investments through an entity; Investment Capital (Cayman) Limited (ICCL) which is fully owned by COCL. ICCL has invested in approximately 41.2% of the share capital of Access Co-Invest Limited, also a Cayman Island limited liability company, which manages these overseas investments. Samba Real Estate Company A wholly owned subsidiary incorporated in Saudi Arabia under commercial registration no. 1010234757 issued in Riyadh dated 9 Jumada II, 1428H (June 24, 2007). The company has been formed as a limited liability company with the approval of Saudi Arabian Monetary Authority (SAMA) and is engaged in managing real estate projects on behalf of the Bank. Samba Global Markets Limited A wholly owned company incorporated as a limited liability company under the laws of Cayman Islands on February 1, 2016, with the objective of managing certain treasury related transactions. The company started its commercial operations during the fourth quarter of 2016.
2. Summary of significant accounting policies
The significant accounting policies adopted in the preparation of these consolidated financial statements are set out below. 2.1 Statement of compliance
The consolidated financial statements have been prepared in accordance with International Financial Reporting Standards (IFRS) as modified by SAMA for the accounting of zakat and income tax (See note 2.2 below).The Group prepares its consolidated financial statements also to comply with the Banking Control Law, the Regulations for Companies in the Kingdom of Saudi Arabia and its Articles of Association.
2.2 Basis of preparation and presentation
The consolidated financial statements of the Group have been prepared:
- in accordance with ‘International Financial Reporting Standards (IFRS) as modified by SAMA for the accounting of zakat
and income tax’, which requires, adoption of all IFRSs as issued by the International Accounting Standards Board (“IASB”)
Samba Financial Group
PUBLIC
16
except for the application of International Accounting Standard (IAS) 12 - “Income Taxes” and IFRIC 21 - “Levies” so far as these relate to zakat and income tax. As per the SAMA Circular no. 381000074519 dated April 11, 2017 and subsequent amendments through certain clarifications relating to the accounting for zakat and income tax (“SAMA Circular”), the Zakat and Income tax are to be accrued on a quarterly basis through shareholders equity under retained earnings; and
- in compliance with the provisions of Banking Control Law, the Regulations for Companies in the Kingdom of Saudi Arabia
and the Article of Association of the Bank.
Further, the above SAMA Circular has also repealed the existing Accounting Standards for Commercial Banks, as promulgated by SAMA, and are no longer applicable from January 1, 2017. Refer note 2.26 for the accounting policy of zakat and income tax and note 37 for the impact of change in the accounting policy resulting from the SAMA Circular. The consolidated financial statements are prepared under the historical cost convention except for the measurement at fair value of derivatives, available for sale and FVIS financial assets and liabilities. In addition, as explained fully in the related notes, financial assets and liabilities that are hedged under a fair value hedging relationship are adjusted to record changes in fair value attributable to the risks that are being hedged. Under article 37 of the Bank’s Articles of Association, the Gregorian calendar is observed for reporting the consolidated financial statements. These consolidated financial statements are expressed in Saudi Arabian Riyals (SAR) and are rounded off to the nearest thousands.
2.3 Consolidation These consolidated financial statements include the financial position and results of Samba Financial Group and its subsidiary companies. The financial statements of subsidiaries are prepared for the same reporting period as that of the Bank, using consistent accounting policies except for Co-Invest Offshore Capital Limited (COCL) whose financial statements are made up to the previous quarter end for consolidation purposes to meet the group reporting timetable. However any material changes during the interim period are adjusted for the purposes of consolidation. In addition, wherever necessary, adjustments have been made to the financial statements of the subsidiaries to align with the Bank’s consolidated financial statements. Significant intragroup balances and transactions are eliminated upon consolidation. Subsidiaries are the entities that are controlled by the Group. The Group controls an entity when it is exposed, or has a right, to variable returns from its involvement with the entity and has the ability to affect those returns through its power over that entity. Subsidiaries are consolidated from the date on which control is transferred to the Group and cease to be consolidated from the date on which the control is transferred from the Group. The results of subsidiaries acquired or disposed-off during the year are included in the statement of consolidated income from the date of acquisition or up to the date of disposal, as appropriate. Non-controlling interest represents the portion of net income or loss and net assets not owned, directly or indirectly, by the Group in subsidiaries and are presented in the statements of consolidated income and within equity in the statements of consolidated financial position separately from the equity holders of the Bank. The purchase method of accounting is used to account for the acquisition of subsidiaries by the Bank. The cost of acquisition is measured at the fair value of the consideration given at the date of exchange. The acquired identifiable assets, liabilities and contingent liabilities are measured at their fair value at the date of acquisition. The excess of the cost of acquisition over the fair value of the Bank’s share of identifiable net assets acquired is recorded as intangible asset – goodwill. In addition to the subsidiaries stated above under note 1, the Bank is also party to certain special purpose entities which are formed with the approval of SAMA solely to facilitate certain Shariah complaint financing arrangements. The Bank has concluded that these entities cannot be consolidated as it does not control these entities. However, the exposures to these entities are included in the Bank’s loans and advances portfolio.
2.4 Fair value measurement Fair value is the price that would be received to sell an asset or paid to transfer a liability in an orderly transaction between market participants at the measurement date. The fair value measurement is based on the presumption that the transaction to sell the asset or transfer the liability takes place either in the principal market for the asset or liability, or in the absence of a principal market, in the most advantageous market for the asset or liability. The fair value of an asset or a liability is measured using the assumptions that market participants would use when pricing the asset or liability, assuming that market participants act in their best economic interest. The fair value for financial instruments traded in active markets at the reporting date is based on their quoted price or dealer price quotations. For all other financial instruments not traded in an active market, the fair value is determined by using valuation techniques deemed to be appropriate
Samba Financial Group
PUBLIC
17
in the circumstances. Valuation techniques include the market approach (i.e. using recent arm’s length market transactions adjusted as necessary and with reference to the current market value of another instrument that is substantially the same) and the income approach (i.e. discounted cash flow analysis and option pricing models making as much use of available and supportable market data in a reasonably possible manner). A fair value measurement of a non-financial asset takes into account a market participant's ability to generate economic benefits by using the asset in its highest and best use or by selling it to another market participant that would use the asset in its highest and best use. For assets and liabilities that are recognized in the financial statements on a recurring basis, the Group determines whether transfers have occurred between the levels in the hierarchy by re-assessing categorization (based on the lowest level input that is significant to the fair value measurement as a whole) at the end of each reporting period. For the purpose of fair value disclosures, the Group has determined classes of assets and liabilities on the basis of the nature, characteristics and risks of the asset or liability and the level of the fair value hierarchy.
2.5 Critical accounting judgments and estimates The preparation of consolidated financial statements in conformity with IFRS requires the use of certain critical accounting estimates, assumptions and judgements that affect the reported amounts of assets and liabilities. It also requires management to exercise its judgement in the process of applying the Group’s accounting policies. Such estimates, assumptions and judgements are continually evaluated and are based on historical experience and other factors, including obtaining professional advice and expectations of future events that are believed to be reasonable under the circumstances. Significant areas where management has used estimates, assumptions or exercised judgements are as follows: (a) Impairment for credit losses on loans and advances
The Group reviews its loan portfolios to assess impairment on a quarterly basis. In determining whether an impairment loss should be recognized, the Group makes judgments as to whether there is any observable data indicating that there is a measurable decrease in the estimated future cash flows. This evidence may include observable data indicating that there has been an adverse change in the payment of borrowers in a group. Management uses estimates based on historical loss experience for loans with credit risk characteristics and objective evidence of impairment similar to those in the portfolio when estimating its cash flows. The methodology and assumptions used for estimating both the amount and the timing of future cash flows are reviewed regularly to reduce any differences between loss estimates and actual loss experience.
(b) Fair value of unquoted financial instruments
The fair values of financial instruments that are not quoted in active markets are determined by using valuation techniques. Where valuation techniques including models are used to determine fair values, they are validated and periodically reviewed by qualified personnel independent of the area that created them. All models are calibrated to ensure that outputs reflect actual data and comparative market prices. To the extent practical, models use only observable data, however areas such as credit risk (both own and counterparty), volatilities and correlations require management to make estimates. Changes in assumptions about these factors could affect the reported fair value of financial instruments. (c) Impairment of available for sale equity investments
The Group exercises judgment to consider impairment on its available for sale equity investments. This includes determination of a significant or prolonged decline in the fair value below its cost. In making this judgment, management evaluates among other factors, the normal volatility in share price. In addition, management considers impairment to be appropriate when there is evidence of deterioration in the financial position of the investee, industry and sector performance, changes in technology, and operational and financing cash flows.
2.6 Settlement date accounting All regular way purchases and sales of financial instruments are recognized and derecognized on the settlement date. Regular way purchases or sales are purchases or sales of financial instruments that require delivery of assets within the time frame generally established by regulation or convention in the market place. For financial instruments held at fair value, the Group accounts for any change in fair values between the trade date and the reporting date.
2.7 Derivative financial instruments and hedge accounting Derivative financial instruments are measured at fair value. Fair values are generally obtained by reference to quoted market prices, discounted cash flow models and other pricing models, as appropriate. Derivative financial instruments are designated as held for trading unless they are part of an effective hedging relationship. Any changes in the fair values of derivatives that are held for trading purposes are taken directly to the statements of consolidated income.
Samba Financial Group
PUBLIC
18
Hedge accounting Hedges are classified into two categories: (a) fair value hedges which hedge the exposure to changes in the fair value of a recognized asset or liability; and (b) cash flow hedges which hedge exposure to variability in cash flows that is attributable to a particular risk associated with a recognized asset or liability.
In order to qualify for hedge accounting, the hedge is required to be highly effective at inception i.e. the changes in the fair value or the cash flows of the hedging instrument should effectively offset corresponding changes in the hedged item, and should be reliably measurable. At the inception of the hedge, the risk management objective and strategy is documented including the identification of the hedging instrument, the related hedged item, the nature of the risk being hedged, and how the Group will assess the effectiveness of the hedging relationship. Subsequently, the hedge is required to be assessed and determined to be an effective hedge on an ongoing basis. Hedge accounting is discontinued when the designation is revoked, the hedging instrument is expired or sold, terminated or exercised, or no longer qualifies for hedge accounting.
In relation to fair value hedges that meet the criteria for hedge accounting, any gain or loss from re-measuring the hedging instruments to change in fair value is recognized immediately in the statements of consolidated income. The corresponding change in fair value of the hedged item is adjusted against the carrying amount and is recognized in the statements of consolidated income. Where the fair value hedge of a special commission bearing financial instrument ceases to meet the criteria for hedge accounting, the adjustment to the carrying value resulting from fair value changes is amortized to the statements of consolidated income over the remaining life of the hedged item.
In relation to cash flow hedges that meet the criteria for hedge accounting, the portion of the gain or loss on the hedging instrument that is determined to be an effective hedge is recognized initially in other reserves under equity and the ineffective portion, if any, is recognized in the statements of consolidated income. A hedge is expected to be highly effective if the changes in fair value or cash flows attributable to the hedged risk during the period for which the hedge is designated were offset by the the hedging instrument in a range of 80% to 125% and were expected to achieve such offset in future periods. Hedge ineffectiveness is recognized in the statements of consolidated income in Net trading income. Gains or losses recognized initially in other reserves are transferred to the statements of consolidated income in the period in which the hedged item impacts the statements of consolidated income.
2.8 Foreign currencies The consolidated financial statements are denominated and presented in Saudi Arabian Riyals, which is also the functional currency of the Bank. Transactions in foreign currencies are translated into Saudi Arabian Riyals at exchange rates prevailing at transaction dates. Monetary assets and liabilities denominated in foreign currencies at the end of the year (other than monetary items that form part of the net investments in a foreign operation) are translated into Saudi Arabian Riyals at the exchange rates prevailing at the reporting date. Non-monetary items measured at fair value in a foreign currency are translated using the spot exchange rates at the date when the fair value is determined. Translation gains or losses on non-monetary items carried at fair value are included as part of the fair value adjustment either in the consolidated statement of income or in equity, depending on the underlying financial asset. Non-monetary assets and liabilities denominated in a foreign currency that are measured in terms of historical cost are translated using the spot exchange rates as at the date of the initial transaction. Realized and unrealized gains or losses on exchange are credited or charged to the statements of consolidated income. The assets and liabilities of overseas branches and subsidiaries are translated at the rate of exchange prevailing at the reporting date. The statements of income of overseas branches and subsidiaries are translated at the average exchange rates for the year. On consolidation, exchange differences arising from the translation of the net investment in foreign entities are taken to equity through the statement of consolidated comprehensive income.
2.9 Offsetting Financial assets and liabilities are offset and reported net in the statements of consolidated financial position when there is a legally enforceable right to offset the recognized amounts and the Group intends to settle on a net basis, or to realize the asset and settle the liability simultaneously.
2.10 Revenue recognition Special commission income and expense including the fees which are considered an integral part of the effective yield of a financial instrument, are recognized in the statements of consolidated income using the effective yield method, and include premiums amortized and discounts accreted during the year. Special commission income on loans and advances which is received but not earned is netted off against the related assets.
Fee from banking services are recognized on an accrual basis when the service has been provided. Commitment fees for loans that are likely to be drawn down are deferred and, together with the related direct cost, are recognized as an adjustment to the effective yield on the loan when it is drawn down. Portfolio and other management advisory and service fees are recognized based on the applicable service contracts, usually on a time-proportionate basis. Fee received on asset management, wealth management, financial planning, custody services and other similar services that are provided over an extended period of time,
Samba Financial Group
PUBLIC
19
are recognized rateably over the period when the service is being provided. Dividend income is recognized when declared and right to receive is established. Any fee income received but not earned is classified as “other liability”.
The calculation of the effective commission rate includes all fees and points paid or received, transaction costs, and discounts or premiums that are an integral part of the effective commission rate. Transaction costs are incremental costs that are directly attributable to the acquisition or the issue of financial asset or liability.
Exchange income is recognized as and when it arises. For presentation purposes, “Exchange income, net” includes exchange related gains and losses from derivative financial instruments and translated foreign currency assets and liabilities.
2.11 Sale and repurchase agreements Securities sold with a commitment to repurchase at a specified future date (repos), continue to be recognized in the statements of consolidated financial position and are measured in accordance with related accounting policies for trading, FVIS, available for sale and other investments at amortized cost. The counterparty liability for amounts received under these agreements is included in due to banks and other financial institutions or customer deposits, as appropriate. The difference between the sale and the repurchase price is treated as special commission expense and is recognized over the life of the repo agreement on an effective yield basis. Assets purchased with a corresponding commitment to resell at a specified future date (reverse repos), are not recognized in the statements of consolidated financial position, as the Group does not obtain control over the assets. Amounts paid under these agreements are included in cash and balances with Central Banks, due from banks and other financial institutions or loans and advances, as appropriate. The difference between the purchase and the resale price is treated as special commission income and is recognized over the life of the reverse repo agreement on an effective yield basis.
2.12 Investments All investment securities are initially recognized at fair value and except for investments held at FVIS, include the acquisition costs associated with the investment. Transaction costs if any are not added to fair value measurement at initial recognition of investments held at FVIS and are included in the statement of consolidated income. Premiums are amortized and discounts are accreted using the effective yield method and are taken to statements of consolidated income. For securities that are traded in organized financial markets, fair value is determined by reference to the prevailing quoted market bid prices at the close of business on the reporting date. Fair value of managed assets and investments in mutual funds are determined by reference to declared net asset values. For securities where there is no quoted market price, a reasonable estimate of the fair value is determined by reference to the current market value of another instrument which is substantially the same, or is based on the expected future cash flows or the underlying net asset base of the security. Following initial recognition of investment securities, subsequent transfers between the various classes of investment are not ordinarily permissible. Subsequent measurement for each class of investments are determined as follows: a) Held at fair value through income statement (FVIS) Investments in this category are classified as either held for trading or those designated as FVIS upon initial recognition. Investments classified as trading are acquired principally for the purpose of selling or repurchasing in short term. An instrument which is part of a portfolio classified as held for trading, may include items held for a longer period of time due to market conditions or position management. An investment may be designated as FVIS by the management if it eliminates or significantly reduces a measurement or recognition inconsistency (sometimes referred to as “an accounting mismatch”) that would otherwise arise from measuring assets or liabilities or recognizing the gains and losses on different bases; or a group of financial assets, financial liabilities or both is managed and its performance is evaluated on a fair value basis, in accordance with a documented risk management or investment strategy, and information about the group is provided internally on that basis to the Group’s key management personnel. After initial recognition, investments are measured at fair value and gains and losses arising from any change in the fair value are recognized in the statements of consolidated income for the period in which it arises. b) Available for sale Investments that are classified as available for sale are subsequently measured at fair value. For available for sale investments where fair value has not been hedged, any gain or loss arising from a change in the fair value is recognized directly through the statements of consolidated comprehensive income in fair value reserve under equity until the investment is derecognized or considered impaired, at which time the cumulative gain or loss previously recognized in equity is included in the statements of consolidated income for the period. Any gain or loss arising from a change in the fair value of available for sale investments that are part of an effective hedging relationship is recognized directly in the statements of consolidated income to the extent of the changes in fair value being hedged.
c) Other Investments held at amortized cost Investments with fixed or determinable payments that are not quoted in an active market, other than those purchased with the intent to be sold immediately or in the short term and are not classified as available for sale, are classified as other investments held at amortized cost. Such investments where fair value has not been hedged are stated at amortized cost, less provision for
Samba Financial Group
PUBLIC
20
any impairment. Any gain or loss is recognized in the statements of consolidated income when the investment is derecognized or impaired. d) Held to maturity Investments having fixed or determinable payments and fixed maturity that the Group has the positive intent and ability to hold to maturity other than those that the Group designates as FVIS, available for sale and those that meet the definition of other investments held at amortized cost are classified as held to maturity. Held to maturity investments are subsequently measured at amortized cost, less provision for impairment in value. Amortized cost is calculated by taking into account any discount or premium on acquisition on an effective yield method. Any gain or loss on such investments is recognized in the statements of consolidated income when the investment is derecognized or impaired. Investments classified as held to maturity cannot ordinarily be sold or reclassified without impacting the Group’s ability to use this classification and cannot be designated as a hedged item with respect to special commission rate or prepayment risk, reflecting the longer-term nature of these investments.
2.13 Loans and advances
Loans and advances are non-derivative financial assets having fixed or determinable payments that are not quoted in an active market. All loans and advances are initially measured at fair value including acquisition charges associated with the loans and advances, if any. Following initial recognition, subsequent transfers between the various classes of loans and advances is not ordinarily permissible. Loans and advances that are not quoted in an active market and for which fair value has not been hedged are stated at amortized cost. For loans and advances which are hedged, the related portion of the hedged fair value is adjusted against the carrying amount. For presentation purposes, provision for credit losses is netted from loans and advances.
2.14 Impairment of financial assets An assessment is made at each reporting date to determine whether there is objective evidence that a financial asset or group of financial assets may be impaired. Objective evidence of impairment may include indications that the borrower is experiencing significant financial difficulty, default or delinquency in special commission or principal payments, the probability that it will enter bankruptcy or other financial reorganization and where observable data indicates that there is a measurable decrease in the estimated future cash flows, such as changes in economic conditions that correlate with defaults. If such evidence exists, the estimated recoverable amount of that asset is determined and an impairment loss, based on the net present value of future anticipated cash flows, is recognized for changes in its carrying amounts. Financial assets are written off only in circumstances where effectively all possible means of recovery have been exhausted. Once a financial asset has been written down to its estimated recoverable amount, special commission income is thereafter recognized based on the rate of special commission that was used to discount the future cash flows for the purpose of measuring the recoverable amount.
If, in a subsequent period, the amount of the impairment loss decreases and the decrease can be related objectively to an event occurring after the impairment was recognized, the previously recognized impairment loss is reversed by adjusting the allowance account. The amount of the reversal is recognized in the statements of consolidated income. Renegotiation activity is designed to manage customer relationships, maximise collection opportunities and, if possible, avoid foreclosure or repossession. Such activity may involve extending the payment arrangements and/or the agreement of new loan conditions. Once the terms have been renegotiated, the loan is no longer considered past due. Management continuously reviews renegotiated loans to ensure that all criteria are met and that future payments are likely to occur. (a) Impairment of financial assets held at amortized cost A financial asset is classified as impaired when there is an objective evidence of impairment as a result of one or more events that occurred after the initial recognition of the asset (a ‘loss event’) and that loss event has an impact on the estimated future cash flows of the financial asset or group of financial assets that can be reliably estimated. A specific provision for credit losses due to impairment of a loan or any other financial asset held at amortized cost is established if there is objective evidence that the Group will not be able to collect all amounts due. The amount of the specific provision is the difference between the carrying amount and the estimated recoverable amount. The estimated recoverable amount is the present value of expected future cash flows, including amounts estimated to be recoverable from guarantees and collateral, discounted based on the original effective special commission rate. In addition to specific provision for credit losses, a provision for collective impairment is made on a portfolio basis for credit losses where there is an objective evidence that unidentified losses exist at the reporting date. This provision is estimated based
Samba Financial Group
PUBLIC
21
on various factors including credit ratings allocated to a borrower or group of borrowers, the current economic conditions, the experience the Group has had in dealing with a borrower or group of borrowers and available historical default information. Historical loss experience is adjusted on the basis of current observable data to reflect the effects of current conditions. For financial assets at amortised cost, the carrying amount of the asset is adjusted either directly or through the use of an allowance account and the amount of the adjustment is included in the statements of consolidated income. (b) Impairment of financial assets held as available for sale For financial assets held as available for sale at fair value, where a loss has been recognised directly under equity, the cumulative net loss recognised in equity is transferred to the statements of consolidated income when the asset is considered to be impaired. If, in a subsequent period, the fair value of a debt instrument increases and the increase can be objectively related to credit event occurring after the impairment loss was recognised in the consolidated statement of income, the impairment loss is reversed through the consolidated statement of income. However, for equity investments held as available for sale, a significant or prolonged decline in fair value below its cost represents objective evidence of impairment. The impairment loss against available for sale equity instruments cannot be reversed through the statements of consolidated income as long as the asset continues to be recognised i.e. any increase in fair value after impairment can only be recognised in equity. On de-recognition, any cumulative gain or loss previously recognised in equity is included in the statements of consolidated income for the period.
2.15 Other real estate owned
The Group, in the ordinary course of business, acquires certain real estate against settlement of loans and advances. Such real estate are considered as assets held for sale and are initially recorded at the lower of the net realizable value of related loans and advances or the current fair value of the related real estate, less any cost to sell. Subsequent to the initial recognition, these other real estate owned are periodically revalued and are carried at lower of their carrying values or the related net realizable value. Rental income, realized gains or losses on disposal and unrealized losses on revaluation are credited or charged to the statements of consolidated income.
2.16 Property and equipment
Property and equipment are stated at historical cost net of accumulated depreciation. Freehold land is not depreciated. The cost of other property and equipment is depreciated using the straight-line method over the estimated useful lives of the assets as follows:
Buildings 33 years Leasehold improvements Over the lease period or economic life (10 years), whichever is shorter Furniture, equipment and vehicles Up to 7 years
The assets’ residual values and useful lives are reviewed, and adjusted if appropriate, at each reporting date. Gains and losses on disposals of property and equipment are included in the statements of consolidated income.
2.17 Intangible assets - goodwill
Goodwill represents the excess of the cost of acquisition over the fair value of the Bank’s share of identifiable assets, liabilities and contingent liabilities of the acquired subsidiary at the date of acquisition. Goodwill is stated at cost less any accumulated impairment losses, which are charged to the statements of consolidated income. An impairment test for goodwill is carried out annually or more frequently if events or changes in circumstances indicate that the carrying value may be impaired. Impairment loss recorded against goodwill cannot be reversed.
2.18 Financial liabilities
All financial liabilities including customer and money market deposits and debt securities issued are initially recognized at fair value less transaction costs except for financial liabilities measured at FVIS where transactions cost, if any, are not deducted from the fair value measurement at initial recognition, and are included in the statements of consolidated income. Subsequently, all special commission bearing financial liabilities other than those held at FVIS are measured at amortized cost. Amortized cost is calculated by taking into account any discount or premium on settlement. Special commission bearing deposits for which there is an associated fair value hedging relationship are adjusted for fair value to the extent hedged. Financial liabilities held at FVIS comprise market linked financial liabilities which are customer deposits where the rate of return is benchmarked to the performance of underlying instruments such as currencies, equities or commodities. At maturity, the repayment of principal amount to the customers is in accordance with the contractual terms. After initial recognition these deposits are measured at fair value and any gains or losses arising from the change in fair value are included in the statements of consolidated income for the year.
Samba Financial Group
PUBLIC
22
2.19 Financial guarantees In the ordinary course of business, the Group extends credit related commitments consisting of letters of credit, guarantees and acceptances. Financial guarantees are initially recognized in the consolidated financial statements at fair value in other liabilities, being the value of the premium received. Subsequent to initial recognition, the Group’s liability under each guarantee is measured at the higher of the unamortized premium and the best estimate of expenditure required to settle any financial obligation arising as a result of guarantees. The premium received is recognized in the statements of consolidated income over the life of the guarantee.
2.20 Provisions Provisions are recognized when a reliable estimate can be made for a present legal or constructive obligation as a result of past events and it is more likely than not that an outflow of resources will be required to settle the obligation.
2.21 Cash and cash equivalents For the purpose of the statements of consolidated cash flows, cash and cash equivalents comprise cash, balances with Central Banks and reverse repos (excluding statutory deposit) and due from banks and other financial institutions having an original maturity of three months or less.
2.22 De-recognition of financial instruments
A financial asset is derecognized, when the contractual rights to the cash flows from the financial asset expire or the asset is transferred and the transfer qualifies for de-recognition. In instances where the Group is assessed to have transferred a financial asset, the asset is derecognized if the Group has transferred substantially all the risks and rewards of ownership. Where the Group has neither transferred nor retained substantially all the risks and rewards of ownership, the financial asset is derecognized only if the Group has not retained control of the financial asset. The Group recognizes separately as assets or liabilities any rights and obligations created or retained in the process. A financial liability is derecognized only when it is extinguished, that is when the obligation specified in the contract is either discharged, cancelled or expires.
2.23 Equity-based payments The Bank offers its eligible employees an equity-settled share-based payment plan (the “Plan”) as approved by SAMA. Under the terms of the Equity Based Long Term Bonus Plan, eligible employees of the Bank are offered shares at a predetermined benchmark price for a fixed period of time. At the vesting dates determined under the terms of the plan, the Bank delivers the underlying allotted shares to the employees, subject to the satisfactory completion of the vesting conditions. The cost of these plans is measured by reference to the fair value at the date on which the shares are granted. The fair value of the plan is determined with reference to the market value of the shares at the inception of the plan using the discounted cash flow model. The cost of the plans is recognized over the period in which the service condition is fulfilled, ending on the date on which the relevant employees become fully entitled the shares (‘the vesting date’). The cumulative expense recognized for these plans at each reporting date until the vesting date, reflects the extent to which the vesting period has expired and the Bank’s best estimate of the number of equity instruments that will ultimately vest. The charge or credit to the statements of consolidated income for a period represents the movement in cumulative expense recognized as at the beginning and end of that period. The Bank, with the approval from SAMA, has entered into an agreement with an independent third-party to acquire a beneficial interest in the underlying shares solely to manage the price risks associated with the above plans. Under the provisions of such agreement, the Bank, at no point, becomes the legal owner of the underlying shares.
2.24 Employee benefit obligations The Bank operates an end of service benefit plan for its employees. The provision under this plan is made based on an actuarial valuation of the Bank’s liability under the Saudi Arabian Labour Law and in accordance with the local statutory requirements of the foreign branches and subsidiaries.
2.25 Treasury stock Treasury stocks are recorded at cost and presented as a deduction from the equity as adjusted for any transaction costs, dividends and gains or losses on sale of such stocks. Subsequent to their acquisition, these stocks are carried at the amount equal to the consideration paid. These stocks are acquired by the Bank with the approval of SAMA, primarily for discharging its obligation under its equity-based payment plans and also include stocks acquired in settlement of customer debt.
Samba Financial Group
PUBLIC
23
2.26 Zakat and income taxes
Under Saudi Arabian Zakat and Income tax laws, Zakat and income taxes are the liabilities of the Saudi and foreign shareholders, respectively. Zakat is computed on the Saudi shareholders’ share of equity or net income using the basis defined under the Zakat regulations. Income taxes are computed on the foreign shareholders’ share of net income for the year. Zakat and income taxes are not charged to the Bank’s statements of consolidated income. They are paid on behalf of and are deducted from the dividends paid to the shareholders. Please refer to Note 2.29 for change in accounting policy. Overseas branches and subsidiaries are subject to income tax as per rules and regulations of the country in which they reside.
2.27 Investment management services The Bank offers certain investment management and advisory services to its customers through its subsidiary. These services include portfolio management on discretionary and non-discretionary basis and management of investment funds in consultation with professional investment advisors. The Bank’s investment in these funds is included in the FVIS or available for sale investments and fees earned are disclosed under related party transactions. Determining whether the Bank controls such an investment fund usually depends on the assessment of the aggregate economic interests of the Bank in the fund and the investors’ right to remove the fund manager. Based on the assessment carried out by the Bank, it has concluded that it acts as an agent for the investors in all the cases and therefore it has not consolidated these funds in these financial statements. In addition, the assets held in a trust or fiduciary capacity are not treated as assets of the Bank or that of its subsidiary and accordingly are not included in the Group’s statements of consolidated financial position.
2.28 Shariah approved banking products In addition to conventional banking, the Bank offers its customers certain Shariah compliant banking products, which are approved by its Shariah Board. All Shariah compliant banking products are accounted for using IFRS and are in conformity with the accounting policies described in these consolidated financial statements.
2.29 Change in accounting policies
The accounting policies adopted are consistent with those of the previous financial year except for the:-
amendment to accounting policy relating to Zakat and income tax. The Bank now accrues liabilities for Zakat and income tax on a quarterly basis. Previously, Zakat and income tax were deducted from dividends upon payment of dividend to the shareholders and were recognized as liabilities at that time. The above change in accounting policy has been retrospectively accounted for in these consolidated financial statements and therefore, corresponding figures have been restated and the effects of the above change are disclosed in note 37 to the consolidated financial statements. Consistent with previous years, Zakat and income tax continues to be charged to retained earnings as required by SAMA circular relating to accounting for Zakat and Income tax.
amendments to IAS 7: Statement of cash flows on disclosure initiative - This amendment introduces an additional disclosure that will enable users of financial statements to evaluate changes in liabilities arising from financing activities. This amendment is part of the IASB’s Disclosure Initiative, which continues to explore how financial statement disclosure can be improved. This did not have any significant impact on the financial position or the performance of the Group.
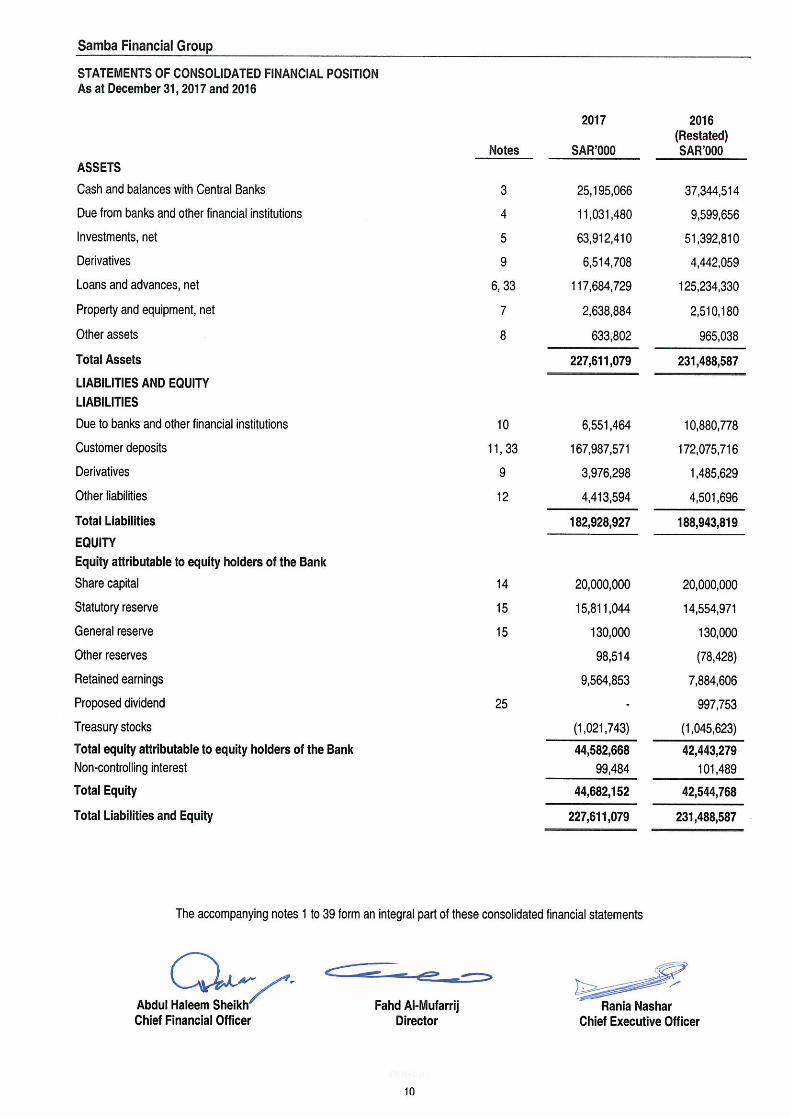
3. Cash and balances with Central Banks
2017
SAR ‘000 2016
SAR ‘000
Cash in hand 1,214,448 1,395,760
Statutory deposit 9,242,179 9,560,219
Current account 665,026 405,159
Money market placements 14,073,413 25,983,376
Total 25,195,066 37,344,514
In accordance with the Banking Control Law and regulations issued by SAMA, the Group is required to maintain a statutory deposit with SAMA and other Central Banks at stipulated percentages of its demand, savings, time and other deposits, as calculated at the end of each month. Money market placements represent securities purchased under an agreement to re-sell (reverse repos) with SAMA.
Samba Financial Group
PUBLIC
24
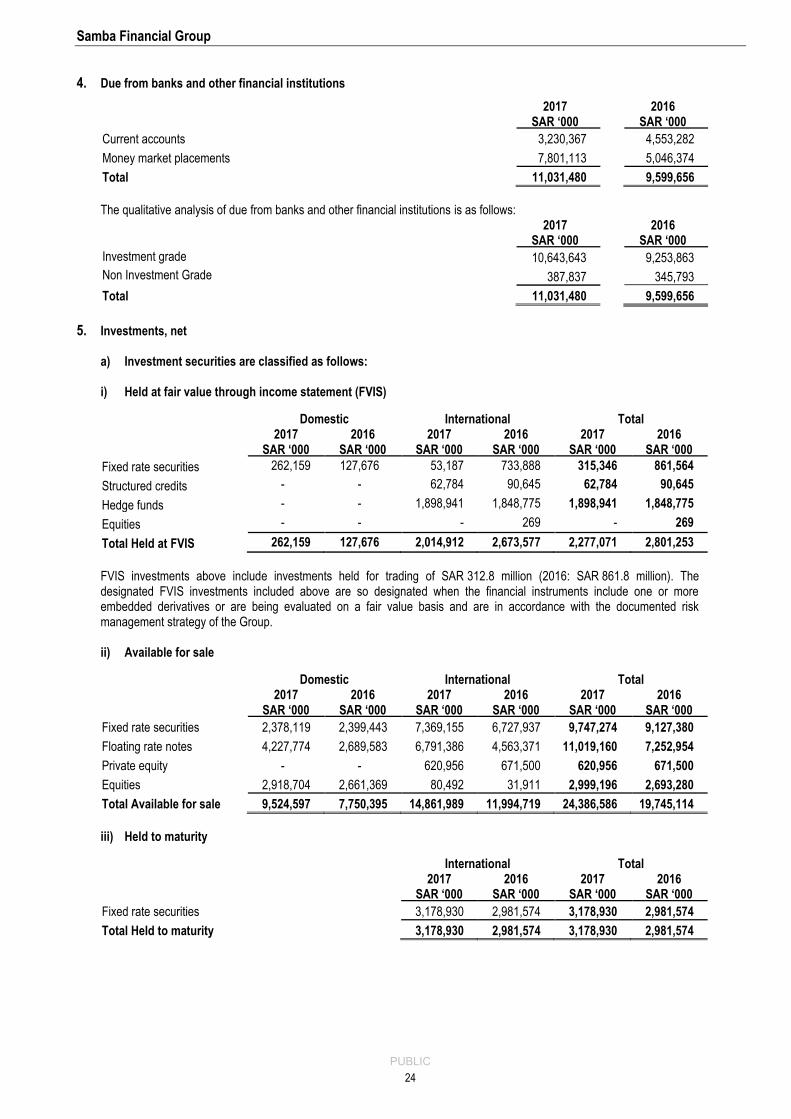
4. Due from banks and other financial institutions
2017
SAR ‘000 2016
SAR ‘000
Current accounts 3,230,367 4,553,282
Money market placements 7,801,113 5,046,374
Total 11,031,480 9,599,656
The qualitative analysis of due from banks and other financial institutions is as follows:
2017
SAR ‘000 2016
SAR ‘000
Investment grade 10,643,643 9,253,863
Non Investment Grade 387,837 345,793
Total 11,031,480 9,599,656
5. Investments, net
a) Investment securities are classified as follows:
i) Held at fair value through income statement (FVIS)
Domestic International Total
2017
SAR ‘000 2016
SAR ‘000 2017
SAR ‘000 2016
SAR ‘000 2017
SAR ‘000 2016
SAR ‘000
Fixed rate securities 262,159 127,676 53,187 733,888 315,346 861,564
Structured credits - - 62,784 90,645 62,784 90,645
Hedge funds - - 1,898,941 1,848,775 1,898,941 1,848,775
Equities - - - 269 - 269
Total Held at FVIS 262,159 127,676 2,014,912 2,673,577 2,277,071 2,801,253
FVIS investments above include investments held for trading of SAR 312.8 million (2016: SAR 861.8 million). The designated FVIS investments included above are so designated when the financial instruments include one or more embedded derivatives or are being evaluated on a fair value basis and are in accordance with the documented risk management strategy of the Group.
ii) Available for sale
Domestic International Total
2017
SAR ‘000 2016
SAR ‘000 2017
SAR ‘000 2016
SAR ‘000 2017
SAR ‘000 2016
SAR ‘000
Fixed rate securities 2,378,119 2,399,443 7,369,155 6,727,937 9,747,274 9,127,380
Floating rate notes 4,227,774 2,689,583 6,791,386 4,563,371 11,019,160 7,252,954
Private equity - - 620,956 671,500 620,956 671,500
Equities 2,918,704 2,661,369 80,492 31,911 2,999,196 2,693,280
Total Available for sale 9,524,597 7,750,395 14,861,989 11,994,719 24,386,586 19,745,114
iii) Held to maturity
International Total
2017
SAR ‘000 2016
SAR ‘000 2017
SAR ‘000 2016
SAR ‘000
Fixed rate securities 3,178,930 2,981,574 3,178,930 2,981,574
Total Held to maturity 3,178,930 2,981,574 3,178,930 2,981,574
Samba Financial Group
PUBLIC
25
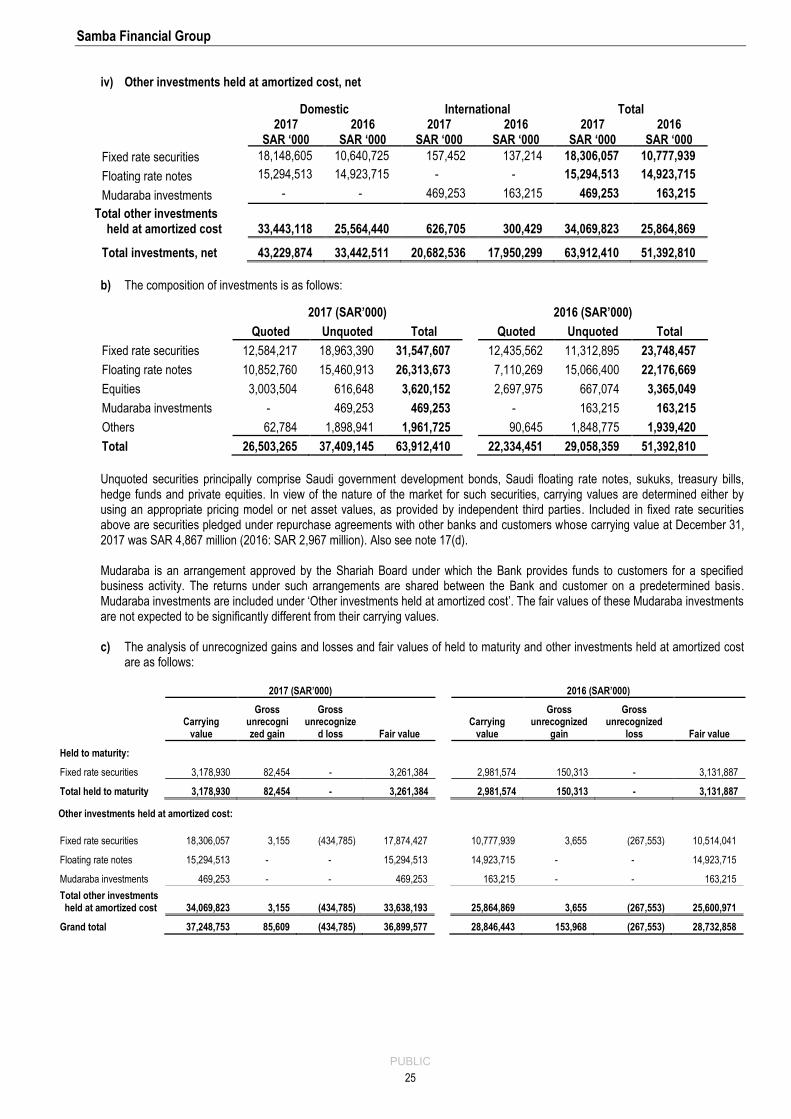
iv) Other investments held at amortized cost, net
Domestic International Total
2017
SAR ‘000 2016
SAR ‘000 2017
SAR ‘000 2016
SAR ‘000 2017
SAR ‘000 2016
SAR ‘000
Fixed rate securities 18,148,605 10,640,725 157,452 137,214 18,306,057 10,777,939
Floating rate notes 15,294,513 14,923,715 - - 15,294,513 14,923,715
Mudaraba investments - - 469,253 163,215 469,253 163,215
Total other investments held at amortized cost 33,443,118 25,564,440 626,705 300,429 34,069,823 25,864,869
Total investments, net 43,229,874 33,442,511 20,682,536 17,950,299 63,912,410 51,392,810
b) The composition of investments is as follows:
2017 (SAR’000) 2016 (SAR’000)
Quoted Unquoted Total Quoted Unquoted Total
Fixed rate securities 12,584,217 18,963,390 31,547,607 12,435,562 11,312,895 23,748,457
Floating rate notes 10,852,760 15,460,913 26,313,673 7,110,269 15,066,400 22,176,669
Equities 3,003,504 616,648 3,620,152 2,697,975 667,074 3,365,049
Mudaraba investments - 469,253 469,253 - 163,215 163,215
Others 62,784 1,898,941 1,961,725 90,645 1,848,775 1,939,420
Total 26,503,265 37,409,145 63,912,410 22,334,451 29,058,359 51,392,810
Unquoted securities principally comprise Saudi government development bonds, Saudi floating rate notes, sukuks, treasury bills, hedge funds and private equities. In view of the nature of the market for such securities, carrying values are determined either by using an appropriate pricing model or net asset values, as provided by independent third parties. Included in fixed rate securities above are securities pledged under repurchase agreements with other banks and customers whose carrying value at December 31, 2017 was SAR 4,867 million (2016: SAR 2,967 million). Also see note 17(d). Mudaraba is an arrangement approved by the Shariah Board under which the Bank provides funds to customers for a specified business activity. The returns under such arrangements are shared between the Bank and customer on a predetermined basis. Mudaraba investments are included under ‘Other investments held at amortized cost’. The fair values of these Mudaraba investments are not expected to be significantly different from their carrying values. c) The analysis of unrecognized gains and losses and fair values of held to maturity and other investments held at amortized cost
are as follows:
2017 (SAR’000) 2016 (SAR’000)
Carrying
value
Gross unrecognized gain
Gross unrecognize
d loss Fair value Carrying
value
Gross unrecognized
gain
Gross unrecognized
loss Fair value
Held to maturity:
Fixed rate securities 3,178,930 82,454 - 3,261,384 2,981,574 150,313 - 3,131,887
Total held to maturity 3,178,930 82,454 - 3,261,384 2,981,574 150,313 - 3,131,887
Other investments held at amortized cost:
Fixed rate securities 18,306,057 3,155 (434,785) 17,874,427 10,777,939 3,655 (267,553) 10,514,041
Floating rate notes 15,294,513 - - 15,294,513 14,923,715 - - 14,923,715
Mudaraba investments 469,253 - - 469,253 163,215 - - 163,215
Total other investments held at amortized cost 34,069,823 3,155 (434,785) 33,638,193 25,864,869 3,655 (267,553) 25,600,971
Grand total 37,248,753 85,609 (434,785) 36,899,577 28,846,443 153,968 (267,553) 28,732,858
Samba Financial Group
PUBLIC
26
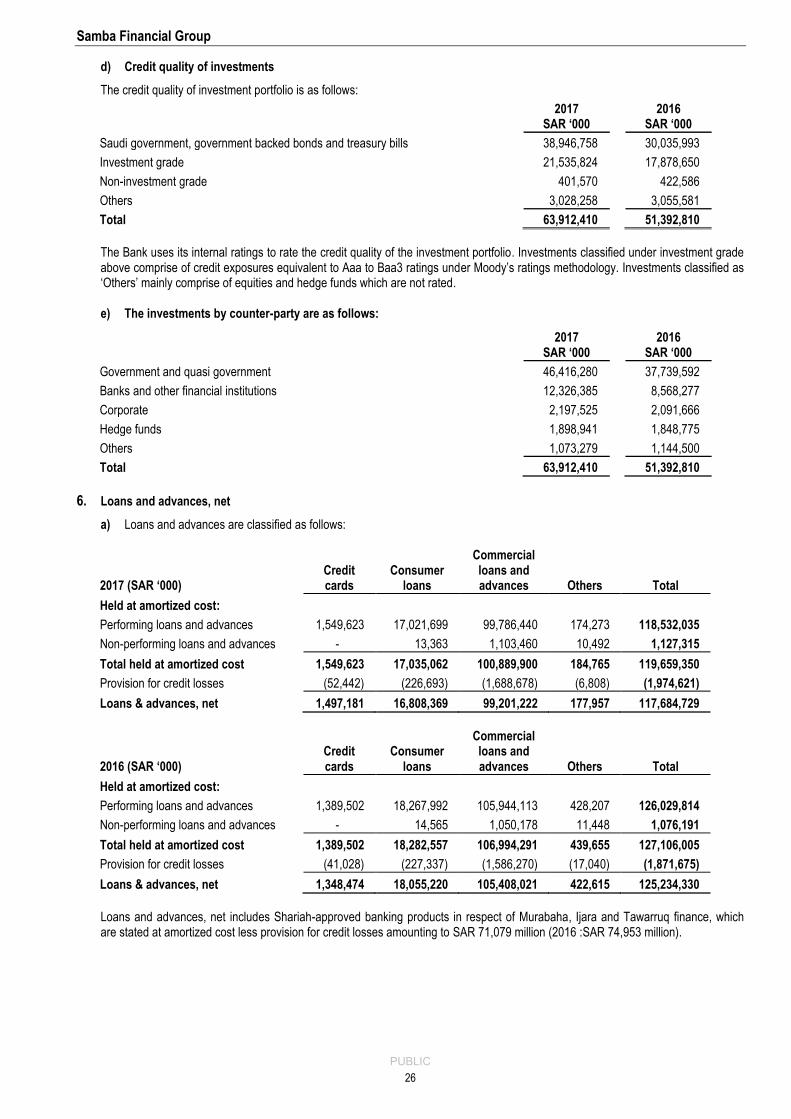
d) Credit quality of investments
The credit quality of investment portfolio is as follows:
2017
SAR ‘000 2016
SAR ‘000
Saudi government, government backed bonds and treasury bills 38,946,758 30,035,993
Investment grade 21,535,824 17,878,650
Non-investment grade 401,570 422,586
Others 3,028,258 3,055,581
Total 63,912,410 51,392,810
The Bank uses its internal ratings to rate the credit quality of the investment portfolio. Investments classified under investment grade above comprise of credit exposures equivalent to Aaa to Baa3 ratings under Moody’s ratings methodology. Investments classified as ‘Others’ mainly comprise of equities and hedge funds which are not rated. e) The investments by counter-party are as follows:
2017
SAR ‘000 2016
SAR ‘000
Government and quasi government 46,416,280 37,739,592
Banks and other financial institutions 12,326,385 8,568,277
Corporate 2,197,525 2,091,666
Hedge funds 1,898,941 1,848,775
Others 1,073,279 1,144,500
Total 63,912,410 51,392,810
6. Loans and advances, net
a) Loans and advances are classified as follows:
2017 (SAR ‘000) Credit cards
Consumer loans
Commercial loans and advances Others Total
Held at amortized cost:
Performing loans and advances 1,549,623 17,021,699 99,786,440 174,273 118,532,035
Non-performing loans and advances - 13,363 1,103,460 10,492 1,127,315
Total held at amortized cost 1,549,623 17,035,062 100,889,900 184,765 119,659,350
Provision for credit losses (52,442) (226,693) (1,688,678) (6,808) (1,974,621)
Loans & advances, net 1,497,181 16,808,369 99,201,222 177,957 117,684,729
2016 (SAR ‘000) Credit cards
Consumer loans
Commercial loans and advances Others Total
Held at amortized cost:
Performing loans and advances 1,389,502 18,267,992 105,944,113 428,207 126,029,814
Non-performing loans and advances - 14,565 1,050,178 11,448 1,076,191
Total held at amortized cost 1,389,502 18,282,557 106,994,291 439,655 127,106,005
Provision for credit losses (41,028) (227,337) (1,586,270) (17,040) (1,871,675)
Loans & advances, net 1,348,474 18,055,220 105,408,021 422,615 125,234,330
Loans and advances, net includes Shariah-approved banking products in respect of Murabaha, Ijara and Tawarruq finance, which are stated at amortized cost less provision for credit losses amounting to SAR 71,079 million (2016 :SAR 74,953 million).
Samba Financial Group
PUBLIC
27
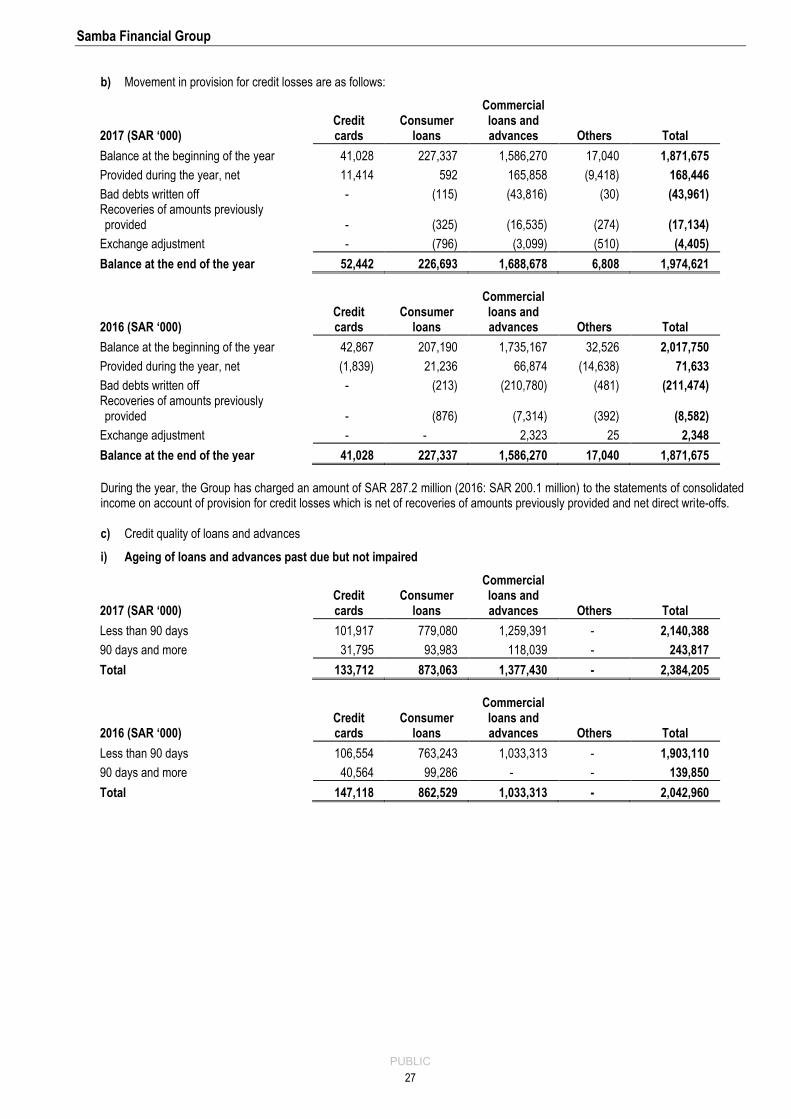
b) Movement in provision for credit losses are as follows:
2017 (SAR ‘000) Credit cards
Consumer loans
Commercial loans and advances Others Total
Balance at the beginning of the year 41,028 227,337 1,586,270 17,040 1,871,675
Provided during the year, net 11,414 592 165,858 (9,418) 168,446
Bad debts written off - (115) (43,816) (30) (43,961) Recoveries of amounts previously provided - (325) (16,535) (274) (17,134)
Exchange adjustment - (796) (3,099) (510) (4,405)
Balance at the end of the year 52,442 226,693 1,688,678 6,808 1,974,621
2016 (SAR ‘000) Credit cards
Consumer loans
Commercial loans and advances Others Total
Balance at the beginning of the year 42,867 207,190 1,735,167 32,526 2,017,750
Provided during the year, net (1,839) 21,236 66,874 (14,638) 71,633
Bad debts written off - (213) (210,780) (481) (211,474) Recoveries of amounts previously provided - (876) (7,314) (392) (8,582)
Exchange adjustment - - 2,323 25 2,348
Balance at the end of the year 41,028 227,337 1,586,270 17,040 1,871,675
During the year, the Group has charged an amount of SAR 287.2 million (2016: SAR 200.1 million) to the statements of consolidated income on account of provision for credit losses which is net of recoveries of amounts previously provided and net direct write-offs. c) Credit quality of loans and advances
i) Ageing of loans and advances past due but not impaired
2017 (SAR ‘000) Credit cards
Consumer loans
Commercial loans and advances Others Total
Less than 90 days 101,917 779,080 1,259,391 - 2,140,388
90 days and more 31,795 93,983 118,039 - 243,817
Total 133,712 873,063 1,377,430 - 2,384,205
2016 (SAR ‘000) Credit cards
Consumer loans
Commercial loans and advances Others Total
Less than 90 days 106,554 763,243 1,033,313 - 1,903,110
90 days and more 40,564 99,286 - - 139,850
Total 147,118 862,529 1,033,313 - 2,042,960
Samba Financial Group
PUBLIC
28
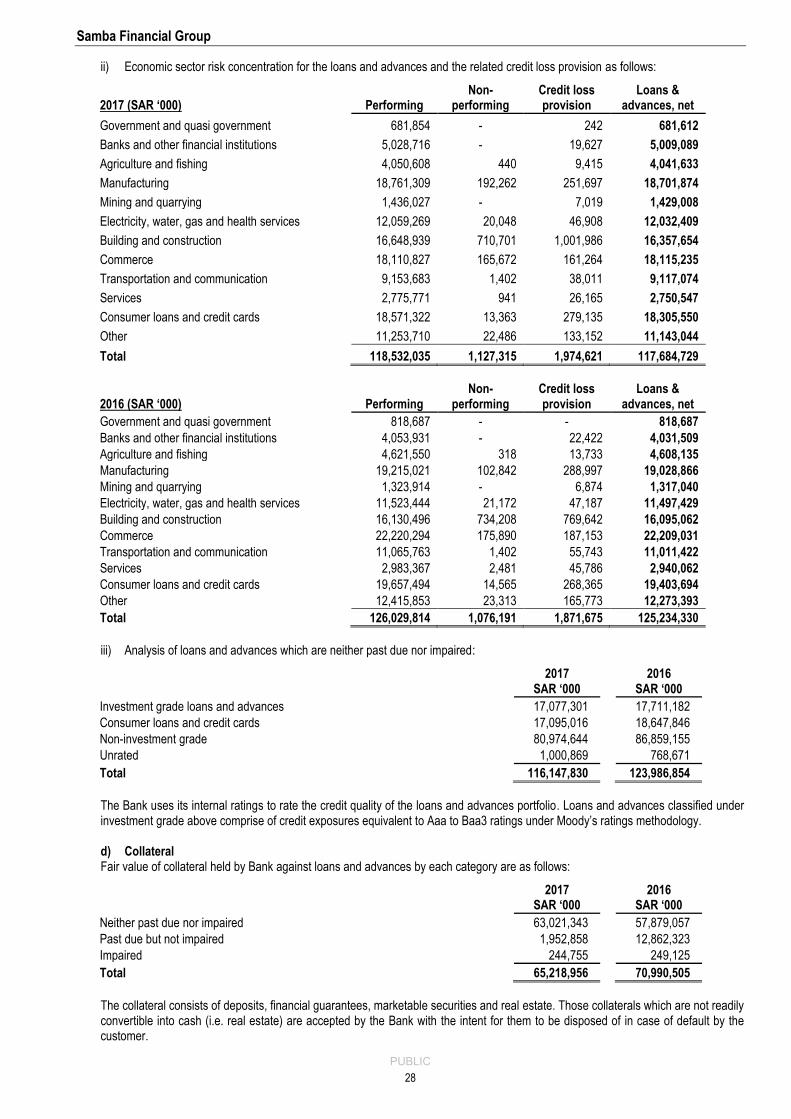
ii) Economic sector risk concentration for the loans and advances and the related credit loss provision as follows:
2017 (SAR ‘000) Performing Non-
performing Credit loss provision
Loans & advances, net
Government and quasi government 681,854 - 242 681,612
Banks and other financial institutions 5,028,716 - 19,627 5,009,089
Agriculture and fishing 4,050,608 440 9,415 4,041,633
Manufacturing 18,761,309 192,262 251,697 18,701,874
Mining and quarrying 1,436,027 - 7,019 1,429,008
Electricity, water, gas and health services 12,059,269 20,048 46,908 12,032,409
Building and construction 16,648,939 710,701 1,001,986 16,357,654
Commerce 18,110,827 165,672 161,264 18,115,235
Transportation and communication 9,153,683 1,402 38,011 9,117,074
Services 2,775,771 941 26,165 2,750,547
Consumer loans and credit cards 18,571,322 13,363 279,135 18,305,550
Other 11,253,710 22,486 133,152 11,143,044
Total 118,532,035 1,127,315 1,974,621 117,684,729
2016 (SAR ‘000) Performing Non-
performing Credit loss provision
Loans & advances, net
Government and quasi government 818,687 - - 818,687
Banks and other financial institutions 4,053,931 - 22,422 4,031,509
Agriculture and fishing 4,621,550 318 13,733 4,608,135
Manufacturing 19,215,021 102,842 288,997 19,028,866
Mining and quarrying 1,323,914 - 6,874 1,317,040
Electricity, water, gas and health services 11,523,444 21,172 47,187 11,497,429
Building and construction 16,130,496 734,208 769,642 16,095,062
Commerce 22,220,294 175,890 187,153 22,209,031
Transportation and communication 11,065,763 1,402 55,743 11,011,422
Services 2,983,367 2,481 45,786 2,940,062
Consumer loans and credit cards 19,657,494 14,565 268,365 19,403,694
Other 12,415,853 23,313 165,773 12,273,393
Total 126,029,814 1,076,191 1,871,675 125,234,330
iii) Analysis of loans and advances which are neither past due nor impaired:
2017
SAR ‘000 2016
SAR ‘000
Investment grade loans and advances 17,077,301 17,711,182
Consumer loans and credit cards 17,095,016 18,647,846
Non-investment grade 80,974,644 86,859,155
Unrated 1,000,869 768,671
Total 116,147,830 123,986,854
The Bank uses its internal ratings to rate the credit quality of the loans and advances portfolio. Loans and advances classified under investment grade above comprise of credit exposures equivalent to Aaa to Baa3 ratings under Moody’s ratings methodology. d) Collateral Fair value of collateral held by Bank against loans and advances by each category are as follows:
2017
SAR ‘000 2016
SAR ‘000
Neither past due nor impaired 63,021,343 57,879,057
Past due but not impaired 1,952,858 12,862,323
Impaired 244,755 249,125
Total 65,218,956 70,990,505
The collateral consists of deposits, financial guarantees, marketable securities and real estate. Those collaterals which are not readily convertible into cash (i.e. real estate) are accepted by the Bank with the intent for them to be disposed of in case of default by the customer.
Samba Financial Group
PUBLIC
29
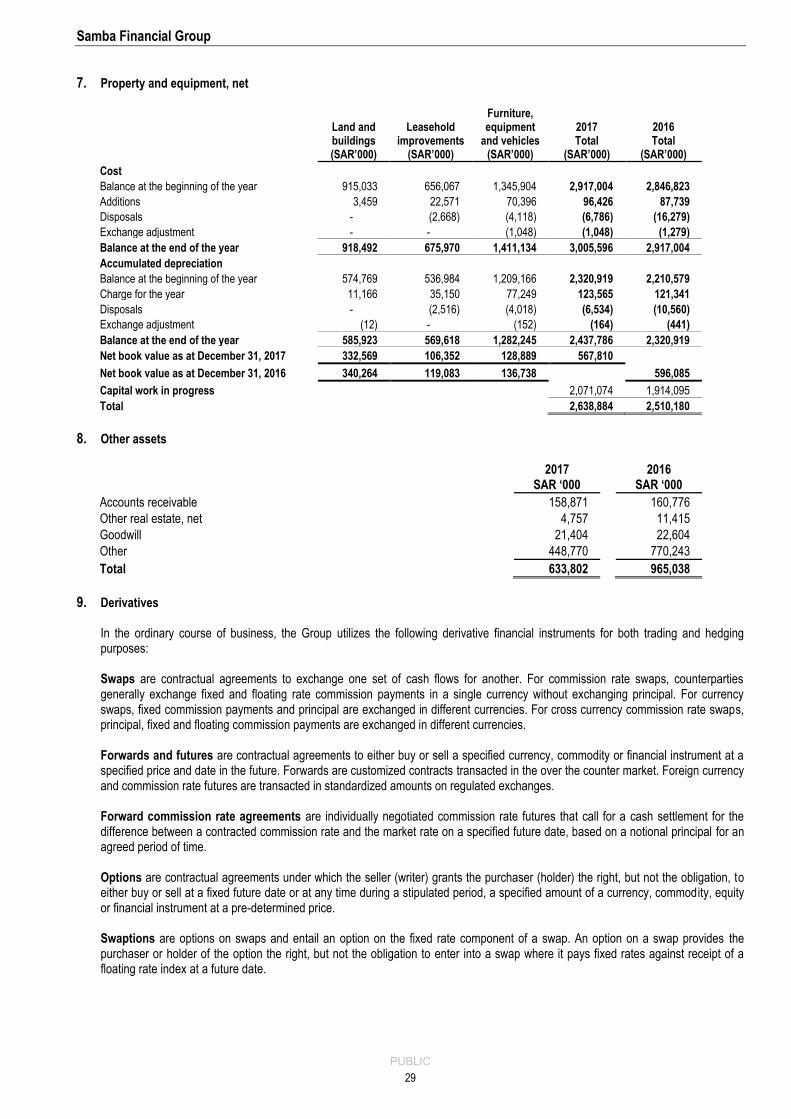
7. Property and equipment, net
Land and buildings (SAR’000)
Leasehold improvements
(SAR’000)
Furniture, equipment
and vehicles (SAR’000)
2017 Total
(SAR’000)
2016 Total
(SAR’000)
Cost
Balance at the beginning of the year 915,033 656,067 1,345,904 2,917,004 2,846,823
Additions 3,459 22,571 70,396 96,426 87,739
Disposals - (2,668) (4,118) (6,786) (16,279)
Exchange adjustment - - (1,048) (1,048) (1,279)
Balance at the end of the year 918,492 675,970 1,411,134 3,005,596 2,917,004
Accumulated depreciation
Balance at the beginning of the year 574,769 536,984 1,209,166 2,320,919 2,210,579
Charge for the year 11,166 35,150 77,249 123,565 121,341
Disposals - (2,516) (4,018) (6,534) (10,560)
Exchange adjustment (12) - (152) (164) (441)
Balance at the end of the year 585,923 569,618 1,282,245 2,437,786 2,320,919
Net book value as at December 31, 2017 332,569 106,352 128,889 567,810
Net book value as at December 31, 2016 340,264 119,083 136,738 596,085
Capital work in progress 2,071,074 1,914,095
Total 2,638,884 2,510,180
8. Other assets
2017
SAR ‘000 2016
SAR ‘000
Accounts receivable 158,871 160,776
Other real estate, net 4,757 11,415
Goodwill 21,404 22,604
Other 448,770 770,243
Total 633,802 965,038
9. Derivatives In the ordinary course of business, the Group utilizes the following derivative financial instruments for both trading and hedging purposes: Swaps are contractual agreements to exchange one set of cash flows for another. For commission rate swaps, counterparties generally exchange fixed and floating rate commission payments in a single currency without exchanging principal. For currency swaps, fixed commission payments and principal are exchanged in different currencies. For cross currency commission rate swaps, principal, fixed and floating commission payments are exchanged in different currencies. Forwards and futures are contractual agreements to either buy or sell a specified currency, commodity or financial instrument at a specified price and date in the future. Forwards are customized contracts transacted in the over the counter market. Foreign currency and commission rate futures are transacted in standardized amounts on regulated exchanges. Forward commission rate agreements are individually negotiated commission rate futures that call for a cash settlement for the difference between a contracted commission rate and the market rate on a specified future date, based on a notional principal for an agreed period of time. Options are contractual agreements under which the seller (writer) grants the purchaser (holder) the right, but not the obligation, to either buy or sell at a fixed future date or at any time during a stipulated period, a specified amount of a currency, commodity, equity or financial instrument at a pre-determined price. Swaptions are options on swaps and entail an option on the fixed rate component of a swap. An option on a swap provides the purchaser or holder of the option the right, but not the obligation to enter into a swap where it pays fixed rates against receipt of a floating rate index at a future date.
Samba Financial Group
PUBLIC
30
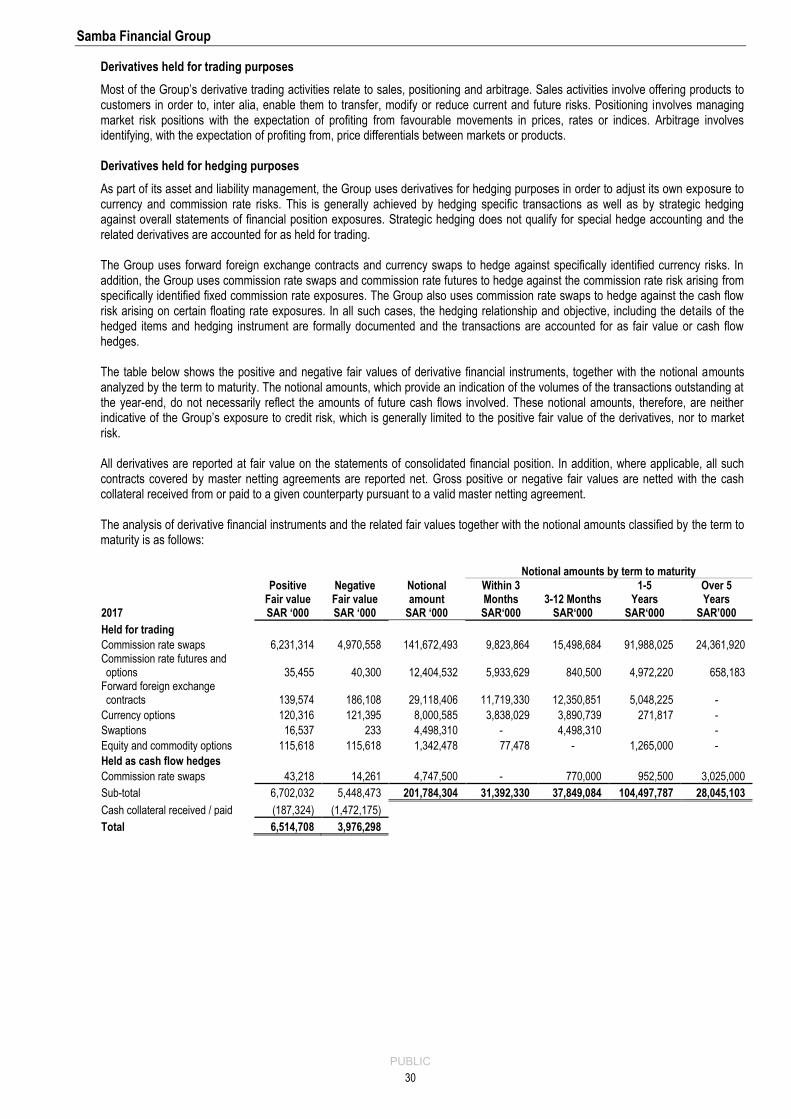
Derivatives held for trading purposes
Most of the Group’s derivative trading activities relate to sales, positioning and arbitrage. Sales activities involve offering products to customers in order to, inter alia, enable them to transfer, modify or reduce current and future risks. Positioning involves managing market risk positions with the expectation of profiting from favourable movements in prices, rates or indices. Arbitrage involves identifying, with the expectation of profiting from, price differentials between markets or products. Derivatives held for hedging purposes
As part of its asset and liability management, the Group uses derivatives for hedging purposes in order to adjust its own exposure to currency and commission rate risks. This is generally achieved by hedging specific transactions as well as by strategic hedging against overall statements of financial position exposures. Strategic hedging does not qualify for special hedge accounting and the related derivatives are accounted for as held for trading. The Group uses forward foreign exchange contracts and currency swaps to hedge against specifically identified currency risks. In addition, the Group uses commission rate swaps and commission rate futures to hedge against the commission rate risk arising from specifically identified fixed commission rate exposures. The Group also uses commission rate swaps to hedge against the cash flow risk arising on certain floating rate exposures. In all such cases, the hedging relationship and objective, including the details of the hedged items and hedging instrument are formally documented and the transactions are accounted for as fair value or cash flow hedges. The table below shows the positive and negative fair values of derivative financial instruments, together with the notional amounts analyzed by the term to maturity. The notional amounts, which provide an indication of the volumes of the transactions outstanding at the year-end, do not necessarily reflect the amounts of future cash flows involved. These notional amounts, therefore, are neither indicative of the Group’s exposure to credit risk, which is generally limited to the positive fair value of the derivatives, nor to market risk. All derivatives are reported at fair value on the statements of consolidated financial position. In addition, where applicable, all such contracts covered by master netting agreements are reported net. Gross positive or negative fair values are netted with the cash collateral received from or paid to a given counterparty pursuant to a valid master netting agreement. The analysis of derivative financial instruments and the related fair values together with the notional amounts classified by the term to maturity is as follows:
Notional amounts by term to maturity
2017
Positive Fair value SAR ‘000
Negative Fair value SAR ‘000
Notional amount
SAR ‘000
Within 3 Months SAR‘000
3-12 Months SAR‘000
1-5 Years
SAR‘000
Over 5 Years
SAR’000
Held for trading
Commission rate swaps 6,231,314 4,970,558 141,672,493 9,823,864 15,498,684 91,988,025 24,361,920 Commission rate futures and options 35,455 40,300 12,404,532 5,933,629 840,500 4,972,220 658,183
Forward foreign exchange contracts 139,574 186,108 29,118,406 11,719,330 12,350,851 5,048,225 -
Currency options 120,316 121,395 8,000,585 3,838,029 3,890,739 271,817 -
Swaptions 16,537 233 4,498,310 - 4,498,310 -
Equity and commodity options 115,618 115,618 1,342,478 77,478 - 1,265,000 -
Held as cash flow hedges
Commission rate swaps 43,218 14,261 4,747,500 - 770,000 952,500 3,025,000
Sub-total 6,702,032 5,448,473 201,784,304 31,392,330 37,849,084 104,497,787 28,045,103
Cash collateral received / paid (187,324) (1,472,175)
Total 6,514,708 3,976,298
Samba Financial Group
PUBLIC
31
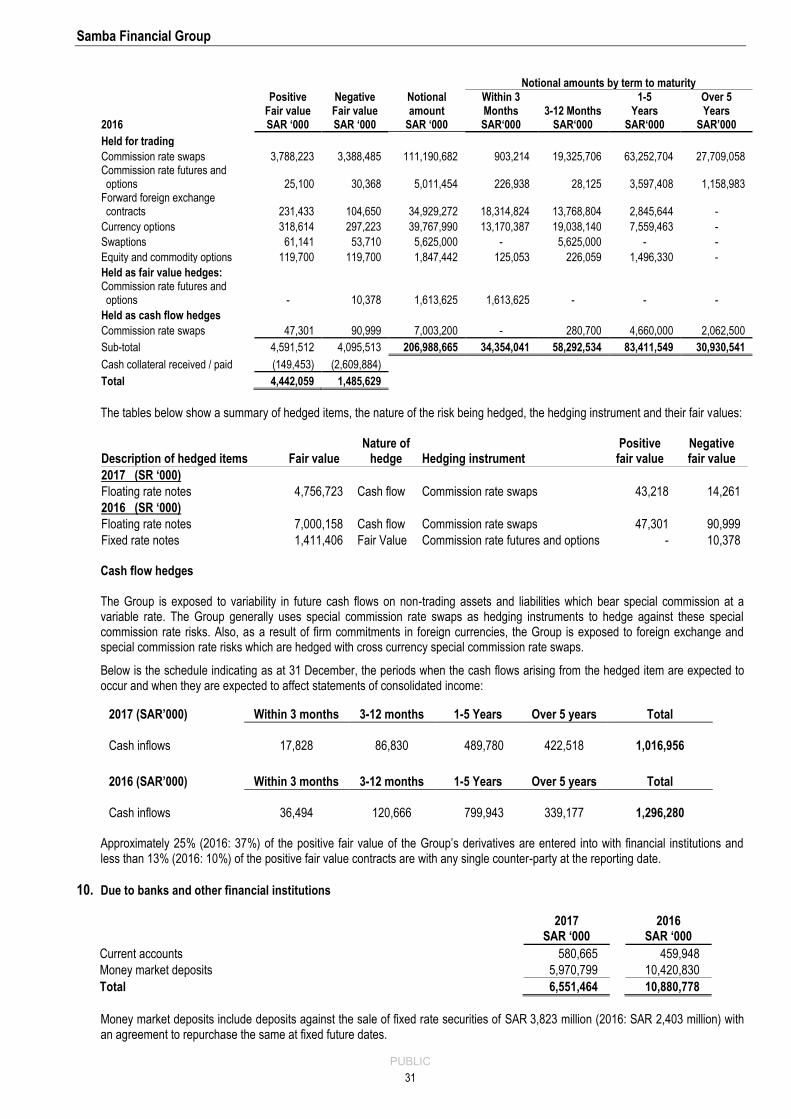
Notional amounts by term to maturity
2016
Positive Fair value SAR ‘000
Negative Fair value SAR ‘000
Notional amount
SAR ‘000
Within 3 Months SAR‘000
3-12 Months SAR‘000
1-5 Years
SAR‘000
Over 5 Years
SAR’000
Held for trading
Commission rate swaps 3,788,223 3,388,485 111,190,682 903,214 19,325,706 63,252,704 27,709,058 Commission rate futures and options 25,100 30,368 5,011,454 226,938 28,125 3,597,408 1,158,983
Forward foreign exchange contracts 231,433 104,650 34,929,272 18,314,824 13,768,804 2,845,644 -
Currency options 318,614 297,223 39,767,990 13,170,387 19,038,140 7,559,463 -
Swaptions 61,141 53,710 5,625,000 - 5,625,000 - -
Equity and commodity options 119,700 119,700 1,847,442 125,053 226,059 1,496,330 -
Held as fair value hedges: Commission rate futures and options - 10,378 1,613,625 1,613,625 - - -
Held as cash flow hedges
Commission rate swaps 47,301 90,999 7,003,200 - 280,700 4,660,000 2,062,500
Sub-total 4,591,512 4,095,513 206,988,665 34,354,041 58,292,534 83,411,549 30,930,541
Cash collateral received / paid (149,453) (2,609,884)
Total 4,442,059 1,485,629
The tables below show a summary of hedged items, the nature of the risk being hedged, the hedging instrument and their fair values:
Description of hedged items Fair value Nature of
hedge Hedging instrument Positive
fair value Negative fair value
2017 (SR ‘000)
Floating rate notes 4,756,723 Cash flow Commission rate swaps 43,218 14,261
2016 (SR ‘000)
Floating rate notes 7,000,158 Cash flow Commission rate swaps 47,301 90,999
Fixed rate notes 1,411,406 Fair Value Commission rate futures and options - 10,378 Cash flow hedges The Group is exposed to variability in future cash flows on non-trading assets and liabilities which bear special commission at a variable rate. The Group generally uses special commission rate swaps as hedging instruments to hedge against these special commission rate risks. Also, as a result of firm commitments in foreign currencies, the Group is exposed to foreign exchange and special commission rate risks which are hedged with cross currency special commission rate swaps.
Below is the schedule indicating as at 31 December, the periods when the cash flows arising from the hedged item are expected to occur and when they are expected to affect statements of consolidated income:
Approximately 25% (2016: 37%) of the positive fair value of the Group’s derivatives are entered into with financial institutions and less than 13% (2016: 10%) of the positive fair value contracts are with any single counter-party at the reporting date.
10. Due to banks and other financial institutions
2017
SAR ‘000 2016
SAR ‘000
Current accounts 580,665 459,948
Money market deposits 5,970,799 10,420,830
Total 6,551,464 10,880,778
Money market deposits include deposits against the sale of fixed rate securities of SAR 3,823 million (2016: SAR 2,403 million) with an agreement to repurchase the same at fixed future dates.
2017 (SAR’000) Within 3 months 3-12 months 1-5 Years Over 5 years Total
Cash inflows 17,828 86,830 489,780 422,518 1,016,956
2016 (SAR’000) Within 3 months 3-12 months 1-5 Years Over 5 years Total
Cash inflows 36,494 120,666 799,943 339,177 1,296,280
Samba Financial Group
PUBLIC
32
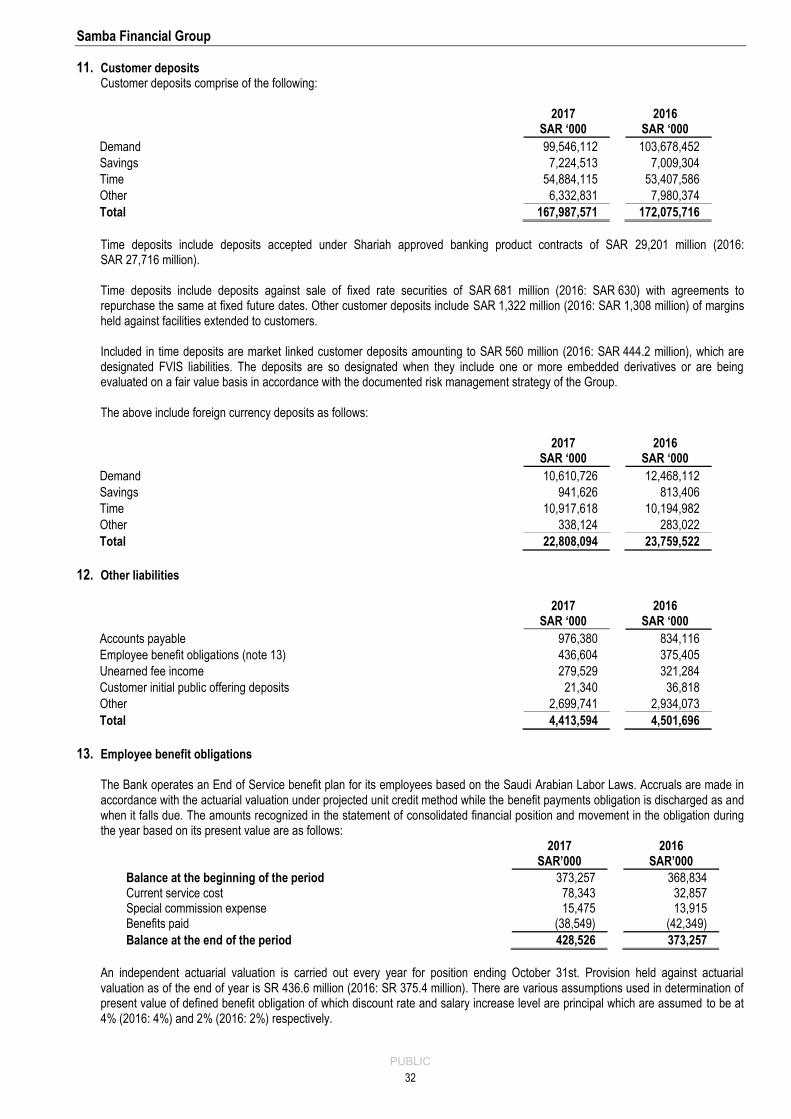
11. Customer deposits Customer deposits comprise of the following:
2017
SAR ‘000 2016
SAR ‘000
Demand 99,546,112 103,678,452
Savings 7,224,513 7,009,304
Time 54,884,115 53,407,586
Other 6,332,831 7,980,374
Total 167,987,571 172,075,716
Time deposits include deposits accepted under Shariah approved banking product contracts of SAR 29,201 million (2016: SAR 27,716 million). Time deposits include deposits against sale of fixed rate securities of SAR 681 million (2016: SAR 630) with agreements to repurchase the same at fixed future dates. Other customer deposits include SAR 1,322 million (2016: SAR 1,308 million) of margins held against facilities extended to customers. Included in time deposits are market linked customer deposits amounting to SAR 560 million (2016: SAR 444.2 million), which are designated FVIS liabilities. The deposits are so designated when they include one or more embedded derivatives or are being evaluated on a fair value basis in accordance with the documented risk management strategy of the Group. The above include foreign currency deposits as follows:
2017
SAR ‘000 2016
SAR ‘000
Demand 10,610,726 12,468,112
Savings 941,626 813,406
Time 10,917,618 10,194,982
Other 338,124 283,022
Total 22,808,094 23,759,522
12. Other liabilities
2017
SAR ‘000 2016
SAR ‘000
Accounts payable 976,380 834,116
Employee benefit obligations (note 13) 436,604 375,405
Unearned fee income 279,529 321,284
Customer initial public offering deposits 21,340 36,818
Other 2,699,741 2,934,073
Total 4,413,594 4,501,696
13. Employee benefit obligations The Bank operates an End of Service benefit plan for its employees based on the Saudi Arabian Labor Laws. Accruals are made in accordance with the actuarial valuation under projected unit credit method while the benefit payments obligation is discharged as and when it falls due. The amounts recognized in the statement of consolidated financial position and movement in the obligation during the year based on its present value are as follows:
2017
SAR’000 2016
SAR’000
Balance at the beginning of the period 373,257 368,834 Current service cost 78,343 32,857 Special commission expense 15,475 13,915 Benefits paid (38,549) (42,349)
Balance at the end of the period 428,526 373,257
An independent actuarial valuation is carried out every year for position ending October 31st. Provision held against actuarial valuation as of the end of year is SR 436.6 million (2016: SR 375.4 million). There are various assumptions used in determination of present value of defined benefit obligation of which discount rate and salary increase level are principal which are assumed to be at 4% (2016: 4%) and 2% (2016: 2%) respectively.
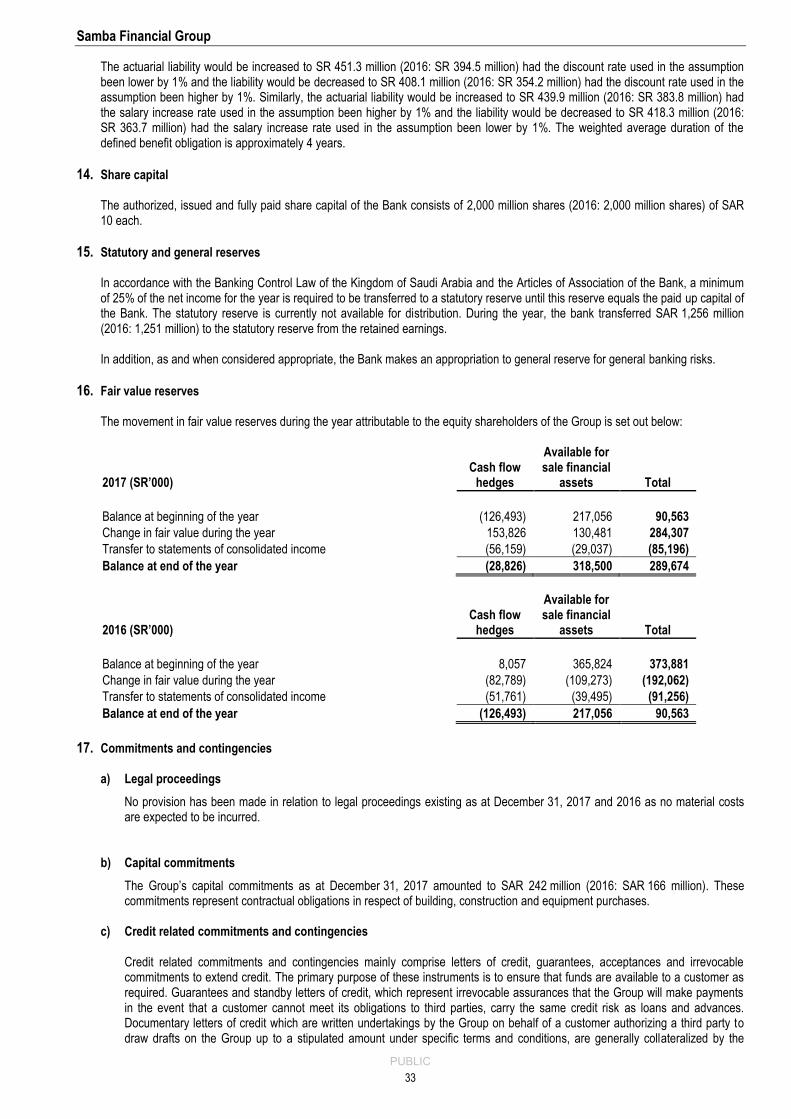
Samba Financial Group
PUBLIC
33
The actuarial liability would be increased to SR 451.3 million (2016: SR 394.5 million) had the discount rate used in the assumption been lower by 1% and the liability would be decreased to SR 408.1 million (2016: SR 354.2 million) had the discount rate used in the assumption been higher by 1%. Similarly, the actuarial liability would be increased to SR 439.9 million (2016: SR 383.8 million) had the salary increase rate used in the assumption been higher by 1% and the liability would be decreased to SR 418.3 million (2016: SR 363.7 million) had the salary increase rate used in the assumption been lower by 1%. The weighted average duration of the defined benefit obligation is approximately 4 years.
14. Share capital The authorized, issued and fully paid share capital of the Bank consists of 2,000 million shares (2016: 2,000 million shares) of SAR 10 each.
15. Statutory and general reserves In accordance with the Banking Control Law of the Kingdom of Saudi Arabia and the Articles of Association of the Bank, a minimum of 25% of the net income for the year is required to be transferred to a statutory reserve until this reserve equals the paid up capital of the Bank. The statutory reserve is currently not available for distribution. During the year, the bank transferred SAR 1,256 million (2016: 1,251 million) to the statutory reserve from the retained earnings. In addition, as and when considered appropriate, the Bank makes an appropriation to general reserve for general banking risks.
16. Fair value reserves The movement in fair value reserves during the year attributable to the equity shareholders of the Group is set out below:
2017 (SR’000) Cash flow
hedges
Available for sale financial
assets Total
Balance at beginning of the year (126,493) 217,056 90,563
Change in fair value during the year 153,826 130,481 284,307
Transfer to statements of consolidated income (56,159) (29,037) (85,196)
Balance at end of the year (28,826) 318,500 289,674
2016 (SR’000) Cash flow
hedges
Available for sale financial
assets Total
Balance at beginning of the year 8,057 365,824 373,881
Change in fair value during the year (82,789) (109,273) (192,062)
Transfer to statements of consolidated income (51,761) (39,495) (91,256)
Balance at end of the year (126,493) 217,056 90,563
17. Commitments and contingencies
a) Legal proceedings
No provision has been made in relation to legal proceedings existing as at December 31, 2017 and 2016 as no material costs are expected to be incurred.
b) Capital commitments
The Group’s capital commitments as at December 31, 2017 amounted to SAR 242 million (2016: SAR 166 million). These commitments represent contractual obligations in respect of building, construction and equipment purchases.
c) Credit related commitments and contingencies Credit related commitments and contingencies mainly comprise letters of credit, guarantees, acceptances and irrevocable commitments to extend credit. The primary purpose of these instruments is to ensure that funds are available to a customer as required. Guarantees and standby letters of credit, which represent irrevocable assurances that the Group will make payments in the event that a customer cannot meet its obligations to third parties, carry the same credit risk as loans and advances. Documentary letters of credit which are written undertakings by the Group on behalf of a customer authorizing a third party to draw drafts on the Group up to a stipulated amount under specific terms and conditions, are generally collateralized by the
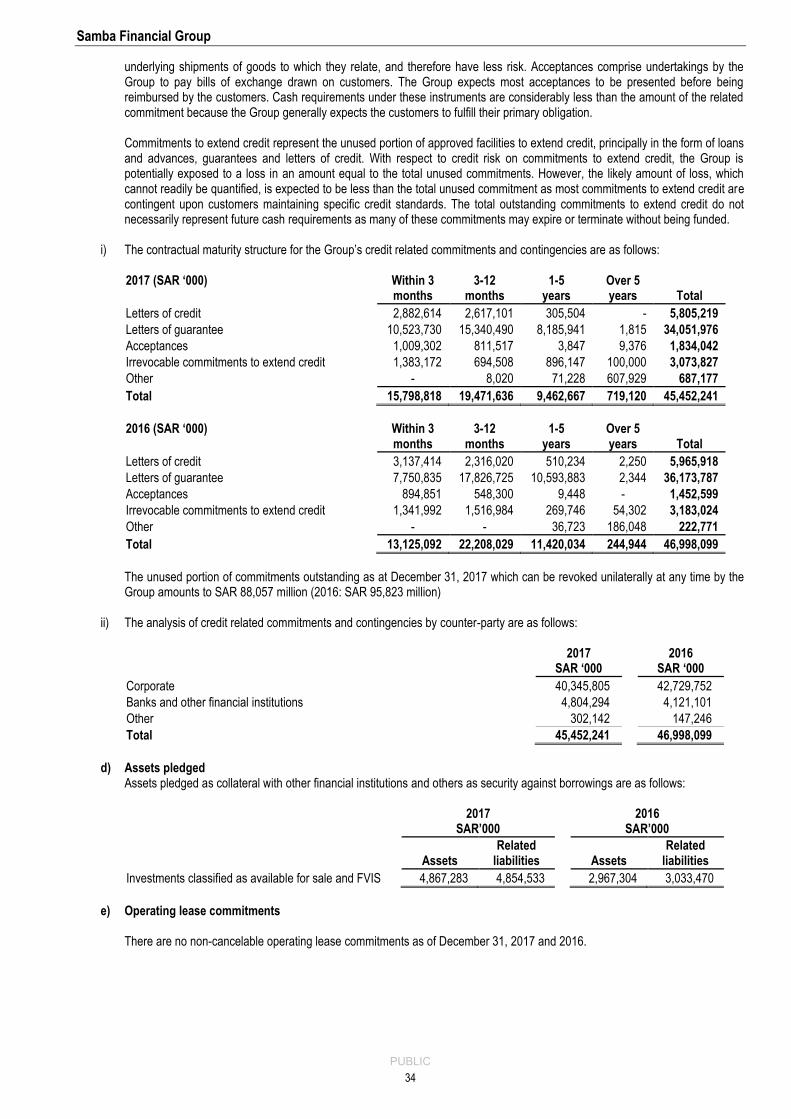
Samba Financial Group
PUBLIC
34
underlying shipments of goods to which they relate, and therefore have less risk. Acceptances comprise undertakings by the Group to pay bills of exchange drawn on customers. The Group expects most acceptances to be presented before being reimbursed by the customers. Cash requirements under these instruments are considerably less than the amount of the related commitment because the Group generally expects the customers to fulfill their primary obligation. Commitments to extend credit represent the unused portion of approved facilities to extend credit, principally in the form of loans and advances, guarantees and letters of credit. With respect to credit risk on commitments to extend credit, the Group is potentially exposed to a loss in an amount equal to the total unused commitments. However, the likely amount of loss, which cannot readily be quantified, is expected to be less than the total unused commitment as most commitments to extend credit are contingent upon customers maintaining specific credit standards. The total outstanding commitments to extend credit do not necessarily represent future cash requirements as many of these commitments may expire or terminate without being funded.
i) The contractual maturity structure for the Group’s credit related commitments and contingencies are as follows:
2017 (SAR ‘000) Within 3 months
3-12 months
1-5 years
Over 5 years Total
Letters of credit 2,882,614 2,617,101 305,504 - 5,805,219
Letters of guarantee 10,523,730 15,340,490 8,185,941 1,815 34,051,976
Acceptances 1,009,302 811,517 3,847 9,376 1,834,042
Irrevocable commitments to extend credit 1,383,172 694,508 896,147 100,000 3,073,827
Other - 8,020 71,228 607,929 687,177
Total 15,798,818 19,471,636 9,462,667 719,120 45,452,241
2016 (SAR ‘000) Within 3
months 3-12
months 1-5
years Over 5 years Total
Letters of credit 3,137,414 2,316,020 510,234 2,250 5,965,918
Letters of guarantee 7,750,835 17,826,725 10,593,883 2,344 36,173,787
Acceptances 894,851 548,300 9,448 - 1,452,599
Irrevocable commitments to extend credit 1,341,992 1,516,984 269,746 54,302 3,183,024
Other - - 36,723 186,048 222,771
Total 13,125,092 22,208,029 11,420,034 244,944 46,998,099
The unused portion of commitments outstanding as at December 31, 2017 which can be revoked unilaterally at any time by the Group amounts to SAR 88,057 million (2016: SAR 95,823 million)
ii) The analysis of credit related commitments and contingencies by counter-party are as follows:
2017
SAR ‘000 2016
SAR ‘000
Corporate 40,345,805 42,729,752
Banks and other financial institutions 4,804,294 4,121,101
Other 302,142 147,246
Total 45,452,241 46,998,099
d) Assets pledged
Assets pledged as collateral with other financial institutions and others as security against borrowings are as follows:
2017
SAR’000 2016
SAR’000
Assets Related
liabilities Assets Related
liabilities
Investments classified as available for sale and FVIS 4,867,283 4,854,533 2,967,304 3,033,470
e) Operating lease commitments
There are no non-cancelable operating lease commitments as of December 31, 2017 and 2016.
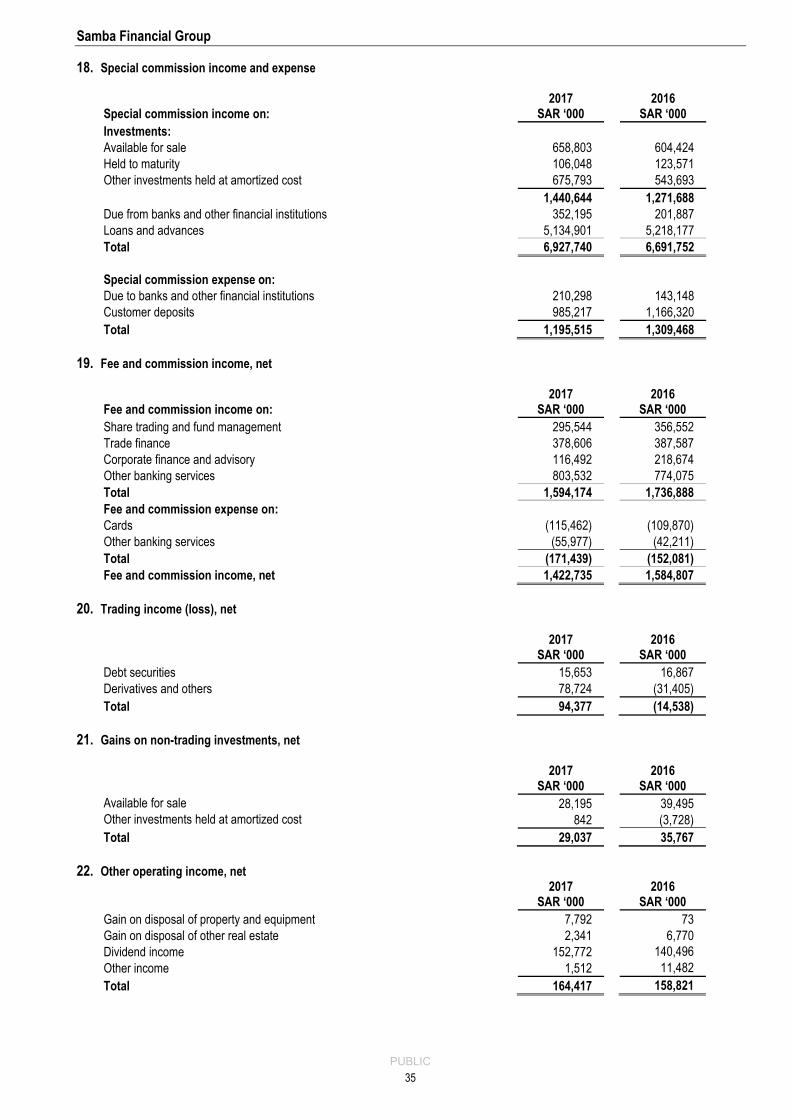
Samba Financial Group
PUBLIC
35
18. Special commission income and expense
Special commission income on: 2017
SAR ‘000 2016
SAR ‘000
Investments:
Available for sale 658,803 604,424
Held to maturity 106,048 123,571
Other investments held at amortized cost 675,793 543,693
1,440,644 1,271,688
Due from banks and other financial institutions 352,195 201,887
Loans and advances 5,134,901 5,218,177
Total 6,927,740 6,691,752
Special commission expense on:
Due to banks and other financial institutions 210,298 143,148
Customer deposits 985,217 1,166,320
Total 1,195,515 1,309,468
19. Fee and commission income, net
Fee and commission income on: 2017
SAR ‘000 2016
SAR ‘000
Share trading and fund management 295,544 356,552
Trade finance 378,606 387,587
Corporate finance and advisory 116,492 218,674
Other banking services 803,532 774,075
Total 1,594,174 1,736,888
Fee and commission expense on:
Cards (115,462) (109,870)
Other banking services (55,977) (42,211)
Total (171,439) (152,081)
Fee and commission income, net 1,422,735 1,584,807
20. Trading income (loss), net
2017
SAR ‘000 2016
SAR ‘000
Debt securities 15,653 16,867
Derivatives and others 78,724 (31,405)
Total 94,377 (14,538)
21. Gains on non-trading investments, net
2017
SAR ‘000 2016
SAR ‘000
Available for sale 28,195 39,495
Other investments held at amortized cost 842 (3,728)
Total 29,037 35,767
22. Other operating income, net
2017
SAR ‘000 2016
SAR ‘000
Gain on disposal of property and equipment 7,792 73
Gain on disposal of other real estate 2,341 6,770
Dividend income 152,772 140,496
Other income 1,512 11,482
Total 164,417 158,821
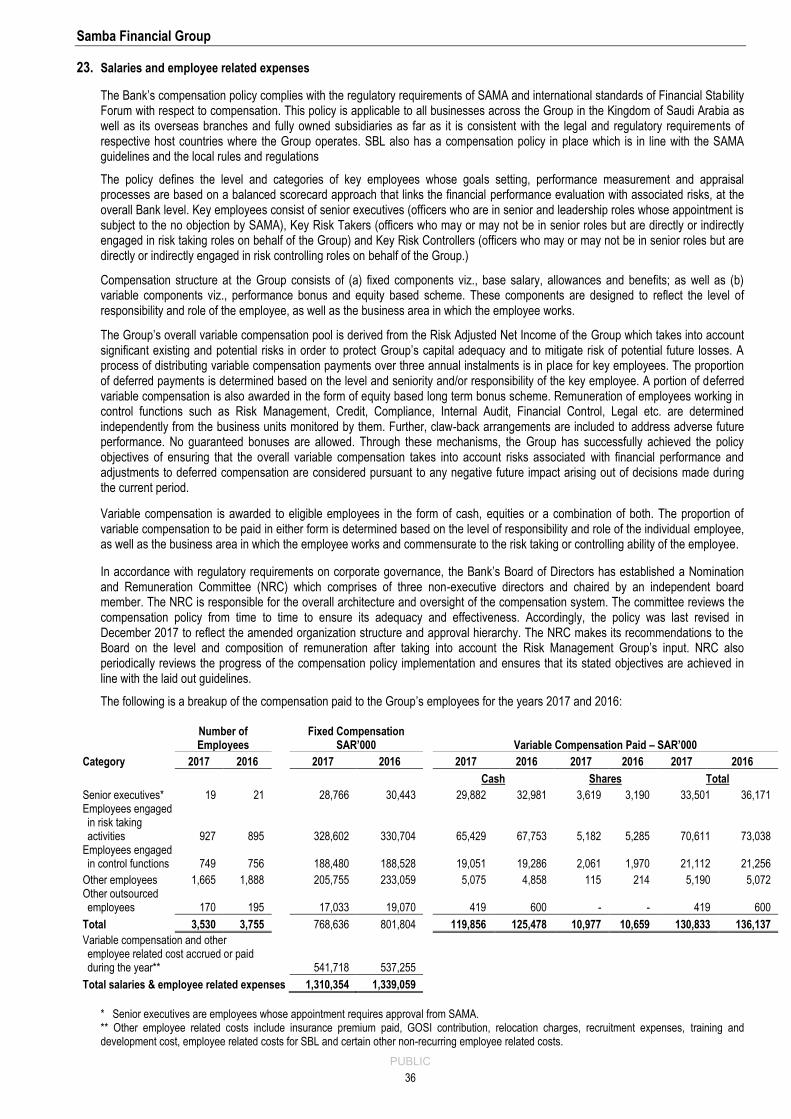
Samba Financial Group
PUBLIC
36
23. Salaries and employee related expenses
The Bank’s compensation policy complies with the regulatory requirements of SAMA and international standards of Financial Stability Forum with respect to compensation. This policy is applicable to all businesses across the Group in the Kingdom of Saudi Arabia as well as its overseas branches and fully owned subsidiaries as far as it is consistent with the legal and regulatory requirements of respective host countries where the Group operates. SBL also has a compensation policy in place which is in line with the SAMA guidelines and the local rules and regulations
The policy defines the level and categories of key employees whose goals setting, performance measurement and appraisal processes are based on a balanced scorecard approach that links the financial performance evaluation with associated risks, at the overall Bank level. Key employees consist of senior executives (officers who are in senior and leadership roles whose appointment is subject to the no objection by SAMA), Key Risk Takers (officers who may or may not be in senior roles but are directly or indirectly engaged in risk taking roles on behalf of the Group) and Key Risk Controllers (officers who may or may not be in senior roles but are directly or indirectly engaged in risk controlling roles on behalf of the Group.)
Compensation structure at the Group consists of (a) fixed components viz., base salary, allowances and benefits; as well as (b) variable components viz., performance bonus and equity based scheme. These components are designed to reflect the level of responsibility and role of the employee, as well as the business area in which the employee works.
The Group’s overall variable compensation pool is derived from the Risk Adjusted Net Income of the Group which takes into account significant existing and potential risks in order to protect Group’s capital adequacy and to mitigate risk of potential future losses. A process of distributing variable compensation payments over three annual instalments is in place for key employees. The proportion of deferred payments is determined based on the level and seniority and/or responsibility of the key employee. A portion of deferred variable compensation is also awarded in the form of equity based long term bonus scheme. Remuneration of employees working in control functions such as Risk Management, Credit, Compliance, Internal Audit, Financial Control, Legal etc. are determined independently from the business units monitored by them. Further, claw-back arrangements are included to address adverse future performance. No guaranteed bonuses are allowed. Through these mechanisms, the Group has successfully achieved the policy objectives of ensuring that the overall variable compensation takes into account risks associated with financial performance and adjustments to deferred compensation are considered pursuant to any negative future impact arising out of decisions made during the current period.
Variable compensation is awarded to eligible employees in the form of cash, equities or a combination of both. The proportion of variable compensation to be paid in either form is determined based on the level of responsibility and role of the individual employee, as well as the business area in which the employee works and commensurate to the risk taking or controlling ability of the employee.
In accordance with regulatory requirements on corporate governance, the Bank’s Board of Directors has established a Nomination and Remuneration Committee (NRC) which comprises of three non-executive directors and chaired by an independent board member. The NRC is responsible for the overall architecture and oversight of the compensation system. The committee reviews the compensation policy from time to time to ensure its adequacy and effectiveness. Accordingly, the policy was last revised in December 2017 to reflect the amended organization structure and approval hierarchy. The NRC makes its recommendations to the Board on the level and composition of remuneration after taking into account the Risk Management Group’s input. NRC also periodically reviews the progress of the compensation policy implementation and ensures that its stated objectives are achieved in line with the laid out guidelines.
The following is a breakup of the compensation paid to the Group’s employees for the years 2017 and 2016:
Number of Employees
Fixed Compensation SAR’000 Variable Compensation Paid – SAR’000
Category 2017 2016 2017 2016 2017 2016 2017 2016 2017 2016
Cash Shares Total
Senior executives* 19 21 28,766 30,443 29,882 32,981 3,619 3,190 33,501 36,171 Employees engaged in risk taking activities 927 895 328,602 330,704 65,429 67,753 5,182 5,285 70,611 73,038
Employees engaged in control functions 749 756 188,480 188,528 19,051 19,286 2,061 1,970 21,112 21,256
Other employees 1,665 1,888 205,755 233,059 5,075 4,858 115 214 5,190 5,072 Other outsourced employees 170 195 17,033 19,070 419 600 - - 419 600
Total 3,530 3,755 768,636 801,804 119,856 125,478 10,977 10,659 130,833 136,137
Variable compensation and other employee related cost accrued or paid during the year** 541,718 537,255
Total salaries & employee related expenses 1,310,354 1,339,059
* Senior executives are employees whose appointment requires approval from SAMA. ** Other employee related costs include insurance premium paid, GOSI contribution, relocation charges, recruitment expenses, training and development cost, employee related costs for SBL and certain other non-recurring employee related costs.
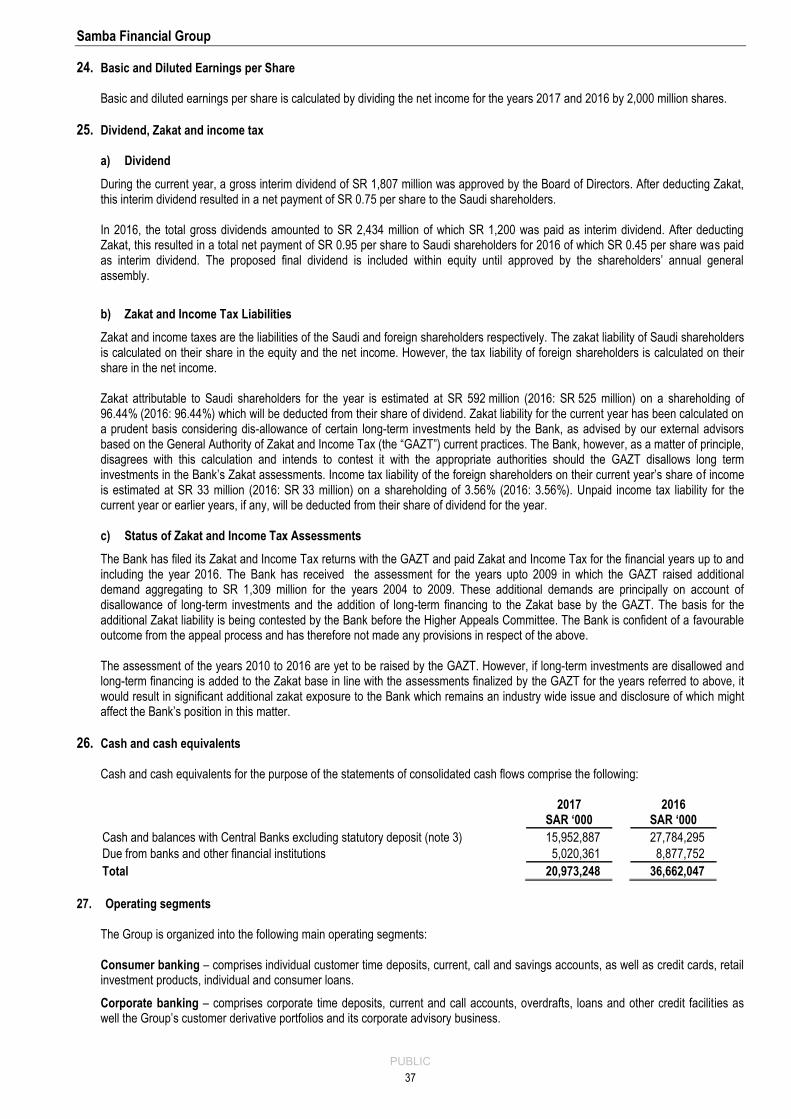
Samba Financial Group
PUBLIC
37
24. Basic and Diluted Earnings per Share Basic and diluted earnings per share is calculated by dividing the net income for the years 2017 and 2016 by 2,000 million shares.
25. Dividend, Zakat and income tax a) Dividend
During the current year, a gross interim dividend of SR 1,807 million was approved by the Board of Directors. After deducting Zakat, this interim dividend resulted in a net payment of SR 0.75 per share to the Saudi shareholders. In 2016, the total gross dividends amounted to SR 2,434 million of which SR 1,200 was paid as interim dividend. After deducting Zakat, this resulted in a total net payment of SR 0.95 per share to Saudi shareholders for 2016 of which SR 0.45 per share was paid as interim dividend. The proposed final dividend is included within equity until approved by the shareholders’ annual general assembly.
b) Zakat and Income Tax Liabilities
Zakat and income taxes are the liabilities of the Saudi and foreign shareholders respectively. The zakat liability of Saudi shareholders is calculated on their share in the equity and the net income. However, the tax liability of foreign shareholders is calculated on their share in the net income. Zakat attributable to Saudi shareholders for the year is estimated at SR 592 million (2016: SR 525 million) on a shareholding of 96.44% (2016: 96.44%) which will be deducted from their share of dividend. Zakat liability for the current year has been calculated on a prudent basis considering dis-allowance of certain long-term investments held by the Bank, as advised by our external advisors based on the General Authority of Zakat and Income Tax (the “GAZT”) current practices. The Bank, however, as a matter of principle, disagrees with this calculation and intends to contest it with the appropriate authorities should the GAZT disallows long term investments in the Bank’s Zakat assessments. Income tax liability of the foreign shareholders on their current year’s share of income is estimated at SR 33 million (2016: SR 33 million) on a shareholding of 3.56% (2016: 3.56%). Unpaid income tax liability for the current year or earlier years, if any, will be deducted from their share of dividend for the year. c) Status of Zakat and Income Tax Assessments
The Bank has filed its Zakat and Income Tax returns with the GAZT and paid Zakat and Income Tax for the financial years up to and including the year 2016. The Bank has received the assessment for the years upto 2009 in which the GAZT raised additional demand aggregating to SR 1,309 million for the years 2004 to 2009. These additional demands are principally on account of disallowance of long-term investments and the addition of long-term financing to the Zakat base by the GAZT. The basis for the additional Zakat liability is being contested by the Bank before the Higher Appeals Committee. The Bank is confident of a favourable outcome from the appeal process and has therefore not made any provisions in respect of the above. The assessment of the years 2010 to 2016 are yet to be raised by the GAZT. However, if long-term investments are disallowed and long-term financing is added to the Zakat base in line with the assessments finalized by the GAZT for the years referred to above, it would result in significant additional zakat exposure to the Bank which remains an industry wide issue and disclosure of which might affect the Bank’s position in this matter.
26. Cash and cash equivalents Cash and cash equivalents for the purpose of the statements of consolidated cash flows comprise the following:
2017
SAR ‘000 2016
SAR ‘000
Cash and balances with Central Banks excluding statutory deposit (note 3) 15,952,887 27,784,295
Due from banks and other financial institutions 5,020,361 8,877,752
Total 20,973,248 36,662,047
27. Operating segments
The Group is organized into the following main operating segments: Consumer banking – comprises individual customer time deposits, current, call and savings accounts, as well as credit cards, retail investment products, individual and consumer loans. Corporate banking – comprises corporate time deposits, current and call accounts, overdrafts, loans and other credit facilities as well the Group’s customer derivative portfolios and its corporate advisory business.
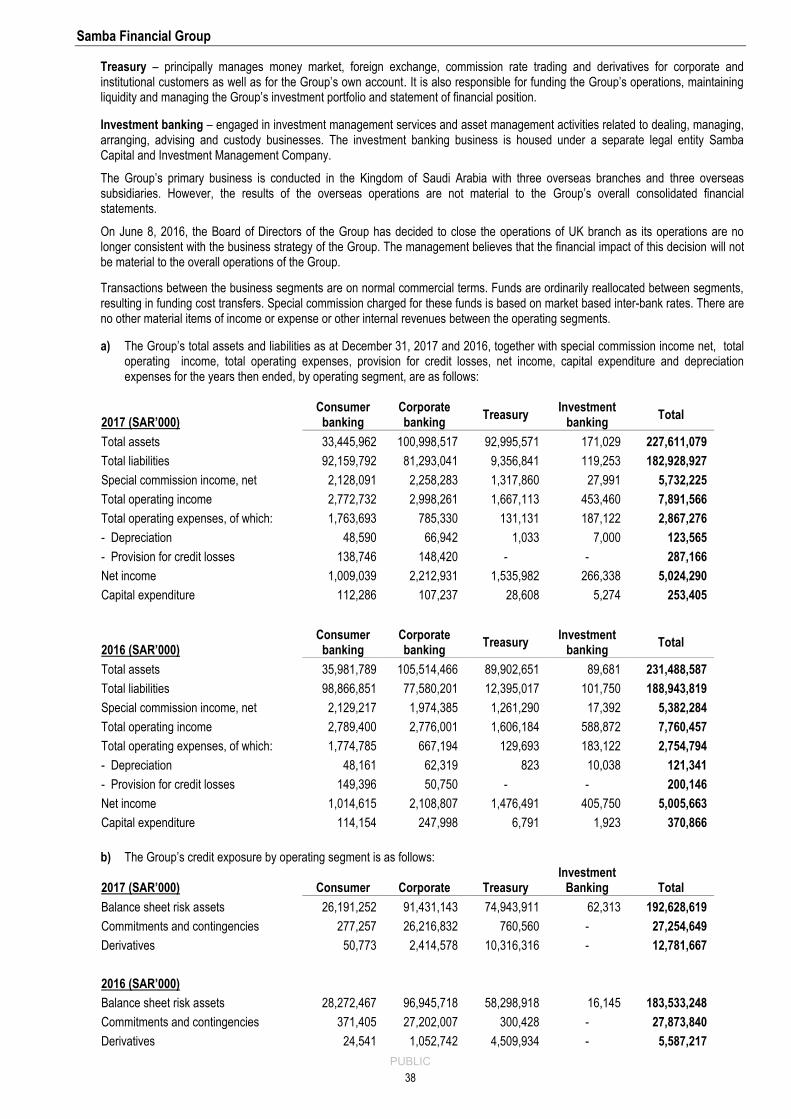
Samba Financial Group
PUBLIC
38
Treasury – principally manages money market, foreign exchange, commission rate trading and derivatives for corporate and institutional customers as well as for the Group’s own account. It is also responsible for funding the Group’s operations, maintaining liquidity and managing the Group’s investment portfolio and statement of financial position.
Investment banking – engaged in investment management services and asset management activities related to dealing, managing, arranging, advising and custody businesses. The investment banking business is housed under a separate legal entity Samba Capital and Investment Management Company. The Group’s primary business is conducted in the Kingdom of Saudi Arabia with three overseas branches and three overseas subsidiaries. However, the results of the overseas operations are not material to the Group’s overall consolidated financial statements. On June 8, 2016, the Board of Directors of the Group has decided to close the operations of UK branch as its operations are no longer consistent with the business strategy of the Group. The management believes that the financial impact of this decision will not be material to the overall operations of the Group.
Transactions between the business segments are on normal commercial terms. Funds are ordinarily reallocated between segments, resulting in funding cost transfers. Special commission charged for these funds is based on market based inter-bank rates. There are no other material items of income or expense or other internal revenues between the operating segments.
a) The Group’s total assets and liabilities as at December 31, 2017 and 2016, together with special commission income net, total operating income, total operating expenses, provision for credit losses, net income, capital expenditure and depreciation expenses for the years then ended, by operating segment, are as follows:
2017 (SAR’000) Consumer
banking Corporate banking
Treasury Investment
banking Total
Total assets 33,445,962 100,998,517 92,995,571 171,029 227,611,079
Total liabilities 92,159,792 81,293,041 9,356,841 119,253 182,928,927
Special commission income, net 2,128,091 2,258,283 1,317,860 27,991 5,732,225
Total operating income 2,772,732 2,998,261 1,667,113 453,460 7,891,566
Total operating expenses, of which: 1,763,693 785,330 131,131 187,122 2,867,276
- Depreciation 48,590 66,942 1,033 7,000 123,565
- Provision for credit losses 138,746 148,420 - - 287,166
Net income 1,009,039 2,212,931 1,535,982 266,338 5,024,290
Capital expenditure 112,286 107,237 28,608 5,274 253,405
2016 (SAR’000) Consumer
banking Corporate banking
Treasury Investment
banking Total
Total assets 35,981,789 105,514,466 89,902,651 89,681 231,488,587
Total liabilities 98,866,851 77,580,201 12,395,017 101,750 188,943,819
Special commission income, net 2,129,217 1,974,385 1,261,290 17,392 5,382,284
Total operating income 2,789,400 2,776,001 1,606,184 588,872 7,760,457
Total operating expenses, of which: 1,774,785 667,194 129,693 183,122 2,754,794
- Depreciation 48,161 62,319 823 10,038 121,341
- Provision for credit losses 149,396 50,750 - - 200,146
Net income 1,014,615 2,108,807 1,476,491 405,750 5,005,663
Capital expenditure 114,154 247,998 6,791 1,923 370,866
b) The Group’s credit exposure by operating segment is as follows:
2017 (SAR’000) Consumer Corporate Treasury Investment
Banking Total
Balance sheet risk assets 26,191,252 91,431,143 74,943,911 62,313 192,628,619
Commitments and contingencies 277,257 26,216,832 760,560 - 27,254,649
Derivatives 50,773 2,414,578 10,316,316 - 12,781,667
2016 (SAR’000)
Balance sheet risk assets 28,272,467 96,945,718 58,298,918 16,145 183,533,248
Commitments and contingencies 371,405 27,202,007 300,428 - 27,873,840
Derivatives 24,541 1,052,742 4,509,934 - 5,587,217
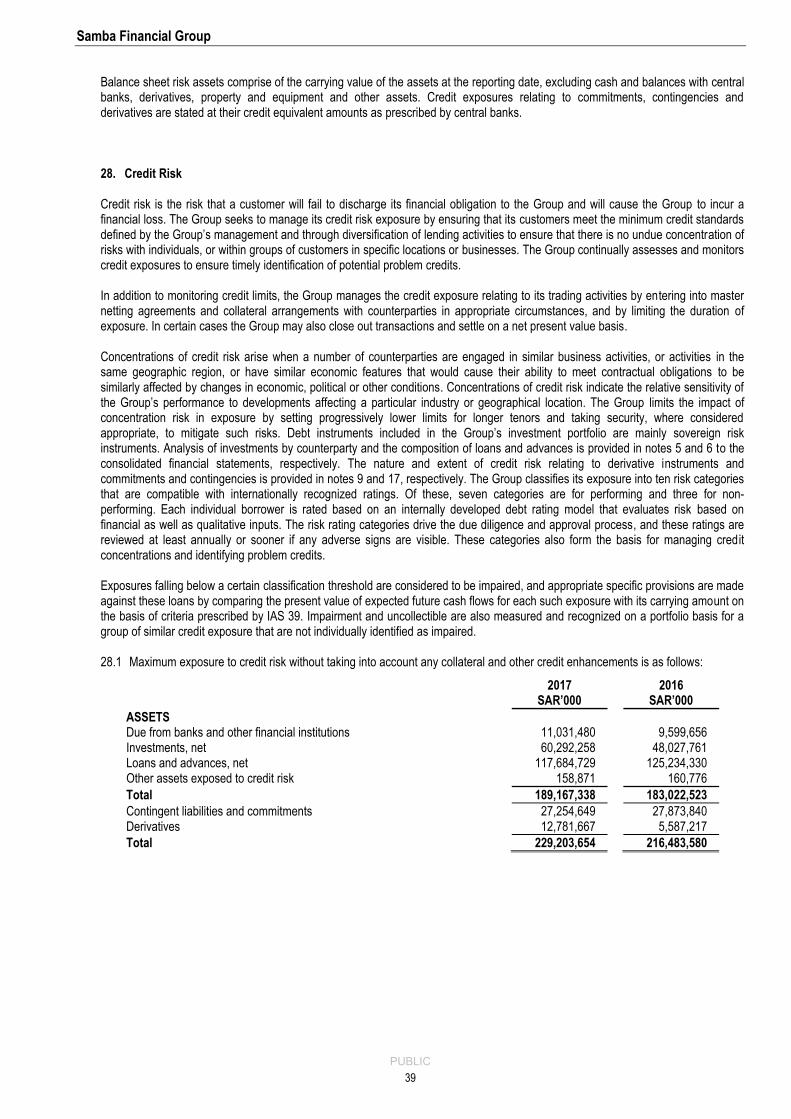
Samba Financial Group
PUBLIC
39
Balance sheet risk assets comprise of the carrying value of the assets at the reporting date, excluding cash and balances with central banks, derivatives, property and equipment and other assets. Credit exposures relating to commitments, contingencies and derivatives are stated at their credit equivalent amounts as prescribed by central banks. 28. Credit Risk Credit risk is the risk that a customer will fail to discharge its financial obligation to the Group and will cause the Group to incur a financial loss. The Group seeks to manage its credit risk exposure by ensuring that its customers meet the minimum credit standards defined by the Group’s management and through diversification of lending activities to ensure that there is no undue concentration of risks with individuals, or within groups of customers in specific locations or businesses. The Group continually assesses and monitors credit exposures to ensure timely identification of potential problem credits. In addition to monitoring credit limits, the Group manages the credit exposure relating to its trading activities by entering into master netting agreements and collateral arrangements with counterparties in appropriate circumstances, and by limiting the duration of exposure. In certain cases the Group may also close out transactions and settle on a net present value basis. Concentrations of credit risk arise when a number of counterparties are engaged in similar business activities, or activities in the same geographic region, or have similar economic features that would cause their ability to meet contractual obligations to be similarly affected by changes in economic, political or other conditions. Concentrations of credit risk indicate the relative sensitivity of the Group’s performance to developments affecting a particular industry or geographical location. The Group limits the impact of concentration risk in exposure by setting progressively lower limits for longer tenors and taking security, where considered appropriate, to mitigate such risks. Debt instruments included in the Group’s investment portfolio are mainly sovereign risk instruments. Analysis of investments by counterparty and the composition of loans and advances is provided in notes 5 and 6 to the consolidated financial statements, respectively. The nature and extent of credit risk relating to derivative instruments and commitments and contingencies is provided in notes 9 and 17, respectively. The Group classifies its exposure into ten risk categories that are compatible with internationally recognized ratings. Of these, seven categories are for performing and three for non-performing. Each individual borrower is rated based on an internally developed debt rating model that evaluates risk based on financial as well as qualitative inputs. The risk rating categories drive the due diligence and approval process, and these ratings are reviewed at least annually or sooner if any adverse signs are visible. These categories also form the basis for managing credit concentrations and identifying problem credits. Exposures falling below a certain classification threshold are considered to be impaired, and appropriate specific provisions are made against these loans by comparing the present value of expected future cash flows for each such exposure with its carrying amount on the basis of criteria prescribed by IAS 39. Impairment and uncollectible are also measured and recognized on a portfolio basis for a group of similar credit exposure that are not individually identified as impaired. 28.1 Maximum exposure to credit risk without taking into account any collateral and other credit enhancements is as follows:
2017
SAR’000 2016
SAR’000
ASSETS Due from banks and other financial institutions 11,031,480 9,599,656 Investments, net 60,292,258 48,027,761 Loans and advances, net 117,684,729 125,234,330 Other assets exposed to credit risk 158,871 160,776
Total 189,167,338 183,022,523
Contingent liabilities and commitments 27,254,649 27,873,840 Derivatives 12,781,667 5,587,217
Total 229,203,654 216,483,580
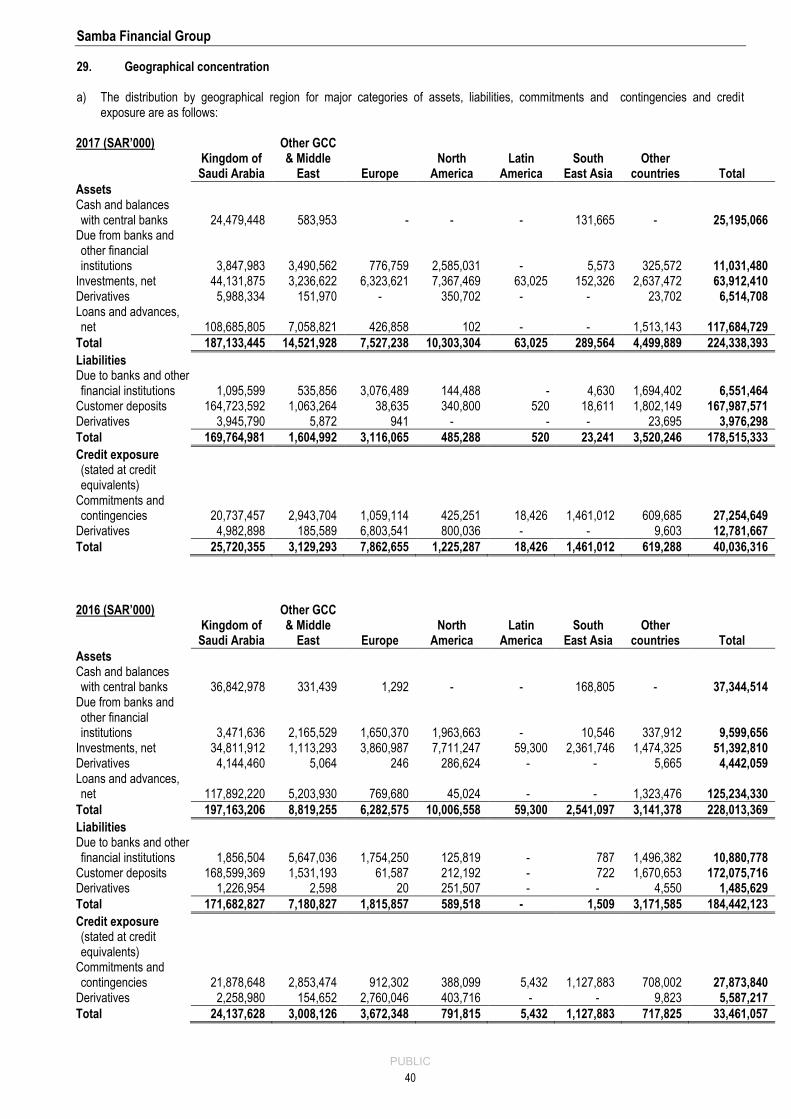
Samba Financial Group
PUBLIC
40
29. Geographical concentration a) The distribution by geographical region for major categories of assets, liabilities, commitments and contingencies and credit
exposure are as follows: 2017 (SAR’000)
Kingdom of Saudi Arabia
Other GCC & Middle
East Europe North
America Latin
America South
East Asia Other
countries Total
Assets Cash and balances with central banks 24,479,448 583,953 - - - 131,665 - 25,195,066
Due from banks and other financial institutions 3,847,983 3,490,562 776,759 2,585,031 - 5,573 325,572 11,031,480
Investments, net 44,131,875 3,236,622 6,323,621 7,367,469 63,025 152,326 2,637,472 63,912,410 Derivatives 5,988,334 151,970 - 350,702 - - 23,702 6,514,708 Loans and advances, net 108,685,805 7,058,821 426,858 102 - - 1,513,143 117,684,729
Total 187,133,445 14,521,928 7,527,238 10,303,304 63,025 289,564 4,499,889 224,338,393
Liabilities Due to banks and other financial institutions 1,095,599 535,856 3,076,489 144,488 - 4,630 1,694,402 6,551,464
Customer deposits 164,723,592 1,063,264 38,635 340,800 520 18,611 1,802,149 167,987,571 Derivatives 3,945,790 5,872 941 - - - 23,695 3,976,298
Total 169,764,981 1,604,992 3,116,065 485,288 520 23,241 3,520,246 178,515,333
Credit exposure (stated at credit equivalents)
Commitments and contingencies 20,737,457 2,943,704 1,059,114 425,251 18,426 1,461,012 609,685 27,254,649
Derivatives 4,982,898 185,589 6,803,541 800,036 - - 9,603 12,781,667
Total 25,720,355 3,129,293 7,862,655 1,225,287 18,426 1,461,012 619,288 40,036,316
2016 (SAR’000)
Kingdom of Saudi Arabia
Other GCC & Middle
East Europe North
America Latin
America South
East Asia Other
countries Total
Assets Cash and balances with central banks 36,842,978 331,439 1,292 - - 168,805 - 37,344,514
Due from banks and other financial institutions 3,471,636 2,165,529 1,650,370 1,963,663 - 10,546 337,912 9,599,656
Investments, net 34,811,912 1,113,293 3,860,987 7,711,247 59,300 2,361,746 1,474,325 51,392,810 Derivatives 4,144,460 5,064 246 286,624 - - 5,665 4,442,059 Loans and advances, net 117,892,220 5,203,930 769,680 45,024 - - 1,323,476 125,234,330
Total 197,163,206 8,819,255 6,282,575 10,006,558 59,300 2,541,097 3,141,378 228,013,369
Liabilities Due to banks and other financial institutions 1,856,504 5,647,036 1,754,250 125,819 - 787 1,496,382 10,880,778
Customer deposits 168,599,369 1,531,193 61,587 212,192 - 722 1,670,653 172,075,716 Derivatives 1,226,954 2,598 20 251,507 - - 4,550 1,485,629
Total 171,682,827 7,180,827 1,815,857 589,518 - 1,509 3,171,585 184,442,123
Credit exposure (stated at credit equivalents)
Commitments and contingencies 21,878,648 2,853,474 912,302 388,099 5,432 1,127,883 708,002 27,873,840
Derivatives 2,258,980 154,652 2,760,046 403,716 - - 9,823 5,587,217
Total 24,137,628 3,008,126 3,672,348 791,815 5,432 1,127,883 717,825 33,461,057
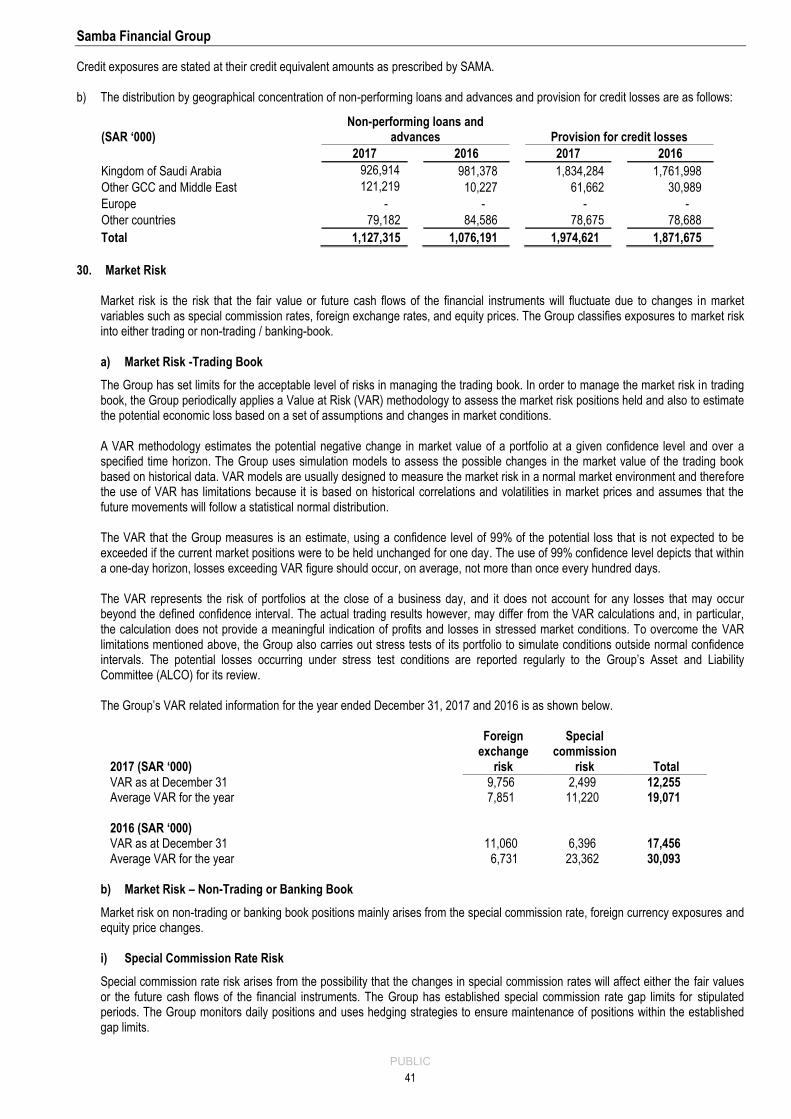
Samba Financial Group
PUBLIC
41
Credit exposures are stated at their credit equivalent amounts as prescribed by SAMA. b) The distribution by geographical concentration of non-performing loans and advances and provision for credit losses are as follows:
(SAR ‘000) Non-performing loans and
advances Provision for credit losses
2017 2016 2017 2016
Kingdom of Saudi Arabia 926,914 981,378 1,834,284 1,761,998
Other GCC and Middle East 121,219 10,227 61,662 30,989
Europe - - - -
Other countries 79,182 84,586 78,675 78,688
Total 1,127,315 1,076,191 1,974,621 1,871,675
30. Market Risk
Market risk is the risk that the fair value or future cash flows of the financial instruments will fluctuate due to changes in market variables such as special commission rates, foreign exchange rates, and equity prices. The Group classifies exposures to market risk into either trading or non-trading / banking-book. a) Market Risk -Trading Book
The Group has set limits for the acceptable level of risks in managing the trading book. In order to manage the market risk in trading book, the Group periodically applies a Value at Risk (VAR) methodology to assess the market risk positions held and also to estimate the potential economic loss based on a set of assumptions and changes in market conditions. A VAR methodology estimates the potential negative change in market value of a portfolio at a given confidence level and over a specified time horizon. The Group uses simulation models to assess the possible changes in the market value of the trading book based on historical data. VAR models are usually designed to measure the market risk in a normal market environment and therefore the use of VAR has limitations because it is based on historical correlations and volatilities in market prices and assumes that the future movements will follow a statistical normal distribution. The VAR that the Group measures is an estimate, using a confidence level of 99% of the potential loss that is not expected to be exceeded if the current market positions were to be held unchanged for one day. The use of 99% confidence level depicts that within a one-day horizon, losses exceeding VAR figure should occur, on average, not more than once every hundred days. The VAR represents the risk of portfolios at the close of a business day, and it does not account for any losses that may occur beyond the defined confidence interval. The actual trading results however, may differ from the VAR calculations and, in particular, the calculation does not provide a meaningful indication of profits and losses in stressed market conditions. To overcome the VAR limitations mentioned above, the Group also carries out stress tests of its portfolio to simulate conditions outside normal confidence intervals. The potential losses occurring under stress test conditions are reported regularly to the Group’s Asset and Liability Committee (ALCO) for its review. The Group’s VAR related information for the year ended December 31, 2017 and 2016 is as shown below.
2017 (SAR ‘000)
Foreign exchange
risk
Special commission
risk Total
VAR as at December 31 9,756 2,499 12,255 Average VAR for the year 7,851 11,220 19,071 2016 (SAR ‘000) VAR as at December 31 11,060 6,396 17,456 Average VAR for the year 6,731 23,362 30,093
b) Market Risk – Non-Trading or Banking Book
Market risk on non-trading or banking book positions mainly arises from the special commission rate, foreign currency exposures and equity price changes. i) Special Commission Rate Risk
Special commission rate risk arises from the possibility that the changes in special commission rates will affect either the fair values or the future cash flows of the financial instruments. The Group has established special commission rate gap limits for stipulated periods. The Group monitors daily positions and uses hedging strategies to ensure maintenance of positions within the established gap limits.
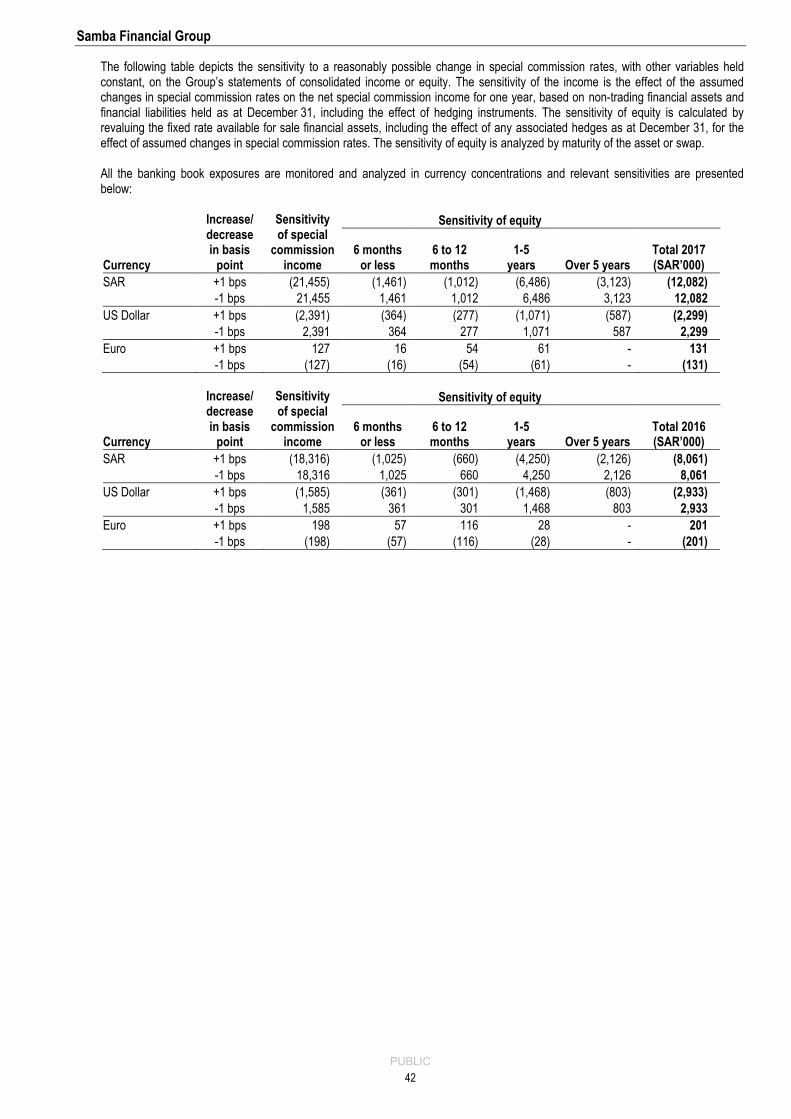
Samba Financial Group
PUBLIC
42
The following table depicts the sensitivity to a reasonably possible change in special commission rates, with other variables held constant, on the Group’s statements of consolidated income or equity. The sensitivity of the income is the effect of the assumed changes in special commission rates on the net special commission income for one year, based on non-trading financial assets and financial liabilities held as at December 31, including the effect of hedging instruments. The sensitivity of equity is calculated by revaluing the fixed rate available for sale financial assets, including the effect of any associated hedges as at December 31, for the effect of assumed changes in special commission rates. The sensitivity of equity is analyzed by maturity of the asset or swap. All the banking book exposures are monitored and analyzed in currency concentrations and relevant sensitivities are presented below:
Currency
Increase/ decrease in basis
point
Sensitivity of special
commission income
Sensitivity of equity
6 months or less
6 to 12 months
1-5 years Over 5 years
Total 2017 (SAR’000)
SAR +1 bps (21,455) (1,461) (1,012) (6,486) (3,123) (12,082)
-1 bps 21,455 1,461 1,012 6,486 3,123 12,082
US Dollar +1 bps (2,391) (364) (277) (1,071) (587) (2,299)
-1 bps 2,391 364 277 1,071 587 2,299
Euro +1 bps 127 16 54 61 - 131
-1 bps (127) (16) (54) (61) - (131)
Currency
Increase/ decrease in basis
point
Sensitivity of special
commission income
Sensitivity of equity
6 months or less
6 to 12 months
1-5 years Over 5 years
Total 2016 (SAR’000)
SAR +1 bps (18,316) (1,025) (660) (4,250) (2,126) (8,061)
-1 bps 18,316 1,025 660 4,250 2,126 8,061
US Dollar +1 bps (1,585) (361) (301) (1,468) (803) (2,933)
-1 bps 1,585 361 301 1,468 803 2,933
Euro +1 bps 198 57 116 28 - 201
-1 bps (198) (57) (116) (28) - (201)
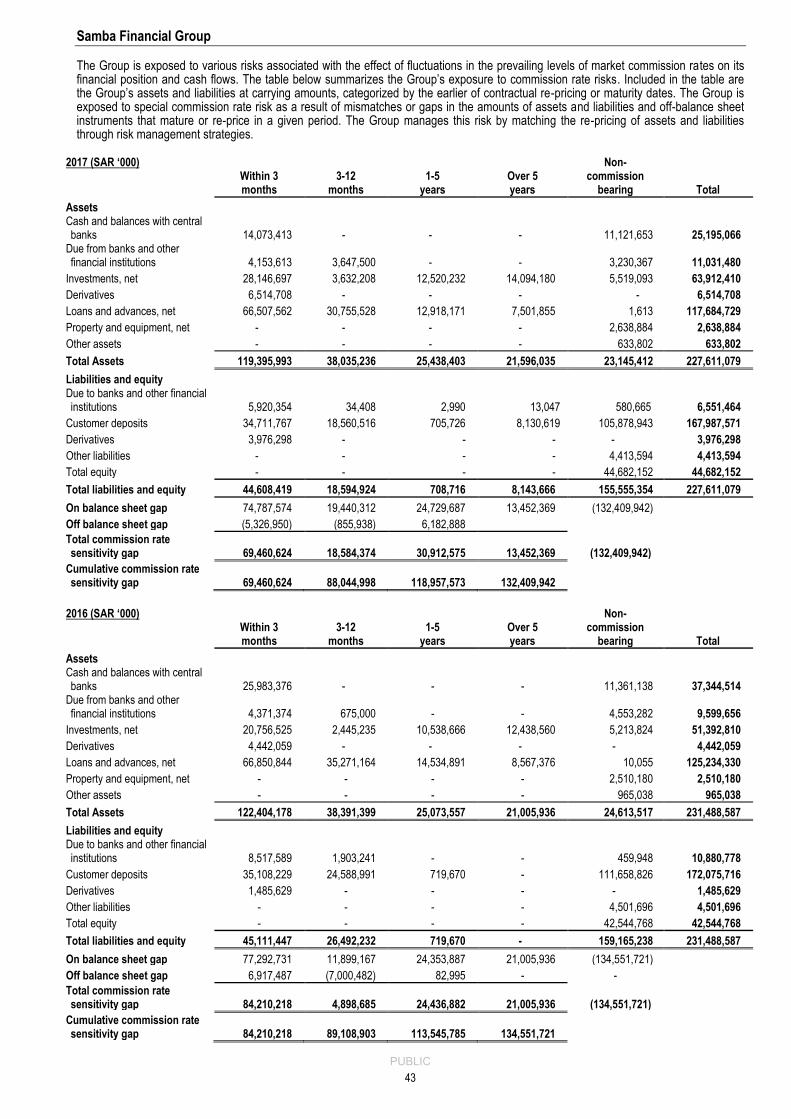
Samba Financial Group
PUBLIC
43
The Group is exposed to various risks associated with the effect of fluctuations in the prevailing levels of market commission rates on its financial position and cash flows. The table below summarizes the Group’s exposure to commission rate risks. Included in the table are the Group’s assets and liabilities at carrying amounts, categorized by the earlier of contractual re-pricing or maturity dates. The Group is exposed to special commission rate risk as a result of mismatches or gaps in the amounts of assets and liabilities and off-balance sheet instruments that mature or re-price in a given period. The Group manages this risk by matching the re-pricing of assets and liabilities through risk management strategies.
2017 (SAR ‘000) Within 3 months
3-12 months
1-5 years
Over 5 years
Non- commission
bearing Total
Assets Cash and balances with central banks 14,073,413 - - - 11,121,653 25,195,066
Due from banks and other financial institutions 4,153,613 3,647,500 - - 3,230,367 11,031,480
Investments, net 28,146,697 3,632,208 12,520,232 14,094,180 5,519,093 63,912,410
Derivatives 6,514,708 - - - - 6,514,708
Loans and advances, net 66,507,562 30,755,528 12,918,171 7,501,855 1,613 117,684,729
Property and equipment, net - - - - 2,638,884 2,638,884
Other assets - - - - 633,802 633,802
Total Assets 119,395,993 38,035,236 25,438,403 21,596,035 23,145,412 227,611,079
Liabilities and equity Due to banks and other financial institutions 5,920,354 34,408 2,990 13,047 580,665 6,551,464
Customer deposits 34,711,767 18,560,516 705,726 8,130,619 105,878,943 167,987,571
Derivatives 3,976,298 - - - - 3,976,298
Other liabilities - - - - 4,413,594 4,413,594
Total equity - - - - 44,682,152 44,682,152
Total liabilities and equity 44,608,419 18,594,924 708,716 8,143,666 155,555,354 227,611,079
On balance sheet gap 74,787,574 19,440,312 24,729,687 13,452,369 (132,409,942)
Off balance sheet gap (5,326,950) (855,938) 6,182,888
Total commission rate sensitivity gap 69,460,624 18,584,374 30,912,575 13,452,369 (132,409,942)
Cumulative commission rate sensitivity gap 69,460,624 88,044,998 118,957,573 132,409,942
2016 (SAR ‘000)
Within 3 months
3-12 months
1-5 years
Over 5 years
Non- commission
bearing Total
Assets Cash and balances with central banks 25,983,376 - - - 11,361,138 37,344,514
Due from banks and other financial institutions 4,371,374 675,000 - - 4,553,282 9,599,656
Investments, net 20,756,525 2,445,235 10,538,666 12,438,560 5,213,824 51,392,810
Derivatives 4,442,059 - - - - 4,442,059
Loans and advances, net 66,850,844 35,271,164 14,534,891 8,567,376 10,055 125,234,330
Property and equipment, net - - - - 2,510,180 2,510,180
Other assets - - - - 965,038 965,038
Total Assets 122,404,178 38,391,399 25,073,557 21,005,936 24,613,517 231,488,587
Liabilities and equity Due to banks and other financial institutions 8,517,589 1,903,241 - - 459,948 10,880,778
Customer deposits 35,108,229 24,588,991 719,670 - 111,658,826 172,075,716
Derivatives 1,485,629 - - - - 1,485,629
Other liabilities - - - - 4,501,696 4,501,696
Total equity - - - - 42,544,768 42,544,768
Total liabilities and equity 45,111,447 26,492,232 719,670 - 159,165,238 231,488,587
On balance sheet gap 77,292,731 11,899,167 24,353,887 21,005,936 (134,551,721)
Off balance sheet gap 6,917,487 (7,000,482) 82,995 - -
Total commission rate sensitivity gap 84,210,218 4,898,685 24,436,882 21,005,936 (134,551,721)
Cumulative commission rate sensitivity gap 84,210,218 89,108,903 113,545,785 134,551,721
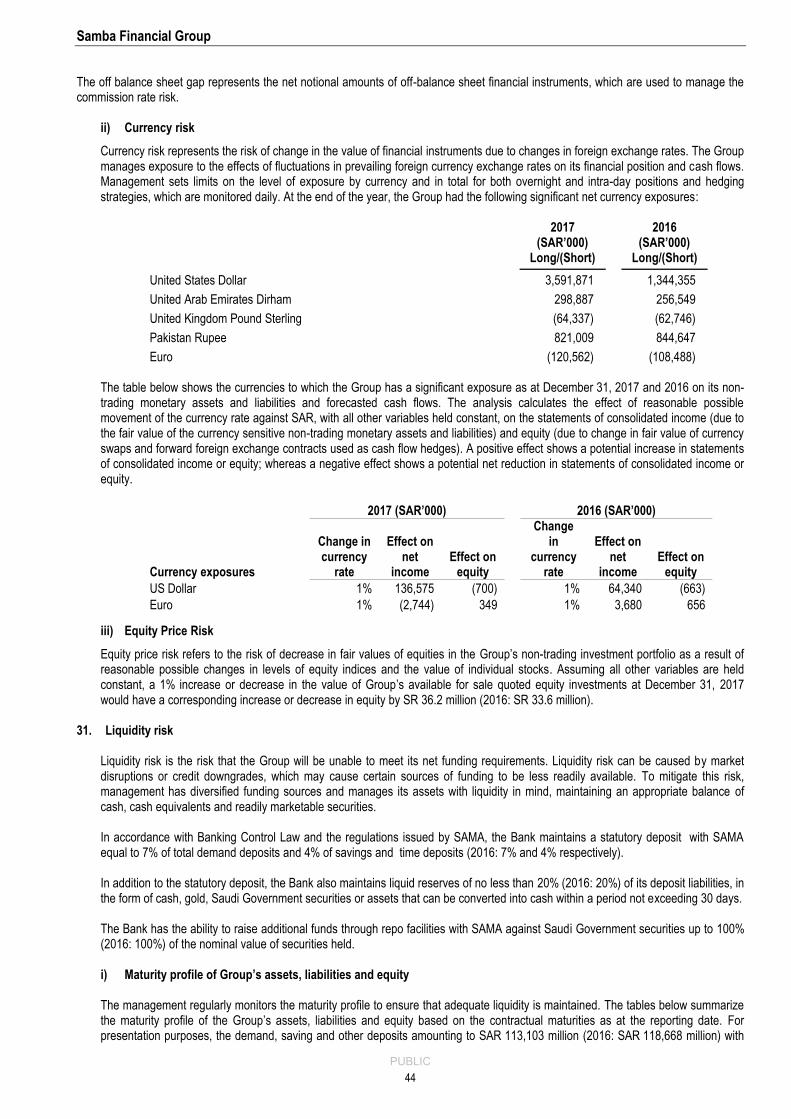
Samba Financial Group
PUBLIC
44
The off balance sheet gap represents the net notional amounts of off-balance sheet financial instruments, which are used to manage the commission rate risk.
ii) Currency risk
Currency risk represents the risk of change in the value of financial instruments due to changes in foreign exchange rates. The Group manages exposure to the effects of fluctuations in prevailing foreign currency exchange rates on its financial position and cash flows. Management sets limits on the level of exposure by currency and in total for both overnight and intra-day positions and hedging strategies, which are monitored daily. At the end of the year, the Group had the following significant net currency exposures:
2017 (SAR’000)
Long/(Short)
2016 (SAR’000)
Long/(Short)
United States Dollar 3,591,871 1,344,355
United Arab Emirates Dirham 298,887 256,549
United Kingdom Pound Sterling (64,337) (62,746)
Pakistan Rupee 821,009 844,647
Euro (120,562) (108,488) The table below shows the currencies to which the Group has a significant exposure as at December 31, 2017 and 2016 on its non-trading monetary assets and liabilities and forecasted cash flows. The analysis calculates the effect of reasonable possible movement of the currency rate against SAR, with all other variables held constant, on the statements of consolidated income (due to the fair value of the currency sensitive non-trading monetary assets and liabilities) and equity (due to change in fair value of currency swaps and forward foreign exchange contracts used as cash flow hedges). A positive effect shows a potential increase in statements of consolidated income or equity; whereas a negative effect shows a potential net reduction in statements of consolidated income or equity.
2017 (SAR’000) 2016 (SAR’000)
Currency exposures
Change in currency
rate
Effect on net
income Effect on
equity
Change in
currency rate
Effect on net
income Effect on
equity
US Dollar 1% 136,575 (700) 1% 64,340 (663)
Euro 1% (2,744) 349 1% 3,680 656
iii) Equity Price Risk
Equity price risk refers to the risk of decrease in fair values of equities in the Group’s non-trading investment portfolio as a result of reasonable possible changes in levels of equity indices and the value of individual stocks. Assuming all other variables are held constant, a 1% increase or decrease in the value of Group’s available for sale quoted equity investments at December 31, 2017 would have a corresponding increase or decrease in equity by SR 36.2 million (2016: SR 33.6 million).
31. Liquidity risk Liquidity risk is the risk that the Group will be unable to meet its net funding requirements. Liquidity risk can be caused by market disruptions or credit downgrades, which may cause certain sources of funding to be less readily available. To mitigate this risk, management has diversified funding sources and manages its assets with liquidity in mind, maintaining an appropriate balance of cash, cash equivalents and readily marketable securities. In accordance with Banking Control Law and the regulations issued by SAMA, the Bank maintains a statutory deposit with SAMA equal to 7% of total demand deposits and 4% of savings and time deposits (2016: 7% and 4% respectively). In addition to the statutory deposit, the Bank also maintains liquid reserves of no less than 20% (2016: 20%) of its deposit liabilities, in the form of cash, gold, Saudi Government securities or assets that can be converted into cash within a period not exceeding 30 days. The Bank has the ability to raise additional funds through repo facilities with SAMA against Saudi Government securities up to 100% (2016: 100%) of the nominal value of securities held. i) Maturity profile of Group’s assets, liabilities and equity The management regularly monitors the maturity profile to ensure that adequate liquidity is maintained. The tables below summarize the maturity profile of the Group’s assets, liabilities and equity based on the contractual maturities as at the reporting date. For presentation purposes, the demand, saving and other deposits amounting to SAR 113,103 million (2016: SAR 118,668 million) with
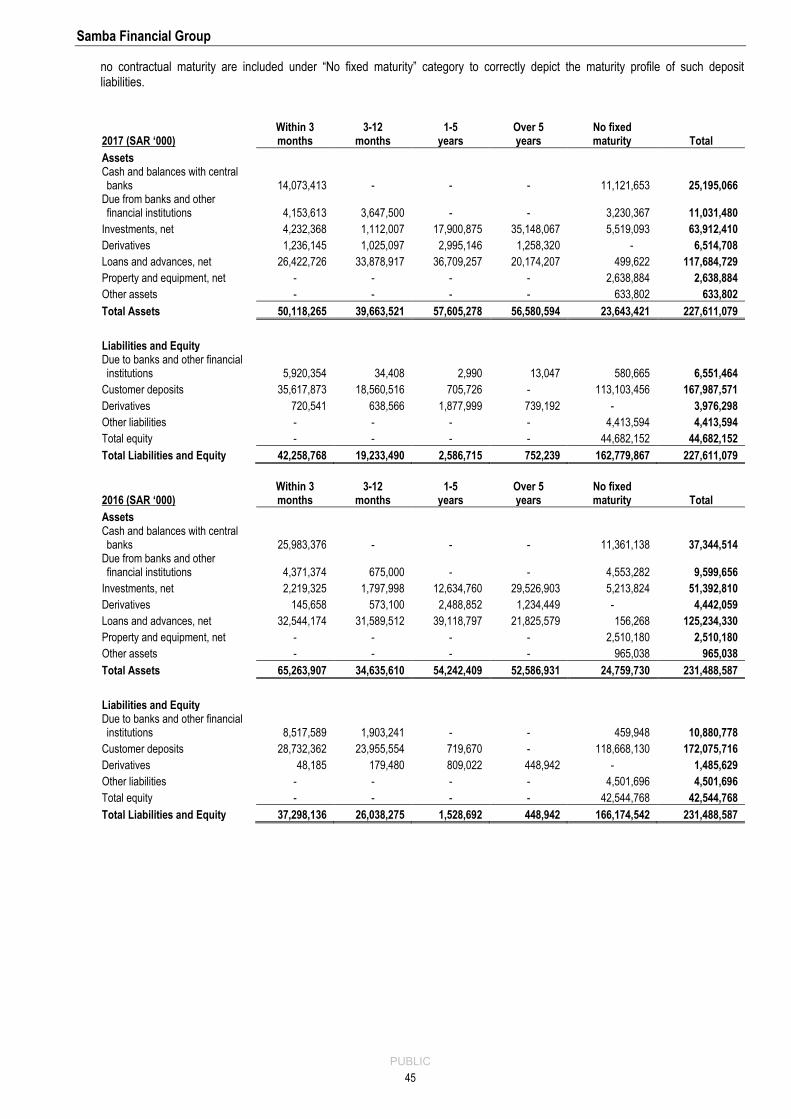
Samba Financial Group
PUBLIC
45
no contractual maturity are included under “No fixed maturity” category to correctly depict the maturity profile of such deposit liabilities.
2017 (SAR ‘000) Within 3 months
3-12 months
1-5 years
Over 5 years
No fixed maturity Total
Assets Cash and balances with central banks 14,073,413 - - - 11,121,653 25,195,066
Due from banks and other financial institutions 4,153,613 3,647,500 - - 3,230,367 11,031,480
Investments, net 4,232,368 1,112,007 17,900,875 35,148,067 5,519,093 63,912,410
Derivatives 1,236,145 1,025,097 2,995,146 1,258,320 - 6,514,708
Loans and advances, net 26,422,726 33,878,917 36,709,257 20,174,207 499,622 117,684,729
Property and equipment, net - - - - 2,638,884 2,638,884
Other assets - - - - 633,802 633,802
Total Assets 50,118,265 39,663,521 57,605,278 56,580,594 23,643,421 227,611,079
Liabilities and Equity Due to banks and other financial institutions 5,920,354 34,408 2,990 13,047 580,665 6,551,464
Customer deposits 35,617,873 18,560,516 705,726 - 113,103,456 167,987,571
Derivatives 720,541 638,566 1,877,999 739,192 - 3,976,298
Other liabilities - - - - 4,413,594 4,413,594
Total equity - - - - 44,682,152 44,682,152
Total Liabilities and Equity 42,258,768 19,233,490 2,586,715 752,239 162,779,867 227,611,079
2016 (SAR ‘000) Within 3 months
3-12 months
1-5 years
Over 5 years
No fixed maturity Total
Assets Cash and balances with central banks 25,983,376 - - - 11,361,138 37,344,514
Due from banks and other financial institutions 4,371,374 675,000 - - 4,553,282 9,599,656
Investments, net 2,219,325 1,797,998 12,634,760 29,526,903 5,213,824 51,392,810
Derivatives 145,658 573,100 2,488,852 1,234,449 - 4,442,059
Loans and advances, net 32,544,174 31,589,512 39,118,797 21,825,579 156,268 125,234,330
Property and equipment, net - - - - 2,510,180 2,510,180
Other assets - - - - 965,038 965,038
Total Assets 65,263,907 34,635,610 54,242,409 52,586,931 24,759,730 231,488,587
Liabilities and Equity Due to banks and other financial institutions 8,517,589 1,903,241 - - 459,948 10,880,778
Customer deposits 28,732,362 23,955,554 719,670 - 118,668,130 172,075,716
Derivatives 48,185 179,480 809,022 448,942 - 1,485,629
Other liabilities - - - - 4,501,696 4,501,696
Total equity - - - - 42,544,768 42,544,768
Total Liabilities and Equity 37,298,136 26,038,275 1,528,692 448,942 166,174,542 231,488,587
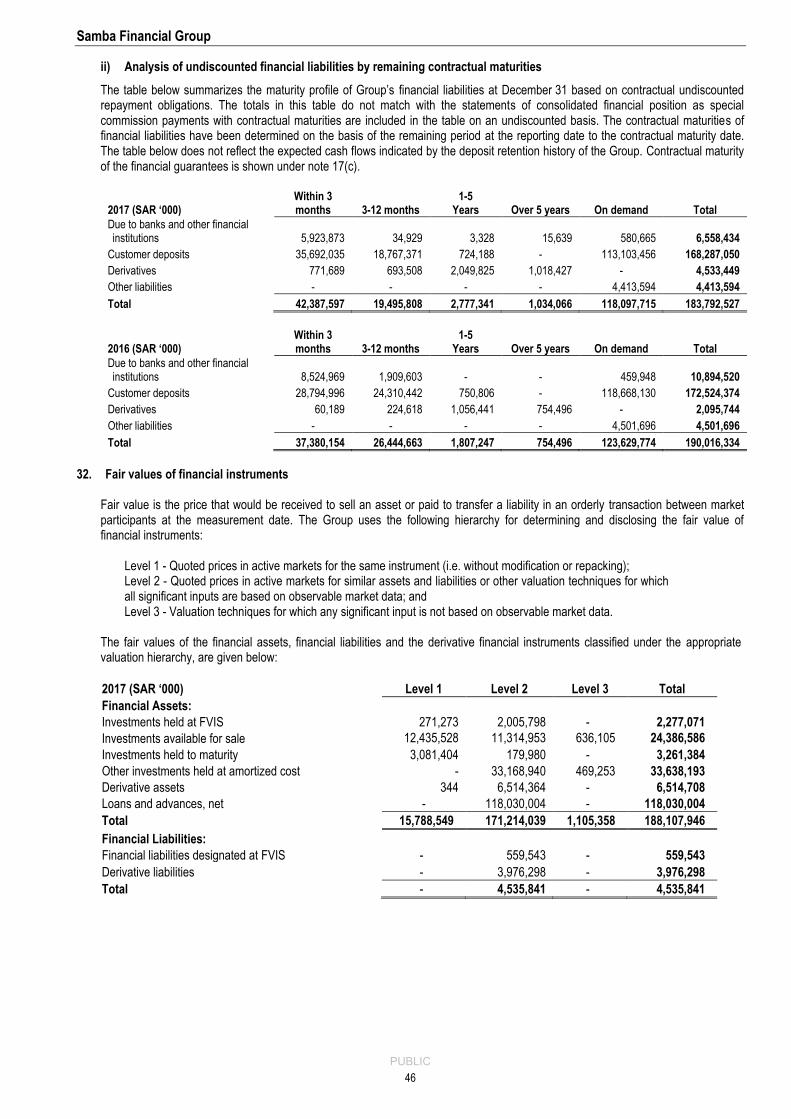
Samba Financial Group
PUBLIC
46
ii) Analysis of undiscounted financial liabilities by remaining contractual maturities
The table below summarizes the maturity profile of Group’s financial liabilities at December 31 based on contractual undiscounted repayment obligations. The totals in this table do not match with the statements of consolidated financial position as special commission payments with contractual maturities are included in the table on an undiscounted basis. The contractual maturities of financial liabilities have been determined on the basis of the remaining period at the reporting date to the contractual maturity date. The table below does not reflect the expected cash flows indicated by the deposit retention history of the Group. Contractual maturity of the financial guarantees is shown under note 17(c).
2017 (SAR ‘000) Within 3 months 3-12 months
1-5 Years Over 5 years On demand Total
Due to banks and other financial institutions 5,923,873 34,929 3,328 15,639 580,665 6,558,434
Customer deposits 35,692,035 18,767,371 724,188 - 113,103,456 168,287,050
Derivatives 771,689 693,508 2,049,825 1,018,427 - 4,533,449
Other liabilities - - - - 4,413,594 4,413,594
Total 42,387,597 19,495,808 2,777,341 1,034,066 118,097,715 183,792,527
2016 (SAR ‘000) Within 3 months 3-12 months
1-5 Years Over 5 years On demand Total
Due to banks and other financial institutions 8,524,969 1,909,603 - - 459,948 10,894,520
Customer deposits 28,794,996 24,310,442 750,806 - 118,668,130 172,524,374
Derivatives 60,189 224,618 1,056,441 754,496 - 2,095,744
Other liabilities - - - - 4,501,696 4,501,696
Total 37,380,154 26,444,663 1,807,247 754,496 123,629,774 190,016,334
32. Fair values of financial instruments
Fair value is the price that would be received to sell an asset or paid to transfer a liability in an orderly transaction between market participants at the measurement date. The Group uses the following hierarchy for determining and disclosing the fair value of financial instruments:
Level 1 - Quoted prices in active markets for the same instrument (i.e. without modification or repacking); Level 2 - Quoted prices in active markets for similar assets and liabilities or other valuation techniques for which all significant inputs are based on observable market data; and Level 3 - Valuation techniques for which any significant input is not based on observable market data.
The fair values of the financial assets, financial liabilities and the derivative financial instruments classified under the appropriate valuation hierarchy, are given below:
2017 (SAR ‘000) Level 1 Level 2 Level 3 Total
Financial Assets:
Investments held at FVIS 271,273 2,005,798 - 2,277,071
Investments available for sale 12,435,528 11,314,953 636,105 24,386,586
Investments held to maturity 3,081,404 179,980 - 3,261,384
Other investments held at amortized cost - 33,168,940 469,253 33,638,193
Derivative assets 344 6,514,364 - 6,514,708
Loans and advances, net - 118,030,004 - 118,030,004
Total 15,788,549 171,214,039 1,105,358 188,107,946
Financial Liabilities:
Financial liabilities designated at FVIS - 559,543 - 559,543
Derivative liabilities - 3,976,298 - 3,976,298
Total - 4,535,841 - 4,535,841
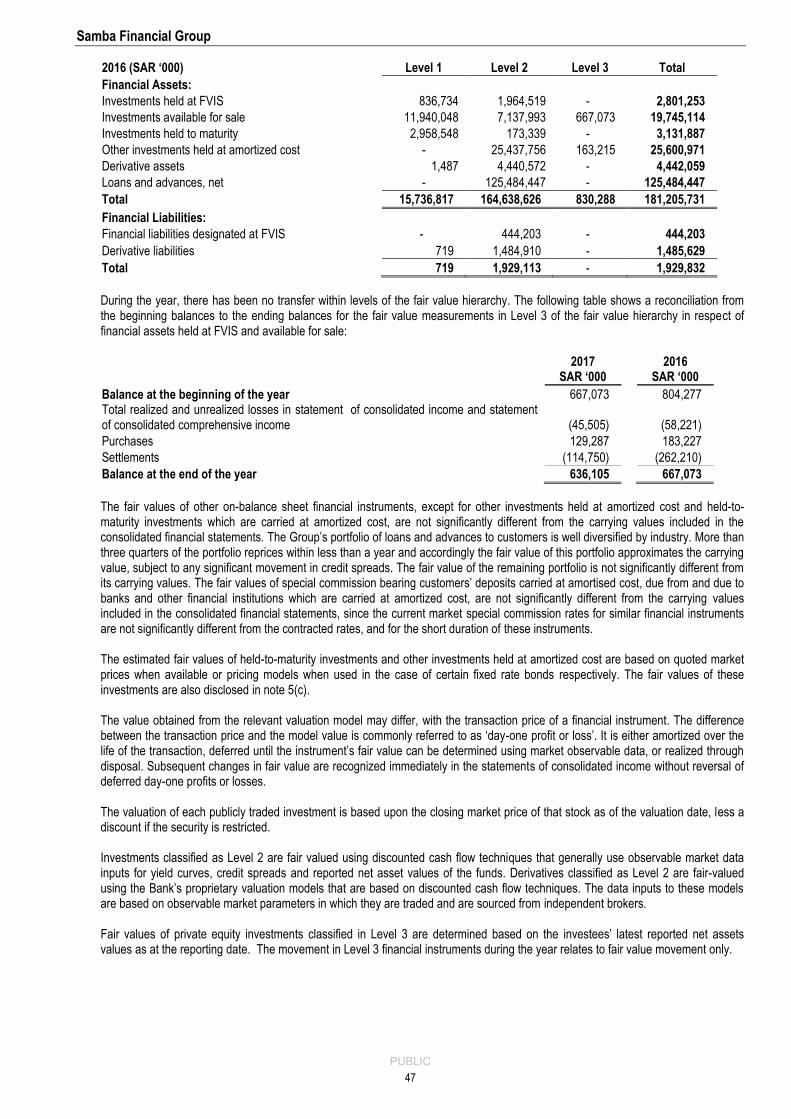
Samba Financial Group
PUBLIC
47
2016 (SAR ‘000) Level 1 Level 2 Level 3 Total
Financial Assets:
Investments held at FVIS 836,734 1,964,519 - 2,801,253
Investments available for sale 11,940,048 7,137,993 667,073 19,745,114
Investments held to maturity 2,958,548 173,339 - 3,131,887
Other investments held at amortized cost - 25,437,756 163,215 25,600,971
Derivative assets 1,487 4,440,572 - 4,442,059
Loans and advances, net - 125,484,447 - 125,484,447
Total 15,736,817 164,638,626 830,288 181,205,731
Financial Liabilities:
Financial liabilities designated at FVIS - 444,203 - 444,203
Derivative liabilities 719 1,484,910 - 1,485,629
Total 719 1,929,113 - 1,929,832
During the year, there has been no transfer within levels of the fair value hierarchy. The following table shows a reconciliation from the beginning balances to the ending balances for the fair value measurements in Level 3 of the fair value hierarchy in respect of financial assets held at FVIS and available for sale:
2017
SAR ‘000 2016
SAR ‘000
Balance at the beginning of the year 667,073 804,277 Total realized and unrealized losses in statement of consolidated income and statement of consolidated comprehensive income (45,505) (58,221)
Purchases 129,287 183,227
Settlements (114,750) (262,210)
Balance at the end of the year 636,105 667,073
The fair values of other on-balance sheet financial instruments, except for other investments held at amortized cost and held-to-maturity investments which are carried at amortized cost, are not significantly different from the carrying values included in the consolidated financial statements. The Group’s portfolio of loans and advances to customers is well diversified by industry. More than three quarters of the portfolio reprices within less than a year and accordingly the fair value of this portfolio approximates the carrying value, subject to any significant movement in credit spreads. The fair value of the remaining portfolio is not significantly different from its carrying values. The fair values of special commission bearing customers’ deposits carried at amortised cost, due from and due to banks and other financial institutions which are carried at amortized cost, are not significantly different from the carrying values included in the consolidated financial statements, since the current market special commission rates for similar financial instruments are not significantly different from the contracted rates, and for the short duration of these instruments. The estimated fair values of held-to-maturity investments and other investments held at amortized cost are based on quoted market prices when available or pricing models when used in the case of certain fixed rate bonds respectively. The fair values of these investments are also disclosed in note 5(c). The value obtained from the relevant valuation model may differ, with the transaction price of a financial instrument. The difference between the transaction price and the model value is commonly referred to as ‘day-one profit or loss’. It is either amortized over the life of the transaction, deferred until the instrument’s fair value can be determined using market observable data, or realized through disposal. Subsequent changes in fair value are recognized immediately in the statements of consolidated income without reversal of deferred day-one profits or losses. The valuation of each publicly traded investment is based upon the closing market price of that stock as of the valuation date, less a discount if the security is restricted. Investments classified as Level 2 are fair valued using discounted cash flow techniques that generally use observable market data inputs for yield curves, credit spreads and reported net asset values of the funds. Derivatives classified as Level 2 are fair-valued using the Bank’s proprietary valuation models that are based on discounted cash flow techniques. The data inputs to these models are based on observable market parameters in which they are traded and are sourced from independent brokers. Fair values of private equity investments classified in Level 3 are determined based on the investees’ latest reported net assets values as at the reporting date. The movement in Level 3 financial instruments during the year relates to fair value movement only.
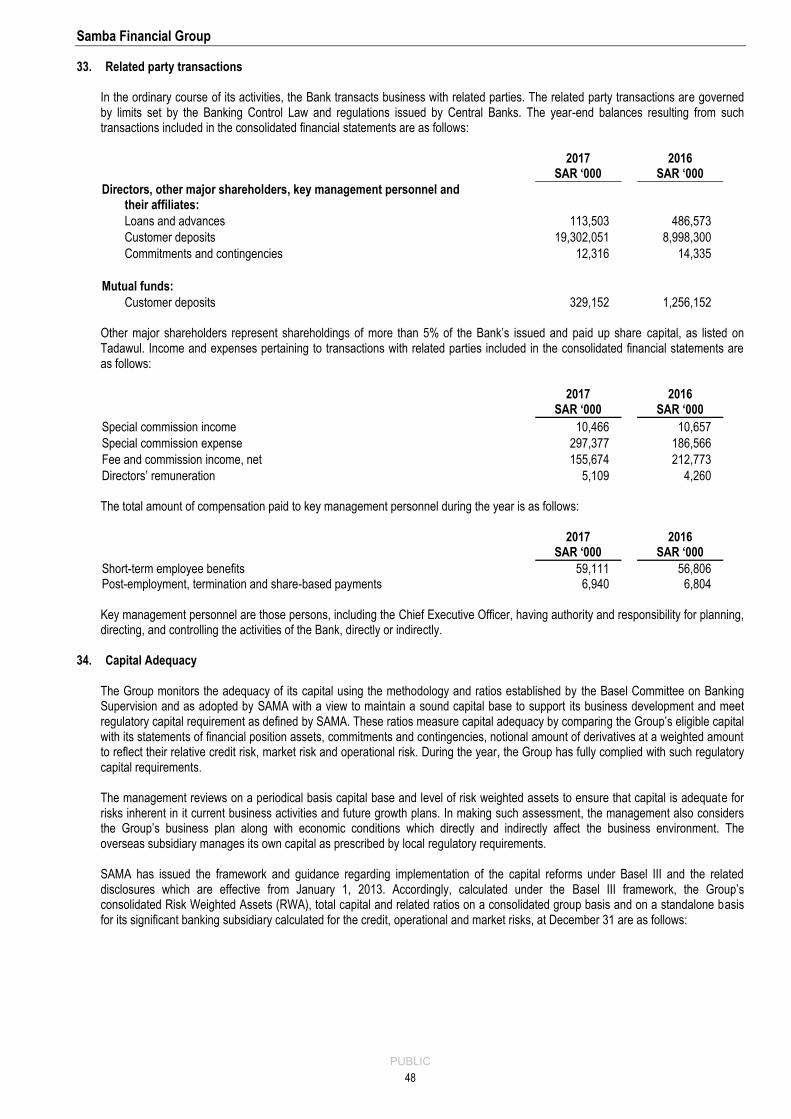
Samba Financial Group
PUBLIC
48
33. Related party transactions In the ordinary course of its activities, the Bank transacts business with related parties. The related party transactions are governed by limits set by the Banking Control Law and regulations issued by Central Banks. The year-end balances resulting from such transactions included in the consolidated financial statements are as follows:
2017
SAR ‘000 2016
SAR ‘000
Directors, other major shareholders, key management personnel and their affiliates:
Loans and advances 113,503 486,573
Customer deposits 19,302,051 8,998,300
Commitments and contingencies 12,316 14,335
Mutual funds:
Customer deposits 329,152 1,256,152 Other major shareholders represent shareholdings of more than 5% of the Bank’s issued and paid up share capital, as listed on Tadawul. Income and expenses pertaining to transactions with related parties included in the consolidated financial statements are as follows:
2017
SAR ‘000 2016
SAR ‘000
Special commission income 10,466 10,657
Special commission expense 297,377 186,566
Fee and commission income, net 155,674 212,773
Directors’ remuneration 5,109 4,260 The total amount of compensation paid to key management personnel during the year is as follows:
2017
SAR ‘000 2016
SAR ‘000
Short-term employee benefits 59,111 56,806 Post-employment, termination and share-based payments 6,940 6,804 Key management personnel are those persons, including the Chief Executive Officer, having authority and responsibility for planning, directing, and controlling the activities of the Bank, directly or indirectly.
34. Capital Adequacy The Group monitors the adequacy of its capital using the methodology and ratios established by the Basel Committee on Banking Supervision and as adopted by SAMA with a view to maintain a sound capital base to support its business development and meet regulatory capital requirement as defined by SAMA. These ratios measure capital adequacy by comparing the Group’s eligible capital with its statements of financial position assets, commitments and contingencies, notional amount of derivatives at a weighted amount to reflect their relative credit risk, market risk and operational risk. During the year, the Group has fully complied with such regulatory capital requirements. The management reviews on a periodical basis capital base and level of risk weighted assets to ensure that capital is adequate for risks inherent in it current business activities and future growth plans. In making such assessment, the management also considers the Group’s business plan along with economic conditions which directly and indirectly affect the business environment. The overseas subsidiary manages its own capital as prescribed by local regulatory requirements. SAMA has issued the framework and guidance regarding implementation of the capital reforms under Basel III and the related disclosures which are effective from January 1, 2013. Accordingly, calculated under the Basel III framework, the Group’s consolidated Risk Weighted Assets (RWA), total capital and related ratios on a consolidated group basis and on a standalone basis for its significant banking subsidiary calculated for the credit, operational and market risks, at December 31 are as follows:
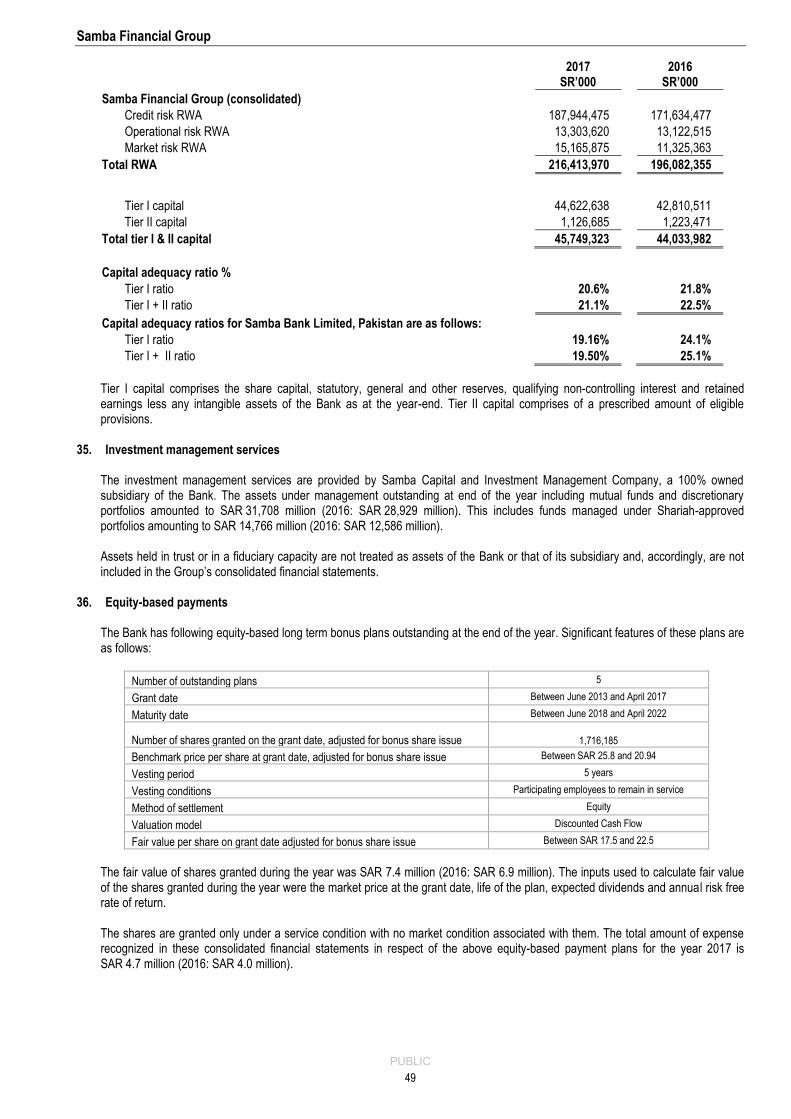
Samba Financial Group
PUBLIC
49
2017
SR’000 2016
SR’000
Samba Financial Group (consolidated)
Credit risk RWA 187,944,475 171,634,477
Operational risk RWA 13,303,620 13,122,515
Market risk RWA 15,165,875 11,325,363
Total RWA 216,413,970 196,082,355
Tier I capital 44,622,638 42,810,511
Tier II capital 1,126,685 1,223,471
Total tier I & II capital 45,749,323 44,033,982
Capital adequacy ratio %
Tier I ratio 20.6% 21.8%
Tier I + II ratio 21.1% 22.5%
Capital adequacy ratios for Samba Bank Limited, Pakistan are as follows:
Tier I ratio 19.16% 24.1%
Tier I + II ratio 19.50% 25.1%
Tier I capital comprises the share capital, statutory, general and other reserves, qualifying non-controlling interest and retained earnings less any intangible assets of the Bank as at the year-end. Tier II capital comprises of a prescribed amount of eligible provisions.
35. Investment management services The investment management services are provided by Samba Capital and Investment Management Company, a 100% owned subsidiary of the Bank. The assets under management outstanding at end of the year including mutual funds and discretionary portfolios amounted to SAR 31,708 million (2016: SAR 28,929 million). This includes funds managed under Shariah-approved portfolios amounting to SAR 14,766 million (2016: SAR 12,586 million). Assets held in trust or in a fiduciary capacity are not treated as assets of the Bank or that of its subsidiary and, accordingly, are not included in the Group’s consolidated financial statements.
36. Equity-based payments The Bank has following equity-based long term bonus plans outstanding at the end of the year. Significant features of these plans are as follows:
Number of outstanding plans 5
Grant date Between June 2013 and April 2017
Maturity date Between June 2018 and April 2022
Number of shares granted on the grant date, adjusted for bonus share issue
1,716,185
Benchmark price per share at grant date, adjusted for bonus share issue Between SAR 25.8 and 20.94
Vesting period 5 years
Vesting conditions Participating employees to remain in service
Method of settlement Equity
Valuation model Discounted Cash Flow
Fair value per share on grant date adjusted for bonus share issue Between SAR 17.5 and 22.5
The fair value of shares granted during the year was SAR 7.4 million (2016: SAR 6.9 million). The inputs used to calculate fair value of the shares granted during the year were the market price at the grant date, life of the plan, expected dividends and annual risk free rate of return. The shares are granted only under a service condition with no market condition associated with them. The total amount of expense recognized in these consolidated financial statements in respect of the above equity-based payment plans for the year 2017 is SAR 4.7 million (2016: SAR 4.0 million).
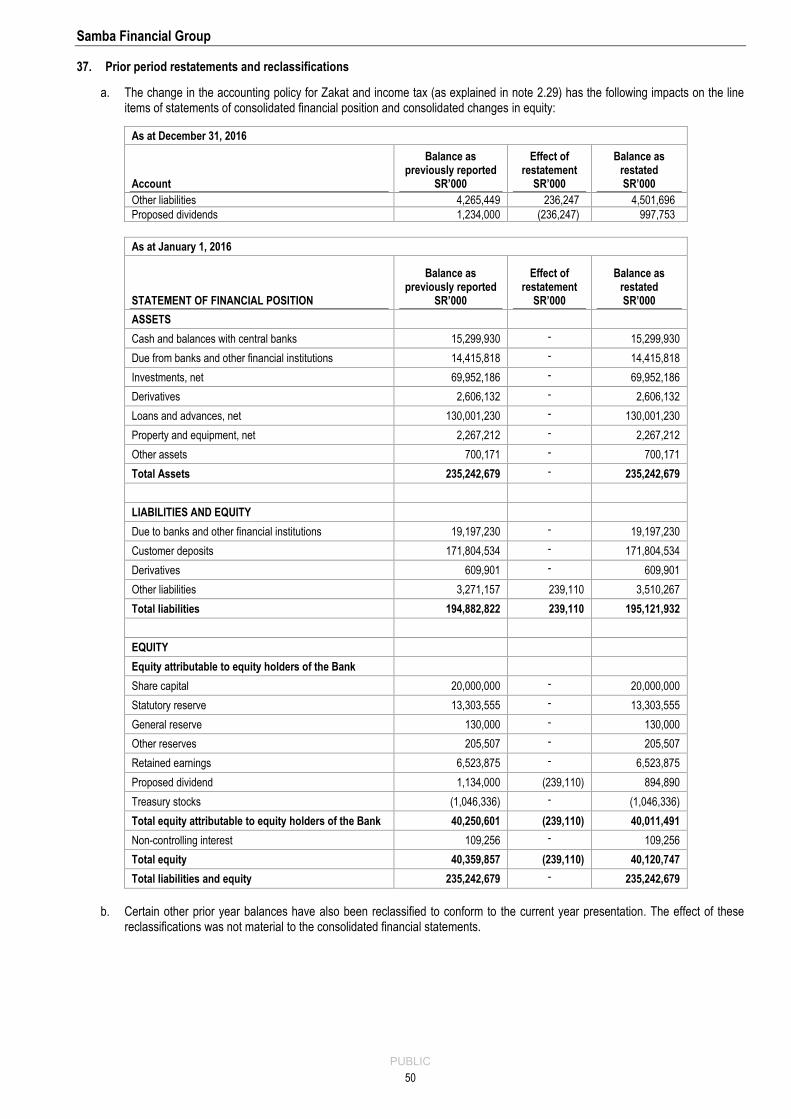
Samba Financial Group
PUBLIC
50
37. Prior period restatements and reclassifications
a. The change in the accounting policy for Zakat and income tax (as explained in note 2.29) has the following impacts on the line items of statements of consolidated financial position and consolidated changes in equity:
As at December 31, 2016
Account
Balance as previously reported
SR’000
Effect of restatement
SR’000
Balance as restated SR’000
Other liabilities 4,265,449 236,247 4,501,696
Proposed dividends 1,234,000 (236,247) 997,753
As at January 1, 2016
STATEMENT OF FINANCIAL POSITION
Balance as previously reported
SR’000
Effect of restatement
SR’000
Balance as restated SR’000
ASSETS
Cash and balances with central banks 15,299,930 - 15,299,930
Due from banks and other financial institutions 14,415,818 - 14,415,818
Investments, net 69,952,186 - 69,952,186
Derivatives 2,606,132 - 2,606,132
Loans and advances, net 130,001,230 - 130,001,230
Property and equipment, net 2,267,212 - 2,267,212
Other assets 700,171 - 700,171
Total Assets 235,242,679 - 235,242,679
LIABILITIES AND EQUITY
Due to banks and other financial institutions 19,197,230 - 19,197,230
Customer deposits 171,804,534 - 171,804,534
Derivatives 609,901 - 609,901
Other liabilities 3,271,157 239,110 3,510,267
Total liabilities 194,882,822 239,110 195,121,932
EQUITY
Equity attributable to equity holders of the Bank
Share capital 20,000,000 - 20,000,000
Statutory reserve 13,303,555 - 13,303,555
General reserve 130,000 - 130,000
Other reserves 205,507 - 205,507
Retained earnings 6,523,875 - 6,523,875
Proposed dividend 1,134,000 (239,110) 894,890
Treasury stocks (1,046,336) - (1,046,336)
Total equity attributable to equity holders of the Bank 40,250,601 (239,110) 40,011,491
Non-controlling interest 109,256 - 109,256
Total equity 40,359,857 (239,110) 40,120,747
Total liabilities and equity 235,242,679 - 235,242,679
b. Certain other prior year balances have also been reclassified to conform to the current year presentation. The effect of these
reclassifications was not material to the consolidated financial statements.
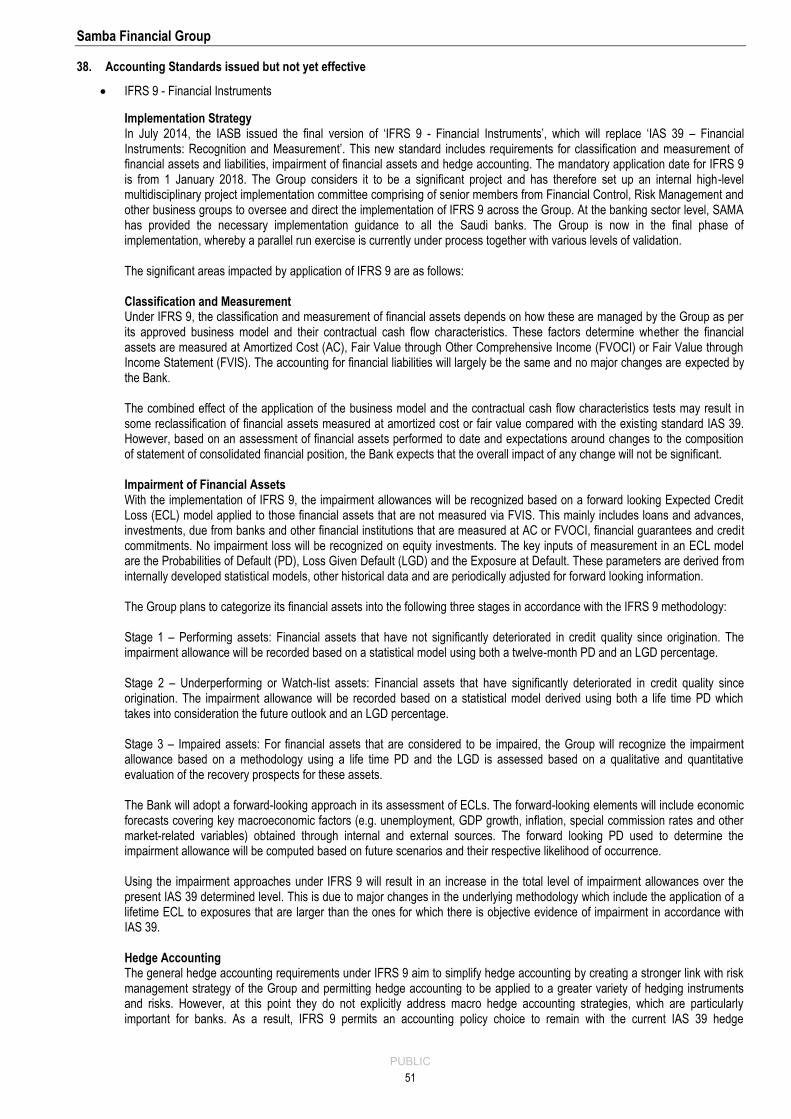
Samba Financial Group
PUBLIC
51
38. Accounting Standards issued but not yet effective
IFRS 9 - Financial Instruments
Implementation Strategy In July 2014, the IASB issued the final version of ‘IFRS 9 - Financial Instruments’, which will replace ‘IAS 39 – Financial Instruments: Recognition and Measurement’. This new standard includes requirements for classification and measurement of financial assets and liabilities, impairment of financial assets and hedge accounting. The mandatory application date for IFRS 9 is from 1 January 2018. The Group considers it to be a significant project and has therefore set up an internal high-level multidisciplinary project implementation committee comprising of senior members from Financial Control, Risk Management and other business groups to oversee and direct the implementation of IFRS 9 across the Group. At the banking sector level, SAMA has provided the necessary implementation guidance to all the Saudi banks. The Group is now in the final phase of implementation, whereby a parallel run exercise is currently under process together with various levels of validation. The significant areas impacted by application of IFRS 9 are as follows: Classification and Measurement Under IFRS 9, the classification and measurement of financial assets depends on how these are managed by the Group as per its approved business model and their contractual cash flow characteristics. These factors determine whether the financial assets are measured at Amortized Cost (AC), Fair Value through Other Comprehensive Income (FVOCI) or Fair Value through Income Statement (FVIS). The accounting for financial liabilities will largely be the same and no major changes are expected by the Bank. The combined effect of the application of the business model and the contractual cash flow characteristics tests may result in some reclassification of financial assets measured at amortized cost or fair value compared with the existing standard IAS 39. However, based on an assessment of financial assets performed to date and expectations around changes to the composition of statement of consolidated financial position, the Bank expects that the overall impact of any change will not be significant. Impairment of Financial Assets With the implementation of IFRS 9, the impairment allowances will be recognized based on a forward looking Expected Credit Loss (ECL) model applied to those financial assets that are not measured via FVIS. This mainly includes loans and advances, investments, due from banks and other financial institutions that are measured at AC or FVOCI, financial guarantees and credit commitments. No impairment loss will be recognized on equity investments. The key inputs of measurement in an ECL model are the Probabilities of Default (PD), Loss Given Default (LGD) and the Exposure at Default. These parameters are derived from internally developed statistical models, other historical data and are periodically adjusted for forward looking information. The Group plans to categorize its financial assets into the following three stages in accordance with the IFRS 9 methodology: Stage 1 – Performing assets: Financial assets that have not significantly deteriorated in credit quality since origination. The impairment allowance will be recorded based on a statistical model using both a twelve-month PD and an LGD percentage. Stage 2 – Underperforming or Watch-list assets: Financial assets that have significantly deteriorated in credit quality since origination. The impairment allowance will be recorded based on a statistical model derived using both a life time PD which takes into consideration the future outlook and an LGD percentage. Stage 3 – Impaired assets: For financial assets that are considered to be impaired, the Group will recognize the impairment allowance based on a methodology using a life time PD and the LGD is assessed based on a qualitative and quantitative evaluation of the recovery prospects for these assets. The Bank will adopt a forward-looking approach in its assessment of ECLs. The forward-looking elements will include economic forecasts covering key macroeconomic factors (e.g. unemployment, GDP growth, inflation, special commission rates and other market-related variables) obtained through internal and external sources. The forward looking PD used to determine the impairment allowance will be computed based on future scenarios and their respective likelihood of occurrence. Using the impairment approaches under IFRS 9 will result in an increase in the total level of impairment allowances over the present IAS 39 determined level. This is due to major changes in the underlying methodology which include the application of a lifetime ECL to exposures that are larger than the ones for which there is objective evidence of impairment in accordance with IAS 39. Hedge Accounting The general hedge accounting requirements under IFRS 9 aim to simplify hedge accounting by creating a stronger link with risk management strategy of the Group and permitting hedge accounting to be applied to a greater variety of hedging instruments and risks. However, at this point they do not explicitly address macro hedge accounting strategies, which are particularly important for banks. As a result, IFRS 9 permits an accounting policy choice to remain with the current IAS 39 hedge
Samba Financial Group
PUBLIC
52
accounting. Based on the analysis performed to date, the Group has exercised the accounting policy choice to continue with IAS 39 hedge accounting and therefore is not currently planning to change its hedge accounting. Expected Impact According to the transitional provisions of IFRS 9, the Group is permitted to recognize any difference between previous carrying amounts of the financial assets under IAS 39 and the carrying amounts at the beginning of the application date through its opening balance of retained earnings. The combined impact of this initial adjustment is estimated to be a reduction of approximately 5% to the opening balance of the Group’s equity. The Group’s capital ratios will also be impacted by such an adjustment to the equity, but this impact is not expected to be greater than 0.65% of the current levels, notwithstanding the five year transitionary arrangements allowed by SAMA. Furthermore, with the implementation of IFRS 9, the Group also expects greater volatility in its annual impairment charges as compared to the existing methodology which is currently governed by IAS 39 and the prevailing SAMA guidelines. This may impact the Group’s future profitability as well as its regulatory capital levels. It should however be noted that the above assessment is a point in time estimate and is not a forecast. The actual effect of the implementation of IFRS 9 may vary from this estimate as the Group continues to refine and recalibrate its models, methodologies and processes with continuing related regulatory guidance and developments. The new standard also introduces extensive disclosure requirements and changes in presentation. These are expected to change the nature and extent of the Group’s disclosures about its financial instruments particularly in the year of adoption of the new standard. Governance and Controls The governance structure and controls is currently under implementation in line with the IFRS 9 guidance document which calls for the establishment of an approved governance framework with detailed policies and controls, including roles and responsibilities of the various stakeholders.
The other Accounting standards, amendments and revisions which have been published and are mandatory for compliance for the Group’s accounting year beginning 1 January 2018 are listed below. The Group has opted not to early adopt these pronouncements and they do not have a significant impact on the consolidated financial statements.
IFRS 15: Revenue from Contracts with Customers - New revenue standard is applicable to all entities and will supersede all current revenue recognition requirements under IFRS. Effective for annual periods beginning on or after 1 January 2018.
Amendments to IFRS 2: Share-based Payment - The amendments cover measurement of cash-settled share-based payments, classification of share-based payments settled net of tax withholdings, and accounting for a modification of a share-based payment from cash-settled to equity-settled. Effective for the annual periods beginning on or after 1 January 2018.
IFRS 16: Leases - The new standard eliminates the current dual accounting model for lessees under IAS 17, which distinguishes between on-balance sheet finance leases and off-balance sheet operating leases. Instead, IFRS 16 proposes on-balance sheet accounting model. Effective for the annual periods beginning on or after 1 January 2019.
Amendments to IAS 40: Investment Property - The amendments clarify that to transfer to, or from, investment properties there must be a change in use. If a property has changed use, there should be an assessment of whether the property meets the definition and this change must be supported by evidence.
Amendments to IAS 28: Investments in associates and joint ventures - The amendments clarify that companies account for long-term interests in an associate or joint venture to which the equity method is not applied using IFRS 9.
Amendments to IFRIC 22: Foreign currency transactions and advance consideration - The interpretation provides guidance for when a single payment/receipt is made as well as for situations where multiple payments/receipts are made.
Annual improvements 2014 – 2016 cycle - These amendments impact two standards:
IFRS 1: First-time adoption of IFRS - regarding the deletion of short-term exemptions for first-time adopters regarding IFRS 7, IFRS 19 and IFRS 10 effective from January 1, 2018.
IAS 28: Investments in associates and joint ventures - regarding measuring an associate or joint venture at fair value effective January 1, 2018.
39. Board of Directors' approval
The consolidated financial statements were approved by the Board of Directors’ on February 21, 2018 (5 Jumada II 1439H).