consolidated financial statements - great-west lifeco · changes in insurance and investment...
TRANSCRIPT

Consolidated Financial Statements
For the year 2016
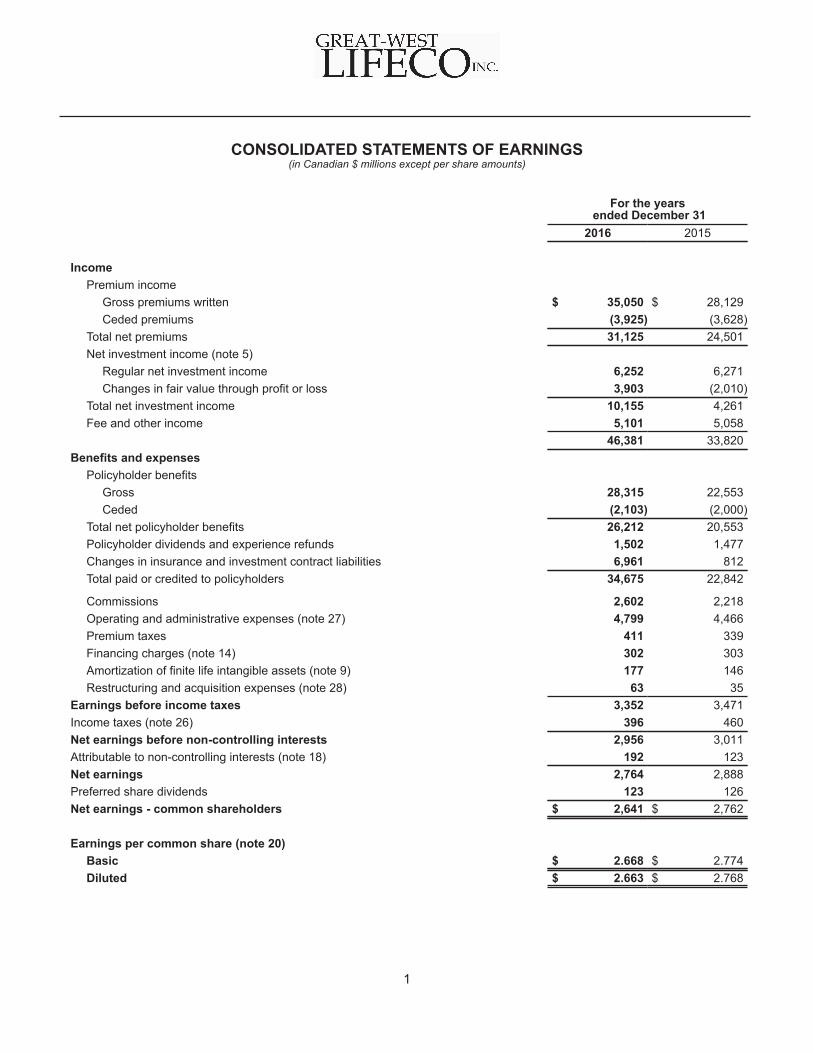
CONSOLIDATED STATEMENTS OF EARNINGS (in Canadian $ millions except per share amounts)
For the years ended December 31
2016 2015
IncomePremium income
Gross premiums written $ 35,050 $ 28,129Ceded premiums (3,925) (3,628)
Total net premiums 31,125 24,501Net investment income (note 5)
Regular net investment income 6,252 6,271Changes in fair value through profit or loss 3,903 (2,010)
Total net investment income 10,155 4,261Fee and other income 5,101 5,058
46,381 33,820Benefits and expenses
Policyholder benefitsGross 28,315 22,553Ceded (2,103) (2,000)
Total net policyholder benefits 26,212 20,553Policyholder dividends and experience refunds 1,502 1,477Changes in insurance and investment contract liabilities 6,961 812Total paid or credited to policyholders 34,675 22,842
Commissions 2,602 2,218Operating and administrative expenses (note 27) 4,799 4,466Premium taxes 411 339Financing charges (note 14) 302 303Amortization of finite life intangible assets (note 9) 177 146Restructuring and acquisition expenses (note 28) 63 35
Earnings before income taxes 3,352 3,471Income taxes (note 26) 396 460Net earnings before non-controlling interests 2,956 3,011Attributable to non-controlling interests (note 18) 192 123Net earnings 2,764 2,888Preferred share dividends 123 126Net earnings - common shareholders $ 2,641 $ 2,762
Earnings per common share (note 20)Basic $ 2.668 $ 2.774Diluted $ 2.663 $ 2.768
1
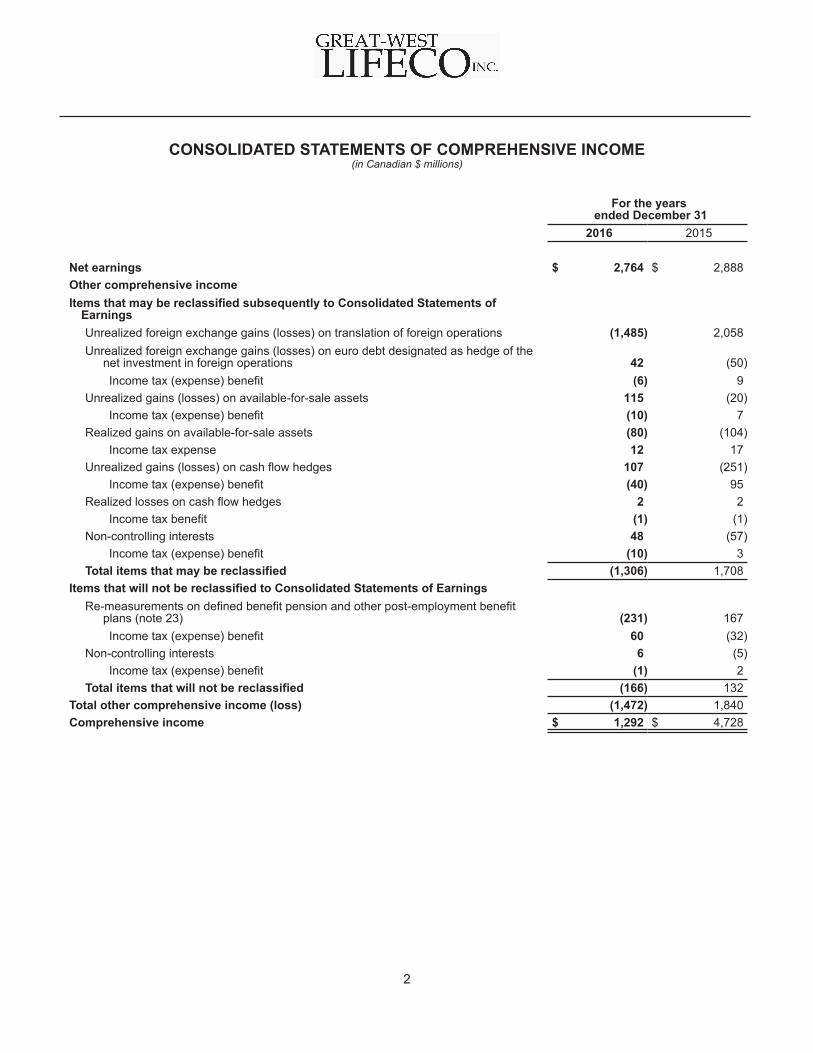
CONSOLIDATED STATEMENTS OF COMPREHENSIVE INCOME (in Canadian $ millions)
For the years ended December 31
2016 2015
Net earnings $ 2,764 $ 2,888Other comprehensive incomeItems that may be reclassified subsequently to Consolidated Statements of
EarningsUnrealized foreign exchange gains (losses) on translation of foreign operations (1,485) 2,058Unrealized foreign exchange gains (losses) on euro debt designated as hedge of the
net investment in foreign operations 42 (50)Income tax (expense) benefit (6) 9
Unrealized gains (losses) on available-for-sale assets 115 (20)Income tax (expense) benefit (10) 7
Realized gains on available-for-sale assets (80) (104)Income tax expense 12 17
Unrealized gains (losses) on cash flow hedges 107 (251)Income tax (expense) benefit (40) 95
Realized losses on cash flow hedges 2 2Income tax benefit (1) (1)
Non-controlling interests 48 (57)Income tax (expense) benefit (10) 3
Total items that may be reclassified (1,306) 1,708Items that will not be reclassified to Consolidated Statements of Earnings
Re-measurements on defined benefit pension and other post-employment benefitplans (note 23) (231) 167Income tax (expense) benefit 60 (32)
Non-controlling interests 6 (5)Income tax (expense) benefit (1) 2
Total items that will not be reclassified (166) 132Total other comprehensive income (loss) (1,472) 1,840Comprehensive income $ 1,292 $ 4,728
2
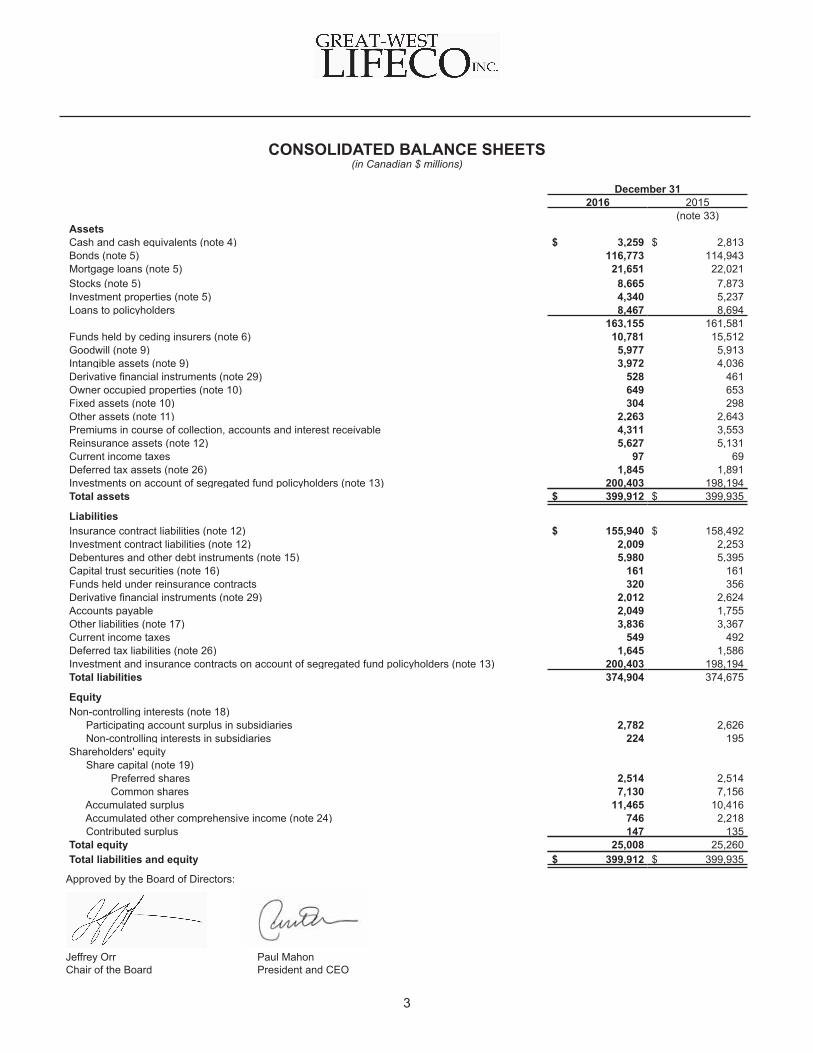
CONSOLIDATED BALANCE SHEETS (in Canadian $ millions)
December 312016 2015
(note 33)AssetsCash and cash equivalents (note 4) $ 3,259 $ 2,813Bonds (note 5) 116,773 114,943Mortgage loans (note 5) 21,651 22,021Stocks (note 5) 8,665 7,873Investment properties (note 5) 4,340 5,237Loans to policyholders 8,467 8,694
163,155 161,581Funds held by ceding insurers (note 6) 10,781 15,512Goodwill (note 9) 5,977 5,913Intangible assets (note 9) 3,972 4,036Derivative financial instruments (note 29) 528 461Owner occupied properties (note 10) 649 653Fixed assets (note 10) 304 298Other assets (note 11) 2,263 2,643Premiums in course of collection, accounts and interest receivable 4,311 3,553Reinsurance assets (note 12) 5,627 5,131Current income taxes 97 69Deferred tax assets (note 26) 1,845 1,891Investments on account of segregated fund policyholders (note 13) 200,403 198,194Total assets $ 399,912 $ 399,935
LiabilitiesInsurance contract liabilities (note 12) $ 155,940 $ 158,492Investment contract liabilities (note 12) 2,009 2,253Debentures and other debt instruments (note 15) 5,980 5,395Capital trust securities (note 16) 161 161Funds held under reinsurance contracts 320 356Derivative financial instruments (note 29) 2,012 2,624Accounts payable 2,049 1,755Other liabilities (note 17) 3,836 3,367Current income taxes 549 492Deferred tax liabilities (note 26) 1,645 1,586Investment and insurance contracts on account of segregated fund policyholders (note 13) 200,403 198,194Total liabilities 374,904 374,675
EquityNon-controlling interests (note 18)
Participating account surplus in subsidiaries 2,782 2,626 Non-controlling interests in subsidiaries 224 195
Shareholders' equity Share capital (note 19)
Preferred shares 2,514 2,514 Common shares 7,130 7,156
Accumulated surplus 11,465 10,416 Accumulated other comprehensive income (note 24) 746 2,218 Contributed surplus 147 135
Total equity 25,008 25,260Total liabilities and equity $ 399,912 $ 399,935
Approved by the Board of Directors:
Jeffrey Orr Paul MahonChair of the Board President and CEO
3
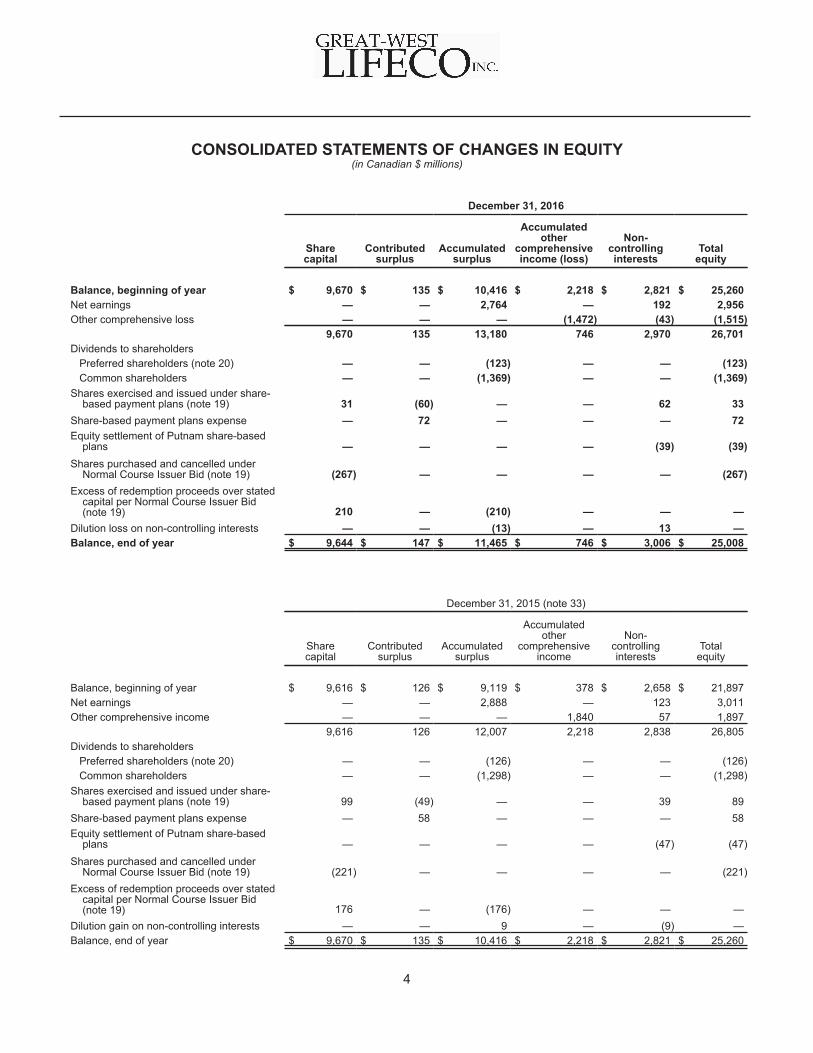
CONSOLIDATED STATEMENTS OF CHANGES IN EQUITY (in Canadian $ millions)
December 31, 2016
Sharecapital
Contributedsurplus
Accumulatedsurplus
Accumulatedother
comprehensiveincome (loss)
Non-controllinginterests
Totalequity
Balance, beginning of year $ 9,670 $ 135 $ 10,416 $ 2,218 $ 2,821 $ 25,260Net earnings — — 2,764 — 192 2,956Other comprehensive loss — — — (1,472) (43) (1,515)
9,670 135 13,180 746 2,970 26,701Dividends to shareholders Preferred shareholders (note 20) — — (123) — — (123) Common shareholders — — (1,369) — — (1,369)Shares exercised and issued under share-
based payment plans (note 19) 31 (60) — — 62 33Share-based payment plans expense — 72 — — — 72Equity settlement of Putnam share-based
plans — — — — (39) (39)Shares purchased and cancelled under
Normal Course Issuer Bid (note 19) (267) — — — — (267)Excess of redemption proceeds over stated
capital per Normal Course Issuer Bid(note 19) 210 — (210) — — —
Dilution loss on non-controlling interests — — (13) — 13 —Balance, end of year $ 9,644 $ 147 $ 11,465 $ 746 $ 3,006 $ 25,008
December 31, 2015 (note 33)
Sharecapital
Contributedsurplus
Accumulatedsurplus
Accumulatedother
comprehensiveincome
Non-controllinginterests
Totalequity
Balance, beginning of year $ 9,616 $ 126 $ 9,119 $ 378 $ 2,658 $ 21,897Net earnings — — 2,888 — 123 3,011Other comprehensive income — — — 1,840 57 1,897
9,616 126 12,007 2,218 2,838 26,805Dividends to shareholders Preferred shareholders (note 20) — — (126) — — (126) Common shareholders — — (1,298) — — (1,298)Shares exercised and issued under share-
based payment plans (note 19) 99 (49) — — 39 89Share-based payment plans expense — 58 — — — 58Equity settlement of Putnam share-based
plans — — — — (47) (47)Shares purchased and cancelled under
Normal Course Issuer Bid (note 19) (221) — — — — (221)Excess of redemption proceeds over stated
capital per Normal Course Issuer Bid(note 19) 176 — (176) — — —
Dilution gain on non-controlling interests — — 9 — (9) —Balance, end of year $ 9,670 $ 135 $ 10,416 $ 2,218 $ 2,821 $ 25,260
4
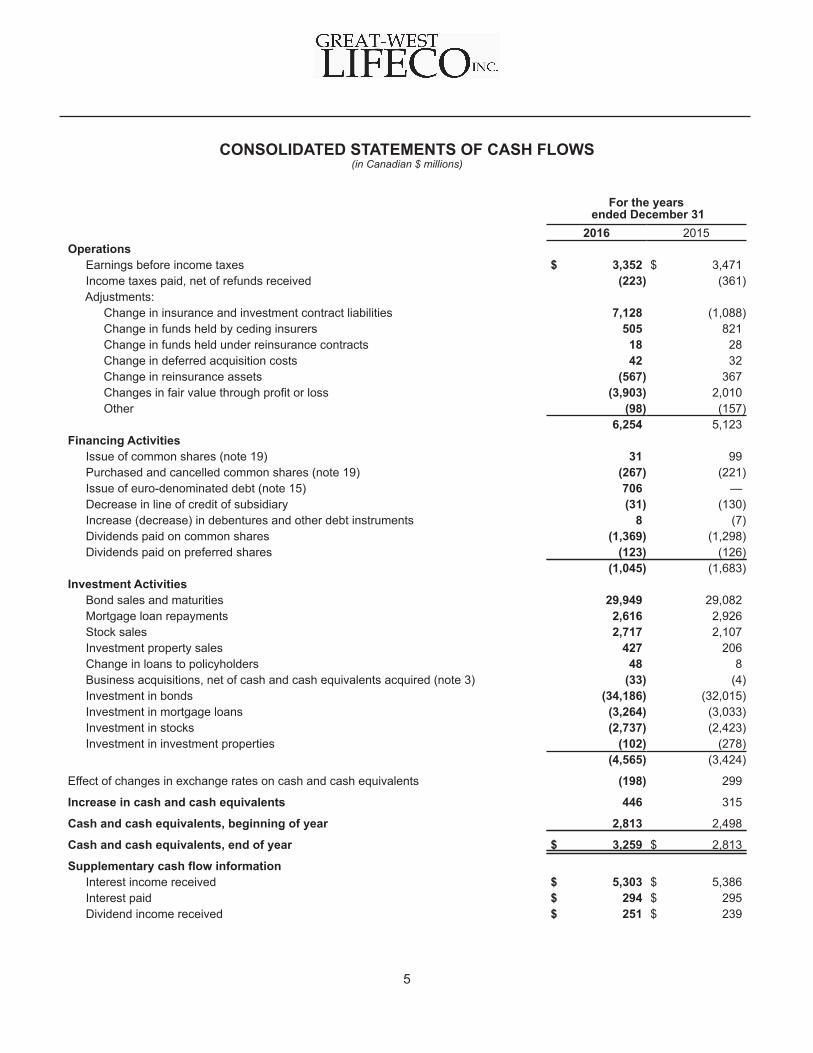
CONSOLIDATED STATEMENTS OF CASH FLOWS (in Canadian $ millions)
For the years ended December 31
2016 2015Operations
Earnings before income taxes $ 3,352 $ 3,471 Income taxes paid, net of refunds received (223) (361) Adjustments:
Change in insurance and investment contract liabilities 7,128 (1,088) Change in funds held by ceding insurers 505 821 Change in funds held under reinsurance contracts 18 28 Change in deferred acquisition costs 42 32 Change in reinsurance assets (567) 367 Changes in fair value through profit or loss (3,903) 2,010 Other (98) (157)
6,254 5,123Financing Activities
Issue of common shares (note 19) 31 99 Purchased and cancelled common shares (note 19) (267) (221) Issue of euro-denominated debt (note 15) 706 — Decrease in line of credit of subsidiary (31) (130) Increase (decrease) in debentures and other debt instruments 8 (7) Dividends paid on common shares (1,369) (1,298) Dividends paid on preferred shares (123) (126)
(1,045) (1,683)Investment Activities
Bond sales and maturities 29,949 29,082 Mortgage loan repayments 2,616 2,926 Stock sales 2,717 2,107 Investment property sales 427 206 Change in loans to policyholders 48 8 Business acquisitions, net of cash and cash equivalents acquired (note 3) (33) (4) Investment in bonds (34,186) (32,015) Investment in mortgage loans (3,264) (3,033) Investment in stocks (2,737) (2,423) Investment in investment properties (102) (278)
(4,565) (3,424)
Effect of changes in exchange rates on cash and cash equivalents (198) 299
Increase in cash and cash equivalents 446 315
Cash and cash equivalents, beginning of year 2,813 2,498
Cash and cash equivalents, end of year $ 3,259 $ 2,813
Supplementary cash flow information Interest income received $ 5,303 $ 5,386 Interest paid $ 294 $ 295 Dividend income received $ 251 $ 239
5
NOTES TO CONSOLIDATED FINANCIAL STATEMENTS
(in Canadian $ millions except per share amounts)
6
1. Corporate Information
Great-West Lifeco Inc. (Lifeco or the Company) is a publicly listed company (Toronto Stock Exchange: GWO),incorporated and domiciled in Canada. The registered address of the Company is 100 Osborne Street North,Winnipeg, Manitoba, Canada, R3C 1V3. Lifeco is a member of the Power Corporation of Canada group ofcompanies and its direct parent is Power Financial Corporation (Power Financial).
Lifeco is a financial services holding company with interests in the life insurance, health insurance, retirementsavings, investment management and reinsurance businesses, primarily in Canada, the United States and Europethrough its operating subsidiaries including The Great-West Life Assurance Company (Great-West Life), LondonLife Insurance Company (London Life), The Canada Life Assurance Company (Canada Life), Great-West Life &Annuity Insurance Company (Great-West Financial) and Putnam Investments, LLC (Putnam).
The consolidated financial statements (financial statements) of the Company as at and for the year endedDecember 31, 2016 were approved by the Board of Directors on February 9, 2017.
2. Basis of Presentation and Summary of Accounting Policies
The financial statements of the Company have been prepared in compliance with International Financial ReportingStandards (IFRS), as issued by the International Accounting Standards Board (IASB). Consistent accountingpolicies were applied in the preparation of the consolidated financial statements of the subsidiaries of the Company.
The Company adopted the narrow scope amendments to IFRS for IFRS 11 Joint Arrangements, IAS 16 Property,Plant and Equipment, IAS 38 Intangible Assets, IAS 1 Presentation of Financial Statements, IFRS 10 ConsolidatedFinancial Statements, IFRS 12 Disclosure of Interests in Other Entities, IAS 28 Investments in Associates andJoint Ventures and Annual Improvements 2012 - 2014 Cycle effective January 1, 2016. The adoption of thesenarrow scope amendments did not have a significant impact on the Company’s financial statements.
Basis of ConsolidationThe consolidated financial statements of the Company were prepared as at and for the year ended December 31,2016 with comparative information for December 31, 2015. Subsidiaries are fully consolidated from the date ofacquisition, being the date on which the Company obtains control, and continue to be consolidated until the datethat such control ceases. The Company has control when it has the power to direct the relevant activities, hassignificant exposure to variable returns from these activities and has the ability to use its power to affect the variablereturns. All intercompany balances, transactions, income and expenses and profits or losses, including dividendsresulting from intercompany transactions, are eliminated on consolidation.
Use of Significant Judgments, Estimates and Assumptions In preparation of these financial statements, management is required to make significant judgments, estimatesand assumptions that affect the reported amounts of assets, liabilities, net earnings and related disclosures.Although some uncertainty is inherent in these judgments and estimates, management believes that the amountsrecorded are reasonable. Key sources of estimation uncertainty and areas where significant judgments have beenmade are listed below and discussed throughout the notes to these financial statements including:
• Management uses independent qualified appraisal services to determine the fair value of investmentproperties, which utilize judgments and estimates. These appraisals are adjusted by applying managementjudgments and estimates for material changes in property cash flows, capital expenditures or generalmarket conditions (note 5).
• In the determination of the fair value of financial instruments, the Company's management exercisesjudgment in the determination of fair value inputs, particularly those items categorized within level 3 of thefair value hierarchy (note 8).
• Cash generating unit groupings for goodwill and indefinite life intangible assets have been determined bymanagement as the lowest level that the assets are monitored for internal reporting purposes, whichrequires management judgment in the determination of the lowest level of monitoring (note 9).
• Management evaluates the synergies and future benefit for initial recognition and measurement of goodwilland intangible assets as well as testing the recoverable amounts. The determination of the carrying valueand recoverable amounts of the cash generating unit groupings for goodwill and intangible assets reliesupon the determination of fair value or value-in-use using valuation methodologies (note 9).
• Judgments are used by management in determining whether deferred acquisition costs and deferredincome reserves can be recognized on the Consolidated Balance Sheets. Deferred acquisition costs arerecognized if management determines the costs meet the definition of an asset and are incremental andrelated to the issuance of the investment contract. Deferred income reserves are amortized on a straight-line basis over the term of the policy (notes 11 and 17).
• Management uses judgment to evaluate the classification of insurance and reinsurance contracts todetermine whether these arrangements should be accounted for as insurance, investment or servicecontracts.
• The actuarial assumptions, such as interest rates, inflation, policyholder behaviour, mortality and morbidityof policyholders, used in the valuation of insurance and certain investment contract liabilities under theCanadian Asset Liability Method require significant judgment and estimation (note 12).
• The actuarial assumptions used in determining the expense and benefit obligations for the Company’sdefined benefit pension plans and other post-employment benefits requires significant judgment andestimation. Management reviews previous experience of its plan members and market conditions includinginterest rates and inflation rates in evaluating the assumptions used in determining the expense for thecurrent year (note 23).
• The Company operates within various tax jurisdictions where significant management judgments andestimates are required when interpreting the relevant tax laws, regulations and legislation in thedetermination of the Company’s tax provisions and the carrying amounts of its tax assets and liabilities(note 26).
• Management assesses the recoverability of the deferred income tax asset carrying values based on futureyears’ taxable income projections and believes the carrying values of the deferred income tax assets asof December 31, 2016 are recoverable (note 26).
• Legal and other provisions are recognized resulting from a past event which, in the judgment ofmanagement, has resulted in a probable outflow of economic resources which would be passed to a third-party to settle the obligation. Management uses judgment to evaluate the possible outcomes and risks indetermining the best estimate of the provision at the balance sheet date (note 30).
• The operating segments of the Company, which are the segments reviewed by the Company’s ChiefExecutive Officer to assess performance and allocate resources within the Company, are aligned with theCompany’s geographic operations. Management applies judgment in the aggregation of the businessunits into the Company's operating segments (note 32).
• The Company consolidates all subsidiaries and entities which management determines that the Companycontrols. Control is evaluated on the ability of the Company to direct the activities of the subsidiary orentity to derive variable returns and management uses judgment in determining whether control exists.Judgment is exercised in the evaluation of the variable returns and in determining the extent to which theCompany has the ability to exercise its power to generate variable returns.
• Management uses judgments, such as the determination of the risks and benefits associated with thetransaction that are used in determining whether the Company retains the primary obligation with a clientin sub-advisor arrangements. Where the Company retains the risks and benefits, revenue and expensesare recorded on a gross basis.
2. Basis of Presentation and Summary of Accounting Policies (cont'd)
7
• Within the Consolidated Statements of Cash Flows, purchases and sales of portfolio investments arerecorded within investment activities due to management's judgment that these investing activities arelong-term in nature.
• The results of the Company reflect management’s judgments regarding the impact of prevailing globalcredit, equity and foreign exchange market conditions. The provision for future credit losses within theCompany's insurance contract liabilities relies upon investment credit ratings. The Company’s practice isto use third-party independent credit ratings where available. Management judgment is required whensetting credit ratings for instruments that do not have a third-party rating.
The significant accounting policies are as follows:
(a) Portfolio Investments
Portfolio investments include bonds, mortgage loans, stocks and investment properties. Portfolio investmentsare classified as fair value through profit or loss, available-for-sale, held-to-maturity, loans and receivables oras non-financial instruments based on management’s intention relating to the purpose and nature of theinstrument or characteristics of the investment. The Company has not classified any investments as held-to-maturity.
Investments in bonds and stocks normally actively traded on a public market or where fair value can be reliablymeasured are either designated or classified as fair value through profit or loss or classified as available-for-sale on a trade date basis. A financial asset is designated as fair value through profit or loss on initial recognitionif it eliminates or significantly reduces an accounting mismatch. Changes in the fair value of financial assetsdesignated as fair value through profit or loss are generally offset by changes in insurance contract liabilities,since the measurement of insurance contract liabilities is determined with reference to the assets supportingthe liabilities. A financial asset is classified as fair value through profit or loss on initial recognition if it is partof a portfolio that is actively traded for the purpose of earning investment income. Fair value through profit orloss investments are recognized at fair value on the Consolidated Balance Sheets with realized and unrealizedgains and losses reported in the Consolidated Statements of Earnings. Available-for-sale investments arerecognized at fair value on the Consolidated Balance Sheets with unrealized gains and losses recorded inother comprehensive income. Realized gains and losses on available-for-sale investments are reclassifiedfrom other comprehensive income and recorded in the Consolidated Statements of Earnings when theinvestment is sold. Interest income earned on both fair value through profit or loss and available-for-sale bondsis recorded as net investment income in the Consolidated Statements of Earnings.
Investments in stocks where a fair value cannot be measured reliably are classified as available–for–sale andcarried at cost. Investments in stocks for which the Company exerts significant influence over but does notcontrol are accounted for using the equity method of accounting. Investments in stocks over which the Companyexerts significant influence but does not control include the Company’s investment in an affiliated company,IGM Financial Inc. (IGM), a member of the Power Financial group of companies, and Allianz Ireland, an unlistedgeneral insurance company operating in Ireland.
Investments in mortgages and bonds not normally actively traded on a public market are classified as loansand receivables and are carried at amortized cost net of any allowance for credit losses. Interest income earnedand realized gains and losses on the sale of investments classified as loans and receivables are recorded inthe Consolidated Statements of Earnings and included in net investment income.
2. Basis of Presentation and Summary of Accounting Policies (cont'd)
8
Investment properties are real estate held to earn rental income or for capital appreciation. Investmentproperties are initially measured at cost and subsequently carried at fair value on the Consolidated BalanceSheets. All changes in fair value are recorded as net investment income in the Consolidated Statements ofEarnings. Properties held to earn rental income or for capital appreciation that have an insignificant portionthat is owner occupied or where there is no intent to occupy on a long-term basis are classified as investmentproperties. Properties that do not meet these criteria are classified as owner occupied properties. Propertythat is leased that would otherwise be classified as investment property if owned by the Company is alsoincluded within investment properties.
Fair Value MeasurementFinancial instrument carrying values necessarily reflect the prevailing market liquidity and the liquidity premiumsembedded within the market pricing methods that the Company relies upon.
Fair value movement on the assets supporting insurance contract liabilities is a major factor in the movementof insurance contract liabilities. Changes in the fair value of bonds designated or classified as fair value throughprofit or loss that support insurance and investment contract liabilities are largely offset by correspondingchanges in the fair value of liabilities except when the bond has been deemed impaired.
The following is a description of the methodologies used to value instruments carried at fair value:
Bonds - Fair Value Through Profit or Loss and Available-for-Sale
Fair values for bonds classified and designated as fair value through profit or loss or available-for-sale aredetermined with reference to quoted market bid prices primarily provided by third-party independent pricingsources. Where prices are not quoted in a normally active market, fair values are determined by valuationmodels. The Company maximizes the use of observable inputs when measuring fair value. The Companyobtains quoted prices in active markets, when available, for identical assets at the balance sheet date tomeasure bonds at fair value in its fair value through profit or loss and available-for-sale portfolios.
The Company estimates the fair value of bonds not traded in active markets by referring to actively tradedsecurities with similar attributes, dealer quotations, matrix pricing methodology, discounted cash flow analysesand/or internal valuation models. This methodology considers such factors as the issuer's industry, the security'srating, term, coupon rate and position in the capital structure of the issuer, as well as, yield curves, creditcurves, prepayment rates and other relevant factors. For bonds that are not traded in active markets, valuationsare adjusted to reflect illiquidity, and such adjustments generally are based on available market evidence. Inthe absence of such evidence, management's best estimate is used.
Bonds and Mortgages - Loans and Receivables
For disclosure purposes only, fair values for bonds and mortgages classified as loans and receivables aredetermined by discounting expected future cash flows using current market rates for similar instruments.Valuation inputs typically include benchmark yields and risk-adjusted spreads based on current lending activitiesand market activity.
Stocks - Fair Value Through Profit or Loss and Available-for-Sale
Fair values for stocks traded on an active market are generally determined by the last bid price for the securityfrom the exchange where it is principally traded. Fair values for stocks for which there is no active market istypically based upon alternative valuation techniques such as discounted cash flow analysis, review of pricemovement relative to the market and utilization of information provided by the underlying investment manager.The Company maximizes the use of observable inputs when measuring fair value. The Company obtainsquoted prices in active markets, when available, for identical assets at the balance sheet date to measurestocks at fair value in its fair value through profit or loss and available-for-sale portfolios.
2. Basis of Presentation and Summary of Accounting Policies (cont'd)
9
Investment Properties
Fair values for investment properties are determined using independent qualified appraisal services and includemanagement adjustments for material changes in property cash flows, capital expenditures or general marketconditions in the interim period between appraisals. The determination of the fair value of investment propertyrequires the use of estimates including future cash flows (such as future leasing assumptions, rental rates,capital and operating expenditures) and discount, reversionary and overall capitalization rates applicable tothe asset based on current market conditions. Investment property under construction is valued at fair valueif such values can be reliably determined; otherwise they are recorded at cost.
ImpairmentInvestments are reviewed regularly on an individual basis to determine impairment status. The Companyconsiders various factors in the impairment evaluation process, including, but not limited to, the financialcondition of the issuer, specific adverse conditions affecting an industry or region, decline in fair value notrelated to interest rates, bankruptcy or defaults, and delinquency in payments of interest or principal.
Investments are deemed to be impaired when there is objective evidence that timely collection of future cashflows can no longer be reliably estimated. The fair value of an investment is not a definitive indicator ofimpairment, as it may be significantly influenced by other factors including the remaining term to maturity andliquidity of the asset; however, market price is taken into consideration when evaluating impairment.
For impaired mortgages and bonds classified as loans and receivables, provisions are established or write-offs made to adjust the carrying value to the net realizable amount. Wherever possible the fair value of collateralunderlying the loans or observable market price is used to establish net realizable value. For impaired available-for-sale bonds recorded at fair value, the accumulated loss recorded in accumulated other comprehensiveincome is reclassified to net investment income. Impairments on available-for-sale debt instruments arereversed if there is objective evidence that a permanent recovery has occurred. All gains and losses on bondsclassified or designated as fair value through profit or loss are already recorded in net investment income;therefore a reduction due to impairment of these assets will be recorded in net investment income. As well,when determined to be impaired, interest is no longer accrued and previous interest accruals are reversed.
Securities LendingThe Company engages in securities lending through its securities custodians as lending agents. Loanedsecurities are not derecognized, and continue to be reported within invested assets, as the Company retainssubstantial risks and rewards and economic benefits related to the loaned securities.
(b) Transaction Costs
Transaction costs are expensed as incurred for financial instruments classified as fair value through profit orloss. Transaction costs for financial assets classified as available-for-sale or loans and receivables are addedto the value of the instrument at acquisition and taken into net earnings using the effective interest method.Transaction costs for financial liabilities classified as other than fair value through profit or loss are includedin the value of the instrument issued and taken into net earnings using the effective interest method.
(c) Cash and Cash Equivalents
Cash and cash equivalents comprise cash, current operating accounts, overnight bank and term deposits withmaturities of three months or less held for the purpose of meeting short-term cash requirements. Net paymentsin transit and overdraft bank balances are included in other liabilities.
(d) Trading Account Assets
Trading account assets consist of investments in sponsored funds, open ended investment companies andsponsored unit-trusts in Europe, which are carried at fair value based on the net asset value of these funds.Investments in these assets are included in other assets on the Consolidated Balance Sheets with realizedand unrealized gains and losses reported in the Consolidated Statements of Earnings.
2. Basis of Presentation and Summary of Accounting Policies (cont'd)
10

(e) Debentures and Other Debt Instruments and Capital Trust Securities
Debentures and other debt instruments and capital trust securities are initially recorded on the ConsolidatedBalance Sheets at fair value and subsequently carried at amortized cost using the effective interest methodwith amortization expense recorded in financing charges in the Consolidated Statements of Earnings. Theseliabilities are derecognized when the obligation is cancelled or redeemed.
(f) Other Assets and Other Liabilities
Other assets, which include prepaid expenses, deferred acquisition costs and miscellaneous other assets, aremeasured at cost. Other liabilities, which include, deferred income reserves and bank overdraft, are measuredat cost. Pension and other post-employment benefits also included within other assets and other liabilities aremeasured in accordance with note 2(w).
(g) Derivative Financial Instruments
The Company uses derivative products as risk management instruments to hedge or manage asset, liabilityand capital positions, including fee and investment income. The Company’s policy guidelines prohibit the useof derivative instruments for speculative trading purposes.
The Company includes disclosure of the maximum credit risk, future credit exposure, credit risk equivalentand risk weighted equivalent in note 29 as prescribed by the Office of the Superintendent of Financial Institutions(OSFI) in Canada.
All derivatives including those that are embedded in financial and non-financial contracts that are not closelyrelated to the host contracts are recorded at fair value on the Consolidated Balance Sheets. The method ofrecognizing unrealized and realized fair value gains and losses depends on whether the derivatives aredesignated as hedging instruments. For derivatives that are not designated as hedging instruments, unrealizedand realized gains and losses are recorded in net investment income on the Consolidated Statements ofEarnings. For derivatives designated as hedging instruments, unrealized and realized gains and losses arerecognized according to the nature of the hedged item.
Derivatives are valued using market transactions and other market evidence whenever possible, includingmarket based inputs to models, broker or dealer quotations or alternative pricing sources with reasonablelevels of price transparency. When models are used, the selection of a particular model to value a derivativedepends on the contractual terms of, and specific risks inherent in, the instrument, as well as the availabilityof pricing information in the market. The Company generally uses similar models to value similar instruments.Valuation models require a variety of inputs, including contractual terms, market prices and rates, yield curves,credit curves, measures of volatility, prepayment rates and correlations of such inputs.
To qualify for hedge accounting, the relationship between the hedged item and the hedging instrument mustmeet several strict conditions on documentation, probability of occurrence, hedge effectiveness and reliabilityof measurement. If these conditions are not met, the relationship does not qualify for hedge accountingtreatment and both the hedged item and the hedging instrument are reported independently as if there wasno hedging relationship.
Where a hedging relationship exists, the Company documents all relationships between hedging instrumentsand hedged items, as well as its risk management objectives and strategy for undertaking various hedgetransactions. This process includes linking derivatives that are used in hedging transactions to specific assetsand liabilities on the Consolidated Balance Sheets or to specific firm commitments or forecasted transactions.The Company also assesses, both at the hedge’s inception and on an ongoing basis, whether derivatives thatare used in hedging transactions are effective in offsetting changes in fair values or cash flows of hedgeditems. Hedge effectiveness is reviewed quarterly through correlation testing. Hedge accounting is discontinuedwhen the hedging no longer qualifies for hedge accounting.
2. Basis of Presentation and Summary of Accounting Policies (cont'd)
11
Derivatives not designated as hedges for accounting purposesFor derivative investments not designated as accounting hedges, changes in fair value are recorded in netinvestment income.
Fair value hedgesFor fair value hedges, changes in fair value of both the hedging instrument and the hedged risk are recordedin net investment income and consequently any ineffective portion of the hedge is recorded immediately innet investment income.
The Company currently has no instruments designated as fair value hedges.
Cash flow hedgesFor cash flow hedges, the effective portion of the changes in fair value of the hedging instrument is recordedin the same manner as the hedged item in other comprehensive income while the ineffective portion isrecognized immediately in net investment income. Gains and losses that accumulate in other comprehensiveincome are recorded in net investment income in the same period the hedged item affects net earnings. Gainsand losses on cash flow hedges are immediately reclassified from other comprehensive income to netinvestment income if and when it is probable that a forecasted transaction is no longer expected to occur.
The Company currently uses interest rate swaps and cross-currency swaps designated as cash flow hedges.
Net investment hedgesFor net investment hedges the effective portion of changes in the fair value of the hedging instrument arerecorded in other comprehensive income while the ineffective portion is recognized immediately in netinvestment income. The unrealized foreign exchange gains (losses) on the instruments are recorded withinaccumulated other comprehensive income and will be reclassified into net earnings when the Companydisposes of the foreign operation.
The Company currently has instruments designated as net investment hedges.
(h) Embedded Derivatives
An embedded derivative is a component of a host contract that modifies the cash flows of the host contract ina manner similar to a derivative, according to a specified interest rate, financial instrument price, foreignexchange rate, underlying index or other variable. Embedded derivatives are treated as separate contractsand are recorded at fair value if their economic characteristics and risks are not closely related to those of thehost contract and the host contract is not itself recorded at fair value through the Consolidated Statements ofEarnings. Embedded derivatives that meet the definition of an insurance contract are accounted for andmeasured as an insurance contract.
(i) Foreign Currency Translation
The Company operates with multiple functional currencies. The Company’s consolidated financial statementsare presented in Canadian dollars as this presentation is most meaningful to financial statement users. Forthose subsidiaries with different functional currencies, exchange rate differences arising from the translationof monetary items that form part of the net investment in the foreign operation are recorded in unrealizedforeign exchange gains (losses) on translation of foreign operations in other comprehensive income.
For the purpose of presenting consolidated financial statements, assets and liabilities are translated intoCanadian dollars at the rate of exchange prevailing at the balance sheet dates and all income and expenseitems are translated at an average of daily rates. Unrealized foreign currency translation gains and losses ontranslation of the Company’s net investment in its foreign operations are presented separately as a componentof other comprehensive income. Unrealized gains and losses will be recognized proportionately in netinvestment income on the Consolidated Statements of Earnings when there has been a disposal of theinvestment in the foreign operations.
2. Basis of Presentation and Summary of Accounting Policies (cont'd)
12
Foreign currency translation gains and losses on foreign currency transactions of the Company are includedin net investment income.
(j) Loans to Policyholders
Loans to policyholders are classified as loans and receivables and measured at amortized cost. Loans topolicyholders are shown at their unpaid principal balance and are fully secured by the cash surrender valuesof the policies. Carrying value of loans to policyholders approximates their fair value.
(k) Reinsurance Contracts
The Company, in the normal course of business, is a user of reinsurance in order to limit the potential for lossesarising from certain exposures and a provider of reinsurance. Assumed reinsurance refers to the acceptanceof certain insurance risks by the Company underwritten by another company. Ceded reinsurance refers tothe transfer of insurance risk, along with the respective premiums, to one or more reinsurers who will sharethe risks. To the extent that assuming reinsurers are unable to meet their obligations, the Company remainsliable to its policyholders for the portion reinsured. Consequently, allowances are made for reinsurance contractswhich are deemed uncollectible.
Reinsurance contracts are insurance contracts and undergo the classification as described within the Insuranceand Investment Contract Liabilities section of this note. Assumed reinsurance premiums, commissions andclaim settlements, as well as the reinsurance assets associated with insurance and investment contracts, areaccounted for in accordance with the terms and conditions of the underlying reinsurance contract. Reinsuranceassets are reviewed for impairment on a regular basis for any events that may trigger impairment. The Companyconsiders various factors in the impairment evaluation process, including but not limited to, collectability ofamounts due under the terms of the contract. The carrying amount of a reinsurance asset is adjusted throughan allowance account with any impairment loss being recorded in the Consolidated Statements of Earnings.
Any gains or losses on buying reinsurance are recognized in the Consolidated Statements of Earningsimmediately at the date of purchase in accordance with the Canadian Asset Liability Method.
Assets and liabilities related to reinsurance are reported on a gross basis in the Consolidated Balance Sheets.The amount of liabilities ceded to reinsurers is estimated in a manner consistent with the claim liability associatedwith reinsured risks.
(l) Funds Held by Ceding Insurers/Funds Held Under Reinsurance Contracts
On the asset side, funds held by ceding insurers are assets that would normally be paid to the Company butare withheld by the cedant to reduce potential credit risk. Under certain forms of reinsurance contracts it iscustomary for the cedant to retain amounts on a funds withheld basis supporting the insurance or investmentcontract liabilities ceded. For the funds withheld assets where the underlying asset portfolio is managed bythe Company, the credit risk is retained by the Company. The funds withheld balance where the Companyassumes the credit risk is measured at the fair value of the underlying asset portfolio with the change in fairvalue recorded in net investment income. See note 6 for funds held by ceding insurers that are managed bythe Company. Other funds held by ceding insurers are general obligations of the cedant and serve as collateralfor insurance contract liabilities assumed from cedants. Funds withheld assets on these contacts do not havefixed maturity dates, their release generally being dependent on the run-off of the corresponding insurancecontract liabilities.
On the liability side, funds held under reinsurance contracts consist mainly of amounts retained by the Companyfrom ceded business written on a funds withheld basis. The Company withholds assets related to cededinsurance contract liabilities in order to reduce credit risk.
2. Basis of Presentation and Summary of Accounting Policies (cont'd)
13
(m) Business Combinations, Goodwill and Intangible Assets
Business combinations are accounted for using the acquisition method. The Company identifies and classifies,in accordance with the Company’s accounting policies, all assets acquired and liabilities assumed as at theacquisition date. Goodwill represents the excess of purchase consideration over the fair value of net assetsof the acquired subsidiaries of the Company. Following initial recognition, goodwill is measured at cost lessaccumulated impairment losses.
Intangible assets represent finite life and indefinite life intangible assets of acquired subsidiaries of the Companyand software acquired or internally developed by the Company. Finite life intangible assets include the valueof technology/software, certain customer contracts and distribution channels. These finite life intangible assetsare amortized over their estimated useful lives, typically ranging between 3 and 30 years.
Indefinite life intangible assets include brands and trademarks, certain customer contracts and the shareholders'portion of acquired future participating account profits. Amounts are classified as indefinite life intangible assetswhen based on an analysis of all the relevant factors, there is no foreseeable limit to the period over whichthe asset is expected to generate net cash inflows for the Company. The identification of indefinite life intangibleassets is made by reference to relevant factors such as product life cycles, potential obsolescence, industrystability and competitive position. Following initial recognition, indefinite life intangible assets are measuredat cost less accumulated impairment losses.
Impairment TestingGoodwill and indefinite life intangible assets are tested for impairment annually or more frequently if eventsindicate that impairment may have occurred. Intangible assets that were previously impaired are reviewed ateach reporting date for evidence of reversal. In the event that certain conditions have been met, the Companywould be required to reverse the impairment charge or a portion thereof.
Goodwill and indefinite life intangible assets have been allocated to cash generating unit groupings,representing the lowest level that the assets are monitored for internal reporting purposes. Goodwill andindefinite life intangible assets are tested for impairment by comparing the carrying value of each cashgenerating unit grouping containing the assets to its recoverable amount. An impairment loss is recognizedfor the amount by which the asset's carrying amount exceeds its recoverable amount.
The recoverable amount is the higher of the asset’s fair value less costs of disposal and value-in-use.
Finite life intangible assets are reviewed annually to determine if there are indicators of impairment and assesswhether the amortization period and method are appropriate. If indicators of impairment have been identified,a test for impairment is performed and then the amortization of these assets are adjusted or impairment isrecognized as necessary.
(n) Revenue Recognition
Premiums for all types of insurance contracts, and contracts with limited mortality or morbidity risk, are generallyrecognized as revenue when due and collection is reasonably assured.
Interest income on bonds and mortgages is recognized and accrued using the effective yield method.
Dividend income is recognized when the right to receive payment is established. This is the ex-dividend datefor listed stocks, and usually the notification date or date when the shareholders have approved the dividendfor private equity instruments.
Investment property income includes rents earned from tenants under lease agreements and property tax andoperating cost recoveries. Rental income leases with contractual rent increases and rent-free periods arerecognized on a straight-line basis over the term of the lease.
2. Basis of Presentation and Summary of Accounting Policies (cont'd)
14
Fee and other income primarily includes fees earned from management of segregated fund assets, proprietarymutual funds assets, fees earned on administrative services only Group health contracts, commissions andfees earned from management services. Fee and other income is recognized when services are renderedand the amount can be reasonably estimated.
The Company has sub-advisor arrangements where the Company retains the primary obligation with the client;as a result, fee income earned is reported on a gross basis with the corresponding sub-advisor expenserecorded in operating and administrative expenses.
(o) Owner Occupied Properties and Fixed Assets
Property held for own use and fixed assets are carried at cost less accumulated depreciation and impairments.Depreciation is charged to write-off the cost of assets, over their estimated useful lives, using the straight-linemethod, on the following bases:
Owner occupied properties 15 - 20 yearsFurniture and fixtures 5 - 10 yearsOther fixed assets 3 - 10 years
Depreciation methods, useful lives and residual values are reviewed at least annually and adjusted if necessary.
(p) Deferred Acquisition Costs
Included in other assets are deferred acquisition costs. These are recognized as assets if the costs areincremental and incurred due to the contract being issued and are primarily amortized on a straight-line basisover the policy term, not to exceed 20 years.
(q) Segregated Funds
Segregated funds assets and liabilities arise from contracts where all financial risks associated with the relatedassets are borne by policyholders and are presented separately in the Consolidated Balance Sheets. Theassets and liabilities are set equal to the fair value of the underlying asset portfolio. Investment income andchanges in fair value of the segregated fund assets are offset by a corresponding change in the segregatedfund liabilities.
(r) Insurance and Investment Contract Liabilities
Contract ClassificationWhen significant insurance risk exists, the Company’s products are classified at contract inception as insurancecontracts, in accordance with IFRS 4, Insurance Contracts (IFRS 4). Significant insurance risk exists whenthe Company agrees to compensate policyholders or beneficiaries of the contract for specified uncertain futureevents that adversely affect the policyholder and whose amount and timing is unknown. Refer to note 12 fordiscussion of insurance risk.
In the absence of significant insurance risk, the contract is classified as an investment contract or servicecontract. Investment contracts with discretionary participating features are accounted for in accordance withIFRS 4 and investment contracts without discretionary participating features are accounted for in accordancewith IAS 39, Financial Instruments: Recognition & Measurement. The Company has not classified any contractsas investment contracts with discretionary participating features.
Investment contracts may be reclassified as insurance contracts after inception if insurance risk becomessignificant. A contract that is classified as an insurance contract at contract inception remains as such untilall rights and obligations under the contract are extinguished or expire.
Investment contracts are contracts that carry financial risk, which is the risk of a possible future change in oneor more of the following: interest rate, commodity price, foreign exchange rate, or credit rating. Refer to note7 for discussion of Financial Instruments Risk Management.
2. Basis of Presentation and Summary of Accounting Policies (cont'd)
15
MeasurementInsurance contract liabilities represent the amounts required, in addition to future premiums and investmentincome, to provide for future benefit payments, policyholder dividends, commission and policy administrativeexpenses for all insurance and annuity policies in force with the Company. The Appointed Actuaries of theCompany's subsidiary companies are responsible for determining the amount of the liabilities to makeappropriate provisions for the Company's obligations to policyholders. The Appointed Actuaries determine theliabilities for insurance contracts using generally accepted actuarial practices, according to the standardsestablished by the Canadian Institute of Actuaries. The valuation uses the Canadian Asset Liability Method.This method involves the projection of future events in order to determine the amount of assets that must beset aside currently to provide for all future obligations and involves a significant amount of judgment.
In the computation of insurance contract liabilities, valuation assumptions have been made regarding rates ofmortality/morbidity, investment returns, levels of operating expenses, rates of policy termination and rates ofutilization of elective policy options or provisions. The valuation assumptions use best estimates of futureexperience together with a margin for adverse deviation. These margins are necessary to provide forpossibilities of mis-estimation and/for future deterioration in the best estimate assumptions and providereasonable assurance that insurance contract liabilities cover a range of possible outcomes. Margins arereviewed periodically for continued appropriateness.
Investment contract liabilities are measured at fair value determined using discounted cash flows utilizing theyield curves of financial instruments with similar cash flow characteristics.
(s) Deferred Income Reserves
Included in other liabilities are deferred income reserves relating to investment contracts. These are amortizedon a straight-line basis to recognize the initial policy fees over the policy term, not to exceed 20 years.
(t) Income Taxes
The income tax expense for the period represents the sum of current income tax and deferred income tax.Income tax is recognized as an expense or income in profit or loss except to the extent that it relates to itemsthat are recognized outside profit or loss (whether in other comprehensive income or directly in equity), inwhich case the income tax is also recognized outside profit or loss.
Current Income TaxCurrent income tax is based on taxable income for the year. Current income tax liabilities (assets) for thecurrent and prior periods are measured at the amount expected to be paid to (recovered from) the taxationauthorities using the tax rates that have been enacted or substantively enacted at the balance sheet date ineach respective jurisdiction. Current income tax assets and current income tax liabilities are offset if a legallyenforceable right exists to offset the recognized amounts and the entity intends either to settle on a net basis,or to realize the assets and settle the liabilities simultaneously.
A provision for tax uncertainties which meet the probable threshold for recognition is measured based on theprobability weighted average approach.
Deferred Income TaxDeferred income tax is the tax expected to be payable or recoverable on differences arising between thecarrying amounts of assets and liabilities in the financial statements and the corresponding tax bases used inthe computation of taxable income and is accounted for using the balance sheet liability method. Deferredincome tax liabilities are generally recognized for all taxable temporary differences and deferred income taxassets are recognized to the extent that it is probable that taxable profits will be available against whichdeductible temporary differences, unused tax losses and carryforwards can be utilized.
2. Basis of Presentation and Summary of Accounting Policies (cont'd)
16
Recognition is based on the fact that it is probable that the entity will have taxable profits and/or tax planningopportunities available to allow the deferred income tax asset to be utilized. Changes in circumstances infuture periods may adversely impact the assessment of the recoverability. The uncertainty of the recoverabilityis taken into account in establishing the deferred income tax assets. The Company's annual financial planningprocess provides a significant basis for the measurement of deferred income tax assets.
Deferred income tax assets and liabilities are measured at the tax rates expected to apply in the year whenthe asset is realized or the liability is settled, based on tax rates (and tax laws) that have been enacted orsubstantively enacted at the balance sheet date. Deferred income tax assets and deferred income tax liabilitiesare offset if a legally enforceable right exists to net current income tax assets against current income taxliabilities and the deferred income taxes relate to the same taxable entity and the same taxation authority.
The carrying amount of deferred income tax assets is reviewed at each balance sheet date and reduced tothe extent that it is no longer probable that sufficient taxable profit will be available to allow all or part of thedeferred income tax asset to be utilized. Unrecognized deferred income tax assets are reassessed at eachbalance sheet date and are recognized to the extent that it has become probable that future taxable profit willallow the deferred income tax asset to be recovered.
Deferred income tax liabilities are recognized for taxable temporary differences arising on investments insubsidiaries and associates, except where the group controls the timing of the reversal of the temporarydifference and it is probable that the temporary differences will not reverse in the foreseeable future.
(u) Policyholder Benefits
Policyholder benefits include benefits and claims on life insurance contracts, maturity payments, annuitypayments and surrenders. Gross benefits and claims for life insurance contracts include the cost of all claimsarising during the year and settlement of claims. Death claims and surrenders are recorded on the basis ofnotifications received. Maturities and annuity payments are recorded when due.
(v) Repurchase Agreements
The Company accounts for certain forward settling to be announced "TBA" security transactions as derivativesas the Company does not regularly accept delivery of such securities when issued.
(w) Pension Plans and Other Post-Employment Benefits
The Company’s subsidiaries maintain contributory and non-contributory defined benefit pension plans forcertain employees and advisors. The Company’s subsidiaries also provide post-employment health, dentaland life insurance benefits to eligible employees, advisors and their dependents.
The present value of the defined benefit obligations and the related current service cost is determined usingthe projected unit credit method (note 23). Pension plan assets are recorded at fair value.
For the defined benefit plans of the Company’s subsidiaries, service costs and net interest costs are recognizedin the Consolidated Statements of Earnings. Service costs include current service cost, administrationexpenses, past service costs and the impact of curtailments and settlements. To determine the net interestcosts (income) recognized in the Consolidated Statements of Earnings, the Company's subsidiaries apply adiscount rate to the net benefit liability (asset), where the discount rate is determined by reference to marketyields at the beginning of the year on high quality corporate bonds.
For the defined benefit plans of the Company’s subsidiaries, re-measurements of the net defined benefit liability(asset) due to asset returns less (greater) than interest income, actuarial losses (gains) and changes in theasset ceiling are recognized in the Consolidated Statements of Comprehensive Income.
The Company’s subsidiaries also maintain defined contribution pension plans for certain employees andadvisors. For the defined contribution plans of the Company’s subsidiaries, the current service costs arerecognized in the Consolidated Statements of Earnings.
2. Basis of Presentation and Summary of Accounting Policies (cont'd)
17
(x) Share Capital and Surplus
Financial instruments issued by the Company are classified as share capital if they represent a residual interestin the assets of the Company. Preferred share capital is classified as equity if it is non-redeemable, or retractableonly at the Company’s option and any dividends are discretionary. Incremental costs that are directly attributableto the issue of share capital are recognized as a deduction from equity, net of income tax.
Contributed surplus represents the vesting expense on unexercised equity instruments under share-basedpayment plans.
Accumulated other comprehensive income (loss) represents the total of the unrealized foreign exchange gains(losses) on translation of foreign operations, the unrealized foreign exchange gains (losses) on euro debtdesignated as a hedge of the net investment of foreign operations, the unrealized gains (losses) on available-for-sale assets, the unrealized gains (losses) on cash flow hedges, and the remeasurements on defined benefitpension and other post-employment benefit plans net of tax, where applicable.
Non-controlling interests in subsidiaries represents the proportion of equity that is attributable to minorityshareholders.
Participating account surplus in subsidiaries represents the proportion of equity attributable to the participatingaccount of the Company's subsidiaries.
(y) Share-Based Payments
The Company provides share-based compensation to certain employees and Directors of the Company andits subsidiaries.
The Company follows the fair value based method of accounting for the valuation of compensation expensefor shares and share options granted to employees under its stock option plans (note 22). This share-basedpayment expense is recognized in operating and administrative expenses in the Consolidated Statements ofEarnings and as an increase to contributed surplus over the vesting period of the granted options. Whenoptions are exercised, the proceeds received, along with the amount in contributed surplus, are transferred toshare capital.
The Company and certain of its affiliates have established Deferred Share Unit Plans (DSU Plans) in whichDirectors of the Company participate. Units issued under the DSU Plans vest when granted. The Companyrecognizes an increase in operating and administrative expenses for the units granted under the DSU Plans.The Company recognizes a liability for units granted under the DSU Plans which is re-measured at eachreporting period based on the market value of the Company’s common shares.
Certain employees of the Company are entitled to participate in the Performance Share Unit Plan (PSU Plan).Units issued under the Performance Share Unit Plan vest over a three year period. The Company uses thefair value method to recognize compensation expense for the units granted under the plan over the vestingperiod with a corresponding increase in the liability based on the market value of the Company’s commonshares.
The Company has an Employee Share Ownership Program (ESOP) where, subject to certain conditions beingmet, the Company will match contributions up to a maximum amount. The Company’s contributions areexpensed within operating and administrative expenses as incurred.
(z) Earnings Per Common Share
Earnings per common share is calculated using net earnings after preferred share dividends and the weightedaverage number of common shares outstanding. Diluted earnings per share is calculated by adjusting commonshareholders' net earnings and the weighted average number of common shares outstanding for the effectsof all potential dilutive common shares assuming that all convertible instruments are converted and outstandingoptions are exercised.
2. Basis of Presentation and Summary of Accounting Policies (cont'd)
18
(aa) Leases
Leases that do not transfer substantially all the risks and rewards of ownership are classified as operatingleases. Payments made under operating leases, where the Company is the lessee, are charged to net earningsover the period of use.
Where the Company is the lessor under an operating lease for its investment property, the assets subject tothe lease arrangement are presented within the Consolidated Balance Sheets. Income from these leases isrecognized in the Consolidated Statements of Earnings on a straight-line basis over the lease term.
Investments in a lease that transfers substantially all the risks and rewards of ownership to the lessee areclassified as a finance lease. The Company is the lessor under a finance lease and the investment is recognizedas a receivable at an amount equal to the net investment in the lease, which is represented as the presentvalue of the minimum lease payments due from the lessee and is presented within the Consolidated BalanceSheets. Payments received from the lessee are apportioned between the recognition of finance lease incomeand the reduction of the finance lease receivable. Income from the finance leases is recognized in theConsolidated Statements of Earnings at a constant periodic rate of return on the Company’s net investmentin the finance lease.
(ab) Operating Segments
Operating segments have been identified based on internal reports that are regularly reviewed by theCompany’s Chief Executive Officer to allocate resources and assess performance of segments. TheCompany’s reportable operating segments are categorized by geographic region and include Canada, theUnited States and Europe. The Canada segment comprises the Individual Insurance, Wealth Managementand Group Insurance business units. Great-West Financial and Putnam are reported in the United Statessegment. The Europe segment comprises Insurance & Annuities and Reinsurance. The Lifeco Corporatesegment represents activities and transactions that are not directly attributable to the measurement of theoperating segments of the Company.
(ac) Future Accounting Policies
IFRS that have been issued by the IASB and could impact the Company are as follows:
New Standard Summary of Future ChangesIFRS 4 - Insurance Contracts In September 2016, the IASB issued an amendment to IFRS 4, Insurance
Contracts (IFRS 4). The amendment “Applying IFRS 9, FinancialInstruments with IFRS 4, Insurance Contracts” provides qualifyinginsurance companies with two options to address the potential volatilityassociated with implementing the IFRS 9, Financial Instruments (IFRS 9)standard before the new proposed insurance contract standard is effective.The two options are as follows:
• Deferral Approach - provides the option to defer implementation ofIFRS 9 until the year 2021 or the effective date of the new insurancecontract standard, whichever is earlier; or
• Overlay Approach - provides the option to recognize the volatilitythat could arise when IFRS 9 is applied within other comprehensiveincome, rather than profit or loss.
The Company qualifies for the amendment and will be applying the deferralapproach to allow adoption of both IFRS 9 and the new insurance contractstandard simultaneously on January 1, 2021.
2. Basis of Presentation and Summary of Accounting Policies (cont'd)
19
New Standard Summary of Future ChangesIFRS 9 - Financial Instruments In July 2014, the IASB issued a final version of IFRS 9, Financial
Instruments to replace IAS 39, Financial Instruments: Recognition andMeasurement. The standard provides changes to financial instrumentsaccounting for the following:
• classification and measurement of financial instruments based ona business model approach for managing financial assets and thecontractual cash flow characteristics of the financial asset;
• impairment based on an expected loss model; and • hedge accounting that incorporates the risk management practices
of an entity.
Due to applying the deferral method as noted above, the standard will beeffective for the Company on January 1, 2021.
IFRS 15 - Revenue fromContracts with Customers
In May 2014, the IASB issued IFRS 15, Revenue from Contracts withCustomers, which provides a single revenue recognition standard to alignthe financial reporting of revenue from contracts with customers andrelated costs. The revenue arising from insurance contracts, leases andfinancial instruments are not required to apply the revenue recognitionrequirements in IFRS 15. A company would recognize revenue when ittransfers goods or services to a customer in the amount of considerationthe company expects to receive from the customer.
In September 2015, the IASB issued an amendment to IFRS 15 providinga deferral of one year of the effective date of the standard, from January1, 2017 to January 1, 2018.
In April 2016, an additional amendment to IFRS 15 was issued clarifyingrequirements of the standard and providing additional transitional relief forcompanies implementing the standard.
The Company is evaluating the impact of the adoption of this standard.The Company does not anticipate a significant impact for the adoption ofthis standard, however it is not yet possible to provide a reliable estimateof the impact on the Company's financial statements.
IFRS 16 - Leases In January 2016, the IASB issued IFRS 16, Leases, which introduces newguidance for identifying leases as well as a new right-of-use accountingmodel for lessees, replacing the operating and finance lease accountingmodels that currently exist. The new accounting model will generallyrequire all lessees to recognize lease assets and liabilities on the balancesheet, initially measured at the present value of unavoidable leasepayments for all leases with a maximum possible term of more than 12months.
In contrast to the significant changes for lessees, the new standard willretain many key aspects of the current lessor accounting model.
The standard is effective January 1, 2019. The Company is evaluating theimpact of the adoption of this standard, however it is not yet possible toprovide a reliable estimate of the impact on the Company's financialstatements.
2. Basis of Presentation and Summary of Accounting Policies (cont'd)
20
New Standard Summary of Future ChangesAnnual Improvements 2014 -2016 Cycle
In December 2016, the IASB issued Annual Improvements 2014 - 2016Cycle as part of its ongoing process to efficiently deal with non-urgentnarrow scope amendments to IFRS. Three amendments were included inthis issue relating to IFRS 12, Disclosure if Interests in Other Entities, IFRS1, First-time Adoption of International Financial Reporting Standards andIAS 28 Investments in Associates and Joint Ventures.
The amendments to IFRS 12 are effective January 1, 2017, while theamendments to IFRS 1 and IAS 28 are effective January 1, 2018. Adoptionof these amendments will not have an impact on the Company'sconsolidated financial statements.
IAS 40 - Investment Property In December 2016, the IASB issued an amendment to IAS 40, InvestmentProperty to clarify the requirements on transfers to, or from, investmentproperty.
The amendment is effective January 1, 2018. The Company is evaluatingthe impact of the adoption of this standard.
IAS 7 - Statement of Cash Flows In January 2016, the IASB issued an amendment to IAS 7, Statement ofCash Flows that requires additional disclosures to enable users of thefinancial statements to evaluate changes in liabilities arising from financingactivities.
The amendment is effective January 1, 2017. Adoption of this amendmentwill not have a significant impact on the Company's consolidated financialstatements.
IFRS 2 - Share-based Payment In June 2016, the IASB issued narrow scope amendments to IFRS 2,Share-based Payment clarifying how to account for certain types of share-based payment transactions.
The amendment is effective January 1, 2018. The Company is evaluatingthe impact of the adoption of this amendment.
IAS 12 - Income Taxes In January 2016, the IASB issued an amendment to IAS 12, Income Taxesthat clarifies the accounting for deferred tax assets for unrealized losseson debt instruments measured at fair value.
The amendment is effective January 1, 2017. Adoption of this amendmentwill not have an impact on the Company's consolidated financialstatements.
IFRIC 22 - Foreign CurrencyTransactions and AdvanceConsideration
In December 2016, the IASB issued IFRIC Interpretation 22, ForeignCurrency Transactions and Advance Consideration that providesrequirements about which exchange rate to use in reporting foreigncurrency transactions when payment is made or received in advance.
The interpretation is effective January 1, 2018. The Company is evaluatingthe impact of the adoption of this interpretation.
2. Basis of Presentation and Summary of Accounting Policies (cont'd)
21
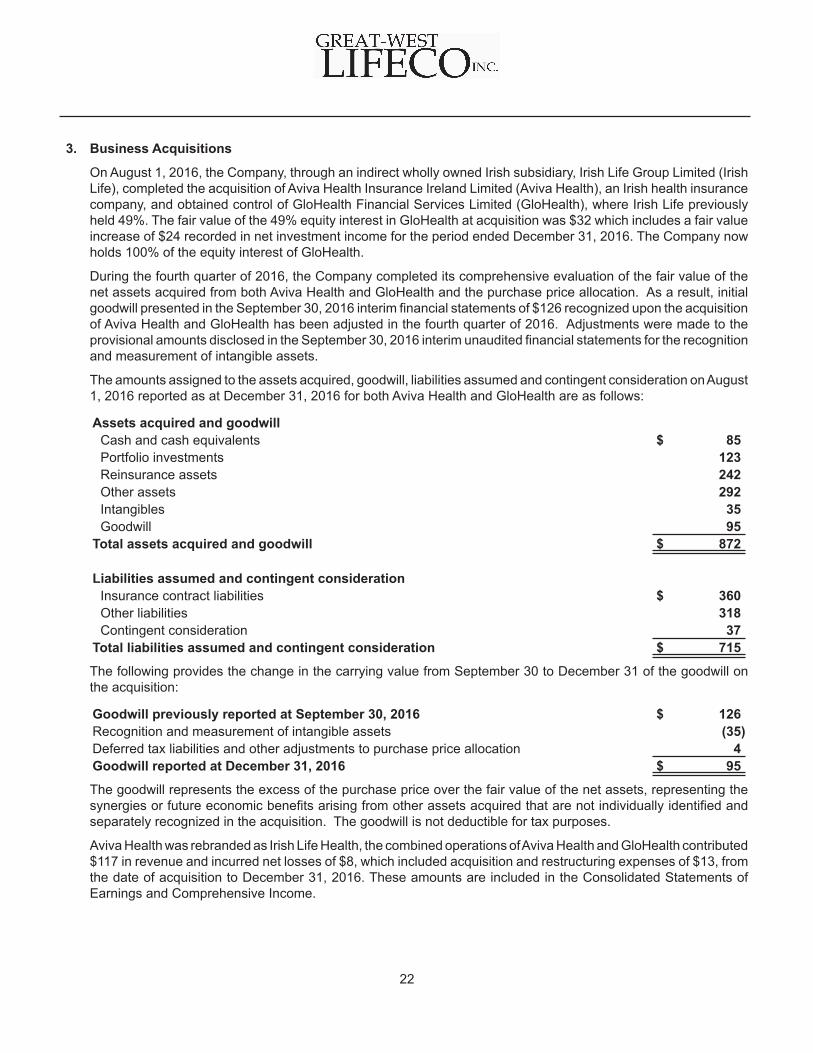
3. Business Acquisitions
On August 1, 2016, the Company, through an indirect wholly owned Irish subsidiary, Irish Life Group Limited (IrishLife), completed the acquisition of Aviva Health Insurance Ireland Limited (Aviva Health), an Irish health insurancecompany, and obtained control of GloHealth Financial Services Limited (GloHealth), where Irish Life previouslyheld 49%. The fair value of the 49% equity interest in GloHealth at acquisition was $32 which includes a fair valueincrease of $24 recorded in net investment income for the period ended December 31, 2016. The Company nowholds 100% of the equity interest of GloHealth.
During the fourth quarter of 2016, the Company completed its comprehensive evaluation of the fair value of thenet assets acquired from both Aviva Health and GloHealth and the purchase price allocation. As a result, initialgoodwill presented in the September 30, 2016 interim financial statements of $126 recognized upon the acquisitionof Aviva Health and GloHealth has been adjusted in the fourth quarter of 2016. Adjustments were made to theprovisional amounts disclosed in the September 30, 2016 interim unaudited financial statements for the recognitionand measurement of intangible assets.
The amounts assigned to the assets acquired, goodwill, liabilities assumed and contingent consideration on August1, 2016 reported as at December 31, 2016 for both Aviva Health and GloHealth are as follows:
Assets acquired and goodwillCash and cash equivalents $ 85Portfolio investments 123Reinsurance assets 242Other assets 292Intangibles 35Goodwill 95
Total assets acquired and goodwill $ 872
Liabilities assumed and contingent considerationInsurance contract liabilities $ 360Other liabilities 318Contingent consideration 37
Total liabilities assumed and contingent consideration $ 715
The following provides the change in the carrying value from September 30 to December 31 of the goodwill onthe acquisition:
Goodwill previously reported at September 30, 2016 $ 126Recognition and measurement of intangible assets (35)Deferred tax liabilities and other adjustments to purchase price allocation 4Goodwill reported at December 31, 2016 $ 95
The goodwill represents the excess of the purchase price over the fair value of the net assets, representing thesynergies or future economic benefits arising from other assets acquired that are not individually identified andseparately recognized in the acquisition. The goodwill is not deductible for tax purposes.
Aviva Health was rebranded as Irish Life Health, the combined operations of Aviva Health and GloHealth contributed$117 in revenue and incurred net losses of $8, which included acquisition and restructuring expenses of $13, fromthe date of acquisition to December 31, 2016. These amounts are included in the Consolidated Statements ofEarnings and Comprehensive Income.
22
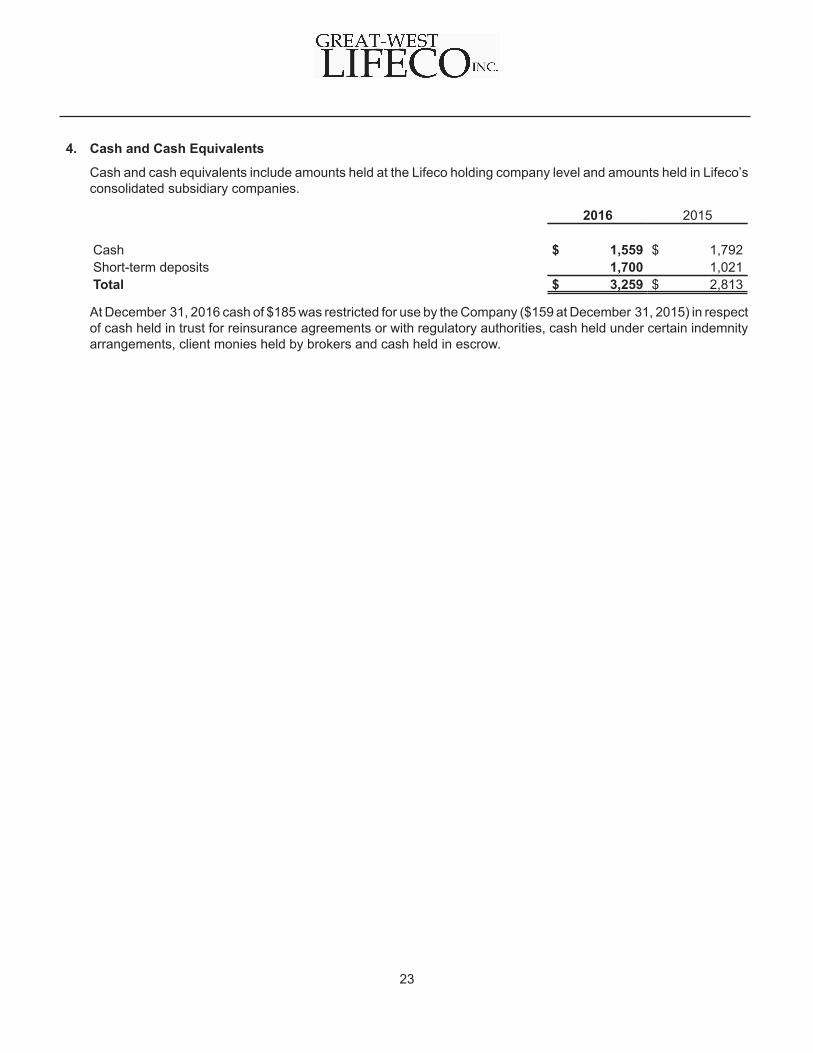
4. Cash and Cash Equivalents
Cash and cash equivalents include amounts held at the Lifeco holding company level and amounts held in Lifeco’sconsolidated subsidiary companies.
2016 2015
Cash $ 1,559 $ 1,792Short-term deposits 1,700 1,021Total $ 3,259 $ 2,813
At December 31, 2016 cash of $185 was restricted for use by the Company ($159 at December 31, 2015) in respectof cash held in trust for reinsurance agreements or with regulatory authorities, cash held under certain indemnityarrangements, client monies held by brokers and cash held in escrow.
23

5. Portfolio Investments
(a) Carrying values and estimated fair values of portfolio investments are as follows:
2016 2015Carrying
valueFair
valueCarrying
valueFair
value
BondsDesignated fair value through profit or loss (1) $ 85,739 $ 85,739 $ 83,688 $ 83,688Classified fair value through profit or loss (1) 2,586 2,586 2,815 2,815Available-for-sale 11,478 11,478 11,535 11,535Loans and receivables 16,970 18,484 16,905 18,253
116,773 118,287 114,943 116,291Mortgage loans
Residential 8,062 8,260 7,783 8,148Commercial 13,589 14,290 14,238 15,298
21,651 22,550 22,021 23,446Stocks
Designated fair value through profit or loss (1) 7,606 7,606 6,647 6,647Available-for-sale 48 48 57 57Available-for-sale, at cost (2) 391 391 534 534Equity method 620 610 635 601
8,665 8,655 7,873 7,839Investment properties 4,340 4,340 5,237 5,237Total $ 151,429 $ 153,832 $ 150,074 $ 152,813
(1) A financial asset is designated as fair value through profit or loss on initial recognition if it eliminates orsignificantly reduces an accounting mismatch. Changes in the fair value of financial assets designated asfair value through profit or loss are generally offset by changes in insurance contract liabilities, since themeasurement of insurance contract liabilities is determined with reference to the assets supporting theliabilities.
A financial asset is classified as fair value through profit or loss on initial recognition if it is part of a portfoliothat is actively traded for the purpose of earning investment income.
(2) Fair value cannot be reliably measured, therefore the investments are held at cost.
24
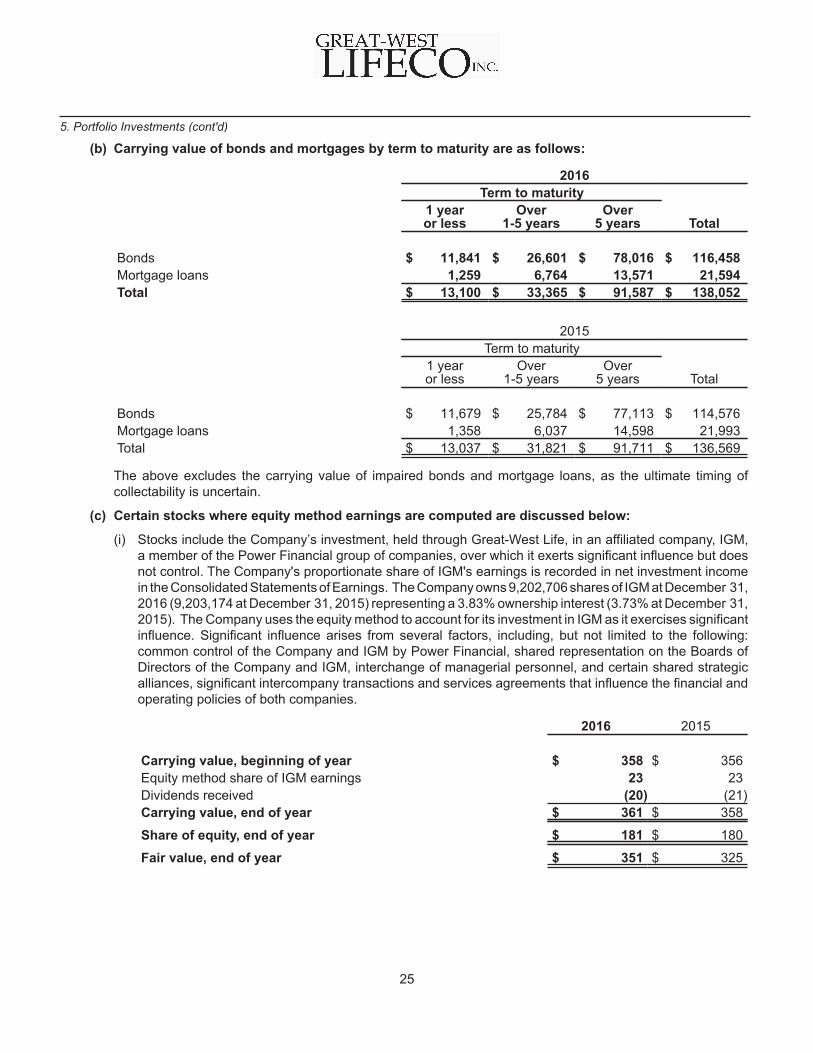
(b) Carrying value of bonds and mortgages by term to maturity are as follows:
2016Term to maturity
1 yearor less
Over1-5 years
Over5 years Total
Bonds $ 11,841 $ 26,601 $ 78,016 $ 116,458Mortgage loans 1,259 6,764 13,571 21,594Total $ 13,100 $ 33,365 $ 91,587 $ 138,052
2015Term to maturity
1 yearor less
Over1-5 years
Over5 years Total
Bonds $ 11,679 $ 25,784 $ 77,113 $ 114,576Mortgage loans 1,358 6,037 14,598 21,993Total $ 13,037 $ 31,821 $ 91,711 $ 136,569
The above excludes the carrying value of impaired bonds and mortgage loans, as the ultimate timing ofcollectability is uncertain.
(c) Certain stocks where equity method earnings are computed are discussed below:
(i) Stocks include the Company’s investment, held through Great-West Life, in an affiliated company, IGM,a member of the Power Financial group of companies, over which it exerts significant influence but doesnot control. The Company's proportionate share of IGM's earnings is recorded in net investment incomein the Consolidated Statements of Earnings. The Company owns 9,202,706 shares of IGM at December 31,2016 (9,203,174 at December 31, 2015) representing a 3.83% ownership interest (3.73% at December 31,2015). The Company uses the equity method to account for its investment in IGM as it exercises significantinfluence. Significant influence arises from several factors, including, but not limited to the following:common control of the Company and IGM by Power Financial, shared representation on the Boards ofDirectors of the Company and IGM, interchange of managerial personnel, and certain shared strategicalliances, significant intercompany transactions and services agreements that influence the financial andoperating policies of both companies.
2016 2015
Carrying value, beginning of year $ 358 $ 356Equity method share of IGM earnings 23 23Dividends received (20) (21)Carrying value, end of year $ 361 $ 358
Share of equity, end of year $ 181 $ 180
Fair value, end of year $ 351 $ 325
5. Portfolio Investments (cont'd)
25
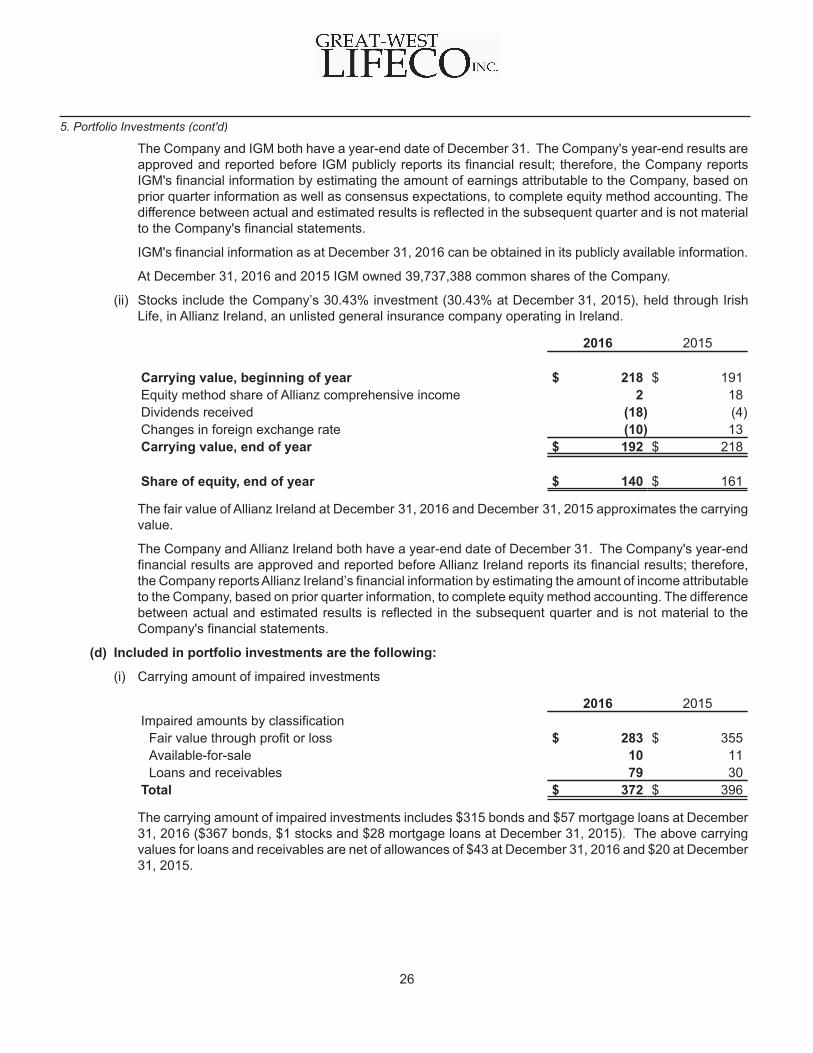
The Company and IGM both have a year-end date of December 31. The Company's year-end results areapproved and reported before IGM publicly reports its financial result; therefore, the Company reportsIGM's financial information by estimating the amount of earnings attributable to the Company, based onprior quarter information as well as consensus expectations, to complete equity method accounting. Thedifference between actual and estimated results is reflected in the subsequent quarter and is not materialto the Company's financial statements.
IGM's financial information as at December 31, 2016 can be obtained in its publicly available information.
At December 31, 2016 and 2015 IGM owned 39,737,388 common shares of the Company.
(ii) Stocks include the Company’s 30.43% investment (30.43% at December 31, 2015), held through IrishLife, in Allianz Ireland, an unlisted general insurance company operating in Ireland.
2016 2015
Carrying value, beginning of year $ 218 $ 191Equity method share of Allianz comprehensive income 2 18Dividends received (18) (4)Changes in foreign exchange rate (10) 13Carrying value, end of year $ 192 $ 218
Share of equity, end of year $ 140 $ 161
The fair value of Allianz Ireland at December 31, 2016 and December 31, 2015 approximates the carryingvalue.
The Company and Allianz Ireland both have a year-end date of December 31. The Company's year-endfinancial results are approved and reported before Allianz Ireland reports its financial results; therefore,the Company reports Allianz Ireland’s financial information by estimating the amount of income attributableto the Company, based on prior quarter information, to complete equity method accounting. The differencebetween actual and estimated results is reflected in the subsequent quarter and is not material to theCompany's financial statements.
(d) Included in portfolio investments are the following:
(i) Carrying amount of impaired investments
2016 2015Impaired amounts by classification
Fair value through profit or loss $ 283 $ 355Available-for-sale 10 11Loans and receivables 79 30
Total $ 372 $ 396
The carrying amount of impaired investments includes $315 bonds and $57 mortgage loans at December31, 2016 ($367 bonds, $1 stocks and $28 mortgage loans at December 31, 2015). The above carryingvalues for loans and receivables are net of allowances of $43 at December 31, 2016 and $20 at December31, 2015.
5. Portfolio Investments (cont'd)
26
(ii) The allowance for credit losses and changes in the allowance for credit losses related to investmentsclassified as loans and receivables are as follows:
2016 2015
BondsMortgage
loans Total BondsMortgage
loans Total
Balance, beginningof year $ — $ 20 $ 20 $ — $ 18 $ 18
Net provision forcredit losses - inyear 7 28 35 — — —
Write-offs, net ofrecoveries — (6) (6) — — —
Other (includingforeign exchangerate changes) — (6) (6) — 2 2
Balance, end ofyear $ 7 $ 36 $ 43 $ — $ 20 $ 20
The allowance for credit losses is supplemented by the provision for future credit losses included ininsurance contract liabilities.
(e) Net investment income comprises the following:
2016
BondsMortgage
loans StocksInvestmentproperties Other Total
Regular net investment income:Investment income earned $ 4,230 $ 921 $ 266 $ 325 $ 571 $ 6,313Net realized gains
Available-for-sale 80 — 4 — — 84Other classifications 30 51 — — — 81
Net allowances for credit losseson loans and receivables (7) (28) — — — (35)
Other income and expenses — — — (84) (107) (191)4,333 944 270 241 464 6,252
Changes in fair value on fair valuethrough profit or loss assets:Designated fair value through
profit or loss 3,182 — 957 — (297) 3,842Recorded at fair value through
profit or loss — — — 61 — 613,182 — 957 61 (297) 3,903
Total $ 7,515 $ 944 $ 1,227 $ 302 $ 167 $ 10,155
5. Portfolio Investments (cont'd)
27
2015
BondsMortgage
loans StocksInvestmentproperties Other Total
Regular net investment income:Investment income earned $ 4,252 $ 965 $ 279 $ 356 $ 416 $ 6,268Net realized gains
Available-for-sale 104 — 2 — — 106Other classifications 10 97 — — — 107
Other income and expenses — — — (100) (110) (210)4,366 1,062 281 256 306 6,271
Changes in fair value on fair valuethrough profit or loss assets:Classified fair value through
profit or loss 13 — — — — 13Designated fair value through
profit or loss (2,000) — (409) — 137 (2,272)Recorded at fair value through
profit or loss — — — 249 — 249(1,987) — (409) 249 137 (2,010)
Total $ 2,379 $ 1,062 $ (128) $ 505 $ 443 $ 4,261
Investment income earned comprises income from investments that are classified as available-for-sale, loansand receivables and investments classified or designated as fair value through profit or loss. Investmentincome from bonds and mortgages includes interest income and premium and discount amortization. Incomefrom stocks includes dividends, distributions from private equity and equity income from the investment in IGMand Allianz Ireland. Investment properties income includes rental income earned on investment properties,ground rent income earned on leased and sub-leased land, fee recoveries, lease cancellation income, andinterest and other investment income earned on investment properties. Other income includes policyholderloan income, foreign exchange gains and losses, income earned from derivative financial instruments andother miscellaneous income.
(f) The carrying value of investment properties and changes in the carrying value of investment propertiesare as follows:
2016 2015
Balance, beginning of year $ 5,237 $ 4,613Additions 102 278Change in fair value through profit or loss 61 249Disposals (427) (282)Foreign exchange rate changes (633) 379Balance, end of year $ 4,340 $ 5,237
5. Portfolio Investments (cont'd)
28
(g) Transferred Financial Assets
The Company engages in securities lending to generate additional income. The Company’s securitiescustodians are used as lending agents. Collateral, which exceeds the fair value of the loaned securities, isdeposited by the borrower with the Company's lending agent and maintained by the lending agent until theunderlying security has been returned. The fair value of the loaned securities is monitored on a daily basis bythe lending agent who obtains or refunds additional collateral as the fair value of the loaned securities fluctuates.There was no cash collateral included in the collateral deposited with the Company's lending agent as ofDecember 31, 2016 and December 31, 2015. In addition, the securities lending agent indemnifies the Companyagainst borrower risk, meaning that the lending agent agrees contractually to replace securities not returneddue to a borrower default. As at December 31, 2016, the Company had loaned securities (which are includedin invested assets) with a fair value of $7,520 ($6,593 at December 31, 2015).
5. Portfolio Investments (cont'd)
29
6. Funds Held by Ceding Insurers
At December 31, 2016, the Company had amounts on deposit of $10,781 ($15,512 at December 31, 2015) forfunds held by ceding insurers on the Consolidated Balance Sheets. Income and expenses arising from theagreements are included in net investment income on the Consolidated Statements of Earnings.
During 2016, the Company completed the transfer of approximately $1,600 of annuity policies from The EquitableLife Assurance Company (Equitable Life) acquired during 2015. As a result, the related assets presented as FundsHeld by Ceding Insurers at December 31, 2015 are recorded in Portfolio Investments at December 31, 2016.
During 2016, a subsidiary of the Company completed a portfolio transfer of approximately $1,300 wherebyinvestment contract liabilities and supporting bonds and cash were acquired. The portfolio of investment contractliabilities had been previously reinsured by the Company on a funds withheld basis. As a result, the related assetspresented in Funds Held by Ceding Insurers at December 31, 2015 are recorded in Portfolio Investments atDecember 31, 2016.
The details of the funds on deposit for certain agreements where the Company has credit risk are as follows:
(a) Carrying values and estimated fair values:
2016 2015Carrying
valueFair
valueCarrying
valueFair
value
Cash and cash equivalents $ 214 $ 214 $ 180 $ 180Bonds 8,391 8,391 13,472 13,472Other assets 118 118 178 178Total $ 8,723 $ 8,723 $ 13,830 $ 13,830
Supporting:Reinsurance liabilities $ 8,218 $ 8,218 $ 13,222 $ 13,222Surplus 505 505 608 608Total $ 8,723 $ 8,723 $ 13,830 $ 13,830
(b) The following provides details of the carrying value of bonds included in the funds on deposit by issuerand industry sector:
2016 2015Bonds issued or guaranteed by:
Treasuries $ 1,143 $ 2,357Government related 1,506 2,153Agency securitized 3 20Non-agency securitized 1,126 1,580Financials 1,764 2,679Communications 132 205Consumer products 692 1,248Energy 276 557Industrials 252 435Technology 72 243Transportation 164 233Utilities 1,228 1,738Total long-term bonds 8,358 13,448Short-term bonds 33 24
Total $ 8,391 $ 13,472
(c) Asset quality
Bond Portfolio By Credit Rating2016 2015
AAA $ 618 $ 3,697AA 3,792 3,405A 3,300 5,186BBB 476 798BB and lower 205 386Total $ 8,391 $ 13,472
6. Funds Held by Ceding Insurers (cont'd)
30

7. Financial Instruments Risk Management
The Company has policies relating to the identification, measurement, management, monitoring and reporting ofrisks associated with financial instruments. The key risks related to financial instruments are credit risk, liquidityrisk and market risk (currency, interest rate and equity). The Risk Committee of the Board of Directors is responsiblefor the oversight of the Company's key risks.
The following sections describe how the Company manages each of these risks.
(a) Credit Risk
Credit risk is the risk of loss resulting from an obligor's potential inability or unwillingness to fully meet itscontractual obligations to the Company.
The following policies and procedures are in place to manage this risk:
• Investment policies are in place that require only the purchase of investment-grade assets and minimizeundue concentration within issuers, connected companies, industries or individual geographies.
• Investment limits specify minimum and maximum limits for each asset class. • Identification of credit risk through an internal credit risk rating system which includes a detailed assessment
of an obligor's creditworthiness. Internal credit risk ratings cannot be higher than the highest rating providedby certain independent ratings companies.
• Portfolios are monitored continuously, and reviewed regularly with the Risk Committee and the InvestmentCommittee of the Board of Directors.
• Credit risk associated with derivative instruments is evaluated quarterly based on conditions that existedat the balance sheet date, using practices that are at least as conservative as those recommended byregulators. The Company seeks to mitigate derivative credit risk by setting rating based counterparty limitsin investment policies and through collateral arrangements where possible.
• Counterparties providing reinsurance to the Company are reviewed for financial soundness as part of anongoing monitoring process. The minimum financial strength of reinsurers is outlined in the CorporateReinsurance Ceded Risk Management Policy. The Company seeks to minimize reinsurance credit riskby setting rating based limits on net ceded exposure by counterparty as well as seeking protection in theform of collateral or funds withheld arrangements where possible.
• Investment guidelines also specify collateral requirements.
31
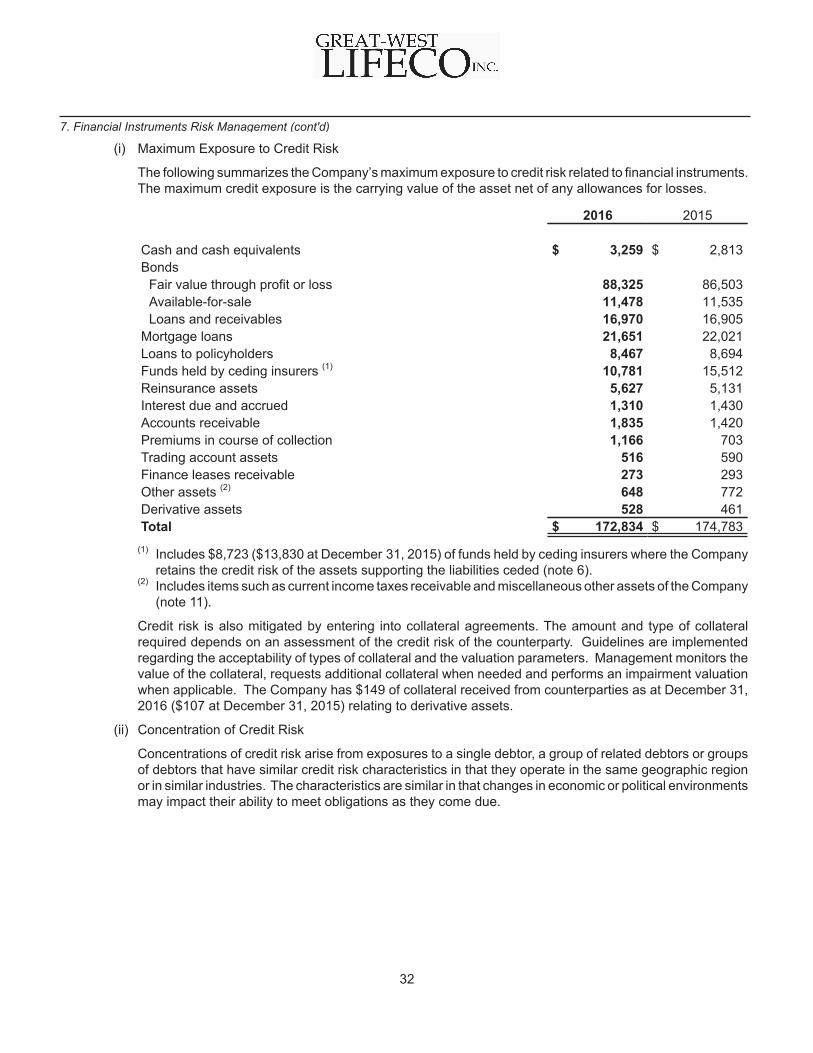
(i) Maximum Exposure to Credit Risk
The following summarizes the Company’s maximum exposure to credit risk related to financial instruments.The maximum credit exposure is the carrying value of the asset net of any allowances for losses.
2016 2015
Cash and cash equivalents $ 3,259 $ 2,813Bonds
Fair value through profit or loss 88,325 86,503Available-for-sale 11,478 11,535Loans and receivables 16,970 16,905
Mortgage loans 21,651 22,021Loans to policyholders 8,467 8,694Funds held by ceding insurers (1) 10,781 15,512Reinsurance assets 5,627 5,131Interest due and accrued 1,310 1,430Accounts receivable 1,835 1,420Premiums in course of collection 1,166 703Trading account assets 516 590Finance leases receivable 273 293Other assets (2) 648 772Derivative assets 528 461Total $ 172,834 $ 174,783
(1) Includes $8,723 ($13,830 at December 31, 2015) of funds held by ceding insurers where the Companyretains the credit risk of the assets supporting the liabilities ceded (note 6).
(2) Includes items such as current income taxes receivable and miscellaneous other assets of the Company(note 11).
Credit risk is also mitigated by entering into collateral agreements. The amount and type of collateralrequired depends on an assessment of the credit risk of the counterparty. Guidelines are implementedregarding the acceptability of types of collateral and the valuation parameters. Management monitors thevalue of the collateral, requests additional collateral when needed and performs an impairment valuationwhen applicable. The Company has $149 of collateral received from counterparties as at December 31,2016 ($107 at December 31, 2015) relating to derivative assets.
(ii) Concentration of Credit Risk
Concentrations of credit risk arise from exposures to a single debtor, a group of related debtors or groupsof debtors that have similar credit risk characteristics in that they operate in the same geographic regionor in similar industries. The characteristics are similar in that changes in economic or political environmentsmay impact their ability to meet obligations as they come due.
7. Financial Instruments Risk Management (cont'd)
32
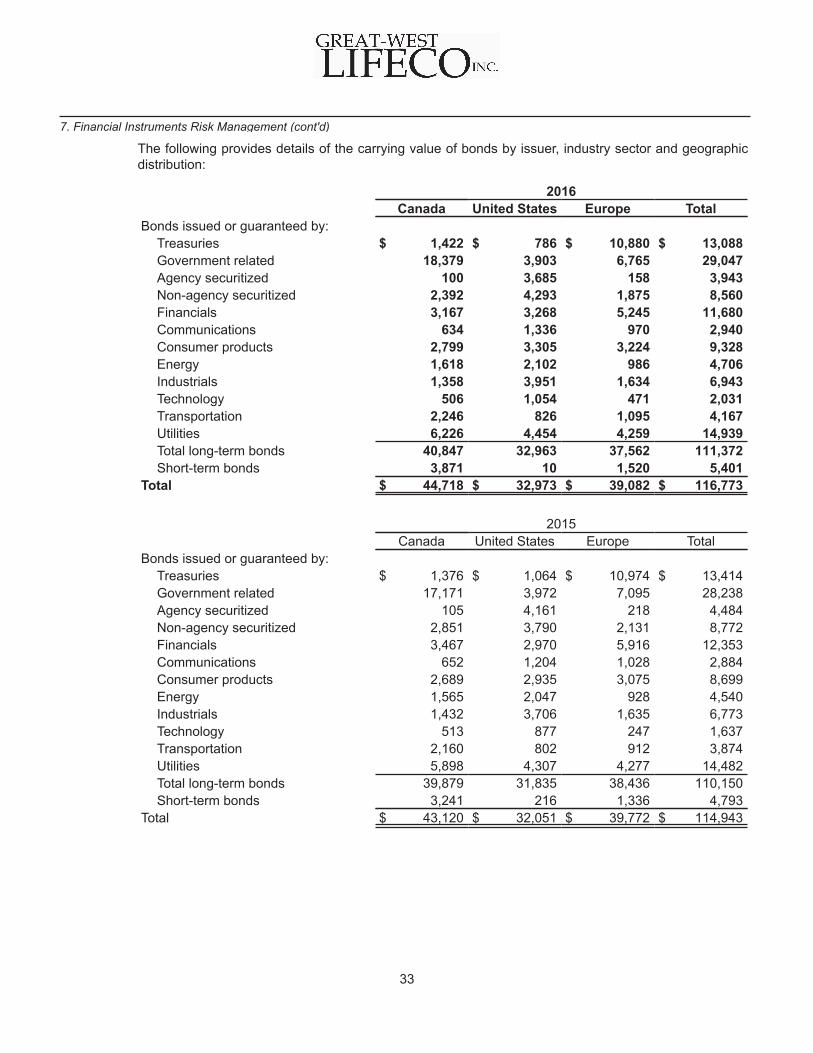
The following provides details of the carrying value of bonds by issuer, industry sector and geographicdistribution:
2016Canada United States Europe Total
Bonds issued or guaranteed by:Treasuries $ 1,422 $ 786 $ 10,880 $ 13,088Government related 18,379 3,903 6,765 29,047Agency securitized 100 3,685 158 3,943Non-agency securitized 2,392 4,293 1,875 8,560Financials 3,167 3,268 5,245 11,680Communications 634 1,336 970 2,940Consumer products 2,799 3,305 3,224 9,328Energy 1,618 2,102 986 4,706Industrials 1,358 3,951 1,634 6,943Technology 506 1,054 471 2,031Transportation 2,246 826 1,095 4,167Utilities 6,226 4,454 4,259 14,939Total long-term bonds 40,847 32,963 37,562 111,372Short-term bonds 3,871 10 1,520 5,401
Total $ 44,718 $ 32,973 $ 39,082 $ 116,773
2015Canada United States Europe Total
Bonds issued or guaranteed by:Treasuries $ 1,376 $ 1,064 $ 10,974 $ 13,414Government related 17,171 3,972 7,095 28,238Agency securitized 105 4,161 218 4,484Non-agency securitized 2,851 3,790 2,131 8,772Financials 3,467 2,970 5,916 12,353Communications 652 1,204 1,028 2,884Consumer products 2,689 2,935 3,075 8,699Energy 1,565 2,047 928 4,540Industrials 1,432 3,706 1,635 6,773Technology 513 877 247 1,637Transportation 2,160 802 912 3,874Utilities 5,898 4,307 4,277 14,482Total long-term bonds 39,879 31,835 38,436 110,150Short-term bonds 3,241 216 1,336 4,793
Total $ 43,120 $ 32,051 $ 39,772 $ 114,943
7. Financial Instruments Risk Management (cont'd)
33
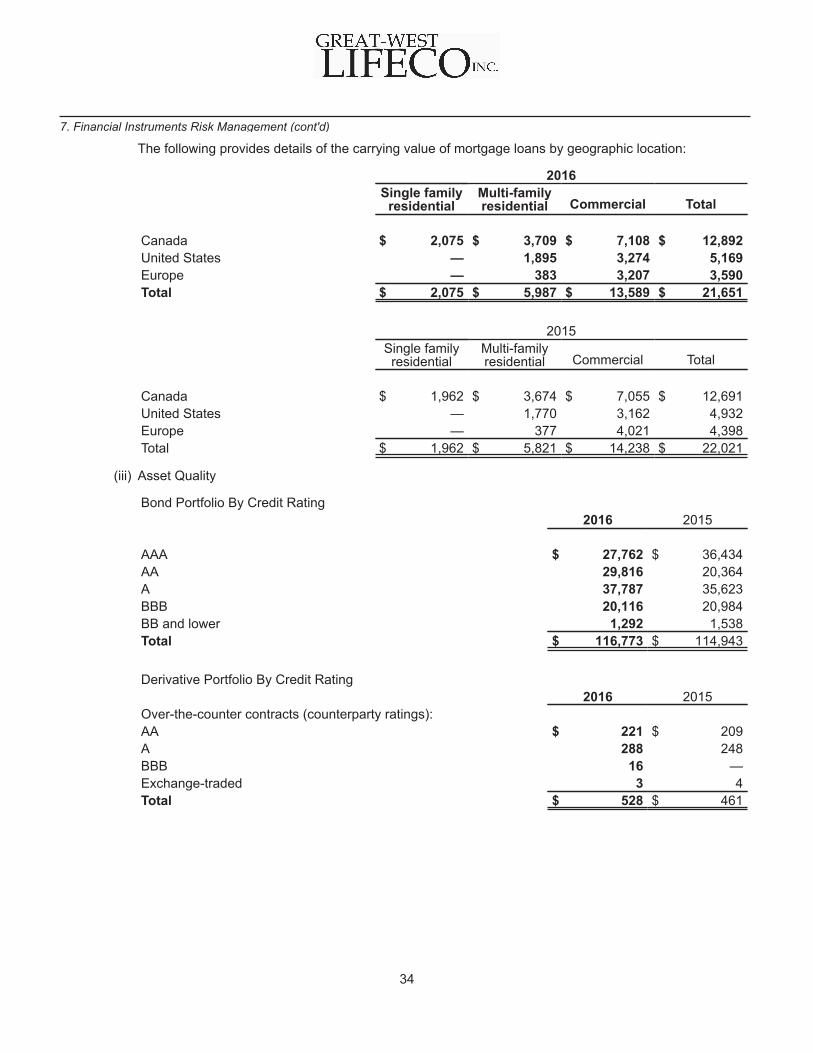
The following provides details of the carrying value of mortgage loans by geographic location:
2016Single family
residentialMulti-familyresidential Commercial Total
Canada $ 2,075 $ 3,709 $ 7,108 $ 12,892United States — 1,895 3,274 5,169Europe — 383 3,207 3,590Total $ 2,075 $ 5,987 $ 13,589 $ 21,651
2015Single familyresidential
Multi-familyresidential Commercial Total
Canada $ 1,962 $ 3,674 $ 7,055 $ 12,691United States — 1,770 3,162 4,932Europe — 377 4,021 4,398Total $ 1,962 $ 5,821 $ 14,238 $ 22,021
(iii) Asset Quality
Bond Portfolio By Credit Rating2016 2015
AAA $ 27,762 $ 36,434AA 29,816 20,364A 37,787 35,623BBB 20,116 20,984BB and lower 1,292 1,538Total $ 116,773 $ 114,943
Derivative Portfolio By Credit Rating2016 2015
Over-the-counter contracts (counterparty ratings):AA $ 221 $ 209A 288 248BBB 16 —Exchange-traded 3 4Total $ 528 $ 461
7. Financial Instruments Risk Management (cont'd)
34
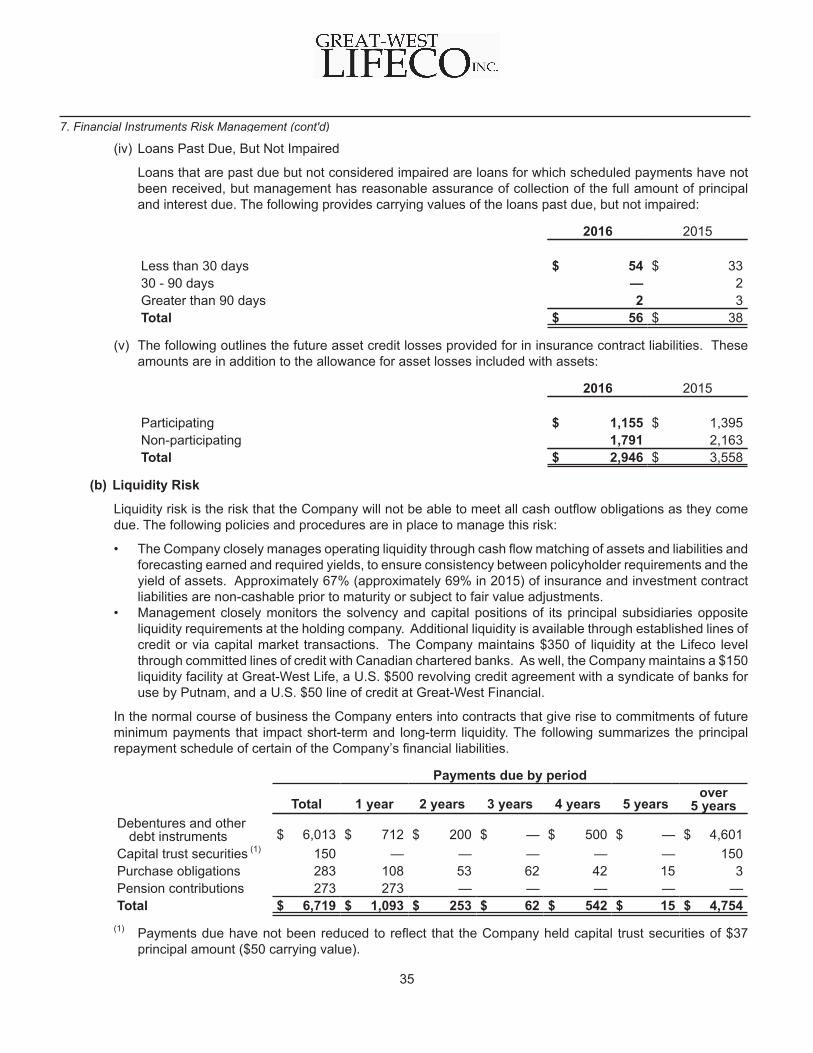
(iv) Loans Past Due, But Not Impaired
Loans that are past due but not considered impaired are loans for which scheduled payments have notbeen received, but management has reasonable assurance of collection of the full amount of principaland interest due. The following provides carrying values of the loans past due, but not impaired:
2016 2015
Less than 30 days $ 54 $ 3330 - 90 days — 2Greater than 90 days 2 3Total $ 56 $ 38
(v) The following outlines the future asset credit losses provided for in insurance contract liabilities. Theseamounts are in addition to the allowance for asset losses included with assets:
2016 2015
Participating $ 1,155 $ 1,395Non-participating 1,791 2,163Total $ 2,946 $ 3,558
(b) Liquidity Risk
Liquidity risk is the risk that the Company will not be able to meet all cash outflow obligations as they comedue. The following policies and procedures are in place to manage this risk:
• The Company closely manages operating liquidity through cash flow matching of assets and liabilities andforecasting earned and required yields, to ensure consistency between policyholder requirements and theyield of assets. Approximately 67% (approximately 69% in 2015) of insurance and investment contractliabilities are non-cashable prior to maturity or subject to fair value adjustments.
• Management closely monitors the solvency and capital positions of its principal subsidiaries oppositeliquidity requirements at the holding company. Additional liquidity is available through established lines ofcredit or via capital market transactions. The Company maintains $350 of liquidity at the Lifeco levelthrough committed lines of credit with Canadian chartered banks. As well, the Company maintains a $150liquidity facility at Great-West Life, a U.S. $500 revolving credit agreement with a syndicate of banks foruse by Putnam, and a U.S. $50 line of credit at Great-West Financial.
In the normal course of business the Company enters into contracts that give rise to commitments of futureminimum payments that impact short-term and long-term liquidity. The following summarizes the principalrepayment schedule of certain of the Company’s financial liabilities.
Payments due by period
Total 1 year 2 years 3 years 4 years 5 yearsover
5 yearsDebentures and other
debt instruments $ 6,013 $ 712 $ 200 $ — $ 500 $ — $ 4,601Capital trust securities (1) 150 — — — — — 150Purchase obligations 283 108 53 62 42 15 3Pension contributions 273 273 — — — — —Total $ 6,719 $ 1,093 $ 253 $ 62 $ 542 $ 15 $ 4,754
(1) Payments due have not been reduced to reflect that the Company held capital trust securities of $37principal amount ($50 carrying value).
7. Financial Instruments Risk Management (cont'd)
35
(c) Market Risk
Market risk is the risk that the fair value or future cash flows of a financial instrument will fluctuate as a resultof changes in market factors which include three types: currency risk, interest rate (including related inflation)risk and equity risk.
Caution Related to Risk SensitivitiesThese financial statements include estimates of sensitivities and risk exposure measures for certain risks,such as the sensitivity due to specific changes in interest rate levels projected and market prices as at thevaluation date. Actual results can differ significantly from these estimates for a variety of reasons including:
• Assessment of the circumstances that led to the scenario may lead to changes in (re)investmentapproaches and interest rate scenarios considered,
• Changes in actuarial, investment return and future investment activity assumptions,• Actual experience differing from the assumptions,• Changes in business mix, effective income tax rates and other market factors,• Interactions among these factors and assumptions when more than one changes, and• The general limitations of the Company's internal models.
For these reasons, the sensitivities should only be viewed as directional estimates of the underlying sensitivitiesfor the respective factors based on the assumptions outlined above. Given the nature of these calculations,the Company cannot provide assurance that the actual impact on net earnings attributed to shareholders willbe as indicated.
(i) Currency Risk
Currency risk relates to the Company operating and holding financial instruments in different currencies.For the assets backing insurance and investment contract liabilities that are not matched by currency,changes in foreign exchange rates can expose the Company to the risk of foreign exchange losses notoffset by liability decreases. The Company has net investments in foreign operations. The Company’sdebt obligations are denominated in Canadian dollars, euros, and U.S. dollars. In accordance with IFRS,foreign currency translation gains and losses from net investments in foreign operations, net of relatedhedging activities and tax effects, are recorded in accumulated other comprehensive income.Strengthening or weakening of the Canadian dollar spot rate compared to the U.S. dollar, British poundand euro spot rates impacts the Company’s total equity. Correspondingly, the Company’s book value pershare and capital ratios monitored by rating agencies are also impacted.
The following policies and procedures are in place to mitigate the Company's exposure to currency risk:
• The Company uses financial measures such as constant currency calculations to monitor the effectof currency translation fluctuations.
• Investments are normally made in the same currency as the liabilities supported by those investments.Segmented Investment Guidelines include maximum tolerances for unhedged currency mismatchexposures.
• For assets backing liabilities not matched by currency, the Company would normally convert the assetsback to the currency of the liability using foreign exchange contracts.
7. Financial Instruments Risk Management (cont'd)
36
• A 10% weakening of the Canadian dollar against foreign currencies would be expected to increasenon-participating insurance and investment contract liabilities and their supporting assets byapproximately the same amount resulting in an immaterial change to net earnings. A 10% strengtheningof the Canadian dollar against foreign currencies would be expected to decrease non-participatinginsurance and investment contract liabilities and their supporting assets by approximately the sameamount resulting in an immaterial change in net earnings.
(ii) Interest Rate Risk
Interest rate risk exists if asset and liability cash flows are not closely matched and interest rates changecausing a difference in value between the asset and liability. The following policies and procedures arein place to mitigate the Company's exposure to interest rate risk:
• The Company utilizes a formal process for managing the matching of assets and liabilities. This involvesgrouping general fund assets and liabilities into segments. Assets in each segment are managed inrelation to the liabilities in the segment.
• Interest rate risk is managed by investing in assets that are suitable for the products sold.• Where these products have benefit or expense payments that are dependent on inflation (inflation-
indexed annuities, pensions and disability claims) the Company generally invests in real returninstruments to hedge its real dollar liability cash flows. Some protection against changes in the inflationindex is achieved as any related change in the fair value of the assets will be largely offset by a similarchange in the fair value of the liabilities.
• For products with fixed and highly predictable benefit payments, investments are made in fixed incomeassets or real estate whose cash flows closely match the liability product cash flows. Where assetsare not available to match certain period cash flows, such as long-tail cash flows, a portion of theseare invested in equities and the rest are duration matched. Hedging instruments are employed wherenecessary when there is a lack of suitable permanent investments to minimize loss exposure to interestrate changes. To the extent these cash flows are matched, protection against interest rate change isachieved and any change in the fair value of the assets will be offset by a similar change in the fairvalue of the liabilities.
• For products with less predictable timing of benefit payments, investments are made in fixed incomeassets with cash flows of a shorter duration than the anticipated timing of benefit payments, or equitiesas described below.
• The risk associated with the mismatch in portfolio duration and cash flow, asset prepayment exposureand the pace of asset acquisition are quantified and reviewed regularly.
Projected cash flows from the current assets and liabilities are used in the Canadian Asset Liability Methodto determine insurance contract liabilities. Valuation assumptions have been made regarding rates ofreturns on supporting assets, fixed income, equity and inflation. The valuation assumptions use bestestimates of future reinvestment rates and inflation assumptions with an assumed correlation togetherwith margins for adverse deviation set in accordance with professional standards. These margins arenecessary to provide for possibilities of misestimation and/or future deterioration in the best estimateassumptions and provide reasonable assurance that insurance contract liabilities cover a range of possibleoutcomes. Margins are reviewed periodically for continued appropriateness.
Projected cash flows from fixed income assets used in actuarial calculations are reduced to provide forpotential asset default losses. The net effective yield rate reduction averaged 0.14% (0.18% in 2015). Thecalculation for future credit losses on assets is based on the credit quality of the underlying asset portfolio.
7. Financial Instruments Risk Management (cont'd)
37
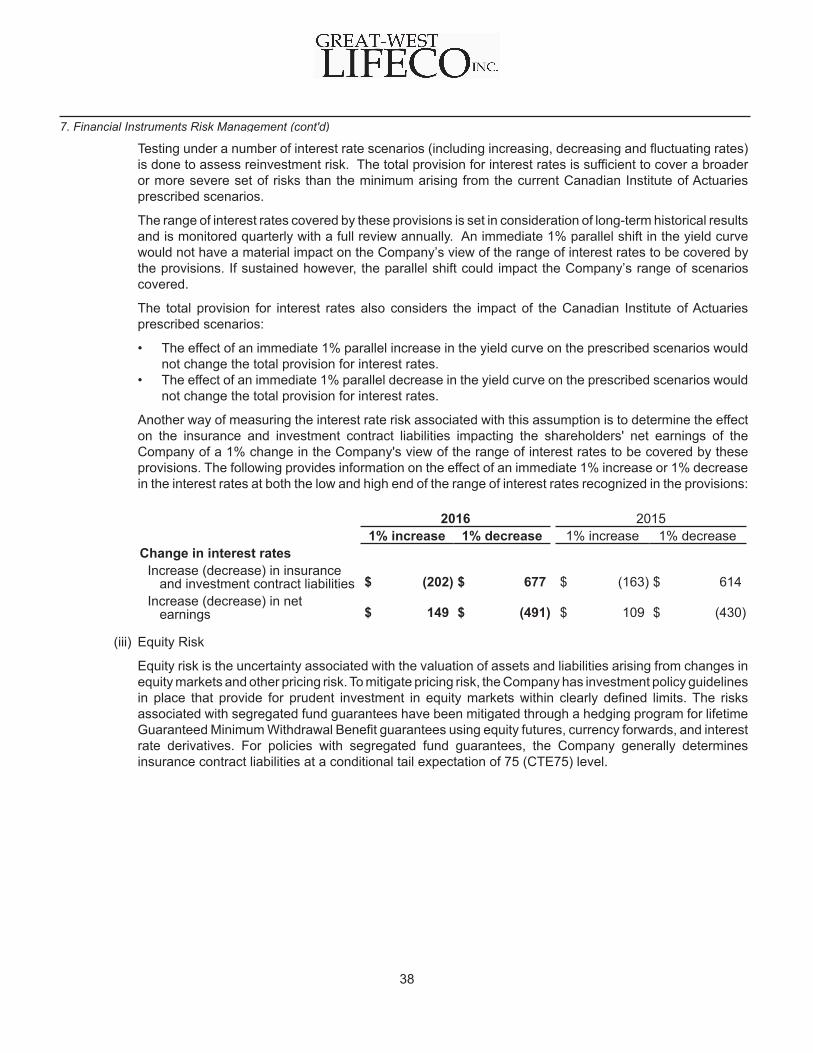
Testing under a number of interest rate scenarios (including increasing, decreasing and fluctuating rates)is done to assess reinvestment risk. The total provision for interest rates is sufficient to cover a broaderor more severe set of risks than the minimum arising from the current Canadian Institute of Actuariesprescribed scenarios.
The range of interest rates covered by these provisions is set in consideration of long-term historical resultsand is monitored quarterly with a full review annually. An immediate 1% parallel shift in the yield curvewould not have a material impact on the Company’s view of the range of interest rates to be covered bythe provisions. If sustained however, the parallel shift could impact the Company’s range of scenarioscovered.
The total provision for interest rates also considers the impact of the Canadian Institute of Actuariesprescribed scenarios:
• The effect of an immediate 1% parallel increase in the yield curve on the prescribed scenarios wouldnot change the total provision for interest rates.
• The effect of an immediate 1% parallel decrease in the yield curve on the prescribed scenarios wouldnot change the total provision for interest rates.
Another way of measuring the interest rate risk associated with this assumption is to determine the effecton the insurance and investment contract liabilities impacting the shareholders' net earnings of theCompany of a 1% change in the Company's view of the range of interest rates to be covered by theseprovisions. The following provides information on the effect of an immediate 1% increase or 1% decreasein the interest rates at both the low and high end of the range of interest rates recognized in the provisions:
2016 20151% increase 1% decrease 1% increase 1% decrease
Change in interest ratesIncrease (decrease) in insurance
and investment contract liabilities $ (202) $ 677 $ (163) $ 614Increase (decrease) in net
earnings $ 149 $ (491) $ 109 $ (430)
(iii) Equity Risk
Equity risk is the uncertainty associated with the valuation of assets and liabilities arising from changes inequity markets and other pricing risk. To mitigate pricing risk, the Company has investment policy guidelinesin place that provide for prudent investment in equity markets within clearly defined limits. The risksassociated with segregated fund guarantees have been mitigated through a hedging program for lifetimeGuaranteed Minimum Withdrawal Benefit guarantees using equity futures, currency forwards, and interestrate derivatives. For policies with segregated fund guarantees, the Company generally determinesinsurance contract liabilities at a conditional tail expectation of 75 (CTE75) level.
7. Financial Instruments Risk Management (cont'd)
38
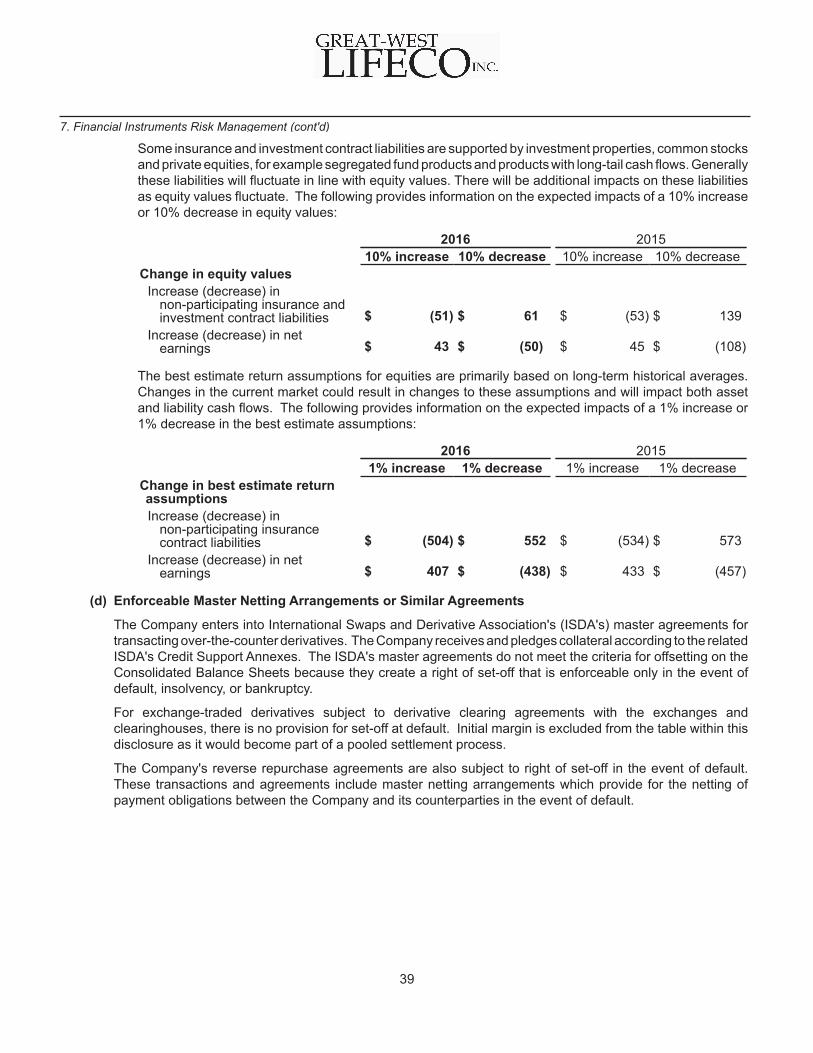
Some insurance and investment contract liabilities are supported by investment properties, common stocksand private equities, for example segregated fund products and products with long-tail cash flows. Generallythese liabilities will fluctuate in line with equity values. There will be additional impacts on these liabilitiesas equity values fluctuate. The following provides information on the expected impacts of a 10% increaseor 10% decrease in equity values:
2016 201510% increase 10% decrease 10% increase 10% decrease
Change in equity valuesIncrease (decrease) in
non-participating insurance andinvestment contract liabilities $ (51) $ 61 $ (53) $ 139
Increase (decrease) in netearnings $ 43 $ (50) $ 45 $ (108)
The best estimate return assumptions for equities are primarily based on long-term historical averages.Changes in the current market could result in changes to these assumptions and will impact both assetand liability cash flows. The following provides information on the expected impacts of a 1% increase or1% decrease in the best estimate assumptions:
2016 20151% increase 1% decrease 1% increase 1% decrease
Change in best estimate returnassumptionsIncrease (decrease) in
non-participating insurancecontract liabilities $ (504) $ 552 $ (534) $ 573
Increase (decrease) in netearnings $ 407 $ (438) $ 433 $ (457)
(d) Enforceable Master Netting Arrangements or Similar Agreements
The Company enters into International Swaps and Derivative Association's (ISDA's) master agreements fortransacting over-the-counter derivatives. The Company receives and pledges collateral according to the relatedISDA's Credit Support Annexes. The ISDA's master agreements do not meet the criteria for offsetting on theConsolidated Balance Sheets because they create a right of set-off that is enforceable only in the event ofdefault, insolvency, or bankruptcy.
For exchange-traded derivatives subject to derivative clearing agreements with the exchanges andclearinghouses, there is no provision for set-off at default. Initial margin is excluded from the table within thisdisclosure as it would become part of a pooled settlement process.
The Company's reverse repurchase agreements are also subject to right of set-off in the event of default.These transactions and agreements include master netting arrangements which provide for the netting ofpayment obligations between the Company and its counterparties in the event of default.
7. Financial Instruments Risk Management (cont'd)
39
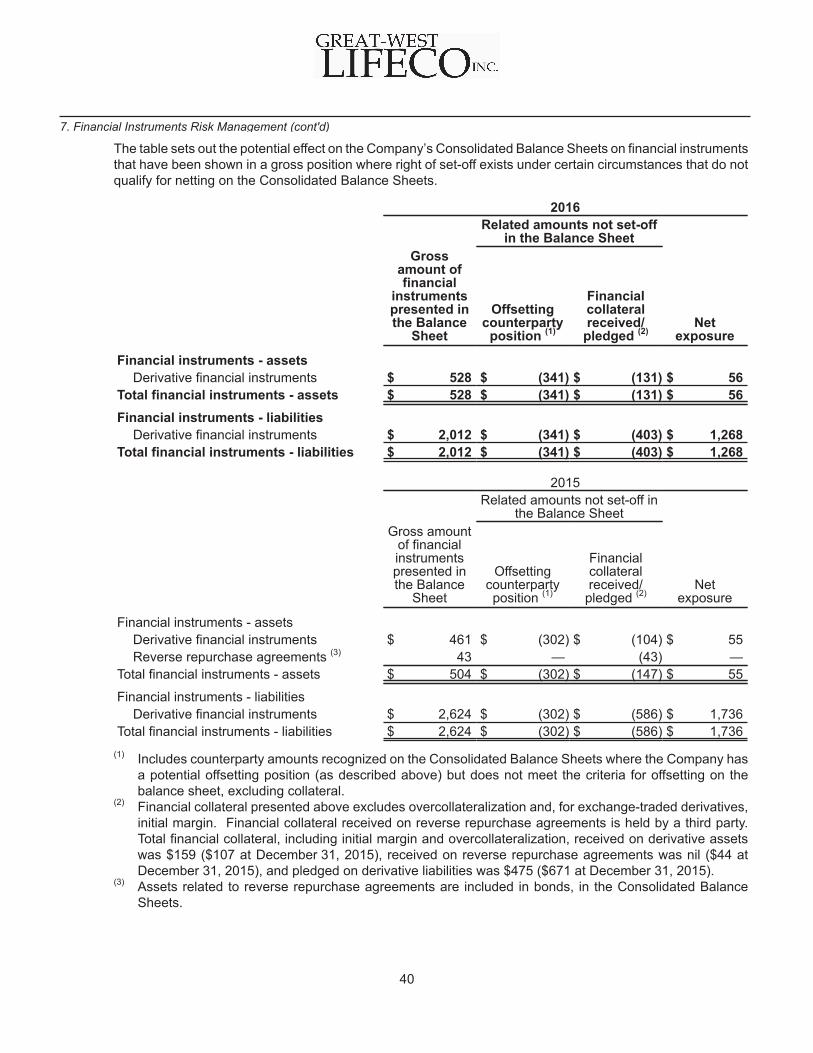
The table sets out the potential effect on the Company’s Consolidated Balance Sheets on financial instrumentsthat have been shown in a gross position where right of set-off exists under certain circumstances that do notqualify for netting on the Consolidated Balance Sheets.
2016Related amounts not set-off
in the Balance SheetGross
amount offinancial
instrumentspresented inthe Balance
Sheet
Offsettingcounterparty
position (1)
Financialcollateralreceived/
pledged (2)Net
exposure
Financial instruments - assetsDerivative financial instruments $ 528 $ (341) $ (131) $ 56
Total financial instruments - assets $ 528 $ (341) $ (131) $ 56Financial instruments - liabilities
Derivative financial instruments $ 2,012 $ (341) $ (403) $ 1,268Total financial instruments - liabilities $ 2,012 $ (341) $ (403) $ 1,268
2015Related amounts not set-off in
the Balance SheetGross amount
of financialinstrumentspresented inthe Balance
Sheet
Offsettingcounterpartyposition (1)
Financialcollateralreceived/
pledged (2)Net
exposure
Financial instruments - assetsDerivative financial instruments $ 461 $ (302) $ (104) $ 55Reverse repurchase agreements (3) 43 — (43) —
Total financial instruments - assets $ 504 $ (302) $ (147) $ 55
Financial instruments - liabilitiesDerivative financial instruments $ 2,624 $ (302) $ (586) $ 1,736
Total financial instruments - liabilities $ 2,624 $ (302) $ (586) $ 1,736(1) Includes counterparty amounts recognized on the Consolidated Balance Sheets where the Company has
a potential offsetting position (as described above) but does not meet the criteria for offsetting on thebalance sheet, excluding collateral.
(2) Financial collateral presented above excludes overcollateralization and, for exchange-traded derivatives,initial margin. Financial collateral received on reverse repurchase agreements is held by a third party.Total financial collateral, including initial margin and overcollateralization, received on derivative assetswas $159 ($107 at December 31, 2015), received on reverse repurchase agreements was nil ($44 atDecember 31, 2015), and pledged on derivative liabilities was $475 ($671 at December 31, 2015).
(3) Assets related to reverse repurchase agreements are included in bonds, in the Consolidated BalanceSheets.
7. Financial Instruments Risk Management (cont'd)
40
8. Fair Value Measurement
The Company’s assets and liabilities recorded at fair value have been categorized based upon the following fairvalue hierarchy:
Level 1: Fair value measurements utilize observable, quoted prices (unadjusted) in active markets for identicalassets or liabilities that the Company has the ability to access. Assets and liabilities utilizing Level 1 inputs includeactively exchange-traded equity securities, exchange-traded futures, and mutual and segregated funds which haveavailable prices in an active market with no redemption restrictions.
Level 2: Fair value measurements utilize inputs other than quoted prices included in Level 1 that are observablefor the asset or liability, either directly or indirectly. Level 2 inputs include quoted prices for similar assets andliabilities in active markets, and inputs other than quoted prices that are observable for the asset or liability, suchas interest rates and yield curves that are observable at commonly quoted intervals. The fair values for someLevel 2 securities were obtained from a pricing service. The pricing service inputs include, but are not limited to,benchmark yields, reported trades, broker/dealer quotes, issuer spreads, two-sided markets, benchmark securities,offers and reference data. Level 2 assets and liabilities include those priced using a matrix which is based oncredit quality and average life, government and agency securities, restricted stock, some private bonds and equities,most investment-grade and high-yield corporate bonds, most asset-backed securities, most over-the-counterderivatives, and mortgage loans. Investment contracts that are measured at fair value through profit or loss aremostly included in the Level 2 category.
Level 3: Fair value measurements utilize one or more significant inputs that are not based on observable marketinputs and include situations where there is little, if any, market activity for the asset or liability. The values of themajority of Level 3 securities were obtained from single broker quotes, internal pricing models, or externalappraisers. Assets and liabilities utilizing Level 3 inputs generally include certain bonds, certain asset-backedsecurities, some private equities, investments in mutual and segregated funds where there are redemptionrestrictions, certain over-the-counter derivatives, and investment properties.
41
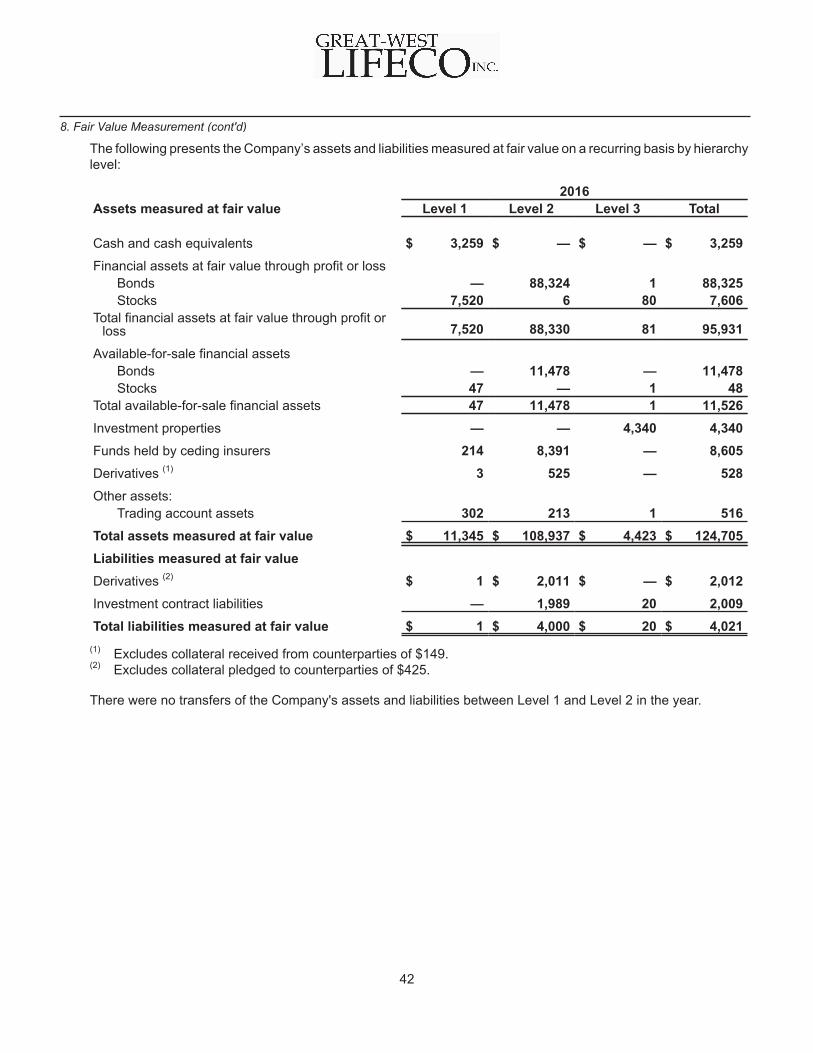
The following presents the Company’s assets and liabilities measured at fair value on a recurring basis by hierarchylevel:
2016Assets measured at fair value Level 1 Level 2 Level 3 Total
Cash and cash equivalents $ 3,259 $ — $ — $ 3,259Financial assets at fair value through profit or loss
Bonds — 88,324 1 88,325Stocks 7,520 6 80 7,606
Total financial assets at fair value through profit orloss 7,520 88,330 81 95,931
Available-for-sale financial assetsBonds — 11,478 — 11,478Stocks 47 — 1 48
Total available-for-sale financial assets 47 11,478 1 11,526Investment properties — — 4,340 4,340Funds held by ceding insurers 214 8,391 — 8,605Derivatives (1) 3 525 — 528Other assets:
Trading account assets 302 213 1 516Total assets measured at fair value $ 11,345 $ 108,937 $ 4,423 $ 124,705Liabilities measured at fair valueDerivatives (2) $ 1 $ 2,011 $ — $ 2,012Investment contract liabilities — 1,989 20 2,009Total liabilities measured at fair value $ 1 $ 4,000 $ 20 $ 4,021
(1) Excludes collateral received from counterparties of $149. (2) Excludes collateral pledged to counterparties of $425.
There were no transfers of the Company's assets and liabilities between Level 1 and Level 2 in the year.
8. Fair Value Measurement (cont'd)
42
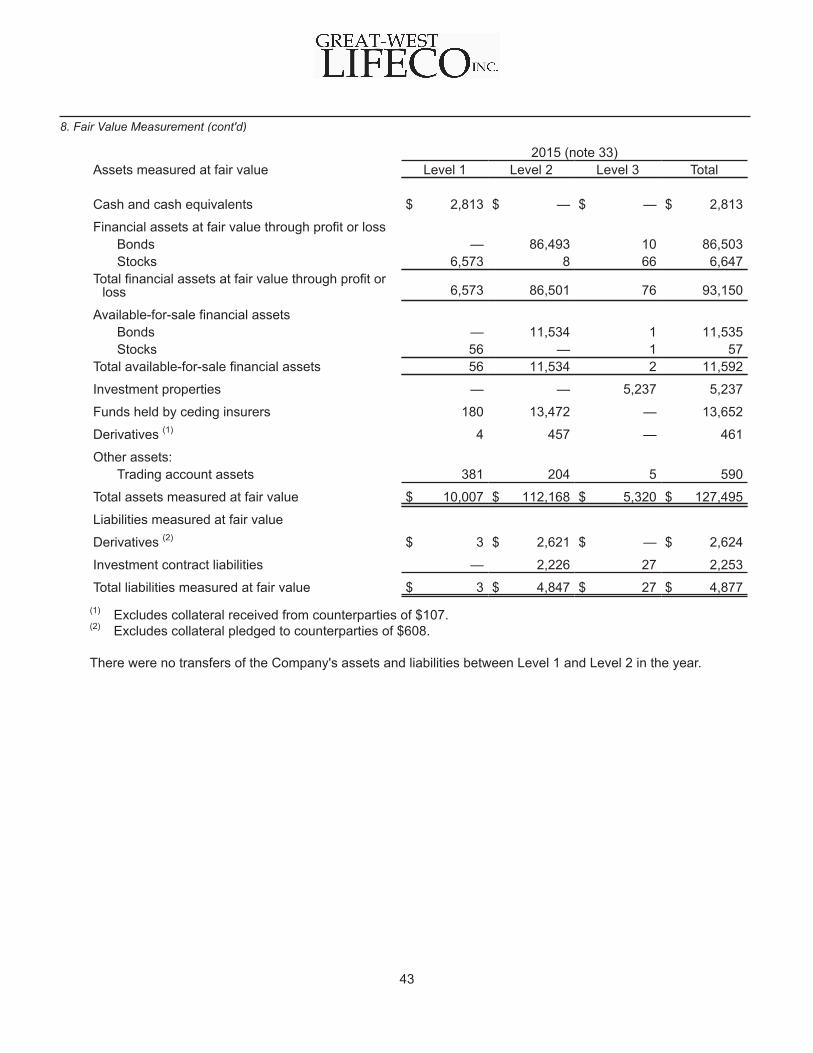
2015 (note 33)Assets measured at fair value Level 1 Level 2 Level 3 Total
Cash and cash equivalents $ 2,813 $ — $ — $ 2,813
Financial assets at fair value through profit or lossBonds — 86,493 10 86,503Stocks 6,573 8 66 6,647
Total financial assets at fair value through profit orloss 6,573 86,501 76 93,150
Available-for-sale financial assetsBonds — 11,534 1 11,535Stocks 56 — 1 57
Total available-for-sale financial assets 56 11,534 2 11,592
Investment properties — — 5,237 5,237
Funds held by ceding insurers 180 13,472 — 13,652
Derivatives (1) 4 457 — 461
Other assets:Trading account assets 381 204 5 590
Total assets measured at fair value $ 10,007 $ 112,168 $ 5,320 $ 127,495
Liabilities measured at fair value
Derivatives (2) $ 3 $ 2,621 $ — $ 2,624
Investment contract liabilities — 2,226 27 2,253
Total liabilities measured at fair value $ 3 $ 4,847 $ 27 $ 4,877(1) Excludes collateral received from counterparties of $107. (2) Excludes collateral pledged to counterparties of $608.
There were no transfers of the Company's assets and liabilities between Level 1 and Level 2 in the year.
8. Fair Value Measurement (cont'd)
43
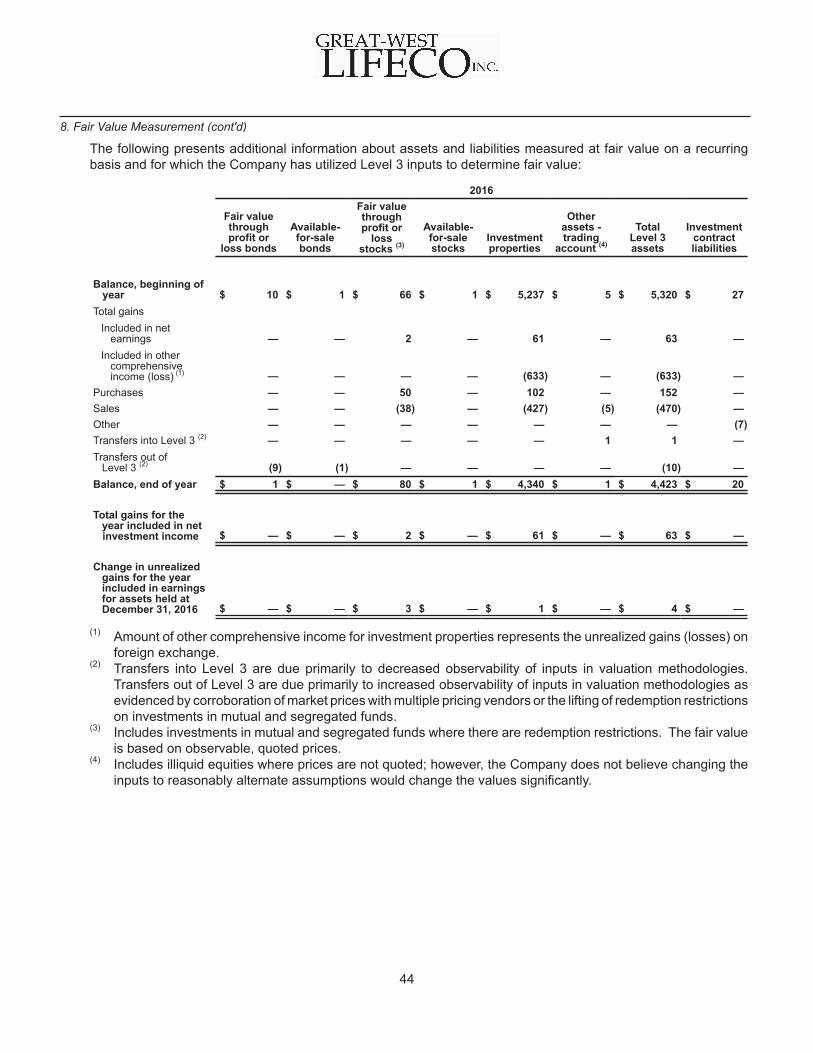
The following presents additional information about assets and liabilities measured at fair value on a recurringbasis and for which the Company has utilized Level 3 inputs to determine fair value:
2016
Fair valuethroughprofit or
loss bonds
Available-for-salebonds
Fair valuethroughprofit or
lossstocks (3)
Available-for-salestocks
Investmentproperties
Otherassets -trading
account (4)
TotalLevel 3assets
Investmentcontractliabilities
Balance, beginning ofyear $ 10 $ 1 $ 66 $ 1 $ 5,237 $ 5 $ 5,320 $ 27
Total gainsIncluded in net
earnings — — 2 — 61 — 63 —Included in other
comprehensiveincome (loss) (1) — — — — (633) — (633) —
Purchases — — 50 — 102 — 152 —Sales — — (38) — (427) (5) (470) —Other — — — — — — — (7)Transfers into Level 3 (2) — — — — — 1 1 —Transfers out of Level 3 (2) (9) (1) — — — — (10) —Balance, end of year $ 1 $ — $ 80 $ 1 $ 4,340 $ 1 $ 4,423 $ 20
Total gains for the year included in net
investment income $ — $ — $ 2 $ — $ 61 $ — $ 63 $ —
Change in unrealized gains for the year included in earnings for assets held at December 31, 2016 $ — $ — $ 3 $ — $ 1 $ — $ 4 $ —
(1) Amount of other comprehensive income for investment properties represents the unrealized gains (losses) onforeign exchange.
(2) Transfers into Level 3 are due primarily to decreased observability of inputs in valuation methodologies.Transfers out of Level 3 are due primarily to increased observability of inputs in valuation methodologies asevidenced by corroboration of market prices with multiple pricing vendors or the lifting of redemption restrictionson investments in mutual and segregated funds.
(3) Includes investments in mutual and segregated funds where there are redemption restrictions. The fair valueis based on observable, quoted prices.
(4) Includes illiquid equities where prices are not quoted; however, the Company does not believe changing theinputs to reasonably alternate assumptions would change the values significantly.
8. Fair Value Measurement (cont'd)
44
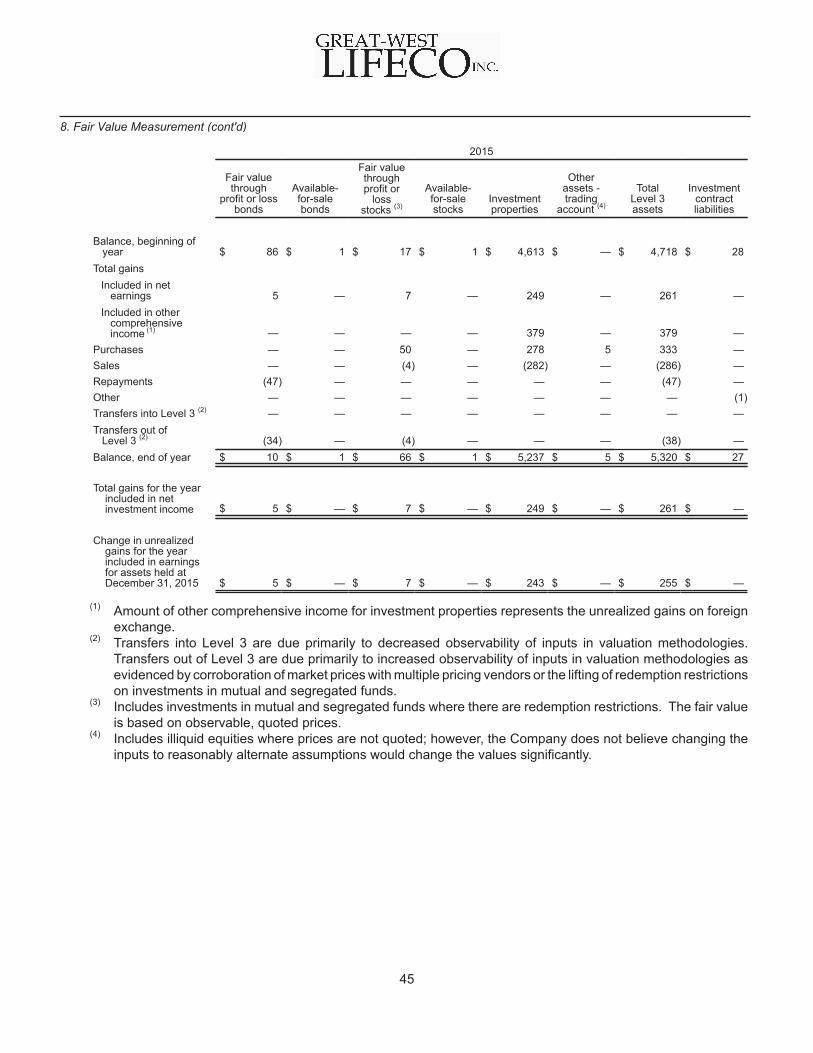
2015
Fair valuethrough
profit or lossbonds
Available-for-salebonds
Fair valuethroughprofit or
lossstocks (3)
Available-for-salestocks
Investmentproperties
Otherassets -trading
account (4)
TotalLevel 3assets
Investmentcontractliabilities
Balance, beginning ofyear $ 86 $ 1 $ 17 $ 1 $ 4,613 $ — $ 4,718 $ 28
Total gainsIncluded in net
earnings 5 — 7 — 249 — 261 —Included in other
comprehensiveincome (1) — — — — 379 — 379 —
Purchases — — 50 — 278 5 333 —Sales — — (4) — (282) — (286) —Repayments (47) — — — — — (47) —Other — — — — — — — (1)Transfers into Level 3 (2) — — — — — — — —Transfers out of Level 3 (2) (34) — (4) — — — (38) —Balance, end of year $ 10 $ 1 $ 66 $ 1 $ 5,237 $ 5 $ 5,320 $ 27
Total gains for the yearincluded in netinvestment income $ 5 $ — $ 7 $ — $ 249 $ — $ 261 $ —
Change in unrealizedgains for the yearincluded in earningsfor assets held atDecember 31, 2015 $ 5 $ — $ 7 $ — $ 243 $ — $ 255 $ —
(1) Amount of other comprehensive income for investment properties represents the unrealized gains on foreignexchange.
(2) Transfers into Level 3 are due primarily to decreased observability of inputs in valuation methodologies.Transfers out of Level 3 are due primarily to increased observability of inputs in valuation methodologies asevidenced by corroboration of market prices with multiple pricing vendors or the lifting of redemption restrictionson investments in mutual and segregated funds.
(3) Includes investments in mutual and segregated funds where there are redemption restrictions. The fair valueis based on observable, quoted prices.
(4) Includes illiquid equities where prices are not quoted; however, the Company does not believe changing theinputs to reasonably alternate assumptions would change the values significantly.
8. Fair Value Measurement (cont'd)
45
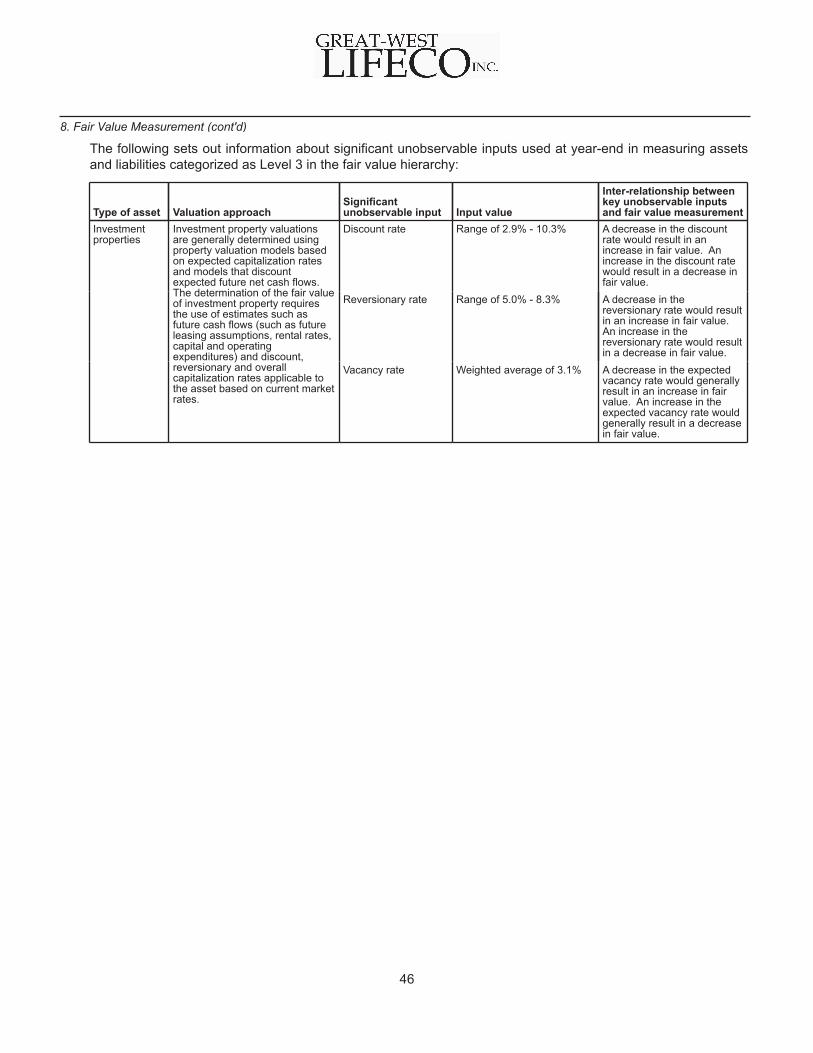
The following sets out information about significant unobservable inputs used at year-end in measuring assetsand liabilities categorized as Level 3 in the fair value hierarchy:
Type of asset Valuation approachSignificantunobservable input Input value
Inter-relationship betweenkey unobservable inputsand fair value measurement
Investmentproperties
Investment property valuationsare generally determined usingproperty valuation models basedon expected capitalization ratesand models that discountexpected future net cash flows.The determination of the fair valueof investment property requiresthe use of estimates such asfuture cash flows (such as futureleasing assumptions, rental rates,capital and operatingexpenditures) and discount,reversionary and overallcapitalization rates applicable tothe asset based on current marketrates.
Discount rate Range of 2.9% - 10.3% A decrease in the discountrate would result in anincrease in fair value. Anincrease in the discount ratewould result in a decrease infair value.
Reversionary rate Range of 5.0% - 8.3% A decrease in thereversionary rate would resultin an increase in fair value.An increase in thereversionary rate would resultin a decrease in fair value.
Vacancy rate Weighted average of 3.1% A decrease in the expectedvacancy rate would generallyresult in an increase in fairvalue. An increase in theexpected vacancy rate wouldgenerally result in a decreasein fair value.
8. Fair Value Measurement (cont'd)
46
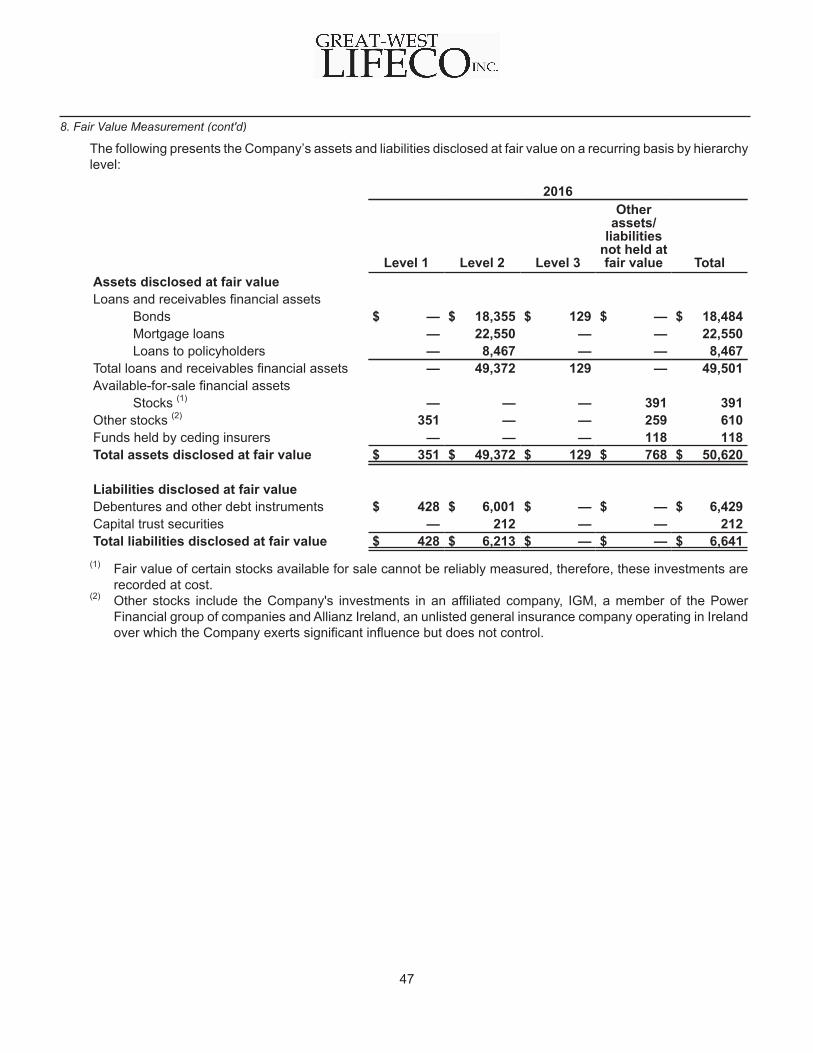
The following presents the Company’s assets and liabilities disclosed at fair value on a recurring basis by hierarchylevel:
2016
Level 1 Level 2 Level 3
Otherassets/
liabilitiesnot held atfair value Total
Assets disclosed at fair valueLoans and receivables financial assets
Bonds $ — $ 18,355 $ 129 $ — $ 18,484Mortgage loans — 22,550 — — 22,550Loans to policyholders — 8,467 — — 8,467
Total loans and receivables financial assets — 49,372 129 — 49,501Available-for-sale financial assets
Stocks (1) — — — 391 391Other stocks (2) 351 — — 259 610Funds held by ceding insurers — — — 118 118Total assets disclosed at fair value $ 351 $ 49,372 $ 129 $ 768 $ 50,620
Liabilities disclosed at fair valueDebentures and other debt instruments $ 428 $ 6,001 $ — $ — $ 6,429Capital trust securities — 212 — — 212Total liabilities disclosed at fair value $ 428 $ 6,213 $ — $ — $ 6,641
(1) Fair value of certain stocks available for sale cannot be reliably measured, therefore, these investments arerecorded at cost.
(2) Other stocks include the Company's investments in an affiliated company, IGM, a member of the PowerFinancial group of companies and Allianz Ireland, an unlisted general insurance company operating in Irelandover which the Company exerts significant influence but does not control.
8. Fair Value Measurement (cont'd)
47
2015
Level 1 Level 2 Level 3
Otherassets/
liabilitiesnot held atfair value Total
Assets disclosed at fair valueLoans and receivables financial assets
Bonds $ — $ 18,145 $ 108 $ — $ 18,253Mortgage loans — 23,446 — — 23,446Loans to policyholders — 8,694 — — 8,694
Total loans and receivables financial assets — 50,285 108 — 50,393Available-for-sale financial assets
Stocks (1) — — — 534 534Other stocks (2) 325 — — 276 601Funds held by ceding insurers — — — 178 178Total assets disclosed at fair value $ 325 $ 50,285 $ 108 $ 988 $ 51,706
Liabilities disclosed at fair valueDebentures and other debt instruments $ 467 $ 5,565 $ — $ — $ 6,032Capital trust securities — 215 — — 215Total liabilities disclosed at fair value $ 467 $ 5,780 $ — $ — $ 6,247
(1) Fair value of certain stocks available for sale cannot be reliably measured, therefore, these investments arerecorded at cost.
(2) Other stocks include the Company's investments in an affiliated company, IGM, a member of the PowerFinancial group of companies and Allianz Ireland, an unlisted general insurance company operating in Ireland,and a joint venture in GloHealth where the Company obtained control in 2016 (note 3).
8. Fair Value Measurement (cont'd)
48
9. Goodwill and Intangible Assets
(a) Goodwill
(i) The carrying value of goodwill and changes in the carrying value of goodwill are as follows:
2016 2015
Balance, beginning of year $ 5,913 $ 5,855Business acquisitions (note 3) 95 —Changes in foreign exchange rates (31) 58Balance, end of year $ 5,977 $ 5,913
Accumulated goodwill impairment losses and changes in accumulated goodwill impairment losses areas follows:
2016 2015
Balance, beginning of year $ 1,241 $ 1,043Changes in foreign exchange rates (36) 198Balance, end of year $ 1,205 $ 1,241

(ii) Within each of the three operating segments, goodwill has been assigned to cash generating unit groupings,representing the lowest level in which goodwill is monitored for internal reporting purposes. Lifeco doesnot allocate insignificant amounts of goodwill and indefinite life intangible assets across multiple cashgenerating unit groupings. Goodwill is tested for impairment by comparing the carrying value of each cashgenerating unit grouping to which goodwill has been assigned to its recoverable amount as follows:
2016 2015Canada
Group $ 1,047 $ 1,047Individual Insurance/Wealth Management 2,740 2,740
EuropeInsurance and Annuities 1,984 1,915Reinsurance 1 1
United StatesFinancial Services 205 210
Total $ 5,977 $ 5,913
(b) Intangible Assets
Intangible assets of $3,972 ($4,036 in 2015) include indefinite life and finite life intangible assets. The carryingvalue and changes in the carrying value of these intangible assets are as follows:
(i) Indefinite life intangible assets:
2016
Brands andtrademarks
Customercontract related
Shareholders'portion of
acquired futureparticipating
account profit Total
CostBalance, beginning of year $ 1,020 $ 3,019 $ 354 $ 4,393Transfer to finite life — (3) — (3)Changes in foreign exchange rates (41) (78) — (119)Balance, end of year $ 979 $ 2,938 $ 354 $ 4,271
Accumulated impairmentBalance, beginning of year $ (162) $ (1,116) $ — $ (1,278)Changes in foreign exchange rates 5 32 — 37Balance, end of year $ (157) $ (1,084) $ — $ (1,241)Net carrying amount $ 822 $ 1,854 $ 354 $ 3,030
9. Goodwill and Intangible Assets (cont'd)
49
2015
Brands andtrademarks
Customercontract related
Shareholders'portion of
acquired futureparticipating
account profit Total
CostBalance, beginning of year $ 921 $ 2,592 $ 354 $ 3,867Business acquisitions — 3 — 3Changes in foreign exchange rates 99 424 — 523Balance, end of year $ 1,020 $ 3,019 $ 354 $ 4,393
Accumulated impairmentBalance, beginning of year $ (140) $ (939) $ — $ (1,079)Changes in foreign exchange rates (22) (177) — (199)Balance, end of year $ (162) $ (1,116) $ — $ (1,278)Net carrying amount $ 858 $ 1,903 $ 354 $ 3,115
(ii) Indefinite life intangible assets have been assigned to the cash generating unit groupings as follows:
2016 2015Canada
Individual Insurance/Wealth Management $ 973 $ 973Europe
Insurance and Annuities 216 246United States
Asset Management 1,841 1,896Total $ 3,030 $ 3,115
(iii) Finite life intangible assets:
2016Customercontractrelated
Distributionchannels
Technology/Software Total
Amortization period range 9 - 30 years 30 years 3 - 10 yearsAmortization method Straight-line Straight-line Straight-line
CostBalance, beginning of year $ 810 $ 118 $ 1,106 $ 2,034Additions 39 — 183 222Transfer from indefinite life 3 — — 3Changes in foreign exchange rates (21) (12) (25) (58)Balance, end of year $ 831 $ 106 $ 1,264 $ 2,201
Accumulated amortization and impairmentBalance, beginning of year $ (418) $ (49) $ (646) $ (1,113)Changes in foreign exchange rates 8 5 18 31Amortization (50) (4) (123) (177)Balance, end of year $ (460) $ (48) $ (751) $ (1,259)Net carrying amount $ 371 $ 58 $ 513 $ 942
9. Goodwill and Intangible Assets (cont'd)
50

2015Customercontractrelated
Distributionchannels
Technology/Software Total
Amortization period range 9 - 20 years 30 years 3 - 10 yearsAmortization method Straight-line Straight-line Straight-line
CostBalance, beginning of year $ 745 $ 109 $ 864 $ 1,718Additions — — 161 161Changes in foreign exchange rates 65 9 81 155Balance, end of year $ 810 $ 118 $ 1,106 $ 2,034
Accumulated amortization and impairmentBalance, beginning of year $ (338) $ (42) $ (501) $ (881)Impairment — — (2) (2)Changes in foreign exchange rates (31) (3) (50) (84)Amortization (49) (4) (93) (146)Balance, end of year $ (418) $ (49) $ (646) $ (1,113)Net carrying amount $ 392 $ 69 $ 460 $ 921
The weighted average remaining amortization period of the customer contract related and distributionchannels are 10 and 17 years respectively (9 and 18 years respectively at December 31, 2015).
(c) Recoverable Amount
For the purposes of annual impairment testing, the Company allocates goodwill and indefinite life intangibleassets to cash generating unit groupings. Any potential impairment of goodwill or indefinite life intangibleassets is identified by comparing the recoverable amount of a cash generating unit grouping to its carryingvalue. Recoverable amount is based on fair value less cost of disposal.
Fair value is initially assessed with reference to valuation multiples of comparable publicly-traded financialinstitutions and precedent business acquisitions transactions. These valuation multiples may include price-to-earnings or price-to-book measures for life insurers and asset managers. This assessment may give regardto a variety of relevant considerations, including expected growth, risk and capital market conditions, amongother factors. The valuation multiples used in assessing fair value represent Level 2 inputs.
In the fourth quarter of 2016, the Company conducted its annual impairment testing of goodwill and indefinitelife intangible assets based on September 30, 2016 asset balances. It was determined that the recoverableamounts of cash generating unit groupings were in excess of their carrying values and there was no evidenceof impairment.
Any reasonable changes in assumptions and estimates used in determining recoverable amounts of cashgenerating unit groupings is unlikely to cause carrying values to exceed recoverable amounts.
9. Goodwill and Intangible Assets (cont'd)
51
10. Owner Occupied Properties and Fixed Assets
The carrying value of owner occupied properties and the changes in the carrying value of owner occupied propertiesis as follows:
2016 2015
Carrying value, beginning of year $ 715 $ 671Less: accumulated depreciation/impairments (62) (52)Net carrying value, beginning of year 653 619Additions 21 10Impairments — (1)Disposals (2) (1)Depreciation (10) (9)Foreign exchange (13) 35Net carrying value, end of year $ 649 $ 653
The net carrying value of fixed assets is $304 at December 31, 2016 ($298 at December 31, 2015).
The following provides details of the net carrying value of owner occupied properties and fixed assets by geographiclocation:
2016 2015
Canada $ 548 $ 531United States 270 277Europe 135 143Total $ 953 $ 951
There are no restrictions on the title of the owner occupied properties and fixed assets, nor are they pledged assecurity for debt.
52
11. Other Assets
2016 2015
Deferred acquisition costs $ 597 $ 704Trading account assets (1) 516 590Finance leases receivable 273 293Defined benefit pension plan assets (note 23) 214 250Prepaid expenses 112 103Miscellaneous other assets 551 703Total $ 2,263 $ 2,643
(1) Includes bonds of $141 and stocks of $375 at December 31, 2016 (bonds of $124 and stocks of $466 atDecember 31, 2015).
Total other assets of $1,203 ($1,421 at December 31, 2015) are expected to be realized within 12 months fromthe reporting date. This amount excludes deferred acquisition costs, the changes in which are noted below.
Deferred acquisition costs2016 2015
Balance, beginning of year $ 704 $ 685Additions 93 120Amortization (73) (111)Changes in foreign exchange (74) 66Disposals (53) (56)Balance, end of year $ 597 $ 704
Finance leases receivable
The Company has a finance lease on one property in Canada which has been leased for a 25-year term. TheCompany has two finance leases on properties in Europe. These properties have been leased for a 35-year term.
The finance lease receivable for the three properties, in aggregate, is as follows:
2016
Minimumlease
payments
Present valueof minimum
leasepayments
One year $ 24 $ 23Over one to five years 94 74Over five years 524 176
642 273Less: unearned finance lease income 369 —Total finance leases receivable $ 273 $ 273
The internal rate of return for the leases is fixed at the contract dates and will remain fixed for the duration of thecontract, ranging between 5.4% and 7.5%.
53
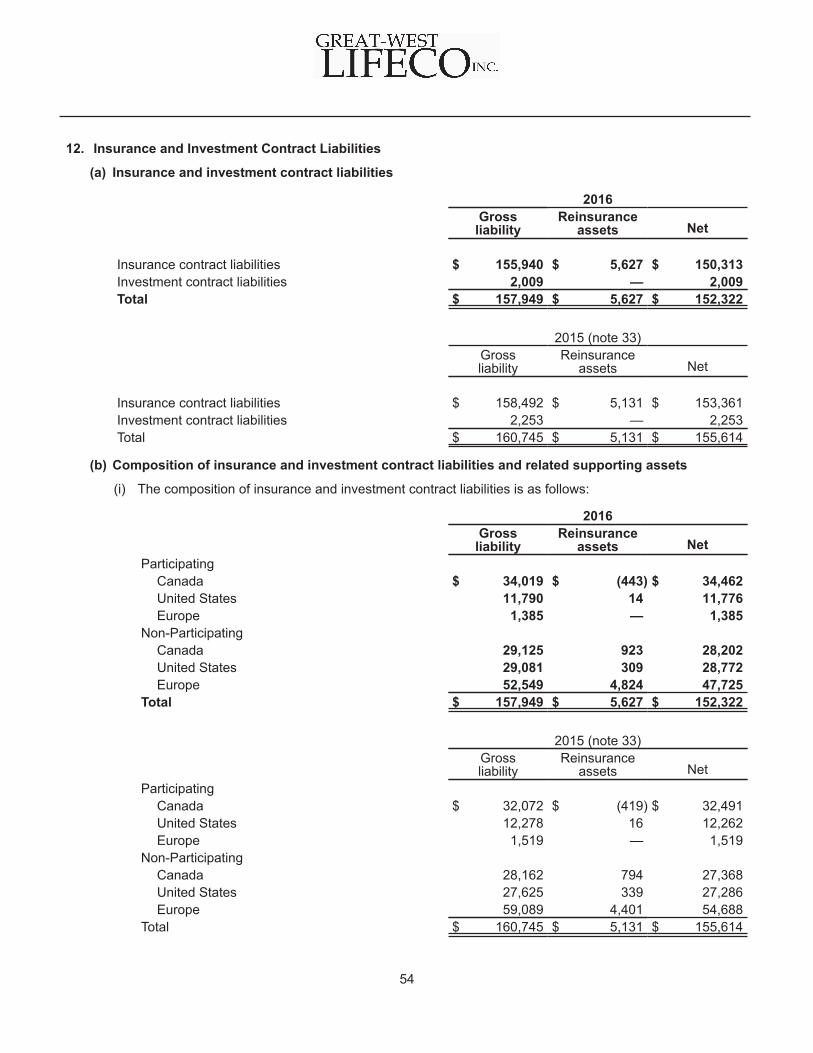
12. Insurance and Investment Contract Liabilities
(a) Insurance and investment contract liabilities
2016Grossliability
Reinsuranceassets Net
Insurance contract liabilities $ 155,940 $ 5,627 $ 150,313Investment contract liabilities 2,009 — 2,009Total $ 157,949 $ 5,627 $ 152,322
2015 (note 33)Grossliability
Reinsuranceassets Net
Insurance contract liabilities $ 158,492 $ 5,131 $ 153,361Investment contract liabilities 2,253 — 2,253Total $ 160,745 $ 5,131 $ 155,614
(b) Composition of insurance and investment contract liabilities and related supporting assets
(i) The composition of insurance and investment contract liabilities is as follows:
2016Grossliability
Reinsuranceassets Net
ParticipatingCanada $ 34,019 $ (443) $ 34,462United States 11,790 14 11,776Europe 1,385 — 1,385
Non-ParticipatingCanada 29,125 923 28,202United States 29,081 309 28,772Europe 52,549 4,824 47,725
Total $ 157,949 $ 5,627 $ 152,322
2015 (note 33)Grossliability
Reinsuranceassets Net
ParticipatingCanada $ 32,072 $ (419) $ 32,491United States 12,278 16 12,262Europe 1,519 — 1,519
Non-ParticipatingCanada 28,162 794 27,368United States 27,625 339 27,286Europe 59,089 4,401 54,688
Total $ 160,745 $ 5,131 $ 155,614
54
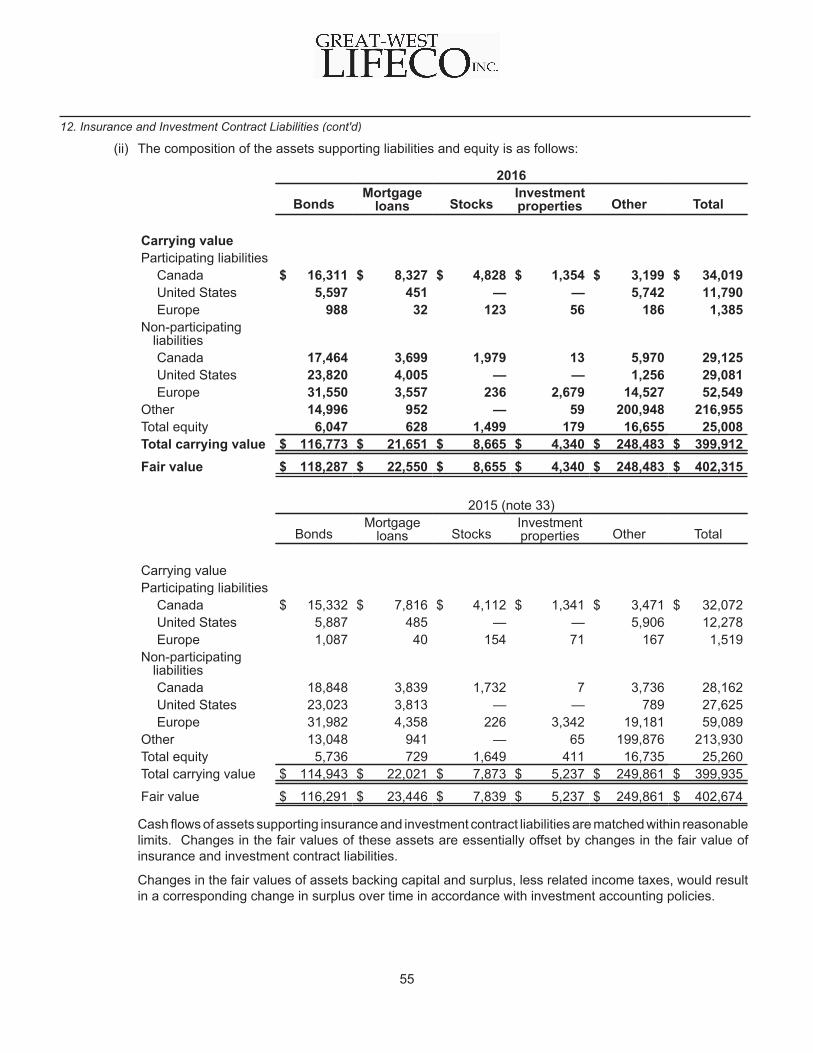
(ii) The composition of the assets supporting liabilities and equity is as follows:
2016
BondsMortgage
loans StocksInvestmentproperties Other Total
Carrying valueParticipating liabilities
Canada $ 16,311 $ 8,327 $ 4,828 $ 1,354 $ 3,199 $ 34,019United States 5,597 451 — — 5,742 11,790Europe 988 32 123 56 186 1,385
Non-participatingliabilitiesCanada 17,464 3,699 1,979 13 5,970 29,125United States 23,820 4,005 — — 1,256 29,081Europe 31,550 3,557 236 2,679 14,527 52,549
Other 14,996 952 — 59 200,948 216,955Total equity 6,047 628 1,499 179 16,655 25,008Total carrying value $ 116,773 $ 21,651 $ 8,665 $ 4,340 $ 248,483 $ 399,912Fair value $ 118,287 $ 22,550 $ 8,655 $ 4,340 $ 248,483 $ 402,315
2015 (note 33)
BondsMortgage
loans StocksInvestmentproperties Other Total
Carrying valueParticipating liabilities
Canada $ 15,332 $ 7,816 $ 4,112 $ 1,341 $ 3,471 $ 32,072United States 5,887 485 — — 5,906 12,278Europe 1,087 40 154 71 167 1,519
Non-participatingliabilitiesCanada 18,848 3,839 1,732 7 3,736 28,162United States 23,023 3,813 — — 789 27,625Europe 31,982 4,358 226 3,342 19,181 59,089
Other 13,048 941 — 65 199,876 213,930Total equity 5,736 729 1,649 411 16,735 25,260Total carrying value $ 114,943 $ 22,021 $ 7,873 $ 5,237 $ 249,861 $ 399,935
Fair value $ 116,291 $ 23,446 $ 7,839 $ 5,237 $ 249,861 $ 402,674
Cash flows of assets supporting insurance and investment contract liabilities are matched within reasonablelimits. Changes in the fair values of these assets are essentially offset by changes in the fair value ofinsurance and investment contract liabilities.
Changes in the fair values of assets backing capital and surplus, less related income taxes, would resultin a corresponding change in surplus over time in accordance with investment accounting policies.
12. Insurance and Investment Contract Liabilities (cont'd)
55
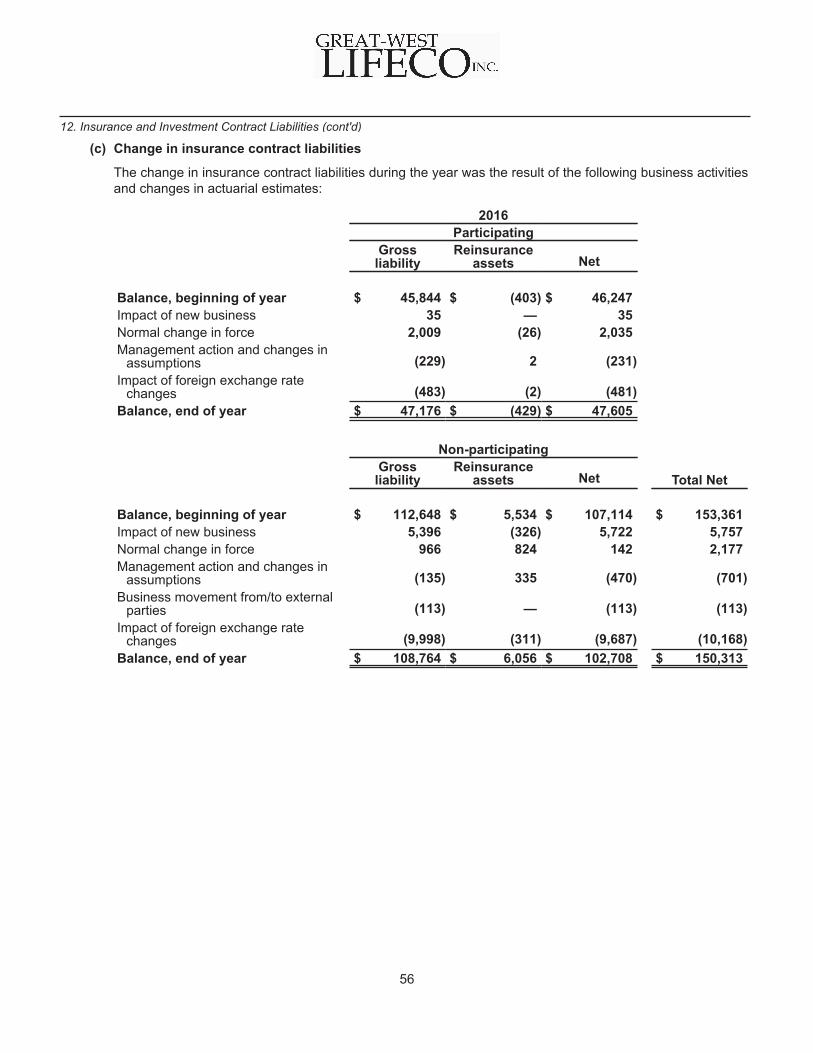
(c) Change in insurance contract liabilities
The change in insurance contract liabilities during the year was the result of the following business activitiesand changes in actuarial estimates:
2016Participating
Grossliability
Reinsuranceassets Net
Balance, beginning of year $ 45,844 $ (403) $ 46,247Impact of new business 35 — 35Normal change in force 2,009 (26) 2,035Management action and changes in
assumptions (229) 2 (231)Impact of foreign exchange rate
changes (483) (2) (481)Balance, end of year $ 47,176 $ (429) $ 47,605
Non-participatingGrossliability
Reinsuranceassets Net Total Net
Balance, beginning of year $ 112,648 $ 5,534 $ 107,114 $ 153,361Impact of new business 5,396 (326) 5,722 5,757Normal change in force 966 824 142 2,177Management action and changes in
assumptions (135) 335 (470) (701)Business movement from/to external
parties (113) — (113) (113)Impact of foreign exchange rate
changes (9,998) (311) (9,687) (10,168)Balance, end of year $ 108,764 $ 6,056 $ 102,708 $ 150,313
12. Insurance and Investment Contract Liabilities (cont'd)
56
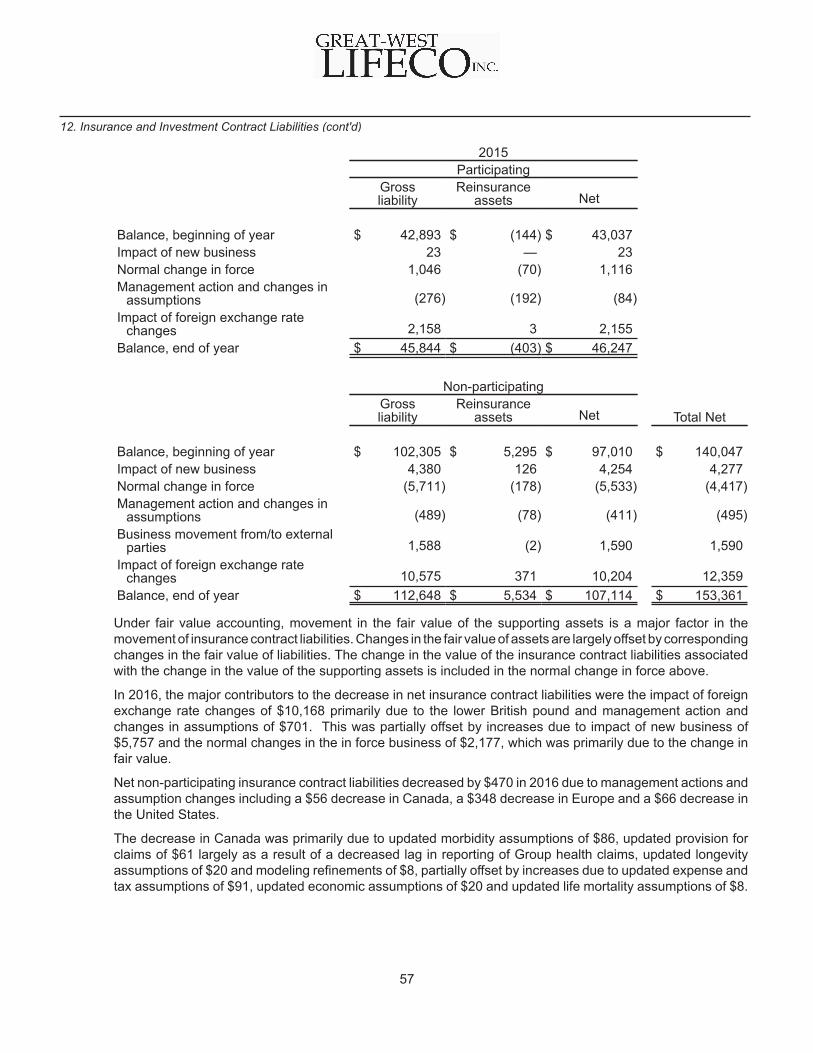
2015Participating
Gross liability
Reinsuranceassets Net
Balance, beginning of year $ 42,893 $ (144) $ 43,037Impact of new business 23 — 23Normal change in force 1,046 (70) 1,116Management action and changes in
assumptions (276) (192) (84)Impact of foreign exchange rate
changes 2,158 3 2,155Balance, end of year $ 45,844 $ (403) $ 46,247
Non-participatingGross liability
Reinsuranceassets Net Total Net
Balance, beginning of year $ 102,305 $ 5,295 $ 97,010 $ 140,047Impact of new business 4,380 126 4,254 4,277Normal change in force (5,711) (178) (5,533) (4,417)Management action and changes in
assumptions (489) (78) (411) (495)Business movement from/to external
parties 1,588 (2) 1,590 1,590Impact of foreign exchange rate
changes 10,575 371 10,204 12,359Balance, end of year $ 112,648 $ 5,534 $ 107,114 $ 153,361
Under fair value accounting, movement in the fair value of the supporting assets is a major factor in themovement of insurance contract liabilities. Changes in the fair value of assets are largely offset by correspondingchanges in the fair value of liabilities. The change in the value of the insurance contract liabilities associatedwith the change in the value of the supporting assets is included in the normal change in force above.
In 2016, the major contributors to the decrease in net insurance contract liabilities were the impact of foreignexchange rate changes of $10,168 primarily due to the lower British pound and management action andchanges in assumptions of $701. This was partially offset by increases due to impact of new business of$5,757 and the normal changes in the in force business of $2,177, which was primarily due to the change infair value.
Net non-participating insurance contract liabilities decreased by $470 in 2016 due to management actions andassumption changes including a $56 decrease in Canada, a $348 decrease in Europe and a $66 decrease inthe United States.
The decrease in Canada was primarily due to updated morbidity assumptions of $86, updated provision forclaims of $61 largely as a result of a decreased lag in reporting of Group health claims, updated longevityassumptions of $20 and modeling refinements of $8, partially offset by increases due to updated expense andtax assumptions of $91, updated economic assumptions of $20 and updated life mortality assumptions of $8.
12. Insurance and Investment Contract Liabilities (cont'd)
57
The decrease in Europe was primarily due to updated longevity assumptions of $207, updated economicassumptions of $165, modeling refinements of $30, updated morbidity assumptions of $17 and updatedpolicyholder behaviour assumptions of $9, partially offset by increases due to updated life mortality assumptionsof $43 and updated expense and tax assumptions of $40.
The discount rate for valuing the reinsurance asset was updated in Ireland. This change in accounting estimateincreased gross liabilities and reinsurance assets by $360 and had no impact on net liabilities or net earnings.
The decrease in the United States was primarily due to updated economic assumptions of $27, updatedlongevity assumptions of $19, updated life mortality assumptions of $17 and modeling refinements of $3.
Net participating insurance contract liabilities decreased by $231 in 2016 due to management actions andassumption changes. The decrease was primarily due to updated expense and tax assumptions of $153,higher investment returns of $102, provisions for future policyholder dividends of $19, updated mortalityassumptions of $13 and updated morbidity assumptions of $2, partially offset by increases due updatedpolicyholder behaviour assumptions of $29 and modeling refinements of $29.
In 2015, the major contributors to the increase in net insurance contract liabilities were the impact of foreignexchange rate changes of $12,359, the impact of new business of $4,277, and business movement from/toexternal parties of $1,590, which was primarily due to the acquisition of Equitable Life’s annuity business duringthe first quarter of 2015, partially offset by decreases due to the normal changes in the in force business of$4,417, which was primarily due to the change in fair value, and management actions and assumption changesof $495.
Net non-participating insurance contract liabilities decreased by $411 in 2015 due to management actions andassumption changes including a $50 decrease in Canada, a $331 decrease in Europe and a $30 decrease inthe United States.
The decrease in Canada was primarily due to updated mortality assumptions of $159, updated economicassumptions of $15 and updated expense and tax assumptions of $12, partially offset by increases due toupdated policyholder behaviour assumptions of $85, and modeling refinements of $49.
The decrease in Europe was primarily due to updated longevity assumptions of $292, updated economicassumptions of $184, updated morbidity assumptions of $12 and updates to other provisions of $10, partiallyoffset by increases due to updated mortality assumptions of $64, updated expense and tax assumptions of$55, modeling refinements of $37 and updated policyholder behaviour assumptions of $11.
The decrease in the United States was primarily due to updated economic assumptions of $30 and updatedmortality assumptions of $8, partially offset by increases due to updated policyholder behaviour assumptionsof $6.
Net participating insurance contract liabilities decreased by $84 in 2015 due to management actions andassumption changes. The decrease was primarily due to provisions for future policyholder dividends of $4,991,updated expense and tax assumptions of $545 and updated mortality assumptions of $412, partially offset byincreases due to lower investment returns of $5,527, updated policyholder behaviour assumptions of $188,and modeling refinements of $149.
12. Insurance and Investment Contract Liabilities (cont'd)
58
(d) Change in investment contract liabilities measured at fair value
2016 2015(note 33)
Balance, beginning of year $ 2,253 $ 922Normal change in force business (220) (89)Investment experience 93 18Management action and changes in assumptions (46) 7Business movement from/to external parties — 1,330Impact of foreign exchange rate changes (71) 65Balance, end of year $ 2,009 $ 2,253
The carrying value of investment contract liabilities approximates their fair value. No investment contractliabilities have been reinsured.
In 2015, business movement from/to external parties is primarily due to a retrocession agreement to assumea block of investment contract liabilities in the form of structured settlements with fixed terms and amount.
(e) Gross premiums written and gross policyholder benefits
(i) Premium Income
2016 2015
Direct premiums $ 23,772 $ 22,120Assumed reinsurance premiums 11,278 6,009Total $ 35,050 $ 28,129
(ii) Policyholder Benefits
2016 2015
Direct $ 16,721 $ 15,880Assumed reinsurance 11,594 6,673Total $ 28,315 $ 22,553
(f) Actuarial Assumptions
In the computation of insurance contract liabilities, valuation assumptions have been made regarding rates ofmortality/morbidity, investment returns, levels of operating expenses, rates of policy termination and rates ofutilization of elective policy options or provisions. The valuation assumptions use best estimates of futureexperience together with a margin for adverse deviation. These margins are necessary to provide forpossibilities of misestimation and/or future deterioration in the best estimate assumptions and providereasonable assurance that insurance contract liabilities cover a range of possible outcomes. Margins arereviewed periodically for continued appropriateness.
The methods for arriving at these valuation assumptions are outlined below:
MortalityA life insurance mortality study is carried out annually for each major block of insurance business. The resultsof each study are used to update the Company’s experience valuation mortality tables for that business. Whenthere is insufficient data, use is made of the latest industry experience to derive an appropriate valuationmortality assumption. Mortality improvement has been projected to occur for the next 25 years. In addition,appropriate provisions have been made for future mortality deterioration on term insurance.
12. Insurance and Investment Contract Liabilities (cont'd)
59
Annuitant mortality is also studied regularly and the results used to modify established industry experienceannuitant mortality tables. Mortality improvement has been projected to occur throughout future years forannuitants.
MorbidityThe Company uses industry developed experience tables modified to reflect emerging Company experience.Both claim incidence and termination are monitored regularly and emerging experience is factored into thecurrent valuation.
Property and casualty reinsuranceInsurance contract liabilities for property and casualty reinsurance written by London Reinsurance Group(LRG), a subsidiary of London Life, are determined using accepted actuarial practices for property and casualtyinsurers in Canada. The insurance contract liabilities have been established using cash flow valuationtechniques including discounting. The insurance contract liabilities are based on cession statements providedby ceding companies. In addition, insurance contract liabilities also include an amount for incurred but notreported losses which may differ significantly from the ultimate loss development. The estimates and underlyingmethodology are continually reviewed and updated, and adjustments to estimates are reflected in earnings.LRG analyzes the emergence of claims experience against expected assumptions for each reinsurancecontract separately and at the portfolio level. If necessary, a more in-depth analysis is undertaken of the cedantexperience.
Investment returnsThe assets which correspond to the different liability categories are segmented. For each segment, projectedcash flows from the current assets and liabilities are used in the Canadian Asset Liability Method to determineinsurance contract liabilities. Cash flows from assets are reduced to provide for asset default losses. Testingunder several interest rate and equity scenarios (including increasing and decreasing rates) is done to providefor reinvestment risk (note 7(c)).
ExpensesContractual policy expenses (e.g. sales commissions) and tax expenses are reflected on a best estimate basis.Expense studies for indirect operating expenses are updated regularly to determine an appropriate estimateof future operating expenses for the liability type being valued. Improvements in unit operating expenses arenot projected. An inflation assumption is incorporated in the estimate of future operating expenses consistentwith the interest rate scenarios projected under the Canadian Asset Liability Method as inflation is assumedto be correlated with new money interest rates.
Policy terminationStudies to determine rates of policy termination are updated regularly to form the basis of this estimate. Industrydata is also available and is useful where the Company has no experience with specific types of policies orits exposure is limited. The Company has significant exposures in respect of the T-100 and Level Cost ofInsurance Universal Life products in Canada and policy renewal rates at the end of term for renewable termpolicies in Canada and Reinsurance. Industry experience has guided the Company's assumptions for theseproducts as the Company's own experience is very limited.
Utilization of elective policy optionsThere are a wide range of elective options embedded in the policies issued by the Company. Examples includeterm renewals, conversion to whole life insurance (term insurance), settlement annuity purchase at guaranteedrates (deposit annuities) and guarantee re-sets (segregated fund maturity guarantees). The assumed rates ofutilization are based on Company or industry experience when it exists and when not on judgment consideringincentives to utilize the option. Generally, whenever it is clearly in the best interests of an informed policyholderto utilize an option, then it is assumed to be elected.
12. Insurance and Investment Contract Liabilities (cont'd)
60
Policyholder dividends and adjustable policy featuresFuture policyholder dividends and other adjustable policy features are included in the determination of insurancecontract liabilities with the assumption that policyholder dividends or adjustable benefits will change in thefuture in response to the relevant experience. The dividend and policy adjustments are determined consistentwith policyholders’ reasonable expectations, such expectations being influenced by the participatingpolicyholder dividend policies and/or policyholder communications, marketing material and past practice. It isthe Company's expectation that changes will occur in policyholder dividend scales or adjustable benefits forparticipating or adjustable business respectively, corresponding to changes in the best estimate assumptions,resulting in an immaterial net change in insurance contract liabilities. Where underlying guarantees may limitthe ability to pass all of this experience back to the policyholder, the impact of this non-adjustability onshareholders' earnings is reflected in the changes in best estimate assumptions above.
(g) Risk Management
(i) Insurance risk
Insurance risk is the risk that the insured event occurs and that there are large deviations between expectedand actual actuarial assumptions including mortality, persistency, longevity, morbidity, expense variationsand investment returns.
The Company is in the business of accepting risk associated with insurance contract liabilities. The objectiveof the Company is to mitigate its exposure to risk arising from these contracts through product design,product and geographical diversification, the implementation of the Company’s underwriting strategyguidelines, and through the use of reinsurance arrangements.
The following provides information about the Company’s insurance contract liabilities sensitivities tomanagement’s best estimate of the approximate impact as a result of changes in assumptions used todetermine the Company’s liability associated with these contracts.
Increase (decrease) innet earnings
2016 2015
Mortality - 2% increase $ (281) $ (282)Annuitant mortality - 2% decrease $ (384) $ (314)Morbidity - 5% adverse change $ (242) $ (225)Investment returns
Parallel shift in yield curve1% increase $ — $ —1% decrease $ — $ —
Change in range of interest rates1% increase $ 149 $ 1091% decrease $ (491) $ (430)
Change in equity markets10% increase $ 43 $ 4510% decrease $ (50) $ (108)
Change in best estimate returns for equities1% increase $ 407 $ 4331% decrease $ (438) $ (457)
Expenses - 5% increase $ (117) $ (108)Policy termination and renewal - 10% adverse change $ (608) $ (602)
12. Insurance and Investment Contract Liabilities (cont'd)
61
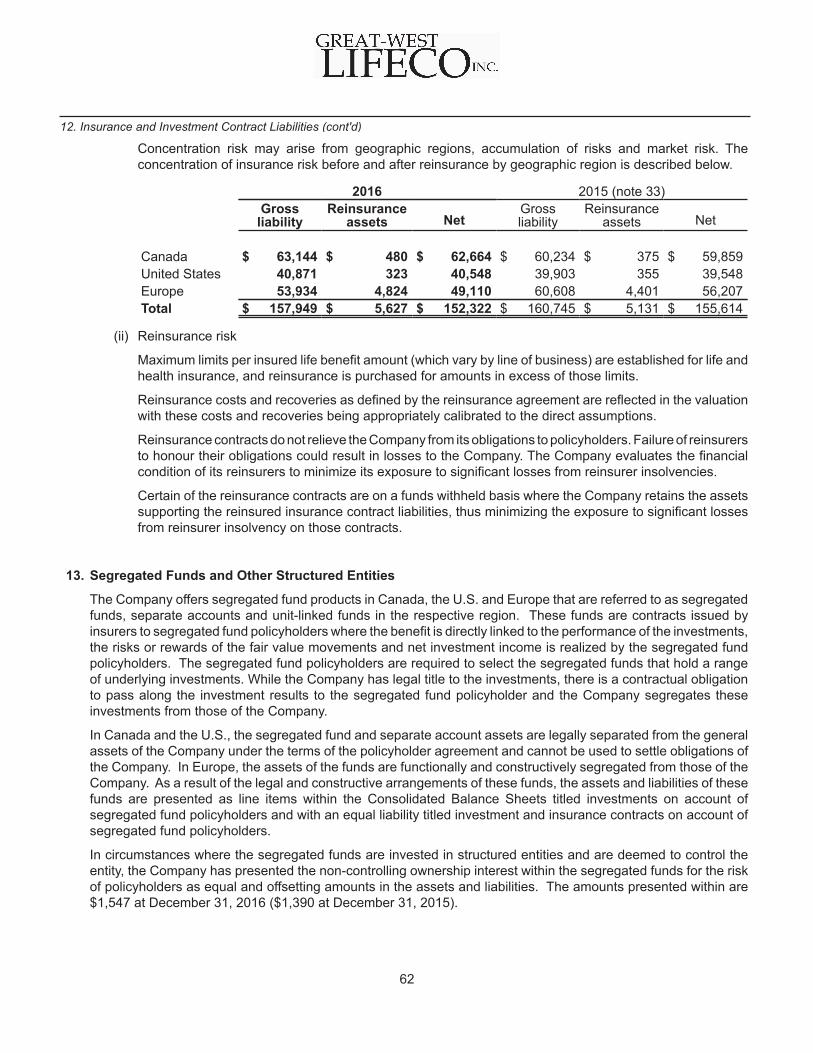
Concentration risk may arise from geographic regions, accumulation of risks and market risk. Theconcentration of insurance risk before and after reinsurance by geographic region is described below.
2016 2015 (note 33)Grossliability
Reinsuranceassets Net
Grossliability
Reinsuranceassets Net
Canada $ 63,144 $ 480 $ 62,664 $ 60,234 $ 375 $ 59,859United States 40,871 323 40,548 39,903 355 39,548Europe 53,934 4,824 49,110 60,608 4,401 56,207Total $ 157,949 $ 5,627 $ 152,322 $ 160,745 $ 5,131 $ 155,614
(ii) Reinsurance risk
Maximum limits per insured life benefit amount (which vary by line of business) are established for life andhealth insurance, and reinsurance is purchased for amounts in excess of those limits.
Reinsurance costs and recoveries as defined by the reinsurance agreement are reflected in the valuationwith these costs and recoveries being appropriately calibrated to the direct assumptions.
Reinsurance contracts do not relieve the Company from its obligations to policyholders. Failure of reinsurersto honour their obligations could result in losses to the Company. The Company evaluates the financialcondition of its reinsurers to minimize its exposure to significant losses from reinsurer insolvencies.
Certain of the reinsurance contracts are on a funds withheld basis where the Company retains the assetssupporting the reinsured insurance contract liabilities, thus minimizing the exposure to significant lossesfrom reinsurer insolvency on those contracts.
12. Insurance and Investment Contract Liabilities (cont'd)
62
13. Segregated Funds and Other Structured Entities
The Company offers segregated fund products in Canada, the U.S. and Europe that are referred to as segregatedfunds, separate accounts and unit-linked funds in the respective region. These funds are contracts issued byinsurers to segregated fund policyholders where the benefit is directly linked to the performance of the investments,the risks or rewards of the fair value movements and net investment income is realized by the segregated fundpolicyholders. The segregated fund policyholders are required to select the segregated funds that hold a rangeof underlying investments. While the Company has legal title to the investments, there is a contractual obligationto pass along the investment results to the segregated fund policyholder and the Company segregates theseinvestments from those of the Company.
In Canada and the U.S., the segregated fund and separate account assets are legally separated from the generalassets of the Company under the terms of the policyholder agreement and cannot be used to settle obligations ofthe Company. In Europe, the assets of the funds are functionally and constructively segregated from those of theCompany. As a result of the legal and constructive arrangements of these funds, the assets and liabilities of thesefunds are presented as line items within the Consolidated Balance Sheets titled investments on account ofsegregated fund policyholders and with an equal liability titled investment and insurance contracts on account ofsegregated fund policyholders.
In circumstances where the segregated funds are invested in structured entities and are deemed to control theentity, the Company has presented the non-controlling ownership interest within the segregated funds for the riskof policyholders as equal and offsetting amounts in the assets and liabilities. The amounts presented within are$1,547 at December 31, 2016 ($1,390 at December 31, 2015).
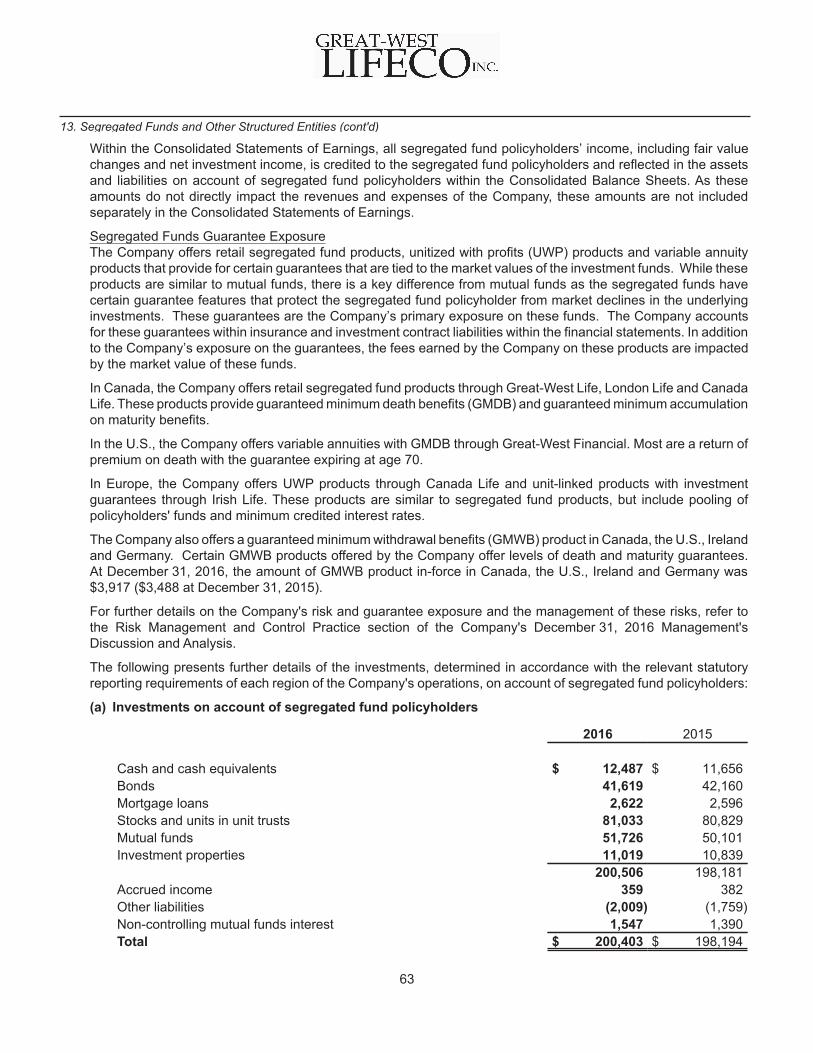
Within the Consolidated Statements of Earnings, all segregated fund policyholders’ income, including fair valuechanges and net investment income, is credited to the segregated fund policyholders and reflected in the assetsand liabilities on account of segregated fund policyholders within the Consolidated Balance Sheets. As theseamounts do not directly impact the revenues and expenses of the Company, these amounts are not includedseparately in the Consolidated Statements of Earnings.
Segregated Funds Guarantee ExposureThe Company offers retail segregated fund products, unitized with profits (UWP) products and variable annuityproducts that provide for certain guarantees that are tied to the market values of the investment funds. While theseproducts are similar to mutual funds, there is a key difference from mutual funds as the segregated funds havecertain guarantee features that protect the segregated fund policyholder from market declines in the underlyinginvestments. These guarantees are the Company’s primary exposure on these funds. The Company accountsfor these guarantees within insurance and investment contract liabilities within the financial statements. In additionto the Company’s exposure on the guarantees, the fees earned by the Company on these products are impactedby the market value of these funds.
In Canada, the Company offers retail segregated fund products through Great-West Life, London Life and CanadaLife. These products provide guaranteed minimum death benefits (GMDB) and guaranteed minimum accumulationon maturity benefits.
In the U.S., the Company offers variable annuities with GMDB through Great-West Financial. Most are a return ofpremium on death with the guarantee expiring at age 70.
In Europe, the Company offers UWP products through Canada Life and unit-linked products with investmentguarantees through Irish Life. These products are similar to segregated fund products, but include pooling ofpolicyholders' funds and minimum credited interest rates.
The Company also offers a guaranteed minimum withdrawal benefits (GMWB) product in Canada, the U.S., Irelandand Germany. Certain GMWB products offered by the Company offer levels of death and maturity guarantees.At December 31, 2016, the amount of GMWB product in-force in Canada, the U.S., Ireland and Germany was$3,917 ($3,488 at December 31, 2015).
For further details on the Company's risk and guarantee exposure and the management of these risks, refer tothe Risk Management and Control Practice section of the Company's December 31, 2016 Management'sDiscussion and Analysis.
The following presents further details of the investments, determined in accordance with the relevant statutoryreporting requirements of each region of the Company's operations, on account of segregated fund policyholders:
(a) Investments on account of segregated fund policyholders
2016 2015
Cash and cash equivalents $ 12,487 $ 11,656Bonds 41,619 42,160Mortgage loans 2,622 2,596Stocks and units in unit trusts 81,033 80,829Mutual funds 51,726 50,101Investment properties 11,019 10,839
200,506 198,181Accrued income 359 382Other liabilities (2,009) (1,759)Non-controlling mutual funds interest 1,547 1,390Total $ 200,403 $ 198,194
13. Segregated Funds and Other Structured Entities (cont'd)
63

(b) Investment and insurance contracts on account of segregated fund policyholders
2016 2015
Balance, beginning of year $ 198,194 $ 174,966Additions (deductions):
Policyholder deposits 21,358 21,592Net investment income 2,379 2,855Net realized capital gains on investments 4,275 4,780Net unrealized capital gains (losses) on investments 6,311 (2,938)Unrealized gains (losses) due to changes in foreign exchange rates (10,584) 12,933Policyholder withdrawals (21,895) (21,934)Business and other acquisitions 193 5,465Segregated fund investment in General Fund 8 43General Fund investment in Segregated Fund (13) (11)Net transfer from General Fund 20 65Non-controlling mutual funds interest 157 378
Total 2,209 23,228Balance, end of year $ 200,403 $ 198,194
(c) Investment income on account of segregated fund policyholders
2016 2015
Net investment income $ 2,379 $ 2,855Net realized capital gains on investments 4,275 4,780Net unrealized capital gains (losses) on investments 6,311 (2,938)Unrealized gains (losses) due to changes in foreign exchange rates (10,584) 12,933Total 2,381 17,630Change in investment and insurance contracts liability on account of
segregated fund policyholders 2,381 17,630Net $ — $ —
(d) Investments on account of segregated fund policyholders by fair value hierarchy level (note 8)
2016Level 1 Level 2 Level 3 Total
Investments on account of segregated fundpolicyholders (1) $ 125,829 $ 63,804 $ 12,045 $ 201,678
(1) Excludes other liabilities, net of other assets, of $1,275.
2015Level 1 Level 2 Level 3 Total
Investments on account of segregated fundpolicyholders (1) $ 120,283 $ 67,333 $ 11,765 $ 199,381
(1) Excludes other liabilities, net of other assets, of $1,187.
13. Segregated Funds and Other Structured Entities (cont'd)
64
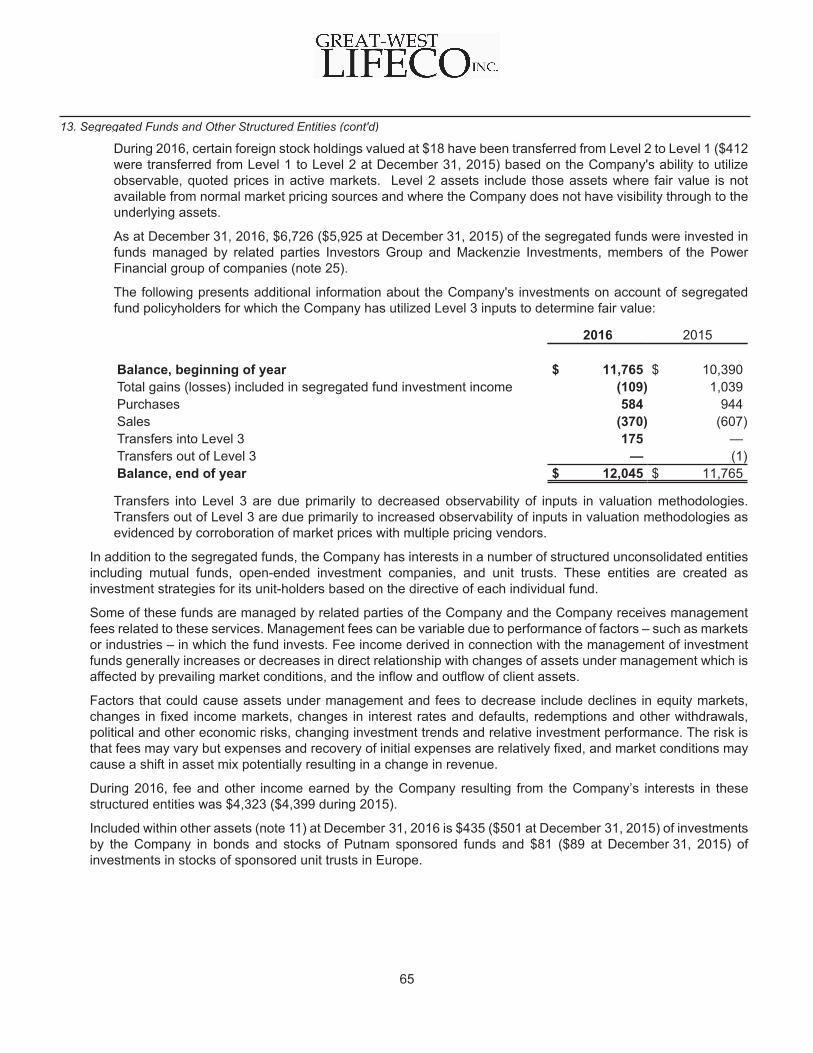
During 2016, certain foreign stock holdings valued at $18 have been transferred from Level 2 to Level 1 ($412were transferred from Level 1 to Level 2 at December 31, 2015) based on the Company's ability to utilizeobservable, quoted prices in active markets. Level 2 assets include those assets where fair value is notavailable from normal market pricing sources and where the Company does not have visibility through to theunderlying assets.
As at December 31, 2016, $6,726 ($5,925 at December 31, 2015) of the segregated funds were invested infunds managed by related parties Investors Group and Mackenzie Investments, members of the PowerFinancial group of companies (note 25).
The following presents additional information about the Company's investments on account of segregatedfund policyholders for which the Company has utilized Level 3 inputs to determine fair value:
2016 2015
Balance, beginning of year $ 11,765 $ 10,390Total gains (losses) included in segregated fund investment income (109) 1,039Purchases 584 944Sales (370) (607)Transfers into Level 3 175 —Transfers out of Level 3 — (1)Balance, end of year $ 12,045 $ 11,765
Transfers into Level 3 are due primarily to decreased observability of inputs in valuation methodologies.Transfers out of Level 3 are due primarily to increased observability of inputs in valuation methodologies asevidenced by corroboration of market prices with multiple pricing vendors.
In addition to the segregated funds, the Company has interests in a number of structured unconsolidated entitiesincluding mutual funds, open-ended investment companies, and unit trusts. These entities are created asinvestment strategies for its unit-holders based on the directive of each individual fund.
Some of these funds are managed by related parties of the Company and the Company receives managementfees related to these services. Management fees can be variable due to performance of factors – such as marketsor industries – in which the fund invests. Fee income derived in connection with the management of investmentfunds generally increases or decreases in direct relationship with changes of assets under management which isaffected by prevailing market conditions, and the inflow and outflow of client assets.
Factors that could cause assets under management and fees to decrease include declines in equity markets,changes in fixed income markets, changes in interest rates and defaults, redemptions and other withdrawals,political and other economic risks, changing investment trends and relative investment performance. The risk isthat fees may vary but expenses and recovery of initial expenses are relatively fixed, and market conditions maycause a shift in asset mix potentially resulting in a change in revenue.
During 2016, fee and other income earned by the Company resulting from the Company’s interests in thesestructured entities was $4,323 ($4,399 during 2015).
Included within other assets (note 11) at December 31, 2016 is $435 ($501 at December 31, 2015) of investmentsby the Company in bonds and stocks of Putnam sponsored funds and $81 ($89 at December 31, 2015) ofinvestments in stocks of sponsored unit trusts in Europe.
13. Segregated Funds and Other Structured Entities (cont'd)
65
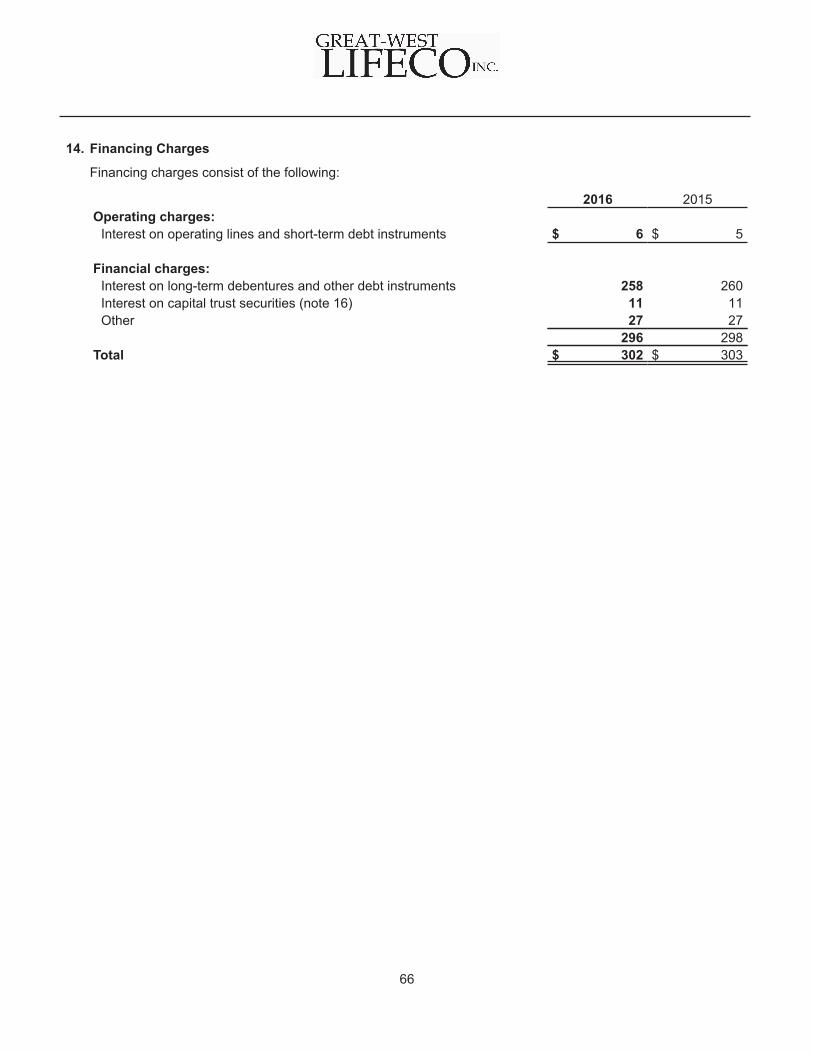
14. Financing Charges
Financing charges consist of the following:
2016 2015Operating charges:
Interest on operating lines and short-term debt instruments $ 6 $ 5
Financial charges:Interest on long-term debentures and other debt instruments 258 260Interest on capital trust securities (note 16) 11 11Other 27 27
296 298Total $ 302 $ 303
66
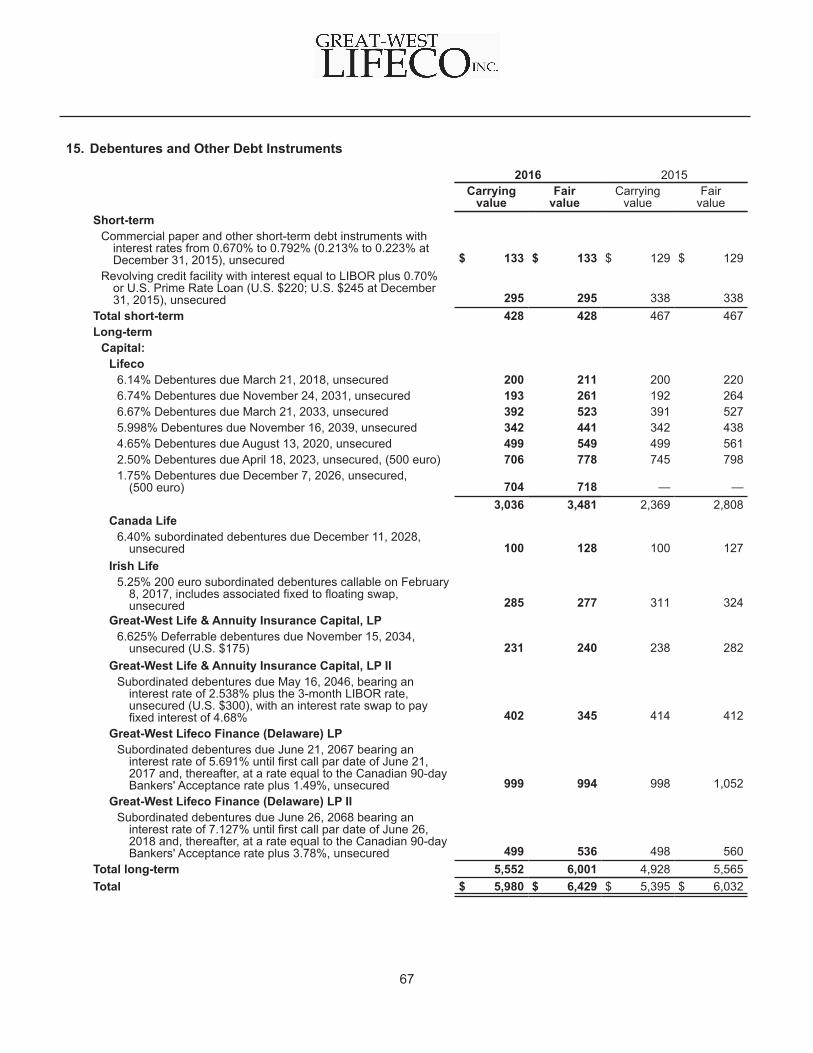
15. Debentures and Other Debt Instruments
2016 2015Carrying
valueFair
valueCarrying
valueFair
valueShort-term
Commercial paper and other short-term debt instruments withinterest rates from 0.670% to 0.792% (0.213% to 0.223% atDecember 31, 2015), unsecured $ 133 $ 133 $ 129 $ 129
Revolving credit facility with interest equal to LIBOR plus 0.70%or U.S. Prime Rate Loan (U.S. $220; U.S. $245 at December31, 2015), unsecured 295 295 338 338
Total short-term 428 428 467 467Long-term
Capital:Lifeco
6.14% Debentures due March 21, 2018, unsecured 200 211 200 2206.74% Debentures due November 24, 2031, unsecured 193 261 192 2646.67% Debentures due March 21, 2033, unsecured 392 523 391 5275.998% Debentures due November 16, 2039, unsecured 342 441 342 4384.65% Debentures due August 13, 2020, unsecured 499 549 499 5612.50% Debentures due April 18, 2023, unsecured, (500 euro) 706 778 745 7981.75% Debentures due December 7, 2026, unsecured,
(500 euro) 704 718 — —3,036 3,481 2,369 2,808
Canada Life6.40% subordinated debentures due December 11, 2028,
unsecured 100 128 100 127Irish Life
5.25% 200 euro subordinated debentures callable on February8, 2017, includes associated fixed to floating swap,unsecured 285 277 311 324
Great-West Life & Annuity Insurance Capital, LP6.625% Deferrable debentures due November 15, 2034,
unsecured (U.S. $175) 231 240 238 282Great-West Life & Annuity Insurance Capital, LP II
Subordinated debentures due May 16, 2046, bearing aninterest rate of 2.538% plus the 3-month LIBOR rate,unsecured (U.S. $300), with an interest rate swap to payfixed interest of 4.68% 402 345 414 412
Great-West Lifeco Finance (Delaware) LPSubordinated debentures due June 21, 2067 bearing an
interest rate of 5.691% until first call par date of June 21,2017 and, thereafter, at a rate equal to the Canadian 90-dayBankers' Acceptance rate plus 1.49%, unsecured 999 994 998 1,052
Great-West Lifeco Finance (Delaware) LP IISubordinated debentures due June 26, 2068 bearing an
interest rate of 7.127% until first call par date of June 26,2018 and, thereafter, at a rate equal to the Canadian 90-dayBankers' Acceptance rate plus 3.78%, unsecured 499 536 498 560
Total long-term 5,552 6,001 4,928 5,565Total $ 5,980 $ 6,429 $ 5,395 $ 6,032
67
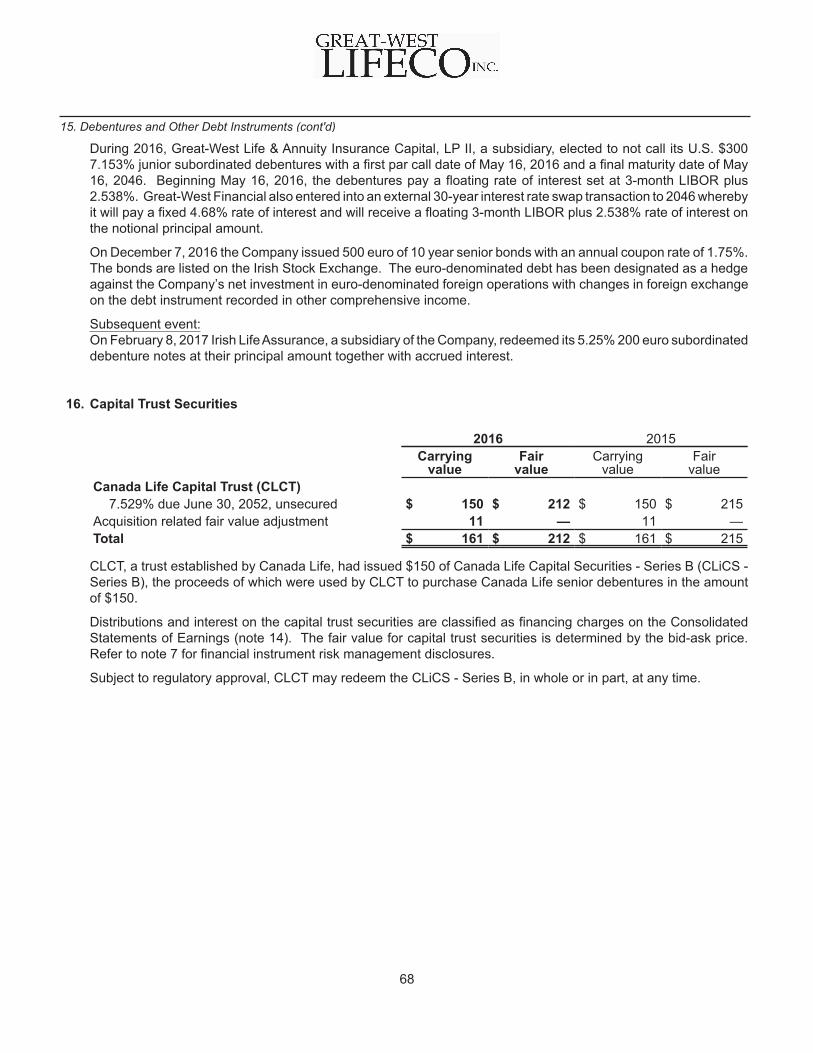
During 2016, Great-West Life & Annuity Insurance Capital, LP II, a subsidiary, elected to not call its U.S. $3007.153% junior subordinated debentures with a first par call date of May 16, 2016 and a final maturity date of May16, 2046. Beginning May 16, 2016, the debentures pay a floating rate of interest set at 3-month LIBOR plus2.538%. Great-West Financial also entered into an external 30-year interest rate swap transaction to 2046 wherebyit will pay a fixed 4.68% rate of interest and will receive a floating 3-month LIBOR plus 2.538% rate of interest onthe notional principal amount.
On December 7, 2016 the Company issued 500 euro of 10 year senior bonds with an annual coupon rate of 1.75%.The bonds are listed on the Irish Stock Exchange. The euro-denominated debt has been designated as a hedgeagainst the Company’s net investment in euro-denominated foreign operations with changes in foreign exchangeon the debt instrument recorded in other comprehensive income.
Subsequent event: On February 8, 2017 Irish Life Assurance, a subsidiary of the Company, redeemed its 5.25% 200 euro subordinateddebenture notes at their principal amount together with accrued interest.
15. Debentures and Other Debt Instruments (cont'd)
68
16. Capital Trust Securities
2016 2015Carrying
valueFair
valueCarrying
valueFair
valueCanada Life Capital Trust (CLCT)
7.529% due June 30, 2052, unsecured $ 150 $ 212 $ 150 $ 215Acquisition related fair value adjustment 11 — 11 —Total $ 161 $ 212 $ 161 $ 215
CLCT, a trust established by Canada Life, had issued $150 of Canada Life Capital Securities - Series B (CLiCS -Series B), the proceeds of which were used by CLCT to purchase Canada Life senior debentures in the amountof $150.
Distributions and interest on the capital trust securities are classified as financing charges on the ConsolidatedStatements of Earnings (note 14). The fair value for capital trust securities is determined by the bid-ask price.Refer to note 7 for financial instrument risk management disclosures.
Subject to regulatory approval, CLCT may redeem the CLiCS - Series B, in whole or in part, at any time.

17. Other Liabilities
2016 2015
Pension and other post-employment benefits (note 23) $ 1,436 $ 1,261Bank overdraft 447 479Deferred income reserve 309 437Other 1,644 1,190Total $ 3,836 $ 3,367
Total other liabilities of $2,091 ($1,669 at December 31, 2015) are expected to be realized within 12 months fromthe reporting date. This amount excludes deferred income reserve, the changes in which are noted below.
Deferred income reserve2016 2015
Balance, beginning of year $ 437 $ 429Additions 29 42Amortization (39) (39)Changes in foreign exchange (76) 51Disposals (42) (46)Balance, end of year $ 309 $ 437
69
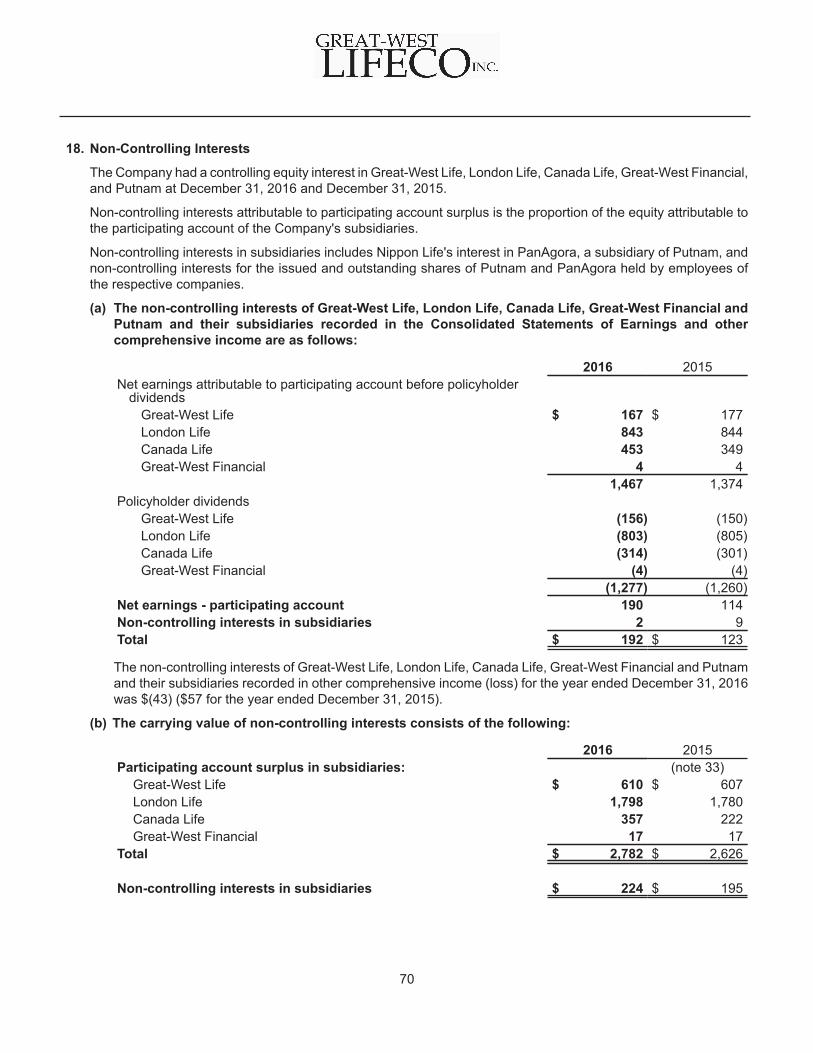
18. Non-Controlling Interests
The Company had a controlling equity interest in Great-West Life, London Life, Canada Life, Great-West Financial,and Putnam at December 31, 2016 and December 31, 2015.
Non-controlling interests attributable to participating account surplus is the proportion of the equity attributable tothe participating account of the Company's subsidiaries.
Non-controlling interests in subsidiaries includes Nippon Life's interest in PanAgora, a subsidiary of Putnam, andnon-controlling interests for the issued and outstanding shares of Putnam and PanAgora held by employees ofthe respective companies.
(a) The non-controlling interests of Great-West Life, London Life, Canada Life, Great-West Financial andPutnam and their subsidiaries recorded in the Consolidated Statements of Earnings and othercomprehensive income are as follows:
2016 2015Net earnings attributable to participating account before policyholder
dividendsGreat-West Life $ 167 $ 177London Life 843 844Canada Life 453 349Great-West Financial 4 4
1,467 1,374Policyholder dividends
Great-West Life (156) (150)London Life (803) (805)Canada Life (314) (301)Great-West Financial (4) (4)
(1,277) (1,260)Net earnings - participating account 190 114Non-controlling interests in subsidiaries 2 9Total $ 192 $ 123
The non-controlling interests of Great-West Life, London Life, Canada Life, Great-West Financial and Putnamand their subsidiaries recorded in other comprehensive income (loss) for the year ended December 31, 2016was $(43) ($57 for the year ended December 31, 2015).
(b) The carrying value of non-controlling interests consists of the following:
2016 2015Participating account surplus in subsidiaries: (note 33)
Great-West Life $ 610 $ 607London Life 1,798 1,780Canada Life 357 222Great-West Financial 17 17
Total $ 2,782 $ 2,626
Non-controlling interests in subsidiaries $ 224 $ 195
70
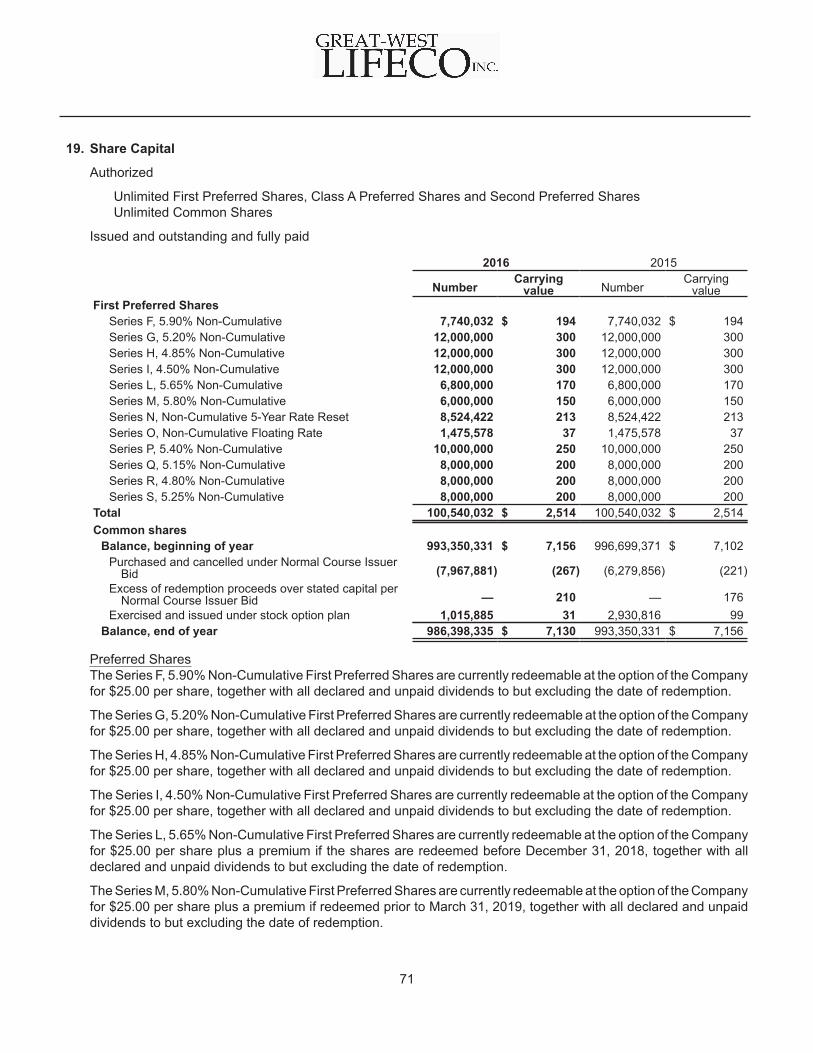
19. Share Capital
Authorized
Unlimited First Preferred Shares, Class A Preferred Shares and Second Preferred SharesUnlimited Common Shares
Issued and outstanding and fully paid
2016 2015
NumberCarrying
value NumberCarrying
valueFirst Preferred Shares
Series F, 5.90% Non-Cumulative 7,740,032 $ 194 7,740,032 $ 194Series G, 5.20% Non-Cumulative 12,000,000 300 12,000,000 300Series H, 4.85% Non-Cumulative 12,000,000 300 12,000,000 300Series I, 4.50% Non-Cumulative 12,000,000 300 12,000,000 300Series L, 5.65% Non-Cumulative 6,800,000 170 6,800,000 170Series M, 5.80% Non-Cumulative 6,000,000 150 6,000,000 150Series N, Non-Cumulative 5-Year Rate Reset 8,524,422 213 8,524,422 213Series O, Non-Cumulative Floating Rate 1,475,578 37 1,475,578 37Series P, 5.40% Non-Cumulative 10,000,000 250 10,000,000 250Series Q, 5.15% Non-Cumulative 8,000,000 200 8,000,000 200Series R, 4.80% Non-Cumulative 8,000,000 200 8,000,000 200Series S, 5.25% Non-Cumulative 8,000,000 200 8,000,000 200
Total 100,540,032 $ 2,514 100,540,032 $ 2,514Common shares
Balance, beginning of year 993,350,331 $ 7,156 996,699,371 $ 7,102Purchased and cancelled under Normal Course Issuer
Bid (7,967,881) (267) (6,279,856) (221)Excess of redemption proceeds over stated capital per
Normal Course Issuer Bid — 210 — 176Exercised and issued under stock option plan 1,015,885 31 2,930,816 99
Balance, end of year 986,398,335 $ 7,130 993,350,331 $ 7,156
Preferred Shares The Series F, 5.90% Non-Cumulative First Preferred Shares are currently redeemable at the option of the Companyfor $25.00 per share, together with all declared and unpaid dividends to but excluding the date of redemption.
The Series G, 5.20% Non-Cumulative First Preferred Shares are currently redeemable at the option of the Companyfor $25.00 per share, together with all declared and unpaid dividends to but excluding the date of redemption.
The Series H, 4.85% Non-Cumulative First Preferred Shares are currently redeemable at the option of the Companyfor $25.00 per share, together with all declared and unpaid dividends to but excluding the date of redemption.
The Series I, 4.50% Non-Cumulative First Preferred Shares are currently redeemable at the option of the Companyfor $25.00 per share, together with all declared and unpaid dividends to but excluding the date of redemption.
The Series L, 5.65% Non-Cumulative First Preferred Shares are currently redeemable at the option of the Companyfor $25.00 per share plus a premium if the shares are redeemed before December 31, 2018, together with alldeclared and unpaid dividends to but excluding the date of redemption.
The Series M, 5.80% Non-Cumulative First Preferred Shares are currently redeemable at the option of the Companyfor $25.00 per share plus a premium if redeemed prior to March 31, 2019, together with all declared and unpaiddividends to but excluding the date of redemption.
71
The Series N, Non-Cumulative 5-Year Rate Reset First Preferred Shares carry an annual fixed dividend rate of2.176% to but excluding December 31, 2020 and are redeemable at the option of the Company on December 31,2020 and on December 31 every five years thereafter for $25.00 per share plus all declared and unpaid dividendsto but excluding the date of redemption. Subject to the Company's right of redemption and certain other restrictionson conversion described in the Series N share conditions, each Series N share is convertible into one Series Oshare at the option of the holders on December 31, 2020 and on December 31 every five years thereafter.
The Series O, Non-Cumulative Floating Rate First Preferred Shares carry a floating dividend rate equal to therelevant Government of Canada Treasury Bill rate plus 1.30% and are redeemable at the option of the Companyfor $25.50 per share, unless the shares are redeemed on December 31, 2020 or on December 31 every five yearsthereafter in which case the redemption price will be $25.00 per share, plus in each case all declared and unpaiddividends to but excluding the date of redemption. Subject to the Company's right of redemption and certain otherrestrictions on conversion described in the Series O share conditions, each Series O share is convertible into oneSeries N share at the option of the holders on December 31, 2020 and on December 31 every five years thereafter.
The Series P, 5.40% Non-Cumulative First Preferred Shares are redeemable at the option of the Company on orafter March 31, 2017 for $25.00 per share plus a premium if redeemed prior to March 31, 2021, together with alldeclared and unpaid dividends up to but excluding the date of redemption.
The Series Q, 5.15% Non-Cumulative First Preferred Shares are redeemable at the option of the Company on orafter September 30, 2017 for $25.00 per share plus a premium if redeemed prior to September 30, 2021, togetherwith all declared and unpaid dividends up to but excluding the date of redemption.
The Series R, 4.80% Non-Cumulative First Preferred Shares are redeemable at the option of the Company on orafter December 31, 2017 for $25.00 per share plus a premium if redeemed prior to December 31, 2021, togetherwith all declared and unpaid dividends up to but excluding the date of redemption.
The Series S, 5.25% Non-Cumulative First Preferred Shares are redeemable at the option of the Company on orafter June 30, 2019 for $25.00 per share plus a premium if redeemed prior to June 30, 2023, together with alldeclared and unpaid dividends up to but excluding the date of redemption.
Common Shares
Normal Course Issuer BidOn January 5, 2016, the Company announced a normal course issuer bid commencing January 8, 2016 andterminating January 7, 2017 to purchase for cancellation up to but not more than 8,000,000 of its common sharesat market prices. On February 22, 2016, the Company announced an amendment to the current normal courseissuer bid allowing the Company to purchase up to 20,000,000 of its common shares at market prices. Theamended normal course issuer bid was effective February 23, 2016 and will continue until January 7, 2017.
On June 17, 2016, the Company announced its intention to purchase for cancellation, up to 5,809,000 of its commonshares pursuant to private agreements between the Company and several arm’s length third-party sellers. Thesepurchases were to be made pursuant to issuer bid exemption orders issued by the Ontario Securities Commission.Any purchases of common shares made by way of private agreements under the orders would be at a discountto the prevailing market price of the common shares on the Toronto Stock Exchange at the time of purchase andall purchases must occur on or before January 7, 2017. As of December 31, 2016 the Company had entered intoa private agreement for the repurchase of 1,600,000 of its common shares.
During 2016, the Company repurchased and subsequently cancelled 7,967,881 common shares pursuant to itsprevious normal course issuer bid at a cost of $267, which includes shares repurchased under a private agreement(6,279,856 during 2015 under the previous normal course issuer bid at a cost of $221). The Company’s sharecapital was reduced by the average carrying value of the shares repurchased for cancellation. The excess paidover the average carrying value of stated capital was $210 and was recognized as a reduction to equity ($176during 2015 under the previous normal course issuer bid).
19. Share Capital (cont'd)
72
Subsequent eventOn January 5, 2017, the Company announced a normal course issuer bid commencing January 9, 2017 andterminating January 8, 2018 to purchase for cancellation up to but not more than 20,000,000 of its common sharesat market prices.
19. Share Capital (cont'd)
73
20. Earnings Per Common Share
The following provides the reconciliation between basic and diluted earnings per common share:
2016 2015EarningsNet earnings $ 2,764 $ 2,888Preferred share dividends (123) (126)Net earnings - common shareholders $ 2,641 $ 2,762
Number of common sharesAverage number of common shares outstanding 989,986,009 995,609,685Add:- Potential exercise of outstanding stock options 1,681,577 2,245,143Average number of common shares outstanding - diluted basis 991,667,586 997,854,828
Basic earnings per common share $ 2.668 $ 2.774
Diluted earnings per common share $ 2.663 $ 2.768
Dividends per common share $ 1.384 $ 1.304
21. Capital Management
(a) Policies and Objectives
Managing capital is the continual process of establishing and maintaining the quantity and quality of capitalappropriate for the Company and ensuring capital is deployed in a manner consistent with the expectationsof the Company’s stakeholders. For these purposes, the Board considers the key stakeholders to be theCompany’s shareholders, policyholders and holders of subordinated liabilities in addition to the relevantregulators in the various jurisdictions where the Company and its subsidiaries operate.
The Company manages its capital on both a consolidated basis as well as at the individual operating subsidiarylevel. The primary objectives of the Company’s capital management strategy are:
• to maintain the capitalization of its regulated operating subsidiaries at a level that will exceed the relevantminimum regulatory capital requirements in the jurisdictions in which they operate;
• to maintain strong credit and financial strength ratings of the Company ensuring stable access to capitalmarkets; and
• to provide an efficient capital structure to maximize shareholders' value in the context of the Company’soperational risks and strategic plans.
The Company has established policies and procedures designed to identify, measure and report all materialrisks. Management is responsible for establishing capital management procedures for implementing andmonitoring the capital plan.
The capital planning process is the responsibility of the Company’s Chief Financial Officer. The capital planis reviewed by the Executive Committee of the Board of Directors and approved by the Company’s Board ofDirectors on an annual basis. The Board of Directors reviews and approves all capital transactions undertakenby management.
The target level of capitalization for the Company and its subsidiaries is assessed by considering variousfactors such as the probability of falling below the minimum regulatory capital requirements in the relevantoperating jurisdiction, the views expressed by various credit rating agencies that provide financial strength andother ratings to the Company, and the desire to hold sufficient capital to be able to honour all policyholder andother obligations of the Company with a high degree of confidence.
(b) Regulatory Capital
In Canada, OSFI has established a capital adequacy measurement for life insurance companies incorporatedunder the Insurance Companies Act (Canada) and their subsidiaries, known as the Minimum Continuing Capitaland Surplus Requirements. For this purpose, various additions or deductions from capital are mandated bythe guidelines issued by OSFI. The following provides a summary of the Minimum Continuing Capital andSurplus Requirements information and ratios for Great-West Life:
2016 2015
Adjusted Net Tier 1 Capital $ 13,071 $ 13,195Net Tier 2 Capital 2,798 2,535Total Capital Available $ 15,869 $ 15,730Total Capital Required $ 6,618 $ 6,599
Tier 1 Ratio 198% 200%Total Ratio 240% 238%
74

At December 31, 2016, the Risk-Based Capital ratio of Great-West Life & Annuity Insurance Company, Lifeco'sregulated U.S. operating company was estimated to be 455% of the Company Action Level set by the NationalAssociation of Insurance Commissioners. Great-West Life & Annuity Insurance Company reports its Risk-Based Capital ratio annually to U.S. insurance regulators.
For entities based in Europe, the local solvency capital regime has changed to the Solvency II basis, effectiveJanuary 1, 2016. During 2016, the Company's regulated European insurance and reinsurance businesseswere developing internal risk models and undertook steps to manage the potential capital volatility under thenew regulations in cooperation with the European regulators. At the end of 2016 all European regulated entitiesmet all capital and solvency requirements as prescribed under Solvency II.
Other foreign operations and foreign subsidiaries of the Company are required to comply with local capital orsolvency requirements in their respective jurisdictions. At December 31, 2016 and December 31, 2015 theCompany maintained capital levels above the minimum local regulatory requirements in each of its other foreignoperations.
21. Capital Management (cont'd)
75
22. Share-Based Payments
(a) The Company has a stock option plan (the Plan) pursuant to which options to subscribe for common sharesof Lifeco may be granted to certain officers and employees of Lifeco and its affiliates. The Company’s HumanResources Committee (the Committee) administers the Plan and, subject to the specific provisions of the Plan,fixes the terms and conditions upon which options are granted. The exercise price of each option grantedunder the Plan is fixed by the Committee, but cannot under any circumstances be less than the weightedaverage trading price per Lifeco common share on the Toronto Stock Exchange for the five trading dayspreceding the date of the grant. Options generally vest over a period of five years, and have a maximumexercise period of ten years. Termination of employment may, in certain circumstances, result in forfeiture ofthe options, unless otherwise determined by the Committee. The maximum number of Lifeco common sharesthat may be issued under the Plan is currently 65,000,000.
During 2016, 3,146,800 common share options were granted (2,793,820 during 2015). The weighted averagefair value of common share options granted during 2016 was $3.87 per option ($5.54 in 2015). The fair valueof each common share option was estimated using the Black-Scholes option-pricing model with the followingweighted average assumptions used for those options granted in 2016: dividend yield 3.99% (3.66% in 2015),expected volatility 19.31% (22.79% in 2015), risk-free interest rate 0.94% (1.09% in 2015), and expected lifeof seven years (seven in 2015).
The following summarizes the changes in options outstanding and the weighted average exercise price:
2016 2015
Options
Weightedaverage
exercise price Options
Weightedaverage
exercise price
Outstanding, beginning of year 14,623,832 $ 30.50 14,995,388 $ 29.18Granted 3,146,800 34.68 2,793,820 35.66Exercised (1,015,885) 27.41 (2,930,816) 28.71Forfeited/expired (226,997) 35.12 (234,560) 30.01
Outstanding, end of year 16,527,750 $ 31.42 14,623,832 $ 30.50Options exercisable at end of year 10,259,325 $ 30.13 9,395,978 $ 29.78
The weighted average share price at the date of exercise of stock options for the year ended December 31,2016 was $35.05 ($35.88 in 2015).
Compensation expense due to the Plan transactions accounted for as equity-settled share-based paymentsof $11 after-tax in 2016 ($10 after-tax in 2015) has been recognized in the Consolidated Statements of Earnings.
The following summarizes information on the ranges of exercise prices including weighted average remainingcontractual life at December 31, 2016:
Outstanding Exercisable
Exercise priceranges Options
Weightedaverage
remainingcontractual
life
Weightedaverageexercise
price Options
Weightedaverageexercise
price Expiry
$23.16 - $37.22 1,174,700 0.19 37.02 1,174,700 37.02 2017$23.16 - $31.27 3,475,717 1.38 30.74 3,475,717 30.74 2018$23.16 - $31.14 268,700 2.53 28.79 268,700 28.79 2019$23.16 - $35.62 666,226 3.37 28.32 666,226 28.32 2020$23.16 - $35.62 1,331,980 4.23 28.31 1,331,980 28.31 2021$23.16 1,415,438 5.16 23.16 1,160,058 23.16 2022$27.13 - $28.36 1,323,259 6.16 27.15 858,779 27.15 2023$30.33 - $33.02 1,338,723 7.19 31.10 602,955 31.11 2024$35.62 - $36.63 2,515,545 8.17 35.66 631,210 35.65 2025$34.68 - $35.52 3,017,462 9.16 34.68 89,000 34.68 2026
(b) In order to promote a greater alignment of interests between Directors and the shareholders of the Company,the Company and certain of its affiliates have established mandatory Deferred Share Unit Plans and/or voluntaryDeferred Share Unit Plans (the “Mandatory DSU Plans” and the “Voluntary DSU Plans” respectively) in whichthe Directors of the Company participate. Under the Mandatory DSU Plans, each Director who is a residentof Canada or the United States is required to receive 50% of his or her annual Board retainer in the form ofDeferred Share Units (DSUs). Under the Voluntary DSU Plans, each Director may elect to receive the balanceof his or her annual Board retainer (including Board Committee fees) and his or her attendance fees entirelyin the form of DSUs, entirely in cash, or equally in cash and DSUs. In both cases the number of DSUs grantedis determined by dividing the amount of remuneration payable to the Director by the weighted average tradingprice per Common Share on the Toronto Stock Exchange for the last five trading days of the preceding fiscalquarter (such weighted average trading price being the "value of a Deferred Share Unit"). Directors receiveadditional DSUs in respect of dividends payable on the Common Shares based on the value of a DeferredShare Unit at that time. DSUs are generally redeemable at the time that an individual ceases to be a Directorby a lump sum cash payment, based on the value of the DSUs on the date of redemption. In 2016, $3 indirectors fees were used to acquire DSUs ($3 in 2015).
(c) Certain employees of the Company are entitled to receive Performance Share Units (PSUs). Under thesePSU plans, these employees are granted PSUs equivalent to the Company’s common shares vesting over athree-year period. Employees receive additional PSUs in respect of dividends payable on the common sharesbased on the value of a PSU at that time. At the maturity date, employees receive cash representing the valueof the PSU at this date. The Company uses the fair-value based method to account for the PSUs granted toemployees under the plan. For the year ended December 31, 2016, the Company recognized compensationexpense of $14 ($12 in 2015) for the PSU plans recorded in operating and administrative expenses on theConsolidated Statements of Earnings. At December 31, 2016, the carrying value of the PSU liability is $27($22 in 2015) recorded within other liabilities.
22. Share-Based Payments (cont'd)
76
(d) The Company's Employee Share Ownership Plan (ESOP) is a voluntary plan where eligible employees cancontribute up to 5% of their previous year’s eligible earnings to purchase common shares of Great-West LifecoInc. The Company matches 50% of the total employee contributions. The contributions from the Companyvest immediately and are expensed. For the year ended December 31, 2016, the Company recognizedcompensation expense of $11 ($10 in 2015) for the ESOP recorded in operating and administrative expenseson the Consolidated Statements of Earnings.
(e) Putnam sponsors the Putnam Investments, LLC Equity Incentive Plan. Under the terms of the Equity IncentivePlan, Putnam is authorized to grant or sell Class B Shares of Putnam (the Putnam Class B Shares), subjectto certain restrictions, and to grant options to purchase Putnam Class B Shares (collectively, the Awards) tocertain senior management and key employees of Putnam at fair value at the time of the award. Fair valueis determined under the valuation methodology outlined in the Equity Incentive Plan. Awards vest over a periodof up to five years and are specified in the individual's award letter. Holders of Putnam Class B Shares are notentitled to vote other than in respect of certain matters in regards to the Equity Incentive Plan and have norights to convert their shares into any other securities. The number of Putnam Class B Shares that may besubject to Awards under the Equity Incentive Plan is limited to 10,555,555.
During 2016, Putnam granted 990,000 (1,525,218 in 2015) restricted Class B common shares and no optionsin 2016 or 2015 to certain members of senior management and key employees.
Compensation expense recorded for the year ended December 31, 2016 related to restricted Class B commonshares and Class B stock options earned was $37 ($36 in 2015) and is recorded in operating and administrativeexpenses on the Consolidated Statements of Earnings.
(f) Certain employees of PanAgora, a subsidiary of Putnam, are eligible to participate in the PanAgoraManagement Equity Plan under which Class C Shares of PanAgora and options and stock appreciation rightson Class C Shares of PanAgora may be issued. Holders of PanAgora Class C Shares are not entitled to voteand have no rights to convert their shares into any other securities. The number of PanAgora Class C Sharesmay not exceed 20% of the equity of PanAgora on a fully exercised and converted basis.
Compensation expense recorded for the year ended December 31, 2016 related to restricted Class C Sharesand stock appreciation rights was $17 in 2016 ($11 in 2015) and is included as a component of operating andadministrative expenses in the Consolidated Statements of Earnings.
22. Share-Based Payments (cont'd)
77
23. Pension Plans and Other Post-Employment Benefits
Characteristics, Funding and RiskThe Company’s subsidiaries maintain contributory and non-contributory defined benefit pension plans for certainemployees and advisors. The Company’s subsidiaries also maintain defined contribution pension plans for certainemployees and advisors.
The defined benefit pension plans provide pensions based on length of service and final average pay. For mostplans, active plan participants share in the cost by making contributions in respect of current service. Certainpension payments are indexed either on an ad hoc basis or a guaranteed basis. The determination of the definedbenefit obligation reflects pension benefits in accordance with the terms of the plans. The assets supporting thefunded pension plans are held in separate trusteed pension funds. The obligations for the wholly unfunded plansare included in other liabilities and are supported by general assets.
The significant defined benefit plans of the Company's subsidiaries are closed to new entrants. New hires areeligible only for defined contribution benefits. The Company's defined benefit plan exposure will continue to bereduced in future years.
The defined contribution pension plans provide pension benefits based on accumulated employee and subsidiarycompany contributions. Subsidiary company contributions to these plans are a set percentage of employees’annual income and may be subject to certain vesting requirements.
The Company’s subsidiaries also provide post-employment health, dental and life insurance benefits to eligibleemployees, advisors and their dependents. Retirees share in the cost of benefits through deductibles, co-insuranceand caps on benefits. These plans are closed to new hires and were previously amended to limit which employeescould become eligible to receive benefits. The amount of some of the post-employment benefits other than pensionsdepends on future cost escalation. These post-employment benefits are not pre-funded and the amount of theobligation for these benefits is included in other liabilities and is supported by general assets.
The Company's subsidiaries have pension and benefit committees or a trusteed arrangement that providesoversight for the benefit plans of the Company's subsidiaries. The benefit plans are monitored on an ongoingbasis to assess the benefit, funding and investment policies, financial status, and funding requirements of theCompany's subsidiaries. Significant changes to the subsidiary company's benefit plans require approval from thatCompany's Board of Directors.
The Company's subsidiaries' funding policy for the funded pension plans is to make contributions equal to or greaterthan those required by the applicable regulations and plan provisions that govern the funding of the plans. Wherefunded plans have a net defined benefit pension plan asset, the Company determines if an economic benefit existsin the form of potential reductions in future contributions by the Company, the present value of future expenses tobe paid from the plan and in the form of surplus refunds, where permitted by applicable regulation and planprovisions.
By their design, the defined benefit plans expose the Company to the typical risks faced by defined benefit planssuch as investment performance, changes to the discount rates used to value the obligations, longevity of planmembers, and future inflation. Pension and benefit risk is managed by regular monitoring of the plans, applicableregulations and other factors that could impact the expenses and cash flows of the Company.
78
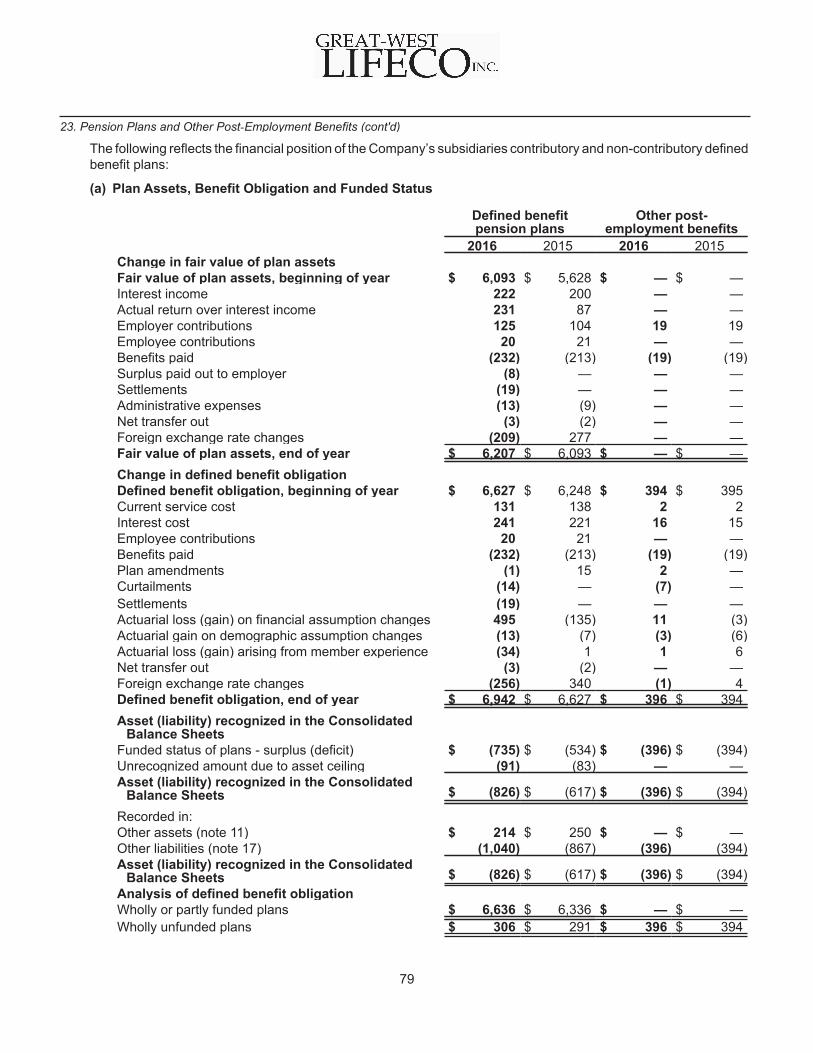
The following reflects the financial position of the Company’s subsidiaries contributory and non-contributory definedbenefit plans:
(a) Plan Assets, Benefit Obligation and Funded Status
Defined benefitpension plans
Other post-employment benefits
2016 2015 2016 2015Change in fair value of plan assetsFair value of plan assets, beginning of year $ 6,093 $ 5,628 $ — $ —Interest income 222 200 — —Actual return over interest income 231 87 — —Employer contributions 125 104 19 19Employee contributions 20 21 — —Benefits paid (232) (213) (19) (19)Surplus paid out to employer (8) — — —Settlements (19) — — —Administrative expenses (13) (9) — —Net transfer out (3) (2) — —Foreign exchange rate changes (209) 277 — —Fair value of plan assets, end of year $ 6,207 $ 6,093 $ — $ —Change in defined benefit obligationDefined benefit obligation, beginning of year $ 6,627 $ 6,248 $ 394 $ 395Current service cost 131 138 2 2Interest cost 241 221 16 15Employee contributions 20 21 — —Benefits paid (232) (213) (19) (19)Plan amendments (1) 15 2 —Curtailments (14) — (7) —Settlements (19) — — —Actuarial loss (gain) on financial assumption changes 495 (135) 11 (3)Actuarial gain on demographic assumption changes (13) (7) (3) (6)Actuarial loss (gain) arising from member experience (34) 1 1 6Net transfer out (3) (2) — —Foreign exchange rate changes (256) 340 (1) 4Defined benefit obligation, end of year $ 6,942 $ 6,627 $ 396 $ 394Asset (liability) recognized in the Consolidated
Balance SheetsFunded status of plans - surplus (deficit) $ (735) $ (534) $ (396) $ (394)Unrecognized amount due to asset ceiling (91) (83) — —Asset (liability) recognized in the Consolidated
Balance Sheets $ (826) $ (617) $ (396) $ (394)
Recorded in:Other assets (note 11) $ 214 $ 250 $ — $ —Other liabilities (note 17) (1,040) (867) (396) (394)Asset (liability) recognized in the Consolidated
Balance Sheets $ (826) $ (617) $ (396) $ (394)Analysis of defined benefit obligationWholly or partly funded plans $ 6,636 $ 6,336 $ — $ —Wholly unfunded plans $ 306 $ 291 $ 396 $ 394
23. Pension Plans and Other Post‑Employment Benefits (cont'd)
79
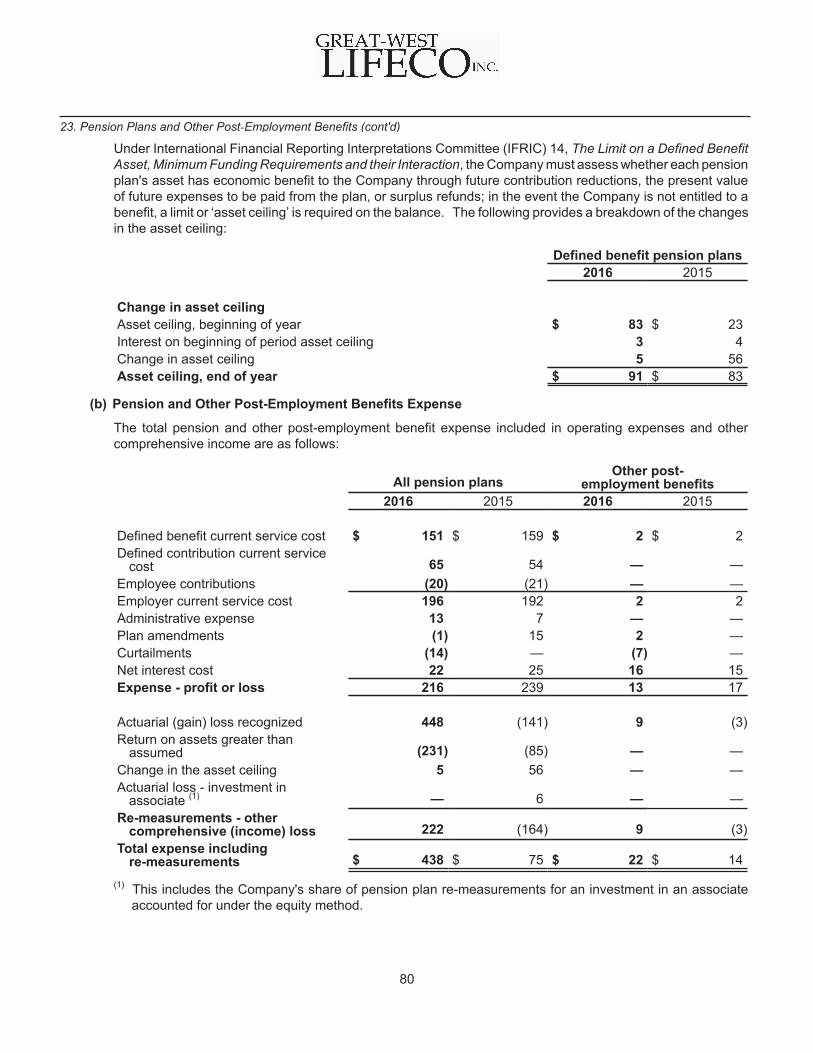
Under International Financial Reporting Interpretations Committee (IFRIC) 14, The Limit on a Defined BenefitAsset, Minimum Funding Requirements and their Interaction, the Company must assess whether each pensionplan's asset has economic benefit to the Company through future contribution reductions, the present valueof future expenses to be paid from the plan, or surplus refunds; in the event the Company is not entitled to abenefit, a limit or ‘asset ceiling’ is required on the balance. The following provides a breakdown of the changesin the asset ceiling:
Defined benefit pension plans2016 2015
Change in asset ceilingAsset ceiling, beginning of year $ 83 $ 23Interest on beginning of period asset ceiling 3 4Change in asset ceiling 5 56Asset ceiling, end of year $ 91 $ 83
(b) Pension and Other Post-Employment Benefits Expense
The total pension and other post-employment benefit expense included in operating expenses and othercomprehensive income are as follows:
All pension plansOther post-
employment benefits2016 2015 2016 2015
Defined benefit current service cost $ 151 $ 159 $ 2 $ 2Defined contribution current service
cost 65 54 — —Employee contributions (20) (21) — —Employer current service cost 196 192 2 2Administrative expense 13 7 — —Plan amendments (1) 15 2 —Curtailments (14) — (7) —Net interest cost 22 25 16 15Expense - profit or loss 216 239 13 17
Actuarial (gain) loss recognized 448 (141) 9 (3)Return on assets greater than
assumed (231) (85) — —Change in the asset ceiling 5 56 — —Actuarial loss - investment in
associate (1) — 6 — —Re-measurements - other
comprehensive (income) loss 222 (164) 9 (3)Total expense including
re-measurements $ 438 $ 75 $ 22 $ 14
(1) This includes the Company's share of pension plan re-measurements for an investment in an associateaccounted for under the equity method.
23. Pension Plans and Other Post‑Employment Benefits (cont'd)
80

(c) Asset Allocation by Major Category Weighted by Plan Assets
Defined benefit pension plans2016 2015
Equity securities 47% 51%Debt securities 41% 36%Real estate 7% 6%Cash and cash equivalents 5% 7%Total 100% 100%
No plan assets are directly invested in the Company’s or related parties’ securities. Plan assets includeinvestments in segregated funds and other funds managed by subsidiaries of the Company of $5,241 atDecember 31, 2016 and $5,207 at December 31, 2015, of which $5,176 ($5,143 at December 31, 2015) areincluded in the Consolidated Balance Sheets. Plan assets do not include any property occupied or otherassets used by the Company.
(d) Details of Defined Benefit Obligation
(i) Portion of Defined Benefit Obligation Subject to Future Salary Increases
Defined benefitpension plans
Other post-employment benefits
2016 2015 2016 2015
Benefit obligation without future salaryincreases $ 6,306 $ 5,987 $ 396 $ 394
Effect of assumed future salary increases 636 640 — —Defined benefit obligation $ 6,942 $ 6,627 $ 396 $ 394
The other post-employment benefits are not subject to future salary increases.
(ii) Portion of Defined Benefit Obligation Without Future Pension Increases
Defined benefitpension plans
Other post-employment benefits
2016 2015 2016 2015
Benefit obligation without future pensionincreases $ 6,515 $ 6,053 $ 396 $ 394
Effect of assumed future pension increases 427 574 — —Defined benefit obligation $ 6,942 $ 6,627 $ 396 $ 394
The other post-employment benefits are not subject to future pension increases.
23. Pension Plans and Other Post‑Employment Benefits (cont'd)
81
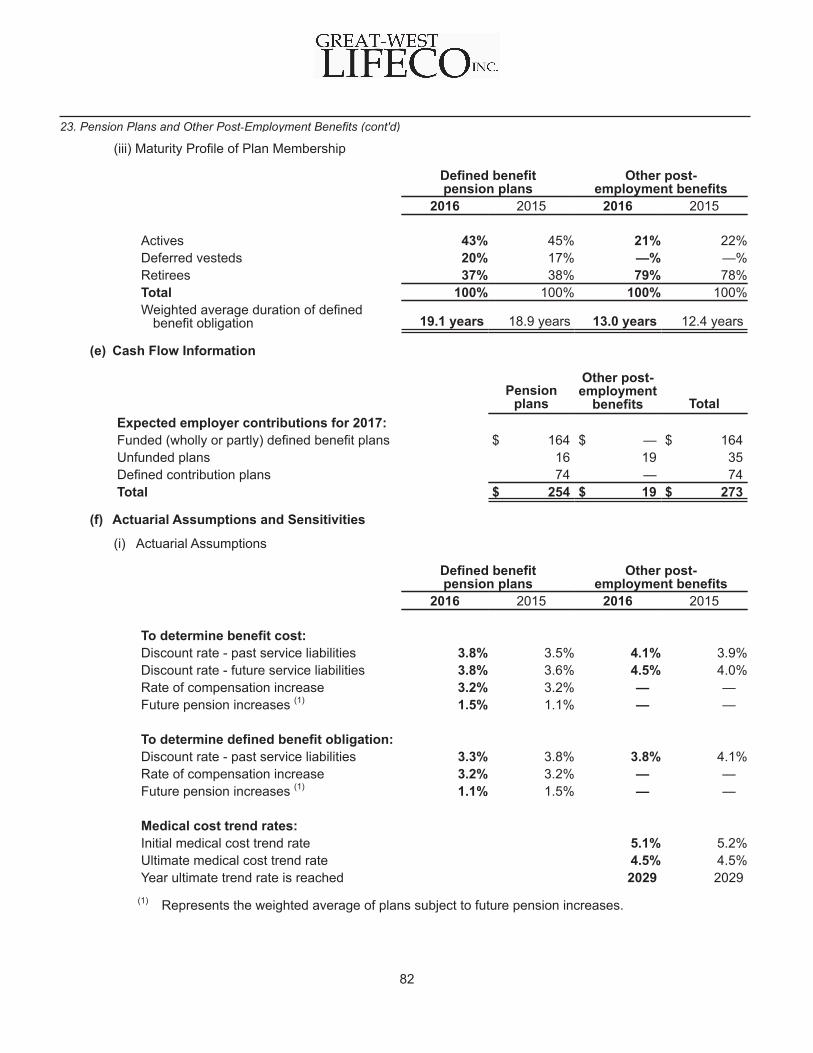
(iii) Maturity Profile of Plan Membership
Defined benefitpension plans
Other post-employment benefits
2016 2015 2016 2015
Actives 43% 45% 21% 22%Deferred vesteds 20% 17% —% —%Retirees 37% 38% 79% 78%Total 100% 100% 100% 100%Weighted average duration of defined
benefit obligation 19.1 years 18.9 years 13.0 years 12.4 years
(e) Cash Flow Information
Pensionplans
Other post-employment
benefits TotalExpected employer contributions for 2017:Funded (wholly or partly) defined benefit plans $ 164 $ — $ 164Unfunded plans 16 19 35Defined contribution plans 74 — 74Total $ 254 $ 19 $ 273
(f) Actuarial Assumptions and Sensitivities
(i) Actuarial Assumptions
Defined benefit pension plans
Other post-employment benefits
2016 2015 2016 2015
To determine benefit cost:Discount rate - past service liabilities 3.8% 3.5% 4.1% 3.9%Discount rate - future service liabilities 3.8% 3.6% 4.5% 4.0%Rate of compensation increase 3.2% 3.2% — —Future pension increases (1) 1.5% 1.1% — —
To determine defined benefit obligation:Discount rate - past service liabilities 3.3% 3.8% 3.8% 4.1%Rate of compensation increase 3.2% 3.2% — —Future pension increases (1) 1.1% 1.5% — —
Medical cost trend rates:Initial medical cost trend rate 5.1% 5.2%Ultimate medical cost trend rate 4.5% 4.5%Year ultimate trend rate is reached 2029 2029
(1) Represents the weighted average of plans subject to future pension increases.
23. Pension Plans and Other Post‑Employment Benefits (cont'd)
82
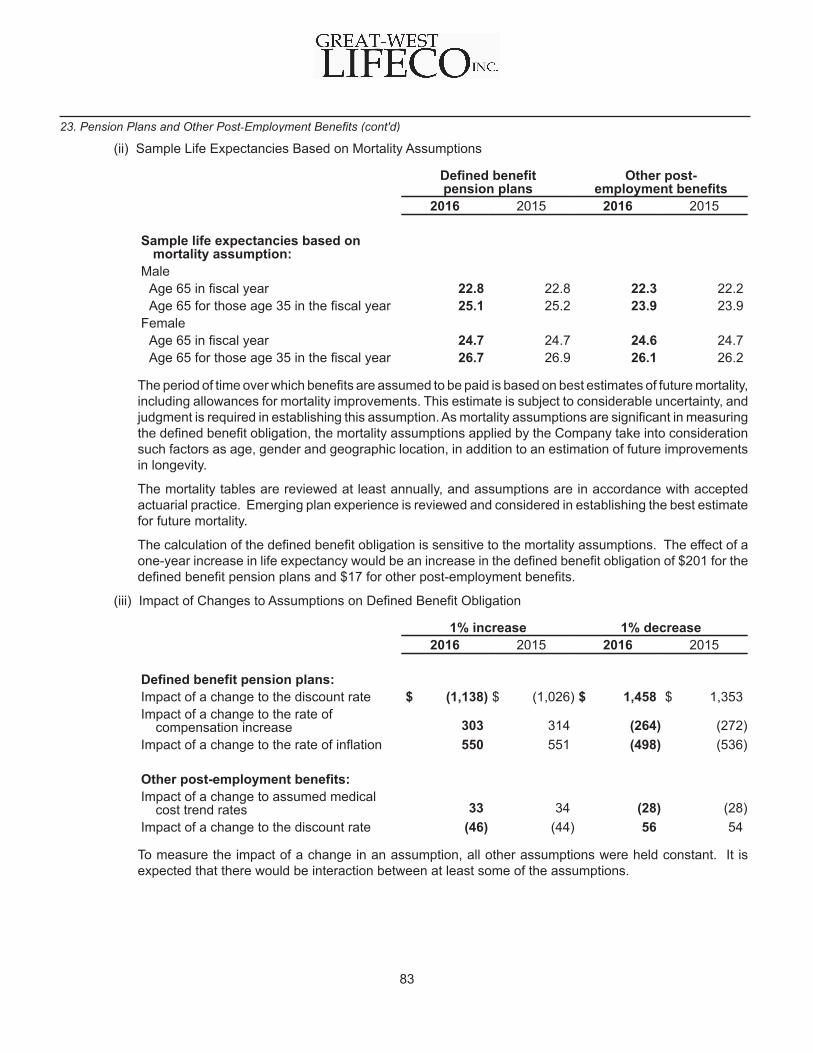
(ii) Sample Life Expectancies Based on Mortality Assumptions
Defined benefit pension plans
Other post-employment benefits
2016 2015 2016 2015
Sample life expectancies based onmortality assumption:
MaleAge 65 in fiscal year 22.8 22.8 22.3 22.2Age 65 for those age 35 in the fiscal year 25.1 25.2 23.9 23.9
FemaleAge 65 in fiscal year 24.7 24.7 24.6 24.7Age 65 for those age 35 in the fiscal year 26.7 26.9 26.1 26.2
The period of time over which benefits are assumed to be paid is based on best estimates of future mortality,including allowances for mortality improvements. This estimate is subject to considerable uncertainty, andjudgment is required in establishing this assumption. As mortality assumptions are significant in measuringthe defined benefit obligation, the mortality assumptions applied by the Company take into considerationsuch factors as age, gender and geographic location, in addition to an estimation of future improvementsin longevity.
The mortality tables are reviewed at least annually, and assumptions are in accordance with acceptedactuarial practice. Emerging plan experience is reviewed and considered in establishing the best estimatefor future mortality.
The calculation of the defined benefit obligation is sensitive to the mortality assumptions. The effect of aone-year increase in life expectancy would be an increase in the defined benefit obligation of $201 for thedefined benefit pension plans and $17 for other post-employment benefits.
(iii) Impact of Changes to Assumptions on Defined Benefit Obligation
1% increase 1% decrease2016 2015 2016 2015
Defined benefit pension plans:Impact of a change to the discount rate $ (1,138) $ (1,026) $ 1,458 $ 1,353Impact of a change to the rate of
compensation increase 303 314 (264) (272)Impact of a change to the rate of inflation 550 551 (498) (536)
Other post-employment benefits:Impact of a change to assumed medical
cost trend rates 33 34 (28) (28)Impact of a change to the discount rate (46) (44) 56 54
To measure the impact of a change in an assumption, all other assumptions were held constant. It isexpected that there would be interaction between at least some of the assumptions.
23. Pension Plans and Other Post‑Employment Benefits (cont'd)
83
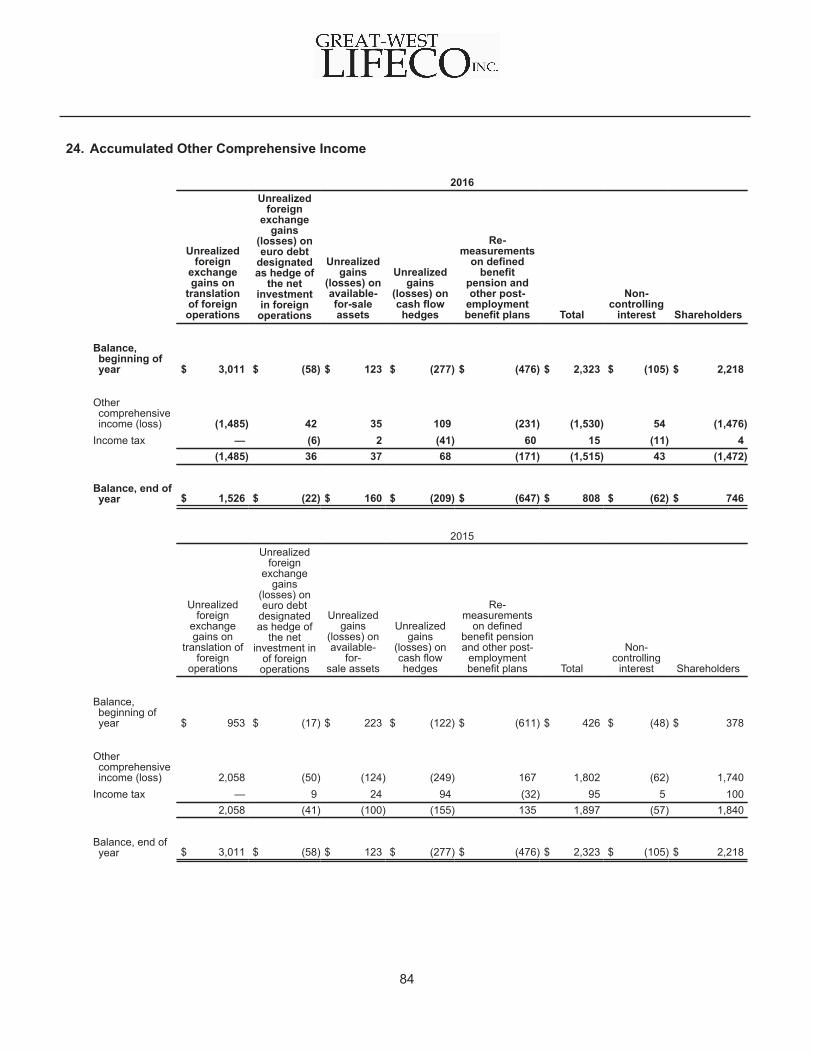
24. Accumulated Other Comprehensive Income
2016
Unrealizedforeign
exchangegains on
translationof foreignoperations
Unrealizedforeign
exchangegains
(losses) oneuro debt
designatedas hedge of
the netinvestmentin foreign
operations
Unrealizedgains
(losses) onavailable-for-saleassets
Unrealizedgains
(losses) oncash flowhedges
Re-measurements
on definedbenefit
pension andother post-
employmentbenefit plans Total
Non-controlling
interest Shareholders
Balance,beginning ofyear $ 3,011 $ (58) $ 123 $ (277) $ (476) $ 2,323 $ (105) $ 2,218
Othercomprehensiveincome (loss) (1,485) 42 35 109 (231) (1,530) 54 (1,476)
Income tax — (6) 2 (41) 60 15 (11) 4(1,485) 36 37 68 (171) (1,515) 43 (1,472)
Balance, end ofyear $ 1,526 $ (22) $ 160 $ (209) $ (647) $ 808 $ (62) $ 746
2015
Unrealizedforeign
exchangegains on
translation offoreign
operations
Unrealizedforeign
exchangegains
(losses) oneuro debt
designatedas hedge of
the netinvestment in
of foreignoperations
Unrealizedgains
(losses) onavailable-
for-sale assets
Unrealizedgains
(losses) oncash flowhedges
Re-measurements
on definedbenefit pensionand other post-
employmentbenefit plans Total
Non-controlling
interest Shareholders
Balance,beginning ofyear $ 953 $ (17) $ 223 $ (122) $ (611) $ 426 $ (48) $ 378
Othercomprehensiveincome (loss) 2,058 (50) (124) (249) 167 1,802 (62) 1,740
Income tax — 9 24 94 (32) 95 5 1002,058 (41) (100) (155) 135 1,897 (57) 1,840
Balance, end ofyear $ 3,011 $ (58) $ 123 $ (277) $ (476) $ 2,323 $ (105) $ 2,218
84
25. Related Party Transactions
Power Financial, which is incorporated and domiciled in Canada, is the Company's parent and has voting controlof the Company. The Company is related to other members of the Power Financial group including IGM FinancialInc., a company in the financial services sector along with its subsidiaries Investors Group, Mackenzie Financialand Investment Planning Council and Pargesa, a holding company with substantial holdings in a diversified industrialgroup based in Europe.
(a) Principal subsidiaries
The financial statements of the Company include the operations of the following subsidiaries and theirsubsidiaries:
Company Incorporated in Primary business operation % HeldThe Great-West Life Assurance Company Canada Insurance and wealth management 100.00%London Life Insurance Company Canada Insurance and wealth management 100.00%The Canada Life Assurance Company Canada Insurance and wealth management 100.00%Great-West Life & Annuity Insurance Company United States Insurance and wealth management 100.00%Putnam Investments, LLC United States Financial services 100.00% (1)
(1) Lifeco holds 100% of the voting shares and 96.2% of the total outstanding shares.
(b) Transactions with related parties included in the consolidated financial statements
In the normal course of business, Great-West Life and Putnam enter into various transactions with relatedcompanies which include providing insurance benefits and sub-advisory services to other companies withinthe Power Financial group of companies. In all cases, transactions were at market terms and conditions.
During the year, Great-West Life provided to and received from IGM and its subsidiaries, a member of thePower Financial group of companies, certain administrative services. Great-West Life also provided lifeinsurance, annuity and disability insurance products under a distribution agreement with IGM. London Lifeprovided distribution services to IGM. All transactions were provided at market terms and conditions.
Segregated funds of the Company were invested in funds managed by Investors Group and MackenzieInvestments. The Company also has interests in mutual funds, open-ended investment companies and unittrusts. Some of these funds are managed by related parties of the Company and the Company receivesmanagement fees related to these services. All transactions were provided at market terms and conditions(note 13).
The Company held debentures issued by IGM; the interest rates and maturity dates are as follows:
2016 2015
6.65%, matures December 13, 2027 $ 16 $ 167.45%, matures May 9, 2031 13 147.00%, matures December 31, 2032 13 13Total $ 42 $ 43
During 2016, the Company purchased residential mortgages of $184 from IGM ($206 in 2015).
In October 2016, the Company made an investment in Portag3 Ventures which invests in the FinTech sector.The investment is a corporate partnership with Power Financial and IGM.
The Company provides asset management, employee benefits and administrative services for employeebenefit plans relating to pension and other post-employment benefits for employees of the Company and itssubsidiaries. These transactions were provided at market terms and conditions.
85

There were no significant outstanding loans or guarantees and no loans or guarantees issued during 2016 or2015. There were no provisions for uncollectible amounts from related parties during 2016 and 2015.
(c) Key management compensation
Key management personnel constitute those individuals that have the authority and responsibility for planning,directing and controlling the activities of Lifeco, directly or indirectly, including any Director. The individualsthat comprise the key management personnel are the Board of Directors as well as certain key managementand officers.
The following describes all compensation paid to, awarded to, or earned by each of the key managementpersonnel for services rendered in all capacities to the Company and its subsidiaries:
2016 2015
Salary $ 15 $ 14Share-based awards 7 11Option-based awards 3 5Annual non-equity incentive plan compensation 21 20Pension value 8 8Total $ 54 $ 58
25. Related Party Transactions (cont'd)
86
26. Income Taxes
(a) Components of the income tax expense
(i) Income tax recognized in Consolidated Statements of Earnings
Current income tax
2016 2015
Current year $ 321 $ 296Previously unrecognized tax loss, tax credit or temporary difference
of prior year (32) —Total current income tax $ 289 $ 296
Deferred income tax
2016 2015
Origination and reversal of temporary differences $ 105 $ 161Effect of changes in tax rates or imposition of new taxes 4 7Write-down or reversal of previous write-down of deferred tax assets 5 —Previously unrecognized tax loss, tax credit or temporary difference
of prior year (7) (4)Total deferred income tax $ 107 $ 164
Total income tax expense $ 396 $ 460
(ii) Income tax recognized in other comprehensive income (note 24)
2016 2015
Current income tax recovery $ (9) $ (2)Deferred income tax recovery (6) (93)Total $ (15) $ (95)
(iii) Income tax recognized in Consolidated Statements of Changes in Equity
2016 2015
Current income tax expense $ — $ —Deferred income tax recovery (1) (2)Total $ (1) $ (2)
(b) The effective income tax rate reported in the Consolidated Statements of Earnings varies from thecombined Canadian federal and provincial income tax rate of 26.75% for the following items:
2016 2015
Earnings before income taxes $ 3,352 $ 3,471Combined basic Canadian federal and provincial tax rate 897 26.75 % 929 26.75 %Increase (decrease) in the income tax rate resulting from:
Non-taxable investment income (198) (5.91)% (220) (6.34)%Lower effective tax rates on income not subject to tax in
Canada (213) (6.35)% (224) (6.45)%Other (81) (2.41)% (28) (0.80)%Impact of rate changes on deferred income taxes (9) (0.27)% 3 0.10 %
Total income tax expense and effective income tax rate $ 396 11.81 % $ 460 13.26 %
26. Income Taxes (cont'd)
87
(c) Composition and changes in net deferred income tax assets are as follows:
2016Insurance and
investmentcontract liabilities
Portfolioinvestments
Lossescarriedforward
Intangibleassets Other Total
Balance, beginning of year $ (1,097) $ (674) $ 1,784 $ (312) $ 604 $ 305Recognized in Statements of
Earnings (140) 42 135 (123) (21) (107)Recognized in Statements of
Comprehensive Income — (18) — — 24 6Recognized in Statements of
Changes in Equity — — — — 1 1Acquired in business
combinations — — 5 (9) — (4)Foreign exchange rate changes
and other 27 3 (39) (2) 10 (1)Balance, end of year $ (1,210) $ (647) $ 1,885 $ (446) $ 618 $ 200
2015 (note 33)Insurance and
investmentcontract liabilities
Portfolioinvestments
Lossescarriedforward
Intangibleassets Other Total
Balance, beginning of year $ (600) $ (869) $ 1,490 $ (151) $ 376 $ 246Recognized in Statements of
Earnings (378) 247 38 (84) 13 (164)Recognized in Statements of
Comprehensive Income — 24 — — 69 93Recognized in Statements of
Changes in Equity — — — — 2 2Foreign exchange rate changes
and other (119) (76) 256 (77) 144 128Balance, end of year $ (1,097) $ (674) $ 1,784 $ (312) $ 604 $ 305
Recorded on Consolidated Balance Sheets: 2016 2015(note 33)
Deferred tax assets $ 1,845 $ 1,891Deferred tax liabilities (1,645) (1,586)Total $ 200 $ 305
A deferred income tax asset is recognized for deductible temporary differences and unused losses andcarryforwards only to the extent that realization of the related income tax benefit through future taxable profitsis probable.
Recognition is based on the fact that it is probable that the entity will have taxable profits and/or tax planningopportunities available to allow the deferred income tax asset to be utilized. Changes in circumstances infuture periods may adversely impact the assessment of the recoverability. The uncertainty of the recoverabilityis taken into account in establishing the deferred income tax assets. The Company's annual financial planningprocess provides a significant basis for the measurement of deferred income tax assets.
26. Income Taxes (cont'd)
88
Management assesses the recoverability of the deferred income tax assets carrying values based on futureyears’ taxable income projections and believes the carrying values of the deferred income tax assets as ofDecember 31, 2016 are recoverable.
At December 31, 2016, the Company has recognized a deferred tax asset of $1,885 ($1,784 at December 31,2015) on tax loss carryforwards totaling $6,874 ($4,951 in 2015). Of this amount, $6,748 expire between 2017and 2036, while $126 have no expiry date. The Company will realize this benefit in future years through areduction in current income taxes payable.
One of the Company’s subsidiaries has had a history of recent losses. The subsidiary has a net deferredincome tax asset balance of $1,262 (U.S. $942) as at December 31, 2016 comprised principally of net operatinglosses and future deductions related to goodwill which has been, in prior years, impaired for accountingpurposes. Management has concluded that it is probable that the subsidiary and other historically profitablesubsidiaries with which it files or intends to file a consolidated U.S. income tax return will generate sufficienttaxable income against which the unused U.S. losses and deductions will be utilized.
The Company has not recognized a deferred tax asset of $23 ($27 in 2015) on tax loss carryforwards totaling$101 ($123 in 2015) that have no expiry date.
A deferred income tax liability has not been recognized in respect of the temporary differences associated withinvestments in subsidiaries, branches and associates as the Company is able to control the timing of thereversal of the temporary differences, and it is probable that the temporary differences will not reverse in theforeseeable future.
26. Income Taxes (cont'd)
89
27. Operating and Administrative Expenses
2016 2015
Salaries and other employee benefits $ 3,122 $ 2,923General and administrative 1,594 1,463Amortization of fixed assets 83 80Total $ 4,799 $ 4,466
28. Restructuring
In 2016, Putnam recorded a restructuring charge of $33, which is recorded in restructuring and acquisition expensesin the Consolidated Statements of Earnings. Of this amount, $19 remains unpaid at December 31, 2016 and isrecorded in other liabilities. This charge reflects expense reductions and a realignment of its resources to bestposition itself for current and future opportunities. The Company expects to pay these remaining amounts during2017.
The expense reductions addressed costs across the Putnam enterprise through a reduction in staff, eliminationof certain non-core business programs and vendor consolidation. As part of this effort, Putnam reduced its staffby nearly eight percent, primarily operations and technology professionals, but also a small number of investmentmanagement professionals.
90
29. Derivative Financial Instruments
In the normal course of managing exposure to fluctuations in interest and foreign exchange rates, and to marketrisks, the Company is an end-user of various derivative financial instruments. It is the Company's policy to transactin derivatives only with the most creditworthy financial intermediaries. Note 7 illustrates the credit quality of theCompany's exposure to counterparties. Credit risk equivalent amounts are presented net of collateral received,including initial margin on exchange-traded derivatives of $159 as at December 31, 2016 ($107 at December 31,2015).
(a) The following summarizes the Company's derivative portfolio and related credit exposure using thefollowing definitions of risk as prescribed by OSFI:
Maximum Credit Risk The total replacement cost of all derivative contracts with positive values.Future Credit Exposure The potential future credit exposure is calculated based on a formula prescribed by
OSFI. The factors prescribed by OSFI for this calculation are based on derivativetype and duration.
Credit Risk Equivalent The sum of maximum credit risk and the potential future credit exposure less anycollateral held.
Risk WeightedEquivalent
Represents the credit risk equivalent, weighted according to the creditworthinessof the counterparty, as prescribed by OSFI.
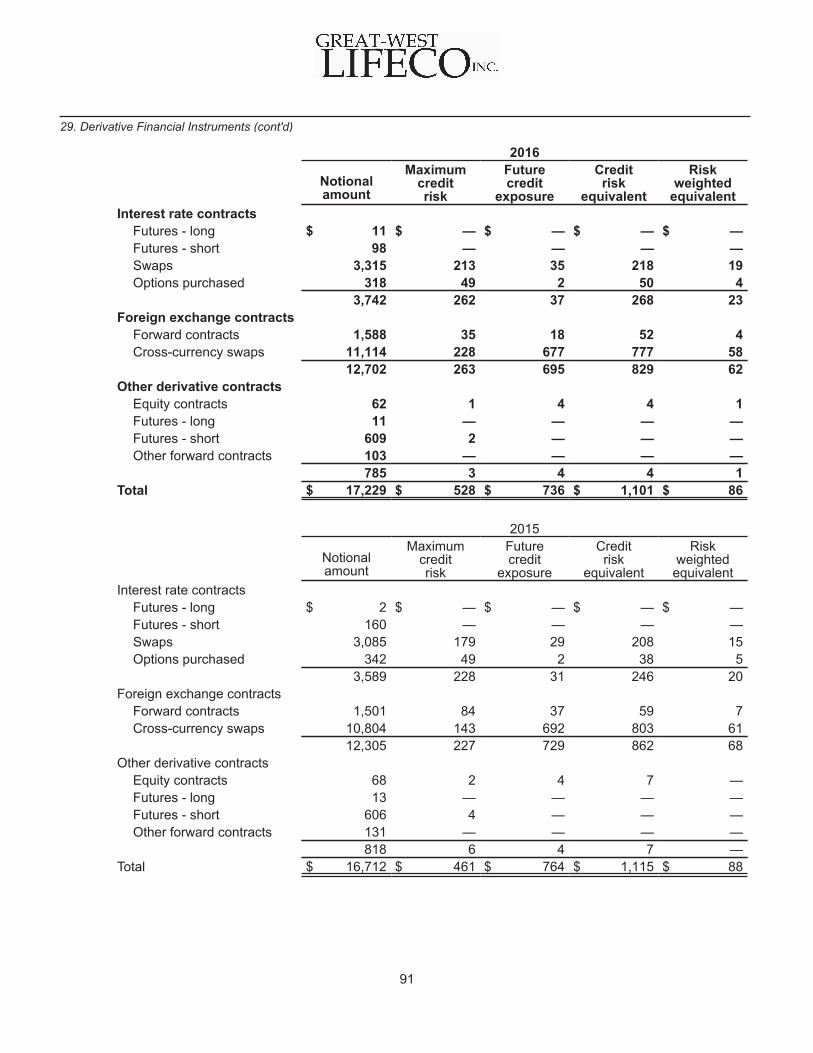
2016
Notionalamount
Maximumcreditrisk
Futurecredit
exposure
Creditrisk
equivalent
Riskweighted
equivalentInterest rate contracts
Futures - long $ 11 $ — $ — $ — $ —Futures - short 98 — — — —Swaps 3,315 213 35 218 19Options purchased 318 49 2 50 4
3,742 262 37 268 23Foreign exchange contracts
Forward contracts 1,588 35 18 52 4Cross-currency swaps 11,114 228 677 777 58
12,702 263 695 829 62Other derivative contracts
Equity contracts 62 1 4 4 1Futures - long 11 — — — —Futures - short 609 2 — — —Other forward contracts 103 — — — —
785 3 4 4 1Total $ 17,229 $ 528 $ 736 $ 1,101 $ 86
2015
Notionalamount
Maximumcreditrisk
Futurecredit
exposure
Creditrisk
equivalent
Riskweighted
equivalentInterest rate contracts
Futures - long $ 2 $ — $ — $ — $ —Futures - short 160 — — — —Swaps 3,085 179 29 208 15Options purchased 342 49 2 38 5
3,589 228 31 246 20Foreign exchange contracts
Forward contracts 1,501 84 37 59 7Cross-currency swaps 10,804 143 692 803 61
12,305 227 729 862 68Other derivative contracts
Equity contracts 68 2 4 7 —Futures - long 13 — — — —Futures - short 606 4 — — —Other forward contracts 131 — — — —
818 6 4 7 —Total $ 16,712 $ 461 $ 764 $ 1,115 $ 88
29. Derivative Financial Instruments (cont'd)
91
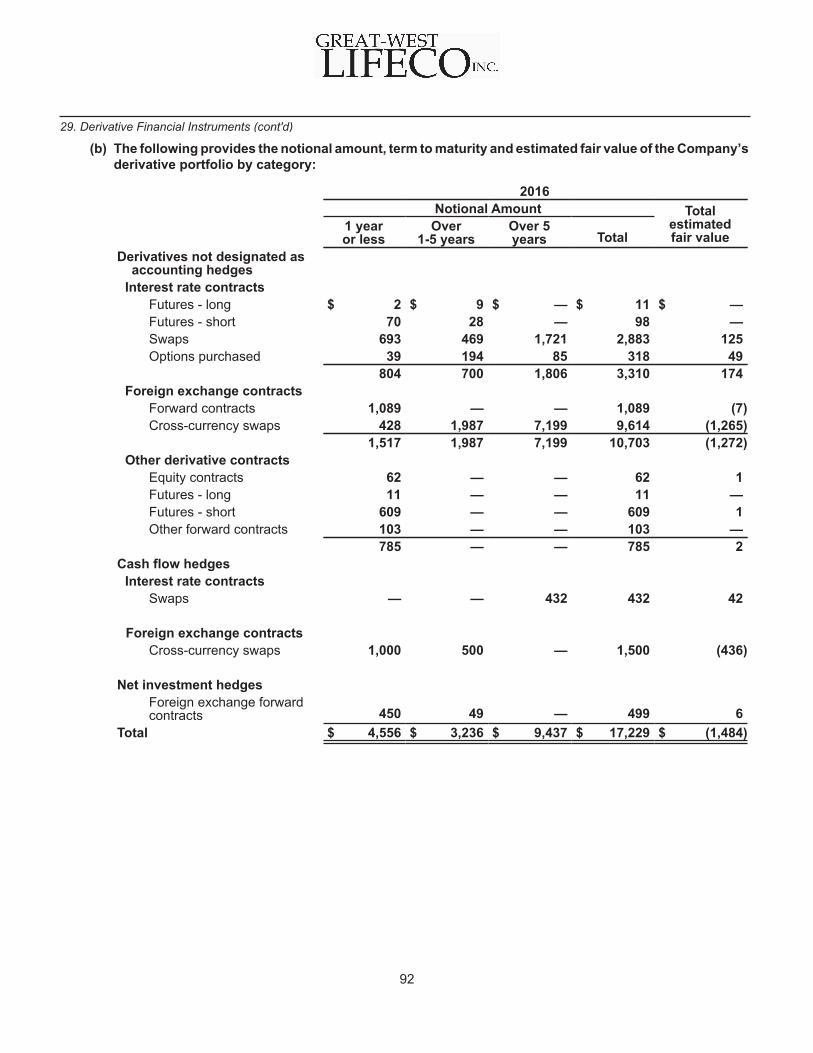
(b) The following provides the notional amount, term to maturity and estimated fair value of the Company’sderivative portfolio by category:
2016Notional Amount Total
estimatedfair value
1 yearor less
Over1-5 years
Over 5years Total
Derivatives not designated asaccounting hedges
Interest rate contractsFutures - long $ 2 $ 9 $ — $ 11 $ —Futures - short 70 28 — 98 —Swaps 693 469 1,721 2,883 125Options purchased 39 194 85 318 49
804 700 1,806 3,310 174Foreign exchange contracts
Forward contracts 1,089 — — 1,089 (7)Cross-currency swaps 428 1,987 7,199 9,614 (1,265)
1,517 1,987 7,199 10,703 (1,272)Other derivative contracts
Equity contracts 62 — — 62 1Futures - long 11 — — 11 —Futures - short 609 — — 609 1Other forward contracts 103 — — 103 —
785 — — 785 2Cash flow hedges
Interest rate contractsSwaps — — 432 432 42
Foreign exchange contractsCross-currency swaps 1,000 500 — 1,500 (436)
Net investment hedgesForeign exchange forwardcontracts 450 49 — 499 6
Total $ 4,556 $ 3,236 $ 9,437 $ 17,229 $ (1,484)
29. Derivative Financial Instruments (cont'd)
92
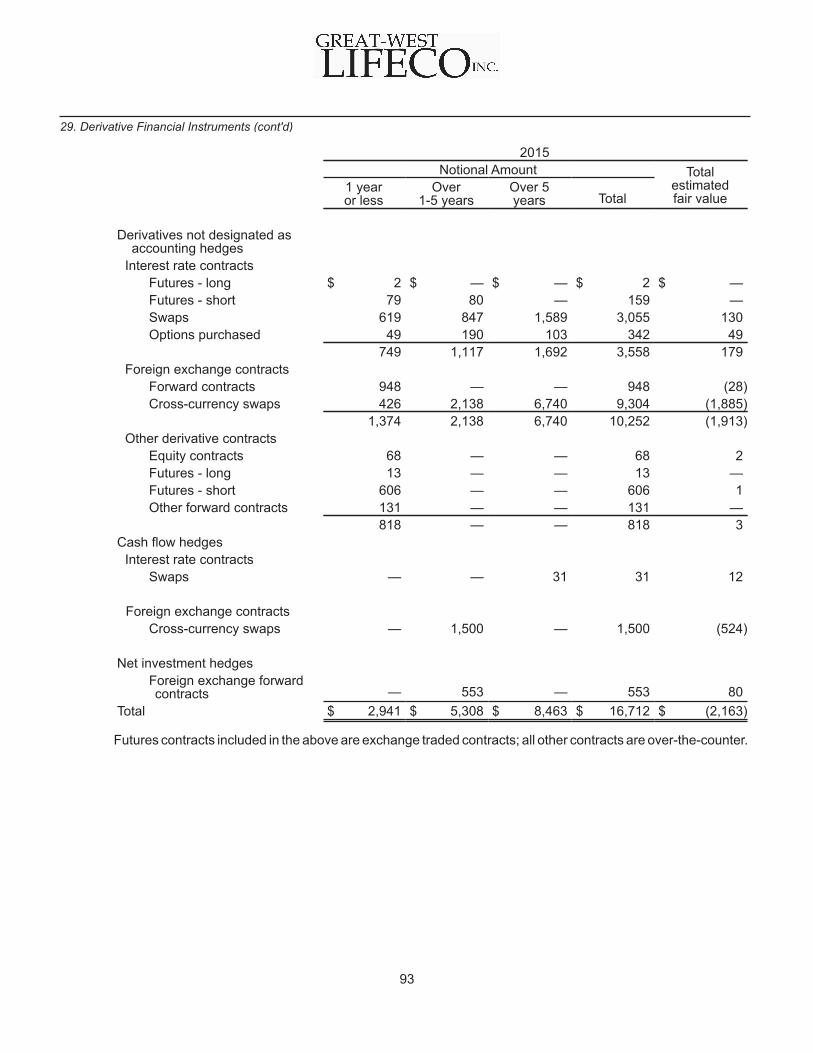
2015Notional Amount Total
estimatedfair value
1 yearor less
Over1-5 years
Over 5years Total
Derivatives not designated asaccounting hedges
Interest rate contractsFutures - long $ 2 $ — $ — $ 2 $ —Futures - short 79 80 — 159 —Swaps 619 847 1,589 3,055 130Options purchased 49 190 103 342 49
749 1,117 1,692 3,558 179Foreign exchange contracts
Forward contracts 948 — — 948 (28)Cross-currency swaps 426 2,138 6,740 9,304 (1,885)
1,374 2,138 6,740 10,252 (1,913)Other derivative contracts
Equity contracts 68 — — 68 2Futures - long 13 — — 13 —Futures - short 606 — — 606 1Other forward contracts 131 — — 131 —
818 — — 818 3Cash flow hedges
Interest rate contractsSwaps — — 31 31 12
Foreign exchange contractsCross-currency swaps — 1,500 — 1,500 (524)
Net investment hedges
Foreign exchange forwardcontracts — 553 — 553 80
Total $ 2,941 $ 5,308 $ 8,463 $ 16,712 $ (2,163)
Futures contracts included in the above are exchange traded contracts; all other contracts are over-the-counter.
29. Derivative Financial Instruments (cont'd)
93
(c) Interest Rate ContractsInterest rate swaps, futures and options are used as part of a portfolio of assets to manage interest rate riskassociated with investment activities and insurance and investment contract liabilities. Interest-rate swapagreements require the periodic exchange of payments without the exchange of the notional principal amounton which payments are based. Call options grant the Company the right to enter into a swap with predeterminedfixed-rate payments over a predetermined time period on the exercise date. Call options are used to managethe variability in future interest payments due to a change in credited interest rates and the related potentialchange in cash flows due to surrenders. Call options are also used to hedge minimum rate guarantees.
Foreign Exchange ContractsCross-currency swaps are used in combination with other investments to manage foreign currency riskassociated with investment activities, and insurance and investment contract liabilities. Under these swapsprincipal amounts and fixed or floating interest payments may be exchanged in different currencies. TheCompany also enters into certain foreign exchange forward contracts to hedge certain product liabilities.
The ineffective portion of the cash flow hedges during 2016, which includes interest rate contracts and foreignexchange contracts, and the anticipated net gains (losses) reclassified out of accumulated other comprehensiveincome within the next twelve months is $1. The maximum time frame for which variable cash flows are hedgedis 29 years.
Other Derivative ContractsEquity index swaps, futures and options are used to hedge certain product liabilities. Equity index swaps arealso used as substitutes for cash instruments and are used to periodically hedge the market risk associatedwith certain fee income. Equity put options are used to manage potential credit risk impact of significantdeclines in certain equity markets.
29. Derivative Financial Instruments (cont'd)
94
30. Legal Provisions and Contingent Liabilities
The Company and its subsidiaries are from time-to-time subject to legal actions, including arbitrations and classactions, arising in the normal course of business. It is inherently difficult to predict the outcome of any of theseproceedings with certainty, and it is possible that an adverse resolution could have a material adverse effect onthe consolidated financial position of the Company. However, based on information presently known, it is notexpected that any of the existing legal actions, either individually or in the aggregate, will have a material adverseeffect on the consolidated financial position of the Company. Actual results could differ from management’s bestestimates.
During the year, a subsidiary of the Company, Canada Life, received the required regulatory approvals and is nowin the final stages of implementing the settlement of the class action related to the four partial declared wind-upsin respect of an Ontario defined benefit pension plan.
A subsidiary of the Company, Putnam Advisory Company, LLC, is a defendant in an action in relation to its role ascollateral manager of a collateralized debt obligation brought by an institution involved in the collateralized debtobligation. On April 28, 2014, the matter was dismissed. On July 2, 2014, the complainant filed an appeal of thedismissal and on April 15, 2015 the United States Court of Appeals for the Second Circuit issued its decisionoverturning the dismissal of the action and remanding the matter for further proceedings, which are ongoing. Theresolution of this matter will not have a material adverse effect on the consolidated financial position of the Company.
Subsidiaries of the Company in the United States are defendants in proposed class actions relating to theadministration of their staff retirement plans, or to the costs and features of certain of their retirement or fundproducts. Management believes the claims are without merit and will be aggressively defending these actions.Based on the information presently known these actions will not have a material adverse effect on the consolidatedfinancial position of the Company.
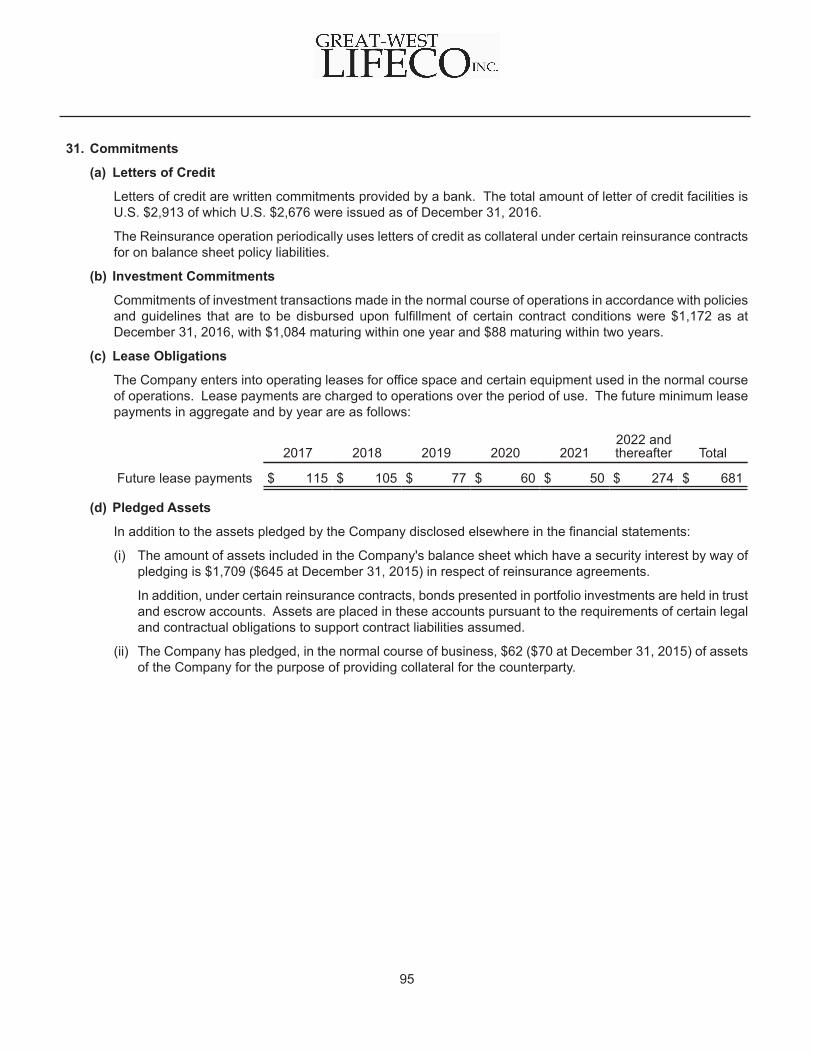
31. Commitments
(a) Letters of Credit
Letters of credit are written commitments provided by a bank. The total amount of letter of credit facilities isU.S. $2,913 of which U.S. $2,676 were issued as of December 31, 2016.
The Reinsurance operation periodically uses letters of credit as collateral under certain reinsurance contractsfor on balance sheet policy liabilities.
(b) Investment Commitments
Commitments of investment transactions made in the normal course of operations in accordance with policiesand guidelines that are to be disbursed upon fulfillment of certain contract conditions were $1,172 as atDecember 31, 2016, with $1,084 maturing within one year and $88 maturing within two years.
(c) Lease Obligations
The Company enters into operating leases for office space and certain equipment used in the normal courseof operations. Lease payments are charged to operations over the period of use. The future minimum leasepayments in aggregate and by year are as follows:
2017 2018 2019 2020 20212022 andthereafter Total
Future lease payments $ 115 $ 105 $ 77 $ 60 $ 50 $ 274 $ 681
(d) Pledged Assets
In addition to the assets pledged by the Company disclosed elsewhere in the financial statements:
(i) The amount of assets included in the Company's balance sheet which have a security interest by way ofpledging is $1,709 ($645 at December 31, 2015) in respect of reinsurance agreements.
In addition, under certain reinsurance contracts, bonds presented in portfolio investments are held in trustand escrow accounts. Assets are placed in these accounts pursuant to the requirements of certain legaland contractual obligations to support contract liabilities assumed.
(ii) The Company has pledged, in the normal course of business, $62 ($70 at December 31, 2015) of assetsof the Company for the purpose of providing collateral for the counterparty.
95
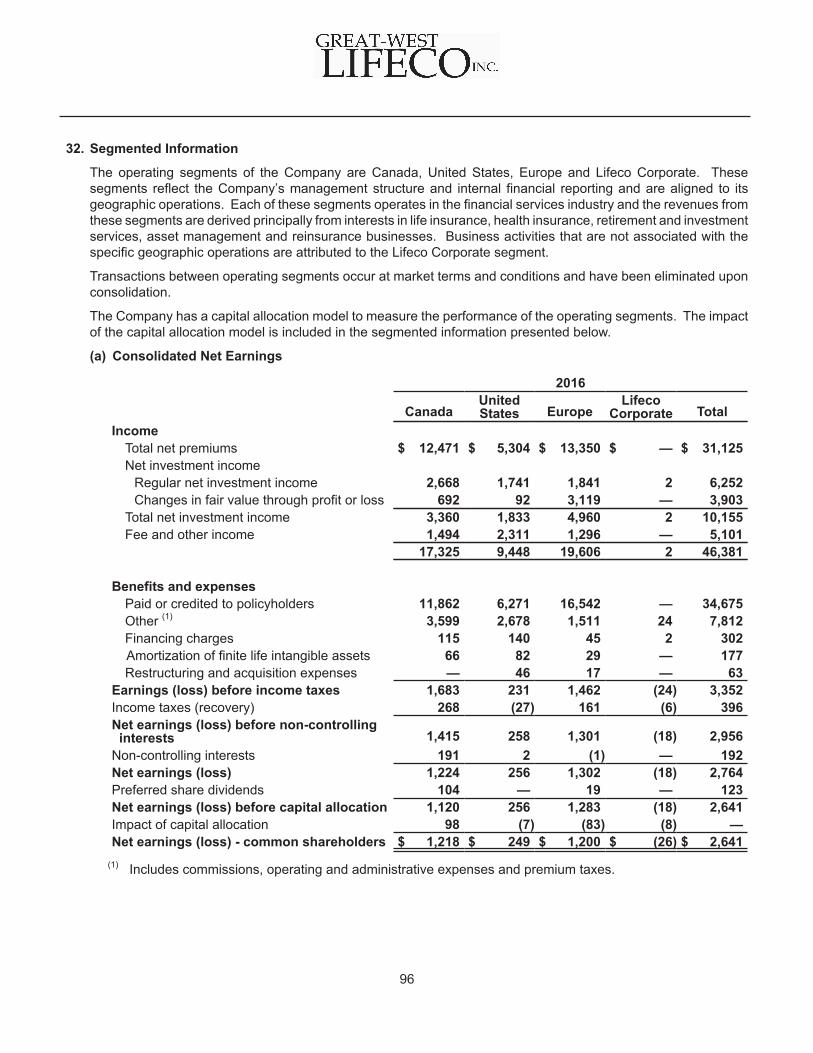
32. Segmented Information
The operating segments of the Company are Canada, United States, Europe and Lifeco Corporate. Thesesegments reflect the Company’s management structure and internal financial reporting and are aligned to itsgeographic operations. Each of these segments operates in the financial services industry and the revenues fromthese segments are derived principally from interests in life insurance, health insurance, retirement and investmentservices, asset management and reinsurance businesses. Business activities that are not associated with thespecific geographic operations are attributed to the Lifeco Corporate segment.
Transactions between operating segments occur at market terms and conditions and have been eliminated uponconsolidation.
The Company has a capital allocation model to measure the performance of the operating segments. The impactof the capital allocation model is included in the segmented information presented below.
(a) Consolidated Net Earnings
2016
CanadaUnitedStates Europe
LifecoCorporate Total
IncomeTotal net premiums $ 12,471 $ 5,304 $ 13,350 $ — $ 31,125Net investment income
Regular net investment income 2,668 1,741 1,841 2 6,252Changes in fair value through profit or loss 692 92 3,119 — 3,903
Total net investment income 3,360 1,833 4,960 2 10,155Fee and other income 1,494 2,311 1,296 — 5,101
17,325 9,448 19,606 2 46,381
Benefits and expensesPaid or credited to policyholders 11,862 6,271 16,542 — 34,675Other (1) 3,599 2,678 1,511 24 7,812Financing charges 115 140 45 2 302Amortization of finite life intangible assets 66 82 29 — 177Restructuring and acquisition expenses — 46 17 — 63
Earnings (loss) before income taxes 1,683 231 1,462 (24) 3,352Income taxes (recovery) 268 (27) 161 (6) 396Net earnings (loss) before non-controlling interests 1,415 258 1,301 (18) 2,956Non-controlling interests 191 2 (1) — 192Net earnings (loss) 1,224 256 1,302 (18) 2,764Preferred share dividends 104 — 19 — 123Net earnings (loss) before capital allocation 1,120 256 1,283 (18) 2,641Impact of capital allocation 98 (7) (83) (8) —Net earnings (loss) - common shareholders $ 1,218 $ 249 $ 1,200 $ (26) $ 2,641
(1) Includes commissions, operating and administrative expenses and premium taxes.
96
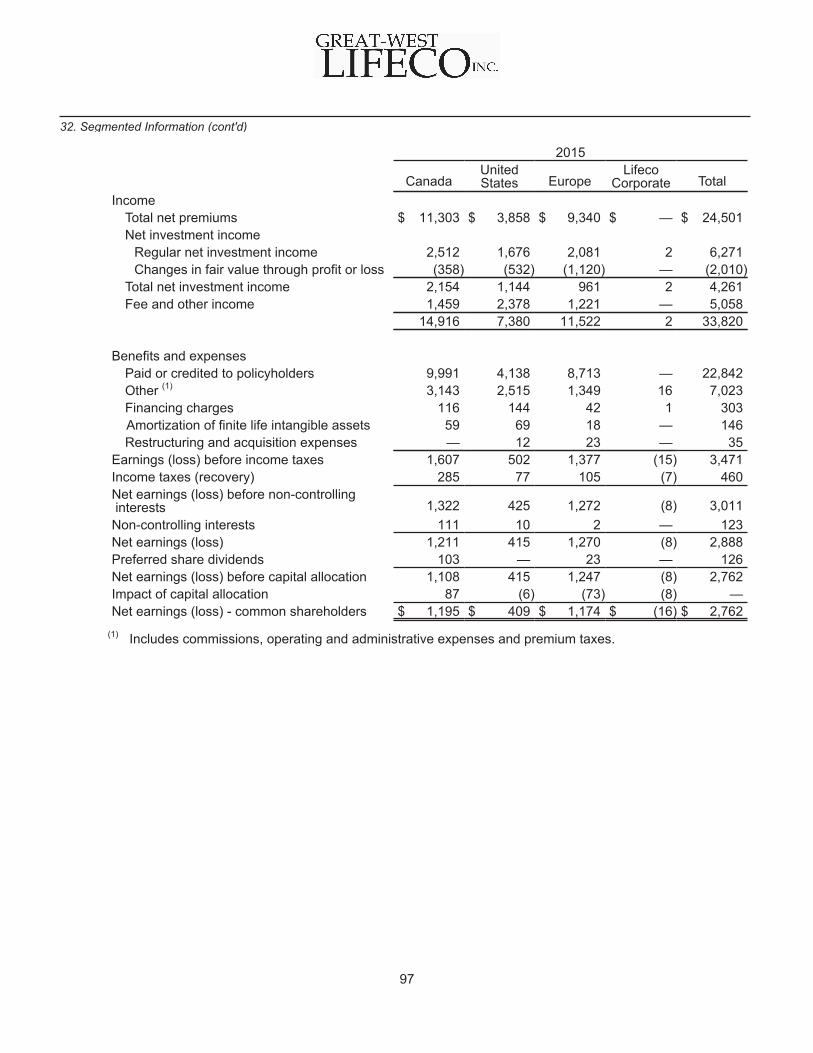
2015
CanadaUnitedStates Europe
LifecoCorporate Total
IncomeTotal net premiums $ 11,303 $ 3,858 $ 9,340 $ — $ 24,501Net investment income
Regular net investment income 2,512 1,676 2,081 2 6,271Changes in fair value through profit or loss (358) (532) (1,120) — (2,010)
Total net investment income 2,154 1,144 961 2 4,261Fee and other income 1,459 2,378 1,221 — 5,058
14,916 7,380 11,522 2 33,820
Benefits and expensesPaid or credited to policyholders 9,991 4,138 8,713 — 22,842Other (1) 3,143 2,515 1,349 16 7,023Financing charges 116 144 42 1 303Amortization of finite life intangible assets 59 69 18 — 146Restructuring and acquisition expenses — 12 23 — 35
Earnings (loss) before income taxes 1,607 502 1,377 (15) 3,471Income taxes (recovery) 285 77 105 (7) 460Net earnings (loss) before non-controlling interests 1,322 425 1,272 (8) 3,011Non-controlling interests 111 10 2 — 123Net earnings (loss) 1,211 415 1,270 (8) 2,888Preferred share dividends 103 — 23 — 126Net earnings (loss) before capital allocation 1,108 415 1,247 (8) 2,762Impact of capital allocation 87 (6) (73) (8) —Net earnings (loss) - common shareholders $ 1,195 $ 409 $ 1,174 $ (16) $ 2,762
(1) Includes commissions, operating and administrative expenses and premium taxes.
32. Segmented Information (cont'd)
97
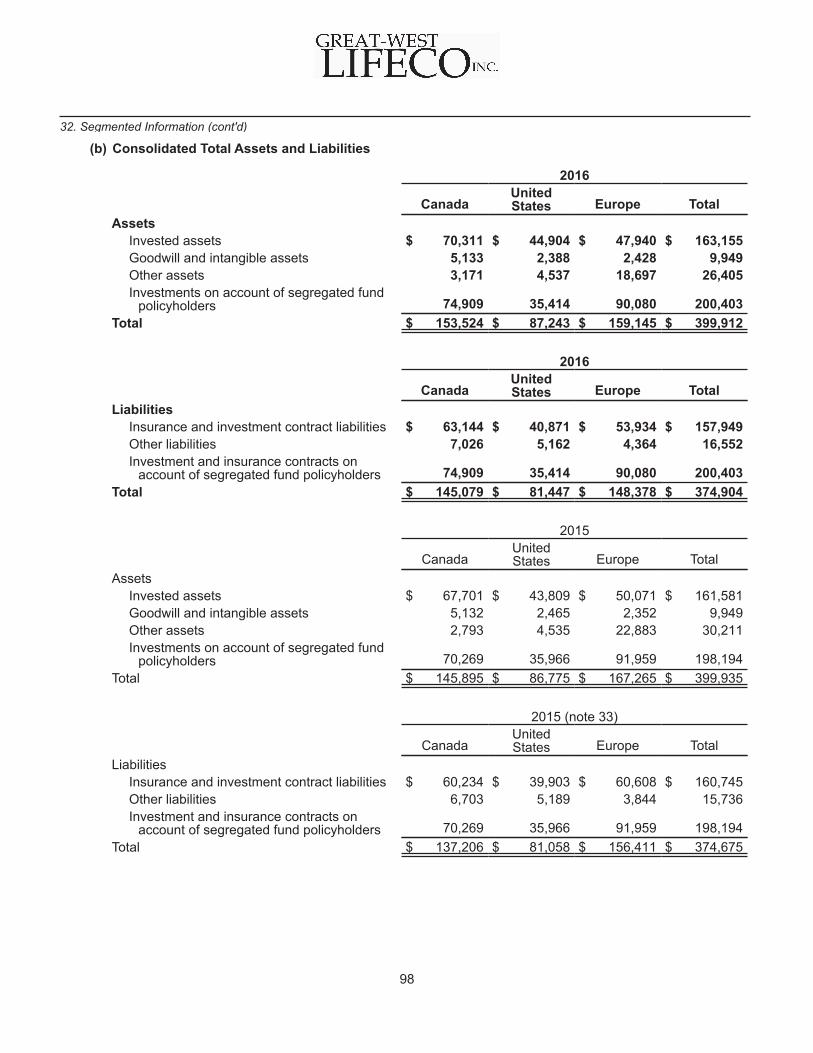
(b) Consolidated Total Assets and Liabilities
2016
CanadaUnitedStates Europe Total
AssetsInvested assets $ 70,311 $ 44,904 $ 47,940 $ 163,155Goodwill and intangible assets 5,133 2,388 2,428 9,949Other assets 3,171 4,537 18,697 26,405Investments on account of segregated fund
policyholders 74,909 35,414 90,080 200,403Total $ 153,524 $ 87,243 $ 159,145 $ 399,912
2016
CanadaUnitedStates Europe Total
LiabilitiesInsurance and investment contract liabilities $ 63,144 $ 40,871 $ 53,934 $ 157,949Other liabilities 7,026 5,162 4,364 16,552Investment and insurance contracts on
account of segregated fund policyholders 74,909 35,414 90,080 200,403Total $ 145,079 $ 81,447 $ 148,378 $ 374,904
2015
CanadaUnitedStates Europe Total
AssetsInvested assets $ 67,701 $ 43,809 $ 50,071 $ 161,581Goodwill and intangible assets 5,132 2,465 2,352 9,949Other assets 2,793 4,535 22,883 30,211Investments on account of segregated fund
policyholders 70,269 35,966 91,959 198,194Total $ 145,895 $ 86,775 $ 167,265 $ 399,935
2015 (note 33)
CanadaUnitedStates Europe Total
LiabilitiesInsurance and investment contract liabilities $ 60,234 $ 39,903 $ 60,608 $ 160,745Other liabilities 6,703 5,189 3,844 15,736Investment and insurance contracts on
account of segregated fund policyholders 70,269 35,966 91,959 198,194Total $ 137,206 $ 81,058 $ 156,411 $ 374,675
32. Segmented Information (cont'd)
98
33. Comparative Figures
The Company corrected the classification of $73 of deferred tax liabilities to investment contract liabilities to conformto the current year presentation (notes 8, 12, 26 and 32). The Company corrected an error that resulted from themisallocation of certain commissions in prior periods. This adjustment was applied retrospectively which resultedin an increase to non-controlling interests of $15 and a decrease to accumulated surplus of $15 (note 18). TheCompany also reclassified comparative figures for certain disclosure items.
These adjustments and reclassifications had no impact on the total equity or net earnings of the Company.
99
Member of Deloitte Touche Tohmatsu Limited
Deloitte LLP 360 Main Street Suite 2300 Winnipeg MB R3C 3Z3 Canada Tel: 1-204-942-0051 Fax: 1-204-947-9390 www.deloitte.ca
Independent Auditor’s Report To the Shareholders of Great-West Lifeco Inc. We have audited the accompanying consolidated financial statements of Great-West Lifeco Inc., which comprise the consolidated balance sheets as at December 31, 2016 and December 31, 2015, and the consolidated statements of earnings, consolidated statements of comprehensive income, consolidated statements of changes in equity and consolidated statements of cash flows for the years then ended, and a summary of significant accounting policies and other explanatory information. Management’s Responsibility for the Consolidated Financial Statements Management is responsible for the preparation and fair presentation of these consolidated financial statements in accordance with International Financial Reporting Standards, and for such internal control as management determines is necessary to enable the preparation of consolidated financial statements that are free from material misstatement, whether due to fraud or error. Auditor’s Responsibility Our responsibility is to express an opinion on these consolidated financial statements based on our audits. We conducted our audits in accordance with Canadian generally accepted auditing standards. Those standards require that we comply with ethical requirements and plan and perform the audit to obtain reasonable assurance about whether the consolidated financial statements are free from material misstatement. An audit involves performing procedures to obtain audit evidence about the amounts and disclosures in the consolidated financial statements. The procedures selected depend on the auditor’s judgment, including the assessment of the risks of material misstatement of the consolidated financial statements, whether due to fraud or error. In making those risk assessments, the auditor considers internal control relevant to the entity’s preparation and fair presentation of the consolidated financial statements in order to design audit procedures that are appropriate in the circumstances, but not for the purpose of expressing an opinion on the effectiveness of the entity’s internal control. An audit also includes evaluating the appropriateness of accounting policies used and the reasonableness of accounting estimates made by management, as well as evaluating the overall presentation of the consolidated financial statements. We believe that the audit evidence we have obtained in our audits is sufficient and appropriate to provide a basis for our audit opinion. Opinion In our opinion, the consolidated financial statements present fairly, in all material respects, the financial position of Great-West Lifeco Inc. as at December 31, 2016 and December 31, 2015, and its financial performance and its cash flows for the years then ended in accordance with International Financial Reporting Standards. /s/ Deloitte LLP Chartered Professional Accountants February 9, 2017 Winnipeg, Manitoba