consolidated financial statements as of december 31, … · carrefour group – consolidated...
TRANSCRIPT

Consolidated Financial Statements
as of December 31, 2017

Carrefour Group – Consolidated Financial Statements as of December 31, 2017 - 2 -
Contents
Consolidated income statement page 3
Consolidated statement of comprehensive income page 4
Consolidated statement of financial position page 5
Consolidated statement of cash flows page 6
Consolidated statement of changes in shareholders’ equity page 7
Notes to the Consolidated Financial Statements page 8

Carrefour Group – Consolidated Financial Statements as of December 31, 2017 - 3 -
Consolidated income statement
The Consolidated Financial Statements are presented in millions of euros, rounded to the nearest million. As a result, there may be rounding differences between the amounts reported in the various statements.
(in € millions) Notes 2017 2016 % change
Net sales 5.1 78,897 76,645 2.9%
Loyalty program costs (644) (591) 9.0%
Net sales net of loyalty program costs 78,253 76,054 2.9%
Other revenue 5.1 2,722 2,720 0.1%
Total revenue 80,975 78,774 2.8%
Cost of sales 5.2 (62,760) (60,789) 3.2%
Gross margin from recurring operations 18,214 17,985 1.3%
Sales, general and administrative expenses, depreciation and amortisation5.2
(16,209) (15,634) 3.7%
Recurring operating income 2,006 2,351 (14.7%)
Net income from equity-accounted companies 7 4 (36) (110.3%)
Recurring operating income after net income from equity-accounted
companies2,010 2,315 (13.2%)
Non-recurring income and expenses, net 5.3 (1,310) (372) n.a.
Operating income 700 1,943 (64.0%)
Finance costs and other financial income and expenses, net 12.6 (445) (515) (13.6%)
Finance costs, net (317) (377) (15.8%)
Other financial income and expenses, net (128) (138) (7.7%)
Income before taxes 255 1,428 (82.1%)
Income tax expense 8.1 (618) (494) 25.1%
Net income from continuing operations (363) 934 (138.8%)
Net income from discontinued operations 3.4 1 (40)
Net income for the year (362) 894 (140.5%)
Group share (531) 746 (171.1%)
of which net income from continuing operations (531) 786 (167.6%)
of which net income from discontinued operations 1 (40) n.a.
Attributable to non-controlling interests 169 148 14.1%
Basic earnings per share, in € 2017 2016 % change
Earnings/(loss) from continuing operations per share (0.70) 1.06 (166.1%)
Earnings from discontinued operations per share 0.00 (0.05) n.a.
Basic earnings per share – Group share (0.70) 1.01 (169.6%)
Diluted earnings per share, in € 2017 2016 % change
Diluted earnings/(loss) from continuing operations per share (0.70) 1.06 (166.1%)
Diluted earnings from discontinued operations per share 0.00 (0.05) n.a.
Diluted earnings per share – Group share (0.70) 1.01 (169.6%) Details of earnings per share calculations are provided in Note 11.6.

Carrefour Group – Consolidated Financial Statements as of December 31, 2017 - 4 -
Consolidated statement of comprehensive income
(in € millions) Notes 2017 2016
Net income for the year (362) 894
Effective portion of changes in the fair value of cash flow hedges (1)
11.4 (17) 10
Changes in the fair value of available-for-sale financial assets (1)
11.4 (3) (4)
Exchange differences on translating foreign operations (2)
11.4 (473) 361
Items that may be reclassified subsequently to profit or loss (493) 367
Remeasurements of defined benefit plans obligation (1) 10.1/11.4 10 (109)
Items that will not be reclassified to profit or loss 10 (109)
Other comprehensive income after tax (482) 258
Total comprehensive income (844) 1,152
Group share (889) 904
Attributable to non-controlling interests 45 248
(1) Presented net of the tax effect (Note 11.4).
(2) Exchange differences on translating foreign operations recognised in 2017 mainly reflect the decline of the Brazilian real. In 2016, gains in the Brazilian real and Taiwan dollar were partly offset by declines in the Argentine peso and Polish zloty.

Carrefour Group – Consolidated Financial Statements as of December 31, 2017 - 5 -
Consolidated statement of financial position
ASSETS
(in € millions) NotesDecember 31,
2017
December 31,
2016
Goodwill 6.1 7,977 8,640
Other intangible assets 6.1 1,364 1,266
Property and equipment 6.2 13,097 13,406
Investment property 6.4 410 314
Investments in companies accounted for by the equity method 7 1,355 1,361
Other non-current financial assets 12.5 1,367 1,430
Consumer credit granted by the financial services companies – long-term 5.5 2,455 2,371
Deferred tax assets 8.2 636 829
Other non-current assets 5.4 337 79
Non-current assets 28,996 29,697
Inventories 5.4 6,690 7,039
Trade receivables 5.4 2,750 2,682
Consumer credit granted by the financial services companies – short-term 5.5 3,866 3,902
Other current financial assets 12.2 161 239
Tax receivables 5.4 890 1,044
Other assets 5.4 851 907
Cash and cash equivalents 12.2 3,593 3,305
Assets held for sale 16 31
Current assets 18,816 19,148
TOTAL ASSETS 47,813 48,845
SHAREHOLDERS’ EQUITY AND LIABILITIES
(in € millions) NotesDecember 31,
2017
December 31,
2016
Share capital 11.2 1,937 1,891
Consolidated reserves and income for the year 8,122 8,536
Shareholders’ equity, Group share 10,059 10,426
Shareholders’ equity attributable to non-controlling interests 11.5 2,099 1,582
Total shareholders' equity 12,159 12,008
Long-term borrowings 12.2 6,428 6,200
Provisions 9 3,003 3,064
Consumer credit financing – long-term 5.5 2,661 1,935
Deferred tax liabilities 8.2 489 543
Non-current liabilities 12,581 11,742
Short-term borrowings 12.2 1,069 1,875
Suppliers and other creditors 5.4 15,082 15,396
Consumer credit financing – short-term 5.5 2,817 3,395
Tax payables 5.4 1,282 1,260
Other payables 5.4 2,813 3,153
Liabilities related to assets held for sale 11 16
Current liabilities 23,074 25,095
TOTAL SHAREHOLDERS’ EQUITY AND LIABILITIES 47,813 48,845

Carrefour Group – Consolidated Financial Statements as of December 31, 2017 - 6 -
Consolidated statement of cash flows
(in € millions) 2017 2016
INCOME BEFORE TAXES 255 1,428
CASH FLOWS FROM OPERATING ACTIVITIES
Income tax (588) (269)
Depreciation and amortisation expense 1,632 1,547
Capital (gains)/losses on sales of assets (49) (39)
Change in provisions and impairment 1,013 (126)
Finance costs, net 317 377
Net income and dividends received from equity-accounted companies 76 79
Impact of discontinued operations (4) (32)
Cash flow from operations 2,653 2,964
Change in working capital requirement (1) 157 454
Impact of discontinued operations (0) (11)
Net cash from operating activities (excluding financial services companies) 2,810 3,407
Change in consumer credit granted by the financial services companies 32 (103)
Net cash from operating activities 2,843 3,305
CASH FLOWS FROM INVESTING ACTIVITIES
Acquisitions of property and equipment and intangible assets (2) (2,379) (2,749)
Acquisitions of non-current financial assets 1 3
Acquisitions of subsidiaries and investments in associates (3) (260) (193)
Proceeds from the disposal of subsidiaries and investments in associates 9 6
Proceeds from the disposal of property and equipment and intangible assets 158 152
Proceeds from the disposal of non-current financial assets 4 4
Change in amounts receivable from disposals of non-current assets and due to suppliers
of non-current assets(117) (70)
Investments net of disposals (2,584) (2,847)
Other cash flows from investing activities (54) (25)
Impact of discontinued operations 3 16
Net cash from/(used in) investing activities (2,635) (2,856)
CASH FLOWS FROM FINANCING ACTIVITIES
Proceeds from share issues to non-controlling interests (4) 969 255
Acquisitions and disposals of investments without any change of control (5) 479 (40)
Dividends paid by Carrefour (parent company) (6) (151) (121)
Dividends paid by consolidated companies to non-controlling interests (141) (86)
Change in treasury stock and other equity instruments (40) 30
Change in current financial assets (7) 34 152
Issuance of bonds (7) 981 743
Repayments of bonds (7) (1,250) (666)
Net financial interests paid (320) (378)
Other changes in borrowings (7) (197) 111
Net cash from/(used in) financing activities 362 0
Net change in cash and cash equivalents before the effect of changes in exchange rates 570 449
Effect of changes in exchange rates (283) 131
Net change in cash and cash equivalents 288 581
Cash and cash equivalents at beginning of year 3,305 2,724
Cash and cash equivalents at end of year 3,593 3,305
(1) The change in working capital is analysed in Note 5.4.1.
(2) Acquisitions of property and equipment and intangible assets are presented in Notes 6.1 and 6.2.
(3) This item mainly reflects the acquisition of stores in Spain (described in Note 3.2.1). In 2016, cash used in acquisitions of subsidiaries and
investments in associates corresponded primarily to the acquisition of Billa in Romania (Note 3.2.2) and several acquisitions in France, notably
in the e-commerce sector.
(4) In 2017, this item corresponds mainly to the cash capital increase carried out by Grupo Carrefour Brasil in connection with the July 2017 IPO,
as described in Notes 2.2 and 3.2.1 (primary offering of 840 million euros, net of directly related issue costs). As in 2016, it also includes the
share capital of Cargo Property Holding subscribed and paid up in that year by third-party investors (non-controlling interests). See Note 3.2.2.
(5) Changes in this item in 2017 primarily result from the sale by the Group of 139,834,428 Grupo Carrefour Brasil shares in connection with the secondary offering of the IPO for the Group’s Brazilian operations and the exercise of the call option by Península (see Notes 2.2 and 3.2.1).
(6) Dividends paid by Carrefour (parent company) correspond to cash dividends paid to shareholders who chose not to reinvest their dividends
(Note 2.7).
(7) Note 12.2 provides a breakdown of total borrowings. Changes in liabilities arising from financing activities are detailed in Note 12.4.

Carrefour Group – Consolidated Financial Statements as of December 31, 2017 - 7 -
Consolidated statement of changes in shareholders’ equity
Share
capital (1)
Translation
reserve
Fair value
reserve (2)
Other
consolidated
reserves and
net income
Shareholders' equity at December 31, 2015 1,846 (835) (7) 8,628 9,633 1,039 10,672
Net income for the year 2016 - - - 746 746 148 894
Other comprehensive income after tax - 261 3 (106) 158 100 258
Total comprehensive income 2016 - 261 3 640 904 248 1,152
Share-based payments - - - 3 3 - 3
Treasury stock (net of tax) - - - 49 49 - 49
2015 dividend payment (3) 44 - - (165) (121) (126) (247)
Change in capital and additional paid-in capital (4) - - - - - 443 443
Effect of changes in scope of consolidation and
other movements- 5 1 (47) (43) (21) (64)
Shareholders' equity at December 31, 2016 1,891 (569) (3) 9,108 10,426 1,582 12,008
Net income for the year 2017 - - - (531) (531) 169 (362)
Other comprehensive income after tax - (349) (20) 11 (358) (124) (482)
Total comprehensive income 2017 - (349) (20) (520) (889) 45 (844)
Share-based payments - - - 12 12 1 13
Treasury stock (net of tax) - - - (31) (31) - (31)
2016 dividend payment (3) 46 - - (197) (151) (103) (254)
Change in capital and additional paid-in capital (4) - - - 470 470 370 840
Effect of changes in scope of consolidation and
other movements (4) - 32 - 191 223 204 427
Shareholders' equity at December 31, 2017 1,937 (885) (24) 9,032 10,059 2,099 12,159
Non-controlling
interests
Total
Shareholders’
equity
(in € millions)
Shareholders’ equity, Group shareTotal
Shareholders’
equity, Group
share
(1) At December 31, 2017, the share capital was made up of 774,677,811 ordinary shares (see Note 11.2.1).
(2) This item comprises:
- the effective portion of changes in the fair value of cash flow hedges;
- cumulative changes in the fair value of available-for-sale financial assets.
(3) The 2015 dividend, totalling 509 million euros, was paid:
- in cash for 121 million euros; and
- in new shares for 388 million euros (corresponding to the aggregate par value of the new shares for 44 million euros and premiums for
344 million euros).
Dividends paid to non-controlling interests in 2016 came to 126 million euros and related mainly to the Group’s Brazilian and Spanish subsidiaries.
The 2016 dividend (Note 2.7), totalling 523 million euros, was paid:
- in cash for 151 million euros; and
- in new shares for 372 million euros (corresponding to the aggregate par value of the new shares for 46 million euros and premiums for 326 million euros).
Dividends paid to non-controlling interests in 2017 for 103 million euros mainly concern Spanish, French and Brazilian subsidiaries.
(4) Changes in capital and additional paid-in capital and other movements in 2017 mainly reflect the July 2017 Grupo Carrefour Brasil IPO: the
primary offering of 840 million euros generated (i) an increase of 370 million euros in non-controlling interests and (ii) an increase of 470 million euros in shareholders’ equity, Group share corresponding to the dilution gain; Carrefour’s sale of 139,834,428 Grupo Carrefour Brasil
shares within the context of the secondary offering and following Península’s exercise of its call option, resulted in (i) a 274 million-euro
disposal gain net of tax and directly related selling costs recorded within “Shareholders’ equity, Group share” and (ii) the recognition of non-
controlling interests for 208 million euros (Notes 2.2 and 3.2.1).
The increase in non-controlling interests in 2016 chiefly corresponded to the portion of Cargo Property Holding’s share capital subscribed by third-party investors (including uncalled capital).

Carrefour Group – Consolidated Financial Statements as of December 31, 2017 - 8 -
Notes to the Consolidated Financial Statements
Notes to the Consolidated Financial Statements
Note 1: Basis of preparation of the Consolidated Financial Statements page 9
Note 2: Significant events of the year page 13
Note 3: Scope of consolidation page 16
Note 4: Segment information page 21
Note 5: Operating items page 23
Note 6: Intangible assets, property and equipment, investment property page 31
Note 7: Investments in equity-accounted companies page 39
Note 8: Income tax page 41
Note 9: Provisions and contingent liabilities page 43
Note 10: Number of employees, employee compensation and benefits page 45
Note 11: Equity and earnings per share page 53
Note 12: Financial assets and liabilities, finance costs and other financial income and expenses page 57
Note 13: Off-balance sheet commitments page 70
Note 14: Subsequent events page 71
Note 15: Fees paid to the Auditors page 73
Note 16: List of consolidated companies page 74

Carrefour Group – Consolidated Financial Statements as of December 31, 2017 - 9 -
Notes to the Consolidated Financial Statements
NOTE 1: BASIS OF PREPARATION OF THE CONSOLIDATED FINANCIAL STATEMENTS
The Consolidated Financial Statements for the year ended December 31, 2017 were approved for publication by the Board of Directors on February 28, 2018. They will be submitted to shareholders for final approval at the Annual General Meeting.
Carrefour (the “Company”) is domiciled in France. The Consolidated Financial Statements for the year ended December 31, 2017 comprise the financial statements of the Company and its subsidiaries (together the “Group”) and the Group’s share of the profits and losses and net assets
of associates and joint ventures accounted for by the equity method. The presentation currency of the Consolidated Financial Statements is the euro, which is the Company’s functional currency.
1.1 Statement of compliance
In accordance with European Regulation (EC) 1606/2002 dated July 19, 2002, the 2017 Consolidated Financial Statements have been prepared in compliance with the international accounting standards adopted for use in the European Union as of December 31, 2017 and applicable at that date, with 2016 comparative information prepared using the same standards.
International accounting standards comprise International Financial Reporting Standards (IFRSs), International Accounting Standards (IASs), IFRS Interpretations Committee (IFRIC) Interpretations and Standing interpretations Committee (SIC) Interpretations.
All of the standards and interpretations endorsed by the European Union are published in the Official Journal of the European Union, which can be accessed in the EUR-Lex.
At December 31, 2017, the standards and interpretations adopted for use in the European Union were the same as those published by the IASB and applicable at that date, except for IAS 39 – Financial Instruments: Recognition and Measurement, which was only partly adopted. The unadopted provisions of IAS 39 had no impact on the Group’s Consolidated Financial Statements.
The Consolidated Financial Statements also include the material disclosures required by Standard no. 2016-09 published by the French accounting authorities (Autorité des Normes Comptables – ANC).
1.2 Changes of method
The accounting policies and calculation methods used to prepare the 2017 Consolidated Financial Statements are the same as those used for the 2016 Consolidated Financial Statements, expect for the following amendments, which were applicable as of January 1, 2017:
amendments to IAS 7 – Disclosure Initiative: the requisite disclosures regarding changes in liabilities arising from financing activities are set out in Note 12;
amendments to IAS 12 – Recognition of Deferred Tax Assets for Unrealised Losses: these
amendments did not have a material impact on the Consolidated Financial Statements.
The Group decided not to early adopt the following standards, amendments and interpretations that were not applicable as of January 1, 2017:

Carrefour Group – Consolidated Financial Statements as of December 31, 2017 - 10 -
Notes to the Consolidated Financial Statements
Adopted for use in the European Union
Standards, amendments and interpretations Effective date for
the Group
IFRS 9 – Financial Instruments, along with the amendments to IFRS 4 – Applying IFRS 9 Financial Instruments with IFRS 4 Insurance Contracts
January 1, 2018
Main provisions and consequences for the Group:
This new standard, which describes the principles to be applied for the classification and measurement of financial assets and liabilities, will replace IAS 39 – Financial Instruments: Recognition and Measurement. IFRS 9 notably introduces:
- a new approach to classifying financial instruments based on the business model and contractual terms of financial instruments (first topic);
- a new financial asset impairment (credit loss) model based on expected losses as opposed to the current
model based on incurred losses (second topic); and
- new hedge accounting principles, excluding macro hedge accounting (third topic).
The Group is primarily concerned by the changes introduced by the second topic of IFRS 9 on financial asset impairment, which will mainly impact its banking and insurance business. It has developed a new methodological framework for this business, which notably defines rules for assessing an increase in credit risk, for determining expected losses (at one year and at maturity) and for taking information into account on a prospective basis. Applying these new provisions will result in an increase in impairment recognised against loans and credit granted by the Group’s banking subsidiaries. This increase will arise mainly from the recognition of expected losses on loans and credit for which there is no objective evidence of impairment within the meaning of IAS 39, and on undrawn loan commitments and credit facilities (expected losses recognised as from the signature of a lending agreement). Recognizing this change in method will have a negative impact on equity at January 1, 2018 which is expected to amount between (200) million euros and (250) million euros net of corporate income tax (subject to control and audit works underway); comparative periods presented will not be restated pursuant to the option available in IFRS 9 transitional provisions. Applying the new expected loss impairment model to trade receivables and lease receivables will result in additional impairment at the transition date (expected credit losses at maturity on receivables not yet due, calculated based on the past due period). The impact on consolidated equity is not expected to be material. After its transition to IFRS 9, the Group does not expect any material recurring impacts on its income statement, except in the event of material new exposures or a financial crisis.
The new principles for classifying and measuring financial instruments (first topic of the standard) and for hedge accounting (third topic) will not have a material impact on the Consolidated Financial Statements, since most financial assets, currently classified within “Loans and receivables”, will continue to be recorded at amortised cost under IFRS 9, and all transactions eligible for hedge accounting under IAS 39 will remain eligible for hedge accounting under the new standard.
IFRS 15 – Revenue from Contracts with Customers (including Clarifications to IFRS 15 published in April 2016)
January 1, 2018
Main provisions and consequences for the Group:
IFRS 15, which replaces IAS 18 – Revenues and IAS 11 – Construction Contracts and the related interpretations, defines the revenue recognition model to be used in IFRS financial statements. IFRS 15 applies to all contracts with customers except for leases (rental revenue and sublease income), financial instruments (interest income) and insurance contracts, which are dealt with in other standards.
IFRS 15 defines a single framework for recognising revenue. It introduces new concepts and principles with regard to revenue recognition, particularly in terms of identifying performance obligations and allocating the transaction price to performance obligations when there are several different performance obligations in a given contract. IFRS 15 also includes new disclosure requirements for the notes to financial statements.
Since the bulk of the Group’s net sales (revenue) is derived from sales to end customers in stores and service stations (sales with no other performance obligation for which revenue is recognised when the customer pays at the check-out), – the impacts of applying IFRS 15 to recognise net sales and other revenue at January 1, 2018 will not be material.

Carrefour Group – Consolidated Financial Statements as of December 31, 2017 - 11 -
Notes to the Consolidated Financial Statements
Standards, amendments and interpretations Effective date for the Group
IFRS 16 – Leases January 1, 2019
Main provisions and consequences for the Group:
IFRS 16, which will replace IAS 17 – Leases and the related interpretations, sets out the principles for recognising leases and introduces major changes in the accounting for leases by lessees, since it eliminates the distinction for lessees between operating and finance leases.
Under IFRS 16, all leases are to be brought onto the statement of financial position by recognising a right-of-use asset and a lease liability corresponding to the present value of the lease payments due over the reasonably certain term of the lease. IFRS 16 will therefore affect the presentation of lease transactions in the income statement (with rental expense replaced by a depreciation expense and interest expense) and in the cash flow statement (lease payments representing payment of interest and repayment of the outstanding liability will impact financing cash flows).
Applying IFRS 16 will result in a significant increase in the Group’s total borrowings as well as a substantial improvement in recurring operating income and cash flow from operating activities. The lease commitments described in Note 6.5, calculated over the non-cancellable term of property leases taking into account the contractual or legal provisions enabling leases to be terminated before the end of the lease term, are not entirely representative of the lease liability to be recognised in accordance with IFRS 16.
The Group began to prepare for IFRS 16 implementation in 2016 and will continue this project through to the effective date of the standard in 2019. It is currently in the process of identifying and analysing existing leases and lease provisions, and compiling all of the data necessary to accurately estimate the impact of first-time
application (January 1, 2019) on equity. At this stage, the Group has not yet decided on its transition approach.
In addition, IFRS Annual Improvements 2014-2016 Cycle (applicable in annual periods beginning on or after January 1, 2018) will have no impact on the Consolidated Financial Statements.
Not yet adopted for use in the European Union
Standards, amendments and interpretations Effective date(1)
Amendments to IFRS 10 and IAS 28 – Sales or Contribution of Assets between an Investor and its Associate or Joint Venture
Application deferred indefinitely by the IASB
Amendments to IFRS 2 – Classification and Measurement of Share-based Payment Transactions
January 1, 2018
Amendments to IAS 40 – Transfers of Investment Property January 1, 2018
IFRIC 22 – Foreign Currency Transactions and Advance Consideration January 1, 2018
IFRIC 23 – Uncertainty over Income Tax Treatments January 1, 2019
IFRS 17 – Insurance Contracts January 1, 2021
Amendments to IFRS 9 – Prepayment Features with Negative Compensation January 1, 2019
Amendments to IAS 28 – Long-term Interests in Associates and Joint Ventures January 1, 2019
IFRS Annual Improvements 2015-2017 Cycle January 1, 2019
Amendments to IAS 19 – Compensation Plan Amendment, Curtailment or Settlement
January 1, 2019
(1) Subject to adoption by the European Union.
The Group is currently analysing the potential impacts of IFRIC 23 and IFRS 17. It does not expect the application of the other standards, amendments or interpretations to have a material impact on its Consolidated Financial Statements.

Carrefour Group – Consolidated Financial Statements as of December 31, 2017 - 12 -
Notes to the Consolidated Financial Statements
1.3 Use of estimates and judgement Preparation of Consolidated Financial Statements involves the use of management estimates and
assumptions that may affect the reported amounts of certain assets, liabilities, income and expenses, as well as the disclosures contained in the notes. These estimates and assumptions are reviewed at regular intervals to ensure that they are reasonable in light of past experience and the current economic situation. Actual results may differ from current estimates. In addition to using estimates, Group management is required to exercise judgement when determining the appropriate accounting treatment of certain transactions and activities and how it should be applied.
The main estimates and judgements applied for the preparation of these Consolidated Financial Statements concern:
- useful lives of operating assets (Note 6);
- definition of cash-generating units (CGUs) for the purpose of impairment tests on non-current assets other than goodwill (Note 6.3);
- recoverable amount of goodwill, other intangible assets and property and equipment
(Note 6.3);
- fair value of identifiable assets acquired and liabilities assumed in business combinations (Note 3.1);
- measurement of rebates and commercial income (Note 5.2.1);
- classification of leases (Notes 6.2 and 6.5);
- measurement of provisions for contingencies and other business-related provisions (Note 9);
- determination of the level of control or influence exercised by the Group over investees
(Notes 3 and 7);
- assumptions used to calculate pension and other post-employment benefit obligations (Note 10.1);
- recognition of deferred tax assets and some tax credits (Note 8).
1.4 Measurement methods
The Consolidated Financial Statements have been prepared using the historical cost convention, except for:
- certain financial assets and liabilities measured using the fair value model (Note 12);
- assets acquired and liabilities assumed in business combinations, measured using the fair
value model (Note 3.1);
- non-current assets held for sale, measured at the lower of carrying amount and fair value less costs to sell.
Fair value is the price that would be received to sell an asset or paid to transfer a liability in an orderly transaction between market participants at the measurement date. Based on the hierarchy defined in IFRS 13 – Fair Value Measurement, fair value may be measured using the following inputs:
- Level 1 inputs: unadjusted quoted prices in active markets for identical assets or liabilities
that the entity can access at the measurement date;
- Level 2 inputs: models that use inputs that are observable for the asset or liability, either directly (i.e., prices) or indirectly (i.e., price-based data);
- Level 3 inputs: inputs that are intrinsic to the asset or liability and are not based on observable market data for the asset or liability.

Carrefour Group – Consolidated Financial Statements as of December 31, 2017 - 13 -
Notes to the Consolidated Financial Statements
NOTE 2: SIGNIFICANT EVENTS OF THE YEAR
2.1 New Group management team
The Board of Directors appointed Alexandre Bompard to replace Georges Plassat as Chairman of the Board of Directors and Chief Executive Officer of Carrefour Group, effective July 18, 2017.
On September 22, 2017 Alexandre Bompard announced the appointment of a Group Executive Committee. The new management team comprises managers from the Group and individuals from
other horizons bringing complementary expertise.
The first task of this new management team has consisted in redefining the Group’s strategy. The Group’s ambition is to become the leader of the food transition for all and regain momentum. The transformation plan announced on January 23, 2018 aims at revamping the Carrefour model, by simplifying its organisation and by opening up to partnerships, improving operational efficiency, investing in growth formats, building an efficient omnichannel model and developing the fresh and
organic products offer, notably under the Carrefour brand.
2.2 IPO of the Group’s Brazil operations In June 2017, the Group announced that Atacadão SA, the parent company of the Carrefour Group’s operations in Brazil (Grupo Carrefour Brasil) filed a prospectus with the Brazilian Securities Commission (CVM) with the aim of listing the shares of Grupo Carrefour Brasil on the Novo
Mercado segment of the São Paulo stock exchange.
The IPO took place on July 20, 2017 and consisted of a primary offering of 205,882,353 shares issued by Grupo Carrefour Brasil and a secondary offering of 34,461,489 and 56,800,000 Grupo Carrefour Brasil shares sold by Carrefour and Península, respectively.
Carrefour also granted a secondary over-allotment option to the Brazilian banks participating in the offering that led to the placement of an additional 34,369,876 Carrefour-owned shares to
cover over-allotment.
Based on the IPO price, set at BRL 15 per share, the primary offering amounted to BRL 3.1 billion (0.8 billion euros), thereby valuing, at the launch of the IPO and following a capital increase, Grupo Carrefour Brasil’s equity at BRL 29.7 billion (8.1 billion euros).
After the completion of the IPO and the exercise by Península of its call option to purchase 71,003,063 Grupo Carrefour Brasil shares from Carrefour, Carrefour holds a 71.8% interest in Grupo Carrefour Brasil, while Península holds 11.5% and Grupo Carrefour Brasil’s free float is
16.7%.
The accounting impact of the transaction is presented in Note 3.2.1.
2.3 Absorption of Carmila by Cardety On March 2, 2017, Carmila and Cardety, two property companies over which the Group has
significant influence, announced a draft merger agreement under which Carmila would be absorbed by Cardety, whose shares are listed on Euronext Paris. The merger took place on
June 12, 2017. Post completion, Carrefour held 42.45% of the new entity, which has been named Carmila.
As part of its development plan, the merged entity carried out a capital increase for 628.6 million euros in July 2017, subscribed by Carrefour in an amount of 50 million euros. Carrefour now owns
35.76% of the shares and voting rights of Carmila.
The accounting impact of the business combination is presented in Note 3.2.1.

Carrefour Group – Consolidated Financial Statements as of December 31, 2017 - 14 -
Notes to the Consolidated Financial Statements
2.4 Acquisition of hypermarkets in Spain On February 29, 2016, the Carrefour Group announced it had signed an agreement with the
Eroski Group to acquire 36 compact hypermarkets with a total sales area of 235,000 square meters, as well as 8 shopping malls and 22 service stations adjacent to the stores.
The conditions precedent have been met for the acquisition of 31 stores. The accounting impact of the transaction is presented in Note 3.2.1.
The acquisition has enabled Carrefour to expand its store network to 27 new towns and cities, and strengthen its position in the food market. In this way, the Group is furthering its ongoing multi-
format and omni-channel development for the benefit of its customers.
2.5 Impairment of goodwill allocated to Italian operations In defining its transformation plan, the Group reviewed the financial trajectories of its various
regions and adjusted certain assumptions underlying financial projections for its operations in
Italy. Although profitability in the region has gradually improved over the past few years, certain commercial dynamics observed in 2017 prompted the Group to adjust its forecast in terms of margins and free cash flow (change in cash from operating activities less operational investments) as reflected in the financial trajectory defined by the Group’s Executive Management.
The results of the impairment tests carried out on this basis (Note 6.3) led the Group to recognise a 700 million-euro impairment loss against goodwill allocated to its Italian operations. This impairment loss is included in non-recurring expenses and has no impact on cash flow (Note 5.3).
2.6 Securing the Group’s long-term financing In December 2016, the Group exercised its option to extend its 2,500 million-euro credit facility by one year. The extension was effective in January 2017 and the facility will now mature in January 2022.
On May 2, 2017, the Group obtained a new 1,400 million-euro five-year bank facility (maturing in May 2022) from a pool of eight banks with two one-year extension options. This new facility will replace the facility of the same amount expiring in April 2019.
These operations contribute to the ongoing strategy to secure the Group’s long-term financing sources by maintaining the average maturity of its facilities (which has risen from 4.1 years as of December 31, 2016 to 4.2 years as of December 31, 2017).
On June 7, 2017 (settlement on June 14, 2017), the Group issued USD 500 million worth of six-year cash-settled convertible bonds (maturing in June 2023) to institutional investors. The
bonds were issued at 98.25% of their nominal value, and do not bear interest as they are zero-coupon bonds. The resulting initial conversion price is 27.7536 euros, including a conversion premium of 20% over the Carrefour reference share price. They may be converted into cash only and will not give rise to the issuance of new shares or carry rights to existing shares.
In parallel with the bond issue, the Group purchased cash-settled call options on its own shares in order to hedge its economic exposure relating to cash payments due on bonds in the event that
investors exercise their conversion rights.
The above operations, for which a EUR/USD cross currency swap was arranged in euros, provide the Group with the equivalent of standard euro-denominated bond financing (see a description of the related accounting treatment in Note 12.2).
The issue consolidated the Group’s long-term financing, extended the average maturity of its bond debt (from 3.6 years to 3.9 years at June 7, 2017) and further reduced its borrowing costs.

Carrefour Group – Consolidated Financial Statements as of December 31, 2017 - 15 -
Notes to the Consolidated Financial Statements
2.7 2016 dividend reinvestment option At the Annual Shareholders’ Meeting held on June 15, 2017, the shareholders decided to set the 2016 dividend at 0.70 euros per share with a dividend reinvestment option.
The issue price of the shares to be issued in exchange for reinvested dividends was set at 20.15 euros per share, representing 90% of the average of the opening prices quoted on Euronext
Paris during the 20 trading days preceding the date of the Annual Shareholders’ Meeting, less the net amount of the dividend of 0.70 euros per share and rounded up to the nearest euro cent.
The option period was open from June 21 to July 4, 2017. At the end of this period, shareholders owning 71.32% of Carrefour’s shares had elected to reinvest their 2016 dividends.
July 13, 2017 was set as the date for:
- settlement/delivery of the 18,442,657 new shares corresponding to reinvested dividends, representing a total capital increase including premiums of 372 million euros;
- payment of the cash dividend to shareholders who chose not to reinvest their dividends,
representing a total payout of 151 million euros.

Carrefour Group – Consolidated Financial Statements as of December 31, 2017 - 16 -
Notes to the Consolidated Financial Statements
NOTE 3: SCOPE OF CONSOLIDATION
3.1 Accounting principles
Basis of consolidation
The Consolidated Financial Statements include the financial statements of subsidiaries from the date of
acquisition (the date when the Group gains control) up to the date when the Group ceases to control the subsidiary, and the Group’s equity in associates and joint ventures accounted for by the equity method.
(i) Subsidiaries
A subsidiary is an entity over which the Group exercises control, directly or indirectly. An entity is controlled when the Group is exposed, or has rights, to variable returns from its involvement with the entity and has the ability to affect those returns through its power over the entity. The Group considers all facts and circumstances when assessing whether it controls an investee, such as rights resulting from contractual arrangements or substantial potential voting rights held by the Group.
The profit or loss of subsidiaries acquired during the year is included in the Consolidated Financial Statements from the date when control is acquired. The profit or loss of subsidiaries sold during the year or that the Group ceases to control, is included up to the date when control ceases.
Intra-group transactions and assets and liabilities are eliminated in consolidation. Profits and losses on transactions between a subsidiary and an associate or joint venture accounted for by the equity method are included in the Consolidated Financial Statements to the extent of unrelated investors’ interests in the associate or joint venture.
(ii) Associates and joint ventures
Entities in which the Group exercises significant influence (associates), and entities over which the Group exercises joint control and that meet the definition of a joint venture, are accounted for by the equity method, as explained in Note 7 “Investments in equity-accounted companies”.
Significant influence is the power to participate in the financial and operating policy decisions of the investee but is not control or joint control of those policies.
Joint control is the contractually agreed sharing of control of an arrangement, which exists only when decisions about the relevant activities require the unanimous consent of the parties sharing control.
(iii) Other investments
Investments in companies where the Group does not exercise control or significant influence over financial and operating policy decisions are qualified as available-for-sale financial assets and reported under “Other non-current financial assets”. The accounting treatment of these investments is described in Note 12 “Financial assets and liabilities, finance costs and other financial income and expenses”.
Business combinations
Business combinations, defined as transactions where the assets acquired and liabilities assumed constitute a business, are accounted for by the purchase method. Business combinations carried out since January 1, 2010 are measured and recognised as described below, in accordance with IFRS 3 – Business Combinations (as revised in 2008).
• As of the acquisition date, the identifiable assets acquired and liabilities assumed are recognised and measured at fair value.
• Goodwill corresponds to the excess of (i) the sum of the consideration transferred (i.e., the acquisition price) and the amount of any non-controlling interest in the acquiree, over (ii) the net of the acquisition-date amounts of the identifiable assets acquired and the liabilities assumed. It is recorded directly in the statement of financial position of the acquiree, in the latter’s functional currency, and is subsequently tested for impairment at the level of the Cash Generating Unit to which the acquiree belongs, by the method described in Note 6.3. Any gain from a bargain purchase (i.e., negative goodwill) is recognised directly in profit or loss.
• For business combinations on a less than 100% basis, the acquisition date components of non-controlling interests in the acquiree (i.e., interests that entitle their holders to a proportionate share of the acquiree’s net assets) are measured at either:
– fair value, such that part of the goodwill recognised at the time of the business combination is
allocated to non-controlling interests (“full goodwill” method), or
– the proportionate share of the acquiree’s identifiable net assets, such that only the goodwill
attributable to the Group is recognised (“partial goodwill” method).
The method used is determined on a transaction-by-transaction basis.
• The provisional amounts recognised for a business combination may be adjusted during a measurement period that ends as soon as the Group receives the information it was seeking about facts and circumstances that existed as of the acquisition date or learns that more information is not obtainable, or at the latest

Carrefour Group – Consolidated Financial Statements as of December 31, 2017 - 17 -
Notes to the Consolidated Financial Statements
12 months from the acquisition date. Adjustments during the measurement period to the fair value of the identifiable assets acquired and liabilities assumed or the consideration transferred are offset by a corresponding adjustment to goodwill, provided they result from facts and circumstances that existed as of the acquisition date. Any adjustments identified after the measurement period ends are recognised directly in profit or loss.
• For a business combination achieved in stages (step acquisition), when control is acquired the previously held equity interest is remeasured at fair value through profit or loss. In the case of a reduction in the Group’s equity interest resulting in a loss of control, the remaining interest is also remeasured at fair value through profit or loss.
• Transaction costs are recorded directly as an operating expense for the period in which they are incurred.
At the IFRS transition date, the Group elected to maintain the accounting treatment for business combinations applied under previous accounting standards, in line with the option available to first-time adopters under IFRS 1 – First-time Adoption of International Financial Reporting Standards.
Changes in ownership interest not resulting in a change of control
Any change in the Group’s ownership interest in a subsidiary after the business combination that does not result in control being acquired or lost is qualified as a transaction with owners in their capacity as owners and recorded directly in equity in accordance with IFRS 10 – Consolidated Financial Statements. It is shown in cash flows from financing activities in the statement of cash flows.
Translation of the financial statements of foreign operations
The Consolidated Financial Statements are presented in euros.
An entity’s functional currency is the currency of the primary economic environment in which the entity operates. The functional currency of Group entities is the currency of their home country.
The financial statements of entities whose functional currency is not the euro and is not the currency of a hyperinflationary economy are translated into euros as follows:
- assets and liabilities are translated at the period-end closing rate;
- income and expenses are translated at the weighted average exchange rate for the period;
- all resulting exchange differences are recognised in “Other comprehensive income” and are taken into account in the calculation of any gain or loss realised on the subsequent disposal of the foreign operation;
- items in the statement of cash flows are translated at the average rate for the period unless the rate on the transaction date is materially different.
No Group companies operated in a hyperinflationary economy in either 2017 or 2016.
Translation of foreign currency transactions
Transactions by Group entities in a currency other than their functional currency are initially translated at the exchange rate on the transaction date.
At each period-end, monetary assets and liabilities denominated in foreign currency are translated at the period-end closing rate and the resulting exchange gain or loss is recorded in the income statement.
Intra-group loans to certain foreign operations are treated as part of the net investment in that operation if settlement of the loan is neither planned nor likely to occur. The gain or loss arising from translation of the loan at each successive period-end is recorded directly in “Other comprehensive income” in accordance with IAS 21 – The Effects of Changes in Foreign Exchange Rates.
Non-current assets and disposal groups held for sale and discontinued operations
If the carrying amount of a non-current asset (or disposal group) will be recovered principally through a sale transaction rather than through continuing use, it is presented separately in the consolidated statement of financial position under “Assets held for sale” in accordance with IFRS 5 – Non-current Assets Held for Sale and Discontinued Operations. Liabilities related to non-current assets held for sale are also reported on a separate line of the consolidated statement of financial position (under “Liabilities related to assets held for sale”). Following their classification as held for sale, the assets concerned are measured at the lower of their carrying amount and fair value less costs to sell and they cease to be depreciated or amortised.
A discontinued operation is a component of an entity that has been either disposed of or classified as held for sale, and:
- represents a separate major line of business or geographical area of operations; and
- is part of a single coordinated plan to dispose of a separate major line of business or geographical area of operations; or

Carrefour Group – Consolidated Financial Statements as of December 31, 2017 - 18 -
Notes to the Consolidated Financial Statements
- is a subsidiary acquired exclusively with a view to resale.
It is classified as a discontinued operation at the time of sale or earlier if its assets and liabilities meet the criteria for classification as “held for sale”. When a component of an entity is classified as a discontinued operation, comparative income statement and cash flow information is restated as if the entity had met the criteria for classification as a discontinued operation on the first day of the comparative period.
In addition, all the assets and liabilities of the discontinued operation are presented on separate lines on each side of the statement of financial position, for the amounts at which they would be reported at the time of sale after eliminating intra-group items.
3.2 Main changes in scope of consolidation
3.2.1 Changes in 2017
IPO of the Group’s Brazil operations
The initial public offering of Grupo Carrefour Brasil shares took place on July 20, 2017 and
consisted of:
- a primary offering of 205,882,353 shares issued by Grupo Carrefour Brasil; and
- a secondary offering of 125,631,365 Grupo Carrefour Brasil shares, of which 68,831,365 shares sold by Carrefour (including additional shares placed in respect of the secondary over-allotment option).
Carrefour also sold 71,003,063 Grupo Carrefour Brasil shares to Península after the latter exercised its call option.
After completion of the IPO and the exercise by Península of its call option, Carrefour holds a 71.8% interest in Grupo Carrefour Brasil, while Península holds 11.5% and Grupo Carrefour Brasil’s free float is 16.7%.
These operations had no impact on the analysis of control over Group subsidiaries in Brazil, which therefore continue to be consolidated within Carrefour’s Consolidated Financial Statements.
The primary offering resulted in (i) the recognition of non-controlling interests in an amount of
370 million euros, and (ii) an increase of 470 million euros in shareholders’ equity, Group share corresponding to the dilution gain. In accordance with IFRS 10 – Consolidated Financial Statements, Carrefour’s sale of Grupo Carrefour Brasil shares within the context of the secondary offering and following Península’s exercise of its call option, resulted in (i) a 274 million-euro disposal gain net of tax and directly related selling costs recorded within “Shareholders’ equity, Group share” and (ii) the recognition of non-controlling interests for 208 million euros.
Absorption of Carmila by Cardety
Carmila was absorbed by Cardety on June 12, 2017. Shares in the new entity, named Carmila, are listed on Euronext Paris. In addition, the Carmila Group increased its share capital by 628.6 million euros in July 2017 in order to finance its 2017-2020 development plan. Having subscribed to the capital increase in an amount of 50 million euros, Carrefour now owns 35.76% of the shares and voting rights of Carmila.
In parallel with the merger, the entity’s corporate governance rules were adapted, resulting in the
restructuring of its administration and management bodies, and amendments to its articles of association and the Board of Directors’ internal rules. In light of the amended corporate governance rules, the Group considers that it has significant influence over the new entity, Carmila, which is accounted for using the equity method. The Group’s position is primarily based on the fact that the Carrefour Group is not represented by a majority on the Board of Directors, which comprises 14 members, of which eight are independent and five are appointed by Carrefour.
Therefore, the Group cannot alone impose decisions requiring the Board’s prior consent, which partly concern the relevant activities.
Prior to the merger, both Cardety and Carmila were accounted for using the equity method. Accordingly, the only impact of this transaction on the Consolidated Financial Statements was the recognition of a non-material dilution gain.

Carrefour Group – Consolidated Financial Statements as of December 31, 2017 - 19 -
Notes to the Consolidated Financial Statements
Acquisition of hypermarkets in Spain On February 29, 2016, the Carrefour Group announced it had signed an agreement with the
Eroski Group to acquire 36 compact hypermarkets with a total sales area of 235,000 square meters, as well as 8 shopping malls and 22 service stations adjacent to the stores.
The conditions precedent were met during the year for the acquisition of 31 stores.
In accordance with IFRS 3 – Business Combinations, following the evaluation of the assets acquired and liabilities assumed carried out by the Group, the acquisition-date fair value of the net assets acquired, which correspond primarily to land and buildings included within “Property and
equipments” and “Investment property”, was estimated to 78 million euros. Considering the 168 million-euro acquisition price, fully paid in cash during the year, goodwill of 90 million euros was recognised in the Consolidated Financial Statements.
The effect of the acquisition on 2017 consolidated operating income and net income was not material.
The revenue and profit attributable to the acquired operations (part of the Spain operating segment) recorded in the consolidated statement of comprehensive income for the period was not
material.
3.2.2 Changes in 2016
Acquisition of Billa Romania
The acquisition of Billa Romania completed on June 30, 2016 led to the recognition of negative goodwill in accordance with IFRS 3, for a non-material amount.
Acquisition of Rue du Commerce
The acquisition of Rue du Commerce completed in January 2016 led to the recognition of negative goodwill in accordance with IFRS 3, for a non-material amount.
Creation of Cargo Property Cargo Property Holding is a new real estate company set up with external investors to own logistics facilities. The Company is 35.2%-owned by the Group with the remaining shares held by three co-investors. As well as being its largest shareholder, Carrefour is also the sole lessee of the assets held by Cargo Property Holding and its subsidiaries. In light of the rules governing the appointment and dismissal of Cargo Property’s legal manager, as specified in the shareholders’
agreement, Carrefour has the ability to direct decisions about the relevant activities. The Group therefore considers that it controls Cargo Property Holding and its subsidiaries and these companies have been fully consolidated in the 2017 and 2016 financial statements.
Other changes
Other changes in scope of consolidation in 2016 mainly resulted from the following transactions:
- Transaction leading to the loss of control of Carrefour Property Development (renamed
Cardety), which was 43.1%-owned at December 31, 2016 (and accounted for as an associate by the equity method from April 2016);
- Several acquisitions in France in the e-commerce sector (including Greenweez, the leading online organic food retailer).

Carrefour Group – Consolidated Financial Statements as of December 31, 2017 - 20 -
Notes to the Consolidated Financial Statements
3.3 Scope of consolidation at December 31, 2017 The list of consolidated companies (subsidiaries and associates) is presented in Note 16.
The Group reviewed its analyses of control over subsidiaries in which it is not the sole investor, in light of changes in facts and circumstances during the year, and particularly those transactions described in Note 3.2. Based on its review, there were no changes in the type of control exercised over these subsidiaries.
3.4 Net income/(loss) from discontinued operations In 2016, the net loss from discontinued operations amounted to 40 million euros, corresponding mainly to the loss generated by Dia stores sold during the year or held for sale at the year-end, which were classified as discontinued operations in accordance with IFRS 5 – Non-current Assets
Held for Sale and Discontinued Operations.

Carrefour Group – Consolidated Financial Statements as of December 31, 2017 - 21 -
Notes to the Consolidated Financial Statements
NOTE 4: SEGMENT INFORMATION
Accounting principles
IFRS 8 – Operating Segments requires the disclosure of information about an entity’s operating segments derived from the internal reporting system and used by the entity’s chief operating decision-maker to make decisions about resources to be allocated to the segment and assess its performance. The Carrefour Group’s operating segments consist of the countries in which it conducts its business through the integrated store network, as each country’s results are reviewed monthly by the Group’s Chief Executive Officer who is the chief operating decision-maker within the meaning of IFRS 8.
Countries located in the same region are considered to have similar characteristics and have been combined to create four geographical segments, as allowed by IFRS 8. These segments are:
• France;
• Rest of Europe: Spain, Italy, Belgium, Poland and Romania;
• Latin America: Brazil and Argentina;
• Asia: China and Taiwan.
The income and expenses of certain support entities are allocated to the various countries proportionately to the services provided to each, with any unallocated income and expenses reported under “Global functions”.
Segment assets include goodwill, other intangible assets, property and equipment, investment property and “other segment assets”, corresponding to inventories, trade receivables, consumer credit granted by the financial services companies and other assets. Segment liabilities comprise suppliers and other creditors, consumer credit financing and other payables.
Segment capital expenditure corresponds to the acquisitions of property and equipment and intangible assets (other than goodwill) reported in the statement of cash flows.
The disclosures in the tables below have been prepared using the same accounting policies as those applied to prepare the Consolidated Financial Statements.
4.1 Segment results
2017 (in € millions) Total France EuropeLatin
AmericaAsia
Global
Functions
Net sales 78,897 35,835 21,112 16,042 5,907 0
Other revenue 2,722 871 692 802 300 56
Recurring operating income before
depreciation and amortisation3,636 1,384 1,136 936 182 (2)
Recurring operating income 2,006 692 677 715 4 (83)
Capital expenditure 2,379 903 636 526 164 150
Depreciation and amortisation expense (1)
(1,630) (692) (459) (221) (178) (81)
2016 (in € millions) Total France EuropeLatin
AmericaAsia
Global
Functions
Net sales 76,645 35,877 20,085 14,507 6,176 0
Other revenue 2,720 877 718 750 301 74
Recurring operating income before
depreciation and amortisation3,886 1,680 1,134 901 142 29
Recurring operating income 2,351 1,031 712 711 (58) (45)
Capital expenditure 2,749 1,287 625 519 174 144
Depreciation and amortisation expense (1)
(1,535) (650) (422) (190) (200) (74)
(1) Including the depreciation and amortisation relating to logistics equipment included in the cost of sales.

Carrefour Group – Consolidated Financial Statements as of December 31, 2017 - 22 -
Notes to the Consolidated Financial Statements
4.2 Segment assets and liabilities
December 31, 2017 (in € millions) Total France EuropeLatin
AmericaAsia
Global
Functions
ASSETS
Goodwill 7,977 4,814 2,518 537 106 1
Other intangible assets 1,364 275 451 157 27 453
Property and equipment 13,097 5,670 3,896 2,574 946 11
Investment property 410 4 160 120 126 -
Other segment assets 17,839 9,158 3,402 3,808 923 549
Total segment assets 40,686 19,921 10,427 7,195 2,128 1,015
Unallocated assets 7,127
Total Assets 47,813
LIABILITIES (excluding equity)
Segment liabilities 24,655 11,658 5,781 4,616 2,137 462
Unallocated liabilities 11,000
Total Liabilities 35,654
December 31, 2016 (in € millions) Total France EuropeLatin
AmericaAsia
Global
Functions
ASSETS
Goodwill 8,640 4,775 3,124 627 112 1
Other intangible assets 1,266 298 395 158 25 390
Property and equipment 13,406 5,716 3,782 2,815 1,079 14
Investment property 314 3 128 46 137 -
Other segment assets 18,024 9,342 3,324 3,851 1,165 342
Total segment assets 41,650 20,134 10,754 7,497 2,517 748
Unallocated assets 7,195
Total Assets 48,845
LIABILITIES (excluding equity)
Segment liabilities 25,139 11,927 5,767 4,597 2,429 420
Unallocated liabilities 11,698
Total Liabilities 36,837

Carrefour Group – Consolidated Financial Statements as of December 31, 2017 - 23 -
Notes to the Consolidated Financial Statements
NOTE 5: OPERATING ITEMS
5.1 Revenue Accounting principles
Revenue (“Total revenue”) comprises net sales and other revenue.
Net sales correspond exclusively to sales via the Group’s stores, e-commerce sites and service stations (to end-customers) and cash-and-carry sales (to franchisees).
Other revenue comprises revenue from banking and insurance activities (including bank card fees, and arranging fees for traditional and revolving credit facilities), property development revenue, travel agency fees, commissions relating to e-commerce sales made on behalf of third parties (Marketplaces), shopping mall rents and franchise fees.
Revenue is measured at the fair value of the consideration received or receivable in exchange for goods or services, excluding sales taxes and net of any benefits granted to customers.
Deferred loyalty award credits granted to customers as part of a sales transaction are accounted for as a separate component of the sale transaction. They are measured at fair value with some of the proceeds of the initial sale allocated to the award credits accounted for as a liability. The deferred portion of the proceeds is recognised as revenue when the award credits are used by the customer, in accordance with IFRIC 13 – Customer Loyalty Programmes.
Revenue is recognised:
- On sales of goods, when the risks and rewards of ownership of the goods are transferred to the customer (commonly at the store checkout for the sales via the Group’s stores, or on the delivery date for sales via e-commerce sites and sales to franchisees);
- On sales of services, in the period in which the service is rendered. Financial services revenues (bank card fees and arranging fees for traditional and revolving credit facilities) are recognised over the life of the contract.
5.1.1 Net sales
(in € millions) 2017 2016 % change
Net sales 78,897 76,645 2.9%
Excluding the currency effect, 2017 net sales amounted to 78,628 million euros versus 76,645 million euros the previous year, an increase of 2.6%.
Changes in exchange rates added 269 million euros to net sales in 2017, and mainly concerned the Latin America segment. Net sales by country
(in € millions) 2017 2016 (in € millions) 2017 2016
France 35,835 35,877 Latin America 16,042 14,507
Brazil 13,248 11,772
Rest of Europe 21,112 20,085Argentina 2,795 2,735
Spain 8,634 8,049
Italy 4,919 4,892 Asia 5,907 6,176
Belgium 3,993 3,994 China 4,050 4,446
Poland 1,785 1,649 Taiwan 1,857 1,729
Romania 1,781 1,501

Carrefour Group – Consolidated Financial Statements as of December 31, 2017 - 24 -
Notes to the Consolidated Financial Statements
5.1.2 Other revenue
(in € millions) 2017 2016 % change
Financing fees and commissions (1)
1,384 1,373 0.8%
Rental revenue 228 213 6.9%
Revenue from sub-leases 256 260 (1.2%)
Property development revenue (2)
89 113 (21.6%)
Other revenue (3)
765 761 0.5%
Total Other revenue 2,722 2,720 0.1%
(1) Including net banking revenue and net insurance revenue generated by the Group’s financial services and insurance companies.
(2) Corresponding to the sale price of properties developed by the Group for resale. After deducting development costs recorded in “Cost of
sales”, the property development margin amounts to 20 million euros in 2017 (38 million euros in 2016).
(3) The amounts reported on the “Other revenue” line in the above table correspond mainly to franchise fees, business lease fees and related
revenue.
5.2 Recurring operating income
Accounting principles
Recurring operating income is an earnings indicator disclosed in order to help users of the Consolidated Financial Statements to better understand the Group’s underlying operating performance. It corresponds to operating income (defined as earnings from continuing operations before interest and tax) before material items that are unusual in terms of their nature and frequency and are reported under “Non-recurring income” or “Non-recurring expenses” (Note 5.3).
5.2.1 Cost of sales Accounting principles
Cost of sales corresponds to the cost of purchases net of rebates and commercial income, changes in inventory (including impairments), discounting revenue, exchange gains and losses on goods purchases, logistics costs and other costs (primarily the cost of products sold by the financial services companies and the production costs of the property development business).
Rebates are calculated based on immediate or deferred discount rates on purchases, as specified in the contractual terms negotiated each year. Rebates can be:
- unconditional, i.e., proportionate to total purchases and subject to no other conditions;
- conditional, i.e., dependent on meeting certain conditions (e.g., growth in the supplier’s net sales with the Group).
Commercial income corresponds to income from services carried out by Carrefour for its suppliers.
Rebates and commercial income recognised in “Cost of sales” are measured based on the contractual terms specified in the agreements signed with suppliers.
5.2.2 Sales, general and administrative expenses, and depreciation and
amortisation
(in € millions) 2017 2016 % change
Sales, general and administrative expenses (14,641) (14,147) 3.5%
Depreciation and amortisation of tangible and intangible assets, and investment property (1,567) (1,487) 5.4%
Total SG&A and depreciation and amortisation (16,209) (15,634) 3.7%

Carrefour Group – Consolidated Financial Statements as of December 31, 2017 - 25 -
Notes to the Consolidated Financial Statements
Sales, general and administrative expenses
Sales, general and administrative expenses break down as follows:
(in € millions) 2017 2016 % change
Employee benefits expense (8,599) (8,240) 4.4%
Property rentals (1,086) (1,022) 6.2%
Advertising expense (973) (955) 1.9%
Fees (888) (895) (0.7%)
Maintenance and repair costs (850) (796) 6.7%
Energy and electricity (628) (670) (6.3%)
Taxes other than on income (595) (578) 2.9%
Other SG&A expenses (1,023) (992) 3.2%
Total SG&A expenses (14,641) (14,147) 3.5%
Depreciation and amortisation
Including supply chain depreciation recognised in cost of sales, total depreciation and amortisation expense recognised in the consolidated income statement amounted to 1,630 million euros in 2017 (2016: 1,535 million euros), as follows:
(in € millions) 2017 2016 % change
Property and equipment (1,359) (1,313) 3.5%
Intangible assets (175) (143) 22.0%
Assets under finance leases (20) (18) 11.5%
Investment property (13) (12) 10.5%
Depreciation and amortisation of tangible and intangible assets and
investment property(1,567) (1,487) 5.4%
Depreciation and amortisation of logistic activity (63) (48) 30.2%
Total Depreciation and amortisation (1,630) (1,535) 6.2%
5.3 Non-recurring income and expenses
Accounting principles
In accordance with the recommendation of the French accounting authorities (Autorité des normes comptables [ANC] recommendation no. 2013-03 dated November 7, 2013), non-recurring income and expenses are reported on a separate line of the income statement. Non-recurring items are defined as “items that are limited in number, clearly identifiable and non-recurring that have a material impact on consolidated results”.
This classification is applied to certain material items of income and expense that are unusual in terms of their nature and frequency, such as non-recurring impairment charges, restructuring costs and provision charges and incomes recorded to reflect revised estimates of risks provided for in prior periods, based on information that came to the Group’s attention during the reporting year.
They are presented separately in the income statement to “help users of the financial statements to better understand the Group’s underlying operating performance and provide them with useful information to assess the earnings outlook”.

Carrefour Group – Consolidated Financial Statements as of December 31, 2017 - 26 -
Notes to the Consolidated Financial Statements
(in € millions) 2017 2016
Net gains on sales of assets 22 39
Restructuring costs (279) (154)
Other non-recurring income and expenses (13) (127)
Non-recurring income and expenses, net before asset impairments
and write-offs(271) (242)
Asset impairments and write-offs (1,039) (130)
Impairments and write-offs of goodwill (707) (5)
Impairments and write-offs of property and equipment and intangible assets (332) (125)
Non-recurring income and expenses, net (1,310) (372)
of which:
Non-recurring income 397 118
Non-recurring expense (1,706) (490)
Net gains on sales of assets
As in 2016, gains on disposals of assets in 2017 primarily related to sales of various individually
non-material assets.
Restructuring costs
Restructuring costs recognised in 2017 concerned plans to streamline operating structures in several of the Group’s countries. Restructuring measures primarily concern France (particularly costs relating to the overhaul of supply chains), Italy, Argentina, China (store closure plan), and Spain (plan to integrate the hypermarkets acquired from Eroski).
The expense recognised in 2016 mainly includes the residual impact of integrating the Dia France stores acquired in late 2014, as well as costs relating to the overhaul of supply chains in France. Impairment losses and asset write-offs
In defining its transformation plan, the Group reviewed its financial trajectories and adjusted certain assumptions underlying financial projections for its operations in Italy. The impairment
tests carried out on this basis (see the accounting principles in Note 6.3) led the Group to recognize a 700 million-euro impairment loss against goodwill allocated to its Italian operations. This impairment loss has no impact on cash flow.
Impairment was also recognised against non-current assets other than goodwill in an amount of 302 million euros, primarily in France, China and Italy. This impairment reflects a decline in the outlook for an improvement in the profitability of certain loss-making stores, including stores which the Group intends to sell or close in 2018 within the scope of the transformation plan announced on
January 23, 2018 (particularly former Dia stores in France). In addition, 30 million euros’ worth of assets were written off during the year (2016: 33 million euros).
In 2016, impairment losses against non-current assets other than goodwill totalled 93 million euros and chiefly concerned assets of loss-making stores, mainly in China. Other non-recurring income and expenses
Other non-recurring income and expenses recognised in 2016 consisted mainly of the impact of a
change in accounting treatment of the tax on retail space in France (TaSCom) under IFRIC 21 – Levies. The TaSCom Act dated July 13, 1972 was modified by France’s Amended Finance Act for
2015 and by the 2017 Finance Act.
Carrefour Group – Consolidated Financial Statements as of December 31, 2017 - 27 -
Notes to the Consolidated Financial Statements
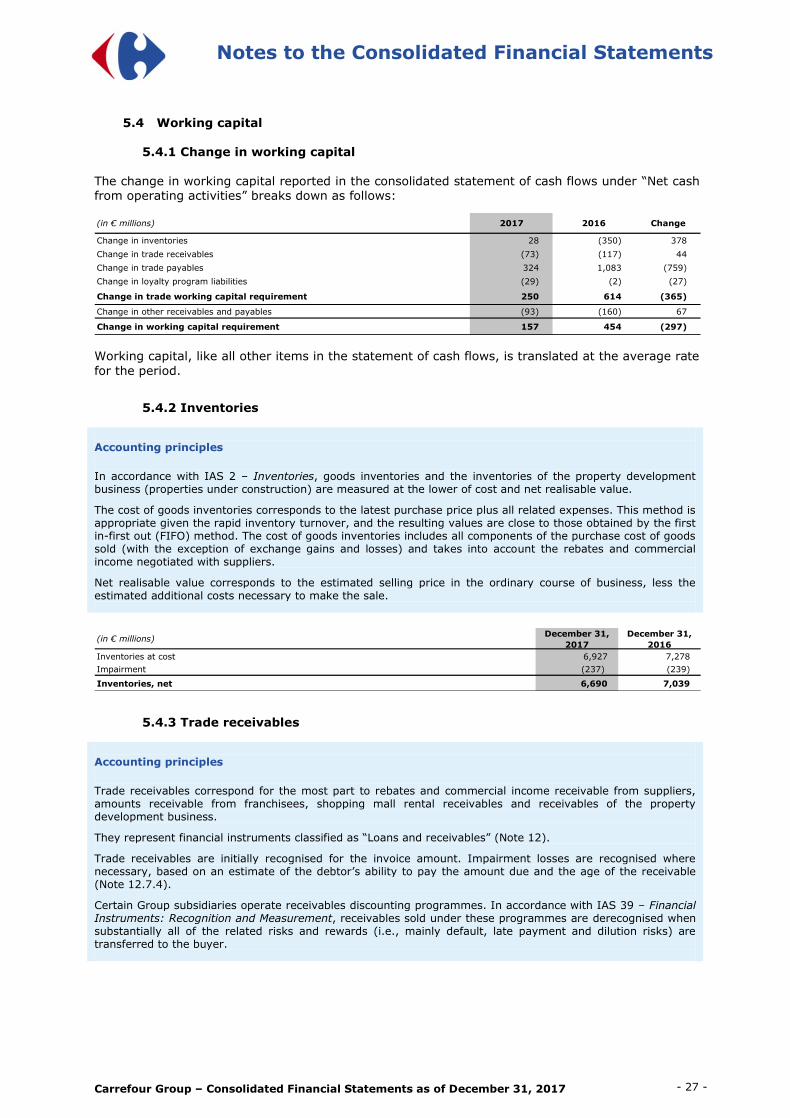
5.4 Working capital 5.4.1 Change in working capital
The change in working capital reported in the consolidated statement of cash flows under “Net cash from operating activities” breaks down as follows:
(in € millions) 2017 2016 Change
Change in inventories 28 (350) 378
Change in trade receivables (73) (117) 44
Change in trade payables 324 1,083 (759)
Change in loyalty program liabilities (29) (2) (27)
Change in trade working capital requirement 250 614 (365)
Change in other receivables and payables (93) (160) 67
Change in working capital requirement 157 454 (297)
Working capital, like all other items in the statement of cash flows, is translated at the average rate
for the period.
5.4.2 Inventories Accounting principles
In accordance with IAS 2 – Inventories, goods inventories and the inventories of the property development business (properties under construction) are measured at the lower of cost and net realisable value.
The cost of goods inventories corresponds to the latest purchase price plus all related expenses. This method is appropriate given the rapid inventory turnover, and the resulting values are close to those obtained by the first in-first out (FIFO) method. The cost of goods inventories includes all components of the purchase cost of goods sold (with the exception of exchange gains and losses) and takes into account the rebates and commercial income negotiated with suppliers.
Net realisable value corresponds to the estimated selling price in the ordinary course of business, less the estimated additional costs necessary to make the sale.
(in € millions)December 31,
2017
December 31,
2016
Inventories at cost 6,927 7,278
Impairment (237) (239)
Inventories, net 6,690 7,039
5.4.3 Trade receivables Accounting principles
Trade receivables correspond for the most part to rebates and commercial income receivable from suppliers, amounts receivable from franchisees, shopping mall rental receivables and receivables of the property development business.
They represent financial instruments classified as “Loans and receivables” (Note 12).
Trade receivables are initially recognised for the invoice amount. Impairment losses are recognised where necessary, based on an estimate of the debtor’s ability to pay the amount due and the age of the receivable (Note 12.7.4).
Certain Group subsidiaries operate receivables discounting programmes. In accordance with IAS 39 – Financial Instruments: Recognition and Measurement, receivables sold under these programmes are derecognised when substantially all of the related risks and rewards (i.e., mainly default, late payment and dilution risks) are transferred to the buyer.

Carrefour Group – Consolidated Financial Statements as of December 31, 2017 - 28 -
Notes to the Consolidated Financial Statements
(in € millions)December 31,
2017
December 31,
2016
Receivables from clients 1,601 1,523
Impairment (168) (181)
Receivables from clients, net 1,433 1,342
Receivables from suppliers 1,317 1,341
Total Trade receivables 2,750 2,682
5.4.4 Suppliers and other creditors Accounting principles
Suppliers and other creditors correspond primarily to trade payables. They also include payables that suppliers have transferred to financial institutions as part of reverse factoring programmes, as there is no substantial difference in the nature or terms of the liabilities before and after factoring.
They are classified in the category of “Financial liabilities measured at amortised cost”, as defined in IAS 39 – Financial Instruments: Recognition and Measurement (Note 12). Suppliers and other creditors are initially recognised at their nominal amount, which represents a reasonable estimate of fair value in light of their short maturities.
5.4.5 Tax receivables and payables Tax receivables
(in € millions)December 31,
2017
December 31,
2016
VAT and turnover tax receivables 527 811
Other tax (other than on income) receivables 41 56
Current income tax receivables (1)
322 177
Total Tax receivables 890 1,044
(1) In 2017, CICE (tax credit for competitiveness and employment) receivables were sold for a total of 197 million euros (2016: 201 million
euros). The Group was able to demonstrate that substantially all the risks and rewards of ownership of the tax credits had been transferred to
the buyer and the credits were therefore derecognised by analogy with the principle in IAS 39 concerning the derecognition of financial assets. The cost of this discounting transaction amounted to 1.6 million euros (2016: 3.5 million euros) and was recorded in “Other financial income
and expenses”.
Tax payables
(in € millions)December 31,
2017
December 31,
2016
VAT and turnover tax payables 425 379
Other tax (other than on income) payables 699 750
Current income tax payables 157 130
Total Tax payables 1,282 1,260
5.4.6 Other current assets and other payables Other assets
(in € millions)December 31,
2017
December 31,
2016
Prepaid expenses 344 327
Proceeds receivable from disposals of non-current assets 44 16
Employee advances 18 20
Other operating receivables, net 445 544
Total Other current assets 851 907
Prepaid expenses – long term 73 79
Tax receivables – long term (1) 264 -
Total Other non-current assets 337 79
(1) These correspond to tax credits expected to be collected in over 12 months which were previously included in tax receivables within current assets.

Carrefour Group – Consolidated Financial Statements as of December 31, 2017 - 29 -
Notes to the Consolidated Financial Statements
Other payables
(in € millions)December 31,
2017
December 31,
2016
Accrued employee benefits expense 1,608 1,760
Payables to suppliers of non-current assets 640 752
Deferred revenue 118 122
Other payables 447 519
Total Other payables 2,813 3,153
5.5 Banking and insurance activities Accounting principles
To support its core retailing business, the Group offers banking and insurance services to customers, mainly in France, Spain and Brazil.
The financial services companies offer their customers “Carrefour” bank cards that can be used in the Group’s stores and elsewhere, consumer loans and savings products such as life insurance and passbook savings accounts. Due to its contribution to the Group’s total assets and liabilities and its specific financial structure, this secondary business is presented separately in the Consolidated Financial Statements:
- Consumer credit granted by the financial services companies (payment card receivables, personal loans, etc.) is presented in the statement of financial position under “Consumer credit granted by the financial
services companies – long-term” and “Consumer credit granted by the financial services companies – short-term”, as appropriate.
- Financing for these loans is presented under “Consumer credit financing – long-term” and “Consumer credit financing – short-term”, as appropriate.
- The other assets and liabilities of the banking activities (property and equipment, intangible assets, cash and cash equivalents, accrued taxes and payroll costs, etc.) are presented on the corresponding lines of the statement of financial position.
- Net revenues from banking activities are reported in the income statement under “Other revenue”.
- The change in the banking and insurance activities’ working capital is reported in the statement of cash flows under “Change in consumer credit granted by the financial services companies”.
5.5.1 Consumer credit granted by the financial services companies At December 31, 2017, consumer credit granted by the financial services companies totalled
6,321 million euros (December 31, 2016: 6,273 million euros), as follows:
(in € millions)December 31,
2017
December 31,
2016
Payment card receivables 4,352 4,432
Loans 2,450 2,347
Consumer credit (on purchases made in Carrefour stores) 70 69
Other financing 273 289
Impairment (824) (863)
Total Consumer credit granted by the financial services companies 6,321 6,273
Short-term financing 3,866 3,902
Long-term financing 2,455 2,371

Carrefour Group – Consolidated Financial Statements as of December 31, 2017 - 30 -
Notes to the Consolidated Financial Statements
5.5.2 Consumer credit financing The related consumer credit financing amounted to 5,478 million euros at December 31, 2017
(December 31, 2016: 5,330 million euros), as follows:
(in € millions)December 31,
2017
December 31,
2016
Debt securities (retail certificates of deposit, medium-term notes) 1,032 1,251
Bank borrowings 554 317
Bonds and notes (1) 1,932 1,846
Customer passbook savings deposits 567 501
Securitisations (2) 410 510
Other refinancing debt to financial institutions 973 886
Other 10 19
Total Consumer credit financing 5,478 5,330
Short-term borrowings 2,817 3,395
Long-term borrowings 2,661 1,935
(1) A zero-coupon, four-year loan obtained in 2017 by Carrefour Banque from the European Central Bank for 400 million euros (maturing in March
2021).
(2) In 2016:
- new bond issue by Carrefour Banque: Carrefour Banque 5-year bonds due April 20, 2021, at 3-month Euribor +68bps for 500 million euros;
- redemption by Carrefour Banque in April of variable rate bonds representing a nominal amount of 300 million euros.
(3) Master Credit Cards Pass reloadable securitisation programme with compartments launched by Carrefour Banque in November 2013. Asset
pool: 560 million euros. Proceeds from the securitisation: 400 million euros. The fund amount at December 31, 2017 was 410 million euros
(510 million euros at December 31, 2016). The securitisation fund is fully consolidated in the Group’s financial statements.
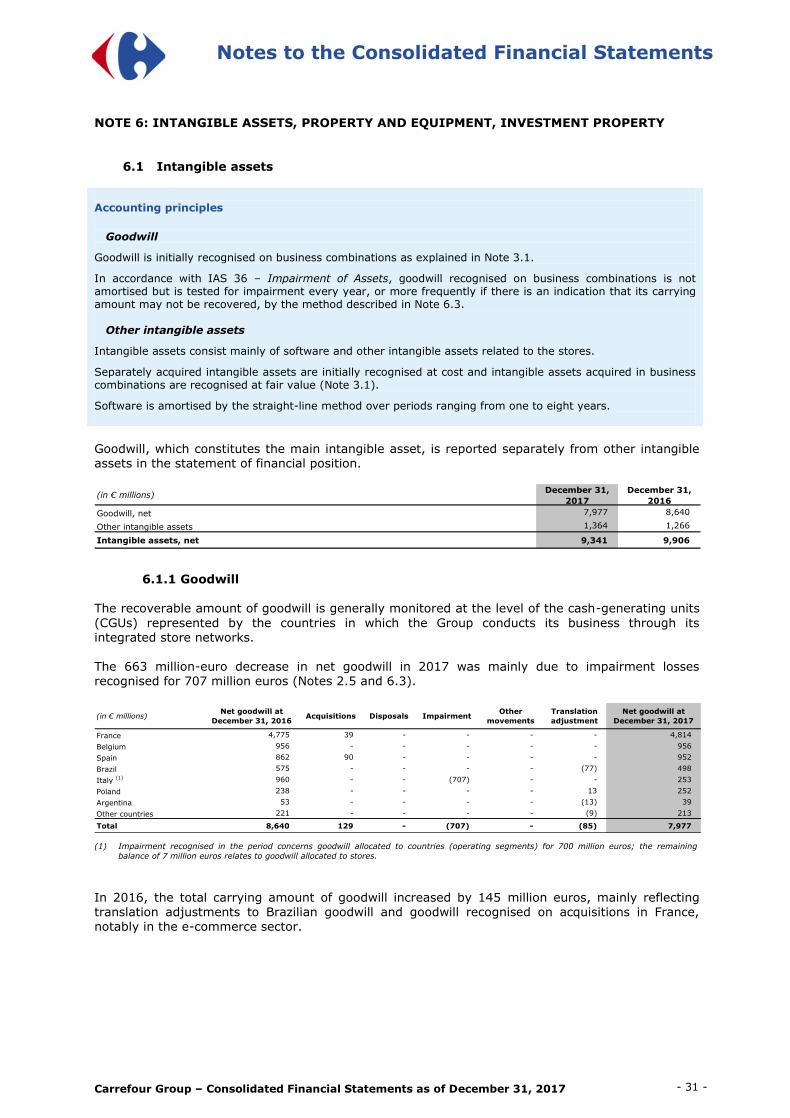
Carrefour Group – Consolidated Financial Statements as of December 31, 2017 - 31 -
Notes to the Consolidated Financial Statements
NOTE 6: INTANGIBLE ASSETS, PROPERTY AND EQUIPMENT, INVESTMENT PROPERTY
6.1 Intangible assets Accounting principles
Goodwill
Goodwill is initially recognised on business combinations as explained in Note 3.1.
In accordance with IAS 36 – Impairment of Assets, goodwill recognised on business combinations is not amortised but is tested for impairment every year, or more frequently if there is an indication that its carrying amount may not be recovered, by the method described in Note 6.3.
Other intangible assets
Intangible assets consist mainly of software and other intangible assets related to the stores.
Separately acquired intangible assets are initially recognised at cost and intangible assets acquired in business combinations are recognised at fair value (Note 3.1).
Software is amortised by the straight-line method over periods ranging from one to eight years.
Goodwill, which constitutes the main intangible asset, is reported separately from other intangible assets in the statement of financial position.
(in € millions)December 31,
2017
December 31,
2016
Goodwill, net 7,977 8,640
Other intangible assets 1,364 1,266
Intangible assets, net 9,341 9,906
6.1.1 Goodwill
The recoverable amount of goodwill is generally monitored at the level of the cash-generating units
(CGUs) represented by the countries in which the Group conducts its business through its integrated store networks. The 663 million-euro decrease in net goodwill in 2017 was mainly due to impairment losses recognised for 707 million euros (Notes 2.5 and 6.3).
(in € millions)Net goodwill at
December 31, 2016Acquisitions Disposals Impairment
Other
movements
Translation
adjustment
Net goodwill at
December 31, 2017
France 4,775 39 - - - - 4,814
Belgium 956 - - - - - 956
Spain 862 90 - - - - 952
Brazil 575 - - - - (77) 498
Italy (1) 960 - - (707) - - 253
Poland 238 - - - - 13 252
Argentina 53 - - - - (13) 39
Other countries 221 - - - - (9) 213
Total 8,640 129 - (707) - (85) 7,977
(1) Impairment recognised in the period concerns goodwill allocated to countries (operating segments) for 700 million euros; the remaining
balance of 7 million euros relates to goodwill allocated to stores.
In 2016, the total carrying amount of goodwill increased by 145 million euros, mainly reflecting translation adjustments to Brazilian goodwill and goodwill recognised on acquisitions in France, notably in the e-commerce sector.

Carrefour Group – Consolidated Financial Statements as of December 31, 2017 - 32 -
Notes to the Consolidated Financial Statements
(in € millions)Net goodwill at
December 31, 2015Acquisitions Disposals Impairment
Other
movements
Translation
adjustment
Net goodwill at
December 31, 2016
France 4,718 66 (17) - 8 - 4,775
Italy 964 - - (5) - - 960
Belgium 957 - - - (1) - 956
Spain 862 - - - - - 862
Brazil 465 - - - - 110 575
Poland 246 - - - - (8) 238
Argentina 63 - - - - (10) 53
Other countries 220 - - - - 1 221
Total 8,495 66 (17) (5) 8 93 8,640
6.1.2 Other intangible assets
(in € millions)December 31,
2017
December 31,
2016
Other intangible assets, at cost 3,233 2,987
Amortisation (1,974) (1,859)
Impairment (90) (78)
Intangible assets in progress 195 216
Other intangible assets, net 1,364 1,266
Change in other intangible assets
(in € millions) CostAmortisation and
impairmentNet
At December 31, 2015 3,393 (2,379) 1,014
Acquisitions 357 - 357
Disposals (704) 659 (45)
Translation adjustment 72 (50) 22
Amortisation - (150) (150)
Impairment - (10) (10)
Changes in scope of consolidation, transfers and other movements 85 (8) 76
At December 31, 2016 3,202 (1,937) 1,266
Acquisitions 379 - 379
Disposals (81) 33 (48)
Translation adjustment (70) 43 (27)
Amortisation - (181) (181)
Impairment - (18) (18)
Changes in scope of consolidation, transfers and other movements (3) (3) (6)
At December 31, 2017 3,427 (2,063) 1,364
6.2 Property and equipment
Accounting principles
Property and equipment mainly comprise buildings, store fixtures and fittings and land.
Initial recognition
In accordance with IAS 16 – Property, Plant and Equipment, land, buildings and equipment are stated at cost less accumulated depreciation and any accumulated impairment losses. Borrowing costs that are directly attributable to the acquisition, construction or production of a qualifying asset are capitalised as part of the cost of the asset. Qualifying assets are defined in IAS 23 – Borrowing Costs as assets that necessarily take a substantial period of time to get ready for their intended use or sale, corresponding in the Group’s case to investment properties, hypermarkets and supermarkets for which the construction period exceeds one year.
Assets under construction are recognised at cost less any identified impairment losses.
Useful lives
Depreciation of property and equipment begins when the asset is available for use and ends when the asset is sold, scrapped or reclassified as held for sale in accordance with IFRS 5 – Non-current Assets Held for Sale and Discontinued Operations.

Carrefour Group – Consolidated Financial Statements as of December 31, 2017 - 33 -
Notes to the Consolidated Financial Statements
Land is not depreciated. Other property and equipment, or each significant part of an item of property or equipment, are depreciated by the straight-line method over the following estimated useful lives:
Buildings
Building 40 years
Site improvements 10 to 20 years
Car parks 6 to 10 years
Equipment, fixtures and fittings 4 to 8 years
Other 3 to 10 years
In light of the nature of its business, the Group considers that its property and equipment have no residual value.
Depreciation periods are reviewed at each year-end and, where appropriate, adjusted prospectively in accordance with IAS 8 – Accounting Policies, Changes in Accounting Estimates and Errors.
Leases
New long-term leases – particularly property leases – are analysed in accordance with IAS 17 – Leases to determine whether they represent finance leases, i.e., leases that transfer substantially all the risks and rewards incidental to ownership of the asset to the lessee, or operating leases. For property leases, the analysis is performed separately for the land on the one hand and the building on the other.
Finance leases are accounted for as follows:
- The leased assets are recognised in the statement of financial position at fair value or, if lower, the present value of the minimum lease payments. They are depreciated over their useful life, in the same way as assets owned outright, or, if shorter, over the lease term.
- The liability for the future lease payments is recognised in the statement of financial position under “Long-term borrowings” and “Short-term borrowings” (Note 12.2.1).
- Lease payments are apportioned between the finance charge and the reduction of the outstanding liability.
Leases that do not transfer substantially all the risks and rewards incidental to ownership of the asset to the lessee are classified as operating leases. Operating lease payments are recognised in the income statement (under “recurring operating expenses”) on a straight-line basis over the life of the lease (Note 5.2.2).
(in € millions)December 31,
2017
December 31,
2016
Land 2,576 2,565
Buildings 10,403 10,200
Equipment, fixtures and fittings 15,842 15,458
Other fixed assets 431 430
Assets under construction 658 789
Finance leases – land 456 460
Finance leases – buildings 1,171 1,182
Finance leases – equipment, fixtures and fittings 84 84
Property and equipment at cost 31,621 31,169
Depreciation (16,758) (16,237)
Depreciation of assets under finance leases (983) (968)
Impairment (783) (558)
Property and equipment, net 13,097 13,406
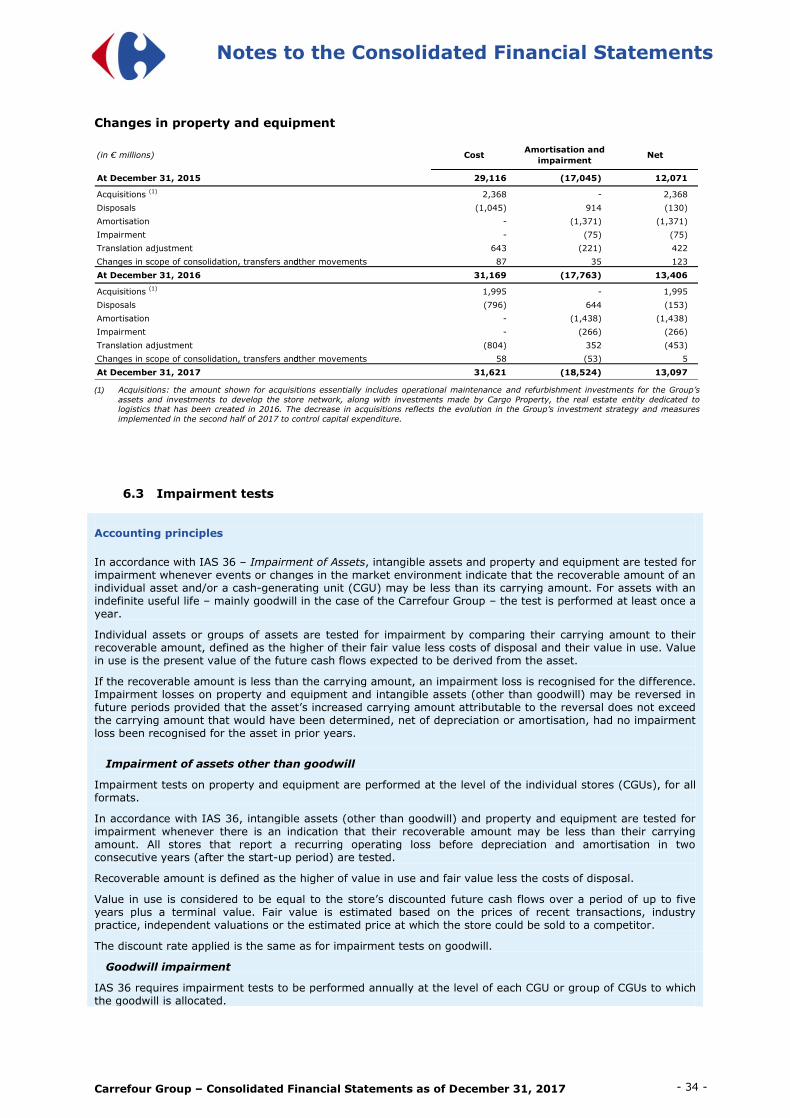
Carrefour Group – Consolidated Financial Statements as of December 31, 2017 - 34 -
Notes to the Consolidated Financial Statements
Changes in property and equipment
(in € millions) CostAmortisation and
impairmentNet
At December 31, 2015 29,116 (17,045) 12,071
Acquisitions (1)
2,368 - 2,368
Disposals (1,045) 914 (130)
Amortisation - (1,371) (1,371)
Impairment - (75) (75)
Translation adjustment 643 (221) 422
Changes in scope of consolidation, transfers and other movements 87 35 123
At December 31, 2016 31,169 (17,763) 13,406
Acquisitions (1)
1,995 - 1,995
Disposals (796) 644 (153)
Amortisation - (1,438) (1,438)
Impairment - (266) (266)
Translation adjustment (804) 352 (453)
Changes in scope of consolidation, transfers and other movements 58 (53) 5
At December 31, 2017 31,621 (18,524) 13,097
(1) Acquisitions: the amount shown for acquisitions essentially includes operational maintenance and refurbishment investments for the Group’s
assets and investments to develop the store network, along with investments made by Cargo Property, the real estate entity dedicated to logistics that has been created in 2016. The decrease in acquisitions reflects the evolution in the Group’s investment strategy and measures
implemented in the second half of 2017 to control capital expenditure.
6.3 Impairment tests Accounting principles
In accordance with IAS 36 – Impairment of Assets, intangible assets and property and equipment are tested for impairment whenever events or changes in the market environment indicate that the recoverable amount of an individual asset and/or a cash-generating unit (CGU) may be less than its carrying amount. For assets with an indefinite useful life – mainly goodwill in the case of the Carrefour Group – the test is performed at least once a year.
Individual assets or groups of assets are tested for impairment by comparing their carrying amount to their recoverable amount, defined as the higher of their fair value less costs of disposal and their value in use. Value in use is the present value of the future cash flows expected to be derived from the asset.
If the recoverable amount is less than the carrying amount, an impairment loss is recognised for the difference. Impairment losses on property and equipment and intangible assets (other than goodwill) may be reversed in future periods provided that the asset’s increased carrying amount attributable to the reversal does not exceed the carrying amount that would have been determined, net of depreciation or amortisation, had no impairment loss been recognised for the asset in prior years.
Impairment of assets other than goodwill
Impairment tests on property and equipment are performed at the level of the individual stores (CGUs), for all formats.
In accordance with IAS 36, intangible assets (other than goodwill) and property and equipment are tested for impairment whenever there is an indication that their recoverable amount may be less than their carrying amount. All stores that report a recurring operating loss before depreciation and amortisation in two consecutive years (after the start-up period) are tested.
Recoverable amount is defined as the higher of value in use and fair value less the costs of disposal.
Value in use is considered to be equal to the store’s discounted future cash flows over a period of up to five years plus a terminal value. Fair value is estimated based on the prices of recent transactions, industry practice, independent valuations or the estimated price at which the store could be sold to a competitor.
The discount rate applied is the same as for impairment tests on goodwill.
Goodwill impairment
IAS 36 requires impairment tests to be performed annually at the level of each CGU or group of CGUs to which the goodwill is allocated.

Carrefour Group – Consolidated Financial Statements as of December 31, 2017 - 35 -
Notes to the Consolidated Financial Statements
According to the standard, goodwill is allocated to the CGU or group of CGUs that is expected to benefit from the synergies of the business combination. Each CGU or group of CGUs to which the goodwill is allocated should represent the lowest level within the entity at which the goodwill is monitored for internal management purposes and should not be larger than an operating segment as defined in IFRS 8 – Operating Segments before aggregation.
For the purpose of analysing the recoverable amount of goodwill, each individual country is considered to represent a separate CGU. The choice of this level is based on a combination of organisational and strategic criteria. In particular, operations within each country (hypermarkets, supermarkets, etc.) use shared resources (country-level centralized purchasing organisation, marketing systems, headquarters functions, etc.) that represent an essential source of synergies between the various operations.
Value in use corresponds to the sum of discounted future cash flows for a period generally not exceeding five years, plus a terminal value calculated by projecting data for the final year to perpetuity at a perpetual growth rate. A specific discount rate by country is used for the calculation. Future cash flows used in the impairment tests carried out in 2017 were estimated based on the financial trajectories defined by the Group’s Executive
Management.
The discount rate for each country corresponds to the weighted average cost of equity and debt, determined using the median gearing rate for the sector. Each country’s cost of equity is determined based on local parameters (risk-free interest rate and market premium). The cost of debt is determined by applying the same logic.
Fair value is the price that would be received to sell the operations in the country tested for impairment in an orderly transaction between market participants. Fair value is measured using observable inputs where these exist (multiples of net sales and/or EBITDA for recent transactions, offers received from potential buyers, stock market multiples for comparable companies) or based on analyses performed by internal or external experts.
Additional tests are performed at the interim period-end when there is an indication of impairment. The main impairment indicators used by the Group are as follows:
- internal impairment indicator: a material deterioration in the ratio of recurring operating income before depreciation and amortisation to net revenues excluding petrol between the budget and the most recent forecast;
- external impairment indicator: a material increase in the discount rate and/or a severe downgrade in the IMF’s GDP growth forecast.
Impairment losses recognised on goodwill are irreversible, including those recorded at an interim period-end.
6.3.1 Impairment of goodwill and sensitivity analysis Based on the impairment tests carried out in 2017, the Group recognised a 700 million-euro
impairment loss against goodwill allocated to its Italian operations. In 2016, no impairment was recognised against goodwill. 6.3.1.1 Countries for which impairment was recognised against goodwill
For several years now the Group has paid particular attention to the value of its Italian operations in light of market trends observed in that country. Although the profitability of the Group’s Italian
operations has gradually improved over the past few years, in line with strategic plans (used to estimate value in use for the impairment tests carried out in previous periods), certain commercial dynamics observed in 2017 led the Group to adjust its forecast in terms of margins and free cash flow (change in cash from operating activities less operational investments) as reflected in the
financial trajectory defined by the Group’s Executive Management.
Adjustments in the operating and financial assumptions used as a basis for future cash flow forecasts led to a significant decrease in the value in use of the Group’s Italian operations. In this
context, an in-depth analysis was carried out to determine the fair value of the Group’s Italian operations. This analysis adopted a multi-criteria valuation approach which took into account multiples observed for comparable companies in the retail sector in Europe, and the market value of Italian real estate assets, determined based on independent appraisals. The resulting fair value represents Executive Management’s best estimate.
Based on the above, the impairment test on the Group’s Italian assets led to the recognition of a
700 million-euro impairment loss in 2017. At December 31, 2017, in light of cumulative impairment losses from prior periods (2,200 million euros), the residual value of goodwill allocated to Italian operations is just 253 million euros.

Carrefour Group – Consolidated Financial Statements as of December 31, 2017 - 36 -
Notes to the Consolidated Financial Statements
6.3.1.2 Countries for which the recoverable amount of goodwill was close to the carrying amount
In the impairment tests carried out at December 31, 2017, the recoverable amount of Poland CGUs
was found to be close to – but still greater than – the carrying amount. Consequently, no impairment was recognised but sensitivity analyses were performed to determine the changes in the main financial assumptions that would lead to an impairment loss being recognised. The amounts below represent the difference between the recoverable amount and the carrying amount of the net assets allocated to Poland. The “-” sign indicates that the scenario would have led to the recognition of an impairment loss for the amount shown.
-0.5% -0.25% 0.00% 0.25% 0.5%
-1.00% (2) (24) (45) (65) (83)
-0.50% 115 83 54 27 2
0.00% 191 153 117 85 55
0.50% 285 237 194 154 119
1.00% 555 475 405 343 289
Sensitivity to changes in WACC and perpetual growth rate
WACC (%)
Perp
etu
al
gro
wth
(%
)
A 50 bp decrease in the EBITDA margin (recurring operating income before depreciation and
amortization as a proportion of net sales) assumption used to determine the terminal value would not have changed the conclusions of the impairment test.
6.3.1.3 Other countries
For the other countries where the Group conducts business, the analysis of sensitivity to a simultaneous change in the key inputs based on reasonably possible assumptions did not reveal any probable scenario according to which the recoverable amount of any of the groups of CGUs
would be less than its carrying amount.
In particular, although the value in use of operations in France decreased following the adjustment of the operating and financial assumptions reflected in the financial trajectory defined by the Group’s Executive Management, it remains well above the carrying amount of assets in France.
6.3.1.4 Main financial assumptions used to estimate value in use
The perpetual growth rates and discount rates (corresponding to the weighted average cost of capital – WACC) applied for impairment testing purposes in 2017 and 2016 are presented below by CGU:
CountryAfter-tax
discount rate
Perpetual
growth rate
After-tax
discount rate
Perpetual
growth rate
France 6.3% 1.8% 6.3% 1.8%
Spain 6.8% 2.1% 6.8% 1.9%
Italy 6.7% 1.7% 6.6% 1.7%
Belgium 6.2% 1.8% 6.3% 1.8%
Poland 8.4% 3.0% 8.5% 2.8%
Romania 9.0% 2.6% 8.5% 2.5%
Brazil 12.3% 4.4% 13.0% 4.8%
Argentina 16.2% 7.4% 16.6% 7.3%
China 9.7% 2.4% 8.9% 2.6%
Taiwan 7.2% 1.9% 7.4% 1.9%
2017 2016

Carrefour Group – Consolidated Financial Statements as of December 31, 2017 - 37 -
Notes to the Consolidated Financial Statements
6.4 Investment property
Accounting principles
IAS 40 – Investment Property defines investment property as property (land or a building or both) held to earn rentals or for capital appreciation or both. Based on this definition, investment property held by the Group consists of shopping malls (retail and service units located behind the stores’ check-out area) that are exclusively or jointly owned or subject to a finance lease and represent a surface area of at least 2,500 square metres. These assets generate cash flows that are largely independent of the cash flows generated by the Group’s other retail assets.
Investment property is recognised at cost and is depreciated over the same period as owner-occupied property (Note 6.2).
Rental revenue generated by investment property is reported in the income statement under “Other revenue” on a straight-line basis over the lease term. The rewards granted by the Group under its leases are an integral
part of the net rental revenue and are recognised over the lease term (Note 6.2).
The fair value of investment property is measured twice a year:
- by applying a multiple that is a function of (i) each shopping mall’s profitability and (ii) a country-specific capitalisation rate, to the gross annualised rental revenue generated by each property; or
- by obtaining independent valuations prepared using two methods: the discounted cash flows method and the yield method. Valuers generally also compare the results of applying these methods to market values per square metre and to recent transaction values.
In view of the limited external data available, particularly concerning capitalisation rates, the complexity of the property valuation process and the use of passing rents to value the Group’s own properties, the fair value of investment property is determined on the basis of level 3 inputs.
(in € millions)December 31,
2017
December 31,
2016
Investment property at cost 593 475
Depreciation and impairment (183) (161)
Total Investment property, net 410 314
Changes in investment property (en millions d'euros)
At December 31, 2015 383
Depreciation (17)
Translation adjustment (4)
Acquisitions 33
Disposals (3)
Transfers and other movements (77)
At December 31, 2016 314
Depreciation (18)
Translation adjustment (20)
Acquisitions 12
Disposals (0)
Investment properties acquired in a business combination 29
Transfers from "Property and equipment" 93
At December 31, 2017 410
Rental revenue generated by investment property, reported in the income statement under “Other revenue”, totalled 76.6 million euros in 2017 (2016: 67.2 million euros). Operating costs directly attributable to the properties amounted to 12.3 million euros in 2017 (2016: 13.9 million euros). The estimated fair value of investment property at December 31, 2017 was 988 million euros (December 31, 2016: 681 million euros). The rise in fair value is attributable to (i) the increase in the market value of several shopping centres as a result of the independent appraisals carried out
in 2017, particularly in China and Poland, and (ii) new shopping malls included in investment property in 2017 (following a business combination in Spain and the reclassification of shopping malls previously shown in property and equipment but which met the definition of investment property in 2017).

Carrefour Group – Consolidated Financial Statements as of December 31, 2017 - 38 -
Notes to the Consolidated Financial Statements
6.5 Leased property
All property leases have been reviewed to determine whether they are operating leases or finance leases to be accounted for by the method described in Note 6.2.
6.5.1 Finance leases
The following table shows future minimum lease payments due for the non-cancellable term of finance leases at December 31, 2017 and 2016:
Lease commitments at December 31, 2017
(in € millions)
Minimum future lease payments 546 47 165 333
Discounted present value 324 44 130 150
Lease commitments at December 31, 2016
(in € millions)
Minimum future lease payments 570 47 177 346
Discounted present value 351 44 139 168
Total Within one yearIn one to five
years
Beyond five
years
Total Within one yearIn one to five
years
Beyond five
years
Rental expense and rental revenue from subleases recorded in the income statement are as
follows: Lease payments and revenue from sub-leases
(in € millions)
Minimum lease payments made during the year (40) (53)
Contingent lease payments made during the year (0) (4)
Revenue from sub-leases received during the year 17 18
2017 2016
The future minimum sublease payments expected to be received under non-cancellable subleases amounted to 14 million euros at December 31, 2017 as at December 31, 2016.
6.5.2 Operating leases
The following table shows future minimum lease payments due for the non-cancellable term of operating leases at December 31, 2017 and 2016: Lease commitments at December 31, 2017
(in € millions)Total Within one year
In one to five
years
Beyond five
years
Minimum future lease payments 3,712 1,115 1,744 853
Discounted present value 2,928 1,034 1,358 536
Lease commitments at December 31, 2016
(in € millions)Total Within one year
In one to five
years
Beyond five
years
Minimum future lease payments 3,625 1,070 1,754 801
Discounted present value 2,853 993 1,363 497
Rental expense and rental revenue from subleases recorded in the income statement are as follows: Lease payments and revenue from sub-leases
(in € millions)
Minimum lease payments made during the year (1,217) (1,113)
Contingent lease payments made during the year (12) (23)
Revenue from sub-leases received during the year 255 265
2017 2016
The future minimum sublease payments expected to be received under non-cancellable subleases amounted to 197 million euros at December 31, 2017 (December 31, 2016: 138 million euros).

Carrefour Group – Consolidated Financial Statements as of December 31, 2017 - 39 -
Notes to the Consolidated Financial Statements
NOTE 7 INVESTMENTS IN EQUITY-ACCOUNTED COMPANIES
Accounting principles
The consolidated statement of financial position includes the Group’s share of the change in the net assets of companies accounted for by the equity method (associates and joint ventures), as adjusted to comply with Group accounting policies, from the date when significant influence or joint control is acquired until the date when it is lost.
Companies accounted for by the equity method are an integral part of the Group’s operations and the Group’s share of their net profit or loss is therefore reported as a separate component of recurring operating income (“Recurring operating income after net income from equity-accounted companies”), in accordance with the recommendation of the French accounting authorities (Autorité des normes comptables [ANC] recommendation no. 2013-01).
7.1 Changes in investments in equity-accounted companies Changes in investments in equity-accounted companies can be analysed as follows:
(in € millions)
At December 31, 2015 1,433
Translation adjustment (15)
Share of net income (36)
Dividends (79)
Capital increase 58
Other movements 0
At December 31, 2016 1,361
Translation adjustment (19)
Share of net income 4
Dividends (80)
Capital increase 64
Other movements 24
At December 31, 2017 1,355
7.2 Information about associates The following table shows key financial indicators for associates:
(in € millions) % interest Total assetsShareholders'
equity
Non-current
assets
Net sales /
Revenues
Net income /
(loss)
Carmila (France) 36% 5,197 2,782 4,675 301 36
CarrefourSA (Turkey) 46% 713 2 437 1,105 (74)
Provencia SA (France) 50% 420 237 194 843 27
Mestdagh (Belgium) 25% 279 64 96 604 (9)
Ulysse (Tunisia) 25% 156 78 133 319 16
Costasol (Spain) 34% 92 50 63 126 13
Other companies (1)
- 883 295 503 1,394 26
(1) Corresponding to a total of 187 companies, none of which is individually material.
All of the summary financial data presented in the table above have been taken from the financial statements of associates, restated where necessary to reflect adjustments made to harmonise accounting methods on application of equity accounting. These data have not been adjusted for any changes in fair value recognised at the time of the acquisition or for any loss of control and
elimination of the Group’s share of profit or loss arising on asset disposals or acquisitions carried out between the Group and the associate.

Carrefour Group – Consolidated Financial Statements as of December 31, 2017 - 40 -
Notes to the Consolidated Financial Statements
Carmila was set up in 2014 by the Group and its co-investment partners. Its corporate purpose is to enhance the value of the shopping centres adjacent to Carrefour hypermarkets in France, Spain and Italy. Carmila is accounted for by the equity method because the governance system
established with the co-investors allows Carrefour to exercise significant influence over its financial and operating policy decisions.
Up until its merger with Cardety on June 12, 2017, Carmila’s governance was organised by a shareholders’ agreement between Carrefour (owner of a 42% stake in Carmila) and other institutional investors (owner of the remaining 58% stake). This agreement specified the composition of the Board of Directors and the list of decisions requiring the Board’s prior approval
(votes subject to a simple or qualified majority, depending on the importance of the matters discussed).
In parallel with the merger of Carmila into Cardety (details of which are provided in Note 2.3), the entity’s corporate governance rules were adjusted, resulting in the restructuring of its administration and management bodies, and amendments to its articles of association and the Board of Directors’ internal rules. In light of the amended corporate governance rules, the Group
considers that it has significant influence over the new entity, Carmila, which is accounted for using
the equity method. The Group’s position is primarily based on the fact that the Carrefour Group is not represented by a majority on the Board of Directors, which comprises 14 members, of which 8 are independent and 5 are appointed by Carrefour. Therefore, the Group cannot alone impose decisions requiring the Board’s prior consent, which partly concern the relevant activities.
The following table presents key financial indicators for Carmila at December 31, 2017 and 2016 (as published in Carmila’s consolidated financial statements(1)).
(in € millions) 2017 2016
Revenue (rental income) 301 276
Operating income before fair value adjustment of assets 230 219
Operating income (1)
394 376
Net income from continuing operations 314 296
Total non current assets (1)
5,521 4,916
Total current assets 513 289
of which Cash and cash equivalent 329 71
Total non current liabilities 2,158 2,200
Total current liabilities 334 354
Ownership % held by Carrefour 35.76% 42.42%
Amount of the investment in equity-accounted company 942 895
Carrefour - Cash dividends received from Carmila 66 62
(1) Since Carmila opted to apply the fair value model for the accounting of its investment properties, in accordance with the option provided in
IAS 40, the figures presented in the above table are adjusted to reflect real estate fair value corrections. Before being accounted for by the equity method in the Group financial statements, Carmila's consolidated financial statements are therefore restated to apply the cost model
applied by Carrefour.
7.3 Transactions with associates (related parties)
The following table presents the main related-party transactions carried out in 2017 with companies over which the Group exercises significant influence:
(in € millions)Carmila
(France)
CarrefourSA
(Turkey)
Provencia
(France)
Mestdagh
(Belgium)
Ulysse
(Tunisia)
Net sales (sales of goods) - 0 596 51 7
Franchise fees - 3 10 8 2
Property development revenue (1)
109 - - - -
Sales of services 14 - - 10 -
Fees and other operating expenses (7) - - - -
Proceeds from the disposal of non-current assets (1) (2)
- - - - -
Receivables at December 31, 2017 23 1 33 7 3
Payables at December 31, 2017 (1) (4) - - -
(1) Amounts are presented before elimination of the Group’s share in the associate of revenues and proceeds arising on transactions carried out
between the Group and the associate.
(2) The non-current assets correspond to property and equipment, investment property and financial assets.

Carrefour Group – Consolidated Financial Statements as of December 31, 2017 - 41 -
Notes to the Consolidated Financial Statements
NOTE 8: INCOME TAX
Accounting principles
Income tax expense comprises current taxes and deferred taxes. It includes the Cotisation sur la Valeur Ajoutée des Entreprises (CVAE) local business tax in France assessed on the value-added generated by the business, which is reported under income tax expense because the Group considers that it meets the definition of a tax on income contained in IAS 12 – Income Tax.
Deferred taxes are calculated on all temporary differences between the carrying amount of assets and liabilities in the consolidated statement of financial position and their tax basis (except in the specific cases referred to in IAS 12), and carried-forward tax losses. They are measured at the tax rates that are expected to apply to the period when the asset will be realised or the liability will be settled, based on tax rates and tax laws that have been enacted or substantively enacted by the end of the reporting period. Deferred tax assets and liabilities are not discounted and are classified in the statement of financial position under “Non-current assets” and “Non-current liabilities”.
The recoverability of deferred tax assets is assessed separately for each tax entity, based on estimates of future taxable profits contained in the business plan for the country concerned (prepared as described in Note 6.3) and the amount of deferred tax liabilities at the period-end. A valuation allowance is recorded to write down deferred tax assets whose recovery is not considered probable.
8.1 Income tax expense for the period
(in € millions) 2017 2016
Current income tax expense (including provisions) (496) (590)
Deferred income taxes (122) 95
Total Income tax expenses (618) (494)
Tax proof
Theoretical income tax for 2017 and 2016 has been calculated by multiplying consolidated income before tax by the standard French corporate income tax rate. For 2017, theoretical income tax expense amounted to 88 million euros compared with actual net income tax expense of 618 million
euros.
(in € millions) 2017 2016
Income before taxes 255 1,428
Standard French corporate income tax rate 34.4% 34.4%
Theoretical income tax expense (88) (492)
Adjustments to arrive at effective income tax rate:
- Differences between the standard French corporate income tax rate and overseas nominal taxation
rates(40) 19
- Effect of changes in applicable tax rates (46) 31
- Tax expense and tax credits not based on the taxable income (1) (77) (28)
- Tax effect of other permanent differences (135) (40)
- Deferred tax assets recognised on temporary differences and tax loss carryforwards of previous
years (2) 139 150
- Deferred tax assets not recognized on temporary differences and tax loss carryforwards arising in
the year (3) (98) (81)
- Valuation allowances on deferred tax assets recognized in prior years (3) (270) (69)
- Tax effect of net income from equity-accounted companies (1) (12)
- Other differences 1 29
Total Income tax expense (618) (494)
Effective tax rate 242.0% 34.6%
(1) The reported amount of taxes with no tax base takes into account the CVAE local business tax in France, amounting to 62 million euros in 2017 (2016: 69 million euros), withholding taxes and changes in provisions for tax risks (Note 9.2.1).
(2) As in 2016, deferred tax assets recognised in 2017 on prior years’ tax losses primarily concerned Brazil.
(3) Valuation allowances recorded on deferred tax assets mainly concerned China and Argentina.

Carrefour Group – Consolidated Financial Statements as of December 31, 2017 - 42 -
Notes to the Consolidated Financial Statements
8.2 Deferred tax assets and liabilities The Group had a net deferred tax asset of 147 million euros at December 31, 2017, a decrease of
138 million euros compared with the previous year-end.
(in € millions)December 31,
2017
December 31,
2016Change
Deferred tax assets 636 829 (193)
Deferred tax liabilities (489) (543) 55
Net deferred tax assets 147 285 (138)
The following table shows the main sources of deferred taxes:
Income
statement
Income tax on
other
comprehensive
income
(OCI)
Changes in
consolidation
scope,
translation
adjustment,
otherTax loss carryforwards 1,101 119 - (113) 1,108
Property and equipment 218 1 - (15) 205
Non-deductible provisions 962 (155) (28) (41) 738
Goodwill amortisation allowed for tax purposes 201 45 - 1 247
Other intangible assets 3 1 - (0) 4
Inventories 181 10 - (18) 172
Financial instruments 48 (38) (3) (1) 5
Other temporary differences 250 (79) - (53) 118
Deferred tax assets before netting 2,964 (97) (31) (239) 2,597
Effect of netting deferred tax assets and liabilities (590) 2 - 81 (508)
Deferred tax assets after netting 2,374 (95) (31) (158) 2,090
Valuation allowances on deferred tax assets (1,545) (62) 0 153 (1,454)
Net deferred tax assets 829 (157) (31) (5) 636
Property and equipment (292) (6) - 90 (208)
Provisions recorded solely for tax purposes (376) (37) - (0) (413)
Goodwill amortisation allowed for tax purposes (197) (2) - 28 (171)
Other intangible assets (0) 3 - (4) (1)
Inventories (21) 2 - - (19)
Financial instruments (16) (5) 13 0 (7)
Other temporary differences (232) 82 - (27) (177)
Deferred tax liabilities before netting (1,134) 37 13 88 (997)
Effect of netting deferred tax assets and liabilities 590 (2) - (81) 508
Deferred tax liabilities after netting (543) 35 13 7 (489)
NET DEFERRED TAXES 285 (122) (18) 2 147
December 31,
2016
Change
December 31,
2017(in € millions)
8.3 Unrecognised deferred tax assets Unrecognised deferred tax assets amounted to 1,454 million euros at December 31, 2017 (December 31, 2016: 1,545 million euros), including 738 million euros related to tax loss
carryforwards (December 31, 2016: 768 million euros) and 716 million euros on temporary
differences (December 31, 2016: 777 million euros).

Carrefour Group – Consolidated Financial Statements as of December 31, 2017 - 43 -
Notes to the Consolidated Financial Statements
NOTE 9: PROVISIONS AND CONTINGENT LIABILITIES
Accounting principles
In accordance with IAS 37 – Provisions, Contingent Liabilities and Contingent Assets, a provision is recorded when, at the period-end, the Group has a present obligation (legal or constructive) as a result of a past event, it is probable that an outflow of resources embodying economic benefits will be required to settle the obligation, and a reliable estimate can be made of the amount of the obligation. The amount of the provision is estimated based on the nature of the obligation and the most probable assumptions. Provisions are discounted when the effect of the time value of money is material.
Contingent liabilities, which are not recognised in the statement of financial position, are defined as:
- possible obligations that arise from past events and whose existence will be confirmed only by the occurrence or non-occurrence of one or more uncertain future events not wholly within the control of the Group; or
- present obligations that arise from past events but are not recognised because (i) it is not probable that an outflow of resources embodying economic benefits will be required to settle the obligation or (ii) the amount of the obligation cannot be measured with sufficient reliability.
9.1 Changes in provisions
(in € millions)December 31,
2016
Translation
adjustmentIncreases
Discounting
adjustment
Reversals of
surplus
provisions
Utilisations OtherDecember 31,
2017
Post-employment benefit
obligations (1) 1,279 (2) 97 (38) (39) (42) 0 1,256
Claims and litigation 1,312 (119) 448 - (210) (150) (1) 1,280
Tax reassessments 885 (84) 285 - (106) (27) 7 960
Disputes with current and
former employees243 (22) 109 - (63) (93) (8) 166
Legal disputes 184 (14) 54 - (41) (30) 1 154
Restructuring 98 (2) 76 - (10) (54) (0) 108
Other (2) 375 (0) 66 - (26) (56) 1 359
Total Provisions 3,064 (123) 687 (38) (285) (302) (0) 3,003
(1) See Note 10. (2) Other provisions primarily concern technical risks associated mainly with the insurance business and onerous contracts.
Group companies are involved in a certain number of claims and legal proceedings in the normal
course of business. They are also subject to tax audits that may result in reassessments. The main claims and legal proceedings are described below. In each case, the risk is assessed by Group management and their advisors. At December 31, 2017, the claims and legal proceedings in which the Group was involved were covered by provisions totalling 1,280 million euros (December 31, 2016: 1,312 million euros). No
details are provided because the Group considers that disclosure of the amount set aside in each case could be seriously detrimental to its interests.
9.2 Claims and litigation
In the normal course of its operations in around a dozen different countries, the Group is involved in tax, employee-related and commercial disputes and legal proceedings.
9.2.1 Tax reassessments Certain Group companies have been or are currently the subject of tax audits conducted by their local tax authorities.
In Brazil, tax audits are in progress covering, in particular, the tax on the distribution of goods and services (ICMS), related tax credits (determination of the amounts claimable and documentation of the claims), and federal contributions to the social integration programme and to the financing of the social security system (Pis-Cofins). The Group has challenged most of the assessments,

Carrefour Group – Consolidated Financial Statements as of December 31, 2017 - 44 -
Notes to the Consolidated Financial Statements
particularly the constitutionality of certain legislative provisions on which they are based. The estimated risk in each case is reviewed regularly with Carrefour Brazil’s advisors and an appropriate provision is recorded. At December 31, 2017, the corresponding provision totalled 518
million euros (versus 551 million euros at December 31, 2016). In France, Carrefour was notified of corporate income tax reassessments relating to the scope of the cap on deductible financial expenses in 2014. Carrefour is challenging this reassessment. The tax authorities in several countries have disallowed part of the headquarters expenses
deducted by Group companies. The Group has contested these reassessments.
9.2.2 Employee-related disputes As a major employer, the Group is regularly involved in disputes with current or former employees. From time to time, disputes may also arise with a large group of current or former employees. In
Brazil, many former employees have initiated legal proceedings against the Group, claiming overtime pay that they allege is due to them.
9.2.3 Legal and commercial disputes The Group is subject to regular audits by the authorities responsible for overseeing compliance with the laws applicable to the retail industry and by the competition authorities. Disputes may also
arise with suppliers as a result of differing interpretations of legal or contractual provisions.
9.3 Contingent liabilities
To the best of the Group’s knowledge, there are no contingent liabilities that may be considered likely to have a material impact on the Group’s results, financial position, assets and liabilities or business.
In Brazil, the Group is exposed to tax risks which the Group and its counsel consider are unlikely to materialise. The tax risks represent a total exposure of 2.38 billion euros at December 31, 2017. The main tax risk concerns the amortization of goodwill for tax purposes related to the acquisition
of Atacadão occurred in 2007. The Group is contesting assessments totalling almost 650 million euros, and filed an appeal at Judicial sphere in the fourth quarter of 2017.

Carrefour Group – Consolidated Financial Statements as of December 31, 2017 - 45 -
Notes to the Consolidated Financial Statements
NOTE 10: NUMBER OF EMPLOYEES, EMPLOYEE COMPENSATION AND BENEFITS
Accounting principles
Group employees receive short-term benefits (such as paid vacation, paid sick leave and statutory profit-sharing bonuses), long-term benefits (such as long-service awards and seniority bonuses) and post-employment benefits (such as length-of-service awards and supplementary pension benefits). Post-employment benefits may be paid under defined contribution or defined benefit plans.
All of these benefits are accounted for in accordance with IAS 19 – Employee Benefits. Short-term benefits (i.e., benefits expected to be settled wholly before twelve months after the end of the annual reporting period in which the employees render the related services) are classified as current liabilities (under “Other payables”) and recorded as an expense for the year in which the employees render the related services (Note 5.2.2). Post-employment benefits and other long-term benefits are measured and recognised as described in Note 10.1.
Two types of share-based payment plans have been set up for management and selected employees – stock option plans and performance share plans. These plans fall within the scope of IFRS 2 – Share-based Payment and are accounted for as described in Note 10.2.
10.1 Pension and other post-employment benefits
Accounting principles
Post-employment benefits are employee benefits that are payable after the completion of employment. The Group’s post-employment benefit plans include both defined contribution plans and defined benefit plans.
Defined contribution plans
Defined contribution plans are post-employment benefit plans under which the Group pays fixed contributions into a separate entity that is responsible for the plan’s administrative and financial management as well as for the payment of benefits, such that the Group has no obligation to pay further contributions if the plan assets are insufficient. Examples include government-sponsored pension schemes, defined contribution supplementary pension plans and defined contribution pension funds.
The contributions are recorded as an expense for the period in which they become due.
Defined benefit and long-term benefit plans
A liability is recognised for defined benefit obligations that are determined by reference to the plan participants’ years of service with the Group.
The defined benefit obligation is calculated annually using the projected unit credit method, taking into account actuarial assumptions concerning future salary levels, retirement age, mortality, staff turnover and the discount rate.
The discount rate corresponds to the interest rate observed at the period-end for investment grade corporate bonds with a maturity close to that of the defined benefit obligation. The calculations are performed by a qualified actuary.
The net liability recorded for defined benefit plans corresponds to the present value of the defined benefit obligation less the fair value of plan assets (if any). The cost recognised in the income statement comprises:
- current service cost, past service cost and the gain or loss on plan amendments or settlements (if any), recorded in operating expense;
- interest expense on the defined benefit liability, net of interest income on the plan assets, recorded in net financial expense.
Remeasurements of the net defined benefit liability (comprising actuarial gains and losses, the return on plan assets and any change in the effect of the asset ceiling) are recognised immediately in “Other comprehensive income”.
10.1.1 Description of the main defined benefit plans
The main defined benefit plans concern supplementary pension benefits paid annually in some countries to retired employees of the Group, and length-of-service awards provided for in collective bargaining agreements that are paid to employees upon retirement. The plans, which are
presented below, mainly concern France, Belgium and Italy.

Carrefour Group – Consolidated Financial Statements as of December 31, 2017 - 46 -
Notes to the Consolidated Financial Statements
French plans
Group employees in France are entitled to a length-of-service award when they retire, determined in accordance with the law and the applicable collective bargaining agreement. The award is
measured as a multiple of the individual’s monthly salary for the last 12 months before retirement, determined by reference to his or her years of service.
In 2009, the Group set up a supplementary pension plan, amended in 2015. The main characteristics of the plan are as follows:
eligibility: plan participants must have completed at least three years’ service at the time
of retirement and their annual compensation must be greater than 18 times the annual ceiling for social security contributions;
benefits: 2.75% of the reference compensation per year of service, subject to the
applicable performance conditions being met for each year. No benefits are paid if a minimum number of years has not been validated in connection with the performance conditions;
years of service taken into account for the calculation of plan benefits: years of service
with the Carrefour Group under consecutive or non-consecutive employment contracts. The
plan’s terms do not provide for any increase in benefits for participants who have completed more than a certain number of years’ service;
the reference compensation is calculated as the average of the last three salaries (basic
salary + annual variable compensation) received over the last three calendar years preceding retirement or 60 times the annual ceiling for social security contributions, whichever is lower;
annual benefit cap: 25% of the reference compensation and the difference between 45% of
the reference compensation and the total basic and supplementary pension benefits received by the plan participant;
reversionary pension: upon the participant’s death, payable to the surviving spouse in an
amount equal to 50% of the original benefit. Belgian plans
The Group’s main commitments in Belgium concern “prepensions” and the “solidarity fund”.
The prepension scheme provides for the payment of unemployment benefits during the period from the retirement age proposed in the collective bargaining agreement to the statutory retirement age. Carrefour is committed to topping up the benefits paid by the Belgian State, so that the individuals concerned receive 95% of their final net salary. The retirement age under Belgian law, amended in 2015, is 67 (unless otherwise provided). Under the collective bargaining agreement applicable to Carrefour, employees are eligible for prepension benefits from the age of
62 (unless otherwise provided).
The solidarity fund is a corporate supplementary pension plan that offers participants the choice between a lump sum payment on retirement or a monthly pension for the rest of their lives. The plan was closed in 1994 and replaced by a defined contribution plan. Consequently, the projected benefit obligation only concerns pension rights that vested before 1994.
Furthermore, as of 2016, an additional provision has been recorded for defined contribution plans with a minimum legal guaranteed yield, in view of the current economic conditions.
Italian plans
The Group’s commitments in Italy primarily concern the Trattemento di Fine Rapporto (TFR) deferred salary scheme. The TFR scheme underwent a radical reform in 2007, with employers now required to pay contributions to an independent pension fund in full discharge of their liability. The Group’s obligation therefore only concerns deferred salary rights that vested before 2007.

Carrefour Group – Consolidated Financial Statements as of December 31, 2017 - 47 -
Notes to the Consolidated Financial Statements
10.1.2 Net expense for the period
The expense recorded in the income statement is detailed as follows:
2016 (in € millions) France Belgium ItalyOther
countriesGroup total
Service cost (1) (112) 13 0 1 (98)
Interest cost (discount effect) 17 10 2 1 30
Return on plan assets (1) (4) - (0) (5)
Other items 3 0 - (0) 3
Expense (income) for 2016 (93) 19 3 1 (71)
2017 (in € millions) France Belgium ItalyOther
countriesGroup total
Service cost (1) 31 12 0 1 44
Interest cost (discount effect) 11 6 2 1 18
Return on plan assets (0) (3) - (0) (3)
Other items (1) - - - (1)
Expense (income) for 2017 40 15 2 1 58
(1) The following table presents details of service cost:
2016 (in € millions) France Belgium ItalyOther
countriesGroup total
Current service cost 59 13 0 1 72
Past service cost (plan amendments and curtailments) (154) - 0 - (154)
Settlements and other (16) - - - (16)
Total Service cost 2016 (112) 13 0 1 (98)
2017 (in € millions) France Belgium ItalyOther
countriesGroup total
Current service cost 57 17 0 1 74
Past service cost (plan amendments and curtailments) 1 (4) - (0) (3)
Settlements and other (26) - (0) - (26)
Total Service cost 2017 31 12 0 1 44
The net expense for 2017 breaks down as (43) million euros recorded in employee benefits expense and (15) million euros recorded in financial expense.
10.1.3 Breakdown of the provision
(in € millions) France Belgium ItalyOther
countriesGroup total
Defined Benefit Obligation 911 480 136 39 1,565
Fair value of plan assets (53) (227) - (7) (286)
Provision at December 31, 2016 858 253 136 32 1,279
Defined Benefit Obligation 889 450 128 42 1,509
Fair value of plan assets (16) (230) - (7) (253)
Provision at December 31, 2017 873 221 128 35 1,256

Carrefour Group – Consolidated Financial Statements as of December 31, 2017 - 48 -
Notes to the Consolidated Financial Statements
10.1.4 Change in the provision
(in € millions) France Belgium ItalyOther
countriesGroup total
Provision at December 31, 2015 845 250 136 27 1,258
Movements recorded in the income statement (93) 19 3 1 (71)
Benefits paid directly by the employer (4) (13) (6) (0) (24)
Effect of changes in scope of consolidation (5) - 0 0 (5)
Change in actuarial gains and losses (1) 113 4 4 3 124
Other 3 (6) (1) 0 (4)
Provision at December 31, 2016 858 253 136 32 1,279
Movements recorded in the income statement 40 15 2 1 59
Benefits paid directly by the employer (7) (12) (9) (0) (28)
Effect of changes in scope of consolidation (5) - - - (5)
Change in actuarial gains and losses (1) (13) (28) (1) 4 (38)
Other (0) (8) - (2) (10)
Provision at December 31, 2017 873 221 128 35 1,256
(1) This line breaks down as follows:
2016 (in € millions) France Belgium ItalyOther
countriesGroup total
Actuarial (gain)/loss due to experience 9 0 (3) 1 7
Actuarial (gain)/loss due to demographic assumption changes 26 - (0) 2 28
Actuarial (gain)/loss due to financial assumption changes 79 147 8 0 235
Return on Plan Assets (Greater) / Less than Discount Rate (1) (144) - 0 (145)
Changes in actuarial gains and losses 2016 113 4 4 3 124
2017 (in € millions) France Belgium ItalyOther
countriesGroup total
Actuarial (gain)/loss due to experience 6 - 1 2 9
Actuarial (gain)/loss due to demographic assumption changes (6) - (0) 1 (5)
Actuarial (gain)/loss due to financial assumption changes (12) (20) (2) 0 (34)
Return on Plan Assets (Greater) / Less than Discount Rate (1) (8) - 0 (9)
Changes in actuarial gains and losses 2017 (13) (28) (1) 4 (38)
10.1.5 Plan assets
(in € millions) France Belgium ItalyOther
countriesGroup total
Fair value at December 31, 2015 70 84 - 6 161
Effect of changes in scope of consolidation - - - - -
Return on plan assets 1 4 - 0 5
Benefits paid out of plan assets (20) (12) - (0) (33)
Actuarial gain/(loss) 1 144 - (0) 145
Other - 7 - 1 8
Fair value at December 31, 2016 53 227 - 7 286
Effect of changes in scope of consolidation - - - - -
Return on plan assets 0 3 - 0 3
Benefits paid out of plan assets (31) (16) - 7 (40)
Actuarial gain/(loss) 1 8 - (0) 9
Other (6) 8 - (7) (5)
Fair value at December 31, 2017 16 230 - 7 253
Plan assets break down as follows by asset class:
Bonds EquitiesMonetary
investments
Real estate
and other Bonds Equities
Monetary
investments
Real estate
and other
France 57% 7% 33% 3% 55% 7% 35% 3%
Belgium 36% 9% 55% 0% 39% 10% 51% 0%
December 31, 2017 December 31, 2016
All bonds and equities held in plan asset portfolios are listed securities.
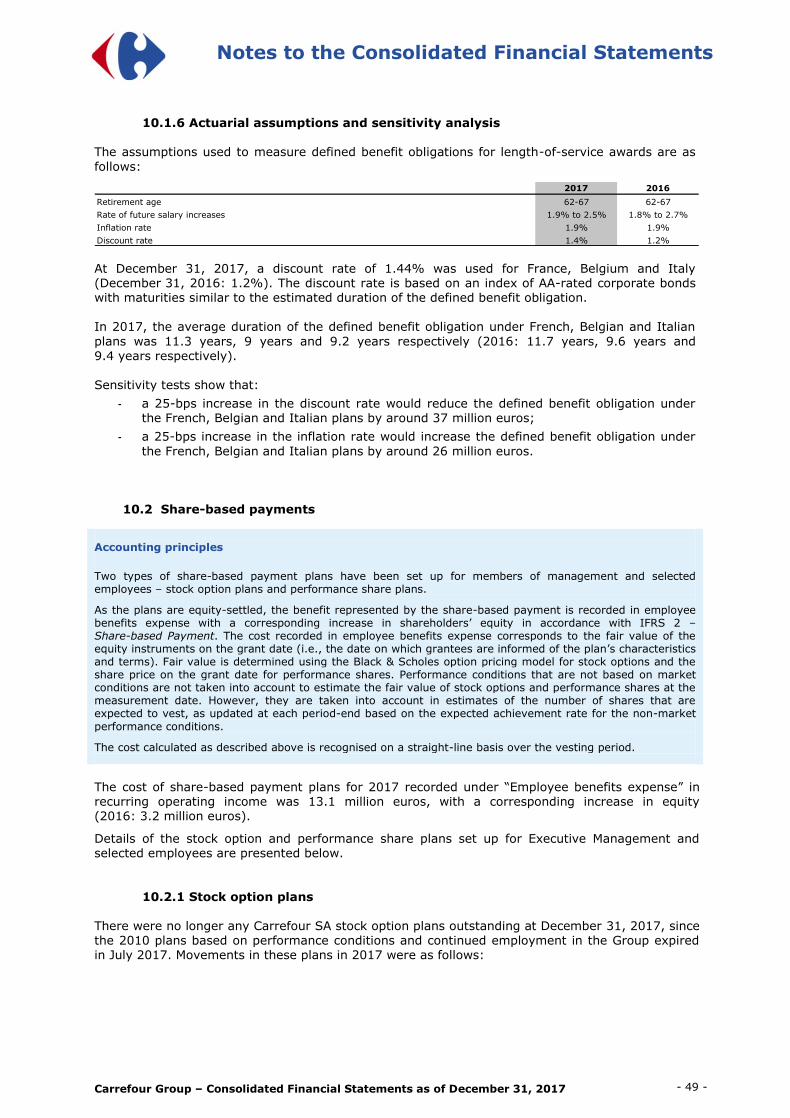
Carrefour Group – Consolidated Financial Statements as of December 31, 2017 - 49 -
Notes to the Consolidated Financial Statements
10.1.6 Actuarial assumptions and sensitivity analysis The assumptions used to measure defined benefit obligations for length-of-service awards are as
follows:
2017 2016
Retirement age 62-67 62-67
Rate of future salary increases 1.9% to 2.5% 1.8% to 2.7%
Inflation rate 1.9% 1.9%
Discount rate 1.4% 1.2%
At December 31, 2017, a discount rate of 1.44% was used for France, Belgium and Italy (December 31, 2016: 1.2%). The discount rate is based on an index of AA-rated corporate bonds with maturities similar to the estimated duration of the defined benefit obligation. In 2017, the average duration of the defined benefit obligation under French, Belgian and Italian
plans was 11.3 years, 9 years and 9.2 years respectively (2016: 11.7 years, 9.6 years and
9.4 years respectively). Sensitivity tests show that:
- a 25-bps increase in the discount rate would reduce the defined benefit obligation under the French, Belgian and Italian plans by around 37 million euros;
- a 25-bps increase in the inflation rate would increase the defined benefit obligation under
the French, Belgian and Italian plans by around 26 million euros.
10.2 Share-based payments
Accounting principles
Two types of share-based payment plans have been set up for members of management and selected employees – stock option plans and performance share plans.
As the plans are equity-settled, the benefit represented by the share-based payment is recorded in employee benefits expense with a corresponding increase in shareholders’ equity in accordance with IFRS 2 – Share-based Payment. The cost recorded in employee benefits expense corresponds to the fair value of the equity instruments on the grant date (i.e., the date on which grantees are informed of the plan’s characteristics and terms). Fair value is determined using the Black & Scholes option pricing model for stock options and the share price on the grant date for performance shares. Performance conditions that are not based on market conditions are not taken into account to estimate the fair value of stock options and performance shares at the measurement date. However, they are taken into account in estimates of the number of shares that are expected to vest, as updated at each period-end based on the expected achievement rate for the non-market
performance conditions.
The cost calculated as described above is recognised on a straight-line basis over the vesting period.
The cost of share-based payment plans for 2017 recorded under “Employee benefits expense” in recurring operating income was 13.1 million euros, with a corresponding increase in equity (2016: 3.2 million euros).
Details of the stock option and performance share plans set up for Executive Management and selected employees are presented below.
10.2.1 Stock option plans
There were no longer any Carrefour SA stock option plans outstanding at December 31, 2017, since the 2010 plans based on performance conditions and continued employment in the Group expired in July 2017. Movements in these plans in 2017 were as follows:
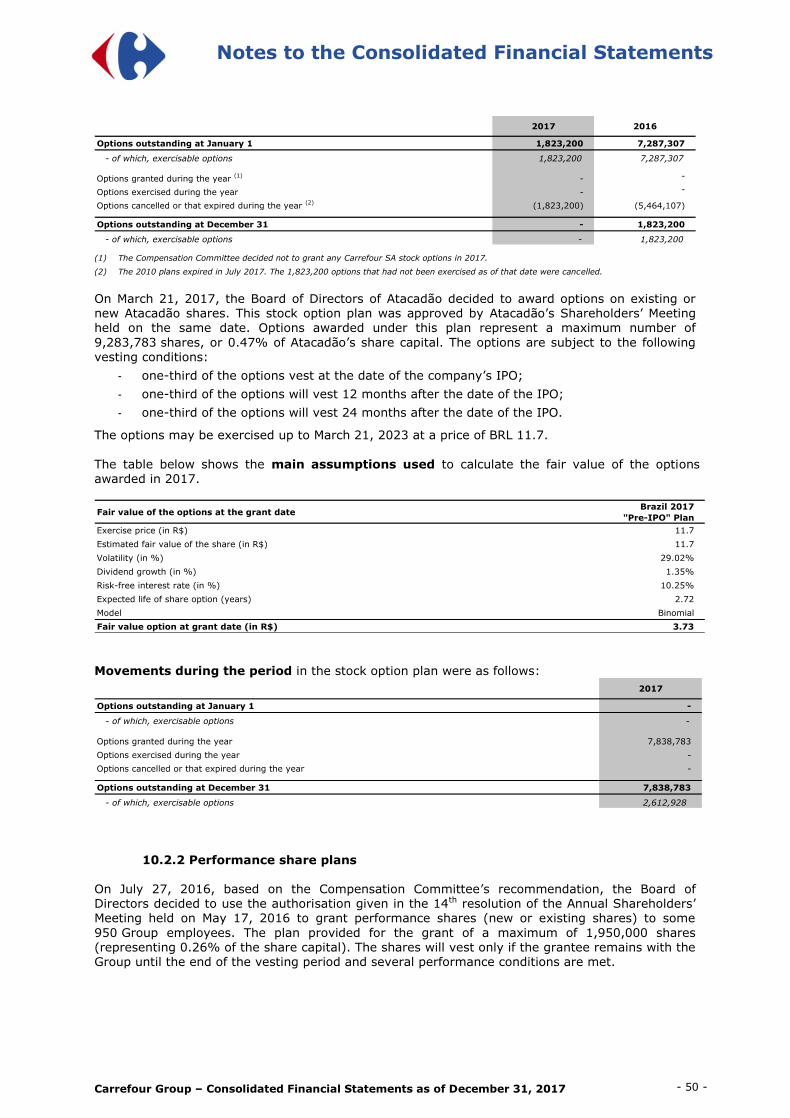
Carrefour Group – Consolidated Financial Statements as of December 31, 2017 - 50 -
Notes to the Consolidated Financial Statements
2017 2016
Options outstanding at January 1 1,823,200 7,287,307
- of which, exercisable options 1,823,200 7,287,307
Options granted during the year (1)
- -
Options exercised during the year - -
Options cancelled or that expired during the year (2)
(1,823,200) (5,464,107)
Options outstanding at December 31 - 1,823,200
- of which, exercisable options - 1,823,200
(1) The Compensation Committee decided not to grant any Carrefour SA stock options in 2017.
(2) The 2010 plans expired in July 2017. The 1,823,200 options that had not been exercised as of that date were cancelled.
On March 21, 2017, the Board of Directors of Atacadão decided to award options on existing or new Atacadão shares. This stock option plan was approved by Atacadão’s Shareholders’ Meeting held on the same date. Options awarded under this plan represent a maximum number of
9,283,783 shares, or 0.47% of Atacadão’s share capital. The options are subject to the following
vesting conditions:
- one-third of the options vest at the date of the company’s IPO;
- one-third of the options will vest 12 months after the date of the IPO;
- one-third of the options will vest 24 months after the date of the IPO.
The options may be exercised up to March 21, 2023 at a price of BRL 11.7.
The table below shows the main assumptions used to calculate the fair value of the options awarded in 2017.
Fair value of the options at the grant dateBrazil 2017
"Pre-IPO" Plan
Exercise price (in R$) 11.7
Estimated fair value of the share (in R$) 11.7
Volatility (in %) 29.02%
Dividend growth (in %) 1.35%
Risk-free interest rate (in %) 10.25%
Expected life of share option (years) 2.72
Model Binomial
Fair value option at grant date (in R$) 3.73
Movements during the period in the stock option plan were as follows:
2017
Options outstanding at January 1 -
- of which, exercisable options -
Options granted during the year 7,838,783
Options exercised during the year -
Options cancelled or that expired during the year -
Options outstanding at December 31 7,838,783
- of which, exercisable options 2,612,928
10.2.2 Performance share plans On July 27, 2016, based on the Compensation Committee’s recommendation, the Board of Directors decided to use the authorisation given in the 14th resolution of the Annual Shareholders’ Meeting held on May 17, 2016 to grant performance shares (new or existing shares) to some
950 Group employees. The plan provided for the grant of a maximum of 1,950,000 shares (representing 0.26% of the share capital). The shares will vest only if the grantee remains with the Group until the end of the vesting period and several performance conditions are met.

Carrefour Group – Consolidated Financial Statements as of December 31, 2017 - 51 -
Notes to the Consolidated Financial Statements
The vesting period is three years from the date of the Board meeting at which the rights were granted. The number of shares that vest will depend on the achievement of three performance conditions:
- two conditions linked to financial performance (EBITDA growth for 35% and organic sales growth for 35%); and
- a CSR-related condition (for 30%). Details of the performance share plans in progress at December 31, 2017 are presented below:
General Meeting date May 17, 2016
Grant date (1)
Vesting date (2)
July 28, 2019
Total number of shares allotted at the grant date 1,944,850
Number of grantees at the grant date 950
Fair value of each share (in €) (3)
20.18
2016 Performance
Plan
September 15, 2016
(1) Notification date (i.e., date on which grantees were notified of the plans’ characteristics and terms).
(2) The shares will vest only if the grantee remains with the Group until the end of the vesting period and several performance conditions are met.
(3) The Carrefour share price on the grant date (reference price) adjusted for estimated dividends not received during the vesting period.
Movements in performance share grants were as follows:
2017 2016
Shares allotted at January 1 1,942,150 -
- of which, vested shares - -
Shares granted during the year - 1,944,850
Shares delivered to the grantees during the year (3,500) -
Shares cancelled during the year (199,200) (2,700)
Shares allotted at December 31 1,739,450 1,942,150
- of which, vested shares 8,000 -
10.3 Management compensation (related parties)
The following table shows the compensation paid by the Carrefour Group during the year to the Group’s key management personnel.
The key management personnel are the members of the Board of Directors, the 6 members of the Group’s management team (up until October 2, 2017), and the 14 members of the Group’s
Executive Committee (as from October 2, 2017).
(in € millions) 2017 2016
Compensation for the year 5.3 4.2
Prior year bonus (1)
11.4 5.2
Benefits in kind (accommodation and company car) 0.1 0.0
Total compensation paid during the year 16.8 9.4
Employer payroll taxes 5.1 3.3
Termination benefits (1)
4.0 -
(1) Amounts shown for the year 2017 include compensation paid to Mr Georges Plassat, Chairman of the Board of Directors and Chief Executive Officer of Carrefour group until July 18, 2017, in respect of (i) the 2014/2015 and 2015/2016 long-term incentive plans, and (ii) the
termination benefit resulting from the termination of his duties as Chairman and Chief Executive Officer, after acknowledgement by the Board
of Directors that the relevant conditions had been met, in particular the performance conditions and the requirement to enter into a non-
compete agreement, in accordance with Article L. 225-42-1 of the French commercial code (Code de commerce).
Other management benefit plans are as follows:
- defined benefit pension plan described in Note 10.1. The plan liability and cost attributable to members of the management team cannot be disclosed separately as the total liability and cost are allocated among members of management and other plan participants using allocation keys;

Carrefour Group – Consolidated Financial Statements as of December 31, 2017 - 52 -
Notes to the Consolidated Financial Statements
- stock options and performance shares: the serving members of the management team at December 31, 2017 held 123,000 performance shares (December 31, 2016: 287,500), for which the vesting conditions are described in Note 10.2.2. The recognised cost of
share-based payment plans for members of the management team was not material in either 2017 or 2016.
Directors’ attendance fees paid to members of the Board of Directors amounted to 1 million euros in 2017 (2016: 1.1 million euros).
10.4 Number of employees
2017 2016
Senior Directors 522 512
Directors 2,267 2,183
Managers 42,575 41,022
Employees 330,790 328,613
Average number of Group employees 376,154 372,330
Number of Group employees at the year-end 378,923 384,151

Carrefour Group – Consolidated Financial Statements as of December 31, 2017 - 53 -
Notes to the Consolidated Financial Statements
NOTE 11: EQUITY AND EARNINGS PER SHARE
11.1 Capital management
The parent company, Carrefour SA, must have sufficient equity capital to comply with the
provisions of France’s Commercial Code.
The Group owns interests in a certain number of financial services companies (banks, insurance
companies). These subsidiaries must have sufficient equity capital to comply with capital adequacy
ratios and the minimum capital rules set by their local banking and insurance supervisors.
Capital management objectives (equity and debt capital) are to:
- ensure that the Group can continue operating as a going concern, in particular by
maintaining high levels of liquid resources;
- optimise shareholder returns;
- keep gearing at an appropriate level, in order to minimise the cost of capital and maintain
the Group’s credit rating at a level that allows it to access a wide range of financing sources
and instruments.
In order to maintain or adjust its gearing, the Group may take on new borrowings or retire existing
borrowings, adjust the dividend paid to shareholders, return capital to shareholders, issue new
shares, buy back shares or sell assets in order to use the proceeds to pay down debt.
11.2 Share capital and treasury stock
11.2.1 Share capital
At December 31, 2017, the share capital was made up of 774,677,811 ordinary shares with a par
value of 2.5 euros each, all fully paid.
(in thousands of shares) 2017 2016
Outstanding at January 1 756,235 738,471
Issued for cash - -
Issued upon exercise of stock options - -
Issued in payment of dividends 18,443 17,764
Cancelled shares - -
Outstanding at December 31 774,678 756,235
The increase during the year corresponded to new shares issued to shareholders who chose to reinvest their 2016 dividend (Notes 2.6 and 11.3).
11.2.2 Treasury stock Accounting principles
Treasury stock is recorded as a deduction from shareholders’ equity, at cost. Gains and losses from sales of treasury stock (and the related tax effect) are recorded directly in shareholders’ equity without affecting net income for the year.
At December 31, 2017, a total of 11,719,539 shares were held in treasury (December 31, 2016:
9,473,039 shares).

Carrefour Group – Consolidated Financial Statements as of December 31, 2017 - 54 -
Notes to the Consolidated Financial Statements
The shares held in treasury are intended notably for the Group’s stock option and performance
share plans, or for the liquidity agreement set up in July 2016 with Rothschild & Cie Banque (which
replaces the 2014 agreement with Oddo Corporate Finance).
All rights attached to these shares are suspended for as long as they are held in treasury.
11.3 Dividends The 2016 ordinary dividend of 0.70 euros per share was paid on July 13, 2017 as follows:
- settlement/delivery of the 18,442,657 new shares corresponding to reinvested dividends,
representing a total capital increase of 372 million euros including premiums;
- 151 million euros paid in cash to shareholders who had chosen not to reinvest their
dividends.
11.4 Other comprehensive income (in € millions)
Group share
Pre-tax Tax Net Pre-tax Tax Net
Effective portion of changes in the fair value of cash flow hedges (29) 10 (19) 12 (4) 8
Changes in the fair value of available-for-sale financial assets (2) 1 (1) (7) 3 (5)
Exchange differences on translating foreign operations (349) 0 (349) 261 0 261
Items that may be reclassified subsequently to profit or loss (380) 11 (369) 266 (2) 264
Remeasurements of defined benefit plans obligation 39 (29) 11 (122) 15 (106)
Items that will not be reclassified to profit or loss 39 (29) 11 (122) 15 (106)
Total Other comprehensive income - Group share (340) (18) (358) 144 14 158
Non-controlling interests
Pre-tax Tax Net Pre-tax Tax Net
Effective portion of changes in the fair value of cash flow hedges 4 (1) 2 3 (1) 2
Changes in the fair value of available-for-sale financial assets (3) 1 (2) 2 (1) 1
Exchange differences on translating foreign operations (124) 0 (124) 100 0 100
Items that may be reclassified subsequently to profit or loss (123) (0) (124) 104 (1) 103
Remeasurements of defined benefit plans obligation (1) 1 (0) (3) 0 (2)
Items that will not be reclassified to profit or loss (1) 1 (0) (3) 0 (2)
Total Other comprehensive income - Non-controlling interests (124) 0 (124) 102 (1) 100
2017 2016
2017 2016
11.5 Shareholders’ equity attributable to non-controlling interests
Non-controlling interests mainly concern:
- the sub-group made up of Carrefour Banque SA and its subsidiaries (part of the France operating segment), which is 60% owned by the Group;
- the sub-group made up of Atacadão and its subsidiaries (part of the Brazil operating segment), which is 71.8% owned by the Group.

Carrefour Group – Consolidated Financial Statements as of December 31, 2017 - 55 -
Notes to the Consolidated Financial Statements
The following tables present the key information from the sub-groups’ Consolidated Financial Statements:
Carrefour Banque SA sub-group
(in € millions)
Income statement 2017 2016 Statement of financial positionDecember 31,
2017
December 31,
2016
Revenue (Net Banking Revenue) 360 389 Non current assets 1,823 2,016
Net result 38 29 Current assets 3,021 2,790
of which:
- attributable to the Group Carrefour 23 18
- attributable to non-controlling interests 15 12
Current liabilities 1,686 2,307
Dividends paid to non-controlling interests 9 9
Non current liabilities (excluding
shareholders' equity)2,631 1,975
Grupo Carrefour Brasil sub-group (in € millions)
Income statement 2017 2016 Statement of financial positionDecember 31,
2017
December 31,
2016
Total revenue 13,945 12,472 Non current assets 4,313 4,135
Net result 475 353 Current assets 4,222 4,288
of which:
- attributable to the Group Carrefour 319 267
- attributable to non-controlling interests 155 86
Current liabilities 4,102 3,908
Dividends paid to non-controlling interests 57 16
Non current liabilities (excluding
shareholders' equity)1,122 2,047
The increase in non controlling interests in Grupo Carrefour Brasil is the result of the IPO described in notes 2.2 and 3.2.1.
There are no individually material non-controlling interests in other subsidiaries.
11.6 Earnings per share (Group share)
Accounting principles
In accordance with IAS 33 – Earnings Per Share, basic earnings per share is calculated by dividing net income, Group share by the weighted average number of shares outstanding during the period. Treasury stock, including shares held indirectly through the equity swap described in Note 11.2.2, are not considered to be outstanding and are therefore deducted from the number of shares used for earnings per share calculations. Contingently issuable shares are treated as outstanding and included in the calculation only from the date when all necessary conditions are satisfied.
Diluted earnings per share is calculated by adjusting net income, Group share and the weighted average number of shares outstanding for the effects of all dilutive potential ordinary shares. Dilutive potential ordinary shares correspond exclusively to the stock options and performance shares presented in Note 10.2.1. Their dilutive effect is calculated by the treasury stock method provided for in IAS 33 which consists in applying the proceeds that would be generated from the exercise of stock options to the purchase of shares at market price (defined as the average share price for the period). In accordance with this method, stock options are considered to be potentially dilutive if they are in the money (based on the sum of the exercise price and the fair value of the services rendered by the grantee, in accordance with IFRS 2 – Share-based Payment).

Carrefour Group – Consolidated Financial Statements as of December 31, 2017 - 56 -
Notes to the Consolidated Financial Statements
Basic earnings per share 2017 2016
Net income from continuing operations (531) 786
Net income from discontinued operations 1 (40)
Net income for the year (531) 746
Weighted average number of shares outstanding (1) 756,976,463 740,030,536
Basic earnings from continuing operations per share (in €) (0.70) 1.06
Basic earnings from discontinued operations per share (in €) 0.00 (0.05)
Basic earnings per share (in €) (0.70) 1.01
(1) In accordance with IAS 33, the weighted average number of shares used to calculate 2016 earnings per share was adjusted to take into
account the effect of the 2016 dividends paid in shares on July 13, 2017 (retrospective adjustment of the effect of the 10% discount on shares
issued in payment of dividends, determined by the treasury stock method).
Diluted earnings per share 2017 2016
Net income from continuing operations (531) 786
Net income from discontinued operations 1 (40)
Net income for the year (531) 746
Weighted average number of shares outstanding, before dilution 756,976,463 740,030,536
Potential dilutive shares - 145,127
Stock grants - 145,127
Stock options - -
Diluted weighted average number of shares outstanding 756,976,463 740,175,662
Diluted earnings from continuing operations per share (in €) (0.70) 1.06
Diluted earnings from discontinued operations per share (in €) 0.00 (0.05)
Diluted earnings per share (in €) (0.70) 1.01
The net income from continuing operations being negative in 2017, the performance shares granted are not deemed dilutives.
Carrefour Group – Consolidated Financial Statements as of December 31, 2017 - 57 -
Notes to the Consolidated Financial Statements
NOTE 12: FINANCIAL ASSETS AND LIABILITIES, FINANCE COSTS AND OTHER FINANCIAL INCOME AND EXPENSES Accounting principles
Non-derivative financial assets
In accordance with IAS 39 – Financial Instruments: Recognition and Measurement, the main financial assets are classified in one of the following four categories:
- financial assets at fair value through profit or loss;
- loans and receivables;
- held-to-maturity investments;
- available-for-sale financial assets. Their classification determines their accounting treatment. They are classified by the Group upon initial recognition, based on the type of asset and the purpose for which it was acquired. Purchases and sales of financial assets are recognised on the trade date, defined as the date on which the Group is committed to buying or selling the asset.
(i) Financial assets at fair value through profit or loss
These are financial assets held for trading, i.e., assets acquired principally for the purpose of selling them at a profit in the short term, or financial assets designated at the outset as at fair value through profit or loss.
They are measured at fair value with changes in fair value recognised in the income statement, under financial income or expense.
(ii) Loans and receivables
Loans and receivables are non-derivative financial assets with fixed or determinable payments that are not quoted in an active market and that do not meet the criteria for classification as either held for trading or available for sale.
They are initially recognised at fair value and are subsequently measured at amortised cost by the effective interest method. For short-term receivables with no specified interest rate, fair value is considered to be equal to the original invoice amount.
These assets are tested for impairment when there is an indication that their recoverable amount may be less than their carrying amount. If this is found to be the case, an impairment loss is recorded.
This category includes trade receivables, other loans and receivables (reported under “Other financial assets”) and consumer credit granted by the financial services companies.
(iii) Held-to-maturity investments
Held-to-maturity investments are non-derivative financial assets other than loans and receivables with fixed or determinable payments and a fixed maturity that the Group has the positive intention and ability to hold to maturity. They are initially recognised at fair value and are subsequently measured at amortised cost by the effective interest method.
The Group did not hold any assets classified as held-to-maturity at December 31, 2017 or December 31, 2016.
(iv) Available-for-sale financial assets
Available-for-sale financial assets are financial assets that do not meet the criteria for classification in any of the other three categories. They consist mainly of shares in non-consolidated companies. Available-for-sale financial assets are measured at fair value, with changes in fair value recognised in “Other comprehensive income”, under “Changes in the fair value of available-for-sale financial assets”. When the assets are sold, the gains and losses accumulated in shareholders’ equity are reclassified to the income statement.
However, in the event of a prolonged or significant fall in value of an equity instrument or a decline in estimated cash flows from a debt instrument, an impairment loss is recognised in the income statement. If, in a subsequent period, the impairment decreases, the previously recognised impairment loss is released as follows:
- for equity instruments (shares and other): through “Other comprehensive income”;
- for debt instruments (bonds, notes and other): where an increase is observed in estimated future cash flows, through profit or loss for an amount not exceeding the previously recognised impairment loss.
The fair value of listed securities corresponds to their market price. For unlisted securities, fair value is determined by reference to recent transactions or by using valuation techniques based on reliable and observable market data. When it is impossible to obtain a reasonable estimate of an asset’s fair value, it is measured at historical cost.

Carrefour Group – Consolidated Financial Statements as of December 31, 2017 - 58 -
Notes to the Consolidated Financial Statements
Non-derivative financial assets held by the Group
The main non-derivative financial assets held by the Group are as follows:
- non-current financial assets, mainly comprising investments in non-consolidated companies and long-term loans;
- trade receivables (Note 5.4.3);
- consumer credit granted by the financial services companies (Note 5.5.1);
- other current financial assets, mainly available-for-sale financial assets, measured at fair value, and short-term loans and deposits.
Non-derivative financial liabilities
Non-derivative financial liabilities are initially recognised at fair value plus transaction costs and premiums directly attributable to their issue. They are subsequently measured at amortised cost.
Non-derivative financial liabilities held by the Group
The main non-derivative financial liabilities held by the Group are as follows:
- borrowings: “Long-term borrowings” and “Short-term borrowings” include bonds and notes issued by the Group, finance lease liabilities, other bank loans and overdrafts, and financial liabilities related to securitised receivables for which the credit risk is retained by the Group;
- suppliers and other creditors (Note 5.4.4);
- consumer credit financing (Note 5.5.2);
- other payables: other payables classified in current liabilities correspond to all other operating payables (mainly accrued employee benefits expense and amounts due to suppliers of non-current assets) and miscellaneous liabilities.
Derivative financial instruments
The Group uses derivative financial instruments to hedge its exposure to risks arising in the course of business, mainly currency and interest rate risks. Exceptionally, the risk of changes in the prices of certain commodities – mainly diesel – may also be hedged.
Derivatives are initially recognised at fair value. They are subsequently measured at fair value with the resulting unrealised gains and losses recorded as explained below.
(i) Derivatives designated as hedging instruments
Hedge accounting is applied if, and only if, the following conditions are met:
- at the inception of the hedge, there is formal designation and documentation of the hedging relationship;
- the effectiveness of the hedge is demonstrated at inception.
The derivatives used by the Group may be qualified as either cash flow hedges or fair value hedges. The Group does not currently hedge its net investment in foreign operations. Cash flow hedges
For instruments qualified as cash flow hedges, the portion of the change in fair value determined to be an effective hedge is recognised directly in “Other comprehensive income” and accumulated in shareholders’ equity until the hedged transaction affects profit. The ineffective portion of the change in fair value is recognised in the income statement, under “Financial income and expense”.
The main cash flow hedges consist of interest rate options and swaps that convert variable rate debt to fixed rate debt, and forward purchases of foreign currencies that hedge future goods purchases in foreign currency. Fair value hedges
Changes in fair value of instruments qualified as fair value hedges are recognised in the income statement, with the effective portion offsetting changes in the fair value of the hedged item.
Examples of fair value hedges include swaps set up to convert fixed rate bonds and notes to variable rate. The hedged portion of the underlying financial liability is remeasured at fair value. Changes in fair value are recognised in the income statement and are offset by the effective portion of symmetrical changes in the fair value of the interest rate swaps.
(ii) Other derivative instruments
Other derivative instruments are measured at fair value, with changes in fair value recognised in profit or loss. Derivative instruments used by the Group include interest rate and currency swaps and vanilla interest rate options.
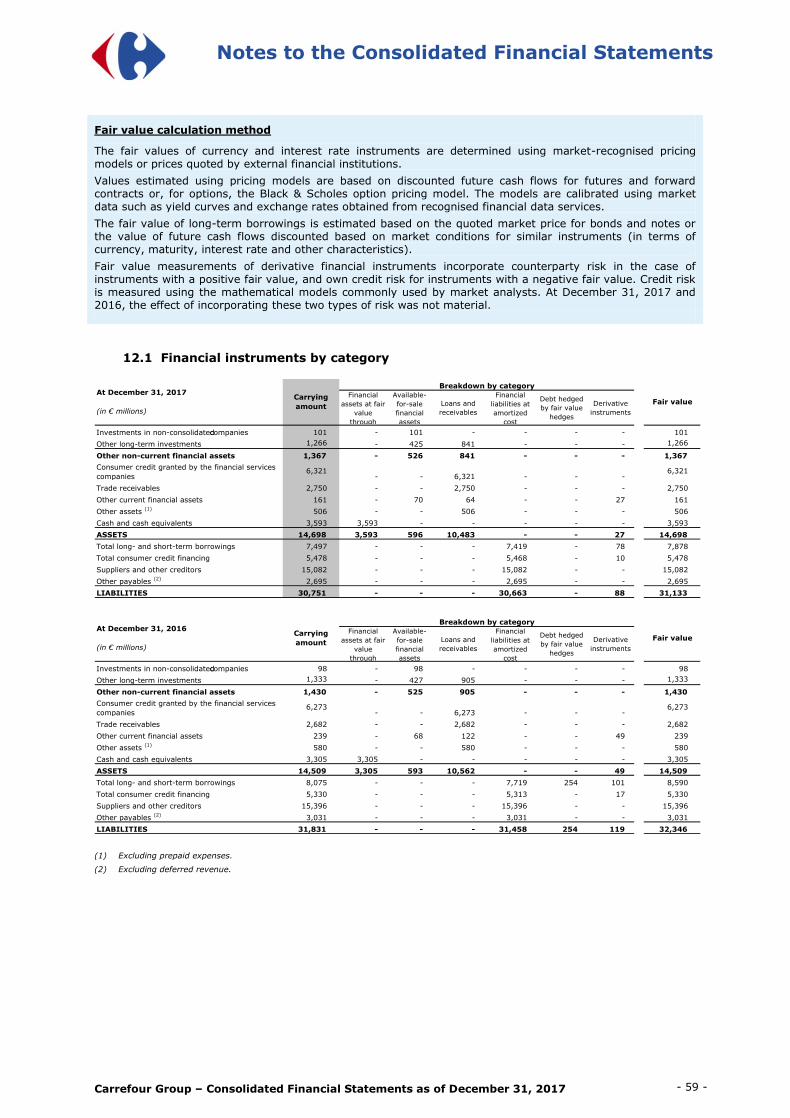
Carrefour Group – Consolidated Financial Statements as of December 31, 2017 - 59 -
Notes to the Consolidated Financial Statements
Fair value calculation method
The fair values of currency and interest rate instruments are determined using market-recognised pricing models or prices quoted by external financial institutions.
Values estimated using pricing models are based on discounted future cash flows for futures and forward contracts or, for options, the Black & Scholes option pricing model. The models are calibrated using market data such as yield curves and exchange rates obtained from recognised financial data services.
The fair value of long-term borrowings is estimated based on the quoted market price for bonds and notes or the value of future cash flows discounted based on market conditions for similar instruments (in terms of currency, maturity, interest rate and other characteristics).
Fair value measurements of derivative financial instruments incorporate counterparty risk in the case of instruments with a positive fair value, and own credit risk for instruments with a negative fair value. Credit risk is measured using the mathematical models commonly used by market analysts. At December 31, 2017 and 2016, the effect of incorporating these two types of risk was not material.
12.1 Financial instruments by category
Financial
assets at fair
value
through
Available-
for-sale
financial
assets
Loans and
receivables
Financial
liabilities at
amortized
cost
Debt hedged
by fair value
hedges
Derivative
instruments
Investments in non-consolidated companies 101 - 101 - - - - 101
Other long-term investments 1,266 - 425 841 - - - 1,266
Other non-current financial assets 1,367 - 526 841 - - - 1,367
Consumer credit granted by the financial services
companies6,321
- - 6,321 - - -6,321
Trade receivables 2,750 - - 2,750 - - - 2,750
Other current financial assets 161 - 70 64 - - 27 161
Other assets (1)
506 - - 506 - - - 506
Cash and cash equivalents 3,593 3,593 - - - - - 3,593
ASSETS 14,698 3,593 596 10,483 - - 27 14,698
Total long- and short-term borrowings 7,497 - - - 7,419 - 78 7,878
Total consumer credit financing 5,478 - - - 5,468 - 10 5,478
Suppliers and other creditors 15,082 - - - 15,082 - - 15,082
Other payables (2)
2,695 - - - 2,695 - - 2,695
LIABILITIES 30,751 - - - 30,663 - 88 31,133
Breakdown by categoryAt December 31, 2017
(in € millions)
Carrying
amountFair value
Financial
assets at fair
value
through
Available-
for-sale
financial
assets
Loans and
receivables
Financial
liabilities at
amortized
cost
Debt hedged
by fair value
hedges
Derivative
instruments
Investments in non-consolidated companies 98 - 98 - - - - 98
Other long-term investments 1,333 - 427 905 - - - 1,333
Other non-current financial assets 1,430 - 525 905 - - - 1,430
Consumer credit granted by the financial services
companies6,273
- - 6,273 - - -6,273
Trade receivables 2,682 - - 2,682 - - - 2,682
Other current financial assets 239 - 68 122 - - 49 239
Other assets (1)
580 - - 580 - - - 580
Cash and cash equivalents 3,305 3,305 - - - - - 3,305
ASSETS 14,509 3,305 593 10,562 - - 49 14,509
Total long- and short-term borrowings 8,075 - - - 7,719 254 101 8,590
Total consumer credit financing 5,330 - - - 5,313 - 17 5,330
Suppliers and other creditors 15,396 - - - 15,396 - - 15,396
Other payables (2)
3,031 - - - 3,031 - - 3,031
LIABILITIES 31,831 - - - 31,458 254 119 32,346
Breakdown by categoryAt December 31, 2016
(in € millions)
Carrying
amountFair value
(1) Excluding prepaid expenses.
(2) Excluding deferred revenue.

Carrefour Group – Consolidated Financial Statements as of December 31, 2017 - 60 -
Notes to the Consolidated Financial Statements
Analysis of assets and liabilities measured at fair value
The table below shows assets and liabilities presented according to the fair value hierarchy
provided for in IFRS 13 – Fair Value Measurement (Note 1.4):
December 31, 2017
(in € millions)
Investments in non-consolidated companies - - 101 101
Other long-term investments 425 - - 425
Other current financial assets - Available-for-sale 70 - - 70
Other current financial assets - Derivative instruments recorded in current
financial assets- 27 - 27
Cash and cash equivalents 3,593 - - 3,593
Consumer credit financing - Derivative instruments recorded in liabilities - (10) - (10)
Borrowings - Derivative instruments recorded in liabilities - (76) (2) (78)
December 31, 2016
(in € millions)
Investments in non-consolidated companies - - 98 98
Other long-term investments 427 - - 427
Other current financial assets - Available-for-sale 68 - - 68
Other current financial assets - Derivative instruments recorded in current
financial assets- 49 - 49
Cash and cash equivalents 3,305 - - 3,305
Consumer credit financing - Derivative instruments recorded in liabilities - (17) - (17)
Borrowings - Derivative instruments recorded in liabilities - (95) (6) (101)
Level 1 Level 2 Level 3 Total
Level 1 Level 2 Level 3 Total
No assets or liabilities measured at fair value were reclassified between the various levels between
December 31, 2016 and 2017.
12.2 Net debt
12.2.1 Net debt calculation Net debt at December 31, 2017 amounted to 3,743 million euros, a decrease of 788 million euros
from December 31, 2016. This amount breaks down as follows:
(in € millions)December 31,
2017
December 31,
2016
Bonds and notes 6,596 6,962
Other borrowings 522 690
Finance lease liabilities 301 322
Total borrowings before derivative instruments recorded in liabilities 7,419 7,974
Derivative instruments recorded in liabilities 78 101
TOTAL BORROWINGS [1] 7,497 8,075
Of which, long-term borrowings 6,428 6,200
Of which, short-term borrowings 1,069 1,875
Other current financial assets 161 239
Cash and cash equivalents 3,593 3,305
TOTAL CURRENT FINANCIAL ASSETS [2] 3,753 3,544
NET DEBT [1] - [2] 3,743 4,531

Carrefour Group – Consolidated Financial Statements as of December 31, 2017 - 61 -
Notes to the Consolidated Financial Statements
12.2.2 Bonds and notes
(in € millions)Book value of
the debt
MaturityDecember 31,
2016Issues Repayments
Translation
adjustments
December 31,
2017
December 31,
2017
Public placements (1) 7,029 446 (1,250) (29) 6,196 6,092
EMTN, EUR, 8 years, 4.678% 2017 250 - (250) - -
EMTN, EUR, 5 years, 1.875% 2017 1,000 - (1,000) - -
Euro Bond Fixed rate, EUR, 7 years, 5.25% 2018 279 - - - 279 279
EMTN, EUR, 6 years, 1.75% 2019 1,000 - - - 1,000 999
EMTN, EUR, 10 years, 4.00% 2020 1,000 - - - 1,000 999
EMTN, EUR, 11 years, 3.875% 2021 1,000 - - - 1,000 993
EMTN, EUR, 8 years, 1.75% 2022 1,000 - - - 1,000 964
Cash-settled convertible bonds, USD 500 million
6 years, 0%2023 - 446 - (29) 417 370
EMTN, EUR, 8 years, 0.750% 2024 750 - - - 750 744
EMTN, EUR, 10 years, 1.25% 2025 750 - - - 750 745
Private placements (2) - 535 - (31) 504 504
Notas promissorias comerciais, BRL 500 million,
6 months, 102% CDI2018 - 134 - (8) 126 126
Notas promissorias comerciais, BRL 500 million,
8 months, 102.25% CDI2018 - 134 - (8) 126 126
Notas promissorias comerciais, BRL 500 million,
14 months, 102.3% CDI2019 - 134 - (8) 126 126
Notas promissorias comerciais, BRL 500 million,
19 months, 103.25% CDI2019 - 134 - (8) 126 126
Total Bonds and notes 7,029 981 (1,250) (61) 6,700 6,596
Face Value
(1) Issues carried out as part of Carrefour SA’s EMTN programme.
(2) Issues carried out by Atacadão SA.
On June 7, 2017, Carrefour issued USD 500 million worth of six-year cash-settled convertible bonds. The bonds, which do not bear interest, may be converted into cash only and will not give rise to the issuance of new shares or carry rights to existing shares.
In accordance with IAS 39 – Financial Instruments: Recognition and Measurement, conversion options on the bonds qualify as embedded derivatives and are therefore accounted for separately
from inception. Subsequent changes in the fair value of these options are recognised in income and set off against changes in the fair value of the call options purchased on Carrefour shares in
parallel with the bond issue.
The bonds are recognised at amortised cost, excluding the conversion feature.
A EUR/USD cross-currency swap for USD 500 million was arranged at the inception of these transactions for the same maturity. The swap has been accounted for as a cash flow hedge and had a fair value of (26) million euros at December 31, 2017.
12.2.3 Other borrowings
(in € millions)December 31,
2017
December 31,
2016
Latin America borrowings 237 376
Other borrowings 145 173
Accrued interest (1)
92 96
Other financial liabilities 48 46
Total Other borrowings 522 690
(1) Accrued interest on total borrowings, including bonds and notes.
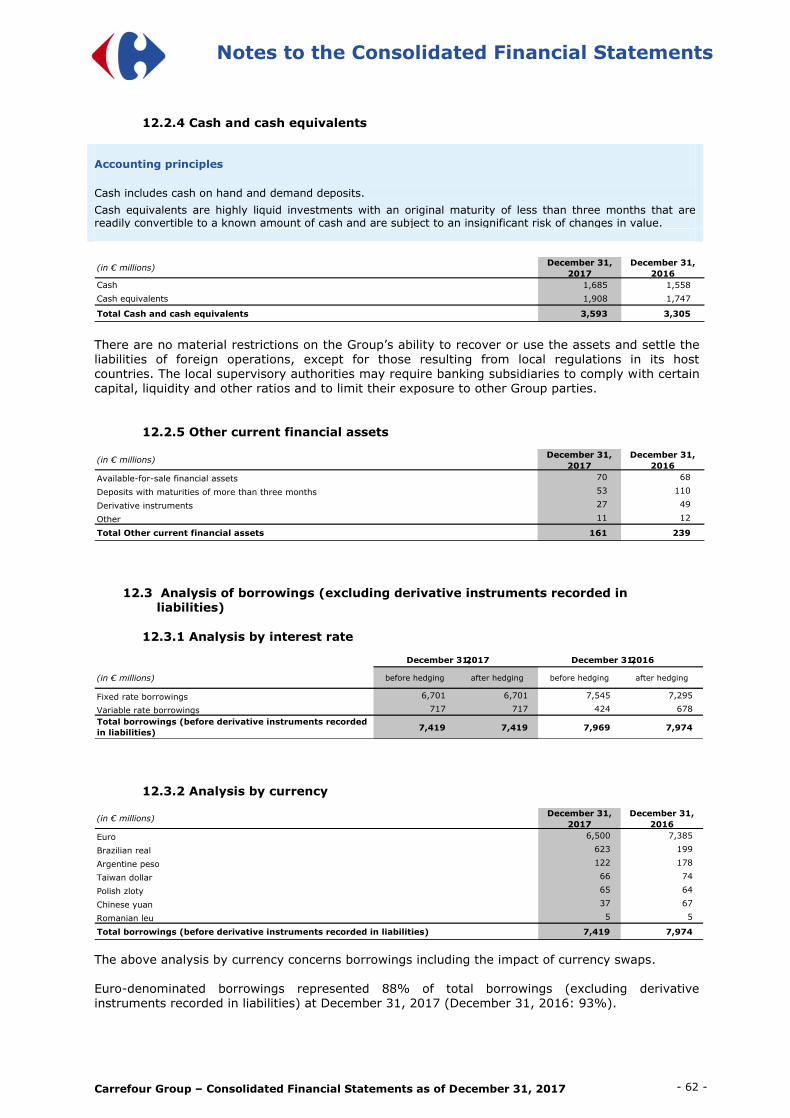
Carrefour Group – Consolidated Financial Statements as of December 31, 2017 - 62 -
Notes to the Consolidated Financial Statements
12.2.4 Cash and cash equivalents
Accounting principles
Cash includes cash on hand and demand deposits.
Cash equivalents are highly liquid investments with an original maturity of less than three months that are readily convertible to a known amount of cash and are subject to an insignificant risk of changes in value.
(in € millions)December 31,
2017
December 31,
2016
Cash 1,685 1,558
Cash equivalents 1,908 1,747
Total Cash and cash equivalents 3,593 3,305
There are no material restrictions on the Group’s ability to recover or use the assets and settle the
liabilities of foreign operations, except for those resulting from local regulations in its host countries. The local supervisory authorities may require banking subsidiaries to comply with certain capital, liquidity and other ratios and to limit their exposure to other Group parties.
12.2.5 Other current financial assets
(in € millions)December 31,
2017
December 31,
2016
Available-for-sale financial assets 70 68
Deposits with maturities of more than three months 53 110
Derivative instruments 27 49
Other 11 12
Total Other current financial assets 161 239
12.3 Analysis of borrowings (excluding derivative instruments recorded in liabilities)
12.3.1 Analysis by interest rate
(in € millions) before hedging after hedging before hedging after hedging
Fixed rate borrowings 6,701 6,701 7,545 7,295
Variable rate borrowings 717 717 424 678
7,419 7,419 7,969 7,974
December 31, 2017 December 31, 2016
Total borrowings (before derivative instruments recorded
in liabilities)
12.3.2 Analysis by currency
(in € millions)December 31,
2017
December 31,
2016
Euro 6,500 7,385
Brazilian real 623 199
Argentine peso 122 178
Taiwan dollar 66 74
Polish zloty 65 64
Chinese yuan 37 67
Romanian leu 5 5
Total borrowings (before derivative instruments recorded in liabilities) 7,419 7,974
The above analysis by currency concerns borrowings including the impact of currency swaps. Euro-denominated borrowings represented 88% of total borrowings (excluding derivative instruments recorded in liabilities) at December 31, 2017 (December 31, 2016: 93%).

Carrefour Group – Consolidated Financial Statements as of December 31, 2017 - 63 -
Notes to the Consolidated Financial Statements
12.3.3 Analysis by maturity
(in € millions)December 31,
2017
December 31,
2016
Due within one year 991 1,774
Due in 1 to 2 years 1,333 333
Due in 2 to 5 years 3,056 3,221
Due beyond 5 years 2,039 2,646
Total borrowings (before derivative instruments recorded in liabilities) 7,419 7,974
12.4 Changes in liabilities arising from financing activities
(in € millions)
Other current
financial
assets
BorrowingsTotal Liabilities arising
from financing activities
At December 31, 2016 (239) 8,075 7,836
Changes from financing cash flows 34 (786) (753)
Change in current financial assets 34 - 34
Issuance of bonds - 981 981
Repayments of bonds - (1,250) (1,250)
Net financial interests paid - (320) (320)
Other changes in borrowings - (197) (197)
Non-cash changes 44 208 253
Effect of changes in foreign exchange rates 17 (156) (139)
Effect of changes in scope of consolidation - (213) (213)
Changes in fair values 12 14 25
Finance costs, net - 317 317
Other changes 16 246 262
At December 31, 2017 (161) 7,497 7,336
12.5 Other non-current financial assets
(in € millions)December 31,
2017
December 31,
2016
Deposits (1)
741 771
Financial services companies' portfolio of assets 426 427
Investments in non-consolidated companies 101 98
Long-term loans 9 9
Other 90 125
Total Other non-current financial assets 1,367 1,430
(1) Deposits include judicial deposits paid in Brazil in the course of litigation described in Notes 9.2 and 9.3 (mostly tax assessments contested by
the Group), pending final decisions from the relevant courts, as well as security deposits paid to lessors under property rental agreements.
12.6 Finance costs and other financial income and expenses
Accounting principles
This item corresponds mainly to finance costs. Other financial income and expenses consist for the most part of discounting adjustments and late interest payable on certain liabilities.

Carrefour Group – Consolidated Financial Statements as of December 31, 2017 - 64 -
Notes to the Consolidated Financial Statements
This item breaks down as follows:
(in € millions) 2017 2016
Interest income from loans and cash equivalents 25 27
Interest income from bank deposits 24 29
Interest income from loans 0 (1)
Finance costs (342) (404)
Interest expense on financial liabilities measured at amortised cost, adjusted for income and expenses from
interest rate instruments(319) (378)
Interest expense on finance lease liabilities (23) (26)
Ineffective portion of fair value hedges of borrowings 1 -
Finance costs, net (317) (377)
Other financial income and expenses, net (128) (138)
Actualisation cost on defined employee benefit debt (18) (30)
Interest income on pension plan assets 3 5
Financial transaction tax (38) (36)
Late interest due in connection with tax reassessments and employee-related litigation (37) (23)
Dividends received on available-for-sale financial assets 3 2
Proceeds from the sale of available-for-sale financial assets 9 35
Cost of sold available-for-sale financial assets (2) (32)
Exchange gains and losses (4) (1)
Cost of bond buybacks (7) (7)
Changes in the fair value of interest rate derivatives (9) (15)
Other (28) (37)
Finance costs and other financial income and expenses, net (445) (515)
Financial expenses (485) (583)
Financial income 41 68
12.7 Risk management
The main risks associated with the financial instruments used by the Group are liquidity, interest
rate, currency, credit and equity risks. The Group’s policy for managing these risks is described
below.
Due to the differing natures of the various businesses, financial risks arising from the banking and
insurance business (including Carrefour Banque in particular) are managed separately from those
related to the retail business.
An organisation has been set up to track financial risks based on a cash-pooling system managed
by the Corporate Treasury and Financing Department. A reporting system ensures that Group
Executive Management can oversee the department’s implementation of the approved
management strategies.
The risks associated with the consumer credit business are managed and tracked directly by the
entities concerned. Corporate Treasury and Financing oversees the proper implementation of the
rules governing the consumer credit business, jointly with the other investors in the business
where applicable. A reporting system exists between local teams and Corporate Treasury and
Financing.
12.7.1 Liquidity risk
12.7.1.1 Retail business
Liquidity risk is the risk that Carrefour will be unable to settle its financial liabilities when they fall
due.
The Group manages its liquidity risk by ensuring, to the extent possible, that it has sufficient liquid
assets at all times to settle its liabilities when they fall due, whatever the conditions in the market.

Carrefour Group – Consolidated Financial Statements as of December 31, 2017 - 65 -
Notes to the Consolidated Financial Statements
A Liquidity Committee meets at monthly intervals to check that the Group’s financing needs are
covered by its available resources.
Corporate Treasury and Financing’s liquidity management strategy consists of:
- promoting conservative financing strategies in order to ensure that the Group’s credit
rating allows it to raise funds on the bond and commercial paper markets;
- maintaining a presence in the debt market through regular debt issuance programmes,
mainly in euros, in order to create a balanced maturity profile. The Group’s issuance
capacity under its Euro Medium-Term Notes (EMTN) programme totals 12 billion euros;
- using the 5 billion-euro commercial paper programme on Euronext Paris, described in a
prospectus filed with the Banque de France;
- maintaining undrawn medium-term bank facilities that can be drawn down at any time
according to the Group’s needs. At December 31, 2017, the Group had two undrawn
syndicated lines of credit obtained from a pool of leading banks, for a total of 3.9 billion
euros. Group policy consists of keeping these facilities on stand-by to support the
commercial paper programme. The loan agreements for the syndicated lines of credit
include the usual commitments clauses, including pari passu, negative pledge, change of
control and cross-default clauses and a clause restricting substantial sales of assets. The
pricing grid may be adjusted up or down to reflect changes in the long-term credit rating.
In Brazil, Atacadão SA issued commercial promissory notes (notas promissórias) with maturity
between 6 and 19 months during the second half of the year amounting to a total of BRL 2 billion
(Note 12.2.2).
The Group considers that its liquidity position is robust. It has sufficient cash reserves to meet its
debt repayment obligations in the coming year.
The Group’s debt profile is balanced, with no peak in refinancing needs across the remaining life of
bond debt, which averages three years and nine months.
12.7.1.2 Banking and insurance business
Carrefour Banque’s liquidity risk is monitored within the framework of an Executive Management-
approved liquidity strategy that is part of the Group’s overall strategy.
Carrefour Banque’s refinancing situation is assessed based on internal standards, early warning
indicators and regulatory ratios.
Liquidity risk management objectives are to:
- ensure that refinancing needs are met, based on monthly assessments of projected cash
surpluses or shortfalls over a three-year period performed by comparing static forecasts of
committed financing facilities with dynamic lending forecasts;
- achieve compliance with the new Basel III liquidity coverage ratios, through a process that
is designed to deliver a sustainable improvement in asset quality by investing in a
dedicated fund eligible for inclusion in the ratio calculation and extending the maturity of
liabilities in order to improve the net stable funding ratio;
- diversify refinancing sources to include bank lines of credit, bond issues, securitisation
programmes, money market issues and customer deposits. During 2017, Carrefour Banque
took out a 400 million-euro loan from the European Central Bank to support the financing
and development of its businesses (Note 5.5.2). The master trust structure allows it to
dynamically manage asset-backed securities series issued by the securitisation fund.
Within this structure, the 110 million-euro series was renewed for a two-year period, as
from June 2016.
In November 2014, Carrefour Banque secured its refinancing sources by rolling over its
750 million-euro five-year syndicated line of credit and negotiating two one-year extension
options. The second of these was exercised in 2016, extending the facility’s maturity to
November 2021.

Carrefour Group – Consolidated Financial Statements as of December 31, 2017 - 66 -
Notes to the Consolidated Financial Statements
The following tables analyse the cash flows generated by the Group’s financial and other liabilities
by period.
December 31, 2017
(in € millions)
Fixed rate borrowings 7,117 7,557 1,285 4,325 1,947
Finance lease liabilities 301 546 47 165 333
Derivative instruments 78 64 25 - 39
Total Borrowings 7,497 8,167 1,358 4,490 2,319
Suppliers and other creditors 15,082 15,082 15,082 - -
Consumer credit financing 5,478 5,478 2,817 2,661 -
Other payables (1)
2,695 2,695 2,695 - -
Total Financial liabilities 30,751 31,422 21,952 7,151 2,319
Carrying
amount
Contractual
cash flowsWithin 1 year
In 1 to 5
years
Beyond 5
years
December 31, 2016
(in € millions)
Borrowings hedged by fair value hedges 254 251 251 - -
Fixed rate borrowings 7,397 8,090 1,627 3,892 2,572
Finance lease liabilities 322 570 47 177 346
Derivative instruments 101 98 83 9 6
Total Borrowings 8,075 9,009 2,008 4,077 2,924
Suppliers and other creditors 15,396 15,396 15,396 - -
Consumer credit financing 5,330 5,330 3,395 1,935 -
Other payables (1)
3,031 3,031 3,031 - -
Total Financial liabilities 31,831 32,766 23,830 6,012 2,924
Carrying
amount
Contractual
cash flowsWithin 1 year
In 1 to 5
years
Beyond 5
years
(1) Excluding deferred revenue.
12.7.2 Interest rate risk
Interest rate risk is the risk of a change in interest rates leading to an increase in the Group’s net
borrowing costs.
It is managed at headquarters level by Corporate Treasury and Financing, which reports monthly
to an Interest Rate Risk Committee responsible for recommending hedging strategies and methods
to be used to limit interest rate exposures and optimise borrowing costs.
Long-term borrowings are generally at fixed rates of interest and do not therefore give rise to any
exposure to rising interest rates. Various financial instruments are nonetheless used to hedge
borrowings against the risk of changes in interest rates. These are mainly basic swaps and options.
Hedge accounting is applied in all cases where the required criteria are met.
Variable rate long-term borrowings are hedged using financial instruments that cap rises in interest
rates over all or part of the life of the debt.
The following table shows the sensitivity of total borrowings to changes in interest rates over one
year:
Impact on
shareholders'
equity (OCI)
Impact on income
statement
Impact on
shareholders'
equity (OCI)
Impact on income
statement
Investments - (3.4) - 3.4
Options qualified as cash flow hedges (0.2) (8.3) 7.8 4.7
Instruments classified as held for trading - (0.2) - 0.5
Total effect (0.2) (11.9) 7.8 8.6
(in € millions)
(- = loss; + = gain)
50-bps decline 50-bps increase

Carrefour Group – Consolidated Financial Statements as of December 31, 2017 - 67 -
Notes to the Consolidated Financial Statements
12.7.3 Currency risk
Currency transaction risk is the risk of an unfavourable change in exchange rates having an
adverse effect on cash flows from commercial transactions denominated in foreign currency.
The Group conducts its international operations through subsidiaries that operate almost
exclusively in their home country, such that purchases and sales are denominated in local
currency. As a result, the Group’s exposure to currency risk on commercial transactions is naturally
limited and mainly concerns imported products. Currency risks on import transactions (i.e., goods
purchases billed in foreign currencies) covered by firm commitments are hedged by forward
purchases of the payment currency. Currency hedges are generally for periods of less than
12 months.
The following table shows the effect of an increase/decrease in exchange rates on currency
instruments:
Impact on
shareholders'
equity (OCI)
Impact on income
statement
Impact on
shareholders'
equity (OCI)
Impact on income
statement
Position EUR / USD - (104.7) - 104.7
Position EUR / RON - 6.2 - (6.2)
Position EUR / PLN - 5.7 - (5.7)
Position EUR / HKD - (4.3) - 4.3
Position EUR / CNY - (2.6) - 2.6
Position RON / USD - (2.0) - 2.0
(in € millions)
(- = loss; + = gain)
10% decline 10% increase
Currency translation risk is the risk of an unfavourable change in exchange rates reducing the
value of the net assets of a subsidiary whose functional currency is not the euro, after conversion
into euros for inclusion in the Group’s consolidated statement of financial position.
The consolidated statement of financial position and income statement are exposed to a currency
translation risk: consolidated financial ratios are affected by changes in exchange rates used to translate the income and net assets of foreign subsidiaries operating outside the eurozone.
The translation risk on foreign operations outside the eurozone mainly concerns the Brazilian real,
Argentine peso and Chinese renminbi. For example, changes in the average exchange rates used
in 2017 compared with those for 2016 increased consolidated net sales by 269 million euros, or
0.3%, and recurring operating income by 58 million euros, or 3%.
Lastly, when financing is arranged locally, it is generally denominated in local currency.
12.7.4 Credit risk
The Group’s estimated exposure to credit risk is presented below:
(in € millions)December 31,
2017
December 31,
2016
Investments in non-consolidated companies 101 98
Other long-term investments 1,266 1,333
Total Other non-current financial assets 1,367 1,430
Consumer credit granted by the financial services companies 6,321 6,273
Trade receivables 2,750 2,682
Other current financial assets 161 239
Other assets (1)
506 580
Cash and cash equivalents 3,593 3,305
Maximum exposure to credit risk 14,698 14,509
(1) Excluding prepaid expenses.

Carrefour Group – Consolidated Financial Statements as of December 31, 2017 - 68 -
Notes to the Consolidated Financial Statements
12.7.4.1 Retail business
1) Trade receivables
Trade receivables correspond mainly to amounts receivable from franchisees (for delivered goods
and franchise fees), suppliers (mainly rebates and commercial income) and tenants of shopping
mall units (rent). Impairment losses are recognised where necessary, based on an estimate of the
debtor’s ability to pay the amount due and the age of the receivable.
At December 31, 2017, trade receivables net of impairment (excluding receivables from suppliers)
amounted to 1,433 million euros (Note 5.4.3). At that date, past due receivables amounted to a
net 165 million euros, of which 30 million euros were over 90 days past due (2.1% of total trade
receivables net of impairment, excluding receivables from suppliers). No impairment has been
recognised for these receivables as the Group considers that the risk of non-recovery is very
limited.
2) Investments (cash equivalents and other current financial assets)
The Group’s short-term cash management strategy focuses on acquiring liquid investments that are
easily convertible into cash and are subject to an insignificant risk of changes in value.
Investments are made for the most part by Corporate Treasury and Financing, in diversified
instruments such as term deposits with leading banks and mutual funds classified by the AMF as
“money market” and “short-term money market” funds without any withdrawal restrictions.
Investments made at the country level are approved by Corporate Treasury and Financing.
Counterparty risk monitoring procedures are implemented to track counterparties’ direct
investment strategies and the underlying assets held by mutual funds in which the Group invests.
The Group’s objective is to never hold more than 5% of a fund’s units and to never invest more
than 250 million euros in any single fund.
12.7.4.2 Banking and insurance business
1) Credit risk management
To protect against default by borrowers, the Group’s financial services companies have set up
systems to check the quality and repayment capacity of their customers. These include:
- decision-making aids such as credit scoring applications, income/debt simulation tools and
credit history checking procedures;
- interrogation of positive and negative credit history databases, where they exist;
- active management of collection processes;
- credit risk monitoring and control systems.
Within each credit company, a Credit Risk Department is responsible for all of these processes, and
the Board of Directors receives copies of all Credit Risk Management Committee reports.
At Group level, a Credit Risk – Europe unit has been set up to oversee and implement credit risk
management policies in France, Spain, Belgium and Italy.
2) Provisions for non-performing consumer loans
Consumer loans are classified as non-performing when the Group believes that there is a risk that
all or part of the amount due will not be recovered (for example, because of overdue payment or a
litigation procedure).
Provision models are developed in accordance with IAS 39 – Financial Instruments: Recognition
and Measurement and local banking regulations in each country, according to a two-step process:

Carrefour Group – Consolidated Financial Statements as of December 31, 2017 - 69 -
Notes to the Consolidated Financial Statements
- classification of outstanding loans in uniform risk categories based on the probability of
default; then
- modelling of the loss given default based on historical data.
Analysis of due and past due consumer loans
0 to 3 months 3 to 6 months6 months to 1
year
More than one
year
Consumer credit granted by the
financial services companies6,321 6,063 46 47 57 108
0 to 3 months 3 to 6 months6 months to 1
year
More than one
year
Consumer credit granted by the
financial services companies6,273 6,030 69 55 15 104
(in € millions)
(in € millions)
Amounts due and past-due at the period-endAmounts not yet
due at the
period-end
December 31,
2016
December 31,
2017
Amounts not yet
due at the
period-end
Amounts due and past-due at the period-end
Analysis of consumer loans by maturity
(in € millions)December 31,
2017
Due within
1 year
Due in 1 to
5 years
Due beyond
5 years
France 2,383 1,018 1,300 64
Belgium 162 8 143 11
Spain 2,057 1,293 293 471
Italy 205 92 92 22
Argentina 141 139 2 -
Brazil 1,374 1,316 58 -
TOTAL 6,321 3,866 1,887 568
(in € millions)December 31,
2016
Due within
1 year
Due in 1 to
5 years
Due beyond
5 years
France 2,592 1,081 1,426 85
Belgium 166 5 149 11
Spain 1,812 1,260 258 294
Italy 201 93 46 63
Argentina 176 172 4 0
Brazil 1,326 1,290 36 -
TOTAL 6,273 3,902 1,918 453
12.7.5 Equity risk
Equity risk corresponds to the potential impact of changes in the Carrefour share price on its
share-based payment commitments and on treasury stock.
Group policy is to avoid taking positions on its own shares or those of other companies, except in
response to particular circumstances or needs.
From time to time, the Group buys back its shares on the market or purchases call options on its
shares, mainly in connection with its liquidity agreement and its performance share plans. The
frequency and size of these purchases depend on the share price.
At December 31, 2017, shares and options held covered the Group’s total commitments under
outstanding Carrefour SA performance share plans.
Marketable securities portfolios and other financial investments held by the Group consist for the
most part of money market instruments that do not expose the Group to any material equity risk.
The equity risk associated with the conversion options embedded in the bonds issued by the Group
in June 2017 (Note 12.12.2) is fully hedged by symmetrical options contracted with banks. On the
statement of financial position, these derivatives are shown in assets and in liabilities for an
amount of 12.4 million euros.
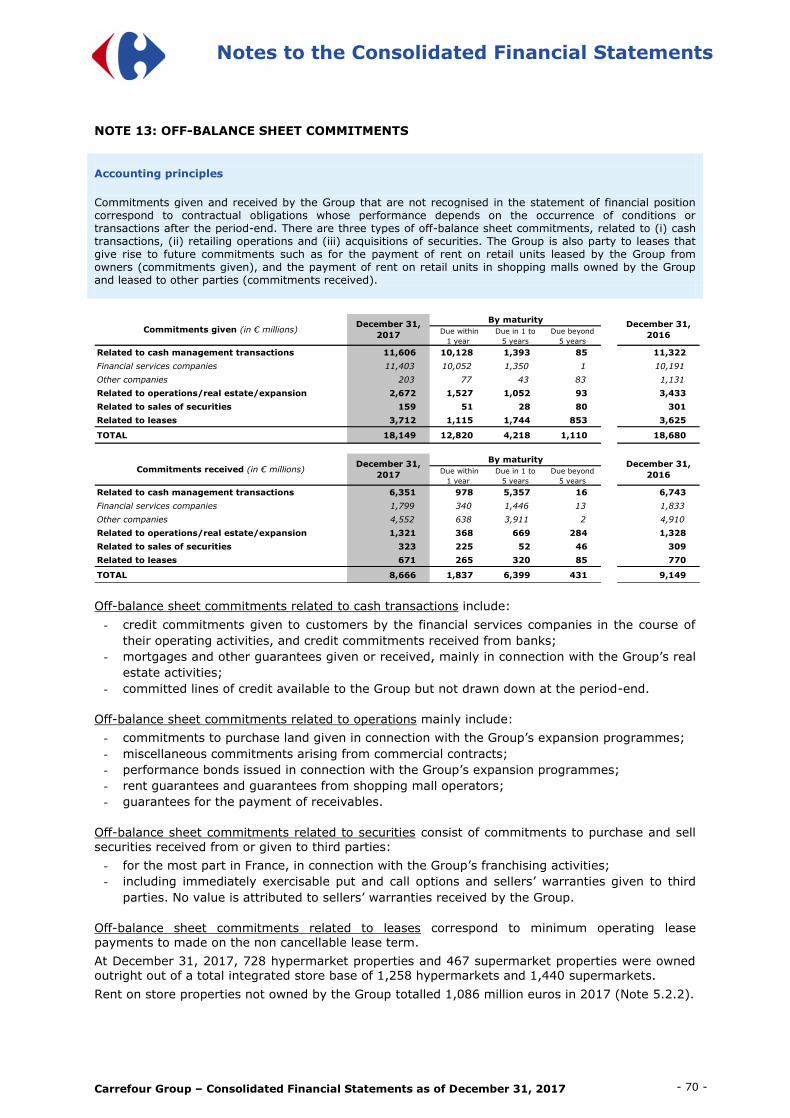
Carrefour Group – Consolidated Financial Statements as of December 31, 2017 - 70 -
Notes to the Consolidated Financial Statements
NOTE 13: OFF-BALANCE SHEET COMMITMENTS
Accounting principles
Commitments given and received by the Group that are not recognised in the statement of financial position correspond to contractual obligations whose performance depends on the occurrence of conditions or transactions after the period-end. There are three types of off-balance sheet commitments, related to (i) cash transactions, (ii) retailing operations and (iii) acquisitions of securities. The Group is also party to leases that give rise to future commitments such as for the payment of rent on retail units leased by the Group from owners (commitments given), and the payment of rent on retail units in shopping malls owned by the Group and leased to other parties (commitments received).
Due within
1 year
Due in 1 to
5 years
Due beyond
5 years
Related to cash management transactions 11,606 10,128 1,393 85 11,322
Financial services companies 11,403 10,052 1,350 1 10,191
Other companies 203 77 43 83 1,131
Related to operations/real estate/expansion 2,672 1,527 1,052 93 3,433
Related to sales of securities 159 51 28 80 301
Related to leases 3,712 1,115 1,744 853 3,625
TOTAL 18,149 12,820 4,218 1,110 18,680
Due within
1 year
Due in 1 to
5 years
Due beyond
5 years
Related to cash management transactions 6,351 978 5,357 16 6,743
Financial services companies 1,799 340 1,446 13 1,833
Other companies 4,552 638 3,911 2 4,910
Related to operations/real estate/expansion 1,321 368 669 284 1,328
Related to sales of securities 323 225 52 46 309
Related to leases 671 265 320 85 770
TOTAL 8,666 1,837 6,399 431 9,149
December 31,
2016
December 31,
2016
By maturityCommitments given (in € millions)
Commitments received (in € millions)December 31,
2017
By maturity
December 31,
2017
Off-balance sheet commitments related to cash transactions include:
- credit commitments given to customers by the financial services companies in the course of
their operating activities, and credit commitments received from banks;
- mortgages and other guarantees given or received, mainly in connection with the Group’s real
estate activities;
- committed lines of credit available to the Group but not drawn down at the period-end.
Off-balance sheet commitments related to operations mainly include:
- commitments to purchase land given in connection with the Group’s expansion programmes;
- miscellaneous commitments arising from commercial contracts;
- performance bonds issued in connection with the Group’s expansion programmes;
- rent guarantees and guarantees from shopping mall operators;
- guarantees for the payment of receivables.
Off-balance sheet commitments related to securities consist of commitments to purchase and sell securities received from or given to third parties:
- for the most part in France, in connection with the Group’s franchising activities;
- including immediately exercisable put and call options and sellers’ warranties given to third
parties. No value is attributed to sellers’ warranties received by the Group.
Off-balance sheet commitments related to leases correspond to minimum operating lease payments to made on the non cancellable lease term.
At December 31, 2017, 728 hypermarket properties and 467 supermarket properties were owned outright out of a total integrated store base of 1,258 hypermarkets and 1,440 supermarkets.
Rent on store properties not owned by the Group totalled 1,086 million euros in 2017 (Note 5.2.2).

Carrefour Group – Consolidated Financial Statements as of December 31, 2017 - 71 -
Notes to the Consolidated Financial Statements
Of total future minimum rentals due under operating and finance leases, 27% are due within one year, 45% in one to five years and 28% beyond five years.
Future minimum rentals under operating leases – determined based on the Group’s maximum
commitment in terms of both duration and amount for each of the property leases in progress at the period-end – amounted to 3,712 million euros at December 31, 2017, or 2,928 million euros after discounting (Note 6.5).
The Group also owns various shopping malls built mainly on the same sites as its hypermarkets and supermarkets and leased to third parties, as well as a number of store premises leased to franchisees. Rental revenues from these retail units in 2017 amounted to 228 million euros. Future
minimum rentals receivable from these retail units – determined based on the tenants’ maximum commitment in terms of both duration and amount for each of the leases in progress at the period-end – amounted to 671 million euros at December 31, 2017, or 546 million euros after discounting.
NOTE 14: SUBSEQUENT EVENTS “Carrefour 2022” transformation plan
On January 23, 2018, the Carrefour Group unveiled its transformation plan based on four pillars:
- Deploy a streamlined and open organisation;
- Achieve productivity and competitiveness gains;
- Create a leading omni-channel universe;
- Overhaul the offering to promote food quality.
In the first pillar, the Group’s headquarters around the globe will be scaled back in order to improve teams’ operational efficiency and responsiveness:
- In the Ile-de-France region, the corporate headquarters in Boulogne will be closed and a project to build a new 30,000 square-meter headquarters in Essonne will be abandoned;
- A strictly voluntary redundancy plan will be offered to 2,400 employees at the headquarters in France, out of a total workforce of 10,500;
- In Belgium, the measures announced on January 25, 2018 to reduce expenditure and operating costs and to increase operational efficiency could have an impact on jobs. Any
implementation of these measures, which could impact up to 1,233 employees, will be launched following the information and consultation procedure in progress with trade unions.
A provision will be accrued for the cost of these measures in 2018 when the conditions for recognising such a provision are met.
The second pillar aims to regain room for manoeuvre to improve the Group’s efficiency and competitiveness in the interest of its customers. This will involve a significant reduction in its cost
base and a more effective, targeted investment policy focused on its growth drivers. As well as a 2 billion euro cost reduction plan, the roll-out of this pillar will eliminate certain loss centres. Struggling stores will exit the Group’s scope of consolidation. These include the network of 273 ex-Dia stores which have experienced great difficulties. A search for buyers has been or will be
launched. In the absence of buyers, the stores will be closed.
The property and equipment of the stores concerned have therefore been written down in the Consolidated Financial Statements for the year ended December 31, 2017 (Note 5.3).
Strategic partnership in China
On January 23, 2018, Carrefour announced that it had signed a term sheet with Tencent and Yonghui regarding a potential investment in Carrefour China. The planned transaction, which is
subject to the finalisation of further due diligence and the agreement of the parties on the definitive terms of the complete legal documentation, would allow Carrefour to remain Carrefour China’s largest shareholder and to continue to control the company.

Carrefour Group – Consolidated Financial Statements as of December 31, 2017 - 72 -
Notes to the Consolidated Financial Statements
The potential investment would leverage Carrefour’s retail knowledge with Tencent’s technological excellence and Yonghui’s operational know-how and in particular its deep knowledge of fresh products.
Also on January 23, 2018, Carrefour and Tencent announced that they had signed a preliminary agreement regarding strategic business cooperation in China in order to bring together Carrefour’s retail knowledge with Tencent’s digital expertise and innovation capabilities.
Thanks to this partnership, Carrefour would improve its online visibility, increase the traffic of its offline and online retail activities, and benefit from Tencent’s advanced digital and technological expertise to develop new smart retail initiatives.
Strategic partnership with Showroomprivé
On January 11, 2018, Carrefour announced that it had signed a strategic agreement with Showroomprivé, Europe’s second-largest online private sales player. This partnership is part of
both groups’ strategy of developing a leading omni-channel offering, and will notably cover areas such as sales, marketing, logistics and data.
In order to seal the partnership, Carrefour acquired 16.86% of Showroomprivé’s share capital on February 7, 2018. This took the form of an off-market acquisition of the block of shares owned by
Conforama, a Steinhoff group subsidiary, at a price of 13.5 euros per share, for a total amount of around 79 million euros.
An additional payment will be made by Carrefour to Conforama should Carrefour launch a takeover bid for Showroomprivé within 18 months of the completion of the transaction.
This transaction was granted an exemption from the obligation to launch a public offer by the French financial markets authority (AMF).
Upon completion of the transaction, Carrefour will replace Conforama in the current shareholders’
agreement between the founders of Showroomprivé and Conforama, under an agreement whose main terms are identical to the existing pact between the founders and Conforama/Steinhoff. The founders will retain 27.17% of the capital and 40.42% of the voting rights. Carrefour will hold
16.86% of the capital and 13.67% of the voting rights.
The shareholders’ agreement contains provisions relating to (i) the composition of the board of directors (11 directors and one non-voting director, including five appointed by the founders
among whom the chairman who has a casting vote and one director and one non-voting director appointed by Carrefour, as well as five independent directors); (ii) an undertaking of the parties to maintain the current management; and (iii) possible termination of the shareholders’ agreement in case of persistent disagreement on major strategic decisions, which could lead to the unwinding of the Carrefour investment or a tender offer.
The Group considers that its representation on Showroomprivé’s Board of Directors gives it significant influence over the company. Accordingly, the stake acquired by the Group on
February 7, 2018 will be accounted for by the equity method in the Consolidated Financial Statements as from that date.

Carrefour Group – Consolidated Financial Statements as of December 31, 2017 - 73 -
Notes to the Consolidated Financial Statements
NOTE 15: FEES PAID TO THE AUDITORS
(in € thousands)Deloitte &
Associés(1) Network
Total
Deloitte
KPMG
S.A.(1) Network
Total
KPMGMAZARS
(1) NetworkTotal
MAZARS
Certification of the accounts services 1,614 764 2,378 3,377 5,752 9,129 1,323 840 2,163
Carrefour S.A. - Issuer 319 - 319 494 - 494 333 - 333
Subsidiaries (controlled entities) 1,294 764 2,058 2,883 5,752 8,635 990 840 1,830
Other services (2) 8 796 804 253 1,574 1,827 42 305 346
Carrefour S.A. - Issuer - 79 79 22 - 22 38 76 114
Subsidiaries (controlled entities) 8 716 724 231 1,574 1,805 4 229 233
TOTAL 1,622 1,560 3,182 3,630 7,326 10,956 1,364 1,145 2,509
Fees 2017
(1) Carrefour SA (holding company) statutory auditors (excluding services provided by their network).
(2) Including services that are by law to be provided by statutory auditors.
Other services provided by Carrefour SA’s auditors include mainly services in relation to the
issuance of certificates and agreed-upon procedures on financial information and internal control.

Carrefour Group – Consolidated Financial Statements as of December 31, 2017 - 74 -
Notes to the Consolidated Financial Statements
NOTE 16: LIST OF CONSOLIDATED COMPANIES
16.1 Fully consolidated companies at December 31, 2017
ALHE DISTRIBUTION 100 CRFP21 100
ALSATOP 100 CRFP22 100
AMIDIS ET CIE 100 CRFP23 100
ANTIDIS 100 CRFP8 100
AVENUE 52 CROQUETTELAND 70
BELLEVUE DISTRIBUTION 100 CSD TRANSPORTS 74
BLADIS 100 CSI 100
BLO DISTRIBUTION 100 DAUPHINOISE DE PARTICIPATIONS 100
C.S.D 74 DE LA COQUERIE 100
C.S.F 100 DE LA FONTAINE 51
CADS 99.5 DE SIAM 51
CALLOUETS 51 DIGITAL MEDIA SHOPPER 100
CARAUTOROUTES 100 DISTRIVAL 100
CARDADEL 100 DOREL 100
CARFUEL 100 ECALHAN 51
CARGO PROPERTY ALLONNES 35.2 ED FRANCHISE 100
CARGO PROPERTY BAGE LA VILLE 35.2 EPG 66
CARGO PROPERTY BAIN DE BRETAGNE 35.2 ERTECO 100
CARGO PROPERTY BRIE COMTE ROBERT 35.2 FALDIS 99.9
CARGO PROPERTY CHOLET 35.2 FCT MASTER CREDIT CARD 2013 60
CARGO PROPERTY COMBS LA VILLE 35.2 FINANCIERE RSV 100
CARGO PROPERTY CREPY 35.2 FINIFAC 100
CARGO PROPERTY EPAUX BEZU 35.2 FONCIERE LES 4 ROUTES 100
CARGO PROPERTY GERANT 100 FORUM DEVELOPPEMENT 100
CARGO PROPERTY HOLDING 35.2 FRAMIDIS 100
CARGO PROPERTY LA COURNEUVE 35.2 FRED 8 100
CARGO PROPERTY LAUDUN 35.2 GAMACASH 100
CARGO PROPERTY LUNEVILLE 35.2 GEILEROP 100
CARGO PROPERTY PLAISANCE DU TOUCH 35.2 GENEDIS 100
CARGO PROPERTY POUPRY ARTENAY 35.2 GERNIMES 100
CARGO PROPERTY SAVIGNY SUR CLAIRIS 35.2 GIE BREST BELLEVUE 79.9
CARGO PROPERTY VENDIN 35.2 GRANDSVINS-PRIVÉS.COM 100
CARIMA 100 GREENWEEZ 97.6
CARMA 50 GUILVIDIS 100
CARMA COURTAGE 50 GUYENNE & GASCOGNE 100
CARMA VIE 50 GVTIMM 51
CARREFOUR ADMINISTRATIF FRANCE 100 HAUTS DE ROYA 100
CARREFOUR BANQUE 60 HYPARLO 100
CARREFOUR DRIVE 100 HYPERADOUR 100
CARREFOUR FRANCE 100 HYPERMARCHES DE LA VEZERE 50
CARREFOUR FRANCE PARTICIPATION 100 IMMAUFFAY 51
CARREFOUR HYPERMARCHES 100 IMMO ARTEMARE 51
CARREFOUR IMPORT 100 IMMO BACQUEVILLE 51
CARREFOUR LIBERTY 100 IMMOBILIERE CARREFOUR 100
CARREFOUR MANAGEMENT 100 IMMOBILIERE ERTECO 100
CARREFOUR MARCHANDISES INTERNATIONALES 100 IMMOCYPRIEN 51
CARREFOUR MONACO 100 IMMODIS 100
CARREFOUR NOLIM 100 IMMOLOUBES 51
CARREFOUR OMNICANAL 100 IMMOTOURNAY 51
CARREFOUR PARTENARIAT INTERNATIONAL 100 INTERDIS 100
CARREFOUR PROPERTY FRANCE 100 JOUFFROY 100
CARREFOUR PROPERTY GESTION 100 LA CROIX VIGNON 51
CARREFOUR PROPERTY INTERNATIONAL 100 LALAUDIS 99
CARREFOUR PROXIMITE FRANCE 100 LANN KERGUEN 51.2
CARREFOUR SA 100 LAPALUS 100
CARREFOUR SERVICES CLIENTS 100 LAURENJI 100
CARREFOUR STATION SERVICE 100 LE COURTEMBLET 100
CARREFOUR SUPPLY CHAIN 100 LES TASSEAUX 51
CARREFOUR VOYAGES 100 LES VALLEES 51
CENTRE DE FORMATION ET COMPETENCES 100 LOGIDIS 100
CHALLENGER 100 LUDIS 100
CIGOTOP 100 LVDIS 100
CLAIREFONTAINE 100 LYBERNET 50
CMCB DISTRIBUTION 100 MAISON JOANNES BOUBEE 100
MARKET PAY 100
MARKET PAY TECH 100
CONCEPT 2003 100 MATOLIDIS 100
CORSAIRE 50 MAXIMOISE DE CREATION 51
COVIAM 8 100 MENUDIS 100
COVIAM 9 100 MICHEL DISTRIBUTION 100
COVICAR 2 100 MICHEL HOCHARD 100
COVICAR 40 100 MONTECO 100
COVICAR IC 6 100 MONTEL DISTRIBUTION 100
COVICAR IC 8 100 MY DESIGN 66
CPF ASSET MANAGEMENT 100 NOSAEL 51
CPF PROJECT 100 OOSHOP 100
CRF REGIE PUBLICITAIRE 100 PASDEL 100
CRFP13 100 PHIVETOL 100
CRFP19 100 PRASSIDIS 100
CRFP20 100 PROFIDIS 100
PROLACOUR 100
FRANCE
Percent
interest used
in
consolidation FRANCE
Percent
interest used
in
consolidation
COMPAGNIE D'ACTIVITE ET DE COMMERCE
INTERNATIONAL -CACI-100

Carrefour Group – Consolidated Financial Statements as of December 31, 2017 - 75 -
Notes to the Consolidated Financial Statements
FRANCE
Percent
interest used
in
consolidation BRAZIL
Percent
interest used
in
consolidation
PROPHI 100 ATACADAO DISTRIBUICAO COMERCIO E INDUSTRIA S.A. 72
RESSONS 51 BANCO CSF S.A. 36.6
RUE DU COMMERCE 100 BSF HOLDING S.A. 36.6
SAFETY 100 CARREFOUR COMMERCIO E INDUSTRIA LTDA 72
SAINT HERMENTAIRE 100 CMBCI INVESTIMENTOS E PARTICIPAÇÕES LTDA 72
SAM PROSPECTIVE 90 COMERCIAL DE ALIMENTOS CARREFOUR S.A. 72
SAMAD 100
SCI COVICAR IC 7 100
SCI IC AULNAY 100 PANDORA PARTICIPACOES LTDA. 72
SCI PROXALBY 74 RIOBONITO ASSESSORIA DE NEGOCIOS LTDA 72
SCYCADIS 100 TROPICARGAS TRANSPORTES LTDA. 72
SELIMA 100 VERPARINVEST S.A 72
SELOJA 51
SIGOULIM 51
SMD 100 CHINA
SOCIETE DES NOUVEAUX HYPERMARCHES 100 BEIJING CARREFOUR COMMERCIAL CO., LTD 55.0
SODIMODIS 100
SODISAL 100
SODISCAF 100 BEIJING CHUANGYIJIA CARREFOUR COMMERCIAL 100
SODISTOURS 100 BEIJING REPRESENTATIVE OFFICE OF CARREFOUR S.A. 100
SODITA 100
SODITRIVE 100
SOFALINE 100 CARREFOUR (CHINA) MANAGEMENT & CONSULTING SERVICES 100
SOFIDIM 98.9 CARREFOUR (SH) E-COMMERCE CO., LTD 100
SOVAL 100 CARREFOUR (SH) SUPPLY CHAIN CO., LTD 100
STELAUR 99.9
STENN 100
STORYDIS 100 CHANGCHUN CARREFOUR COMMERCIAL CO., LTD 100
SUPER AZUR 100 CHANGSHA CARREFOUR HYPERMARKET 100
SUPERADOUR 100 CHANGZHOU YUEDA CARREFOUR COMMERCIAL CO., LTD 60
SUPERDIS 96.5 CHENGDU CARREFOUR HYPERMARKET CO., LTD 100
TOP CONSO OPCO 100 CHONGQING CARREFOUR COMMERCIAL CO., LTD 65
TOP CONSO PROPCO 100 DALIAN CARREFOUR COMMERCIAL CO., LTD 100
TOP CORRECTION OPCO 100 DONGGUAN CARREFOUR COMMERCIAL CO., LTD 100
TOP CORRECTION PROPCO 100 FOSHAN CARREFOUR COMMERCIAL CO., LTD 100
TROTTEL 50 FUZHOU CARREFOUR COMMERCIAL CO., LTD 100
UNIVU 100 GUANGZHOU JIAGUANG SUPERMARKET CO., LTD 100
VAN K 100 GUIZHOU CARREFOUR COMMERCIAL CO.,LTD 100
VEZERE DISTRIBUTION 50 HAIKOU CARREFOUR COMMERCIAL 100
VIZEGU 90.1 HANGZHOU CARREFOUR HYPERMARKET CO., LTD 100
HARBIN CARREFOUR HYPERMARKET CO., LTD 100
HEBEI BAOLONGCANG CARREFOUR COMMERCIAL CO., LTD 100
GERMANY HEFEI YUEJIA COMMERCIAL CO., LTD 60
CARREFOUR PROCUREMENT INTERNATIONAL AG & CO. KG 100 HUHHOT CARREFOUR COMMERCIAL COMPANY CO.,LTD 100
JINAN CARREFOUR COMMERCIAL CO., LTD 100
KUNMING CARREFOUR HYPERMARKET CO., LTD 100
ARGENTINA NANCHANG YUEJIA COMMERCIAL CO., LTD 60
BANCO DE SERVICIOS FINANCIEROS SA 60 NANJING YUEJIA SUPERMARKET CO LTD 65
INC S.A. 100 NINGBO CARREFOUR COMMERCIAL 100
QINGDAO CARREFOUR COMMERCIAL 95
QUJING CARREFOUR HYPERMARKET CO., LTD 100
BELGIUM SHANDONG CARREFOUR COMMERCIAL CO., LTD 100
BRUGGE RETAIL ASSOCIATE 100 SHANGAI CARHUA SUPERMARKET LTD 55
CAPARBEL 100 SHANGHAI GLOBAL SOURCING CONSULTING CO LTD 100
CARREFOUR BELGIUM 100 SHANGHAI JIAYUAN COMMERCIAL CO., LTD 100
CARREFOUR FINANCE 100 SHANGHAI PROXIMITY SUPERMARKET 100
CARUM 100 SHANXI YUEJIA COMMERCIAL CO.,LTD 55
DE NETELAAR 100 SHENYANG CARREFOUR COMMERCIAL CO LTD 100
DRIVE 1 100 SHENZHEN CARREFOUR COMMERCIAL 100
DRIVE 2 100 SHENZHEN LERONG SUPERMARKET CO LTD 100
ECLAIR 100 SHIJIAZHUANG CARREFOUR COMMERCIAL CO., LTD 100
FILUNIC 100 SICHUAN CARREFOUR COMMERCIAL CO., LTD 100
FIMASER 60
GROSFRUIT 100
HALLE RETAIL ASSOCIATE 100 SUZHOU YUEJIA SUPERMARKET CO., LTD 55
FIRST IN FRESH 100
HEPPEN RETAIL ASSOCIATE 100
MARKET A1 CBRA 100 TIANJIN JIAFU COMMERCIAL CO., LTD. 100
MARKET B2 CBRA 100 TIANJIN QUANYE CARREFOUR HYPERMARKET CO., LTD 100
MARKET C3 CBRA 100 WUHAN HANFU SUPERMARKET CO., LTD 100
MARKET D4 CBRA 100 WUXI YUEJIA COMMERCIAL CO., LTD 55
MARKET E5 CBRA 100 XIAMEN CARREFOUR COMMERCIAL CO LTD 100
MARKET F6 CBRA 100 XIAN CARREFOUR HYPERMARKET CO LTD 100
ORTHROS 100 XINJIANG CARREFOUR HYPERMARKET 100
ROB 100 XUZHOU YUEJIA COMMERCIAL CO LTD 60
SCHILCO 100 ZHENGZHOU YUEJIA COMMERCIAL CO., LTD 60
SOUTH MED INVESTMENTS 100 ZHUHAI CARREFOUR COMMERCIAL CO.,LTD 100
STIGAM 100 ZHUHAI LETIN SUPERMARKET CO., LTD 100
VANDEN MEERSSCHE NV 100 ZHUZHOU CARREFOUR COMMERCIAL CO., LTD 100
100
SOCIEDAD DE COMPRAS MODERNAS, S.A. SHANGHAI
REPRESENTATIVE OFFICE100
THE CARREFOUR(CHINA) FOUNDATION FOR FOOD
SAFETY LTD100
IMOPAR PARTICIPCOES E ADMINISTRACAO IMOBILIARIA LTDA 72
BEIJING CHAMPION SHOULIAN COMMUNITY CHAIN STORES CO
LTD100
CARREFOUR (CHINA) CONVENIENCE STORE INVESTMENT CO., LTD 100
CARREFOUR (SHANGHAI) INVESTMENT MANAGEMENT AND
CONSULTING SERVICES CO., LTD

Carrefour Group – Consolidated Financial Statements as of December 31, 2017 - 76 -
Notes to the Consolidated Financial Statements
SPAIN
Percent
interest used
in
consolidation INDIA
Percent
interest used
in
consolidation
CENTROS COMERCIALES CARREFOUR, S.A. 100 CARREFOUR INDIA MASTER FRANCHISE LTD 100
CARREFOUR NORTE, S.L. 100 CARREFOUR WC & C INDIA PRIVATE LTD 100
SOCIEDAD DE COMPRAS MODERNAS, S.A.U. 100
CARREFOUR NAVARRA, S.L. 100 IRLAND
SERVICIOS FINANCIEROS CARREFOUR, EFC, S.A. 60 CARREFOUR INSURANCE LIMITED 100
GROUP SUPECO MAXOR, S.L.U. 100
NORFIN HOLDER, S.L. 100 LUXEMBOURG
SUPERMERCADOS CHAMPION, S.A.U. 100 VELASQUEZ SA 100
INVERSIONES PRYCA, S.A.U. 100
CARREFOUR PROPERTY ESPANA, S.L.U. 100 NETHERLANDS
CARREFOURONLINE, S.L.U. 100 CARREFOUR CHINA HOLDINGS BV 100
CORREDURIA DE SEGUROS CARREFOUR, S.A.U. 100 CARREFOUR NEDERLAND BV 100
SIDAMSA CONTINENTE HIPERMERCADOS, S.A. 100 CARREFOUR PROPERTY BV 100
VIAJES CARREFOUR, S.L.U. 100 FICADAM BV 100
HYPER GERMANY BV 100
ITALY INTERCROSSROADS BV 100
CARREFOUR BANCA 60 INTERNATIONAL MERCHANDISE TRADING BV 100
CARREFOUR ITALIA FINANCE SRL 100 SOCA BV 100
CARREFOUR ITALIA SPA 100
CARREFOUR PROPERTY ITALIA SRL 99.8 POLAND
CARREFOUR POLSKA 100
CPA WAW 1 100
IBES 100
ROMANIA
ALLIB ROM SRL 100
CONSORZIO PROPRIETARI CENTRO COMMERCIALE MASSA 54.1 ARTIMA SA 100
CONSORZIO PROPRIETARI CENTRO COMMERCIALE THIENE 57.8 BRINGO MAGAZIN 51
CARREFOUR PRODUCTIE SI DISTRIBUTIE 100
CARREFOUR ROUMANIE 100
COLUMBUS ACTIVE SRL 100
COLUMBUS OPERATIONAL SRL 100
DIPERDI SRL 99.8 MILITARI GALERIE COMERCIALA 100
GALLERIA COMMERCIALE PADERNO S.R.L. 99.8 SUPECO INVESTMENT SRL 100
GALLERIA COMMERCIALE PROPERTY FUTURA S.R.L. 99.8
GS SPA 99.8 SWITZERLAND
S.C.A.R.L. SHOPVILLE GRAN RENO 57.7 CARREFOUR WORLD TRADE 100
SOCIETA SVILUPPO COMMERCIALE SRL 99.8 HYPERDEMA (PHS) 100
HONG-KONG TAIWAN
CARREFOUR ASIA LTD 100 CARREFOUR INSURANCE BROKER CO 60
CARREFOUR GLOBAL SOURCING ASIA 100 CARREFOUR TELECOMMUNICATION CO 60
CARREFOUR TRADING ASIA LTD (CTA) 100 CHARNG YANG DEVELOPMENT CO 30
PRESICARRE 60
CONSORZIO PROPRIETARI CENTRO COMMERCIALE VERCELLI 84.2
CONSORZIO PROPRIETARI CENTRO COMMERCIALE BUROLO 89.0
CONSORZIO PROPRIETARI CENTRO COMMERCIALE GIUSSANO 76.8
CONSORZIO PROPRIETARI CENTRO COMMERCIALE TORINO
MONTECUCCO87.2
CONSORZIO PROPRIETARI CENTRO COMMERCIALE BRIANZA 52.8
16.2 Equity-accounted companies at December 31, 2017
MESTDAGH 25 SUPERMERCADO CENTENO, S.L. 26
SUPERMERCATS HEGERVIC MATARO, S.L. 26
BRAZIL SUPERMERCATS SAGRADA FAMILIA, S.L. 26
COSMOPOLITANO SHOPPING EMPREENDIMENTOS S.A. 35.9 VALATROZ, S.L. 26
SPAIN ITALY
2012 ALVARO EFREN JIMENEZ, S.L. 26 CARMILA THIENE S.R.L. 49.8
2012 CORDOBA RODRIGUEZ, S.L. 26 CONSORZIO PROPRIETARI CENTRO COMMERCIALE ASSAGO 49.9
2012 ERIK DAVID, S.L. 26 CONSORZIO PROPRIETARI CENTRO COMMERCIALE ROMANINA 46.3
2012 FLORES HERNANDEZ, S.L. 26 CONSORZIO PROPRIETARI CENTRO COMMERCIALE SIRACUSA 33.3
2012 LIZANDA TORTAJADA, S.L. 26 S.C.A.R.L. SHOPVILLE LE GRU 39.3
2012 NAYARA SAN MARTIN YANGÜELA, S.L. 26
2013 ALBADALEJO VALENCIA, S.L. 26 NETHERLANDS
2013 CID OTERO, S.L. 26 ARAVIS INVESTMENTS B.V. 50
2013 CORCOLES ARGANDOÑA, S.L. 26
2013 COUÑAGO NEVADO, S.L. 26 POLAND
2013 GISBERT CATALA, S.L. 26 C SERVICES 30
2013 MARTINEZ CARRION, S.L. 26
2013 SOBAS ROMERO, S.L. 26 ROMANIA
ANTONIO PEREZ 2010, S.L. 26 PLOIESTI SHOPPING CITY 50
COSTASOL DE HIPERMERCADOS, S.L. 34
D-PARKING, S.C.P. 57.5 TURKEY
GLORIAS PARKING, S.A. 50 CARREFOUR SABANCI TICARET MERKEZI AS CARREFOURSA 46
ILITURGITANA DE HIPERMERCADOS, S.L. 34
JM MARMOL SUPERMERCADOS, S.L. 26 TUNISIA
LAREDO EXRPRESS J.CARLOS VAZQUEZ, S.L. 26 ULYSSE 25
LUHERVASAN, S.L. 26
BELGIUM
Percent
interest used
in
consolidationSPAIN
Percent
interest used
in
consolidation

Carrefour Group – Consolidated Financial Statements as of December 31, 2017 - 77 -
Notes to the Consolidated Financial Statements
ABREDIS 50 LES OLIVIERS 50
ADIALEA 45 LEZIDIS 50
ALEXANDRE 50 LSODIS 50
ANGIDIS 50 LUMIMMO 51
ANTONINE 50 LYEMMADIS 50
ARLOM 50 MADIS 50
AROBLIS 50 MAGODIS 50
AUBINYC 50 MAISON VIZET FABRE 40.3
AUDIST SAS 50 MALISSOL 50
AZAYDIS 34 MARIDYS 50
AZIMMO 33.8 MASSEINE 50
BAMAZO 50 MAUDIS 50
BELONDIS 50 MBD 50
BIADIS 34 MIMALI 50
BLS RETRAIL 50 MORTEAU DISTRIBUTION 50
BORDEROUGE 50 NASOCA 50
BOURG SERVICES DISTRIBUTION "B.S.D" 50 NCL 50
BPJ 26 NOUKAT 50
BS DISTRIBUTION 50 OLICOURS 50
CABDIS 50 OUISDIS 50
CALODIAN DISTRIBUTION 50 OULLIDIS 50
CARDUTOT 26 PAM 50
CARGAN 50 PHILODIS 50
CARMILA 35.8 PLAMIDIS 50
CERBEL 50 PLANE MARSEILLAN 50
CEVIDIS 50 PRODIX 50
CHAMNORD 55.4 PROVENCIA SA 50
CHERBOURG INVEST 48 RD2M 50
CHRISTIA 50 REBAIS DISTRIBUTION 50
CINQDIS 09 50 RIMADIS 50
CJA DISTRIBUTION 50 ROND POINT 34
CLUNYDIS 50 ROSE BERGER 26
CODINOG 50 SADEV 26
COFLEDIS 50 SAINT JUERY DISTRIBUTION 50
COLODOR 50 SALACA 50
COROU 50 SAM 50
COVIAM 21 50 SASD 26
CRISANE 50 SCA 50
DECODIS 26 SCB 26
DEPOT PETROLIER DE LYON 50 SCGR DISTRIBUTION 50
DEPOTS PETROLIERS COTIERS 24.4 SCI 2C 50
DIRIC 50 SCI 2F 50
DISTRI PALAVAS 50 SCI FONCIERE DES ALBERES 50
DISTRIBOURG 50 SCI IMMODISC 49.5
DISTRICAB 50 SCI LA BEAUMETTE 49
DISTRIFLEURY 50 SCI LA CLAIRETTE 49.5
DOUDIS 50 SCI LATOUR 60
DU MOULIN 50 SCI PONT D'ALLIER 49.5
EDENDIS 50 SCI SOVALAC 49.5
ENTREPOT PETROLIER DE VALENCIENNES 34 SCOMONDIS 50
FABCORJO 50 SDAP 26
FARO 50 SDR 50
FIVER 50 SEREDIS 26
FONCIERE MARSEILLAN 50 SERPRO 50
FONCIERE PLANES 50 SIFO 50
FONCIERE SOLANDIS 33.8 SME 50
FRELUM 50 SOBRAMIC 50
GALLDIS 50 SOCADIS 50
GANDIS 50 SOCADIS CAVALAIRE 50
GPVM 30 SODIBOR 50
GRANDI 50 SODICAB 50
GWENDA 50 SODILIM 50
HBLP 25 SODIMER 50
IDEC 50 SODYEN 50
IMMO ST PIERRE EGLISE 50 SOLANDIS 34
J2B 50 SOMADIS 50
JEDEMA 50 SOQUIMDIS 50
JLEM 50 SOVADIS 50
JOSIM 34 SOVALDIS 50
JTDS MARKET 50 SPC DISTRI 50
JUPILOU 34 ST BONNET DISCOUNT 50
LA CATALANE DE DISTRIBUTION 50 ST PAUL DE DISTRIBUTION 50
LA CRAUDIS 50 STE DU DEPOT PETROLIER DE NANTERRE 20
LAITA BELON DISTRIBUTION 50 TIADIS 50
LB LE PLAN 50 TURENNE 50
LE CLAUZELS 50 VALCRIS DISTRIBUTION 50
LE PETIT BAILLY 50 VALMENDIS 50
LEATILD 50 VICUN 50
FRANCE
Percent
interest used
in
consolidationFRANCE
Percent
interest used
in
consolidation