consolidated financial statements and supplementary ... · pdf fileconsolidated financial...
TRANSCRIPT

CONSOLIDATED FINANCIAL STATEMENTS
AND
SUPPLEMENTARY INFORMATION
DECEMBER 31, 2014 AND 2013

MAJOR HEALTH PARTNERS
TABLE OF CONTENTS DECEMBER 31, 2014 AND 2013
Page Report of Independent Auditors ................................................................................................ 1 Required Supplementary Information
Management’s Discussion and Analysis (Unaudited) .............................................................. i Consolidated Financial Statements
Consolidated Balance Sheets ................................................................................................. 3 Consolidated Statements of Revenues, Expenses and Changes in Net Position .................. 5 Consolidated Statements of Cash Flows ................................................................................ 6
Notes to Consolidated Financial Statements .......................................................................... 8
Supplementary Information
Consolidating Balance Sheets – December 31, 2014 ........................................................... 34 Consolidating Statements of Revenues, Expenses and
Changes in Net Position – Year Ended December 31, 2014 .......................................... 36 Consolidating Balance Sheets – December 31, 2013 ........................................................... 37 Consolidating Statements of Revenues, Expenses and
Changes in Net Position – Year Ended December 31, 2013 .......................................... 39

1
REPORT OF INDEPENDENT AUDITORS Board of Trustees Major Health Partners Shelbyville, Indiana Report on the Consolidated Financial Statements We have audited the accompanying consolidated financial statements of Major Health Partners (MHP), which comprise the consolidated balance sheets as of December 31, 2014 and 2013, and the related consolidated statements of revenues, expenses and changes in net position, and cash flows, for the years then ended, and the related notes to the consolidated financial statements. Management's Responsibility for the Consolidated Financial Statements Management is responsible for the preparation and fair presentation of these consolidated financial statements in accordance with accounting principles generally accepted in the United States of America; this includes the design, implementation, and maintenance of internal control relevant to the preparation and fair presentation of consolidated financial statements that are free from material misstatement, whether due to fraud or error. Auditor's Responsibility Our responsibility is to express an opinion on these consolidated financial statements based on our audits. We conducted our audits in accordance with auditing standards generally accepted in the United States of America and the Guidelines for Audits of County and City Hospitals by Independent Certified Public Accountants, issued by the Indiana State Board of Accounts. Those standards require that we plan and perform the audits to obtain reasonable assurance about whether the consolidated financial statements are free from material misstatement. An audit involves performing procedures to obtain audit evidence about the amounts and disclosures in the consolidated financial statements. The procedures selected depend on the auditor's judgment, including the assessment of the risks of material misstatement of the consolidated financial statements, whether due to fraud or error. In making those risk assessments, the auditor considers internal control relevant to MHP's preparation and fair presentation of the consolidated financial statements in order to design audit procedures that are appropriate in the circumstances, but not for the purpose of expressing an opinion on the effectiveness of MHP's internal control. Accordingly, we express no such opinion. An audit also includes evaluating the appropriateness of accounting policies used and the reasonableness of significant accounting estimates made by management, as well as evaluating the overall presentation of the consolidated financial statements. We believe that the audit evidence we have obtained is sufficient and appropriate to provide a basis for our audit opinion.

Board of Trustees Major Health Partners Shelbyville, Indiana
2
Opinion In our opinion, the consolidated financial statements referred to above present fairly, in all material respects, the financial position of MHP as of December 31, 2014 and 2013, and the results of its operations and its cash flows for the years then ended in accordance with accounting principles generally accepted in the United States of America. Report on Required Supplementary Information Accounting principles generally accepted in the United States of America require that Management’s Discussion and Analysis be presented to supplement the basic consolidated financial statements. Such information, although not a part of the basic consolidated financial statements, is required by the Governmental Accounting Standards Board who considers it to be an essential part of financial reporting for placing the basic consolidated financial statements in an appropriate operational, economic, or historical context. We have applied certain limited procedures to the required supplementary information in accordance with auditing standards generally accepted in the United States of America, which consisted of inquiries of management about the methods of preparing the information and comparing the information for consistency with management’s responses to our inquiries, the basic consolidated financial statements, and other knowledge we obtained during our audit of the basic consolidated financial statements. We do not express an opinion or provide any assurance on the information because the limited procedures do not provide us with sufficient evidence to express an opinion or provide any assurance. Report on Supplementary Information Our audits were conducted for the purpose of forming an opinion on the consolidated financial statements as a whole. The supplementary information as listed in the accompanying table of contents is presented for purposes of additional analysis rather than to present the financial position, results of operations, and cash flows of the individual entities, and is not a required part of the consolidated financial statements. Such information is the responsibility of management and was derived from and relates directly to the underlying accounting and other records used to prepare the consolidated financial statements. The supplementary information has been subjected to the auditing procedures applied in the audit of the consolidated financial statements and certain additional procedures, including comparing and reconciling such information directly to the underlying accounting and other records used to prepare the consolidated financial statements or to the consolidated financial statements themselves, and other additional procedures in accordance with auditing standards generally accepted in the United States of America. In our opinion, the consolidating information is fairly stated in all material respects in relation to the consolidated financial statements as a whole.
Indianapolis, Indiana April 24, 2015

REQUIRED SUPPLEMENTARY INFORMATION

MAJOR HEALTH PARTNERS
MANAGEMENT’S DISCUSSION AND ANALYSIS (UNAUDITED) DECEMBER 31, 2014 AND 2013
i
This section of Major Health Partners’ (MHP) annual consolidated financial statements presents background information and management’s discussion and analysis (MD&A) of MHP’s financial performance. This MD&A does include a discussion and analysis of the activities and results of MHP which is the consolidated entity that consists of Major Hospital (the Hospital) and its blended component units, Major Affiliates, Inc. (MAI), Major Hospital Foundation and MDSolutions, LLC. Please read it in conjunction with MHP’s financial statements that follow this MD&A. FINANCIAL HIGHLIGHTS
During 2014, MHP issued Indiana Finance Authority Hospital Revenue Bonds, Series 2014A with a face amount of $53,505,000 for construction of a replacement acute care hospital.
MHP reported a positive change in net position for 2014 of approximately $25.5 million compared to a positive change in net position of approximately $12.7 million in 2013, representing an increase of approximately $12.8 million in comparison to the 2013 results.
MHP spent approximately $1.6 million on equipment and capital projects in 2014 net of
disposals. Included in capital expenditures is the construction in progress related to the construction of a replacement acute care hospital. Major capital equipment expenditures include the addition of two radiology digital detectors at the Hospital and Renovo, a central sterile booster pump, two ultrasound units, a laboratory analyzer, OR equipment, a health information scanner, hospital signage, grounds equipment, and ongoing normal equipment replacement. Capital expenditures related to information technology include a SAN upgrade, radiology PACs software upgrade, firewall upgrade, software licenses, servers, and PC replacements. The Hospital spent money for ongoing building maintenance and improvements, including renovations at the main campus. In 2014, the Hospital disposed of a Nursing home facility including the associated land and equipment.
USING THIS ANNUAL REPORT MHP’s consolidated financial statements consist of three consolidated statements – a balance sheet; a statement of revenues, expenses and changes in net position; and a statement of cash flows. These financial statements and related notes provide information about the activities and the financial position of MHP. The consolidated balance sheet includes all of MHP’s assets, deferred outflows, and liabilities and provides information about the nature and amounts of investments in resources (assets) and the obligations to MHP creditors (liabilities). All of the current year’s revenue earned and expenses incurred are accounted for in the consolidated statement of revenues, expenses and changes in net position. Finally, the consolidated statement of cash flows’ purpose is to provide information about MHP’s cash flows from operating activities, financing activities including capital additions, and investing activities. This statement provides information on the sources and uses of cash and the change in the cash balance during the year.

MAJOR HEALTH PARTNERS
MANAGEMENT’S DISCUSSION AND ANALYSIS (UNAUDITED) DECEMBER 31, 2014 AND 2013
ii
THE BALANCE SHEET AND STATEMENT OF REVENUES, EXPENSES AND CHANGES IN NET POSITION The balance sheet and the statement of revenues, expenses and changes in net position report information about MHP’s resources and its activities. These statements include all restricted and unrestricted assets and all liabilities using the accrual basis of accounting. All of the current year's revenues and expenses are taken into account regardless of when cash is received or paid. These statements report MHP’s net position and changes in them. Think of MHP’s net position—the difference between assets and liabilities—as one way to measure MHP’s financial health, or financial position. Over time, increases or decreases in MHP’s net position are one indicator of whether its financial health is improving or deteriorating. Consider other nonfinancial factors, however, such as changes in MHP’s patient base and measures of the quality of service it provides to the community, as well as local economic factors to assess the overall health of MHP. MAJOR HEALTH PARTNERS’ NET POSITION Table 1: Balance Sheets
2014 2013 2012Assets and deferred outflows
Current assets 93,767,127$ 52,444,906$ 29,997,523$ Assets whose use is limited 154,863,819 76,028,499 60,607,198 Capital assets, net 43,079,192 46,130,345 44,971,189 Other assets 5,612,921 7,025,240 9,987,935
Total assets 297,323,059 181,628,990 145,563,845
Deferred outflows - interest rate swaps -0- 146,290 387,726
Total assets and deferred outflows 297,323,059$ 181,775,280$ 145,951,571$
LiabilitiesCurrent liabilities 79,420,538$ 37,223,575$ 18,860,356$ Other liabilities 1,022,832 1,014,612 985,766 Long term debt 80,973,319 33,094,276 28,396,494
Total liabilities 161,416,689 71,332,463 48,242,616
Net positionNet investment in capital assets 12,487,977 11,317,184 15,578,641 Restricted 1,144,809 1,586,288 1,475,534 Unrestricted 122,273,584 97,539,345 80,654,780
Total net position 135,906,370 110,442,817 97,708,955 Total liabilities and net position 297,323,059$ 181,775,280$ 145,951,571$
The significant changes in Major Health Partners’ assets resulted from an increase in current assets of approximately $41.3 million and an increase in assets whose use is limited of approximately $78.8 million. The increase in current assets is due to operating additional long-term care facilities during 2014 which increased patient accounts receivable, inventories and other current assets. Assets whose use is limited increased as a result of long-term care operations, investment return and proceeds from the issuance of long-term debt to be used for the construction of the new hospital. Total liabilities increased in 2014 by approximately $90.1 million in comparison to 2013. The increase is attributable to an increase in operating payables (including long-term care operations) and long-term debt.

MAJOR HEALTH PARTNERS
MANAGEMENT’S DISCUSSION AND ANALYSIS (UNAUDITED) DECEMBER 31, 2014 AND 2013
iii
OPERATING RESULTS AND CHANGES IN NET POSITION AND CASH FLOWS Table 2: Statements of Revenues, Expenses and Changes in Net Position
2014 2013 2012Revenues
Net patient service revenue 323,959,745$ 192,996,493$ 121,996,164$ Other operating revenue 4,094,914 4,723,247 2,594,030
Total revenues 328,054,659 197,719,740 124,590,194
ExpensesSalaries and benefits 64,158,227 63,550,079 57,720,755 Supplies 17,391,564 16,011,109 15,515,642 Depreciation and amortization 7,176,002 5,622,455 5,245,716 Other operating expenses 214,571,810 102,314,086 39,731,569
Total expenses 303,297,603 187,497,729 118,213,682
Operating income 24,757,056 10,222,011 6,376,512
Non-operating revenue (expense), net (1,549,447) 701,780 3,077,241
Excess of revenues over expenses 23,207,609 10,923,791 9,453,753
Transfers from noncontrolling interest 2,255,944 1,810,071 -0-
Change in net position 25,463,553 12,733,862 9,453,753
Net positionBeginning of year 110,442,817 97,708,955 88,255,202 End of year 135,906,370$ 110,442,817$ 97,708,955$
SOURCES OF REVENUE During 2014, Major Health Partners derived substantially all of its revenue from patient service and other related activities. A significant portion of the patient service revenue is from patients that are insured by government health programs, principally Medicare and Medicaid, which are highly regulated and subject to frequent and substantial changes. Revenues from the Medicare and Medicaid programs represented 58% of MHP’s acute care gross revenues in 2014 but 49% of MHP’s acute care net patient service revenues. Major Health Partners’ service mix significantly changed between 2014 and 2013. Inpatient revenue accounted for 15% and 20% of gross revenue in 2014 and 2013, respectively. Outpatient revenue was 48% and 60% of total gross revenue in 2014 and 2013, respectively. Long-term care revenue was 37% and 20% of total gross revenue in 2014 and 2013, respectively.

MAJOR HEALTH PARTNERS
MANAGEMENT’S DISCUSSION AND ANALYSIS (UNAUDITED) DECEMBER 31, 2014 AND 2013
iv
Following is a table of major sources of acute care gross patient revenues for the past three years:
2014 2013 2012
Medicare 44% 43% 41%Medicaid 14% 14% 15%Anthem 15% 14% 15%Commercial 17% 20% 21%Self Pay 10% 9% 8%
100% 100% 100%
OPERATING AND FINANCIAL PERFORMANCE Major Health Partners had income from operations of approximately $24.8 million in 2014, which resulted in a return on equity of 18.2% compared to income from operations of approximately $10.2 million in 2013 and return on equity of 9.3%. This following section highlights the major financial factors for 2014 for MHP: The Hospital’s discharges slightly increased from 2,741 in 2013 to 2,790 in 2014. The
Hospital’s adjusted patient days increased to 36,814 in 2014 compared to 34,655 in 2013.
Overall net patient service revenue increased approximately $131.0 million in 2014. The increase was driven by long-term care operations as MHP operated more long-term care facilities in 2014 compared to 2013. Of the total increase in net patient service revenue, approximately $114 million related to the increase in long-term care patient revenues. The Hospital received approximately $1.7 million from the State for the Indiana Medicaid Municipal Hospital Payment Adjustment, which was a decrease from the 2013 amount of approximately $4.4 million.
MAI’ total operating revenue increased approximately $2.3 million or 11% from year 2013 to
year 2014 for both its’ patient services and office rental. This is a result of new physician specialties and a general increase in volumes of the physician practices.
Other operating revenue for MHP slightly decreased by approximately $0.6 million in 2014
mainly due to a decrease in management revenue generated by Major Affiliates.
Operating expenses increased by approximately $116.0 million in 2014. This increase is result of an increase in supplies, purchased services (including expenses associated with long-term care operations), depreciation and rent.
Salaries and wages and benefits expense remained consistent between 2014 and 2013.
Medical Professional fees for the Hospital decreased by approximately $1.6 million between 2014 and 2013. The decrease was the result of a change in the arrangement with the contracted ER physician group. In 2013, the hospital billed for the professional component of the ER visit and paid a professional fee to the contracted ER physicians. In 2014, the contracted ER physicians billed and collected the professional fee.

MAJOR HEALTH PARTNERS
MANAGEMENT’S DISCUSSION AND ANALYSIS (UNAUDITED) DECEMBER 31, 2014 AND 2013
v
Supplies increased by approximately $1.4 million between 2014 and 2013. The increase was the result of increased pharmaceutical expense.
Purchased services increased approximately $102.0 million or 134.3% in 2014. The majority of this increase relates to long-term care operations.
Table 3: Statements of Cash Flows The final required statement is the statement of cash flows. The statement reports cash receipts, cash payments, and net changes in cash resulting from operations, investing, and financing activities. It provides answers to such questions as “Where did cash come from?”, “What was cash used for?” and “What was the change in cash balance during the reporting period?” The following is a summary of cash flows:
2014 2013 2012Cash flows from
Operating activities 34,238,940$ 18,946,341$ 14,245,507$ Capital and related financing 41,753,141 152,700 (9,200,153) Investing 1,168,658 (6,010,309) (7,151,292)
Change in cash and cash equivalents 77,160,739$ 13,088,732$ (2,105,938)$
Cash and cash equivalents increased by approximately $77.2 million in 2014 compared to an increase of approximately $13.1 million in 2013. The majority of the 2014 increase relates to cash generated from operations and proceeds from the issuance of long-term debt with a face amount of $53,505,000. CAPITAL ASSETS During 2014, Major Health Partners invested approximately $11.0 million in capital assets along with retirements and transfers of approximately $9.4 million. The change in capital assets is outlined in the following table:
2014 2013 2012
Land and land improvements 8,485,889$ 11,581,078$ 11,328,726$ Leasehold improvements 4,441,242 2,639,906 2,322,553 Buildings and improvements 49,854,703 52,238,324 49,735,425 Equipment 39,458,655 38,258,162 36,739,841 Construction in progress 5,056,023 940,307 255,963
Total property and equipment 107,296,512 105,657,777 100,382,508
Less accumulated depreciation 64,217,320 59,527,432 55,411,319
Capital assets, net 43,079,192$ 46,130,345$ 44,971,189$
Capital assets have decreased due to retirements and disposals in 2014. MHP strives to meet the needs of the community and provide high quality care by adding new equipment and facilities or by replacing or upgrading equipment as it becomes obsolete.

MAJOR HEALTH PARTNERS
MANAGEMENT’S DISCUSSION AND ANALYSIS (UNAUDITED) DECEMBER 31, 2014 AND 2013
vi
DEBT MHP has debt outstanding in the Indiana Finance Authority Hospital Revenue Bonds, capital lease obligations, loans payable and notes payable. More detailed information about MHP’s long-term debt is presented in the notes to the consolidated financial statements. ECONOMIC OUTLOOK Management believes that the health care industry’s and MHP’s operating margins will continue to be under pressure because of changes in payor mix and growth in operating expenses that are in excess of the increases in contractually arranged and legally established payments received for services rendered. Another factor that poses a challenge to management is the increasing competitive market for the delivery of health care services. The ongoing challenge facing MHP is to continue to provide quality patient care in this competitive environment, and to attain reasonable rates for the services that are provided while managing costs. The most significant cost factor affecting MHP is the increases in labor costs due to the increasing competition for quality health care workers. CONTACTING MAJOR HEALTH PARTNERS’ FINANCIAL MANAGEMENT This financial report is designed to provide our patients, suppliers, taxpayers, and creditors with a general overview of MHP’s finances and to show MHP’s accountability for the money it receives. If you have questions about this report or need additional financial information, contact MHP’s Administration Department, at 150 W. Washington St., Shelbyville, IN 46176.

MAJOR HEALTH PARTNERS
CONSOLIDATED BALANCE SHEETS DECEMBER 31, 2014 AND 2013
See accompanying notes to consolidated financial statements. 3
2014 2013Current assets
Cash and cash equivalents 16,827,184$ 14,536,069$ Patient accounts receivable, net of
allowance for uncollectible accounts of $4,177,000 in 2014 and $4,477,000 in 2013 44,870,457 22,866,389
Inventory and other current assets 31,161,007 13,493,964 Current portion of assets whose use is limited 908,479 1,548,484
Total current assets 93,767,127 52,444,906
Assets whose use is limitedInternally designated 103,183,178 76,346,747 Held by trustee for construction 51,333,278 -0- Donor restricted funds 1,255,842 1,230,236
Total assets whose use is limited 155,772,298 77,576,983 Less current portion 908,479 1,548,484
Noncurrent assets whose use is limited 154,863,819 76,028,499
Capital assets, net 43,079,192 46,130,345 Property held for sale 2,176,627 4,576,627 Other assets, net 3,436,294 2,448,613
Total assets 297,323,059 181,628,990
Deferred outflows - interest rate swaps -0- 146,290 Total assets and deferred outflows 297,323,059$ 181,775,280$
ASSETS AND DEFERRED OUTFLOWS

MAJOR HEALTH PARTNERS
CONSOLIDATED BALANCE SHEETS DECEMBER 31, 2014 AND 2013
See accompanying notes to consolidated financial statements. 4
2014 2013Current liabilities
Accounts payable and accrued expenses 64,310,015$ 20,702,867$ Accrued wages and related liabilities 11,007,218 10,101,823 Estimated third-party settlements 3,152,131 4,700,000 Current portion of long-term debt
Loans payable and capital leases 42,695 870,401 Revenue bonds payable 908,479 848,484
Total current liabilities 79,420,538 37,223,575
Derivative liability -0- 146,290 Other liabilities 1,022,832 868,322 Long term debt, net of current portion
Loans payable and capital leases 341,602 7,363,760 Revenue bonds payable 80,631,717 25,730,516
Total long term debt 80,973,319 33,094,276
Total liabilities 161,416,689 71,332,463
Net positionNet investment in capital assets 12,487,977 11,317,184 Restricted
Expendable - other specific purpose 400,995 375,389 Non-expendable 743,814 1,210,899
Total restricted net position 1,144,809 1,586,288 Unrestricted 122,273,584 97,539,345
Total net position 135,906,370 110,442,817 Total liabilities and net position 297,323,059$ 181,775,280$
LIABILITIES AND NET POSITION

MAJOR HEALTH PARTNERS
CONSOLIDATED STATEMENTS OF REVENUES, EXPENSES AND CHANGES IN NET POSITION
YEARS ENDED DECEMBER 31, 2014 AND 2013
See accompanying notes to consolidated financial statements. 5
2014 2013Revenues
Net patient service revenue 323,959,745$ 192,996,493$ Other revenue 4,094,914 4,723,247
Total revenues 328,054,659 197,719,740
ExpensesSalaries and wages 49,618,293 48,607,237 Employee benefits 14,539,934 14,942,842 Medical professional fees 3,311,853 4,921,728
Supplies 17,391,564 16,011,109 Purchased services 177,963,107 75,966,074 Rent and maintenance 24,894,947 12,440,390
Utilities 1,745,314 1,592,641 Insurance 888,700 746,300 Depreciation and amortization 7,176,002 5,622,455
Hospital assessment fee 2,731,912 3,625,421 Other expenses 3,035,977 3,021,532
Total expenses 303,297,603 187,497,729
Operating income 24,757,056 10,222,011
Nonoperating revenues (expenses)Investment income 2,766,852 3,558,468 Interest expense (700,502) (928,350) Loss on impairment of goodwill -0- (2,475,000) Loss on impairment of land held for sale (2,400,000) -0- Bond issuance costs (1,088,391) -0- Other nonoperating revenue (expense) (127,406) 546,662
Nonoperating revenues (expenses), net (1,549,447) 701,780
Excess of revenues over expenses 23,207,609 10,923,791
Transfers from noncontrolling interest 2,255,944 1,810,071
Change in net position 25,463,553 12,733,862
Net positionBeginning of year 110,442,817 97,708,955 End of year 135,906,370$ 110,442,817$

MAJOR HEALTH PARTNERS
CONSOLIDATED STATEMENTS OF CASH FLOWS YEARS ENDED DECEMBER 31, 2014 AND 2013
See accompanying notes to consolidated financial statements. 6
2014 2013
Operating activitiesCash received from patient services 300,407,808$ 182,338,839$ Cash paid for salaries, wages and benefits (63,252,832) (62,495,184) Cash paid to vendors and suppliers (207,453,955) (108,569,671) Other receipts, net 4,537,919 7,672,357
Net cash flows from operating activities 34,238,940 18,946,341
Capital and related financing activitiesPrincipal payments on long-term debt (8,712,937) (1,579,387) Proceeds from issuance of long-term debt 53,505,000 7,000,000 Bond premium 2,338,759 -0- Interest on long-term debt (700,502) (928,350) Transfers from noncontrolling interest 2,255,944 1,810,071 Purchases of capital assets (11,010,958) (6,163,219) Proceeds from the sale of capital assets 6,596,912 -0- Bond issuance costs (1,088,391) -0- Other (1,430,686) 13,585
Net cash flows from capital andrelated financing activities 41,753,141 152,700
Investing activitiesInvestment income 2,766,852 3,558,468 Other nonoperating revenues (expenses) (127,406) 546,662 Purchase of investments (27,038,225) (27,732,537) Proceeds from sale of investments 25,567,437 17,617,098
Net cash flows from investing activities 1,168,658 (6,010,309)
Net change in cash and cash equivalents 77,160,739 13,088,732
Cash and cash equivalents:Beginning of year 27,676,807 14,588,075 End of year 104,837,546$ 27,676,807$
Reconciliation of cash and cash equivalents to the consolidated balance sheet
Cash and cash equivalentsIn current assets 16,827,184$ 14,536,069$ In assets whose use is limited
Internally designated 36,641,029 13,111,379 Held by trustee for construction 51,333,278 -0- Donor restricted 36,055 29,359
Total cash and cash equivalents 104,837,546$ 27,676,807$
MAJOR HEALTH PARTNERS
CONSOLIDATED STATEMENTS OF CASH FLOWS YEARS ENDED DECEMBER 31, 2014 AND 2013
See accompanying notes to consolidated financial statements. 7
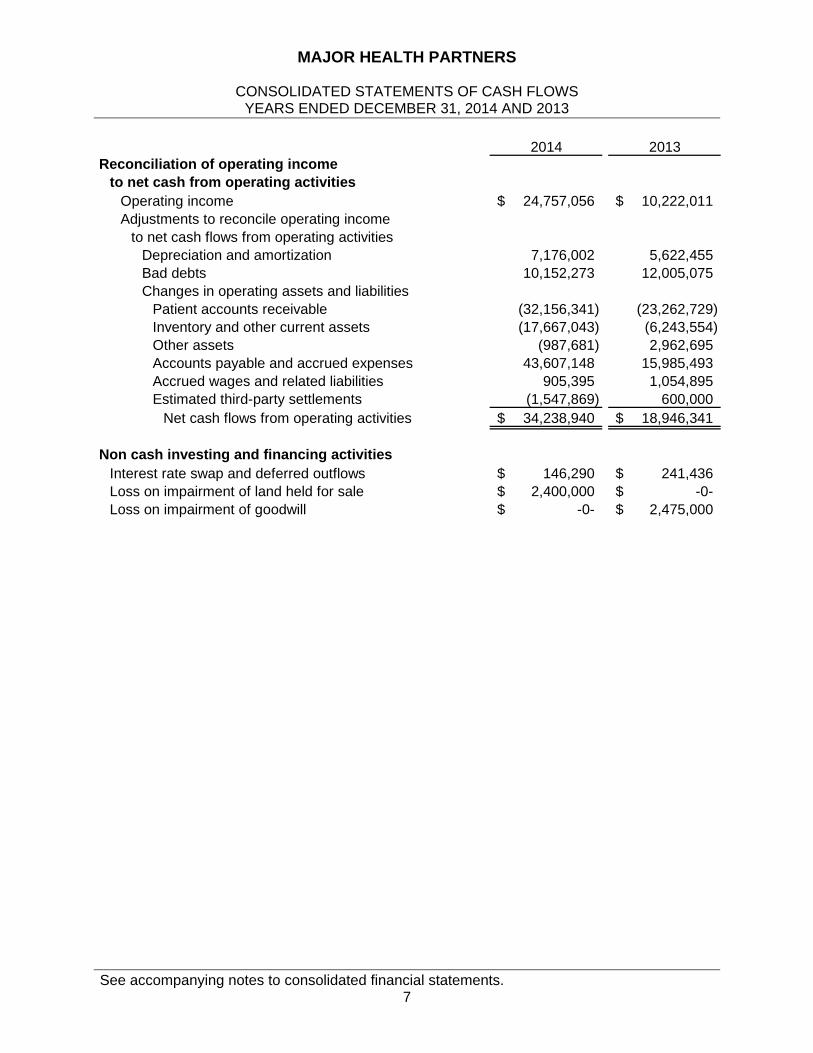
2014 2013Reconciliation of operating income
to net cash from operating activitiesOperating income 24,757,056$ 10,222,011$ Adjustments to reconcile operating income
to net cash flows from operating activitiesDepreciation and amortization 7,176,002 5,622,455 Bad debts 10,152,273 12,005,075 Changes in operating assets and liabilities
Patient accounts receivable (32,156,341) (23,262,729) Inventory and other current assets (17,667,043) (6,243,554) Other assets (987,681) 2,962,695 Accounts payable and accrued expenses 43,607,148 15,985,493 Accrued wages and related liabilities 905,395 1,054,895 Estimated third-party settlements (1,547,869) 600,000
Net cash flows from operating activities 34,238,940$ 18,946,341$
Non cash investing and financing activitiesInterest rate swap and deferred outflows 146,290$ 241,436$ Loss on impairment of land held for sale 2,400,000$ -0-$ Loss on impairment of goodwill -0-$ 2,475,000$

MAJOR HEALTH PARTNERS
NOTES TO CONSOLIDATED FINANCIAL STATEMENTS DECEMBER 31, 2014 AND 2013
8
1. SUMMARY OF SIGNIFICANT ACCOUNTING POLICIES Organization and Reporting Entity The consolidated financial statements of Major Health Partners (MHP) refer to Major Hospital (the Hospital) and its subsidiaries. The Hospital is an acute-care hospital located in Shelbyville, Indiana, organized for the purpose of providing healthcare services to the residents of Shelby County and the surrounding communities. The Hospital is a city-owned facility and operates under the Indiana County Hospital Law, Indiana Code (IC) 16-22. The Hospital provides short-term inpatient, outpatient and long-term health care. A Hospital Appointing Board, consisting of one County Commissioner, one County Council person and the Mayor of the City of Shelbyville, appoints the Governing Board of the Hospital. The Hospital is considered a component unit of Shelby County.
Pursuant to the provision of long-term care, MHP owns the operations of certain long-term care facilities by way of an arrangement with managers of the facilities. These facilities provide inpatient and therapy services. Generally, gross revenues from the operation of the long-term care facilities are the property of MHP and MHP is responsible for the associated operating expenses and working capital requirements. While the management and related lease agreements are in effect, the performance of all activities of the managers shall be on behalf of MHP and MHP retains the authority and legal responsibility for the operation of the facilities. Specifically, MHP entered into lease agreements with the long-term care facilities to lease the facilities managed by the respective managers. Concurrently, MHP entered into an agreement with the managers to manage the leased facilities. As part of the agreements, MHP will pay the managers a management fee to continue managing the facilities on behalf of MHP in accordance with the terms of the agreements. The agreements expire at various times. All parties involved can terminate the agreement without cause with 90 days written notice. Accounting principles generally accepted in the United States require that these consolidated financial statements present the Hospital and its significant component units, collectively referred to as the “primary government.” The blended component units discussed below are included in the Hospital’s reporting entity because of the significance of their operational or financial relationships with the Hospital. Blended component units, although legally separate entities, are in substance part of the primary government’s operations and exist solely to provide services for the primary government; data from these units is consolidated with data of the primary government. Blended Component Units Major Hospital Foundation (the Foundation) is a blended component unit of the Hospital. The Foundation is a separate not-for-profit entity organized to support the operations of the Hospital.

MAJOR HEALTH PARTNERS
NOTES TO CONSOLIDATED FINANCIAL STATEMENTS DECEMBER 31, 2014 AND 2013
9
MDSolutions, LLC is a blended component unit of the Hospital. The Hospital owns a 95% interest and MAI owns a 5% interest in MDSolutions, LLC, a management services organization for physicians. Major Affiliates, Inc. (MAI) is a blended component unit of the Hospital. The Hospital is the sole corporate member of MAI. Although it is legally separate from the Hospital, MAI is reported as if it were a part of the Hospital because the two Governing Boards are substantially the same. MAI primary purpose is to further the mission of Major Hospital through recruiting physicians to the Shelbyville region and leasing office space to physicians. MAI owns 100% of MedWorks, Inc. (MedWorks), which operates a pharmacy located in Shelbyville, Indiana. MedWorks owns 100% of Major Multi Specialty Associates, LLC, Family Orthopedic and Rehabilitation Center, LLC, and Priority Care, LLC. MedWorks also owns a majority interest of Onsite Solutions, LLC and Major Medical Group, LLC. These practices generally provide health care services to the community. These entities have been consolidated for financial statement presentation. All significant intercompany transactions have been eliminated in the consolidated financial statements. Use of Estimates The preparation of consolidated financial statements in conformity with accounting principles generally accepted in the United States of America requires management to make estimates and assumptions that affect the reported amounts of assets and liabilities and disclosures of contingent assets and liabilities at the date of the consolidated financial statements. Estimates also affect the reported amounts of revenues and expenses during the reporting period. Actual results could differ from those estimates. Enterprise Fund Accounting MHP uses the enterprise fund method of accounting whereby revenues and expenses are recognized on the accrual basis. Substantially all revenues and expenses are subject to accrual. Cash and Cash Equivalents Cash and cash equivalents include deposits and investments in highly liquid debt instruments with an original maturity date of 90 days or less from the date of purchase. MHP maintains its cash in accounts, which at times, may exceed federally insured limits. MHP has not experienced any losses in such accounts. MHP believes it is not exposed to any significant credit risk on cash and cash equivalents. Assets Whose Use is Limited Assets whose use is limited are stated at fair market value in the consolidated financial statements. These assets include investments designated by the Hospital Board for internal purposes, investments restricted by donors for a specific purpose and investments held by trustees for debt service.

MAJOR HEALTH PARTNERS
NOTES TO CONSOLIDATED FINANCIAL STATEMENTS DECEMBER 31, 2014 AND 2013
10
These investments consist primarily of cash and cash equivalents, certificates of deposit, US government securities, mutual funds, corporate debt and equity securities. Investment interest, dividends, gains and losses, both realized and unrealized are included in nonoperating revenues (expenses) in the consolidated statements of revenues, expenses and changes in net position. Nonparticipating certificates of deposit, demand deposits and similar negotiable instruments that are not reported as cash and cash equivalents are reported as investments at contract value. Patient Accounts Receivable and Patient Service Revenues Patient revenues and the related accounts receivable are recorded at the time services to patients are performed. MHP is a provider of services to patients entitled to coverage under Titles XVIII and XIX of the Health Insurance Act (Medicare and Medicaid). MHP is reimbursed for Medicare and Medicaid inpatient services based on a fixed price per discharge for each diagnosis related grouping (DRG). MHP is reimbursed for Medicare and Medicaid outpatient services based on a fixed price per clinical unit of service. Differences between the total program billed charges and the payments received are reflected as deductions from revenue. At MHP’s year-end, a cost report is filed with the Medicare program computing reimbursement amounts related to Medicare patients. These programs have audited the year-end cost report filed with the Medicare program through December 31, 2011 with differences reflected as deductions from revenue in 2014. Amounts for unresolved cost reports for 2012 through 2014 are reflected in estimated third-party settlements on the consolidated balance sheets. MHP did not recognize any change in net position in 2014 and 2013, due to the differences between original estimates and subsequent revisions for the final settlement of cost reports. Laws and regulations governing the Medicare and Medicaid programs are extremely complex and subject to interpretation. Although these audits may result in some changes in these amounts, they are not expected to have a material effect on the accompanying consolidated financial statements.
Accounts receivable for patients, insurance companies, and governmental agencies are based on gross charges less an allowance for contractual adjustments and interim payment advances. An allowance for contractual adjustments and interim payment advances is based on expected payment rates from payors based on current reimbursement methodologies. This amount also includes amounts received as interim payments against unpaid claims by certain payors. An allowance for uncollectible accounts is established on an aggregate basis by using historical write-off rate factors applied to unpaid accounts based on aging. Loss rate factors are based on historical loss experience and adjusted for economic conditions and other trends affecting MHP’s ability to collect outstanding amounts. Uncollectible amounts are written off against the allowance for doubtful accounts in the period they are determined to be uncollectible.

MAJOR HEALTH PARTNERS
NOTES TO CONSOLIDATED FINANCIAL STATEMENTS DECEMBER 31, 2014 AND 2013
11
Grants and Contributions MHP received grant funds from Shelby County and the City of Shelbyville, Indiana. Revenues from grants and contributions are recognized when all requirements are met. Grants may be restricted for either specific operation purposes or for capital purposes. Amounts that are unrestricted or that are restricted to a specific operating purpose are reported as nonoperating revenues. Endowments Endowments are provided to MHP through the Foundation on a voluntary basis by individuals and private organizations. Permanent endowments require that the principal or corpus of the endowment be retained in perpetuity. If a donor has not provided specific instructions, the Foundation’s governing board is permitted to expend the net appreciation of the investments of endowment funds. Charity Care MHP provides care without charge or at amounts less than its established rates to patients who meet certain criteria under its charity care policy on a sliding scale on the basis of financial need. Because MHP does not pursue collection of approved charity care balances, the charges are not reflected in net revenue. Rather, charges approved for charity are posted to gross revenue and subsequently written off as a charity adjustment before the resulting net patient service revenue. Of MHP’s total expenses reported within the consolidated statements of revenues, expenses and changes in net position; an estimated $ 2,504,000 and $2,411,000 arose from providing services to charity patients for 2014 and 2013, respectively. The estimated costs of providing charity services are based on a calculation which applies a ratio of costs to charges to the gross uncompensated charges associated with providing care to charity patients. The ratio of cost to charges is calculated based on MHP’s total expenses to gross patient service revenue. Inventory and Other Current Assets Inventory is valued at the lower of cost or market with cost being determined on the first-in, first-out (FIFO) method. Inventory at year-end consists mainly of pharmaceuticals and medical supplies. Other current assets consist of prepaid expenses, other reimbursement receivables related to long-term care services and various other current items. These assets are classified as current as they are expected to be utilized during 2015. Capital Assets and Depreciation Capital assets such as property and equipment are stated at cost and include expenditures for new additions and other costs added to existing facilities which exceed $500 and meet certain useful life thresholds. Maintenance, repairs and minor renewals are expensed as incurred.

MAJOR HEALTH PARTNERS
NOTES TO CONSOLIDATED FINANCIAL STATEMENTS DECEMBER 31, 2014 AND 2013
12
MHP provides for depreciation of property and equipment using annual rates, which are sufficient to depreciate the cost of depreciable assets over their estimated useful lives using the straight-line method. The range of useful lives in computing depreciation is as follows:
Range ofDescription Useful LivesLand improvements 15 yearsLeasehold improvements 15 yearsBuildings and improvements 4-50 yearsEquipment 5-15 years
Classification of Net Position Net position of MHP is classified in four components. (1) Net investment in capital assets consists of capital assets net of accumulated depreciation and reduced by the current balance of any outstanding borrowings used to finance the purchase or construction of those assets and increased by funds held by trustee for construction of the property and equipment related to the borrowings (2) Restricted expendable net position includes assets that must be used for a particular purpose, as specified by creditors, grantors, or contributors external to the Hospital, including amounts deposited with trustees as required by revenue note indentures. (3) Restricted non-expendable net position includes the principal portion of permanent endowments and noncontrolling interests owned by external investors. (4) Unrestricted net position is the remaining net position that does not meet the definition of invested in capital assets net of related debt or restricted. Consolidated Statements of Revenues, Expenses and Changes in Net Position MHP’s consolidated statements of revenues, expenses and changes in net position distinguishes between operating and nonoperating revenues and expenses. For purposes of display, transactions deemed by management to be ongoing, major or central to the provision of healthcare services are reported as revenues and expenses. Peripheral or incidental transactions such as investment activities are reported as nonoperating gains or losses. Costs of Borrowing Interest cost incurred on borrowed funds during the period of construction of capital assets is capitalized as a component of the cost of acquiring those assets. During 2014, MHP capitalized interest of approximately $534,000. No interest was capitalized during 2013. Goodwill During 2011, MHP acquired 100% of Major Medical Associates through an asset purchase. The acquisition price was approximately $1,500,000. MHP recorded initial goodwill of approximately $1,100,000. The remainder of the acquisition price was allocated at fair value to patient accounts receivable, inventory, capital assets and identifiable intangibles. Goodwill is included within other assets on the consolidated balance sheets and is amortized over an estimated life of approximately 10 years. Annual amortization expense related to goodwill is approximately $100,000.

MAJOR HEALTH PARTNERS
NOTES TO CONSOLIDATED FINANCIAL STATEMENTS DECEMBER 31, 2014 AND 2013
13
During 2012, MHP acquired 100% of Westpark Rehabilitation Center (Westpark) through an asset purchase agreement. The acquisition price was $7,000,000. MHP recorded initial goodwill of approximately $2,750,000. MHP had an appraisal performed of Westpark as MHP intended to sell Westpark. As a result of that appraisal, during 2013, MHP deemed the goodwill to be impaired. Additionally, Westpark had experienced a significant decline in census. As a result, MHP recorded an impairment loss for the remaining goodwill balance of $2,475,000 during 2013. The impairment loss is recorded as a separate line item within nonoperating revenues (expenses) in the consolidated statements of revenues, expenses and changes in net position. The impairment loss was considered a level 2 nonrecurring fair value measurement. During 2014, MHP sold Westpark which resulted in loss of approximately $400,000 which is included in the other operating revenue (expense) line of the consolidated statements of revenues, expenses and changes in net position. Hedge Accounting MHP follows the requirements of GASB No. 53, Accounting and Financial Reporting for Derivative Instruments. MHP is a party to interest rate swap agreements which are derivative instruments. The guidance requires governmental entities to evaluate each derivative instrument to determine whether the instrument is an effective hedge. For those instruments deemed to be an effective hedge, governmental entities are required to practice hedge accounting and the instrument continues to be reevaluated at the end of each future reporting period. Under hedge accounting, the fair value of the instrument is recorded on the consolidated balance sheet with the offsetting entry to deferred outflows or deferred inflows, which also reported on the consolidated balance sheet. For those instruments deemed to be an ineffective hedge, governmental entities are required to practice investment accounting and the instruments are not evaluated in future reporting periods. Once deemed ineffective, the instrument is considered ineffective for the remainder of its term. Under investment accounting, the fair value of the instrument is recorded on the consolidated balance sheets with the offsetting entry posted to investment income. MHP’s interest rate swap agreements were determined to be effective hedges as of December 31, 2013. During 2014, the interest rate swap agreements matured and were not renewed. Income Taxes The Hospital is a governmental instrumentality organized under Title 16, Article 12, of the Indiana statutes. The Hospital is exempt from Federal income tax under Section 115 of the Internal Revenue Code of 1986. As such, the Hospital is generally exempt from income taxes as a unit of local government. No income tax filings are required of the Hospital as it is a governmental instrumentality. The blended component units of the Foundation and MAI are tax-exempt organizations under Internal Revenue Code 501(c)(3). As such, the Foundation and MAI are generally exempt from income taxes. However, the Foundation and MAI are required to file Federal Form 990 – Return of Organization Exempt from Income Tax, which is an informational return only.

MAJOR HEALTH PARTNERS
NOTES TO CONSOLIDATED FINANCIAL STATEMENTS DECEMBER 31, 2014 AND 2013
14
The blended component unit of MDSolutions is organized as a limited liability company, whereby net taxable income is taxed directly to the members and not MDSolutions. Thus, the financial statements do not include any provision for Federal or State income taxes. MedWorks is a corporation subject to Federal and State income taxes. Income taxes for these entities are provided for the tax effects of transactions reported in the consolidated financial statements and consist of taxes currently due plus deferred taxes. However, the effects of recording a deferred tax provision have been deemed immaterial and have not been recorded in the accompanying consolidated financial statements. The remaining consolidated subsidiaries of MAI and MedWorks are organized as limited liability companies, whereby net taxable income is taxed directly to the members of the limited liability companies. Thus, the consolidated financial statements do not include any provision for Federal or State income taxes related to these entities. Accounting principles generally accepted in the United States of America require management to evaluate tax positions taken by MHP (and their affiliates) and recognize a tax liability if MHP has taken an uncertain position that more likely than not would not be sustained upon examination by various Federal and State taxing authorities. Management has analyzed the tax positions taken by MHP and has concluded that as of December 31, 2014 and 2013, there are no uncertain positions taken or expected to be taken that would require recognition of a liability or disclosure in the accompanying consolidated financial statements. MHP is subject to routine audits by taxing jurisdictions; however, there are currently no audits for any tax periods in progress. These entities have filed their Federal and State income tax returns for periods through December 31, 2013. These income tax returns are generally open to examination by the relevant taxing authorities for a period of three years from the later of the date the return was filed or its due date (including approved extensions). Compensated Absences MHP’s policy on compensated absences (which include vacation, sick leave and holidays) allows full time employees and regular part time employees to accrue days off, to a maximum hour as stated in the personnel policies. Compensated absences are accrued when incurred and reported as a liability on the consolidated balance sheets. Advertising MHP’s policy is to expense advertising costs when the advertising first takes place. Advertising expense was approximately $154,000 and $224,000 for 2014 and 2013, respectively.

MAJOR HEALTH PARTNERS
NOTES TO CONSOLIDATED FINANCIAL STATEMENTS DECEMBER 31, 2014 AND 2013
15
Electronic Health Records (EHR) Incentive Payments MHP receives EHR incentive payments under the Medicare and Medicaid programs. To qualify for the EHR incentive payments, MHP must meet “meaningful use” criteria that become more stringent over time. MHP periodically submits and attests to its use of certified EHR technology, satisfaction of meaningful use objectives, and various patient data. These submissions generally include performance measures for each annual EHR reporting period (Federal fiscal year ending September 30). The related EHR incentive payments are paid out over a four year transition schedule and are based upon data that is captured in MHP’s cost reports. The payment calculation is based upon an initial amount as adjusted for discharges, Medicare and Medicaid utilization using inpatient days multiplied by a factor of total charges, excluding charity care to total charges, and a transitional factor that ranges from 100% in first payment year and thereby decreasing by 25% each payment year until it is completely phased out in the fifth year. MHP recognizes EHR incentives as revenue when there is reasonable assurance that MHP will comply with the conditions of the meaningful use objectives and any other specific contract requirements. In addition, the consolidated financial statement effects of the revenue must be both recognizable and measurable. During 2014 and 2013, MHP recognized approximately $520,000 and $939,000, respectively, in EHR incentive payments as other revenue using the ratable recognition method. Under the ratable recognition method, MHP recognizes revenue ratably over the entire EHR reporting period when it is reasonably assured at the outset of the EHR reporting period that it will comply with the minimum requirements of the program.
EHR incentive revenue is included in other revenue in the consolidated statements of revenues, expenses and changes in net position. EHR incentive income recognized is based on management’s estimate and amounts are subject to change, with such changes impacting operations in the period the changes occur. Receipt of these funds is subject to the fulfillment of certain obligations by MHP as prescribed by the programs, subject to future audits and may be subject to repayment upon a determination of noncompliance.
Litigation MHP is involved in litigation arising in the normal course of business. After consultation with MHP’s legal counsel, management estimates that these matters will be resolved without material adverse effect on MHP’s future financial position, results from operations, and cash flows. Risk Management MHP is exposed to various risks of loss from torts; theft of, damage to, and destruction of assets; business interruption; errors and omissions; employee injuries and illnesses and natural disasters. Commercial insurance coverage is purchased for claims arising from such matters.

MAJOR HEALTH PARTNERS
NOTES TO CONSOLIDATED FINANCIAL STATEMENTS DECEMBER 31, 2014 AND 2013
16
Subsequent Events
MHP evaluated events or transactions occurring subsequent to the consolidated balance sheet date for recognition and disclosure in the accompanying consolidated financial statements through the date the consolidated financial statements are issued which is April 24, 2015.
2. NET PATIENT SERVICE REVENUE
MHP has agreements with third-party payors that provide for reimbursement to MHP at amounts different from its established rates. Estimated contractual adjustments under third-party reimbursement programs represent the difference between the MHP’s billings at standard rates and amounts reimbursed by third-party payors. They also include any differences between estimated third-party reimbursement settlements for prior years and subsequent final settlements. A summary of the reimbursement arrangements with major third-party payors is as follows: Medicare Medicare inpatient services are reimbursed based on a predetermined amount for each case based on the diagnosis associated with the patient (Prospective Payment Hospital). These rates vary according to a patient classification system that is based on clinical, diagnostic and other factors. The prospectively determined rates are not subject to retroactive adjustment with the exception of a few select items, such as bad debts. MHP’s classification of patients under the Prospective Payment Hospital and the appropriateness of patient admissions are subject to validation reviews by the Medicare peer review organization which is under contract with MHP to perform such reviews. Medicare outpatient services are primarily reimbursed on predetermined rates based on the services provided. Medicaid MHP is reimbursed for Medicaid inpatient services under a prospectively determined rate-per-discharge and is not subject to retroactive adjustment. The differences between standard charges and reimbursement from these programs are recorded as contractual adjustments. Reimbursement for Medicaid outpatient services is based on predetermined rates, and is not subject to retroactive cost based settlements. MHP is eligible for the Indiana Medicaid Supplemental programs including Medicaid Disproportionate Share Hospital and Municipal Upper Payment Limit programs. MHP recognized reimbursement from these programs within net patient revenue of approximately $1,700,000 and $4,400,000 for 2014 and 2013, respectively. These programs are Federal programs administered by the State of Indiana.

MAJOR HEALTH PARTNERS
NOTES TO CONSOLIDATED FINANCIAL STATEMENTS DECEMBER 31, 2014 AND 2013
17
During 2012, the Hospital Assessment Fee (HAF) Program for the period July 1, 2011 through June 30, 2013 was approved by Centers for Medicare & Medicaid Services (CMS) retroactive to July 1, 2011. Subsequently, the program was extended and approved for a multi-year period. The purpose of the HAF Program is to fund the State share of enhanced Medicaid payments and Medicaid Disproportionate Share (DSH) payments for Indiana hospitals as reflected in the HAF Program expense reported in the consolidated statements of revenues, expenses and changes in net position. Previously, the State’s share was funded by governmental entities through intergovernmental transfers. The Medicaid enhanced payments relate to both fee for service and managed care claims. The Medicaid enhanced payments are designed to follow the patients and result in increased Medicaid rates. During 2014 and 2013, MHP recognized HAF Program expense of approximately $2,700,000 and $3,600,000, respectively. The Medicaid rate increases under the HAF Program are included in net patient service revenue in the consolidated statements of revenues, expenses and changes in net position. Other Payors MHP also has entered into payment agreements with certain commercial insurance carriers and preferred provider organizations. The basis for payment to MHP under these agreements includes prospectively determined rates per discharge, discounts from established charges and prospectively determined daily rates. The following is a summary of net patient service revenue for 2014 and 2013:
2014 2013Patient service revenue
Inpatient 67,402,440$ 67,941,398$ Outpatient 218,710,752 200,320,025Long-term care 168,929,582 68,073,283
Gross patient service revenue 455,042,774 336,334,706
Deductions from revenueContractual allowances 114,607,245 125,527,443Charity care 6,323,511 5,805,695Bad debts 10,152,273 12,005,075
Total deductions from revenue 131,083,029 143,338,213
Net patient service revenue 323,959,745$ 192,996,493$
3. ASSETS WHOSE USE IS LIMITED
The classification “Assets whose use is limited” includes:
Internally designated – Amounts transferred by MHP’s Board of Trustees through funding depreciation expense. Such amounts are to be used for equipment and building, remodeling, repairing, replacing or making additions to MHP buildings as authorized by IC 16-22-3-13.

MAJOR HEALTH PARTNERS
NOTES TO CONSOLIDATED FINANCIAL STATEMENTS DECEMBER 31, 2014 AND 2013
18
Held by trustee for construction – Amounts deposited with a trustee and limited to use in accordance with the requirements of a trust indenture and funds from long-term debt borrowings to be expended for capital. Restricted – Amounts designated by outside parties for other specific purposes. Assets whose use is limited that are required for obligations classified as current liabilities are reported in current assets.
The composition of assets whose use is limited includes the following as of December 31:
2014 2013Internally designated
Cash and cash equivalents 36,641,029$ 13,111,379$ Certificates of deposit 1,000,000 1,000,000 US Government securities 26,944,231 24,629,082 Mutual funds 36,301,001 35,073,368 Corporate equity securities 1,865,677 2,123,036 Corporate debt securities 431,240 409,882
Total internally designated 103,183,178 76,346,747
Held by trustee for constructionCash and cash equivalents 51,333,278 -0-
Donor restrictedCash and cash equivalents 36,055 29,359 US Government securities 81,645 44,264 Mutual funds 250,678 432,836 Corporate equity securities 720,845 548,662 Corporate debt securities 166,619 175,115
Total donor restricted 1,255,842 1,230,236
Total assets whose use is limited 155,772,298$ 77,576,983$
The corporate debt and equity securities are owned by the Foundation.
4. DEPOSITS AND INVESTMENTS
Deposits with financial institutions in the State of Indiana at year end were entirely insured by the Federal Depository Insurance Corporation or by the Indiana Deposit Insurance Fund. This includes any deposit accounts issued or offered by a qualifying financial institution. Investments are carried at fair market value except for certificates of deposit and money market deposit funds which are carried at contract value. Net realized gains and losses on security transactions are determined on the specific identification cost basis.

MAJOR HEALTH PARTNERS
NOTES TO CONSOLIDATED FINANCIAL STATEMENTS DECEMBER 31, 2014 AND 2013
19
MHP’s investments generally are reported at fair value, as discussed in Note 1. As of December 31, 2014 and 2013, MHP had the following investments and maturities, all of which were held in MHP’s name by custodial banks that are agents of MHP:
Carrying Less More Amount than 1 1-5 6-10 than 10
US Government securities 27,025,876$ 163,096$ 16,966,962$ 5,399,517$ 4,496,301$ Certificates of deposit 1,000,000 1,000,000 -0- -0- -0- Mutual funds 36,551,679 36,551,679 -0- -0- -0- Corporate equity securities 2,586,522 2,586,522 -0- -0- -0- Corporate debt securities 597,859 7,042 369,101 177,828 43,888
67,761,936$ 40,308,339$ 17,336,063$ 5,577,345$ 4,540,189$
Carrying Less More Amount than 1 1-5 6-10 than 10
US Government securities 24,673,346$ 594,022$ 15,578,369$ 5,145,560$ 3,355,395$ Certificates of deposit 1,000,000 1,000,000 -0- -0- -0- Mutual funds 35,506,204 35,506,204 -0- -0- -0- Corporate equity securities 2,671,698 2,671,698 -0- -0- -0- Corporate debt securities 584,997 8,025 376,315 123,334 77,323
64,436,245$ 39,779,949$ 15,954,684$ 5,268,894$ 3,432,718$
December 31, 2014
December 31, 2013
Investment Maturities (in years)
Investment Maturities (in years)
Interest rate risk - MHP does have a formal investment policy that limits investment maturities as a means of managing its exposure to fair value losses arising from changing interest rates. Credit risk - Statutes authorize MHP to invest in interest bearing deposit accounts, passbook savings accounts, certificates of deposit, money market deposit accounts, mutual funds, pooled fund investments, securities backed by the full faith and credit of the United States Treasury and repurchase agreements. The statutes require that repurchase agreements be fully collateralized by US Government or US Government Agency obligations. Concentration of credit risk - MHP maintains its investments, which at times may exceed federally insured limits. MHP has not experienced any losses in such accounts. MHP believes that it is not exposed to any significant credit risk on investments.

MAJOR HEALTH PARTNERS
NOTES TO CONSOLIDATED FINANCIAL STATEMENTS DECEMBER 31, 2014 AND 2013
20
Deposits and investments consist of the following as of December 31, 2014 and 2013:
2014 2013Carrying amount
Deposits 104,837,546$ 27,676,807$ Investments 67,761,936 64,436,245
172,599,482$ 92,113,052$
Included in the balance sheet captionsCash 16,827,184$ 14,536,069$ Internally designated 103,183,178 76,346,747Held by trustee for construction 51,333,278 -0- Restricted funds 1,255,842 1,230,236
172,599,482$ 92,113,052$
5. FAIR VALUE MEASUREMENTS
The framework for measuring fair value provides a fair value hierarchy that prioritizes the inputs to valuation techniques used to measure fair value. The hierarchy gives the highest priority to unadjusted quoted prices in active markets for identical assets or liabilities (level 1) and the lowest priority to unobservable inputs (level 3). The three levels of the fair value hierarchy are described as follows:
Level 1: Inputs to the valuation methodology are unadjusted quoted prices for identical assets or liabilities in active markets that MHP has the ability to access.
Level 2: Inputs to the valuation methodology include quoted prices for similar assets
or liabilities in active markets; quoted prices for identical or similar assets or liabilities in inactive markets; inputs other than quoted prices that are observable for the asset or liability; inputs that are derived principally from or corroborated by observable market data by correlation or other means. If the asset or liability has a specified (contractual) term, the level 2 input must be observable for substantially the full term of the asset or liability.
Level 3: Inputs to the valuation methodology are unobservable and significant to the
fair value measurement. The asset or liability’s fair value measurement level within the fair value hierarchy is based on the lowest level of any input that is significant to the fair value measurement. Valuation techniques maximize the use of relevant observable inputs and minimize the use of unobservable inputs.

MAJOR HEALTH PARTNERS
NOTES TO CONSOLIDATED FINANCIAL STATEMENTS DECEMBER 31, 2014 AND 2013
21
Following is a description of the valuation methodologies used for assets measured at fair value. There have been no changes in the methodologies used at December 31, 2014 and 2013.
Money market mutual funds: Generally transact subscription and redemption activity
at a $1 stable net asset value (NAV); however, on a daily basis the funds are valued at their daily NAV calculated using the amortized cost of the securities held in the fund.
U.S. government securities: Valued using pricing models maximizing the use of observable inputs for similar securities.
Mutual funds: Valued at the daily closing price as reported by the fund. Mutual funds held by MHP are open-end mutual funds that are registered with the Securities and Exchange Commission. These funds are required to publish their daily NAV and to transact at that price. The mutual funds held by MHP are deemed to be actively traded.
Corporate equity securities: Valued at the closing price reported on the active market
on which the individual securities are traded. Corporate debt securities: Valued using pricing models maximizing the use of
observable inputs for similar securities. This includes basing value on yields currently available on comparable securities of issuers with similar credit ratings.
Interest rate swap agreements: Valued using pricing models that are derived
principally from observable market data based on discounted cash flows and interest rate yield curves at quoted intervals for the full term of the swap.
MHP’s policy is to recognize transfers between levels as of the end of the reporting period. There were no significant transfers between levels during 2014 and 2013.

MAJOR HEALTH PARTNERS
NOTES TO CONSOLIDATED FINANCIAL STATEMENTS DECEMBER 31, 2014 AND 2013
22
The following table sets forth by level, within the hierarchy, MHP’s assets and liabilities measured at fair value on a recurring basis as of December 31, 2014.
Total Level 1 Level 2 Level 3Assets
Assets whose use is limitedMoney market mutual funds 51,333,278$ -0-$ 51,333,278$ -0-$
US Government securitiesUS treasury notes 17,203,023 17,203,023 -0- -0- Federal home loan bank 4,702,931 -0- 4,702,931 -0- Mortgage backed securities 5,119,922 -0- 5,119,922 -0-
Total US Government securities 27,025,876 17,203,023 9,822,853 -0-
Mutual fundsFixed income 11,537,569 11,537,569 -0- -0- Large cap blended 11,342,613 11,342,613 -0- -0- Small cap blended 2,602,278 2,602,278 -0- -0- Large cap growth 4,458,142 4,458,142 -0- -0- Mid cap blended 3,122,599 3,122,599 -0- -0- Mid cap value 3,027,174 3,027,174 -0- -0- Other 461,304 461,304 -0- -0-
Total mutual funds 36,551,679 36,551,679 -0- -0-
Corporate equity securitiesLarge cap growth 474,279 474,279 -0- -0- Large cap core 672,833 672,833 -0- -0- Large cap value 702,423 702,423 -0- -0- Other 736,987 736,987 -0- -0-
Total corporate equity securities 2,586,522 2,586,522 -0- -0-
Corporate debt securitiesFinancial services 197,424 -0- 197,424 -0- Other 400,435 -0- 400,435 -0-
Total corporate debt securities 597,859 -0- 597,859 -0- 118,095,214 56,341,224$ 10,420,712$ -0-$
Cash and cash equivalents 36,677,084 Certificates of deposit 1,000,000
Total assets whose use is limited 155,772,298$
December 31, 2014
Assets measured at fair value on a non-recurring basis as of December 31, 2014 are as follows:
Total Level 1 Level 2 Level 3Assets
Other assetsProperty held for sale 2,176,627$ -0-$ 2,176,627$ -0-$
December 31, 2014
During 2014, MHP had land held for sale appraised which resulted in an impairment loss of $2,400,000. The fair value of the land held for sale is determined by reference to market prices and information for similar assets. The impairment loss is recorded as a separate line item within nonoperating revenues (expenses) in the consolidated statements of revenues, expenses and changes in net position. The impairment loss was considered a level 2 nonrecurring fair value measurement.

MAJOR HEALTH PARTNERS
NOTES TO CONSOLIDATED FINANCIAL STATEMENTS DECEMBER 31, 2014 AND 2013
23
The following table sets forth by level, within the hierarchy, MHP’s assets and liabilities measured at fair value on a recurring basis as of December 31, 2013.
Total Level 1 Level 2 Level 3Assets
Assets whose use is limitedUS Government securities
US treasury notes 16,351,702$ 16,351,702$ -0-$ -0-$ Federal home loan bank 4,216,141 -0- 4,216,141 -0- Mortgage backed securities 4,105,503 -0- 4,105,503 -0-
Total US Government securities 24,673,346 16,351,702 8,321,644 -0-
Mutual fundsFixed income 13,942,356 13,942,356 -0- -0- Large cap blended 13,736,586 13,736,586 -0- -0- Small cap blended 1,924,682 1,924,682 -0- -0- Large cap value 3,073,837 3,073,837 -0- -0- Mid cap blended 2,084,003 2,084,003 -0- -0- Other 744,740 744,740 -0- -0-
Total mutual funds 35,506,204 35,506,204 -0- -0-
Corporate equity securitiesLarge cap growth 795,117 795,117 -0- -0- Large cap core 558,208 558,208 -0- -0- Large cap value 416,246 416,246 -0- -0- Other 902,127 902,127 -0- -0-
Total corporate equity securities 2,671,698 2,671,698 -0- -0-
Corporate debt securitiesFinancial services 222,221 -0- 222,221 -0- Other 362,776 -0- 362,776 -0-
Total corporate debt securities 584,997 -0- 584,997 -0- 63,436,245 54,529,604$ 8,906,641$ -0-$
Cash and cash equivalents 13,140,738 Certificates of deposit 1,000,000
Total assets whose use is limited 77,576,983$
LiabilitiesDerivative - interest rate swap 146,290$ -0-$ 146,290$ -0-$
December 31, 2013
The following methods and assumptions were used by MHP in estimating the fair value of its financial instruments:
Cash and cash equivalents, accounts payable, other current liabilities, salaries, wages and related liabilities and estimated third-party settlements: The carrying amount reported in the consolidated balance sheets for cash and cash equivalents, accounts payable, other current liabilities, salaries, wages and related liabilities and estimated third-party settlements approximate fair value based on short-term maturity. Long-term debt: The carrying value of MHP’s variable rate revenue bonds approximates fair value based upon current traded value. The carrying value of MHP’s fixed rate revenue bonds approximates fair value based upon the timing of when the bonds were issued. The carrying value of loans payable and capital lease obligations approximates fair value based on current fixed rates available to similar entities with similar credit ratings.

MAJOR HEALTH PARTNERS
NOTES TO CONSOLIDATED FINANCIAL STATEMENTS DECEMBER 31, 2014 AND 2013
24
6. RESTRICTED NON-EXPENDABLE NET POSITION MHP, through the Foundation and noncontrolling interest, has restricted non-expendable net position. Unless a contributor provides specific instructions, the Foundation’s governing board is permitted to expend the net appreciation (realized and unrealized) of the investments in its endowments. When administering its power to spend net appreciation, the governing board is required to consider the Foundation’s and supported organization’s long and short-term needs, present and anticipated financial requirements, expected total return on its investments, price-level trends, and general economic conditions. Any net appreciation that is spent is required to be spent for the purposes designated by the contributor. The Foundation’s governing board chooses to spend the investment income (including changes in the value of investments) under the established investment policy. Restricted non-expendable net position as of December 31, 2014 and 2013, represent the principal amounts of permanent endowments, restricted to investment in perpetuity, as well as the noncontrolling interest. Investment earnings from the Foundation's permanent endowments are expendable to support the programs as established by the contributors. The following is a summary of the restricted non-expendable net position as of December 31, 2014 and 2013:
2014 2013
Compton Endowment 521,714$ 521,714$ McFadden Endowment 333,133 333,133Noncontrolling interest (111,033) 356,052
743,814$ 1,210,899$
The following table depicts the changes in consolidated net position attributable to the controlling financial interest of MHP and the noncontrolling interest.
Controlling Noncontrollinginterest interest Total
Balance, December 31, 2012 97,277,625$ 431,330$ 97,708,955$
Excess of revenues over expenses 12,809,140 (1,885,349) 10,923,791
Transfers from noncontrolling interest -0- 1,810,071 1,810,071
Balance, December 31, 2013 110,086,765 356,052 110,442,817
Excess (deficit) of revenues over expenses 25,930,638 (2,723,029) 23,207,609
Transfers from noncontrolling interest -0- 2,255,944 2,255,944
Change in net position 25,930,638 (467,085) 25,463,553
Balance, December 31, 2014 136,017,403$ (111,033)$ 135,906,370$

MAJOR HEALTH PARTNERS
NOTES TO CONSOLIDATED FINANCIAL STATEMENTS DECEMBER 31, 2014 AND 2013
25
7. CAPITAL ASSETS Capital Assets, Net A summary of property and equipment, including assets under capital leases for 2014 and 2013 follows:
December 31, December 31,2013 Additions Disposals Transfers 2014
Land and land improvements 11,581,078$ 261,134$ (3,356,323)$ -0-$ 8,485,889$ Leasehold improvements 2,639,906 2,334,449 (533,113) -0- 4,441,242 Buildings and improvements 52,238,324 124,377 (3,154,218) 646,220 49,854,703 Equipment 38,258,162 3,481,260 (2,328,569) 47,802 39,458,655 Construction in progress 940,307 4,809,738 -0- (694,022) 5,056,023
Total property and equipment 105,657,777 11,010,958 (9,372,223) -0- 107,296,512
Less accumulated depreciationLand improvements 1,943,501 245,326 (63,509) -0- 2,125,318 Leasehold improvements 925,126 164,264 -0- -0- 1,089,390 Buildings and improvements 27,780,083 3,573,156 (908,614) -0- 30,444,625 Equipment 28,878,722 3,051,521 (1,372,256) -0- 30,557,987
Total accumulated depreciation 59,527,432 7,034,267 (2,344,379) -0- 64,217,320
Capital assets, net 46,130,345$ 3,976,691$ (7,027,844)$ -0-$ 43,079,192$
December 31, December 31,2012 Additions Disposals Transfers 2013
Land and land improvements 11,328,726$ 110,807$ (131)$ 141,676$ 11,581,078$ Leasehold improvements 2,322,553 317,353 -0- -0- 2,639,906 Buildings and improvements 49,735,425 2,460,152 (733) 43,480 52,238,324 Equipment 36,739,841 2,399,607 (887,086) 5,800 38,258,162 Construction in progress 255,963 875,300 -0- (190,956) 940,307
Total property and equipment 100,382,508 6,163,219 (887,950) -0- 105,657,777
Less accumulated depreciationLand improvements 1,702,127 241,505 (131) -0- 1,943,501 Leasehold improvements 809,062 116,064 -0- -0- 925,126 Buildings and improvements 26,045,902 1,734,783 (602) -0- 27,780,083 Equipment 26,854,228 2,911,711 (887,217) -0- 28,878,722
Total accumulated depreciation 55,411,319 5,004,063 (887,950) -0- 59,527,432 Capital assets, net 44,971,189$ 1,159,156$ -0-$ -0-$ 46,130,345$
As of December 31, 2014, MHP had a remaining commitment of approximately $80,000,000 primarily related to the construction of a replacement acute care hospital. Assets under Capital Leases The assets acquired through capital leases are as follows:
2014 2013
Equipment 309,061$ 309,061$ Less accumulated depreciation 309,061 294,899
-0-$ 14,162$

MAJOR HEALTH PARTNERS
NOTES TO CONSOLIDATED FINANCIAL STATEMENTS DECEMBER 31, 2014 AND 2013
26
Property Held for Sale MHP currently holds approximately 41 acres of land available for sale. The land is located in the Intelliplex Park where the Hospital’s Cancer Center is located. The land is valued at cost plus improvements and will be sold in lots in varying size. Land held for sale is included within the property held for sale section of the consolidated balance sheets.
8. LONG TERM DEBT A summary of long term debt as of December 31, 2014 is as follows: Indiana Finance Authority Hospital Revenue Bonds, Series 2009 in the original
aggregate principal amount of $30,000,000, were issued during 2009, to finance or refinance various health care facilities. On June 23, 2009, a financial institution purchased from the Indiana Finance Authority all of the Series 2009 Bonds in a private placement. On December 5, 2014, the Series 2009 Bonds were assigned to another financial institution. The Series 2009 Bonds bear interest at a variable rate, adjusted monthly, equal to the lesser of (a) 12% per annum or (b) a rate equal to the sum of (i) 67% of one month LIBOR plus (ii) 0.98% (rate as of December 31, 2014 – 1.092%). The Series 2009 Bonds may be, at the option of the Hospital, converted to another interest rate mode and remarketed to another bondholder or holders. The Series 2009 Bonds are subject to mandatory tender and purchase on December 1, 2024 (Tender Date). If the Series 2009 Bonds cannot be remarketed on the Tender Date, the Hospital would be required to purchase the Series 2009 Bonds at a price equal to the remaining principal amount of the Series 2009 Bonds. The Series 2009 Bonds are secured by certain revenues of the Hospital which approximated $100,000,000. The Series 2009 Bonds mature in monthly installments through December 1, 2024 and on December 1, 2034 (final maturity).
Indiana Finance Authority Hospital Revenue Bonds, Series 2014A, in the original principal amount of $53,505,000, were issued during 2014 for construction of a replacement acute care hospital. The Series 2014A Bonds bear fixed interest at rates ranging from 3.50% to 5.00%, payable semiannually on April 1 and October 1 of each year. Principal payments due in annual installments on October 1 of each year, from October 1, 2017, through October 1, 2044 (final maturity). The Series 2014A Bonds are secured by certain revenues of the Hospital similar to the Series 2009 Bonds, as well as a mortgage on certain real estate, building and improvements comprising the replacement acute care hospital. The net book value of this collateral as of December 31, 2014 approximated $5,000,000.
The capital lease obligation with fixed interest of 4.5% executed for property and equipment was due in monthly installments of $1,881 including interest. The capital lease obligation matured during 2014.
Note payable with an original amount of $7,000,000 with a local financial institution. This note was paid in full during 2014.

MAJOR HEALTH PARTNERS
NOTES TO CONSOLIDATED FINANCIAL STATEMENTS DECEMBER 31, 2014 AND 2013
27
Loans payable with an original amount of $2,300,000 with a local financial institutions, due in monthly installments of approximately $13,000 which included interest with a balloon payment in 2016 at an interest rate of the daily LIBOR plus 300 basis points as of December 31, 2014 (3.17%), was secured by certain assets of a subsidiary. This loan was paid in full during 2014.
Loans payable with an original amount of $628,000 with a local financial institution is due in monthly installments of $5,900 through 2022 at a fixed interest rate of 7.7% and is unsecured.
The revenue bonds require the Hospital to maintain certain financial ratios. As of December 31, 2014, the Hospital was in compliance with the financial ratios. The following is a progression for long term debt for 2014 and 2013:
December 31, Additional December 31, Current2013 Borrowings Payments 2014 Portion
Revenue bonds2009 Bonds 26,579,000$ -0-$ (863,073)$ 25,715,927$ 908,479$ 2014A Bonds -0- 53,505,000 -0- 53,505,000 -0-
Loans payableCapital lease obligations 14,808 -0- (14,808) -0- -0- Note payable 6,416,667 -0- (6,416,667) -0- -0- Loans payable 1,802,686 -0- (1,418,389) 384,297 42,695
34,813,161 53,505,000$ (8,712,937)$ 79,605,224 951,174$ Unamortized bond premium -0- 2,319,269
Total long term debt 34,813,161$ 81,924,493$
December 31, Additional December 31, Current2012 Borrowings Payments 2013 Portion
Revenue bonds2009 Bonds 27,401,000$ -0-$ (822,000)$ 26,579,000$ 848,484$
Loans payableCapital lease obligations 36,191 -0- (21,383) 14,808 14,808 Note payable -0- 7,000,000 (583,333) 6,416,667 700,000$ Loans payable 1,955,357 -0- (152,671) 1,802,686 155,593
Total long term debt 29,392,548$ 7,000,000$ (1,579,387)$ 34,813,161$ 1,718,885$
Scheduled principal and interest repayments on long term debt and payments on capital lease obligations for the years succeeding December 31, 2014 are as follows:
Years Ending TotalDecember 31, Principal Interest Payments
2015 951,174$ 2,937,710$ 3,888,884$ 2016 1,066,581 2,964,460 4,031,041 2017 2,102,707 2,941,608 5,044,315 2018 2,178,022 2,877,292 5,055,314 2019 2,260,286 2,811,659 5,071,945
2020-2024 12,390,526 12,943,604 25,334,130 2025-2029 7,630,000 11,219,370 18,849,370 2030-2034 23,935,928 9,069,720 33,005,648 2035-2039 11,905,000 5,640,250 17,545,250 2040-2044 15,185,000 2,315,000 17,500,000
79,605,224$ 55,720,673$ 135,325,897$

MAJOR HEALTH PARTNERS
NOTES TO CONSOLIDATED FINANCIAL STATEMENTS DECEMBER 31, 2014 AND 2013
28
The interest rate swap agreements matured in 2014. The interest rate swap agreements did not affect the obligation of MHP under the indenture to repay principal and interest on the Series 2009 Bonds. However, during the term of the swap agreements, MHP effectively paid a fixed rate on a portion of the debt. A portion of the debt service requirements to maturity for the Series 2009 Bonds were based on that fixed rate. MHP was exposed to variable rates if the counterparty to the swaps defaulted or the swap agreements terminated. As of December 31, 2013, the variable rate on the Series 2009 Bonds was lower than the swap agreements fixed rates. See the footnote on Derivative Instruments – Interest Rate Swaps for additional information.
9. DERIVATIVE INSTRUMENTS – INTEREST RATE SWAPS Contracts MHP had three interest rate swap agreements in effect as of December 31, 2013 for the Indiana Finance Authority Hospital Revenue Bonds, Series 2009. These agreements matured during 2014. Objectives and Strategies for Using Derivatives As a means to manage the risk associated with interest rate risk on its variable rate debt, MHP entered into interest rate swaps agreements in connection with its Indiana Finance Authority Hospital Revenue Bonds, Series 2009. The intention of the swap agreements was to effectively change MHP’s variable interest rate on the Series 2009 bonds to fixed rates ranging from 2.98% to 3.54%. Swap Payments and Associated Debt Using rates as of December 31, 2013, debt service requirements of the variable rate debt and net swap payments of the Series 2009 bonds, assuming current interest rates remained the same for the term of the bonds that are disclosed in the Long Term Debt note. As rates vary, variable-rate bond interest payments and net swap payments would have varied. As of December 31, 2013, MHP had determined the swaps to be effective hedges. Accordingly, the fair value of the swaps was recorded and subsequent changes in fair value were recorded only in the consolidated balance sheets while the swaps remained effective hedges. Following is an analysis of the recording of the interest rate swap agreements:
2014 2013Deferred outflow -0-$ 146,290$
LiabilityInterest rate swap agreements -0-$ 146,290$
See Fair Value Measurements note for additional information.

MAJOR HEALTH PARTNERS
NOTES TO CONSOLIDATED FINANCIAL STATEMENTS DECEMBER 31, 2014 AND 2013
29
10. ACCOUNTS RECEIVABLE AND PAYABLE Patient accounts receivable and accounts payable (including accrued expenses) reported as current assets and liabilities as of December 31, 2014 and 2013 is as follows:
2014 2013Patient accounts receivable
Receivable from patients and their insurance carriers 17,013,493$ 17,772,774$ Receivable from Medicare 9,516,021 7,809,249Receivable from Medicaid 2,306,914 1,346,422Receivable from long-term care operations 35,041,239 12,006,200
Total patient accounts receivable 63,877,667 38,934,645Less contractual allowances (14,830,556) (11,591,021)Less allowance for uncollectible amounts (4,176,654) (4,477,235)
Patient accounts receivable, net 44,870,457$ 22,866,389$
Accounts payable and accrued expensesPayable to employees (including payroll taxes and benefits) 11,007,218$ 10,101,823$ Payable to suppliers and other accrued expenses 64,310,015 20,702,867
Total accounts payable and accrued expenses 75,317,233$ 30,804,690$
11. PENSION PLAN
Plan Description MHP has a defined contribution pension plan as authorized by IC 16-22-3-11. The plan provides retirement, disability and death benefits to plan members and beneficiaries. The plan was established by written agreement between the Board of Trustees and the Plan Administrator. The Plan Administrator issues a publicly available financial report that includes financial statements and required supplementary information of the plan. The report is available by contacting MHP’s accounting department. Funding Policy The contribution requirements of plan members are established by the written agreement between MHP’s Board of Trustees and the plan administrator. The current employer contribution rate is 7% of annual covered payroll. Employer contributions to the plan for 2014 and 2013 were approximately $2,301,000 and $1,904,000, respectively. Employees are not permitted to contribute to the plan.

MAJOR HEALTH PARTNERS
NOTES TO CONSOLIDATED FINANCIAL STATEMENTS DECEMBER 31, 2014 AND 2013
30
12. CONCENTRATIONS OF CREDIT RISK MHP is located in Shelbyville, Indiana. MHP grants credit without collateral to its patients, most of who are local residents and are insured under third-party payor agreements. Concentrations of accounts receivable and gross revenue from patients and third party payors are as follows as of December 31:
2014 2013 2014 2013Medicare 33% 29% 44% 43%Medicaid 8% 5% 14% 14%Anthem 14% 15% 15% 14%Other third party payors 25% 27% 17% 20%Self-pay 20% 24% 10% 9%
100% 100% 100% 100%
Receivables Revenues
13. ESTIMATED MALPRACTICE COSTS
The Indiana Medical Malpractice Act, IC 27-12 (the Act), provides a recovery for an occurrence of malpractice and for any injury or death of a patient due to an act of malpractice in excess of certain thresholds. The Act provides for a maximum recovery of $1,250,000 per occurrence ($7,500,000 annual aggregate) with the first $250,000 covered by MHP’s insurance and the remainder by the State of Indiana Patient Compensation Fund. The Act requires MHP to maintain medical malpractice liability insurance on a per occurrence basis and in the annual aggregate for amounts below the thresholds of the Act. Management is not aware of any related material adverse effects to its financial position, results from operations, and cash flows.
14. RISK MANAGEMENT
Medical Benefits to Employees and Dependents
MHP is self-funded for medical and related health benefits provided to employees and their families. A stop/loss policy through commercial insurance covers individual claims in excess of $200,000 per year. Provisions are also made for unexpected and unusual claims. Claim expenditures and liabilities of the fund are reported when it is probable that a loss has occurred and the amount of the loss can be reasonably estimated. These losses include an estimate of claims that have been incurred but not reported. Self-funded health insurance and related expenses were approximately $7,006,000 and $7,428,000 in 2014 and 2013, respectively.

MAJOR HEALTH PARTNERS
NOTES TO CONSOLIDATED FINANCIAL STATEMENTS DECEMBER 31, 2014 AND 2013
31
A progression of unpaid claims for 2014 and 2013 follows:
2014 2013
Unpaid claims, beginning of year 1,295,000$ 1,060,000$ Incurred claims and changes in estimates 7,005,683 7,427,979 Claim payments (6,805,683) (7,192,979) Unpaid claims, end of year 1,495,000$ 1,295,000$
15. RENTAL EXPENSE
MHP has leases expiring at various times through 2016. Leases that do not meet the criteria for capitalization are classified as operating leases with related rentals charged to operating as incurred. The majority of the leases are cancellable. Total rent expense for 2014 and 2013 was approximately $22,606,000 and $10,375,000, respectively.
16. COMMITMENTS AND CONTINGENCIES
The Shelby County Council and City of Shelbyville Common Council each passed an ordinance pledging a portion of their share of economic development income tax (EDIT) for the purpose of land acquisition, construction and installation of public infrastructure improvements at the Shelbyville/Shelby County Advanced Technological Industrial Park. Shelby County, the City of Shelbyville, and the Hospital (a component unit of Shelby County) share administrative and financial responsibility for this project. The County and City have each pledged $125,000 each calendar year through 2028 (or such earlier date as all outstanding bonds issued to finance or refinance the projects are defeased). The Hospital recognizes the amounts as revenue when received. A schedule of expected payments is as follows:
Years EndingDecember 31,
2015 250,000$ 2016 250,000 2017 250,000 2018 250,000 2019 250,000
Thereafter 2,250,000 3,500,000$

MAJOR HEALTH PARTNERS
NOTES TO CONSOLIDATED FINANCIAL STATEMENTS DECEMBER 31, 2014 AND 2013
32
17. BLENDED COMPONENT UNITS
MHP’s consolidated financial statements include the accounts of its blended component units. Below is condensed financial information of the blended component units.
MAI Foundation MDSolutions TotalAssets and deferred outflows
Current assets 4,079,247$ 495,457$ 1,530,719$ 6,105,423$ Capital assets 10,730,744 17,144 978 10,748,866 Other assets 3,764,740 4,940,371 -0- 8,705,111
Total assets and deferred outflows 18,574,731$ 5,452,972$ 1,531,697$ 25,559,400$
LiabilitiesLong-term debt 1,592,072$ -0-$ -0-$ 1,592,072$ Other liabilities 5,102,079 20,123 385,496 5,507,698
Total liabilities 6,694,151 20,123 385,496 7,099,770
Net positionNet investment in capital assets 8,566,098 17,144 978 8,584,220 Restricted (111,033) 1,255,842 -0- 1,144,809 Unrestricted 3,425,515 4,159,863 1,145,223 8,730,601
Total net position 11,880,580 5,432,849 1,146,201 18,459,630 Total liabilities and net position 18,574,731$ 5,452,972$ 1,531,697$ 25,559,400$
RevenuesNet patient service revenue 21,090,631$ -0-$ -0-$ 21,090,631$ Other 1,897,256 1,046,759 1,214,645 4,158,660
Total revenues 22,987,887 1,046,759 1,214,645 25,249,291
ExpensesDepreciation 924,712 6,639 35,035 966,386 Other expenses 29,639,891 589,771 1,103,317 31,332,979
Total expenses 30,564,603 596,410 1,138,352 32,299,365
Operating income (loss) (7,576,716) 450,349 76,293 (7,050,074)
Nonoperating revenues (expenses) (236,368) 276,188 15,245 55,065
Excess (deficit) revenues over expenses (7,813,084) 726,537 91,538 (6,995,009)
Transfers 8,458,242 -0- 86,270 8,544,512
Change in net position 645,158 726,537 177,808 1,549,503
Net positionBeginning of year 11,235,422 4,706,312 968,393 16,910,127 End of year 11,880,580$ 5,432,849$ 1,146,201$ 18,459,630$
Net cash flows fromOperating activities (7,216,260)$ 456,988$ 803,049$ (5,956,223)$ Capital and related financing activities 8,073,652 (388,889) 64,124 7,748,887 Investing activities 206,184 77,758 -0- 283,942
Total 1,063,576 145,857 867,173 2,076,606
Cash and cash equivalentsBeginning of year 3,290,645 288,326 565,659 4,144,630 End of year 4,354,221$ 434,183$ 1,432,832$ 6,221,236$
2014

MAJOR HEALTH PARTNERS
NOTES TO CONSOLIDATED FINANCIAL STATEMENTS DECEMBER 31, 2014 AND 2013
33
MAI Foundation MDSolutions TotalAssets and deferred outflows
Current assets 5,275,609$ 329,067$ 765,723$ 6,370,399$ Capital assets 11,866,734 22,376 2,145,547 14,034,657 Other assets 904,471 4,775,694 (13,726) 5,666,439
Total assets and deferred outflows 18,046,814$ 5,127,137$ 2,897,544$ 26,071,495$
LiabilitiesLong-term debt 2,164,646$ -0-$ 1,262,796$ 3,427,442$ Other liabilities 4,646,746 420,825 666,355 5,733,926
Total liabilities 6,811,392 420,825 1,929,151 9,161,368
Net positionNet investment in capital assets 9,160,362 22,376 766,699 9,949,437 Restricted (131,563) 1,230,236 487,615 1,586,288 Unrestricted 2,206,623 3,453,700 (285,921) 5,374,402
Total net position 11,235,422 4,706,312 968,393 16,910,127 Total liabilities and net position 18,046,814$ 5,127,137$ 2,897,544$ 26,071,495$
RevenuesNet patient service revenue 18,085,234$ -0-$ -0-$ 18,085,234$ Other 2,642,160 652,882 1,332,428 4,627,470
Total revenues 20,727,394 652,882 1,332,428 22,712,704
ExpensesDepreciation 894,683 2,672 65,283 962,638 Other expenses 28,294,631 1,030,419 1,076,902 30,401,952
Total expenses 29,189,314 1,033,091 1,142,185 31,364,590
Operating income (loss) (8,461,920) (380,209) 190,243 (8,651,886)
Nonoperating revenues (expenses) 175,957 697,754 (44,542) 829,169
Excess (deficit) revenues over expenses (8,285,963) 317,545 145,701 (7,822,717)
Transfers 11,618,346 -0- 174,070 11,792,416
Change in net position 3,332,383 317,545 319,771 3,969,699
Net positionBeginning of year 7,903,039 4,388,767 648,622 12,940,428 End of year 11,235,422$ 4,706,312$ 968,393$ 16,910,127$
Net cash flows fromOperating activities (7,247,368)$ (377,537)$ 178,950$ (7,445,955)$ Capital and related financing activities 8,408,898 (15,260) 129,528 8,523,166 Investing activities -0- 365,702 -0- 365,702
Total 1,161,530 (27,095) 308,478 1,442,913
CashBeginning of year 2,129,115 315,421 257,181 2,701,717 End of year 3,290,645$ 288,326$ 565,659$ 4,144,630$
2013

SUPPLEMENTARY INFORMATION
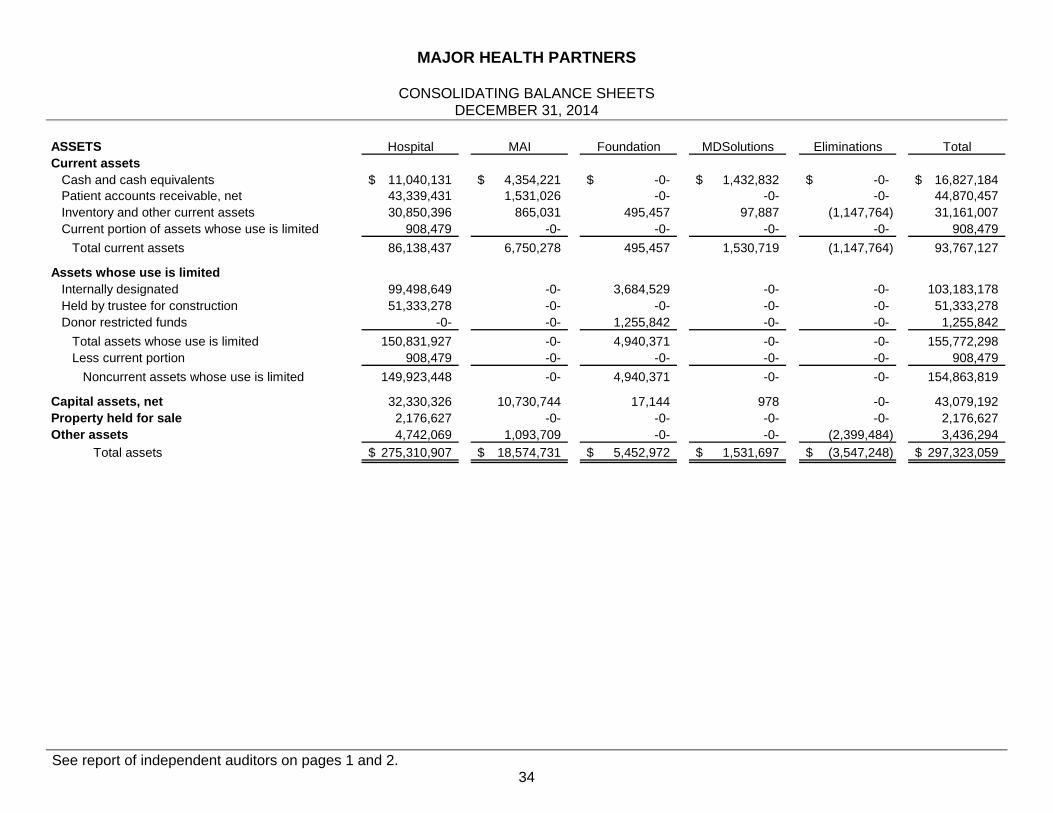
MAJOR HEALTH PARTNERS
CONSOLIDATING BALANCE SHEETS DECEMBER 31, 2014
See report of independent auditors on pages 1 and 2. 34
ASSETS Hospital MAI Foundation MDSolutions Eliminations TotalCurrent assets
Cash and cash equivalents 11,040,131$ 4,354,221$ -0-$ 1,432,832$ -0-$ 16,827,184$ Patient accounts receivable, net 43,339,431 1,531,026 -0- -0- -0- 44,870,457 Inventory and other current assets 30,850,396 865,031 495,457 97,887 (1,147,764) 31,161,007 Current portion of assets whose use is limited 908,479 -0- -0- -0- -0- 908,479
Total current assets 86,138,437 6,750,278 495,457 1,530,719 (1,147,764) 93,767,127
Assets whose use is limited Internally designated 99,498,649 -0- 3,684,529 -0- -0- 103,183,178 Held by trustee for construction 51,333,278 -0- -0- -0- -0- 51,333,278 Donor restricted funds -0- -0- 1,255,842 -0- -0- 1,255,842
Total assets whose use is limited 150,831,927 -0- 4,940,371 -0- -0- 155,772,298 Less current portion 908,479 -0- -0- -0- -0- 908,479
Noncurrent assets whose use is limited 149,923,448 -0- 4,940,371 -0- -0- 154,863,819
Capital assets, net 32,330,326 10,730,744 17,144 978 -0- 43,079,192 Property held for sale 2,176,627 -0- -0- -0- -0- 2,176,627 Other assets 4,742,069 1,093,709 -0- -0- (2,399,484) 3,436,294
Total assets 275,310,907$ 18,574,731$ 5,452,972$ 1,531,697$ (3,547,248)$ 297,323,059$

MAJOR HEALTH PARTNERS
CONSOLIDATING BALANCE SHEETS DECEMBER 31, 2014
See report of independent auditors on pages 1 and 2. 35
LIABILITIES AND NET POSITION Hospital MAI Foundation MDSolutions Eliminations TotalCurrent liabilities
Accounts payable and accrued expenses 63,782,852$ 1,097,626$ 16,371$ 31,051$ (617,885)$ 64,310,015$ Accrued wages and related liabilities 8,239,974 2,409,047 3,752 354,445 -0- 11,007,218 Estimated third-party settlements 3,152,131 -0- -0- -0- -0- 3,152,131 Current portion of long-term debt
Loans payable and capital leases 0 42,695 -0- -0- -0- 42,695 Revenue bonds payable 908,479 -0- -0- -0- -0- 908,479 Intercompany notes payable -0- 529,879 -0- -0- (529,879) -0-
Total current liabilities 76,083,436 4,079,247 20,123 385,496 (1,147,764) 79,420,538
Other liabilities -0- 1,022,832 -0- -0- -0- 1,022,832 Long term debt, net of current portion
Loans payable and capital leases -0- 341,602 -0- -0- -0- 341,602 Revenue bonds payable 80,631,717 -0- -0- -0- -0- 80,631,717 Intercompany notes payable -0- 1,250,470 -0- -0- (1,250,470) -0-
Total long term debt 80,631,717 1,592,072 -0- -0- (1,250,470) 80,973,319
Total liabilities 156,715,153 6,694,151 20,123 385,496 (2,398,234) 161,416,689
Net positionNet investment in capital assets 2,123,408 8,566,098 17,144 978 1,780,349 12,487,977 Restricted
Expendable - other specific purpose -0- -0- 400,995 -0- -0- 400,995 Non-expendable -0- (111,033) 854,847 -0- -0- 743,814
Total restricted net position -0- (111,033) 1,255,842 -0- -0- 1,144,809
Unrestricted 116,472,346 3,425,515 4,159,863 1,145,223 (2,929,363) 122,273,584
Total net position 118,595,754 11,880,580 5,432,849 1,146,201 (1,149,014) 135,906,370
Total liabilities and net position 275,310,907$ 18,574,731$ 5,452,972$ 1,531,697$ (3,547,248)$ 297,323,059$

MAJOR HEALTH PARTNERS
CONSOLIDATING STATEMENTS OF REVENUES, EXPENSES AND CHANGES IN NET POSITION YEAR ENDED DECEMBER 31, 2014
See report of independent auditors on pages 1 and 2. 36
Hospital MAI Foundation MDSolutions Eliminations TotalRevenue
Net patient service revenue 303,020,934$ 21,090,631$ -0-$ -0-$ (151,820)$ 323,959,745$ Other 2,256,856 1,897,256 1,046,759 1,214,645 (2,320,602) 4,094,914
Total revenue 305,277,790 22,987,887 1,046,759 1,214,645 (2,472,422) 328,054,659 Expenses
Salaries and wages 33,987,223 15,543,977 125,945 238,550 (277,402) 49,618,293 Employee benefits 9,992,855 4,418,441 8,547 120,091 -0- 14,539,934 Medical professional fees 3,311,853 -0- -0- -0- -0- 3,311,853 Supplies 12,287,942 5,123,782 -0- 11,478 (31,638) 17,391,564 Purchased services 177,028,923 2,158,681 -0- 216,943 (1,441,440) 177,963,107 Rent and maintenance 24,523,981 624,441 -0- 309,000 (562,475) 24,894,947 Utilities 1,171,901 554,991 -0- 18,422 -0- 1,745,314 Insurance 377,042 510,377 -0- 1,281 -0- 888,700 Depreciation and amortization 6,201,526 924,712 6,639 35,035 8,090 7,176,002 Hospital assessment fee 2,731,912 -0- -0- -0- -0- 2,731,912 Other expenses 1,890,502 705,201 455,279 187,552 (202,557) 3,035,977
Total expenses 273,505,660 30,564,603 596,410 1,138,352 (2,507,422) 303,297,603
Operating income (loss) 31,772,130 (7,576,716) 450,349 76,293 35,000 24,757,056 Nonoperating revenues (expenses)
Investment income 2,601,201 -0- 276,188 -0- (110,537) 2,766,852 Interest expense (650,355) (138,538) -0- (22,146) 110,537 (700,502) Loss on impairment of land (2,400,000) -0- -0- -0- -0- (2,400,000) Bond issuance costs (1,088,391) -0- -0- -0- -0- (1,088,391) Other nonoperating revenues (expenses) 520,263 (97,830) -0- 37,391 (587,230) (127,406)
Nonoperating revenues (expenses), net (1,017,282) (236,368) 276,188 15,245 (587,230) (1,549,447)
Revenues over (under) expenses 30,754,848 (7,813,084) 726,537 91,538 (552,230) 23,207,609
Transfers (to) from (6,172,290) 8,458,242 -0- 86,270 (116,278) 2,255,944
Change in net position 24,582,558 645,158 726,537 177,808 (668,508) 25,463,553
Net positionBeginning of year 94,013,196 11,235,422 4,706,312 968,393 (480,506) 110,442,817 End of year 118,595,754$ 11,880,580$ 5,432,849$ 1,146,201$ (1,149,014)$ 135,906,370$

MAJOR HEALTH PARTNERS
CONSOLIDATING BALANCE SHEETS DECEMBER 31, 2013
See report of independent auditors on pages 1 and 2. 37
ASSETS AND DEFERRED OUTFLOWS Hospital MAI Foundation MDSolutions Eliminations TotalCurrent assets
Cash and cash equivalents 10,679,765$ 3,290,645$ -0-$ 565,659$ -0-$ 14,536,069$ Patient accounts receivable, net 21,560,253 1,306,136 -0- -0- -0- 22,866,389 Inventory and other current assets 14,985,718 678,828 329,067 200,064 (2,699,713) 13,493,964 Current portion of assets whose use is limited 1,548,484 -0- -0- -0- -0- 1,548,484
Total current assets 48,774,220 5,275,609 329,067 765,723 (2,699,713) 52,444,906
Assets whose use is limited Internally designated 72,801,289 -0- 3,545,458 -0- -0- 76,346,747 Donor restricted funds -0- -0- 1,230,236 -0- -0- 1,230,236
Total assets whose use is limited 72,801,289 -0- 4,775,694 -0- -0- 77,576,983 Less current portion 1,548,484 -0- -0- -0- -0- 1,548,484
Noncurrent assets whose use is limited 71,252,805 -0- 4,775,694 -0- -0- 76,028,499
Capital assets, net 32,095,688 11,866,734 22,376 2,145,547 -0- 46,130,345 Property held for sale 4,576,627 -0- -0- -0- -0- 4,576,627 Other assets 3,818,723 904,471 -0- (13,726) (2,260,855) 2,448,613
Total assets 160,518,063 18,046,814 5,127,137 2,897,544 (4,960,568) 181,628,990
Deferred outflows - interest rate swaps 146,290 -0- -0- -0- -0- 146,290
Total assets and deferred outflows 160,664,353$ 18,046,814$ 5,127,137$ 2,897,544$ (4,960,568)$ 181,775,280$

MAJOR HEALTH PARTNERS
CONSOLIDATING BALANCE SHEETS DECEMBER 31, 2013
See report of independent auditors on pages 1 and 2. 38
LIABILITIES AND NET POSITION Hospital MAI Foundation MDSolutions Eliminations TotalCurrent liabilities
Accounts payable and accrued expenses 21,378,441$ 888,575$ 417,014$ 216,365$ (2,197,528)$ 20,702,867$ Accrued wages and related liabilities 7,415,951 2,348,123 3,811 333,938 -0- 10,101,823 Estimated third-party settlements 4,700,000 -0- -0- -0- -0- 4,700,000 Current portion of long-term debt
Loans payable and capital leases 714,808 39,541 -0- 116,052 -0- 870,401 Revenue bonds payable 848,484 -0- -0- -0- -0- 848,484 Intercompany notes payable -0- 502,185 -0- -0- (502,185) -0-
Total current liabilities 35,057,684 3,778,424 420,825 666,355 (2,699,713) 37,223,575
Derivative liability 146,290 -0- -0- -0- -0- 146,290 Other liabilities -0- 868,322 -0- -0- -0- 868,322 Long term debt, net of current portion
Loans payable and capital leases 5,716,667 384,297 -0- 1,262,796 -0- 7,363,760 Revenue bonds payable 25,730,516 -0- -0- -0- -0- 25,730,516 Intercompany notes payable -0- 1,780,349 -0- -0- (1,780,349) -0-
Total long term debt 31,447,183 2,164,646 -0- 1,262,796 (1,780,349) 33,094,276
Total liabilities 66,651,157 6,811,392 420,825 1,929,151 (4,480,062) 71,332,463
Net positionNet investment in capital assets (914,787) 9,160,362 22,376 766,699 2,282,534 11,317,184 Restricted
Expendable - other specific purpose -0- -0- 375,389 -0- -0- 375,389 Non-expendable -0- (131,563) 854,847 487,615 -0- 1,210,899
Total restricted net position -0- (131,563) 1,230,236 487,615 -0- 1,586,288 Unrestricted 94,927,983 2,206,623 3,453,700 (285,921) (2,763,040) 97,539,345
Total net position 94,013,196 11,235,422 4,706,312 968,393 (480,506) 110,442,817
Total liabilities and net position 160,664,353$ 18,046,814$ 5,127,137$ 2,897,544$ (4,960,568)$ 181,775,280$

MAJOR HEALTH PARTNERS
CONSOLIDATING STATEMENTS OF REVENUES, EXPENSES AND CHANGES IN NET POSITION YEAR ENDED DECEMBER 31, 2013
See report of independent auditors on pages 1 and 2. 39
Hospital MAI Foundation MDSolutions Eliminations TotalRevenue
Net patient service revenue 175,056,800$ 18,085,234$ -0-$ -0-$ (145,541)$ 192,996,493$ Other 2,628,389 2,642,160 652,882 1,332,428 (2,532,612) 4,723,247
Total revenue 177,685,189 20,727,394 652,882 1,332,428 (2,678,153) 197,719,740 Expenses
Salaries and wages 33,455,977 15,007,002 91,958 275,410 (223,110) 48,607,237 Employee benefits 10,254,675 4,545,050 6,728 136,389 -0- 14,942,842 Medical professional fees 4,916,101 5,627 -0- -0- -0- 4,921,728 Supplies 11,661,149 4,359,559 -0- 11,249 (20,848.0) 16,011,109 Purchased services 75,256,179 1,883,144 -0- 237,516 (1,410,765) 75,966,074 Rental and maintenance 12,094,834 868,051 -0- 308,421 (830,916) 12,440,390 Utilities 1,091,069 476,963 -0- 24,609 -0- 1,592,641 Insurance 328,659 416,518 -0- 1,123 -0- 746,300 Depreciation and amortization 4,651,727 894,683 2,672 65,283 8,090 5,622,455 Hospital assessment fee 3,625,421 -0- -0- -0- -0- 3,625,421 Other expenses 1,975,501 732,717 931,733 82,185 (700,604) 3,021,532
Total expenses 159,311,292 29,189,314 1,033,091 1,142,185 (3,178,153) 187,497,729 Operating income (loss) 18,373,897 (8,461,920) (380,209) 190,243 500,000 10,222,011
Nonoperating revenues (expenses)Investment income 2,997,498 -0- 697,754 -0- (136,784) 3,558,468 Interest expense (853,578) (167,014) -0- (44,542) 136,784 (928,350) Loss on impairment of goodwill (2,475,000) -0- -0- -0- -0- (2,475,000) Other nonoperating revenues (expenses) 728,800 342,971 -0- -0- (525,109) 546,662
Nonoperating revenues (expenses), net 397,720 175,957 697,754 (44,542) (525,109) 701,780 Revenues over (under) expenses 18,771,617 (8,285,963) 317,545 145,701 (25,109) 10,923,791
Transfers (to) from (9,808,272) 11,618,346 -0- 174,070 (174,073) 1,810,071 Change in net position 8,963,345 3,332,383 317,545 319,771 (199,182) 12,733,862
Net positionBeginning of year 85,049,851 7,903,039 4,388,767 648,622 (281,324) 97,708,955 End of year 94,013,196$ 11,235,422$ 4,706,312$ 968,393$ (480,506)$ 110,442,817$