consolidated financial statements 2013 - rabobank statement of income 6 ... notes to the...
TRANSCRIPT

Consolidated Financial Statements 2013 Rabobank GroupApril 2014www.rabobank.com/annualreports
Rabobank Group
Consolidated Financial Statements 2013

General information 3
Consolidated statement of financial position 4
Consolidated statement of income 6
Consolidated statement of comprehensive income 7
Consolidated statement of changes in equity 8
Consolidated statement of cash flows 9
Notes to the consolidated financial statements 10
1 Basis of consolidation 10
2 Accounting policies 10
3 Solvency and capital management 28
4 Risk exposure of financial instruments 29
5 Business segments 51
6 Cash and cash equivalents 54
7 Due from other banks 54
8 Trading financial assets 55
9 Other financial assets at fair value through profit or loss 55
10 Derivative financial instruments and other trade liabilities 55
11 Loans to customers 60
12 Available-for-sale financial assets 62
13 Investments in associates 62
14 Intangible assets 63
15 Property and equipment 64
16 Investment properties 65
17 Other assets 66
18 Due to other banks 67
19 Due to customers 67
20 Debt securities in issue 68
21 Other liabilities 68
22 Other financial liabilities at fair value through profit or loss 68
23 Provisions 69
24 Deferred tax 70
25 Employee benefits 70
26 Subordinated debt 73
27 Contingencies and commitments 74
28 Equity of Rabobank Nederland and local Rabobanks 75
29 Rabobank (Member) Certificates 76
30 Capital Securities and Trust Preferred Securities III to VI 77
31 Other non-controlling interests 80
32 Interest 81
33 Commissions 81
34 Income from associates 82
35 Net income from financial assets and liabilities
at fair value through profit or loss 82
36 Other income 82
37 Staff costs 83
38 Other administrative expenses 84
39 Depreciation and amortisation 84
40 Value adjustments 84
41 Bank tax 85
42 Taxation 85
43 Non-current assets and liabilities held for sale 85
44 Acquisitions and disposals 86
45 Transactions with related parties 87
46 Costs of external auditor 88
47 Remuneration of members of the Supervisory Board
and Executive Board 88
48 Principal subsidiaries and associates 91
49 Joint ventures 92
50 Transfer of financial assets and financial assets
provided as collateral 92
51 Events after the reporting date 94
52 Balance sheet as at 1 January 2012 94
53 Management’s report on internal control over
financial reporting 95
54 Approval of Supervisory Board 96
Independant auditor’s report 97
Independent auditor’s Assurance report 99
Contents

2 Consolidated Financial Statements 2013 Rabobank Group

3 General information
Rabobank Group (Rabobank) is an international financial services provider with roots as a cooperative
organisation. Rabobank comprises 129 independent local Rabobanks (with a total of 722 branches) in the
Netherlands, members of the central organisation Coöperatieve Centrale Raiffeisen-Boerenleenbank B.A.
(Rabobank Nederland) and several specialised subsidiaries. Rabobank provides international services in retail
banking, wholesale banking, leasing and real estate. Rabobank puts the common interest of individuals and
communities first, and in our services we place a premium on adding value for customers. Our focus in the
home market is on being the general market leader, while internationally we concentrate on expanding our
leading position as a food and agri bank. Rabobank operates in a total of 41 countries and employs around
56,900 FTEs.
Rabobank Nederland is a cooperative whose capital is divided into shares. It is largely the product of a merger
on 1 December 1972 of the two largest Dutch cooperative entities at the time. Rabobank Nederland has its
registered office in Amsterdam and is established under Dutch law for an indefinite period. Rabobank
Nederland is registered at the Trade Registry of the Chamber of Commerce under number 30046259.
Membership of Rabobank Nederland is open to cooperative banks whose Articles of Association have been
approved by Rabobank Nederland; they comprise the local Rabobanks.
The operations of Rabobank Nederland can roughly be divided into three categories. For one, it acts as a
‘central bank’ for local Rabobanks, which involves facilitating the establishment, viability and development of
cooperative banks, as well as signing agreements with, negotiating about the rights of, and entering into
obligations on behalf of, local Rabobanks (to the extent that these obligations have the same impact at all
local Rabobanks). Second, by virtue of the law it has a supervisory and regulatory role in relation to the local
Rabobanks, and third, it operates its own banking business, which is both complementary to and independent
from the business operated by the local Rabobanks.
The latter constitute an organisation of cooperative entities established under and governed by Dutch law.
As at 31 December 2013, the local Rabobanks had a total of around 1.9 million members.
Address:
Croeselaan 18
P.O. Box 17100
3500 HG Utrecht
The Netherlands
www.rabobank.com
General information

4 Consolidated Financial Statements 2013 Rabobank Group
Consolidated statement of financial position
In millions of euros NoteAt 31 December
2013At 31 December
2012
AssetsCash and cash equivalents 6 43,039 68,103
Due from other banks 7 40,844 35,386
Trading financial assets 8 5,289 6,387
Other financial assets at fair value through profit or loss 9 4,971 5,911
Derivative financial instruments 10 39,703 65,423
Loans to customers 11 460,202 485,299
Available-for-sale financial assets 12 46,411 50,425
Investments in associates 13 3,629 3,649
Intangible assets 14 1,991 2,343
Property and equipment 15 6,901 6,500
Investment properties 16 1,073 1,489
Current tax assets 190 597
Deferred tax assets 24 1,911 960
Other assets 17, 25 8,805 9,763
Non-current assets held for sale and discontinued operations 43, 44 9,180 8,475
Total assets 674,139 750,710

5
In millions of euros NoteAt 31 December
2013At 31 December
2012
LiabilitiesDue to other banks 18 15,496 27,059
Due to customers 19 329,400 334,271
Debt securities in issue 20 195,361 223,336
Derivative financial instruments and other trade liabilities 10 50,171 74,800
Other debts 21, 25 7,436 11,166
Other financial liabilities at fair value through profit or loss 22 19,069 24,091
Provisions 23 972 752
Current tax liabilities 267 205
Deferred tax liabilities 24 290 186
Subordinated debt 26 7,815 5,407
Liabilities held for sale and discontinued operations 43, 44 7,825 7,357
Total liabilities 634,102 708,630
Equity
Equity of Rabobank Nederland and local Rabobanks 28 24,641 25,311
Equity instruments issued directly
Rabobank Member Certificates 29 5,823 6,672
Capital Securities 30 7,029 7,114
12,852 13,786
Equity instruments issued by subsidiaries
Capital Securities 30 236 236
Trust Preferred Securities III to VI 30 1,269 1,340
1,505 1,576
Other non-controlling interests 31 1,039 1,407
Total equity 40,037 42,080
Total equity and liabilities 674,139 750,710
6 Consolidated Financial Statements 2013 Rabobank Group
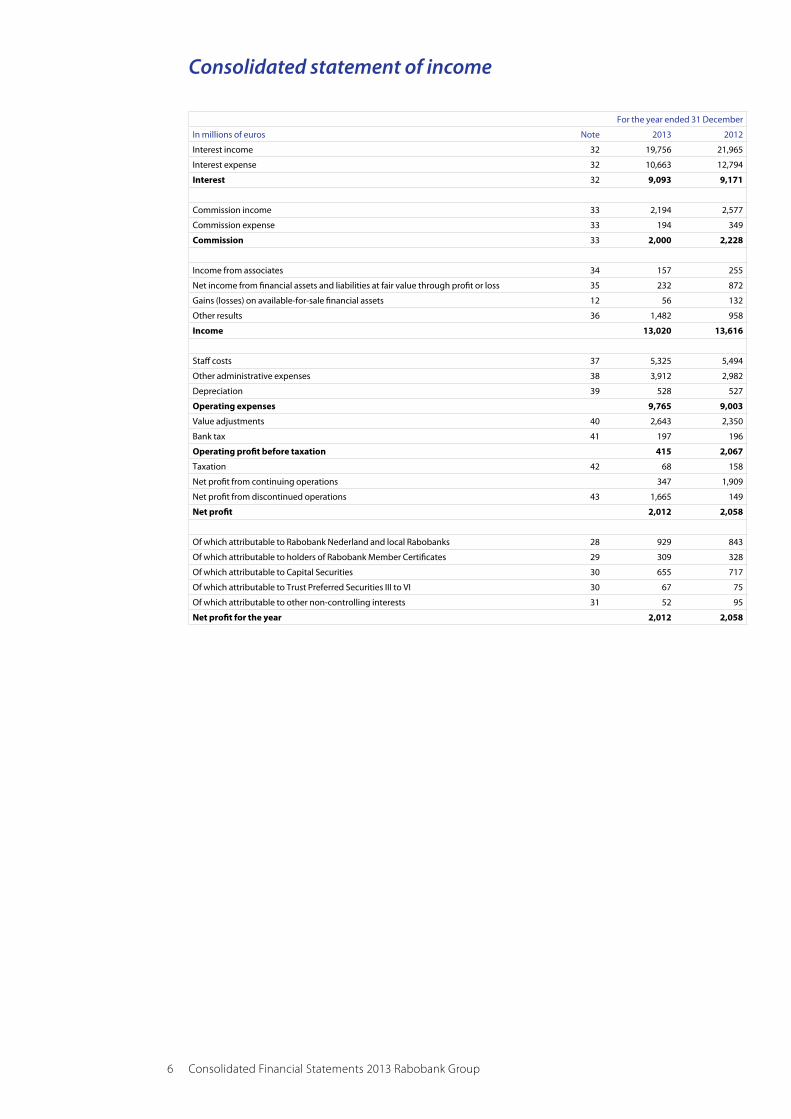
For the year ended 31 December
In millions of euros Note 2013 2012
Interest income 32 19,756 21,965
Interest expense 32 10,663 12,794
Interest 32 9,093 9,171
Commission income 33 2,194 2,577
Commission expense 33 194 349
Commission 33 2,000 2,228
Income from associates 34 157 255
Net income from financial assets and liabilities at fair value through profit or loss 35 232 872
Gains (losses) on available-for-sale financial assets 12 56 132
Other results 36 1,482 958
Income 13,020 13,616
Staff costs 37 5,325 5,494
Other administrative expenses 38 3,912 2,982
Depreciation 39 528 527
Operating expenses 9,765 9,003
Value adjustments 40 2,643 2,350
Bank tax 41 197 196
Operating profit before taxation 415 2,067
Taxation 42 68 158
Net profit from continuing operations 347 1,909
Net profit from discontinued operations 43 1,665 149
Net profit 2,012 2,058
Of which attributable to Rabobank Nederland and local Rabobanks 28 929 843
Of which attributable to holders of Rabobank Member Certificates 29 309 328
Of which attributable to Capital Securities 30 655 717
Of which attributable to Trust Preferred Securities III to VI 30 67 75
Of which attributable to other non-controlling interests 31 52 95
Net profit for the year 2,012 2,058
Consolidated statement of income

7
For the year ended 31 December
In millions of euros Note 2013 2012
Net profit 2,012 2,058
Arising in the period (after taxation):
Foreign currency translation reserves 28
Currency translation differences (412) (249)
Revaluation reserve - Available-for-sale financial assets 28
Currency translation differences (43) 21
Changes in associates (28) 59
Fair value changes (34) 393
Amortisation of reclassified assets 37 55
Transferred to profit or loss (70) (201)
Revaluation reserve - Associates 28
Fair value changes (21) (16)
Revaluation reserve - Cash flow hedges 28
Fair value changes (1,450) 145
Transferred to profit or loss 1,459 7
Revaluation reserve - Pensions 28
Fair value changes (758) (1,611)
Non-controlling interests 31
Currency translation differences (16) (5)
Revaluation reserve - Available-for-sale financial assets - 22
Total other comprehensive income (1,336) (1,380)
Total comprehensive income 676 678
Of which attributable to Rabobank Nederland and local Rabobanks (391) (554)
Of which attributable to holders of Rabobank Member Certificates 309 328
Of which attributable to Capital Securities 655 717
Of which attributable to Trust Preferred Securities III to VI 67 75
Of which attributable to other non-controlling interests 36 112
Total comprehensive income 676 678
Consolidated statement of comprehensive income
8 Consolidated Financial Statements 2013 Rabobank Group
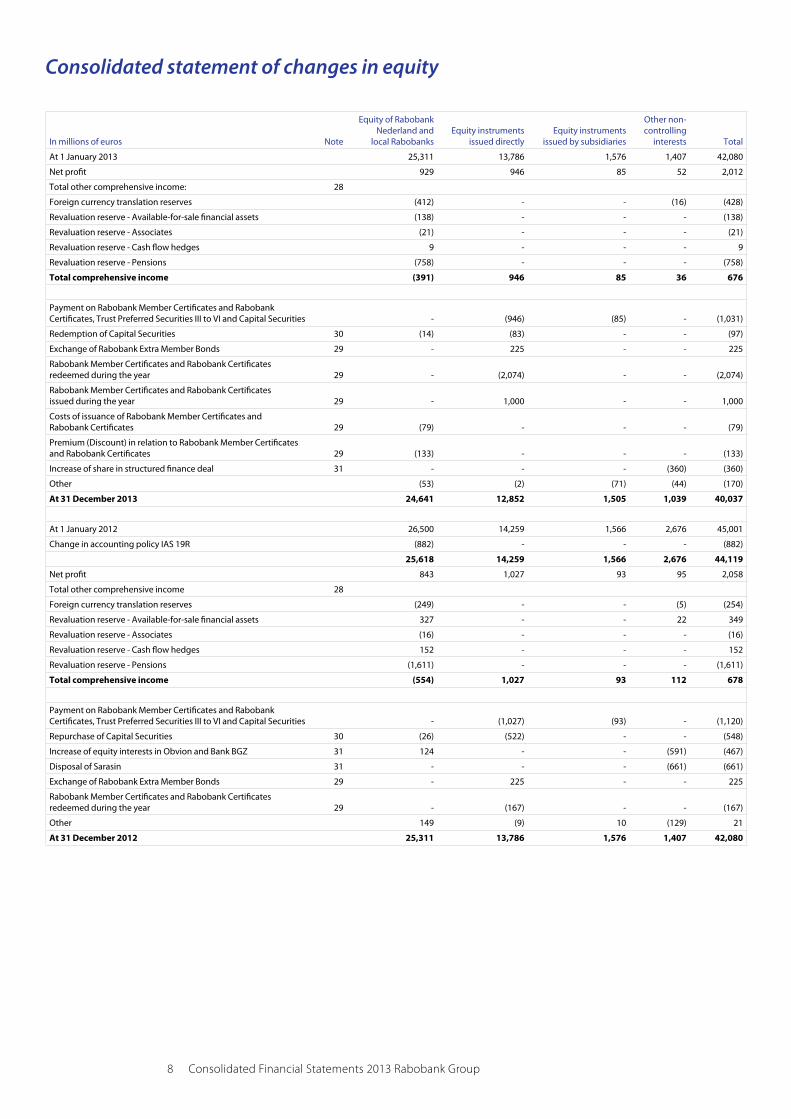
In millions of euros Note
Equity of Rabobank Nederland and
local RabobanksEquity instruments
issued directlyEquity instruments
issued by subsidiaries
Other non-controlling
interests Total
At 1 January 2013 25,311 13,786 1,576 1,407 42,080
Net profit 929 946 85 52 2,012
Total other comprehensive income: 28
Foreign currency translation reserves (412) - - (16) (428)
Revaluation reserve - Available-for-sale financial assets (138) - - - (138)
Revaluation reserve - Associates (21) - - - (21)
Revaluation reserve - Cash flow hedges 9 - - - 9
Revaluation reserve - Pensions (758) - - - (758)
Total comprehensive income (391) 946 85 36 676
Payment on Rabobank Member Certificates and Rabobank Certificates, Trust Preferred Securities III to VI and Capital Securities - (946) (85) - (1,031)
Redemption of Capital Securities 30 (14) (83) - - (97)
Exchange of Rabobank Extra Member Bonds 29 - 225 - - 225
Rabobank Member Certificates and Rabobank Certificates redeemed during the year 29 - (2,074) - - (2,074)
Rabobank Member Certificates and Rabobank Certificates issued during the year 29 - 1,000 - - 1,000
Costs of issuance of Rabobank Member Certificates and Rabobank Certificates 29 (79) - - - (79)
Premium (Discount) in relation to Rabobank Member Certificates and Rabobank Certificates 29 (133) - - - (133)
Increase of share in structured finance deal 31 - - - (360) (360)
Other (53) (2) (71) (44) (170)
At 31 December 2013 24,641 12,852 1,505 1,039 40,037
At 1 January 2012 26,500 14,259 1,566 2,676 45,001
Change in accounting policy IAS 19R (882) - - - (882)
25,618 14,259 1,566 2,676 44,119
Net profit 843 1,027 93 95 2,058
Total other comprehensive income 28
Foreign currency translation reserves (249) - - (5) (254)
Revaluation reserve - Available-for-sale financial assets 327 - - 22 349
Revaluation reserve - Associates (16) - - - (16)
Revaluation reserve - Cash flow hedges 152 - - - 152
Revaluation reserve - Pensions (1,611) - - - (1,611)
Total comprehensive income (554) 1,027 93 112 678
Payment on Rabobank Member Certificates and Rabobank Certificates, Trust Preferred Securities III to VI and Capital Securities - (1,027) (93) - (1,120)
Repurchase of Capital Securities 30 (26) (522) - - (548)
Increase of equity interests in Obvion and Bank BGZ 31 124 - - (591) (467)
Disposal of Sarasin 31 - - - (661) (661)
Exchange of Rabobank Extra Member Bonds 29 - 225 - - 225
Rabobank Member Certificates and Rabobank Certificates redeemed during the year 29 - (167) - - (167)
Other 149 (9) 10 (129) 21
At 31 December 2012 25,311 13,786 1,576 1,407 42,080
Consolidated statement of changes in equity

9
For the year ended 31 December
In millions of euros Note 2013 2012
Cash flows from operating activitiesOperating profit before taxation from continuing operations 415 2,067
Operating profit before taxation from discontinued operations 44 1,719 233
Adjusted for:
Non-cash items recognised in operating profit before taxation
Depreciation 39 528 527
Depreciation of operating lease assets and investment properties 15, 16 818 818
Value adjustments 40 2,643 2,350
Impairment on property activities 637 -
Result on sale of property and equipment 20 1
Income from associates 34 (157) (255)
Fair value results on financial assets and liabilities at fair value through profit or loss 35 (232) (872)
Gains (losses) on available-for-sale financial assets 12 (56) (132)
Result from termination of DB scheme 25 (2,022) -
Allowances 220 -
Non-cash items relating to discontinued operations 204 107
Net change in operating assets
Due from and to other banks 7, 18, 43 (16,320) (9,290)
Trading financial assets 8, 35 64 3,662
Derivative financial instruments 10 25,591 (6,450)
Net change in other financial assets and liabilities at fair value through profit or loss 9, 22, 43 (3,053) (2,827)
Loans to customers 11, 43 16,005 (12,970)
Dividends received from associates and financial assets 95 84
Net change in liabilities relating to operating activities
Derivative financial instruments and other trade liabilities 10 (24,520) 9,869
Due to customers 19, 43 1,536 3,369
Debt securities in issue 20 (27,689) 7,144
Other debts 21, 43 (2,464) 1,645
Income tax paid (318) (416)
Other changes 1,643 470
Net cash flow from operating activities (24,693) (866)
Cash flows from investing activitiesAcquisition of associates net of cash and cash equivalents acquired 13 (58) (41)
Disposal of associates net of cash and cash equivalents 1 12
Acquisition of subsidiaries net of cash and cash equivalents acquired - 3
Disposal of subsidiaries net of cash and cash equivalents 44 1,788 (297)
Acquisition of property and equipment and investment properties 15, 16 (1,791) (2,025)
Proceeds from sale of property and equipment 669 863
Acquisition of available-for-sale financial assets and held-to-maturity financial assets 12 (44,524) (37,339)
Proceeds from sale and repayment of available-for-sale financial assets and held-to-maturity financial assets 44,167 36,974
Net cash flow from investing activities 252 (1,850)
Cash flows from financing activitiesAcceptance of Rabobank Certificates / Member Certificates 29 (2,788) (594)
Sale of Rabobank Certificates / Member Certificates 1,465 430
Payments on Rabobank Member Certificates and Rabobank Certificates, Trust Preferred Securities III to VI and Capital Securities (1,030) (1,120)
Payments on Senior Contingent Notes and Rabo Extra Member Bonds (86) (102)
Redemption of Capital Securities 30 (83) (522)
Increase of equity interests in Obvion and Bank BGZ - (467)
Proceeds from issue of subordinated debt 3,224 2,751
Repayment of subordinated debt (733) -
Net cash flow from financing activities (31) 376
Net change in cash and cash equivalents (24,472) (2,340)
Cash and cash equivalents at beginning of year 68,103 70,430
Foreign exchange differences on cash and cash equivalents (592) 13
Cash and cash equivalents at end of year 43,039 68,103
The cash flows from interest are included in the net cash flow from operating activities
Interest income 19,961 22,154
Interest expense 11,009 12,866
Consolidated statement of cash flows

10 Consolidated Financial Statements 2013 Rabobank Group
1 Basis of consolidation
Rabobank Group (Rabobank) comprises the local Rabobanks (Members), the central cooperative Rabobank
Nederland and a number of specialised subsidiaries. Rabobank Nederland advises the Members and assists
them in the provision of their services. Rabobank Nederland also supervises the local Rabobanks by virtue
of the Dutch Financial Supervision Act (Wet op het financieel toezicht). Furthermore, under the same Act,
the Dutch Ministry of Finance has designated Rabobank Nederland as a holder of a collective license for
purposes of conduct-of-business supervision.
Rabobank’s cooperative structure has several executive levels, each with its own duties and responsibilities.
In annual financial reporting terms, Rabobank Nederland exercises control over the local Rabobanks.
The consolidated financial statements of Rabobank include the financial information of Rabobank Nederland
and that of the Members and other group companies.
2 Accounting policies
The main accounting policies used in preparing these consolidated financial statements are explained below.
2.1 GeneralThe consolidated financial statements of Rabobank have been prepared in accordance with International
Financial Reporting Standards (IFRS) as adopted by the European Union.
New and amended standards issued by the IASB and endorsed by the European Union, applicable to the financial year under reviewIFRS 13 Fair Value Measurement
This standard contains a single IFRS framework for determining fair value and a detailed guideline for fair
value measurement of both financial and non-financial assets and liabilities. IFRS 13 applies if another IFRS
requires or permits fair value measurements or disclosure regarding such measurements. The main impact on
Rabobank of IFRS 13 concerns the measurement of derivatives, whereby counterparty risk must be taken into
account. For assets, Rabobank previously used mainly historical data in order to estimate this risk, including
CDS curves and Monte Carlo simulations. Another factor taken into account was Rabobank’s own credit rating
– for the impact, see paragraph 2.1.1. IFRS 13 is also resulting in more disclosure requirements – see, in particular,
paragraph 4.9, ‘Fair values of financial assets and liabilities’. This standard became effective on 1 January 2013.
IAS 1 Presentation of Financial Statements – Presentation of Comprehensive Income Items
This amendment, which took effect on 1 January 2013, represents only a change in presentation. In the
consolidated statement of comprehensive income, the unrealised gains which will not be taken to the profit
or loss account are presented separately.
IAS 19R Employee Benefits
In June 2011, the International Accounting Standards Board (IASB) published improvements to the
accounting requirements for post-employment benefits. The amendments are significant and can be
summarised as follows.
Notes to the consolidated financial statements
11 Notes to the consolidated financial statements
• Pension surpluses and shortfalls must be fully included in the balance sheet, taking into account the asset
ceiling. The previous deferral mechanism known as the corridor approach has been removed. The actuarial
gains and losses, remeasurements as they are named in the amended IAS 19 standard, must be recognised
in other comprehensive income as they occur rather than in profit or loss, and are not allowed to be
reclassified to profit or loss subsequently.
• Past-service costs will need to be recognised when a plan is amended. Unvested benefits can no longer
be spread over the vesting period.
• Annual expense for a funded benefit plan will include net interest expense or income, calculated by
applying the discount rate to the net defined benefit asset or liability at the start of the year.
• Short and long-term benefits will now be distinguished based on the expected timing of settlement,
rather than employee entitlement.
• Medium and long-term remuneration plans must be recognised and measured in the same way as
pensions. However, all actuarial gains and losses and past-service costs will continue to be recorded in
profit or loss.
• A termination benefit is now recognised at the earlier of:
• when the entity recognises costs for a restructuring within the scope of IAS 37 Provisions,
Contingent Liabilities and Contingent Assets that includes the payment of termination benefits; and
• when the entity can no longer withdraw the offer of the termination benefits.
• Additional disclosures are required to present the characteristics of benefit plans, the amounts recognised
in the financial statements and the risks arising from defined benefit plans and multi-employer plans.
IFRS 7 Financial Instruments: Disclosures/IAS 32 Financial Instruments:
Presentation – Offsetting of financial assets and financial liabilities
The amendment to IFRS 7 is designed to make the provision of additional quantitative data regarding the
offsetting of financial assets and financial liabilities mandatory, to ensure that users are better able to compare
and align the data provided in connection with IFRS and the data provided based on the Generally Accepted
Accounting Principles (GAAP) in the United States. This amendment became effective 1 January 2013 and
does not affect profit or loss or equity.
IAS 12 Income Taxes – Deferred Tax: Recovery of Underlying Assets
The objective of the amendments to IFRS 12 is to introduce a new exemption to the accounting principle set
out in IAS 12, in the form of a refutable assumption that the book value of a property investment would be
realised through sale and that an entity would be required to apply the tax rate applicable to the underlying
asset. This amendment became effective 1 January 2013 and does not affect the profit or loss or equity.
Amendments to IFRS 1 Government Loans
The amendment to IFRS 1 concerns the treatment of government loans with interest rates below the market
interest rates by first time adopters of IFRS. On the transition date to IFRS, all government loans must be
classified as financial obligations or as equity instruments in accordance with IAS 32 – Financial Instruments:
Presentation. This amendment does not apply to Rabobank.
Improvements to International Financial Reporting Standards cycle 2009-2011
The objective of the improvements is to address non-urgent, but necessary issues discussed by the IASB
during the project cycle that began in 2009 on areas of inconsistencies in IFRS or where clarification of
wording is required. Three of the improvements, namely the amendments to Appendix D of IFRS 1,
International Accounting Standard (IAS) 16, and IAS 34, are clarifications or corrections of the respective
standards. The other three improvements, namely the amendments to IFRS 1, IAS 1, and IAS 32, involve
changes to the existing requirements or additional guidance on the implementation of those requirements.

12 Consolidated Financial Statements 2013 Rabobank Group
New and amended standards issued by the IASB and endorsed by the European Union, but not yet applicable to the financial year under reviewIFRS 10 Consolidated Financial Statements
This standard supersedes the consolidation rules of the current IAS 27 and SIC 12. IFRS 10 has important
consequences for the consideration as to when a company has control over another entity. The potential
impact of the changes is currently being assessed. Current expectations are that the consolidation scope
will not change materially. The standard applies effective 1 January 2014.
IFRS 11 Joint Arrangements
The IASB issued a standard regarding joint ventures in May 2011, which supersedes IAS 31 and SIC 13.
The proportional consolidation of joint ventures is no longer authorised. Any interests in joint ventures must
be accounted for using only the equity method. This amendment achieves closer convergence with US GAAP.
The remaining rules are largely identical to IAS 31. While this guideline does not affect profit or equity, it does
have an impact on the composition of the profit and will result in a limited balance sheet reduction.
This standard applies effective 1 January 2014.
IFRS 12 Disclosure of Interests in Other Entities
IFRS 12 aims to enable users of financial statements to assess the purpose and associated risks of interests
held in other entities, as well as the effects of those interests on the financial position, results and cash flows.
This pertains to additional disclosures and has no effect on results or equity. The standard applies effective
1 January 2014.
Amendments to IFRS 10, IFRS 11 and 12 – Transition Guidance
The objective of these amendments to IFRS 10 – The Consolidated Financial Statements, IFRS 11 – Joint
Arrangements and IFRS 12 – Disclosure of Interests in Other Entities, is to simplify the transition to the new
standards. The information concerning the specific notes required by IAS 8.20 is limited to the most recent
comparative period. This amendment applies effective 1 January 2014.
Amendments to IFRS 10, IFRS 12 and IAS 27 – Investment Entities
IFRS 10 has been amended in order to better reflect the business model of investment entities. It requires that
investment entities measure their subsidiaries at fair value through profit or loss rather than consolidate them.
IFRS 12 has been amended in order to require specific disclosure about such subsidiaries of investment
entities. The amendments to IAS 27 also eliminated the option for investment entities to measure investments
in certain subsidiaries either at cost or at fair value in their separate financial statements. This amendment,
which has little impact on Rabobank, applies effective 1 January 2014.
IAS 27 Separate Financial Statements
This is a reissue of IAS 27. The consolidation requirements formerly included in IAS 27 are now included in
IFRS 10. The amended standard is intended for the separate financial statements of entities also preparing
consolidated financial statements. The standard has no impact on Rabobank’s consolidated financial
statements and applies effective 1 January 2014.
IAS 28 Investments in Associates
IAS 28 lays down accounting requirements for investments in associates and describes the requirements
for recognising investments in associates and joint ventures in accordance with the equity method of
accounting. The standard has no impact on profit or equity and applies effective 1 January 2014.

13 Notes to the consolidated financial statements
Amendments to IAS 39 Financial Instruments: Novation of Derivatives and Continuation of Hedge Accounting
The objective of the amendments is to provide relief in situations where a derivative, which has been
designated as a hedging instrument, is novated from one counterparty to a central counterparty as a
consequence of laws or regulations. Such a relief means that hedge accounting can continue irrespective of
the novation which, without the amendment, would not be permitted. This standard, which does not affect
profit or equity, applies effective 1 January 2014.
Amendments to IAS 36 Impairment of Assets
The objective of these amendments is to clarify that the scope of disclosures of information about the
recoverable amount of assets, where this amount is based on fair value less costs of disposal, is limited to
impaired assets, if this recoverable amount is based on fair value less costs of disposal. This amendment
applies effective 1 January 2014.
New standards issued by the IASB, but not yet endorsed Amendments to IAS 19 Employee benefits: employee contributions
Improvements to International Financial Reporting Standards cycle 2010-2012
Improvements to International Financial Reporting Standards cycle 2011-2013
IFRIC Interpretation 21 – Levies
Although these new requirements are currently being analysed and their impact is not yet known, Rabobank
does not expect the implementation of these amended standards to have a significant impact on profit or equity.
IFRS 9 Financial Instruments
The various components of IFRS 9 – Financial Instruments were issued over the past few years, which were
originally applicable effective 2015. However, in November 2013, the International Accounting Standards
Board decided to amend this standard and to defer the compulsory application of IFRS 9 until a date to be
specified. The application of IFRS 9 may have a significant impact on profit or loss and capital; this is currently
being investigated.
The consolidated financial statements have been prepared on the basis of the accounting policies
outlined below.
The remaining assets and liabilities are accounted for on a historical cost basis, unless otherwise stated.
Unless otherwise stated, all amounts in these financial statements are in millions of euros.
2.1.1 Changes in accounting policies and presentationThe amended standard IAS 19 was applied retrospectively and its effect on comparative figures is
shown below.
in millions of euros 31 December 2012 1 January 2012
Effect of IAS 19R on equity
Equity prior to the implementation of the amended standard 44,627 45,001
Increase in deferred tax liabilities 339 -
Decrease in other assets (2,039) (1,175)
Increase in other liabilities (1,216) -
Increase in liabilities held for sale and discontinued operations (141) -
Decrease in deferred tax liabilities 510 293
(2,547) (882)
Equity after the implementation of the amended standard 42,080 44,119
The adjusted balance sheet prior to the amendment to IAS 19 effective 1 January 2012 is included in Note 52,
‘Balance sheet as at 1 January 2012’.
14 Consolidated Financial Statements 2013 Rabobank Group
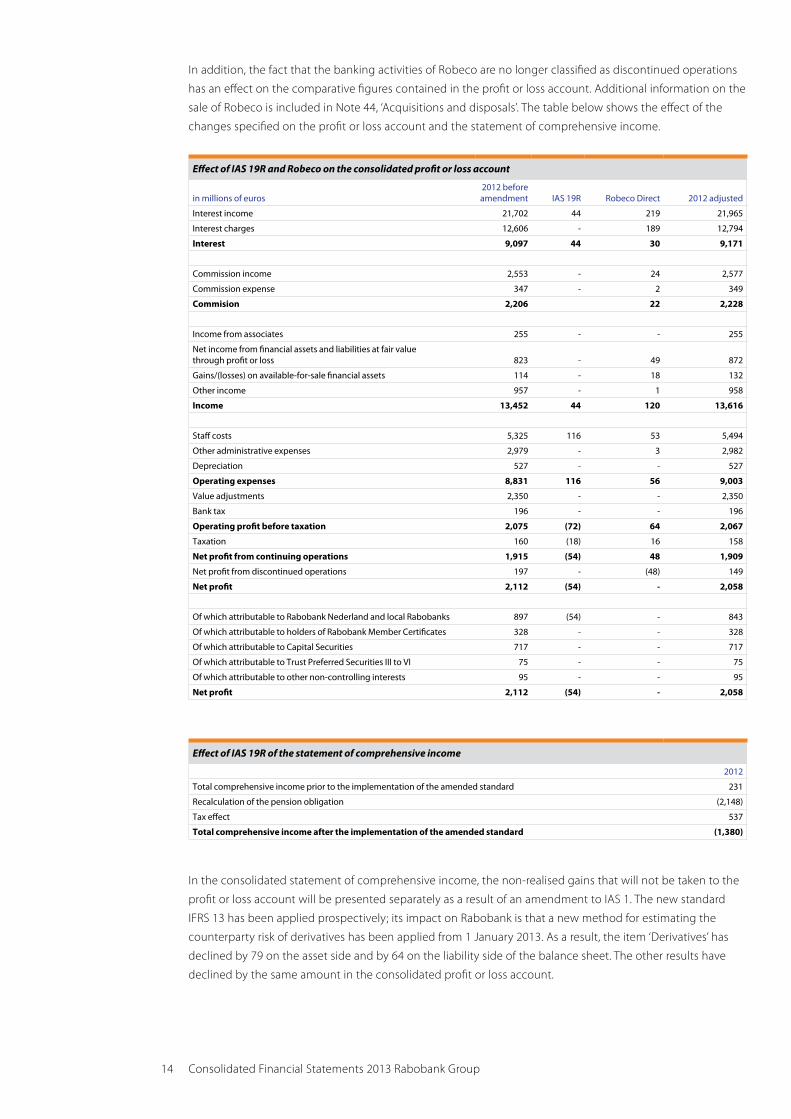
In addition, the fact that the banking activities of Robeco are no longer classified as discontinued operations
has an effect on the comparative figures contained in the profit or loss account. Additional information on the
sale of Robeco is included in Note 44, ‘Acquisitions and disposals’. The table below shows the effect of the
changes specified on the profit or loss account and the statement of comprehensive income.
Effect of IAS 19R and Robeco on the consolidated profit or loss account
in millions of euros2012 before amendment IAS 19R Robeco Direct 2012 adjusted
Interest income 21,702 44 219 21,965
Interest charges 12,606 - 189 12,794
Interest 9,097 44 30 9,171
Commission income 2,553 - 24 2,577
Commission expense 347 - 2 349
Commision 2,206 22 2,228
Income from associates 255 - - 255
Net income from financial assets and liabilities at fair value through profit or loss 823 - 49 872
Gains/(losses) on available-for-sale financial assets 114 - 18 132
Other income 957 - 1 958
Income 13,452 44 120 13,616
Staff costs 5,325 116 53 5,494
Other administrative expenses 2,979 - 3 2,982
Depreciation 527 - - 527
Operating expenses 8,831 116 56 9,003
Value adjustments 2,350 - - 2,350
Bank tax 196 - - 196
Operating profit before taxation 2,075 (72) 64 2,067
Taxation 160 (18) 16 158
Net profit from continuing operations 1,915 (54) 48 1,909
Net profit from discontinued operations 197 - (48) 149
Net profit 2,112 (54) - 2,058
Of which attributable to Rabobank Nederland and local Rabobanks 897 (54) - 843
Of which attributable to holders of Rabobank Member Certificates 328 - - 328
Of which attributable to Capital Securities 717 - - 717
Of which attributable to Trust Preferred Securities III to VI 75 - - 75
Of which attributable to other non-controlling interests 95 - - 95
Net profit 2,112 (54) - 2,058
Effect of IAS 19R of the statement of comprehensive income
2012
Total comprehensive income prior to the implementation of the amended standard 231
Recalculation of the pension obligation (2,148)
Tax effect 537
Total comprehensive income after the implementation of the amended standard (1,380)
In the consolidated statement of comprehensive income, the non-realised gains that will not be taken to the
profit or loss account will be presented separately as a result of an amendment to IAS 1. The new standard
IFRS 13 has been applied prospectively; its impact on Rabobank is that a new method for estimating the
counterparty risk of derivatives has been applied from 1 January 2013. As a result, the item ‘Derivatives’ has
declined by 79 on the asset side and by 64 on the liability side of the balance sheet. The other results have
declined by the same amount in the consolidated profit or loss account.

15 Notes to the consolidated financial statements
The comparative figures in the consolidated statement of cash flows have been adjusted because cash flows
relating to the receipt and sale of Rabobank (Member) Certificates were included in cash flows from business
activities instead of under cash flows from financing activities.
Other amendments to the notes to the consolidated financial statements
In Note 11 to the consolidated financial statements for 2012, ‘Loans to customers’, the fair value of available
financial assets held for sale reclassified by loans is erroneously presented 530 too low. The fair value has been
adjusted from 3,464 to 3,994. In addition, in paragraph 4.9, ‘Fair values of financial assets and liabilities’, the
derivatives and other trading liabilities in category 1 are erroneously presented too low. The derivatives and
other trading liabilities have been adjusted in category 1 from 2,054 to 2,406 and in category 2 from 72,625 to
72,273. In note 5, ‘Business segments’, goodwill relating to the sale of Bouwfonds is erroneously presented in
the ‘property’ segment rather than the Retail Banking Business segment. In Note 11, ‘Loans to customers’,
the collective value adjustments effective 31 December 2012 were increased by an amount of 95, while the
specific value adjustments were reduced by the same amount.
2.1.2 Judgements and estimatesThe preparation of the financial statements requires management to make estimates and assumptions that
affect the amounts reported for assets and liabilities, the reporting of contingent assets and liabilities at the
date of the financial statements, as well as the amounts reported for income and expenses during the
reporting period. The situations that are assessed based on available financial data and information mainly
concern the determination of the fair value of assets and liabilities and impairments. Although management
based their estimates on the most careful assessment of the current circumstances and activities, the actual
results might deviate from these estimates. Due to weaker market conditions for both residential and
commercial real estate and the limited number of transactions, there is increased uncertainty regarding
property valuation (i.e. land holdings, work in progress, completed developments and property investments)
and property financing. Property valuation is subject to a number of different assumptions and valuation
methods. The use of different assumptions and methods may, due to the subjective nature involved, result in
different outcomes. These financial statements have been prepared on the basis of the going concern
assumption as there are no indications of Rabobank’s inability to continue as a going concern.
2.2 Group financial statements2.2.1 SubsidiariesThe subsidiaries and other entities (including special purpose entities over which Rabobank exercises control,
directly or indirectly) are consolidated. The assets, liabilities and results of these entities are consolidated in full.
Subsidiaries are consolidated from the date on which Rabobank obtains control, and cease to be consolidated
on the date that this control ends. All intra-group transactions, balances and unrealised gains and losses on
transactions between Rabobank Group subsidiaries are eliminated for consolidation purposes.
Internal liability (cross-guarantee system)
In accordance with the Dutch Financial Supervision Act (Wet op het financieel toezicht), various legal entities
belonging to Rabobank Group are internally liable under an intragroup mutual keep well system. Under this
system the participating entities are bound, in the event of a lack of funds of a participating entity to satisfy its
creditors, to provide the funds necessary to allow such deficient participant to satisfy its creditors.

16 Consolidated Financial Statements 2013 Rabobank Group
The participating entities are:
• The local Rabobanks of Coöperatieve Centrale Raiffeisen-Boerenleenbank B.A.;
• Coöperatieve Centrale Raiffeisen-Boerenleenbank B.A. (Rabobank Nederland), Amsterdam;
• Rabohypotheekbank N.V., Amsterdam;
• Raiffeisenhypotheekbank N.V., Amsterdam;
• Schretlen & Co N.V., Amsterdam;
• De Lage Landen International B.V., Eindhoven;
• De Lage Landen Financiering B.V., Eindhoven;
• De Lage Landen Trade Finance B.V., Eindhoven; and
• De Lage Landen Financial Services B.V., Eindhoven.
2.2.2 Joint venturesThe interests of Rabobank in entities where control is shared are consolidated proportionally. With this
method, Rabobank includes its share of the income and expenses, assets and liabilities, and cash flows of the
various joint ventures in the relevant items of its financial statements.
2.2.3 Investments in associatesInvestments in associates are recognised in accordance with the equity method. With this method,
Rabobank’s share of the profits and losses of an associate – subject to Rabobank’s accounting policies – (after
the acquisition) is recognised in profit or loss, and its share of the changes in reserves after the acquisition is
recognised in reserves. The cumulative changes after acquisition are adjusted to the cost of the investment.
Associates are entities over which Rabobank has significant influence and in which it usually holds between
20% and 50% of the voting rights but over which it does not exercise control. Unrealised gains on transactions
between Rabobank and its associates are eliminated in proportion to the size of Rabobank’s interest in the
associates. Unrealised losses are also eliminated unless the transaction indicates that an impairment loss
should be recognised on the asset transferred.
Investments by Rabobank in associates include the goodwill acquired. If Rabobank’s share in the losses of an
associate equals or exceeds its interest in the associate, Rabobank will not recognise any more losses of the
associate unless Rabobank has given undertakings or made payments on behalf of this associate.
2.3 Derivative financial instruments and hedging2.3.1 GeneralDerivative financial instruments generally comprise foreign exchange contracts, currency and interest rate
futures, forward rate agreements, currency and interest rate swaps, and currency and interest rate options
(written as well as acquired). Derivative financial instruments might be traded on an exchange or as over-the-
counter (OTC) instruments between Rabobank and a client. All derivative financial instruments are recognised
at fair value. The fair value is determined using listed market prices, prices offered by traders, cash flow
discounting models and option valuation models based on current market prices and contracted prices for
the underlying instruments, as well as the time value of money, yield curves and the volatility of the
underlying assets and liabilities. All derivative financial instruments are included under assets if their fair value
is positive and under liabilities if their fair value is negative.
Derivative financial instruments that are embedded in other financial instruments are treated separately if
their risks and characteristics are not closely related to those of the underlying derivative contract and this
contract is not classified as at fair value through profit and loss.
2.3.2 Instruments not used for hedgingIf Rabobank enters into derivatives for trading purposes, realised and unrealised gains and losses are
accounted for under ‘Income from financial assets and liabilities at fair value through profit and loss’.

17 Notes to the consolidated financial statements
2.3.3 Hedging instrumentsRabobank also uses derivative financial instruments as part of asset and liability management to manage its
interest rate risks, credit risks and foreign currency risks. Rabobank makes use of the possibilities provided by
the EU through the carve-out in IAS 39. The carve-out facilitates the application of fair value portfolio hedge
accounting to certain positions.
On the date of concluding a derivative contract, Rabobank can designate certain derivative financial
instruments as (1) a hedge of the fair value of an asset or liability in the statement of financial position
(fair value hedge), as (2) a hedge of future cash flows attributable to an asset or liability in the statement of
financial position, an expected transaction or a firm commitment (cash flow hedge), or as (3) a hedge of a net
investment in a foreign entity (net investment hedge). Hedge accounting can be applied for derivative
financial instruments designated in this manner if certain criteria are met.
The criteria derivative financial instruments must satisfy to be recognised as hedging instruments include
the following:
• formal documentation of the hedging instrument, the hedged item, the objective of the hedge, the
hedging strategy and the hedge relationship before applying hedge accounting;
• the hedge is expected to be effective (in a range of 80% to 125%) in offsetting changes in the hedged
item’s fair value or cash flows attributable to the hedged risks during the entire reporting period;
• the hedge is continuously effective from inception onwards.
Changes in the fair value of derivative financial instruments that are designated as fair value hedges and are
effective in relation to the hedged risks are recognised in profit or loss, together with the corresponding
changes in the fair value of the assets or liabilities hedged against the risks in question.
If the hedge no longer meets the criteria for hedge accounting (according to the fair value hedge model),
any adjustment to the carrying amount of a hedged interest-bearing financial instrument is amortised
through profit or loss until the end of the hedged period.
Any adjustment to the carrying amount of a hedged equity instrument is recognised as equity until disposal
of the equity instrument (net investment hedge).
Changes in the fair value of derivative financial instruments that are designated and qualify as cash flow
hedges and that are effective in relation to the hedged risks are recognised in the hedging reserve included
under ‘Equity’ (see note 10). The non-effective part of the changes in the fair values of the derivative financial
instruments is recognised in profit and loss.
If the forecast transaction or the non-current liability results in the recognition of a non-financial asset or a
non-financial liability, any deferred gain or loss included in equity is restated to the initial carrying amount
(cost) of the asset or the liability. In all other cases, deferred amounts included in equity are taken to the
statement of income and are classified as income or expenses in the periods in which the hedged non-
current liability or the forecast transaction had an effect on profit and loss.
Certain derivative contracts, although they are economic hedges in relation to the managed risk positions
taken by Rabobank, do not qualify for hedge accounting under the specific IFRS rules. These contracts are
therefore treated as derivative financial instruments held for trading.
The fair value of derivative financial instruments held for trading and hedging purposes is disclosed in note
10: ‘Derivative financial instruments and other trade liabilities’.
2.3.4 Trade LiabilitiesTrade liabilities are mainly negative fair values of derivative financial instruments and delivery obligations
arising on short selling of securities. Securities are sold short to realise gains from short-term price
fluctuations. The securities needed to settle the short selling are acquired through securities leasing or sale
and securities repurchase agreements. Securities sold short are recognised at fair value at the reporting date.
2.4 Financial assets held for tradingFinancial assets held for trading are financial assets acquired with the objective of generating profit from
short-term fluctuations in prices or traders’ margins, or financial assets that form part of portfolios
characterised by patterns of short-term profit participation.

18 Consolidated Financial Statements 2013 Rabobank Group
Financial assets held for trading are measured at fair value based on listed bid prices. All related comprehensive
income is included under ‘Income from financial assets and liabilities at fair value through profit or loss’.
Interest earned on financial assets is recognised as interest income.
Dividends received on financial assets held for trading are recognised as ‘Income from financial assets and
liabilities at fair value through profit and loss’.
All acquisitions and sales of financial assets held for trading which require delivery within a time limit
prescribed under the regulations or in accordance with market conventions are accounted for on the
transaction date.
2.5 Other financial assets and liabilities at fair value through profit or lossRabobank has opted to classify financial instruments not acquired or entered into for realising gains from
short-term fluctuations in traders’ prices or margins at fair value through profit or loss. These financial assets,
including venture capital, are carried at fair value.
Management designates financial assets and liabilities to this category upon initial recognition if any or all of
the following criteria are met:
• such a designation eliminates or substantially reduces any inconsistent treatment that would otherwise
have arisen upon measurement of the assets or liabilities or recognition of profits or losses on the basis of
different accounting policies;
• the assets and liabilities belong to a group of financial assets and/or financial liabilities that are managed
and assessed on the basis of their fair value in accordance with a documented risk management or
investment strategy;
• the financial instrument contains an embedded derivative financial instrument, unless the embedded
derivative financial instrument does not significantly affect the cash flows or if it is evident, after limited
analysis or no analysis at all, that separate recognition is not required.
Interest earned on assets with this classification is recognised as interest income and interest due on liabilities
with this classification is recognised as interest expense. Any other realised and unrealised gains and losses on
revaluation of these financial instruments at fair value are included under Income from other financial assets
and liabilities at fair value through profit or loss. All purchases and sales of other financial assets and liabilities
at fair value through profit or loss that have to be delivered within a period prescribed by regulations or
market convention are recognised at the transaction date.
2.6 Day 1 profitIf, at the time a financial instrument is entered into, valuation methods are used at fair value, a discrepancy
may arise between the transaction price and fair value. Such a discrepancy is referred to as ‘day 1 profit’.
Rabobank immediately accounts for this profit under ‘Income from financial assets and liabilities at fair value
through profit or loss’, if the valuation method is based on observable inputs (of active markets). If non-
observable inputs are used, the day 1 profit is amortised over the term of the transaction and accounted for
as ‘Other liabilities’. Profit is then taken at a subsequent stage if the financial instrument concerned has been
sold or the data entered has become visible at a later stage.
2.7 Available-for-sale financial assetsManagement determines the classification of financial assets on the date of acquisition, depending on the
purpose for which the investments are acquired.
Financial assets that are intended to be held indefinitely and that could be sold for liquidity purposes or in
response to changes in interest rates, exchange rates or share prices are classified as available for sale.
Available-for-sale financial assets are initially recognised at fair value, including transaction costs, based on
quoted bid prices or values derived from cash flow models. The fair values of unlisted equity instruments are
estimated based on appropriate price/earnings ratios, adjusted to reflect the specific circumstances of the
respective issuers. Any unrealised gains and losses from changes in the fair value of available-for-sale financial
assets are recognised in equity unless they relate to amortised interest. If such financial assets are disposed of,
the adjustments to fair value are recognised in profit and loss.

19 Notes to the consolidated financial statements
At each reporting date, management assesses whether there are objective indications of impairment of
available-for-sale assets. Examples of objective evidence for value adjustments are:
• significant financial difficulties on the part of the issuer;
• default in making interest and/or redemption payments;
• the disappearance of active markets for the financial asset caused by financial difficulties.
Equity instruments are impaired if their cost permanently exceeds their recoverable amount, i.e. their fair
value is permanently or significantly lower than their cost. The recoverable amount of investments in unlisted
equity instruments is determined using approved valuation methods, whereas the recoverable amount of
listed financial assets is determined on the basis of market value. Impairment of equity instruments is never
subsequently reversed through profit or loss.
Debt instruments are impaired if there are objective indications that the fair value has decreased to such a
degree that no reasonable assumptions can be made that the value will recover to carrying amount in the
foreseeable future.
In the event of impairment, the cumulative loss is determined by the difference between cost and current fair
value, less any previously recognised impairment transferred from the revaluation reserve in equity to profit or
loss. If the impairment of a debt instrument diminishes in a subsequent period and the diminution can be
objectively attributed to an event that occurred after the impairment, the impairment is reversed through
profit or loss.
All purchases and sales made in accordance with standard market conventions for available-for-sale financial
assets are recognised at the transaction date. All other purchases and sales are recognised at the settlement date.
2.8 Repurchase agreements and reverse repurchase agreementsFinancial assets that are sold subject to related sale and repurchase agreements are included in the financial
statements under ‘Trading financial assets’ and ‘Available-for-sale financial assets’. The liability to the
counterparty is included under Due to other banks or Due to customers, depending on the application.
Financial assets acquired under reverse sale and reverse repurchase agreements are recognised as Due from
other banks, or Loans to customers, depending on the application. The difference between the selling price
and repurchasing price is recognised as interest income or interest expense over the term of the agreement,
based on the effective interest method.
2.9 Securitisations and other derecognition constructionsRabobank securitises, sells and carries various financial assets. Those assets are sometimes sold to special
purpose entities (SPEs), which then issue securities to investors. Rabobank has the option of retaining an
interest in sold securitised financial assets in the form of subordinated interest-only strips, subordinated
securities, spread accounts, servicing rights, guarantees, put options and call options, and other constructions.
A financial asset (or a portion of it) is derecognised if:
• the rights to the cash flows from the asset expire;
• the rights to the cash flows from the asset and a substantial portion of the risks and benefits of ownership
of the asset are transferred;
• a commitment to transfer the cash flows from the asset is presumed and a substantial portion of the risks
and benefits are transferred;
• not all the economic risks and benefits are retained or transferred; however, control over the asset is transferred.
A financial liability or part thereof is derecognised if it ceases to exist, i.e. after the contractual obligation has
been fulfilled or cancelled or has expired.
If Rabobank retains control over the asset but does not retain a substantial portion of the risks and benefits,
the asset is recognised in proportion to the continuing involvement of Rabobank. A related liability is also
recognised to the extent of Rabobank’s continuing involvement. The recognition of changes in the value of
the liability corresponds to the recognition of changes in the value of the asset.
If a transaction does not meet the above conditions for derecognition, it is recognised as a loan for which
security has been provided.
20 Consolidated Financial Statements 2013 Rabobank Group
To the extent that the transfer of a financial asset does not qualify for derecognition, the transfer does not
result in Rabobank’s contractual rights being separately recognised as derivative financial instruments if
recognition of these instruments and the transferred asset, or the liability arising on the transfer, were to result
in double recognition of the same rights or obligations.
Gains and losses on securitisations and sale transactions depend partly on the previous carrying amounts of
the financial assets transferred. These are allocated to the sold and retained interests based on the relative fair
values of these interests at the date of sale. Any gains and losses are recognised through profit or loss at the
time of transfer.
The fair value of the sold and retained interests is based on quoted market prices or calculated as the present
value of the future expected cash flows, using pricing models that take into account various assumptions
such as credit losses, discount rates, yield curves, payment frequency and other factors.
Rabobank decides whether the SPE should be included in the consolidated financial statements. For this purpose,
it performs an assessment of the SPE by taking a number of factors into consideration, including the activities,
decision-making powers and the allocation of the benefits and risks associated with the activities of the SPE.
2.10 Cash and cash equivalentsCash equivalents are highly liquid short-term investments held to meet current obligations in cash, rather
than for investments or other purposes. Such investments have remaining terms of less than 90 days at
inception. Cash equivalents are readily convertible to known amounts of cash and subject to an insignificant
risk of changes in value.
2.11 Netting of financial assets and liabilitiesFinancial assets and liabilities are set off and the net amount is transferred to the statement of financial
position if a legal right to set off the recognised amounts exists and it is intended to settle the expected
future cash flows on a net basis, or to realise the asset and settle the liability simultaneously. This mainly
concerns netting of current account balances and derivative financial instruments. The set-off of taxes is
discussed in note 2.24.
2.12 Foreign currencies2.12.1 Foreign entitiesItems included in the financial statements of each entity in Rabobank Group are carried in the currency that
best reflects the economic reality of the underlying events and circumstances that are relevant for the entity
(the functional currency).
The consolidated financial statements are presented in euros, which is the parent company’s
functional currency.
Gains, losses and cash flows of foreign entities are translated into the presentation currency of Rabobank at
the exchange rates ruling at the transaction dates, which is approximately equal to the average exchange
rates. Assets and liabilities are translated at closing rates. Translation differences arising on the net investments
in foreign entities and on loans and other currency instruments designated as hedges of these investments
are recognised in equity. If a foreign entity is sold, any such translation differences are recognised in profit or
loss as part of the gain or loss on the sale.
Goodwill and fair value adjustments arising on the acquisition of a foreign entity are recognised as assets and
liabilities of the foreign entity and are translated at the closing rate.
2.12.2 Foreign-currency transactionsTransactions in foreign currencies are translated into the functional currency at the exchange rates ruling at
the transaction dates. Translation differences arising on the settlement of such transactions or on the
translation of monetary assets and liabilities denominated in foreign currencies are recognised in profit or loss.
Translation differences qualifying as net investment hedges are recognised in equity.
21 Notes to the consolidated financial statements
Translation differences on debt securities and other monetary financial assets carried at fair value are included
under foreign exchange gains and losses. Translation differences on non-monetary items such as equity
instruments held for trading are recognised as part of the fair value gains or losses. Translation differences on
available-for-sale non-monetary items are included in the revaluation reserve reported under ‘Equity’.
2.13 InterestInterest income and expense for all interest-bearing instruments is recognised in profit or loss on an accrual
basis, with the effective interest method being applied. Interest income includes coupons relating to fixed-
interest financial assets and trading financial assets, as well as the cumulative premiums and discounts on
government treasury securities and other cash equivalent instruments. If any loans suffer impairment losses,
they are written down to their recoverable amounts and the interest income recognised henceforth is based
on the original discount rate for calculating the present value of the future cash flows used to determine the
recoverable amounts. Interest income on derivative financial instruments held for trading and used as
economic hedges is presented separately under interest income.
2.14 CommissionsIncome from asset management activities consists mainly of unit trust, fund management commission and
administration. Income from asset management and insurance brokerage is recognised as earned once the
services have been provided.
Commission is generally recognised on an accrual basis. Commission received for negotiating a transaction,
or taking part in the negotiations, on behalf of third parties, for example the acquisition of a portfolio of loans,
shares or other securities, or the sale or purchase of companies, is recognised at completion of the
underlying transactions.
2.15 Loans to customers and due from other banksLoans to customers and Due from other banks are non-derivative financial instruments with fixed or defined
payments, not listed on an active market, apart from such assets that Rabobank classifies as trading, at fair
value on initial recognition with changes recognised through profit or loss, or as available for sale. Loans to
customers and receivables are initially recognised at fair value, including transaction costs, and subsequently
carried at amortised cost, including transaction costs.
Loans are subject to either individual or collective impairment analyses. A value adjustment, a provision for
expected losses on loans, is recognised if there is objective evidence that Rabobank will not be able to collect
all amounts due under the original terms of the contract. The size of the provision is the difference between
the carrying amount and the recoverable amount, which is the present value of the expected cash flows,
including amounts recoverable under guarantees and sureties, discounted at the original (average) effective
rate of interest of the loans.
The provision for loans includes losses if there is objective evidence that losses are attributable to some
portions of the loan portfolio at the reporting date.
Examples of objective evidence for value adjustments are:
• significant financial difficulties on the part of the borrower;
• default in making interest and/or redemption payments on the part of the borrower;
• loan renegotiations;
• possibility of bankruptcy of or financial reorganisation at the borrower;
• changes in borrowers’ payment status; and
• changes in economic circumstances that could cause the borrower to default.
For each separate business unit, the losses are estimated based on the credit ratings of the borrowers and the
value of the collateral provided to the bank, and taking into account the actual economic conditions under
which the borrowers conduct their activities. The carrying amount of the loans is reduced through the use of
a provision account, based on what the bank considers the most likely scenario, and the loss is taken to the
statement of income. Write-offs of provisions for expected loan losses are made as soon as the enforcement
process is completed, the security provided has been realised, when virtually no other means of recovery are
22 Consolidated Financial Statements 2013 Rabobank Group
available and in the event of a formal cancellation of a debt. Where there is virtually no perspective of the
debtor being able to continue as a going concern, a provision for expected loan losses is written off at
portfolio level, up to the amount deemed uncollectible. Any amounts subsequently collected are included
under the item ‘Value adjustments’ in the statement of income.
As soon as the prospects for continuity have recovered and arrears have been cleared as agreed, the loan is
no longer considered impaired (not fully collectible). Management continually assesses these renegotiated
loans to ensure that all criteria are satisfied with a view to expected future cash flows.
At each reporting date, management assesses whether there is objective evidence that reclassified loans
previously recognised as available-for-sale assets have been impaired. For exposures classified as corporate
exposures under CRD III, exposures are measured in accordance with the ‘one debtor’ principle. This principle
entails that the approved limit for a debtor applies to the sum of all exposures – including derivatives,
guarantees and the like – of the debtor group in which the debtor has been classified. Debtor groups include
all debtors who form part of the economic entity in which legal entities and companies are affiliated with the
same organisation. In addition, the majority shareholders also form part of the economic entity. The ‘one debtor’
principle applies across all entities; the exposures of the debtor group must be included for all group divisions.
2.16 Intangible assets2.16.1 GoodwillGoodwill is the amount by which the acquisition price paid for a subsidiary or associate exceeds the fair value
on the acquisition date of Rabobank’s share of the net assets and the contingent liabilities of the entity
acquired. Upon each acquisition, the other minority interests are recognised at fair value or at the proportion
of the identifiable assets and liabilities of the acquired entity. Impairment tests are performed annually or –
if indications so dictate – more frequently to determine whether impairment has occurred.
2.16.2 Software development costsCosts related to the development or maintenance of software are recognised as an expense at the time they
are incurred. Costs directly incurred in connection with identifiable and unique software products over which
Rabobank has control and that will probably provide economic benefits exceeding the costs for longer than
a year are recognised as intangible assets. Direct costs include the employee expenses of the software
development team, financing and an appropriate portion of the relevant overhead.
Expenditures that improve the performance of software compared with their original specifications are added
to the original cost of the software. Software development costs are recognised as assets and amortised on
a straightline basis over a period not exceeding five years.
2.16.3 Other intangible assetsOther intangible assets are mainly those identified upon business combinations. They are amortised over
their terms. Each year, Rabobank performs an impairment test based on expected future cash flows.
An impairment loss is recognised if the expected future profits do not justify the carrying amount of the asset.
2.16.4 Impairment losses on goodwillEach year, during the fourth quarter of the financial year, or more frequently if indications of impairment exist,
goodwill is tested for impairment by comparing the recoverable amount with the carrying amount. The highest
of value in use on the one hand and fair value less selling costs on the other determines the recoverable amount.
The definition of cash flow generating units depend on the type of company acquired.
The value in use of a cash flow generating unit is arrived at by determining the present value of the expected
future cash flows of the cash flow generating unit in question at the interest rate before tax.
The major assumptions used in the cash flow model depend on the input data which reflect different financial
and economic variables, such as the risk-free interest rate in a country and a premium reflecting the inherent
risk of the entity concerned. The variables are determined subject to review by management. Impairments of
goodwill are included in ‘Other income’ in the statement of income.

23 Notes to the consolidated financial statements
2.16.5 Impairment losses on other intangible assetsAt each reporting date, Rabobank assesses whether there are indications of impairment of other intangible
assets. If such indications exist, impairment testing is carried out to determine whether the carrying amount
of the other intangible assets is fully recoverable. An impairment loss is recognised if the carrying amount
exceeds the recoverable amount. Goodwill and software under development are tested for impairment each
year at the reporting date or more frequently if indications of impairment exist. Impairment losses and
reversed impairments of other intangible assets are included in ‘Other administrative expenses’ in the
statement of income.
2.17 Property and equipment2.17.1 Property and equipment for own useEquipment (for own use) is recognised at historical cost net of accumulated depreciation and impairments
if applicable. Property (for own use) represents mainly offices and is also recognised at cost less accumulated
depreciation and impairments if applicable.
Straightline deprecation is applied to these assets in accordance with the schedule below. Each asset is
depreciated to its residual value over its estimated useful life:
- Land Not depreciated
- Buildings 25 - 40 years
Equipment, including
- Computer equipment 1 - 5 years
- Other equipment and vehicles 3 - 8 years
Each year, Rabobank assesses whether there are indications of impairment of property and equipment. If the
carrying amount of an asset exceeds its estimated recoverable amount, the carrying amount is written down
immediately to the recoverable amount. Impairment losses and reversed impairments of property and
equipment are included in Other administrative expenses in the statement of income. Gains and losses on the
disposal of items of property and equipment are determined in proportion to their carrying amounts and
taken into account when determining the operating result.
Repair and maintenance work is charged to profit or loss at the time the relevant costs are incurred.
Expenditures on extending or increasing the benefits from land and buildings compared with their original
benefits are capitalised and subsequently depreciated.
2.18 Investment propertiesInvestment properties, mainly office buildings, are held for their long-term rental income and are not used by
Rabobank or its subsidiaries. Investment properties are recognised as long-term investments and included in
the statement of financial position at cost, net of accumulated depreciation and impairment. Investment
properties are depreciated over a term of 40 years.
2.19 Other assets2.19.1 Work in progressWork in progress is included in Other assets. Work in progress relates to commercial real estate projects as well
as sold and unsold housing projects under construction or planned and is carried at cost plus allocated
interest, net of provisions as necessary. Instalments invoiced to buyers and customers are deducted from work
in progress. If the balance for a project is negative (the amount of the invoiced instalments exceeds the
capitalised costs), the balance of that project is recognised as Other liabilities.
Gains and losses are recognised based on the percentage of completion method given the continuous
transfer of ownership involved. In the course of the construction work, Rabobank transfers the control and
the material risks and benefits of the ownership of the work in progress in its current state to the buyer as
construction progresses

24 Consolidated Financial Statements 2013 Rabobank Group
2.19.2 Building sites Building sites are valued at cost, including interest allocated and additional costs relating to site acquisition
and preparation. No interest is allocated for land which has no specific designation under the zoning plan,
if there is no certainty that the land will be developed. The price of land does not include the conditional
requirement which depends on a future reclassification of the land in question. For losses expected upon the
sale of the land, the book value of the site is subject to impairment.
2.20 Leasing2.20.1 Rabobank as lesseeLeases relating to property and equipment under which virtually all risks and benefits of ownership are
transferred to Rabobank are classified as finance leases. Finance leases are capitalised at the inception of the
lease at the fair value of the leased assets or at the present value of the minimum lease payments if the
present value is lower. Lease payments are apportioned between the lease liability and the finance charges,
so as to achieve a constant rate of interest on the remaining balance of the liability. The corresponding lease
liabilities are included under Other liabilities, after deduction of finance charges. The interest components of
the finance charges are recognised in profit or loss over the term of the lease. An item of property and
equipment acquired under a lease agreement is depreciated over the useful life of the asset or, if shorter, the
term of the lease.
Leases under which a considerable portion of the risks and benefits of ownership of the assets is retained by
the lessor are classified as operating leases. Operating lease payments (less any discounts by the lessor) are
charged to profit or loss on a straightline basis over the term of the lease.
2.20.2 Rabobank as lessorFinance leases
If assets are leased under a finance lease, the present value of the lease payments is recognised as a receivable
under Due from other banks or Loans to customers. The difference between the gross receivable and the
present value of the receivable is recognised as unearned finance income. Lease income is recognised as
interest income over the term of the lease using the net investment method, which results in a constant rate
of return on the investment.
Operating leases
Assets leased under operating leases are included in the statement of financial position under Property and
equipment. The assets are depreciated over their expected useful lives in line with those of comparable items
of property and equipment. Rental income (less discounts granted to lessees and write-downs) is recognised
under Other income on a straightline basis over the term of the lease.
2.21 ProvisionsProvisions are recognised if Rabobank has a present obligation (legal or constructive) as a result of a past
event, if it is probable that an outflow of resources will be required to settle the obligation and if a reliable
estimate can be made of the amount of the obligation. If Rabobank expects a provision to be reimbursed,
for example under an insurance contract, the reimbursement is recognised as a separate asset but only if the
reimbursement is virtually certain. The provisions are carried at the discounted value of the expected future
cash flows.
2.21.1 RestructuringRestructuring provisions comprise payments under redundancy schemes and other costs directly attributable
to restructuring programmes. These costs are accounted for during the period in which a legal or actual
payment obligation arises for Rabobank, a detailed plan has been prepared for redundancy pay, and there are
realistic expectations among the parties concerned that the reorganisation will be implemented.

25 Notes to the consolidated financial statements
2.21.2 Tax and legal issuesThe provision for tax and legal issues is based on the best possible estimates available at year-end, taking into
account legal and tax advice. The timing of the cash outflow of these provisions is uncertain because the
outcome of the disputes and the time involved are unpredictable.
2.21.3 Other provisionsThis item includes provisions for onerous contracts, credit guarantees and obligations under the terms of the
deposit guarantee scheme.
2.22 Employee benefitsRabobank has various pension plans in place based on the local conditions and practices of the countries
in which it operates. In general, the plans are financed by payments to insurance companies or trustee
administered funds. The payments are calculated actuarially at regular intervals. A defined benefit plan is one
that incorporates a promise to pay an amount of pension benefit, which is usually based on several factors
such as age, number of years in service and remuneration. A defined contribution plan is one in the context
of which Rabobank pays fixed contributions to a separate entity (a pension fund) and acquires no legal or
constructive obligation if the fund has insufficient assets to pay all the benefits to employee-members of the
plan in respect of service in current and past periods.
2.22.1 Pension obligationsThe obligation under the defined-benefit pension schemes is the present value of the defined-benefit
pension obligation on the balance sheet date after deduction of the fair value of fund investments.
The defined-benefit obligation is calculated annually by independent actuaries based on the projected unit
credit method. The present value of the defined-benefit obligation is determined by the estimated future
outflow of cash funds based on the interest rates of high-quality corporate bonds with terms which approach
that of the corresponding obligation. The majority of pension schemes are career-average schemes, and the
costs of these schemes – i.e. the net pension charges for the period less employee contributions and interest,
is included under ‘Staff costs’. Net interest expenses or income are calculated by applying the discount rate at
the beginning of the year for the asset or liability based on the defined-benefit pension scheme.
Actuarial gains and losses arising from actual developments or actuarial assumptions are recognised in the
consolidated statement of comprehensive income.
2.22.2 Defined contribution plansUnder defined contribution plans, Rabobank pays contributions to publicly or privately managed insured
pension plans on a compulsory, contractual or voluntary basis. Once the contributions have been made,
Rabobank has no further payment obligations. The regular contributions are net period costs for the year in
which they are due and are included on this basis under Staff costs.
2.22.3 Other post-employment obligationsSome Rabobank business units provide other post-employment benefits. To become eligible for such
benefits, the usual requirement is that the employee remains in service until retirement and has been with
the company a minimum number of years. The expected costs of these benefits are accrued during the years
of service, based on a system similar to that for defined benefit plans. The obligations are valued each year by
independent actuaries.
2.22.4 Variable remunerationThe costs of variable remuneration paid unconditionally and in cash are recognised in the year in which the
employee renders the services. The costs of conditional payments in cash are included in staff costs in the
statement of income in the period during which the employee’s services are received, which equals the
vesting period of the cash payment. The liability is recognised in other liabilities. The accounting treatment of
equity instrument-based payments is disclosed in note 2.23.

26 Consolidated Financial Statements 2013 Rabobank Group
2.23 Equity instrument-based paymentsRemuneration for services rendered by identified staff is made in the form of cash-settled payments based
on equity instruments that are similar to, and have the same characteristics as, Rabobank (Member)
Certificates. The costs of the services received are based on the awarded equity instruments’ fair value on the
award date and are recalculated annually at the value applicable at the time. The costs of the awarded equity
instruments are included in staff costs in the statement of income in the period during which the employee’s
services are received, which equals the vesting period of the equity instruments. The liability is recognised in
other liabilities.
2.24 TaxCurrent tax receivables and payables are set off if there is a legally enforceable right to set off such items and
if simultaneous treatment or settlement is intended. Deferred tax assets and liabilities are set off if there is a
legally enforceable right to set off such items and if they relate to the same tax authority and arise from the
same tax group.
Provisions are formed in full for deferred tax liabilities, using the liability method, arising from temporary
differences at the reporting date between the tax bases of assets and liabilities and their carrying amounts for
financial reporting purposes.
The main temporary differences relate to the depreciation of property and equipment, the revaluation of
certain financial assets and liabilities, including derivative financial instruments, provisions for pensions and
other post-employment benefits, provisions for loan losses and other impairment and tax losses, and, in
connection with business combinations, the fair values of the net assets acquired and their tax bases.
Deferred income tax assets and liabilities are measured at the tax rates that have been enacted or
substantively enacted at the reporting date.
Deferred tax assets are recognised to the extent that it is probable that future taxable profits will be available,
against which the temporary differences can be utilised.
Provisions are formed in respect of taxable temporary differences associated with investments in subsidiaries,
associates and interests in joint ventures, unless the timing of the reversal of the temporary differences can be
controlled and it is probable that the temporary differences will not reverse in the foreseeable future.
Taxes on profit are calculated in accordance with the tax legislation of the relevant jurisdiction and recognised
as an expense in the period in which the profit is realised. The tax effects of the carry-forward of unused tax
losses are recognised as an asset if it is probable that future taxable profits will be available against which the
losses can be utilised.
Deferred tax assets or deferred tax liabilities are included for the revaluation of available-for-sale financial
assets and cash flow hedges that are directly taken to equity. Upon realisation, they are recognised in profit
or loss together with the respective deferred gain or loss.
2.25 Due to other banks, due to customers and debt securities in issueThese borrowings are initially recognised at fair value, i.e. the issue price less directly attributable and
non-recurring transaction costs, and subsequently carried at amortised cost, including transaction costs.
If Rabobank repurchases one of its own debt instruments, it is derecognised, with the difference between
the carrying amount of a liability and the consideration paid being recognised as income or expense.
2.26 Rabobank (Member) CertificatesThe proceeds of the issue of Rabobank (Member) Certificates are available to Rabobank Group on a perpetual
basis, subordinated to all liabilities (also subordinate to the Trust Preferred Securities and the Capital Securities).
As the payment of planned distributions is fully discretionary, the proceeds of the issue of Rabobank (Member)
Certificates are recognised as equity. Accordingly, planned distributions are accounted for in the profit
appropriation.

27 Notes to the consolidated financial statements
2.27 Trust Preferred Securities and Capital SecuritiesTrust Preferred Securities, which pay a non-discretionary dividend and are redeemable on a specific date or
at the option of the holder, are classified as financial liabilities and included under Subordinated debt.
The distributions on these preferred securities are recognised in profit or loss as interest expense based on
amortised cost using the effective interest method.
The remaining Trust Preferred Securities and Capital Securities are recognised as ‘Equity’, as there is no formal
obligation to repay the principal or to pay the dividend.
2.28 Financial guaranteesFinancial guarantee contracts require that the issuer compensate the holder for a loss the latter incurs
because a specified debtor fails to meet its obligations in accordance with the terms of a debt security.
Such financial guarantees are initially measured at fair value and subsequently measured at the value of the
discounted liability under the guarantee or the higher initially measured value less the amount of previously
recognised cumulative gains or losses, thus reflecting the revenue recognition principles.
2.29 Segment informationA segment is a distinguishable component of Rabobank that engages in providing products or services and is
subject to risks and returns that are different from those of other segments. The business segments Rabobank
uses in its reporting are defined from a management viewpoint. This means they are the segments that are
reviewed as part of Rabobank’s strategic management and for the purpose of making business decisions,
and have different risks and returns. Rabobank’s primary segment reporting format is by business segment;
the secondary format is by geographical segment.
2.30 Business combinations Business combinations are accounted for on the basis of the acquisition method. The price of an acquisition
is determined as the monetary amount or equivalent agreed for the acquisition of the business combination,
if applicable plus costs directly relating to the acquisition. Goodwill represents the difference between the
price of the acquisition and Rabobank’s interest in the fair value of the assets, liabilities and conditional
liabilities acquired. Goodwill is capitalised and recognised as an intangible asset. For each business
combination, the minority interests are valued against the share of the company acquired in the identifiable
net assets. Direct acquisition costs are directly taken to the profit or loss account.
2.31 Groups of assets hived off and classified as held for sale / discontinued operationsGroups of assets which are hived off and classified as held for sale are valued at book value or, if lower, fair
value less estimated cost of sale. A group of assets (or a fixed asset) sold is classified as held for sale if the book
value will be realised primarily by means of a sales transaction as opposed to continued use. This is solely the
case if the sale is extremely likely and the group of assets (or a fixed asset) hived off is immediately available
for sale in its current condition. In addition, the management must have committed to the sale, which is
expected to be completed within one year after the time of classification as held for sale. If a group of assets
classified as held for sale represents a key business activity or key geographic region, it is classified as
discontinued operations. The latter are presented separately from comprehensive income arising from
continuing operations.
2.32 Statement of cash flowsCash and cash equivalents comprises cash resources, money market deposits and deposits at central banks.
The statement of cash flows is prepared in accordance with the indirect method of calculation and provides
details of the source of the cash and cash equivalents that became available during the year as well as their
application during the year. Operating profit before taxation in the net cash flow from operating activities is
adjusted for items in the statement of income and changes in items in the statement of financial position
which do not actually generate cash flows during the year.

28 Consolidated Financial Statements 2013 Rabobank Group
The cash flows from operating, investing and financing activities are stated separately. Changes in loans and
receivables, interbank deposits, due to customers and debt securities in issue are accounted for under cash
flows from operating activities. Investing activities relate to acquisitions and disposals and repayments on
financial investments, as well as the acquisition and disposal of subsidiaries and property and equipment.
The proceeds from the issue of and payments on Rabobank (Member) Certificates, Trust Preferred Securities,
Capital Securities, Senior Contingent Notes, Rabo Extra Member Notes and subordinated debts qualify as
financing activities. Changes on account of currency translation differences are eliminated, as are the
consolidation effects of acquisitions of associates.
The difference between the net change presented in the statement of cash flows and the change in cash and
cash equivalents presented in the statement of financial position is due to currency translation differences.
These are presented separately as part of the reconciliation between those two amounts.
3 Solvency and capital management
Rabobank wishes to have an adequate solvency position, which it manages based on a number of ratios.
The principal ratios are the core tier 1 ratio, the tier 1 ratio, the BIS ratio and the equity capital ratio.
Rabobank’s internal targets exceed the regulators’ minimum requirements as it anticipates market
expectations and developments in laws and regulations. Rabobank seeks to stand out from other financial
institutions, managing its solvency position based on policy documents. The Balance Sheet and Risk
Management Committee Rabobank Group, the Executive Board and the Supervisory Board periodically
discuss the solvency position and the targets to be used.
Rabobank must comply with a number of minimum solvency positions stipulated under the law. The solvency
position is determined based on ratios. These ratios compare Rabobank’s BIS ratio (capital ratio) and core tier 1
ratio with the total amount of the risk-weighted assets.
The minimum required percentages under the CRD III are 8% and 4% of the risk-weighted assets, respectively.
Since 1 January 2014, the minimum required percentages have been determined based on CRD/CRR IV.
This will result in a gradual increase in the minimum required percentages. Rabobank takes this into its
account in its capital planning.
The determination of the risk-weighted assets is based on separate methods for credit risk, operational risk
and market risk. The risk-weighted assets are determined for credit risk purposes in many different ways.
For most assets the risk weight is determined with reference to internal ratings and a number of
characteristics specific to the asset concerned. For off-balance sheet items the balance sheet equivalent is
calculated first, on the basis of internal conversion factors. The resulting equivalent amounts are then also
assigned risk-weightings. An Advanced Measurement Approach Model is used to determine the amount
with respect to the risk-weighted assets for operational risk. With the market risk approach, the general
market risk is hedged, as well as the risk of open positions in foreign currencies, debt and equity instruments,
as well as commodities.

29 Notes to the consolidated financial statements
The ratios displayed below are based on CRD III.
Rabobank Group’s ratios
in millions of euros 2013 2012
Retained earnings (note: 28) 28,107 27,457
Rabobank (Member) Certificates 5,823 6,672
Part of non-controlling interest treated as qualifying capital 437 402
Deductions* (5,816) (5,278)
Core tier 1 capital 28,551 29,253
Trust-Preferred Securities III to VI (note: 30) 1,269 1,340
Trust Preferred Securities II (note: 26) - 415
Capital Securities (note: 30) 7,265 7,350
Deductions* (1,993) -
Tier 1 capital 35,092 38,358
Part of reserves treated as qualifying capital (301) 138
Part of subordinated debt treated as qualifying capital 7,744 4,935
Deductions (885) (1,110)
Qualifying capital (BIS capital) 41,650 42,321
Risk-weighted assets 210,829 222,847
Core tier 1 ratio 13.5% 13.1%
Tier 1 ratio 16.6% 17.2%
BIS ratio 19.8% 19.0%
Equity capital ratio** 16.1% 15.3%
* Of the revaluation reserves – pensions relating to the defined benefit plan terminated in 2013 held by Stichting Rabobank
Pensioenfonds and by Robeco – a total of 1,089 was deducted from the core tier 1 capital and 1,993 was deducted from the
additional tier 1 capital, taking into account the adjustment provision specified in the publication Q&A Gevolgen
pensioenverslaggevingsstandaard (IAS 19 Revised) banken en beleggingsondernemingen in 2013 (‘Q&A regarding the
impact of the pension reporting standard (IAS 19 Revised) on banks and investment institutions in 2013’), published by the
Dutch Central Bank. If the same system had been applied with effect from 30 June 2013, the core tier 1 ratio would reach
13.0% (up from 12.9%), the tier 1 ratio would come to 16.1% (down from 16.9%) and the BIS ratio was 17.9% (down from
18.7%). At 1 January 2014, both amounts were deducted from the core tier 1 capital.
** The equity capital ratio is calculated by relating the ‘Retained earnings’ and ‘Rabobank (Member) Certificates’ to the risk-
weighted assets.
4 Risk exposure of financial instruments
4.1 Risk governanceRabobank Group manages risks at various levels. At the highest level, the Executive Board determines the risk
strategy it will pursue, the policy framework as well as the limits, under the supervision of the Supervisory
Board and on the recommendation of the Rabobank Group Balance Sheet and Risk Management Committee
and Rabobank Group Credit Management Committee. The Supervisory Board regularly assesses the risks
attached to the activities and portfolio of Rabobank Group. The Chief Financial Officer, who is also a member
of the Executive Board, is responsible for the risk management policy within Rabobank Group. Responsibility
for the risk policy within Rabobank Group is spread across two directorates. Group Risk Management is in
charge of the policies for interest rate, market, liquidity, currency and operational risks, as well as for the policy
for credit risks at portfolio level. Credit Risk Management is responsible for the credit risk acceptance policy at
item level. Furthermore, the group entities practice independent risk management.

30 Consolidated Financial Statements 2013 Rabobank Group
4.1.1 Risk appetiteIdentifying and managing risk for its organisation is an ongoing process at Rabobank. It uses an integrated risk
management strategy for this purpose. The risk management cycle includes determining risk appetite,
preparing integrated risk analyses, and measuring and monitoring risk. Throughout this process, Rabobank
uses a risk strategy aimed at continuity and designed to protect profit, maintain solid balance-sheet ratios and
protect identity and reputation.
4.2 Strategy for the use of financial instrumentsRabobank’s activities are inherently related to the use of financial instruments, including derivative financial
instruments. Rabobank accepts deposits from clients at fixed and variable rates of interest for a variety of
terms and aims to earn above average interest margins on these deposits by investing them in high-quality
assets. Rabobank also aims to increase these margins by consolidating short funds and loans for longer terms
at higher interest rates, at the same time keeping sufficient cash resources to meet all payments that might
become due.
A further objective of Rabobank is to increase its interest rate result by obtaining above-average margins, after
deduction of provisions, and by granting loans to commercial and retail borrowers with various credit ratings.
These risks apply not only to loans recognised in the statement of financial position; Rabobank also gives
guarantees, such as letters of credit and performance and other guarantee documents.
Rabobank also trades in financial instruments when it takes positions in tradable and unlisted instruments
(OTCs), including derivative financial instruments, in order to profit from short-term movements on the share
and bond markets and in exchange rates, interest rates and commodity prices.
4.3 Interest-rate riskInterest-rate risk is defined as the risk that the financial results and/or economic value listed in the bank book,
given the balance-sheet composition, is negatively affected by movements in the money-market and capital-
market interest rates.
Accepting a certain amount of interest-rate risk is a fundamental part of banking and can potentially be a
significant source of profit and value creation. The Rabobank Executive Board is responsible for determining
risk appetite, along with the following limits for the two key indicators:
• Equity at risk, duration of equity; and
• Income at Risk, the interest sensitivity analysis whereby a gradual increase or decrease is assumed for the
12 months ahead.
Interest-rate risk at Rabobank is based on the differences in the terms between loans and funds, option risk,
basis risk and yield curve risk. Any interest-rate risk to which customers are exposed on account of an increase
in their liabilities due to interest-rate changes does not affect Rabobank’s interest rate position. Any negative
effects arising from this are regarded as credit risk.
Interest-rate risk is managed by the Rabobank Group Balance Sheet and Risk Management Committee, which
is chaired by the CFRO. The decisions taken by this committee are implemented by the Central Treasury,
with Group Risk Management being responsible for measurement and reporting.
Rabobank’s interest-rate risk derives mainly from mortgages provided and business loans with long fixed-
interest terms. These payments are financed by the savings business, from funds held in customers’ current
accounts and other current accounts and external professional funding. Interest-rate risk is measured not only
based on contractually specified data; Rabobank also factors in customer behaviour in the internal interest-rate
risk model used. The definition used for managing interest-rate risk varies from the IFRS definition of equity.
For interest-rate risk management, the economic value of equity is defined as the present value of the assets
less the present value of the liabilities plus the present value of the off-balance-sheet items. Through the use
of hedge accounting and due to the fact that a large portion of the balance sheet is stated at amortised cost
(in IFRS terms) and therefore does not change in value, the effects of the calculated value changes on IFRS
capital will be largely restricted to an impact on interest income.
Changes in income at risk and equity at risk are detailed on the next page.
31 Notes to the consolidated financial statements
4.3.1 Income-at-riskThe income-at-risk is calculated each month based on a standard interest-rate sensitivity analysis. The latter
shows the effect on interest profit of a gradual, parallel interest rate decrease and increase by 200 basis points
in the coming 12 months in relation to the scenario in which market interest rates and other rates remain
unchanged. The income-at-risk is equal to the most negative effect on interest income. Rabobank was
sensitive to interest rate decreases throughout 2013. The maximum income-at-risk was -54 during 2013 and
-50 at year-end 2013. This low position results from the internal assumption that interest rates cannot fall
below 0%. At year-end 2013, the estimated decrease was 5 basis points lower than at year-end 2012. This was
because the higher money-market interest rate facilitates a parallel decline of 10 basis points without interest
rates falling below zero. The effects on interest income may be greater for non-parallel interest-rate changes.
Income at risk
in millions of euros 31 Dec 2013 31 Dec 2012
10 bp decline 5 bp decline
1-12 months (50) (18)
4.3.2 Equity-at-riskThe equity-at-risk of duration expresses the percentage by which the economic value of equity decreases if
the yield curve increases in parallel by 1%. The Executive Board has set 0% as the lower limit and 10% as the
upper limit. The Balance Sheet and Risk Management Committee applies additional limits for the basis point
sensitivity of equity and the delta profile of equity. The equity at risk increased from 1.4% to 2.3% during 2013.
The interest-rate risk position within the business has hardly increased due to the low number of new
mortgages and business loans combined with an increase in the number of bank savings products with a
long interest-rate term. The effects on interest income may be greater for non-parallel interest-rate changes.
Equity at risk
31 Dec 2013 31 Dec 2012
2.3% 1.4%
Supplementing the monthly interest rate sensitivity assessments, regular analyses are performed that
calculate the impact of one or more macroeconomic scenarios on net interest income. The results of these
scenario analyses are important for integral interest rate risk management purposes and are included in
reports to the Rabobank Group Balance Sheet and Risk Management Committee.
4.4 Credit riskCredit risk is the risk that a counterparty is unable to meet a financial or other contractual obligation vis-à-vis
the bank. Credit risk is inherent to granting loans. Positions in tradable assets such as bonds and shares are
also subject to credit risk.
Rabobank restricts its credit risk exposure by setting limits for loans to an individual counterparty, or a group
of counterparties, as well as for loans to countries. The four-eyes principle is a key factor when granting loans.
A multi-level committee structure is in place to make decisions on major loan applications, with the
competent committee being chosen based on the size of the loan. Decisions on the largest loans are made
directly by the Executive Board.
The credit risk exposure relating to each individual borrower is further restricted by the use of sub-limits to
hedge amounts at risk, not all of which are disclosed in the statement of financial position, and the use of
daily delivery risk limits for trading items such as forward currency contracts. Most actual risks are assessed
daily against the limits.
Once a loan has been granted, it is continually subject to credit management as part of which new
information – financial and other – is reviewed. Credit limits are adjusted where necessary. Rabobank obtains
collateral or guarantees for the majority of the loans.

32 Consolidated Financial Statements 2013 Rabobank Group
4.4.1 Maximum credit riskThe table below sets out the maximum credit risk to which Rabobank is subject at the reporting date in
respect of the various categories, without taking into account any collateral or other measures for restricting
credit risk. It also shows the financial effect of any collateral provided or other types of credit risk reduction.
In some cases the amounts following deviate from the carrying amounts, since the outstanding equity
instruments are not included in the maximum credit risk.
Maximum gross credit risk Credit risk reduction
in millions of euros 2013 2012 2013 2012
Cash and cash equivalents 43,039 68,103 0% 0%
Due from other banks 40,844 35,386 56% 43%
Derivative financial instruments 39,703 65,423 92% 89%
Loans to customers 460,202 485,299 79% 80%
Available-for-sale financial assets 45,594 49,908 8% 7%
Subtotal 629,382 704,119 67% 64%
Credit related and contingent liabilities 49,556 53,548 15% 17%
Total 679,938 757,667 64% 61%
4.4.2 LoansRabobank has a significant market share in private sector lending; these loans to private customers account
for 49% of all loans to customers. These loans have a very low risk profile as evidenced by the actual losses
incurred in previous years, which were below 5 basis points and have edged up to 6 basis points.
The proportion of the total loan portfolio attributable to the food and agri sector was 20% in 2013.
The proportion of the total loan portfolio attributable to trade, industry and services was 31% at year-end 2013.
Loans to trade, industry and services and loans to the food and agri sector are both spread over a wide range
of industries in many different countries. None of these shares represents more than 10% of the total client
loan portfolio.
in millions of euros 2013 2012
Total loans to customers 460,202 485,299
Of which: to government clients 2,670 3,764
reverse repurchase transactions and securities borrowing agreements 10,697 11,410
interest rate hedges (hedge accounting) 7,860 12,034
Private sector lending 438,975 458,091
This can be broken down geographically as follows:The Netherlands 335,046 77% 341,614 75%
Rest of Europe 26,972 6% 35,737 8%
North America 40,853 9% 42,010 9%
Latin America 10,635 2% 11,414 2%
Asia 6,631 2% 6,284 1%
Australia 18,698 4% 20,812 5%
Africa 140 0% 220 0%
Total 438,975 100% 458,091 100%
Breakdown of loans by business sectorPrivate individuals 216,351 49% 220,029 48%
Trade, industry and services 135,648 31% 145,626 32%
Food and agri 86,976 20% 92,436 20%
Total 438,975 100% 458,091 100%
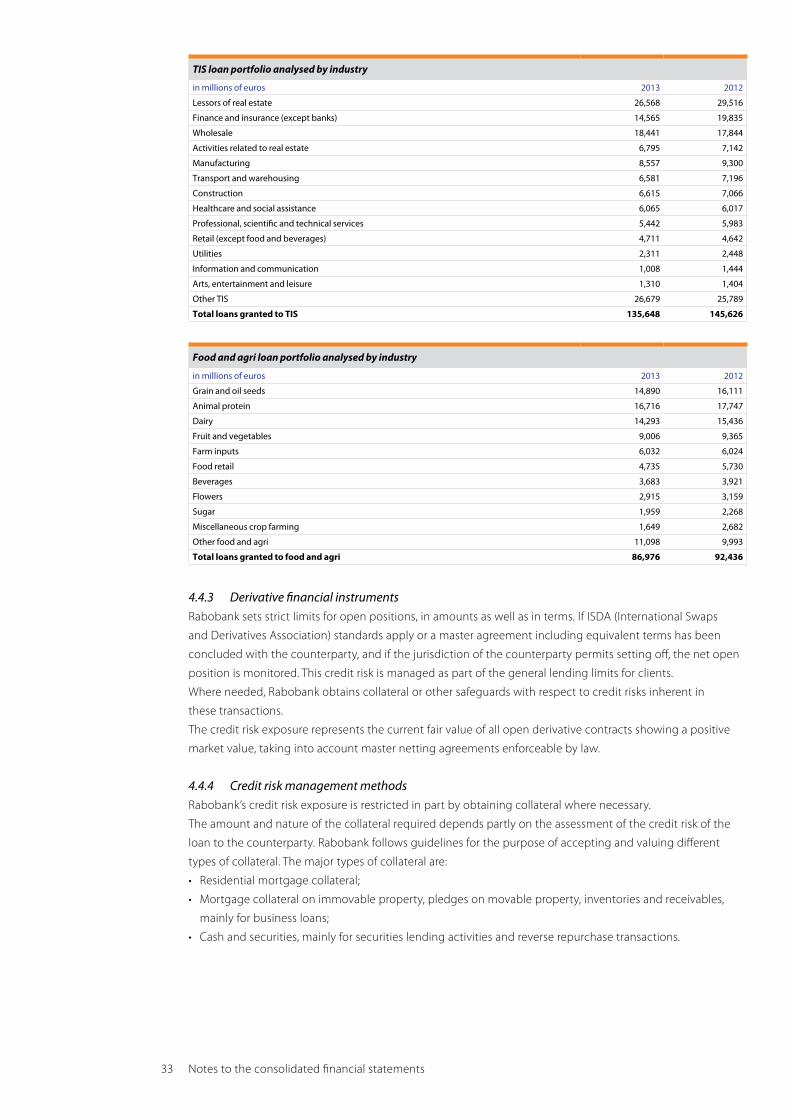
33 Notes to the consolidated financial statements
TIS loan portfolio analysed by industry
in millions of euros 2013 2012
Lessors of real estate 26,568 29,516
Finance and insurance (except banks) 14,565 19,835
Wholesale 18,441 17,844
Activities related to real estate 6,795 7,142
Manufacturing 8,557 9,300
Transport and warehousing 6,581 7,196
Construction 6,615 7,066
Healthcare and social assistance 6,065 6,017
Professional, scientific and technical services 5,442 5,983
Retail (except food and beverages) 4,711 4,642
Utilities 2,311 2,448
Information and communication 1,008 1,444
Arts, entertainment and leisure 1,310 1,404
Other TIS 26,679 25,789
Total loans granted to TIS 135,648 145,626
Food and agri loan portfolio analysed by industry
in millions of euros 2013 2012
Grain and oil seeds 14,890 16,111
Animal protein 16,716 17,747
Dairy 14,293 15,436
Fruit and vegetables 9,006 9,365
Farm inputs 6,032 6,024
Food retail 4,735 5,730
Beverages 3,683 3,921
Flowers 2,915 3,159
Sugar 1,959 2,268
Miscellaneous crop farming 1,649 2,682
Other food and agri 11,098 9,993
Total loans granted to food and agri 86,976 92,436
4.4.3 Derivative financial instrumentsRabobank sets strict limits for open positions, in amounts as well as in terms. If ISDA (International Swaps
and Derivatives Association) standards apply or a master agreement including equivalent terms has been
concluded with the counterparty, and if the jurisdiction of the counterparty permits setting off, the net open
position is monitored. This credit risk is managed as part of the general lending limits for clients.
Where needed, Rabobank obtains collateral or other safeguards with respect to credit risks inherent in
these transactions.
The credit risk exposure represents the current fair value of all open derivative contracts showing a positive
market value, taking into account master netting agreements enforceable by law.
4.4.4 Credit risk management methodsRabobank’s credit risk exposure is restricted in part by obtaining collateral where necessary.
The amount and nature of the collateral required depends partly on the assessment of the credit risk of the
loan to the counterparty. Rabobank follows guidelines for the purpose of accepting and valuing different
types of collateral. The major types of collateral are:
• Residential mortgage collateral;
• Mortgage collateral on immovable property, pledges on movable property, inventories and receivables,
mainly for business loans;
• Cash and securities, mainly for securities lending activities and reverse repurchase transactions.

34 Consolidated Financial Statements 2013 Rabobank Group
The management monitors the market value of collateral obtained and requires additional collateral where
necessary. Rabobank also uses credit derivative financial instruments to manage credit risks. Rabobank further
limits its exposure to credit risk by entering into master netting arrangements with counterparties for a
significant volume of transactions. In general, master netting arrangements do not lead to the setting off of
assets and liabilities included in the statement of financial position, as transactions are usually settled gross.
The credit risk is limited by master netting arrangements, however, to the extent that, if an event or
cancellation occurs, all amounts involving the counterparty are frozen and settled net. The total credit risk
exposure of Rabobank from derivative financial instruments to which netting arrangements apply is highly
sensitive to the closing of new transactions, lapsing of existing transactions and fluctuations in market interest
and exchange rates.
The table below shows offsets which have been applied in the consolidated balance sheet (IAS 32 Offsetting)
and offsets which have not been applied in the consolidated balance sheet. The remaining offsets consist of
securities Rabobank has received from reverse buyback transactions and securities Rabobank has provided in
relation to buyback transaction loans.
Offsetting of financial instruments
in millions of euros Gross book value IAS 32 Offsetting
Net book value included in
balance sheetMaster netting
agreementsOther
offsettingNet value after
other offsetting
At 31 December 2013
Due from other banks 41,843 (999) 40,844 - (23,277) 17,567
Other financial liabilities at fair value through profit and loss 4,971 - 4,971 - - 4,971
Derivative financial instruments 66,836 (27,133) 39,703 (30,492) - 9,211
Loans to customers 478,294 (18,092) 460,202 - (11,265) 448,937
Other assets 9,175 (370) 8,805 - - 8,805
Total 601,119 (46,594) 554,525 (30,492) (34,542) 489,491
Due to other banks 18,135 (2,639) 15,496 - (904) 14,592
Due to customers 341,292 (11,892) 329,400 - (1,636) 327,764
Derivative financial instruments 80,406 (31,693) 48,713 (30,492) - 18,221
Other debts 7,806 (370) 7,436 - - 7,436
Total 447,639 (46,594) 401,045 (30,492) (2,540) 368,013
At 31 December 2012
Due from other banks 37,029 (1,643) 35,386 - (17,397) 17,989
Other financial liabilities at fair value through profit and loss 5,915 (4) 5,911 - - 5,911
Derivative financial instruments 98,650 (33,227) 65,423 (50,896) - 14,527
Loans to customers 515,468 (30,169) 485,299 - (12,085) 473,214
Other assets 10,353 (590) 9,763 - - 9,763
Total 667,425 (65,633) 601,782 (50,896) (29,482) 521,404
Due to other banks 30,443 (3,384) 27,059 - (1,473) 25,586
Due to customers 356,012 (21,741) 334,271 - (2,872) 331,399
Derivative financial instruments 113,155 (39,918) 73,237 (50,896) - 22,341
Other debts 11,756 (590) 11,166 - - 11,166
Total 511,366 (65,633) 445,733 (50,896) (4,345) 390,492

35 Notes to the consolidated financial statements
4.4.5 Off-balance-sheet financial instrumentsThe guarantees and standby letters of credit which Rabobank provides to third parties in the event a client
cannot fulfil its obligations vis-à-vis these third parties, are exposed to credit risk.
Documentary and commercial letters of credit and written undertakings by Rabobank on behalf of clients
authorise third parties to draw bills against Rabobank up to a present amount subject to specific conditions.
These transactions are backed by the delivery of the underlying goods to which they relate. Accordingly,
the risk exposure of such an instrument is less than that of a direct loan.
Obligations to grant loans at specific rates of interest during a fixed period of time are recognised under credit
granting liabilities and accounted for as such unless these commitments do not extend beyond the period
expected to be needed to perform appropriate underwriting, in which case they are considered to be
transactions conforming to standard market conventions. Rabobank is exposed to credit risk when it promises
to grant lending facilities. The size of such losses is less than the total of the unused commitments, as
promises to grant credit facilities are made subject to the clients meeting certain conditions that apply to
loans. Rabobank monitors the term to expiry of credit promises, as long-term commitments are generally
associated with a higher risk than short-term commitments.
4.4.6 Credit quality of financial assetsIn its financing approval process, Rabobank Group uses the Rabobank Risk Rating, which reflects the
counterparty’s probability of default (PD) over a one-year period. The table below sets out the credit quality
(after deduction of the provision for doubtful debts) of the loan-related items in the statement of financial
position. The ‘credit quality’ categories are determined based on the internal Rabobank Risk Rating.
The Rabobank Risk Rating consists of 21 performing ratings and four default ratings. The latter constitute the
total impaired exposure. The ‘vulnerable’ category consists of performance ratings which have been cancelled
but which have not undergone impairment.
Credit quality of financial assets
in millions of euros(Virtually)
no riskAdequate to
good Vulnerable Impaired Total
At 31 December 2013
Due from other banks 26,799 14,041 - 4 40,844
Loans to customersLoans to government clients 1,612 933 1 - 2,546
Loans to private clients:
- overdrafts 984 13,368 934 1,788 17,074
- mortgages 51,071 163,548 3,177 1,588 219,384
- leases 1,019 18,397 1,538 562 21,516
- reverse repurchase transactions and securities borrowing agreements 4,450 6,247 - - 10,697
- corporate loans 19,916 151,011 4,572 4,902 180,401
- other 962 7,358 110 154 8,584
Total 106,813 374,903 10,332 8,998 501,046
At 31 December 2012
Due from other banks 25,242 10,137 - 7 35,386
Loans to customersLoans to government clients 2,621 1,140 2 1 3,764
Loans to private clients:
- overdrafts 650 11,334 1,293 1,433 14,710
- mortgages 69,214 147,797 3,416 1,052 221,479
- leases 1,410 18,290 1,519 745 21,964
- reverse repurchase transactions and securities borrowing agreements 3,778 7,632 - - 11,410
- corporate loans 24,256 164,651 6,391 4,393 199,691
- other 1,214 10,730 153 184 12,281
Total 128,385 371,711 12,774 7,815 520,685

36 Consolidated Financial Statements 2013 Rabobank Group
The table below gives an age analysis of financial assets expired (overdue) but unimpaired.
Age analysis
in millions of euros < 30 days 30 to 60 days 61 to 90 days > 90 days Total
At 31 December 2013
Due from other banks - - - - -
Loans to customersLoans to government clients 1 - - - 1
Loans to private clients:
- overdrafts 594 264 67 9 934
- mortgages 2,057 683 356 81 3,177
- leases 1,042 289 206 1 1,538
- reverse repurchase transactions and securities borrowing agreements - - - - -
- corporate loans 3,187 907 362 116 4,572
- other 84 20 6 - 110
Total 6,965 2,163 997 207 10,332
At 31 December 2012
Due from other banks - - - - -
Loans to customersLoans to government clients 2 - - - 2
Loans to private clients:
- overdrafts 865 338 75 15 1,293
- mortgages 2,271 743 347 55 3,416
- leases 988 290 240 1 1,519
- reverse repurchase transactions and securities borrowing agreements - - - - -
- corporate loans 4,455 1,203 448 285 6,391
- other 103 26 22 2 153
Total 8,684 2,600 1,132 358 12,774
4.4.7 Clemency (forbearance)As part of its role as a relationship bank, Rabobank attempts to prevent potential default by its customers
through effective credit management and periodic meetings with its customers, as well as by taking measures
in a timely manner. If customers, despite these efforts, do run into difficulties, Rabobank – provided there is a
potential for continuation in the long term, will attempt to restructure the loan instead of using the security.
These measures – known as ‘forbearance’ measures – represent concessions by the bank to customers who
are unable to meet their current payment obligations to the bank due to financial difficulties.
Rabobank has developed policies that will enable it to report its forbearance portfolio on a quarterly basis
starting at the end of 2014, in accordance with the EBA requirements. If new agreements made with
customers are classified as forbearance, this will result in additional measures, including classification as a
classified loan. It should be noted here that the ‘vulnerable continuity’ classification includes both performing
and non-performing loans. If forbearance measures are permitted, the loan will, as a rule, be managed by
Rabobank Special Administration.
The new regulations require a great deal of effort in terms of facilitating the detailed documentation of these
measures in the reporting systems. If debtors return to regular continuity again, they are reported as part of
the forbearance portfolio up to two years following the recovery date.
4.4.8 Country risk on GIIPS countries Rabobank Group’s exposure to government bonds issued by Spain, Ireland and Italy was 174 (2012: 202) at
31 December 2013. Rabobank no longer holds any government bonds issued by the other GIIPS countries.
The exposure to bonds issued by financial institutions chiefly concern Spanish secured bonds. The issuing
institution has provided additional collateral. The total nominal exposure to the bonds is 1,671 (2012: 1,795).

37 Notes to the consolidated financial statements
in millions of eurosGovernment
bondsState-guaranteed
bonds Bonds issued by
financial institutions TotalCumulative adjustments
charged to profit and loss
Country
At 31 December 2013
Greece
Loans - 42 - 42 8
Ireland
Available-for-sale financial assets 6 - 41 47 -
Italy
Loans - - 47 47 -
Available-for-sale financial assets 59 - 5 64 -
Financial assets at fair value through profit or loss 65 - - 65 -
Spain
Loans - - 98 98 -
Available-for-sale financial assets - - 1,292 1,292 6
Financial assets at fair value through profit or loss 44 - - 44 -
Total 174 42 1,483 1,699 14
in millions of eurosGovernment
bondsState-guaranteed
bonds Bonds issued by
financial institutions TotalCumulative adjustments
charged to profit and loss
Country
At 31 December 2012
Greece
Loans - 24 - 24 47
Ireland
Available-for-sale financial assets 6 - 41 47 -
Financial assets at fair value through profit or loss 48 - - 48 -
Italy
Loans - - 46 46 -
Available-for-sale financial assets 56 - 10 66 -
Financial assets at fair value through profit or loss 92 - - 92 -
Spain -
Loans - - 178 178 -
Available-for-sale financial assets - - 1,158 1,158 67
Financial assets at fair value through profit or loss - - 3 3 -
Total 202 24 1,436 1,662 114
Based on the accounting policies applied, it has been established with respect to the Greek exposures,
as well a number of bonds issued by financial institutions, that impairment losses need to be recognised;
these positions have been impaired to their fair market value at 31 December 2013. The average valuation
of the Greek government bonds and state-guaranteed bonds at 31 December 2013 was 84% (2012: 34%).
Exposure to European government bonds other than Dutch, German and French is extremely limited.
4.4.9 Developments in real estate portfolioRabobank’s commercial real estate portfolio in the Netherlands is managed primarily by FGH Bank and the
local Rabobanks.
Market conditions affect the quality of the loan portfolio in commercial real estate. The value of properties is
declining in the current market conditions, with the value of less marketable property and property in non-
prime locations, in particular, having been on a downward spiral. The revision and valuation policy, along with
– especially – the management policy, all show a risk-oriented approach. If this audit shows that the value
used is no longer in accordance with the actual market value, the property or properties is/are revalued.
Valuations are performed by an independent appraiser. In pursuing this course of action, Rabobank complies
with the more stringent requirements set by the Dutch Central Bank, based on market conditions,
for valuation and the age of valuations.

38 Consolidated Financial Statements 2013 Rabobank Group
The Dutch commercial real estate portfolio is managed with extra attention within Rabobank Group.
The Commercial Real Estate Task Force, which was set up for this purpose in mid-2010, regularly reports to
the Executive Board on the development of both the size and the risk level of the Dutch portfolio, and will
continue to monitor market trends and portfolio movements closely in the coming years. Rabobank has
tightened its financing, revision and valuation policies in recent years.
Prompted by the alarming trends in commercial real estate described above, the Dutch Central Bank
conducted an Asset Quality Review in 2013 among the largest banks in the Netherlands, in order to assess
whether they maintain sufficient capital and provisions for financing in this sector. At Rabobank, virtually the
entire commercial real estate loan portfolio was included in the scope. The resulting recommendations have
since been implemented. In addition, a test was conducted on the internal models used to determine how
much capital must be maintained to cover unexpected losses. The conclusion was that Rabobank maintains
sufficient Pillar-1 capital for this portfolio.
With regard to the provisions, Rabobank – particularly in the second half of the year – made substantial
additions as a result of the portfolio’s deteriorating quality. Rabobank Group endorses the intentions of the
Platform of Appraisers and Auditors (PTA) in order to improve the level of professionalism, quality, and
transparency in relation to determining property values. Rabobank notes that it already largely complied with
the recommendations set out in the report issued by the PTA, to the extent this was relevant to valuations in
the banking process. Where this was not yet the case, Rabobank has brought its valuation process in line with
the PTA’s recommendations.
The table below shows several data relating to the commercial real estate loan portfolio in the Netherlands at
31 December 2013. The Property Development sector is displayed separately, as this sector has also been
affected by longer lead times and a sluggish property market. At a total amount of EUR 3 billion, Rabobank’s
lending in this sub-sector has been modest; however, it should be noted that the risk costs associated with
this portfolio are significantly higher than for the Investment Property portfolio.
in millions of euros Loan portfolioImpaired portfolio Provisions
Value adjustments
Amounts charged to the provisions
At 31 December 2013
Investment property of domestic retail banking business 9,910 1,104 516 144 35
Investment property of Rabo Real Estate Group (FGH Bank) 14,446 2,410 788 485 23
Total investment property 24,356 3,514 1,304 629 58
Property development of domestic retail banking business 1,942 793 396 168 48
Property development of Rabo Real Estate Group (FGH Bank) 1,041 357 30 29 11
Total property development 2,983 1,150 426 197 59
in millions of euros Loan portfolioImpaired portfolio Provisions
Value adjustments
Amounts charged to the provisions
At 31 December 2012
Investment property of domestic retail banking business 10,346 908 389 103 14
Investment property of Rabo Real Estate Group (FGH Bank) 15,524 1,476 339 223 64
Total investment property 25,870 2,384 728 326 78
Property development of domestic retail banking business 2,135 595 255 112 39
Property development of Rabo Real Estate Group (FGH Bank) 978 49 14 9 3
Total property development 3,113 644 269 121 42
Rabobank’s domestic property portfolio was further reduced in 2013 as a result of redemptions and lower risk
appetite. Market trends diminish the quality of the portfolio, which is reflected in a larger number of impaired
loans and, by extension, the higher cost of bad debt provisions in recent years. One key mitigating factor
determining the quality of the loan portfolio is that Rabobank places a premium on relationship banking and
its financing policy is more customer-driven than property-driven. If the current market trends persist,
Rabobank expects credit losses in the property portfolio to remain high in the coming years.
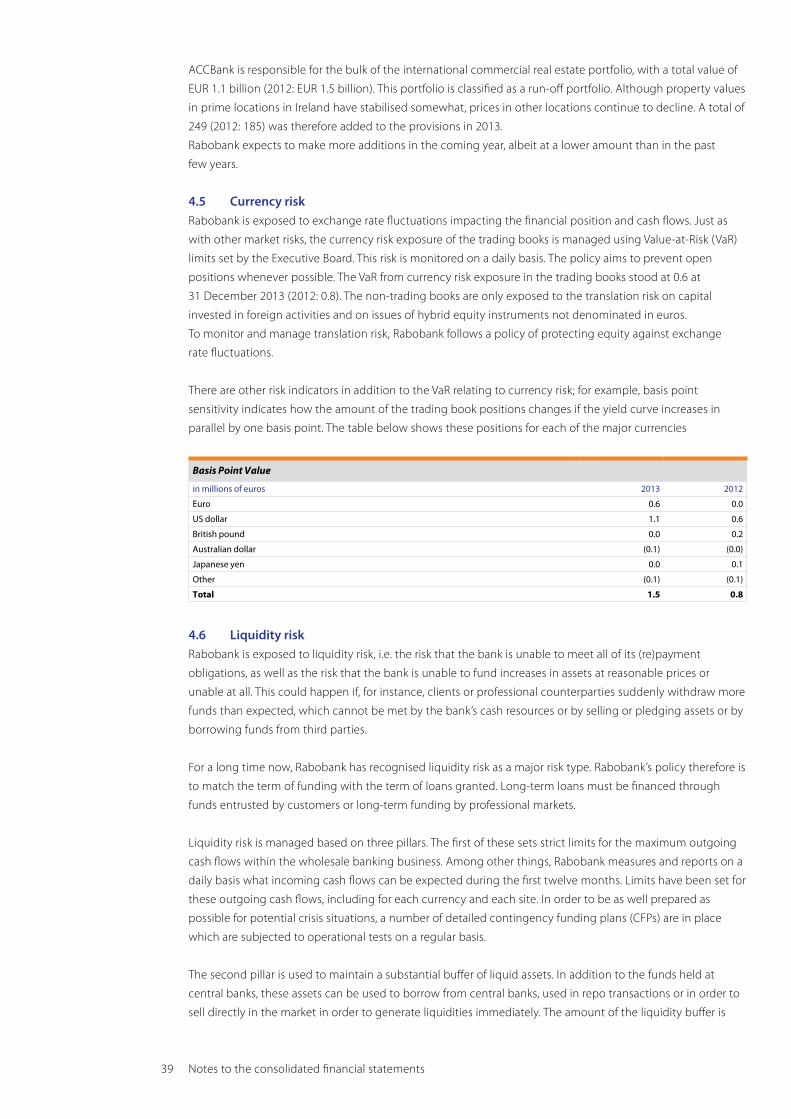
39 Notes to the consolidated financial statements
ACCBank is responsible for the bulk of the international commercial real estate portfolio, with a total value of
EUR 1.1 billion (2012: EUR 1.5 billion). This portfolio is classified as a run-off portfolio. Although property values
in prime locations in Ireland have stabilised somewhat, prices in other locations continue to decline. A total of
249 (2012: 185) was therefore added to the provisions in 2013.
Rabobank expects to make more additions in the coming year, albeit at a lower amount than in the past
few years.
4.5 Currency riskRabobank is exposed to exchange rate fluctuations impacting the financial position and cash flows. Just as
with other market risks, the currency risk exposure of the trading books is managed using Value-at-Risk (VaR)
limits set by the Executive Board. This risk is monitored on a daily basis. The policy aims to prevent open
positions whenever possible. The VaR from currency risk exposure in the trading books stood at 0.6 at
31 December 2013 (2012: 0.8). The non-trading books are only exposed to the translation risk on capital
invested in foreign activities and on issues of hybrid equity instruments not denominated in euros.
To monitor and manage translation risk, Rabobank follows a policy of protecting equity against exchange
rate fluctuations.
There are other risk indicators in addition to the VaR relating to currency risk; for example, basis point
sensitivity indicates how the amount of the trading book positions changes if the yield curve increases in
parallel by one basis point. The table below shows these positions for each of the major currencies
Basis Point Value
in millions of euros 2013 2012
Euro 0.6 0.0
US dollar 1.1 0.6
British pound 0.0 0.2
Australian dollar (0.1) (0.0)
Japanese yen 0.0 0.1
Other (0.1) (0.1)
Total 1.5 0.8
4.6 Liquidity riskRabobank is exposed to liquidity risk, i.e. the risk that the bank is unable to meet all of its (re)payment
obligations, as well as the risk that the bank is unable to fund increases in assets at reasonable prices or
unable at all. This could happen if, for instance, clients or professional counterparties suddenly withdraw more
funds than expected, which cannot be met by the bank’s cash resources or by selling or pledging assets or by
borrowing funds from third parties.
For a long time now, Rabobank has recognised liquidity risk as a major risk type. Rabobank’s policy therefore is
to match the term of funding with the term of loans granted. Long-term loans must be financed through
funds entrusted by customers or long-term funding by professional markets.
Liquidity risk is managed based on three pillars. The first of these sets strict limits for the maximum outgoing
cash flows within the wholesale banking business. Among other things, Rabobank measures and reports on a
daily basis what incoming cash flows can be expected during the first twelve months. Limits have been set for
these outgoing cash flows, including for each currency and each site. In order to be as well prepared as
possible for potential crisis situations, a number of detailed contingency funding plans (CFPs) are in place
which are subjected to operational tests on a regular basis.
The second pillar is used to maintain a substantial buffer of liquid assets. In addition to the funds held at
central banks, these assets can be used to borrow from central banks, used in repo transactions or in order to
sell directly in the market in order to generate liquidities immediately. The amount of the liquidity buffer is
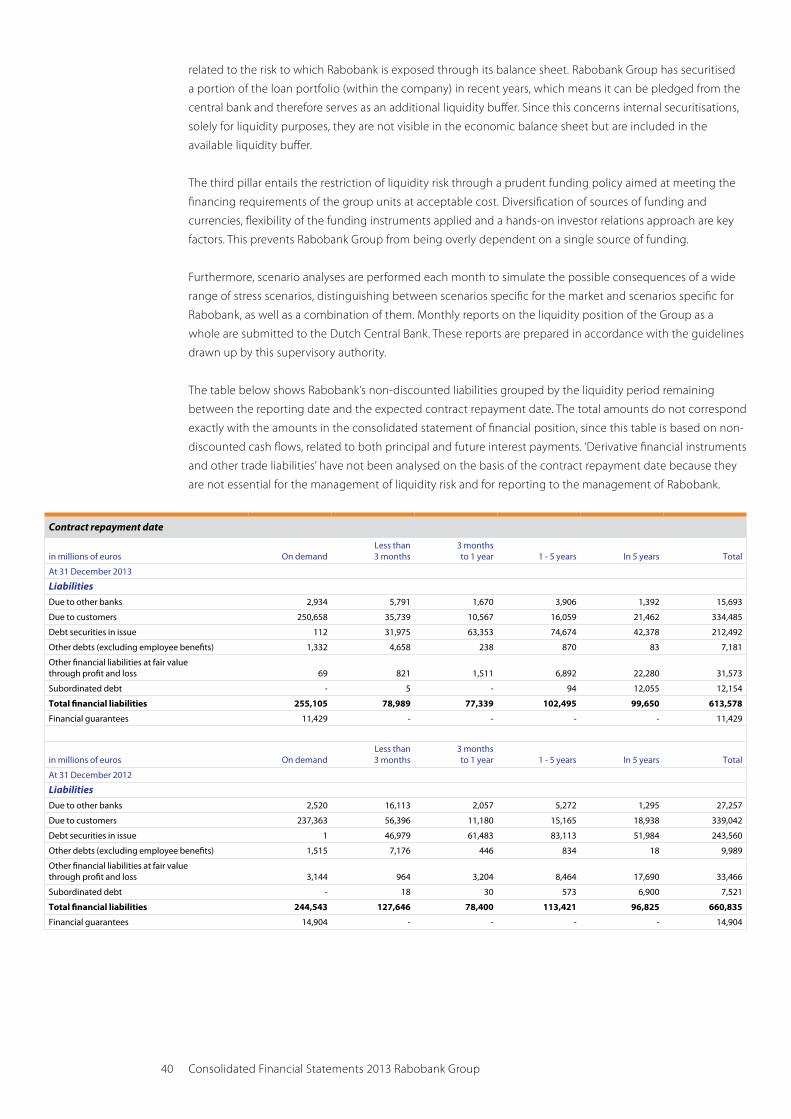
40 Consolidated Financial Statements 2013 Rabobank Group
related to the risk to which Rabobank is exposed through its balance sheet. Rabobank Group has securitised
a portion of the loan portfolio (within the company) in recent years, which means it can be pledged from the
central bank and therefore serves as an additional liquidity buffer. Since this concerns internal securitisations,
solely for liquidity purposes, they are not visible in the economic balance sheet but are included in the
available liquidity buffer.
The third pillar entails the restriction of liquidity risk through a prudent funding policy aimed at meeting the
financing requirements of the group units at acceptable cost. Diversification of sources of funding and
currencies, flexibility of the funding instruments applied and a hands-on investor relations approach are key
factors. This prevents Rabobank Group from being overly dependent on a single source of funding.
Furthermore, scenario analyses are performed each month to simulate the possible consequences of a wide
range of stress scenarios, distinguishing between scenarios specific for the market and scenarios specific for
Rabobank, as well as a combination of them. Monthly reports on the liquidity position of the Group as a
whole are submitted to the Dutch Central Bank. These reports are prepared in accordance with the guidelines
drawn up by this supervisory authority.
The table below shows Rabobank’s non-discounted liabilities grouped by the liquidity period remaining
between the reporting date and the expected contract repayment date. The total amounts do not correspond
exactly with the amounts in the consolidated statement of financial position, since this table is based on non-
discounted cash flows, related to both principal and future interest payments. ‘Derivative financial instruments
and other trade liabilities’ have not been analysed on the basis of the contract repayment date because they
are not essential for the management of liquidity risk and for reporting to the management of Rabobank.
Contract repayment date
in millions of euros On demandLess than 3 months
3 months to 1 year 1 - 5 years In 5 years Total
At 31 December 2013
LiabilitiesDue to other banks 2,934 5,791 1,670 3,906 1,392 15,693
Due to customers 250,658 35,739 10,567 16,059 21,462 334,485
Debt securities in issue 112 31,975 63,353 74,674 42,378 212,492
Other debts (excluding employee benefits) 1,332 4,658 238 870 83 7,181
Other financial liabilities at fair value through profit and loss 69 821 1,511 6,892 22,280 31,573
Subordinated debt - 5 - 94 12,055 12,154
Total financial liabilities 255,105 78,989 77,339 102,495 99,650 613,578
Financial guarantees 11,429 - - - - 11,429
in millions of euros On demandLess than 3 months
3 months to 1 year 1 - 5 years In 5 years Total
At 31 December 2012
LiabilitiesDue to other banks 2,520 16,113 2,057 5,272 1,295 27,257
Due to customers 237,363 56,396 11,180 15,165 18,938 339,042
Debt securities in issue 1 46,979 61,483 83,113 51,984 243,560
Other debts (excluding employee benefits) 1,515 7,176 446 834 18 9,989
Other financial liabilities at fair value through profit and loss 3,144 964 3,204 8,464 17,690 33,466
Subordinated debt - 18 30 573 6,900 7,521
Total financial liabilities 244,543 127,646 78,400 113,421 96,825 660,835
Financial guarantees 14,904 - - - - 14,904

41 Notes to the consolidated financial statements
The following table shows Rabobank’s assets and liabilities grouped by the period remaining between
the reporting date and the contract repayment date. These amounts correspond with the statement of
financial position.
Contract repayment date
in millions of euros On demandLess than 3 months
3 months to 1 year 1 - 5 years
Longer than 5 years Total
At 31 December 2013
Financial assetsCash and cash equivalents 15,495 27,542 2 - - 43,039
Due from other banks 6,380 30,730 2,376 1,138 220 40,844
Trading financial assets 50 1,868 544 1,802 1,025 5,289
Other financial assets at fair value through profit and loss 40 851 402 888 2,790 4,971
Derivative financial instruments 152 3,511 2,841 11,477 21,722 39,703
Loans to customers 27,749 33,300 33,823 89,947 275,383 460,202
Available-for-sale financial assets 70 3,917 3,040 11,778 27,606 46,411
Deferred tax assets 460 - - - 1,451 1,911
Other assets (excluding employee benefits) 989 4,789 1,153 1,441 427 8,799
Total financial assets 51,385 106,508 44,181 118,471 330,624 651,169
Financial liabilitiesDue to other banks 2,907 5,829 1,691 3,803 1,266 15,496
Due to customers 249,908 36,462 10,526 15,586 16,918 329,400
Debt securities in issue 112 31,850 62,865 70,110 30,424 195,361
Derivative financial instruments and other trade liabilities 888 3,958 2,872 16,454 25,999 50,171
Other debts (excluding employee benefits) 1,663 4,235 299 866 85 7,148
Other financial liabilities at fair value through profit and loss 70 653 1,533 7,076 9,737 19,069
Deferred tax liabilities 162 - - - 128 290
Subordinated debt - 5 - 89 7,721 7,815
Total financial liabilities 255,710 82,992 79,786 113,984 92,278 624,750
Net liquidity surplus (204,325) 23,516 (35,605) 4,487 238,346 26,419
in millions of euros On demandLess than 3 months
3 months to 1 year 1 - 5 years
Longer than 5 years Total
At 31 December 2012
Financial assetsCash and cash equivalents 64,198 3,903 2 - - 68,103
Due from other banks 14,619 17,005 1,545 1,943 274 35,386
Trading financial assets 1,316 768 582 2,260 1,461 6,387
Other financial assets at fair value through profit and loss - 8 1,217 1,205 3,481 5,911
Derivative financial instruments 300 4,912 4,374 22,332 33,505 65,423
Loans to customers 28,166 41,362 32,683 85,437 297,651 485,299
Available-for-sale financial assets 56 3,957 3,189 6,718 36,505 50,425
Deferred tax assets 62 - - - 898 960
Other assets (excluding employee benefits) 1,019 4,947 1,534 2,088 167 9,755
Total financial assets 109,736 76,862 45,126 121,983 373,942 727,649
Financial liabilitiesDue to other banks 2,520 16,101 2,047 5,157 1,234 27,059
Due to customers 238,013 56,293 10,962 14,309 14,694 334,271
Debt securities in issue 1 46,851 61,091 77,756 37,637 223,336
Derivative financial instruments and other trade liabilities 10,000 5,182 4,580 26,790 28,248 74,800
Other debts (excluding employee benefits) 1,570 6,800 466 828 38 9,702
Other financial liabilities at fair value through profit and loss 1,532 920 3,294 8,340 10,005 24,091
Deferred tax liabilities 23 - - - 163 186
Subordinated debt - 12 22 540 4,833 5,407
Total financial liabilities 253,659 132,159 82,462 133,720 96,852 698,852
Net liquidity surplus (143,923) (55,297) (37,336) (11,737) 277,090 28,797
42 Consolidated Financial Statements 2013 Rabobank Group
The above breakdown was compiled on the basis of contract information, without taking into account actual
changes in items in the statement of financial position. This is taken into account, however, for the day-to-day
management of the liquidity risk. Customer savings are an example. By contract, they are payable on demand.
However, experience has shown that this is a very stable source of financing at the long-term disposal of
Rabobank. The regulations of the supervisory authority also factor this in. Based on the liquidity criteria of the
Dutch Central Bank, Rabobank had a substantial liquidity surplus at 31 December 2013 and throughout 2013.
The average liquidity surplus was 40% (2012: 44%) of the total 1-month liquidity requirement. The surplus at
31 December 2013 was 30% (2012: 41%).
The liquidity requirements to meet payments under guarantees and standby letters of credit are considerably
lower than the amount of the liabilities, as Rabobank does not generally expect that third parties to such
arrangements will draw funds. The total open position relating to contractual obligations to provide credit
does not necessarily represent Rabobank’s future cash resource needs, as many of these obligations will lapse
or terminate without financing being required.
The Basel Committee published a document in July 2013 entitled ‘Global systemically important banks:
updated assessment methodology and the higher loss absorbency requirement’. This document cites 12
indicators based on which banks can be classified as systemically important on a global scale. The document
indicates that banks with a leverage ratio exposure exceeding EUR 200 billion disclose at least the 12 indicators
– these indicators are detailed in the Capital Adequacy and Risk Management Report 2013.
4.7 Market riskRabobank is exposed to market risk. A market risk arises on open positions in relation to interest rates,
currency, credit spreads, commodities and share-based products, all of which are affected by general and
specific market movements. Rabobank employs a VaR method to estimate the market risk of positions it holds
and the maximum expected losses. The method requires a number of assumptions to be made for various
changes in market conditions. In order to estimate the risk under ‘abnormal’ market conditions as well, the
effect of certain extreme events (event risk) on the value of the portfolios is also measured.
Each year, the Executive Board determines the risk appetite and corresponding VaR and event risk limits.
These limits are converted into limits at book level and are monitored daily by the market risk management
department. The risk position is reported to senior management on a daily basis and discussed in the various
risk management committees each month. In addition to the VaR limits, a very extensive system of trading
controls per book is in place. These controls include rotation risk (the risk of the yield curve rotating), delta
limits per bucket, nominal limits and the maximum number of contracts, thus limiting risks that may offset
each other in the VaR system.
The internal VaR model forms an integral part of Rabobank’s risk management framework; it has also been
approved by the Dutch Central Bank for determining the solvency requirement for market risk. Rabobank has
opted to apply a VaR based on historical simulation for which one year’s worth of historic data is used.
For internal risk management purposes, Rabobank has opted for a confidence level of 97.5% and a time
horizon of 1 day. For solvency calculations a confidence level of 99% is prescribed by the supervisor for
solvency calculations.
The major benefit of a VaR model based on historical simulation is that no assumptions need to be made in
terms of distribution of possible value changes of the various financial instruments. A drawback is that a
certain period of historical market movements needs to be selected, which may affect the level of the
calculated VaR. Further to the requirements of the supervisory authority and after internal research,
Rabobank has opted for a historical period of one year.
The actual results are regularly assessed through back testing in order to determine the validity of the
assumptions and parameters/factors applied when calculating the VaR.
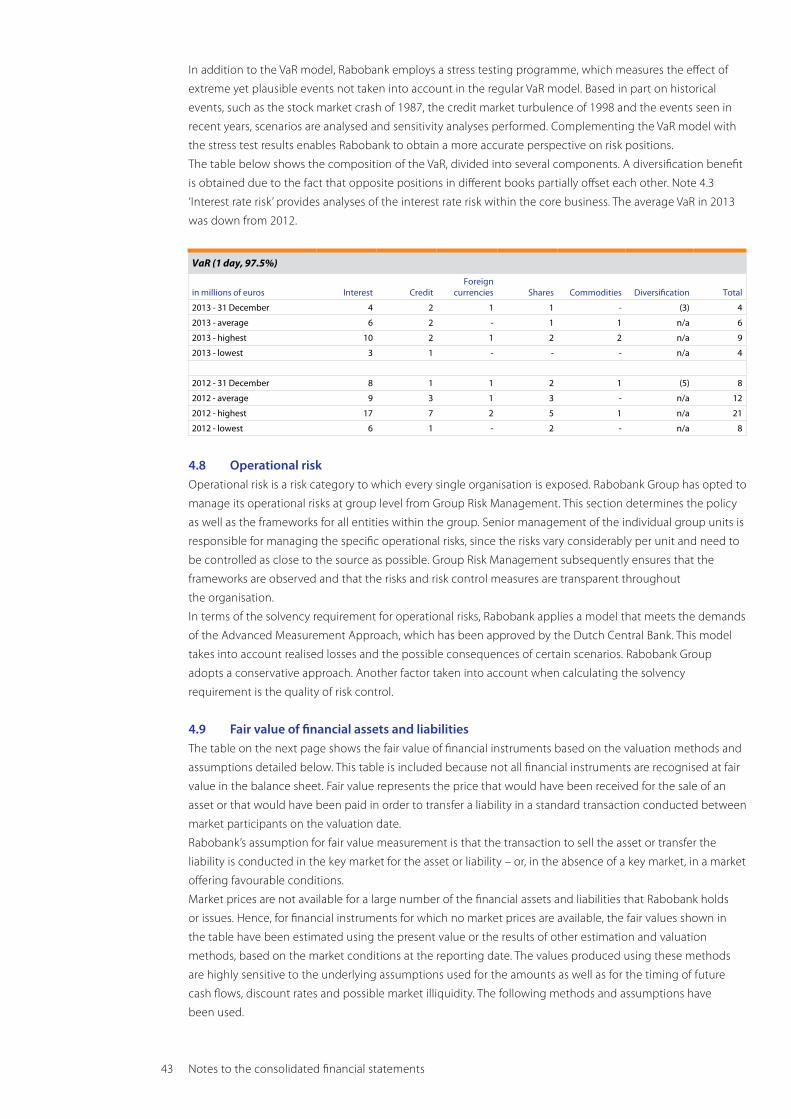
43 Notes to the consolidated financial statements
In addition to the VaR model, Rabobank employs a stress testing programme, which measures the effect of
extreme yet plausible events not taken into account in the regular VaR model. Based in part on historical
events, such as the stock market crash of 1987, the credit market turbulence of 1998 and the events seen in
recent years, scenarios are analysed and sensitivity analyses performed. Complementing the VaR model with
the stress test results enables Rabobank to obtain a more accurate perspective on risk positions.
The table below shows the composition of the VaR, divided into several components. A diversification benefit
is obtained due to the fact that opposite positions in different books partially offset each other. Note 4.3
‘Interest rate risk’ provides analyses of the interest rate risk within the core business. The average VaR in 2013
was down from 2012.
VaR (1 day, 97.5%)
in millions of euros Interest CreditForeign
currencies Shares Commodities Diversification Total
2013 - 31 December 4 2 1 1 - (3) 4
2013 - average 6 2 - 1 1 n/a 6
2013 - highest 10 2 1 2 2 n/a 9
2013 - lowest 3 1 - - - n/a 4
2012 - 31 December 8 1 1 2 1 (5) 8
2012 - average 9 3 1 3 - n/a 12
2012 - highest 17 7 2 5 1 n/a 21
2012 - lowest 6 1 - 2 - n/a 8
4.8 Operational riskOperational risk is a risk category to which every single organisation is exposed. Rabobank Group has opted to
manage its operational risks at group level from Group Risk Management. This section determines the policy
as well as the frameworks for all entities within the group. Senior management of the individual group units is
responsible for managing the specific operational risks, since the risks vary considerably per unit and need to
be controlled as close to the source as possible. Group Risk Management subsequently ensures that the
frameworks are observed and that the risks and risk control measures are transparent throughout
the organisation.
In terms of the solvency requirement for operational risks, Rabobank applies a model that meets the demands
of the Advanced Measurement Approach, which has been approved by the Dutch Central Bank. This model
takes into account realised losses and the possible consequences of certain scenarios. Rabobank Group
adopts a conservative approach. Another factor taken into account when calculating the solvency
requirement is the quality of risk control.
4.9 Fair value of financial assets and liabilitiesThe table on the next page shows the fair value of financial instruments based on the valuation methods and
assumptions detailed below. This table is included because not all financial instruments are recognised at fair
value in the balance sheet. Fair value represents the price that would have been received for the sale of an
asset or that would have been paid in order to transfer a liability in a standard transaction conducted between
market participants on the valuation date.
Rabobank’s assumption for fair value measurement is that the transaction to sell the asset or transfer the
liability is conducted in the key market for the asset or liability – or, in the absence of a key market, in a market
offering favourable conditions.
Market prices are not available for a large number of the financial assets and liabilities that Rabobank holds
or issues. Hence, for financial instruments for which no market prices are available, the fair values shown in
the table have been estimated using the present value or the results of other estimation and valuation
methods, based on the market conditions at the reporting date. The values produced using these methods
are highly sensitive to the underlying assumptions used for the amounts as well as for the timing of future
cash flows, discount rates and possible market illiquidity. The following methods and assumptions have
been used.

44 Consolidated Financial Statements 2013 Rabobank Group
Cash and cash equivalents. The fair value of cash and cash equivalents is assumed to be almost equal to
their carrying amount. This assumption is also used for highly liquid investments and the current component
of all other financial assets and liabilities.
Due from other banks. Due from other banks comprise interbank placings and items to be collected.
The fair values of floating rate placings and overnight deposits are their carrying amounts. The estimated fair
value of fixed-interest deposits is based on the present value of the cash flows, calculated using appropriate
money market interest rates for debts with comparable credit risks and terms to maturity.
Financial assets and derivative financial instruments held for trading. Financial assets and derivative
financial instruments held for trading are carried at fair value based on available quoted market prices.
If quoted market prices are not available, the fair value is estimated from discounted cash flow models and
option valuation models. For derivatives, the bank factors in counterparty risk. Rabobank uses the latest
market data to estimate this risk, including CDS curves and Monte Carlo simulations. Another factor taken into
account is Rabobank’s own credit rating.
Other financial assets at fair value through profit or loss. These financial assets are carried at fair value
based on quoted market prices if available. If not, they are estimated from comparable assets on the market,
or using valuation methods, including appropriate discounted cash flow models and option valuation models.
Loans to customers. The fair value of issued loans is estimated from the present value of the cash flows,
using current market rates for similar loans. For variable-interest loans that are reviewed regularly and do not
vary significantly in terms of credit risk, the fair value is based on the carrying amount until maturity.
Available-for-sale financial assets. Available-for-sale financial assets are measured at fair value based on
listed market prices. If no listed market prices are unavailable, fair value is estimated based on models of
discounted cash flows and option valuation models.
Other financial assets. For almost all other financial assets, the carrying amount is a good approximation of the
fair value.
Due to other banks. Due to other banks comprise interbank placings, items to be delivered and deposits.
The fair values of floating rate placings and overnight deposits are their carrying amounts. The estimated fair
value of fixed-interest deposits is based on the present value of the cash flows, calculated using ruling money
market interest rates for debts with comparable credit risks and terms to maturity.
Trade liabilities. The fair value of trade liabilities is based on available quoted market prices. If quoted
market prices are not available, the fair value is estimated from valuation models.
Other financial liabilities at fair value through profit or loss. The fair value of these liabilities is based on
available quoted market prices. If quoted market prices are not available, the fair value is estimated from
discounted cash flow models and option valuation models.
Due to customers. Due to customers include current accounts and deposits. The fair value of savings and
current accounts that have no specific termination date is assumed to be the amount payable on demand at
the reporting date, i.e. their carrying amount at that date. The fair value of the deposits is estimated from the
present value of the cash flows, based on current bid rates of interest for similar arrangements with terms to
maturity that match the items to be measured. The carrying amount of variable-interest deposits is a good
approximation of their fair value at the reporting date.
Debt and other instruments issued by Rabobank. The fair value of these instruments is calculated using
quoted market prices. For notes for which no quoted market prices are available, a discounted cash flow
model is used, based on a current yield curve appropriate for the term to maturity.

45 Notes to the consolidated financial statements
2013 2012
in millions of euros Carrying amount Fair value Carrying amount Fair value
AssetsCash and cash equivalents 43,039 43,012 68,103 68,097
Due from other banks 40,844 40,878 35,386 35,485
Trading financial assets 5,289 5,289 6,387 6,387
Other financial assets at fair value through profit or loss 4,971 4,971 5,911 5,911
Derivative financial instruments 39,703 39,703 65,423 65,423
Loans to customers 460,202 466,714 485,299 496,591
Available-for-sale financial assets 46,411 46,411 50,425 50,425
Total financial assets 640,459 646,978 716,934 728,319
LiabilitiesDue to other banks 15,496 15,470 27,059 27,112
Due to customers 329,400 332,072 334,271 334,596
Debt securities in issue 195,361 199,458 223,336 231,559
Derivative financial instruments and other trade liabilities 50,171 50,171 74,800 74,800
Other financial liabilities at fair value through profit or loss 19,069 19,069 24,091 24,091
Subordinated debt 7,815 8,103 5,407 6,130
Total financial liabilities 617,312 624,343 688,964 698,288
The above-stated figures represent the best possible estimates by management, based on a range of
methods and assumptions. If a quoted market price is available, this is the best estimate of fair value.
If no quoted market prices are available for fixed-term securities, equity instruments, derivative financial
instruments and commodity instruments, Rabobank bases the fair value on the present value of the future
cash flows, discounted at market rates corresponding to the credit ratings and terms to maturity of the
investments. Also, a model-based price can be used to determine fair value.
Rabobank’s policy is to have all models used for valuing financial instruments validated by expert staff who
are independent of the staff who determine the fair values of the financial instruments.
In determining market values or fair values, various factors have to be considered, such as the time value of
money, volatility, underlying options, warrants and derivative financial instruments. Other factors include
liquidity and the creditworthiness of the counterparty. The valuation process has been designed such that
market prices that are available on a periodic basis are systematically used. This systematic valuation process
has proved its worth during the credit market crisis. Modifications to assumptions might affect the fair value
of trading and non-trading financial assets and liabilities.
The table on the next page illustrates the fair value hierarchy used in determining the fair value of financial
assets and liabilities. The breakdown is as follows:
• category 1: Quoted prices in active markets for identical assets or liabilities; an ‘active market’ is a market in
which transactions relating to the asset or liability occur with sufficient frequency and at a sufficient volume
in order to provide price information on a permanent basis.
• category 2: Inputs other than quoted prices included in category 1 that are observable for the asset or
liability, either directly (i.e. as prices) or indirectly (i.e. derived from prices);
• category 3: Inputs for the asset or liability not based on observable market data.
Rabobank determines for recurrent valuations of financial instruments at fair value when transfers between
the various categories of the fair-value hierarchy occurred by reassessing the category during each new
reporting period.
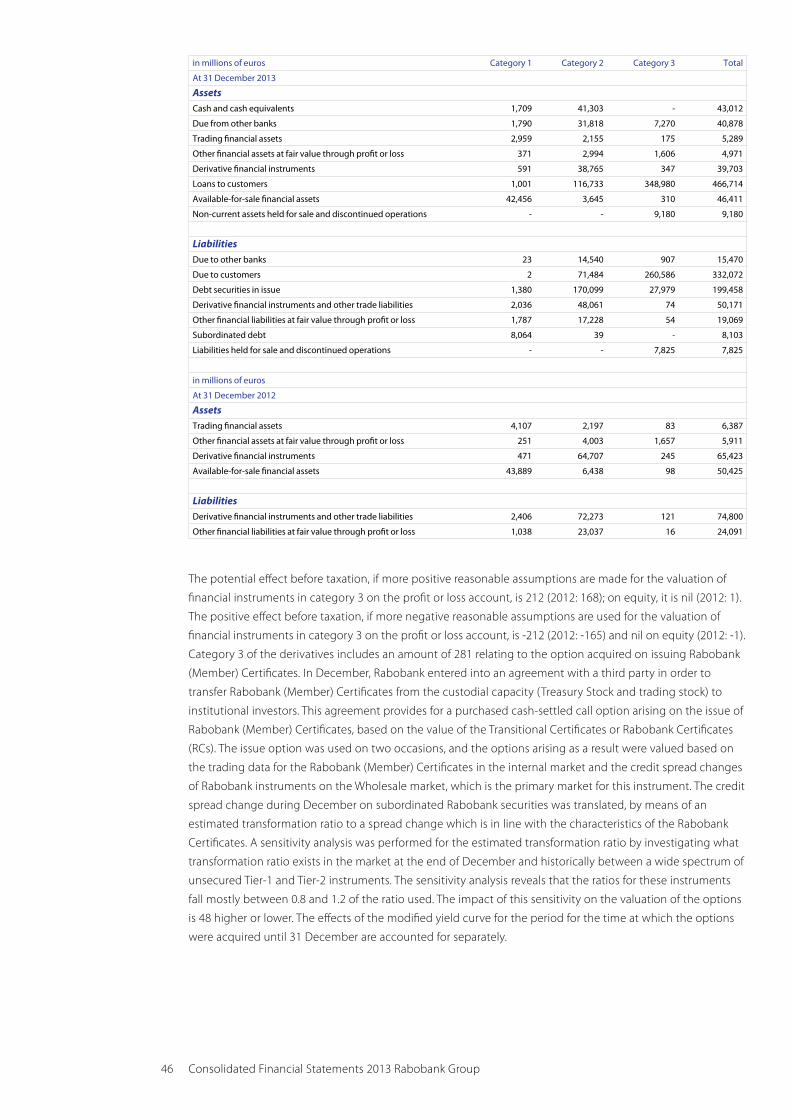
46 Consolidated Financial Statements 2013 Rabobank Group
in millions of euros Category 1 Category 2 Category 3 Total
At 31 December 2013
AssetsCash and cash equivalents 1,709 41,303 - 43,012
Due from other banks 1,790 31,818 7,270 40,878
Trading financial assets 2,959 2,155 175 5,289
Other financial assets at fair value through profit or loss 371 2,994 1,606 4,971
Derivative financial instruments 591 38,765 347 39,703
Loans to customers 1,001 116,733 348,980 466,714
Available-for-sale financial assets 42,456 3,645 310 46,411
Non-current assets held for sale and discontinued operations - - 9,180 9,180
LiabilitiesDue to other banks 23 14,540 907 15,470
Due to customers 2 71,484 260,586 332,072
Debt securities in issue 1,380 170,099 27,979 199,458
Derivative financial instruments and other trade liabilities 2,036 48,061 74 50,171
Other financial liabilities at fair value through profit or loss 1,787 17,228 54 19,069
Subordinated debt 8,064 39 - 8,103
Liabilities held for sale and discontinued operations - - 7,825 7,825
in millions of euros
At 31 December 2012
AssetsTrading financial assets 4,107 2,197 83 6,387
Other financial assets at fair value through profit or loss 251 4,003 1,657 5,911
Derivative financial instruments 471 64,707 245 65,423
Available-for-sale financial assets 43,889 6,438 98 50,425
LiabilitiesDerivative financial instruments and other trade liabilities 2,406 72,273 121 74,800
Other financial liabilities at fair value through profit or loss 1,038 23,037 16 24,091
The potential effect before taxation, if more positive reasonable assumptions are made for the valuation of
financial instruments in category 3 on the profit or loss account, is 212 (2012: 168); on equity, it is nil (2012: 1).
The positive effect before taxation, if more negative reasonable assumptions are used for the valuation of
financial instruments in category 3 on the profit or loss account, is -212 (2012: -165) and nil on equity (2012: -1).
Category 3 of the derivatives includes an amount of 281 relating to the option acquired on issuing Rabobank
(Member) Certificates. In December, Rabobank entered into an agreement with a third party in order to
transfer Rabobank (Member) Certificates from the custodial capacity (Treasury Stock and trading stock) to
institutional investors. This agreement provides for a purchased cash-settled call option arising on the issue of
Rabobank (Member) Certificates, based on the value of the Transitional Certificates or Rabobank Certificates
(RCs). The issue option was used on two occasions, and the options arising as a result were valued based on
the trading data for the Rabobank (Member) Certificates in the internal market and the credit spread changes
of Rabobank instruments on the Wholesale market, which is the primary market for this instrument. The credit
spread change during December on subordinated Rabobank securities was translated, by means of an
estimated transformation ratio to a spread change which is in line with the characteristics of the Rabobank
Certificates. A sensitivity analysis was performed for the estimated transformation ratio by investigating what
transformation ratio exists in the market at the end of December and historically between a wide spectrum of
unsecured Tier-1 and Tier-2 instruments. The sensitivity analysis reveals that the ratios for these instruments
fall mostly between 0.8 and 1.2 of the ratio used. The impact of this sensitivity on the valuation of the options
is 48 higher or lower. The effects of the modified yield curve for the period for the time at which the options
were acquired until 31 December are accounted for separately.

47 Notes to the consolidated financial statements
Category 3 of the other financial assets at fair value through profit or loss includes both debt instruments and
private equity interests. The latter account for 427, and a significant non-observable input for the valuation of
these interests is the multiplier. This is determined at the time the interests are acquired and is applied to the
EBITDA. The average weighted multiplier is 6.0, with a range of -1 and +1 of the multiplier. The majority of
debt instruments constitute structured investments (RMBS and CDO) at an amount of 936. The main input for
valuating these instruments is the market price, but the market for these instruments is illiquid. The prices
have therefore been adjusted in order to determine fair value.
Financial instruments at fair value in category 3
in millions of eurosAt 1 January
2013
Fair value changes
through profit or loss
Fair value changes through
equity Purchases Sales Settlements
Transferred to held for sale/discontinued
operationsTransfers to or
from category 3At 31 December
2013
At 31 December 2013
AssetsTrading financial assets 83 (2) - 128 (24) (4) - (6) 175
Other financial assets at fair value through profit or loss 1,657 (32) - 344 (488) (152) - 277 1,606
Derivative financial instruments 245 (56) - 152 - 6 (1) 1 347
Available-for-sale financial assets 98 2 8 299 (89) (2) (6) - 310
LiabilitiesDerivative financial instruments and other trade liabilities 121 (62) - - - - (1) 16 74
Other financial liabilities at fair value through profit or loss 16 11 - 88 (57) (4) - - 54
The table shows movements in the financial instruments which are stated at fair value in the statement
of financial position and which are classified in category 3. This category includes derivative financial
instruments received by Rabobank as compensation for the issue in December 2013 of the Rabobank
(Member) Certificates, along with a cash amount. The first valuation of this derivative financial instrument is
152 and is recognised under retained earnings.
The fair value adjustments in category 3 which are included in equity are accounted for in the revaluation
reserves for available-for-sale financial assets.
In 2013, debt instruments in the amount of 277 were transferred from category 2 to category 3 as a result of
a decrease in the number of usable ratios for fair value determination. There were no significant transfers
between category 1 and category 2 in 2013.
Financial instruments at fair value in category 3
in millions of eurosAt 1 January
2012
Fair value changes
through profit or loss
Fair value changes through
equity Purchases Sales Settlements
Transferred to held for sale/discontinued
operationsTransfers to or
from category 3At 31 December
2012
At 31 December 2012
AssetsTrading financial assets 404 2 - - (98) (21) (187) (17) 83
Other financial assets at fair value through profit or loss 1,496 127 - 597 (551) (10) - (2) 1,657
Derivative financial instruments 421 (158) - - (23) 5 - - 245
Available-for-sale financial assets 227 7 (1) 4 (2) (33) (99) (5) 98
LiabilitiesDerivative financial instruments and other trade liabilities 205 (81) - - (2) (1) - - 121
Other financial liabilities at fair value through profit or loss 129 (1) - - - (13) (83) (16) 16

48 Consolidated Financial Statements 2013 Rabobank Group
The amount in total gains or losses presented in the statement of income for the period relating to the assets
and liabilities held in category 3 until the end of the reporting period is presented in the table below.
Financial instruments in category 3 - fair value changes through profit or loss
in millions of euros Recognised Derecognised Total
At 31 December 2013
AssetsTrading financial assets (3) 1 (2)
Other financial assets at fair value through profit or loss (58) 26 (32)
Derivative financial instruments 78 (134) (56)
Available-for-sale financial assets 2 - 2
Liabilities Derivative financial instruments and other trade liabilities (53) (9) (62)
Other financial liabilities at fair value through profit or loss 11 - 11
At 31 December 2012
AssetsTrading financial assets (13) 15 2
Other financial assets at fair value through profit or loss 56 71 127
Derivative financial instruments (54) (104) (158)
Available-for-sale financial assets 7 - 7
Liabilities Derivative financial instruments and other trade liabilities (78) (3) (81)
Other financial liabilities at fair value through profit or loss (1) - (1)
The table below shows the changes in deferred profit of the trading financial assets which were initially
recognised at a value determined using a valuation technique based on data input not substantiated by
market prices.
Provision for Day 1 profit
in millions of euros 2013 2012
Opening balance 37 42
Additions 11 41
Amortisation (15) (29)
Changes (6) (17)
Closing balance 27 37
4.10 Securities servicesRabobank provides management, advisory and custody services. Assets held in connection with fiduciary
activities are not disclosed in these financial statements. As part of its management services, Rabobank has
to make decisions on the allocation, purchase and sale of a wide variety of financial instruments. For some of
the arrangements, Rabobank has agreed to achieve return targets for the assets under its management.
Rabobank provides advisory services to third parties with regard to buy and sell orders.
With these management and advisory services, Rabobank could be exposed to the risk of being held liable for
inadequate management, advice or performance.

49 Notes to the consolidated financial statements
4.11 Legal proceedingsGeneral information
Rabobank Group is involved in a number of legal and arbitration proceedings in the Netherlands and other
countries, including the United States, in connection with claims brought by and against Rabobank Group
arising from its business operations. Although it is not possible to predict eventual outcomes or determine
them for all current or impending legal proceedings, Rabobank Group is of the view that the eventual
outcome of the various current proceedings and/or any future legal proceedings will not adversely affect its
financial position or profitability, based on its size, strong balance sheet, stable flow of revenues and
provisions policy.
Fortis
The Dutch Investors’ Association (VEB) served a summons on Fortis N.V. (currently trading as Ageas N.V.),
the underwriters involved – including Rabobank – and the former directors of Fortis N.V. In the summons,
the Dutch Investors’ Association states that investors were misled by the prospectus published by Aegas N.V.
in connection with its rights issue of September 2007. The Association states that the impact and risks of the
sub-prime crisis on Fortis and the latter’s liquidity position were inaccurately represented in the prospectus
and has requested a notice of law stating that the parties summoned acted in violation of the law and must
therefore be held liable for the losses suffered by investors in Fortis. However, the Association has failed to
provide supporting evidence for the alleged loss cited of EUR 18 billion. The legal proceedings involve a
settlement of large-scale loss, which means that the court will only rule on the question of whether or not the
defendants, including Rabobank, are liable. Depending on the outcome of the proceedings, it will become
clear whether separate proceedings for the purpose of assessing the damages may be expected in the future.
Rabobank has defended itself against the claim, and is currently unable to assess the outcome of these
proceedings or any court cases to be brought in the future.
Libor/Euribor
Rabobank has been a member at various times of eight London Interbank Offered Rate (Libor) panels and
the Interbank Offered Rate (Euribor) panel. Currently, Rabobank is a member of the Libor panels for the British
Pound Sterling (GBP), the US Dollar (USD) and the Euro (EUR). Rabobank has not been a member of the panel
for the Tokyo Interbank Offered Rate (Tibor).
Starting early 2010, Rabobank has been receiving claims and requests for documentation and information
from various regulators and competition and criminal-law authorities based in a number of different
countries, including the Netherlands, the United Kingdom, the United States (US), Japan, Hong Kong,
Singapore and Switzerland. These documents and information were requested in relation to pending
investigations by these regulators and other organisations. These investigations relate to the process of
submitting interest rates, including for the purpose of determining the Libor and Euribor interests rates.
On 29 October 2013, Rabobank entered into settlements and agreements with the United States Department
of Justice, the United States Commodity Futures Trading Commission, the UK Financial Conduct Authority,
and the Public Prosecution Service and the Dutch Central Bank in the Netherlands. These settlements and
agreements relate to the submission of interest rates, including Libor and Euribor. Additional information
regarding the settlements and agreements is available at the corporate website. There are still a small number
of investigations pending into these issues. Rabobank will continue to cooperate fully in these investigations.
As part of the arrangements described above, Rabobank has paid a total amount of approximately
EUR 774 million in settlements. In the interim results for 2013, published on 22 August 2013, Rabobank had
made a provision that covered the largest portion of this settlement amount. The amount which was not
covered by the provision was deducted from the profit for 2013 in the second half of the year. The payment
of the settlement amount will have no material effect on Rabobank’s financial position.

50 Consolidated Financial Statements 2013 Rabobank Group
Along with several other panel banks, Rabobank has been summoned in a number of class-action suits and
individual civil court cases in the United States. These cases were referred to federal and local courts of law
and involve claims relating to USD Libor, Japanese Yen Libor (JPY Libor), Tibor, and Euribor.
A number of class-action suits and individual civil court cases relating to USD Libor have been combined into a
Multi-District Litigation (11-md-2262-NRB) (the ‘MDL’). These cases are being reviewed by the U.S. District Court for
the Southern District of New York (the ‘Southern District’) in coordinated pre-trial proceedings. In 2012, several
claimants in the MDL submitted six amended claims (collectively referred to as the ‘MDL claims’), in which they
state that the USD Libor panel banks conspired together to keep the USD Libor submissions artificially low:
(I) in order to represent their actual financing costs as lower than they are in reality; and (II) in order to pay a lower
interest on financial products that were linked to USD Libor, which the parties summoned (subpoenaed) in the
MDL sold to their investors. The parties summoned in the MDL submitted a joint request for the MDL Claims to be
denied. In March 2013, the District Court delivered a judgment (the ‘Judgment’), in which virtually all MDL Claims
were denied, with the exception of several claims brought pursuant to the US Commodities Exchange Act.
The claimants and defendants submitted a number of different requests following the Judgment of March
2013, and they are expected to continue this course of action. In August 2013, the District Court rendered
a judgment in which a number of these requests were denied.
Several other claimants have instituted USD Libor-related proceedings since August 2013. The defendants in
the MDL have attempted to combine each of these cases with the MDL. The proceedings which have been
made part of the MDL and which entail claims as referred to in the Judgment of March 2013 were tabled by
order of the District Court on 3 May 2013.
In February 2013, claimant 7 West 57th St. Realty Co. (7 West 57th) in the Southern District submitted a claim
entitled 7 West 57th St. Realty Co. v. Citigroup, Inc. et al. (13-CV-00981), in which the USD Libor panel banks
are listed as defendants. Claimant 7 West 57th St. Realty Co. brought an amended claim on 11 June 2013,
in which it alleges that the defendants conspired together with the objective of manipulating USD Libor and
keeping it at an artificially low level, except between September 2008 and October 2008, when the
defendants allegedly artificially increased USD Libor. The defendants submitted a request in August 2013 for
the 7 West 57th claim to be denied.
In April 2012, claimant Jeffrey Laydon (Laydon) brought a claim in the Southern District, known as Laydon v.
Mizuho Bank, Ltd., et al., 12-CV-3419 (GBD). Laydon subsequently submitted amended claims, the most recent
of which alleges that the JPY Libor and Tibor panel banks deliberately made artificial Euroyen Tibor and
JPY Libor, as a result of which Euroyen Tibor futures were traded at artificial price levels. The defendants
submitted a request in June 2013 for the Laydon claim to be denied.
In February 2013, claimants Stephen Sullivan and White Oak Fund, LP (Sullivan) brought a class action suit in
the Northern District of Illinois, Sullivan v. Barclays PLC, et al., in which several Euribor panel banks are listed as
defendants. This case has been referred to the Southern District. Following Rabobank’s settlements with the
above-mentioned authorities in October 2013, Sullivan submitted an amended claim in which Rabobank and
other parties have been added as defendants. In addition, the claimants also allege in this amended claim
that the defendants conspired to manipulate Euribor and the prices of Euribor-based derivatives.
On 11 November 2013, the court tabled the obligation of the defendants to respond to the amended claim
until Sullivan has brought a second amended claim.
The above-mentioned class-action suits and civil proceedings, along with any future proceedings conducted in
the United States or elsewhere are by their very nature subject to uncertainty, making their outcomes difficult to
predict. Rabobank nevertheless maintains that it has substantive and persuasive legal and factual objections to
these claims. Rabobank intends to continue defending itself against these claims with all its powers.
51 Notes to the consolidated financial statements
5 Business segments
The business segments Rabobank uses in its reporting are defined from a management viewpoint. This means
they are the segments that are reviewed as part of Rabobank’s strategic management and for the purpose of
making business decisions, and have different risks and returns.
Rabobank distinguishes six major business segments: Domestic retail banking, Wholesale and international
retail banking, Asset management, Leasing, Real estate, and Other segments.
The Domestic Retail Banking business mainly comprises the activities of the local Rabobanks, Obvion, Roparco
and Friesland Bank. The Wholesale Banking business and International Retail Banking business – Rabobank
International – supports Rabobank Group in achieving market leadership in the Netherlands, and focuses on
the food and agricultural sector at the international level. Rabobank International is engaged in regional
corporate banking activities, as well as maintaining multinational business units such as Global Financial
Markets, Structured Finance, Leveraged Finance, Renewable Energy & Infrastructure Finance, International
Direct Retail Banking, Trade & Commodity Finance and Rabo Private Equity. The international retail banking
businesses is conducted under the Rabobank label, with the exception of ACCBank and Bank BGZ.
The Asset Management segment consists mainly of the activities of Robeco (until 1 July 2013) and
Schretlen & Co. Additional information about the sale of Robeco is included in Note 44, ‘Acquisitions and
disposals’. Since the date of the legal merger (21 June 2013), Robeco’s banking business are no longer
reported in the Asset Management segment, but rather in the Domestic Retail Banking business.
The Leasing-De Lage Landen segment is responsible for the leasing business and provides a comprehensive
range of leasing, trading and consumer finance products in the Dutch home market. De Lage Landen
provides sales support to manufacturers, vendors and distributors worldwide through asset-financing
products. De Lage Landen operates in European markets with the Athlon Car Lease leasing company.
The core businesses of the Real Estate – Rabo Real Estate Group segment, which holds investments,
are residential and commercial real estate, finance and asset management. In the Dutch market, Rabo Real
Estate Group operates the Bouwfonds Ontwikkeling, MAB Development, FGH Bank and Bouwfonds
Investment Management brands. The Other Rabobank segments are comprised of various sub-segments,
of which no single segment should be listed separately. The Other segments mainly include the financial
results of associates (particularly Achmea B.V.) and the head office operations. There are no customers who
own a share of more than 10% in Rabobank’s total revenues.
Transactions between the various business segments are conducted subject to standard commercial terms
and market conditions. In the Domestic Retail Banking business, the dividend provided to local Rabobanks
included under ‘Other results’ is nil (2012: 493). Profit from the sale of Robeco is included in ‘Other segments’.
Expenses relating to the Libor settlement is stated in the Wholesale Banking and International Retail Banking
Business segment. The income generated by the termination of the defined-benefit pension scheme has
been allocated to the segments based on the pension base.
Apart from operating activities, there is no other material comprehensive income between the business
segments. A segment’s operating activities comprise business assets and liabilities, i.e. a large portion of the
balance sheet excluding items such as tax. The accounting principles used for the segments are identical to
those described in the summary of key financing reporting principles.

52 Consolidated Financial Statements 2013 Rabobank Group
in millions of eurosDomestic retail
banking
Wholesale banking and international
retail bankingAsset
management Leasing Real estateOther
segments
Consolidation effects/hedge
accounting Total
Value adjustments in loans to customers
At 1 January 1,974 845 - 467 376 53 - 3,715
Additional impairment for credit losses 1,979 1,000 - 276 520 16 - 3,791
Reversal of impairment for credit losses (582) (408) - (40) (6) (9) - (1,045)
Defaulting loans written off during the year (1,270) (487) - (223) (34) (10) - (2,024)
Interest and other adjustments 124 (346) - (25) (14) 1 - (260)
Closing balance 2,225 604 - 455 842 51 - 4,177
Individual value adjustment (specific provision) 1,817 423 - 262 758 47 - 3,307
Collective value adjustment (collective provision) 256 13 - 111 - - - 380
IBNR 152 168 - 82 84 4 - 490
Closing balance 2,225 604 - 455 842 51 - 4,177
In millions of eurosDomestic retail
banking
Wholesale banking and international
retail banking Asset
management Leasing Real estateOther
segments
Consolidation effects/hedge
accounting Total
For the year ended on 31 December 2013
Interest 5,605 2,617 (2) 973 322 (422) - 9,093
Commission 1,319 637 3 52 32 (10) (33) 2,000
Other income 616 793 2 545 (563) 1,544 (1,010) 1,927
Total income 7,540 4,047 3 1,570 (209) 1,112 (1,043) 13,020
Segment expenses 5,015 3,134 2 764 342 591 (83) 9,765
Value adjustments 1,384 568 - 170 513 8 - 2,643
Bank tax 90 75 - 9 8 14 1 197
Operating profit before taxation 1,051 270 1 627 (1,072) 499 (961) 415
Taxation 270 218 - 205 (257) (129) (239) 68
Net profit from continuing operations 781 52 1 422 (815) 628 (722) 347
Net profit from discontinued operations - - 80 - - 1,585 - 1,665
Net profit 781 52 81 422 (815) 2,213 (722) 2,012
Business unit assets 376,241 486,763 1,276 33,128 27,593 71,252 (325,743) 670,510
Investments in associates 17 627 - 25 111 2,849 - 3,629
Total assets 376,258 487,390 1,276 33,153 27,704 74,101 (325,743) 674,139
Business unit liabilities 349,172 476,175 1,051 29,267 26,642 60,816 (309,021) 634,102
Total liabilities 349,172 476,175 1,051 29,267 26,642 60,816 (309,021) 634,102
Additions to property and equipment 160 28 - 1,420 13 38 - 1,659
Depreciation of tangible assets and amortisation of intangible assets 145 127 - 50 27 179 - 528
Impairment of tangible and intangible assets 2 52 - - - 12 - 66
Goodwill 322 599 - 460 - - - 1,381

53 Notes to the consolidated financial statements
in millions of eurosDomestic retail
banking
Wholesale banking and international
retail bankingAsset
management Leasing Real estateOther
segments
Consolidation effects/hedge
accounting Total
Value adjustments in loans to customers
At 1 January 1,501 889 1 451 205 42 - 3,089
Additional impairment for credit losses 1,757 1,214 - 264 240 26 - 3,501
Reversal of impairment for credit losses (416) (572) (2) (64) (2) (8) - (1,064)
Defaulting loans written off during the year (1,370) (658) - (196) (67) (6) - (2,297)
Interest and other adjustments 502 (28) 1 12 - (1) - 486
Closing balance 1,974 845 - 467 376 53 - 3,715
Individual value adjustment (specific provision) 1,639 592 - 274 353 50 - 2,908
Collective value adjustment (collective provision) 205 40 - 108 - - - 353
IBNR 130 213 - 85 23 3 - 454
Closing balance 1,974 845 - 467 376 53 - 3,715
In millions of eurosDomestic retail
banking
Wholesale banking and international
retail banking Asset
management Leasing Real estateOther
segments
Consolidation effects/hedge
accounting Total
For the year ended on 31 December 2012
Interest 5,180 2,775 85 952 312 (133) - 9,171
Commission 1,344 618 225 63 35 (14) (43) 2,228
Other income 765 612 90 442 104 (372) 576 2,217
Total income 7,289 4,005 400 1,457 451 (519) 533 13,616
Segment expense 4,360 2,416 308 796 301 317 505 9,003
Value adjustments 1,329 621 (2) 147 237 18 - 2,350
Bank tax 91 60 2 9 8 26 - 196
Operating profit before taxation 1,509 908 92 505 (95) (880) 28 2,067
Taxation 205 204 25 138 12 (433) 7 158
Net profit from continuing operations 1,304 704 67 367 (107) (447) 21 1,909
Net profit from discontinued operations - - 149 - - - - 149
Net profit 1,304 704 216 367 (107) (447) 21 2,058
Business unit assets 386,039 529,778 11,369 32,737 27,920 82,021 (322,803) 747,061
Investments in associates 12 576 - 29 86 2,946 - 3,649
Total assets 386,051 530,354 11,369 32,766 28,006 84,967 (322,803) 750,710
Business unit liabilities 357,829 518,931 10,308 29,252 26,138 70,046 (303,874) 708,630
Total liabilities 357,829 518,931 10,308 29,252 26,138 70,046 (303,874) 708,630
Additions to property and equipment 181 60 2 1,650 1 98 - 1,992
Depreciation of tangible assets and amortisation of intangible assets 150 121 (2) 48 19 191 - 527
Impairment of tangible and intangible assets 9 - - - - 15 - 24
Goodwill 322 737 - 464 - - - 1,523

54 Consolidated Financial Statements 2013 Rabobank Group
Income from external clients
Additions to property and equipment and
intangible assetsIncome from
external clients
Additions to property and equipment and
intangible assets
At 31 December 2013 At 31 December 2012
in millions of euros
The Netherlands 9,090 1,091 9,190 1,742
Other eurozone 454 85 528 123
Rest of Europe (Non-eurozone) 787 53 1,138 111
North America 1,589 527 1,843 88
Latin America 504 6 521 3
Asia 304 3 337 8
Australia 293 13 262 78
Other and consolidation effects (1) - (203) -
Total 13,020 1,778 13,616 2,153
6 Cash and cash equivalents
in millions of euros 2013 2012
Cash 954 1,002
Money market loans - 7
Deposits at central banks other than mandatory reserve deposits 35,802 66,196
36,756 67,205
Mandatory reserve deposits at central banks 6,283 898
Total cash and cash equivalents 43,039 68,103
Mandatory reserve deposits consist of deposits with the Dutch Central Bank required under its minimum
reserve policy.
7 Due from other banks
in millions of euros 2013 2012
Deposits with other banks 12,276 13,275
Reverse repurchase transactions and securities borrowing agreements 22,418 16,848
Loans 5,758 4,446
Other 63 80
Less: value adjustments (51) (48)
40,464 34,601
Reclassified assets 380 785
Total due from other banks 40,844 35,386
Breakdown of value adjustments
At 1 January 48 51
Additional impairment for credit losses 3 -
Reversal of impairment for credit losses (10) (11)
Value adjustments (7) (11)
Other changes 10 8
At 31 December 51 48
Value adjustments of ‘Due from other banks’ have been recognised in the statement of income as
‘Value adjustments’. The gross carrying amount of Due from other banks whose value adjustments were
established on an individual basis is 55 (2012: 55).

55 Notes to the consolidated financial statements
8 Trading financial assets
in millions of euros 2013 2012
Purchased loans 1,171 1,767
Short-term government securities 204 688
Government bonds 1,086 935
Other debt securities 2,109 1,690
Equity instruments 719 1,307
Total 5,289 6,387
9 Other financial assets at fair value through profit or loss
in millions of euros 2013 2012
Government bonds 63 4
Other debt securities 2,917 3,738
Loans 1,056 1,026
Venture capital (equity instrument) 549 784
Other equity instruments 386 359
Total 4,971 5,911
The change in the year under review in the fair value of the loans designated as at fair value through profit or
loss that is attributable to the changes in credit risk is -18 (2012: -9). The cumulative change is -48 (2012: -30).
Any changes in credit risk are calculated by discounting future cash flows. When setting the discount rate,
account is taken of expected losses, the liquidity mark-ups and the risk margin.
No credit derivative financial instruments are used to hedge the loans designated as at fair value through
profit and loss.
10 Derivative financial instruments and other trade liabilities
10.1 Types of derivative instruments used by RabobankForward currency and interest rate contracts are contractual obligations to receive or pay a net amount based
on changes in exchange or interest rates, or to purchase or sell foreign currency or a financial instrument on a
future date at a fixed specified price in an organised financial market. As collateral for forward contacts is
provided in the form of cash, cash equivalents or marketable securities, and changes in the value of forward
contracts are settled daily, the credit risk is negligible.
Forward rate agreements are individually agreed forward interest rate contracts under which the difference
between a contractually agreed interest rate and the market rate on a future date has to be settled in cash,
based on a notional principal amount.
Currency and interest rate swaps are commitments to exchange one set of cash flows for another. Swaps
entail an economic exchange of currencies or interest rates (such as a fixed rate for one or more variable
rates), or a combination (i.e. a cross-currency swap). Except for certain currency swaps, there is no transfer of
the principal amount. The credit risk exposure of Rabobank represents the potential cost of replacing the
swaps if the counterparties default. The risk is monitored continuously against current fair value, a portion of
the notional amount of the contracts and the liquidity of the markets. As part of the credit risk management
process, Rabobank employs the same methods for evaluating counterparties as it does for evaluating its own
lending activities.

56 Consolidated Financial Statements 2013 Rabobank Group
Currency and interest rate options are contracts under which the seller (known as the writer) gives the buyer
(known as the holder) the right, entailing no obligation, to purchase (in the case of a call option) or sell (in the
case of a put option) a specific amount of foreign currency or a specific financial instrument on or before an
agreed date or during an agreed period at a price set in advance. As consideration for accepting the currency
or interest rate risk, the writer receives a payment (known as a premium) from the holder. Options are traded
on exchanges or between Rabobank and clients (OTC). Rabobank is exposed to credit risks only as option
holder and only up to the carrying amount, which is equal to the fair value in this case.
Credit default swaps (CDSs) are instruments by means of which the seller of a CDS undertakes to pay the
buyer an amount equal to the loss that would be incurred by holding an underlying reference asset if a
specific credit event were to occur (i.e. the materialisation of a risk). The buyer is under no obligation to hold
the underlying reference asset.
The buyer pays the seller a credit protection fee expressed in basis points, with the size of the fee depending
on the credit spread of the reference asset.
10.2 Derivative financial instruments issued or held for tradingRabobank trades in financial instruments to take positions in tradable or OTC instruments, including derivative
financial instruments, so that it can profit from short-term movements on share and bond markets and in
exchange and interest rates. For this type of trading, Rabobank sets risk limits relating to market positions at
the end of the day (overnight trades) as well as during the day (intraday trades). Except under specific
hedging arrangements, the currency and interest rate risks associated with these derivative financial
instruments are usually offset by taking counter positions in order to manage the volatility in the net amounts
needed to liquidate the market positions.
10.3 Derivative financial instruments held as hedgesRabobank concludes various derivative contracts that are intended as fair value, cash flow or net investment
hedges, and which accordingly qualify as such. Rabobank also concludes derivative contracts as hedges
against economic risks. It does not apply hedge accounting to these contracts.
Fair value hedges
The main components of Rabobank’s fair value hedge are interest-rate swaps and cross-currency swaps
which serve as protection against a potential change in the fair value of fixed-income financial assets and
liabilities in both local and foreign currencies. The net fair value of these swaps as at 31 December 2013
was -10,427 (2012: -16,131).
Rabobank hedges a portion of its existing currency and interest-rate risk of securities issued or by means of
fair value hedges in the form of cross-currency interest-rate swaps. The net fair value of these interest-rate
swaps as at 31 December is 1,947 (2012: 2,246). For the year ending on 31 December 2013, Rabobank
reported a profit of 215 (2012: -17) as a result of the portion of the fair value hedges which was classified as
ineffective hedges.
For the year ending on 31 December 2013, Rabobank reported a profit of 2,782 (2012: -5,250) for the hedging
instruments. Total profit from the hedged position, attributable to the hedged risk, totalled -2,567 (2012: 5,233).
Cash-flow hedges
Rabobank’s cash-flow hedges consist mainly of cross-currency interest-rate swaps which serve to protect
against a potential change in cash flows from financial assets in foreign currencies with floating interest rates.
The net fair value of the cross-currency interest-rate swaps, classified as cash-flow hedge as at
31 December 2013 is -2,405 (2012: 408).

57 Notes to the consolidated financial statements
In 2013, Rabobank accounted for an amount of -1,450 (2012: 145) after taxation in equity as effective changes
in the fair value of derivatives in cash-flow hedges. In 2013, an amount of 1,459 (2012:7) after taxation of cash-
flow hedge reserves was reclassified to the profit or loss account. The cash-flow hedge reserves as part of
equity totalled 49 (2012: 40) at 31 December 2013. This amount fluctuates along with the fair value of the
derivatives in the cash-flow hedges and is accounted for in profit over the term of the hedged positions as
trading profit. The cash-flow hedge reserve relates to a large number of derivatives and hedged positions with
different terms. The maximum term is 97 years, with the largest concentrations exceeding 5 years.
For the year ending on 31 December 2013, Rabobank reported a profit of 225 (2012: 228) as a result of the
portion of the cash-flow hedges classified as ineffective hedges.
Net investment hedges
Rabobank uses foreign forward-exchange contracts to hedge a portion of the currency translation risk of
net investments in foreign entities. The net fair value of these foreign forward-exchange contracts as at
31 December 2013 was 29 (2012: 40).
As at 31 December 2013, futures contracts with a nominal amount of 2,386 (2012: 2,654) were designated as
net investment hedges. These resulted in exchange gains and losses of 279 for the year (2012: 51), which are
deferred in equity. No withdrawals were made from equity during the year (2012: 107). For the year ending
31 December 2013, Rabobank reported no ineffectiveness resulting from the net investment hedges.
10.4 Notional amount and fair valueAlthough the notional amount of certain types of financial instruments provides a basis for comparing
instruments that are included in the statement of financial position, it does not necessarily represent the
related future cash flows or the fair values of the instruments. Hence, it does not represent the exposure of
Rabobank to credit or exchange risks. It is the amount of the asset or the reference rate or index underlying a
derivative financial instrument, representing the basis on which changes in a derivative financial instrument’s
value are measured. It provides an indication of the volume of transactions executed by Rabobank; it is not a
measure of risk exposure, however. Some derivative financial instruments are standardised in terms of
notional amount or settlement date, having been designed for trading on active markets (i.e. on stock
exchanges). Others are specifically constructed for individual clients and not for trading on an exchange, even
though they can be traded at prices negotiated by buyers and sellers (OTC instruments).
The positive fair value represents the cost for Rabobank to replace all contracts on which it will be entitled to
receive payment. Replacement would apply in the event of all counterparties remaining in default. This is the
standard method in the industry for calculating the current credit risk exposure. The negative fair value
represents the cost of all Rabobank contracts on which it will have to make payment. Replacement would
apply in the event of Rabobank remaining in default. The total of positive fair values and the total of negative
fair values are disclosed separately in the statement of financial position. Derivative financial instruments are
positive (assets) or negative (liabilities) as a result of fluctuations in market or exchange rates in relation to
their contract values. The total contract amount or notional amount of derivative financial instruments held,
the degree to which these instruments are positive or negative, and hence the total fair value of the derivative
financial assets and liabilities can sometimes fluctuate significantly.
The next table shows the notional amounts and the positive and negative fair values of Rabobank’s
derivative contracts.

58 Consolidated Financial Statements 2013 Rabobank Group
in millions of euros Notional amounts Fair values
At 31 December 2013 Assets Liabilities
Derivative financial instruments held for trading 2,749,767 36,147 34,272
Derivative financial instruments held as hedges 131,042 3,556 14,441
Short positions shares and bonds - - 1,458
Total derivative financial assets/liabilities recognised 2,880,579 39,703 50,171
Derivative financial instruments held for trading
Currency derivative financial instruments
Unlisted tradable contracts (OTC)
Forward currency contracts 40,423 391 339
Currency swaps 333,171 4,175 5,172
Currency options 3,681 41 41
Cross-currency interest rate swaps 17 5 1
Listed tradable contracts
Currency futures 3,808 11 5
Options 257 17 8
Total currency derivative financial instruments 381,357 4,640 5,566
Interest rate derivative financial instruments
Unlisted tradable contracts (OTC)
Interest rate swaps 2,009,856 26,818 23,483
Forward rate agreements 166,404 - 1
Interest rate options 113,487 3,028 3,103
Total OTC contracts 2,289,747 29,846 26,587
Listed tradable contracts
Interest rate swaps 47,937 2 1
Total interest rate derivative financial instruments 2,337,684 29,848 26,588
Credit derivative financial instruments
Credit default swaps 3,815 23 10
Total return swaps 4,036 173 442
Total credit derivative financial instruments 7,851 196 452
Equity instruments/index derivative financial instruments
Unlisted tradable contracts (OTC)
Options 2,137 340 300
Listed tradable contracts
Futures 37 - -
Options 7,643 373 372
Total equity instruments/index derivative financial instruments 9,817 713 672
Other derivative financial instruments 13,058 750 994
Total derivative financial assets/liabilities held for trading 2,749,767 36,147 34,272
Derivative financial instruments held as hedges
Derivative financial instruments designated as fair value hedges
Currency swaps and cross-currency interest rate swaps 47,264 2,019 72
Interest rate swaps 63,733 1,071 11,498
Total derivative financial instruments designated as fair value hedges 110,997 3,090 11,570
Derivative financial instruments designated as cash flow hedges
Currency swaps and cross-currency interest rate swaps 20,045 466 2,871
Interest rate swaps - - -
Total derivative financial assets/liabilities designated as hedges 131,042 3,556 14,441

59 Notes to the consolidated financial statements
in millions of euros Notional amounts Fair values
At 31 December 2012 Assets Liabilities
Derivative financial instruments held for trading 3,226,028 60,026 54,376
Derivative financial instruments held as hedges 146,118 5,397 18,861
Short positions shares and bonds - - 1,563
Total derivative financial assets/liabilities recognised 3,372,146 65,423 74,800
Derivative financial instruments held for trading
Currency derivative financial instruments
Unlisted tradable contracts (OTC)
Forward currency contracts 21,217 324 358
Currency swaps 378,243 6,625 6,478
Currency options 4,190 50 41
Cross-currency interest rate swaps 306 20 1
Listed tradable contracts
Currency futures 3,771 4 4
Options 430 19 7
Total currency derivative financial instruments 408,157 7,042 6,889
Interest rate derivative financial instruments
Unlisted tradable contracts (OTC)
Interest rate swaps 2,024,263 46,447 39,564
Forward rate agreements 548,106 251 266
Interest rate options 131,457 4,542 4,478
Total OTC contracts 2,703,826 51,240 44,308
Listed tradable contracts
Interest rate swaps 64,532 1 18
Total interest rate derivative financial instruments 2,768,358 51,241 44,326
Credit derivative financial instruments
Credit default swaps 7,681 368 47
Total return swaps 8,392 378 983
Total credit derivative financial instruments 16,073 746 1,030
Equity instruments/index derivative financial instruments
Unlisted tradable contracts (OTC)
Options 2,927 259 396
Listed tradable contracts
Futures 106 - -
Options 13,986 391 772
Total equity instruments/index derivative financial instruments 17,019 650 1,168
Other derivative financial instruments 16,421 347 963
Total derivative financial assets/liabilities held for trading 3,226,028 60,026 54,376
Derivative financial instruments held as hedges
Derivative financial instruments designated as fair value hedges
Currency swaps and cross-currency interest rate swaps 43,943 2,262 16
Interest rate swaps 77,914 1,644 17,775
Total derivative financial instruments designated as fair value hedges 121,857 3,906 17,791
Derivative financial instruments designated as cash flow hedges
Currency swaps and cross-currency interest rate swaps 23,603 1,476 1,069
Interest rate swaps 658 15 1
Total derivative financial assets/liabilities designated as hedges 146,118 5,397 18,861

60 Consolidated Financial Statements 2013 Rabobank Group
11 Loans to customers
in millions of euros 2013 2012
Loans initiated by Rabobank
Loans to government clients:
- leases 634 738
- other 2,036 3,027
Loans to private clients:
- overdrafts 17,258 14,953
- mortgages 219,461 221,677
- leases 21,925 22,382
- reverse repurchase transactions and securities borrowing agreements 10,697 11,410
- corporate loans 184,067 202,751
- other 5,495 7,852
Gross loans to customers 461,573 484,790
Less: value adjustments in loans to customers (4,177) (3,715)
457,396 481,075
Reclassified assets 2,806 4,224
Total loans to customers 460,202 485,299
The impairment of reclassified assets is -154 (2012: -135) and is stated in the profit or loss account under
‘Income from other financial assets and liabilities through profit and loss’.
in millions of euros 2013 2012
Value adjustments in loans to customers
Value adjustments in loans to customers can be broken down as follows:
At 1 January 3,715 3,089
Additional impairment for credit losses 3,791 3,501
Reversal of impairment for credit losses (1,045) (1,064)
Defaulting loans written off during the year (2,024) (2,297)
Interest and other changes (260) 486
Total value adjustments in loans to customers 4,177 3,715
Individual value adjustment (specific provision) 3,307 2,908
Collective value adjustment (collective provision) 380 353
IBNR 490 454
Total value adjustments in loans to customers 4,177 3,715
Gross carrying amount of loans whose value adjustments were established on an individual basis 12,681 11,069
In 2013, at portfolio level, the provision for expected losses on loans to corporate customers of local Rabobanks
was written down by 0.4 billion (2012: 0.8 billion). These debtors have virtually no perspective of being able to
continue as a going concern, which means that realisation of the security has started. In 2013, Rabobank
International wrote down its provision for expected loan losses by 21 million (2012: 0.3 billion), notably for
loan losses in the Irish real estate portfolio. No recovery is expected for these loans, but realisation of the
security has been deferred on account of market conditions affecting the security provided. For this reason,
the provision was utilised and the loans written off.
During the year, Rabobank acquired financial and non-financial assets by taking possession of collateral with
an estimated value of 29 (2012: 42). In general, it is Rabobank’s policy to sell these assets in the reasonably
foreseeable future. Yields are allocated to repay the outstanding amount.
Reclassified assets
Based on the amendments to IAS 39 and IFRS 7, ‘Reclassification of financial assets’, Rabobank reclassified
a number of ‘Trading financial assets’ and ’Available-for-sale financial assets’ to ‘Loans to customers’ and
‘Due from other banks’ in 2008.

61 Notes to the consolidated financial statements
Rabobank has identified assets to which this amendment applies, with the intention clearly shifting to
holding the securities for the near future as opposed to selling or trading them in the short term.
The reclassifications were effected as from 1 July 2008 at their fair value at the time. This note provides
details on the impact of the reclassifications at Rabobank.
The table below shows the carrying amounts and fair values of the reclassified assets.
31 December 2013 31 December 2012
in millions of euros Carrying amount Fair value Carrying amount Fair value
Trading financial assets reclassified to loans 579 533 953 851
Available-for-sale financial assets reclassified to loans 2,607 2,718 4,056 3,994
Total financial assets reclassified to loans 3,186 3,251 5,009 4,845
Without the reclassifications of trading financial assets, net profit would have been 42 higher (2012: 137 higher).
The change in equity in 2013 would have been 113 more positive (2012: 37 more negative) if available-for-sale
financial assets had not been reclassified.
Following reclassification, the reclassified financial assets made the following contribution to operating profit
before taxation:
Year ended 31 December
2013 2012
Net interest income 3 33
Value adjustments - (9)
Operating profit before taxation on reclassified trading financial assets 3 24
Net interest income 57 62
Value adjustments 154 144
Operating profit before taxation on reclassified available-for-sale financial assets 211 206
Value adjustments include reversed impairments and recoveries subsequent to write-offs in the amount
of 233 (2012: 215), as well as impairments in the amount of 79 (2012: 80).
Finance leases
Loans to customers also includes receivables from finance leases, which can be broken down as follows:
in millions of euros 2013 2012
Receivables from gross investment in finance leases
Not exceeding 1 year 8,535 9,889
Longer than 1 year but not longer than 5 years 15,847 15,308
Longer than 5 years 814 736
Total receivables from gross investment in finance leases 25,196 25,933
Unearned deferred finance income from finance leases 3,043 3,229
Net investment in finance leases 22,153 22,704
Net investment in finance leases
Not exceeding 1 year 7,532 8,694
Longer than 1 year but not longer than 5 years 13,910 13,339
Longer than 5 years 711 671
Net investment in finance leases 22,153 22,704
The provision for finance leases included in value adjustments amounted to 406 at 31 December 2013
(2012: 416). The unguaranteed residual values accruing to the lessor amount to 1,911 (2012: 1,848).
The contingent lease payments recognised as income in 2013 are nil (2012: 0).
The finance leases chiefly concern the lease of equipment and cars, as well as factoring.

62 Consolidated Financial Statements 2013 Rabobank Group
12 Available-for-sale financial assets
in millions of euros 2013 2012
Short-term government securities 1,710 2,096
Government bonds 35,714 39,275
Other debt securities 8,170 8,537
Equity instruments 817 517
Total available-for-sale financial assets 46,411 50,425
The impairment of available-for-sale financial assets amounts to -111 (2012: 137) and is recognised in profit or
loss under ‘Net income from financial assets and liabilities at fair value through profit and loss’.
in millions of euros 2013 2012
Gains/(losses) on available-for-sale financial assets 56 132
The changes in available-for-sale financial assets can be broken down as follows:
in millions of euros 2013 2012
Opening balance 50,425 51,930
Foreign exchange differences (749) (248)
Acquisitions - 96
Additions 44,524 37,339
Disposals (sale and redemption) (44,167) (37,082)
Transferred to non-current assets held for sale (1,163) (3,018)
Fair value changes (1,984) 1,618
Other changes (475) (210)
Closing balance 46,411 50,425
13 Investments in associates
in millions of euros 2013 2012
Opening balance 3,649 3,340
Purchases 58 54
Sales (1) (16)
Share of profit of associates 157 255
Dividends paid (62) (24)
Revaluation (118) 59
Other (54) (19)
Total 3,629 3,649
The principal associates are listed under note 48 ‘Principal subsidiaries and associates’.

63 Notes to the consolidated financial statements
14 Intangible assets
in millions of euros Goodwill
Software developed
in-house
Other intangible
assets Total
Year ended 31 December 2013
Opening balance 1,523 474 346 2,343
Foreign exchange differences (39) (1) (8) (48)
Additions - 87 32 119
Transferred to non-current assets held for sale and discontinued operations (63) - (100) (163)
Disposals - (4) (1) (5)
Other 2 19 17 38
Amortisation - (134) (103) (237)
Impairments (42) (13) (1) (56)
Closing balance 1,381 428 182 1,991
Cost 1,413 1,232 593 3,238
Accumulated amortisation and impairments (32) (804) (411) (1,247)
Net carrying amount 1,381 428 182 1,991
Year ended 31 December 2012
Opening balance 1,903 502 397 2,802
Foreign exchange differences (12) - 13 1
Additions 5 93 63 161
Acquisitions - - 62 62
Transferred to non-current assets held for sale and discontinued operations (376) - (77) (453)
Disposals (10) (15) (11) (36)
Other 4 38 7 49
Amortisation - (137) (99) (236)
Impairments 9 (7) (9) (7)
Closing balance 1,523 474 346 2,343
Cost 1,719 1,158 841 3,718
Accumulated amortisation and impairments (196) (684) (495) (1,375)
Net carrying amount 1,523 474 346 2,343
Goodwill is reviewed for impairment by comparing the carrying amount of the cash-generating unit
(including goodwill) with the best estimate of the value in use of the cash-generating unit. For that purpose,
first the best estimate of the value in use is determined on the basis of cash flow forecasts taken from annual
medium-term plans drawn up as part of the annual planning cycle, which reflect the management’s best
estimates of market conditions, market restrictions, discount rates (before taxation), growth in operations,
et cetera. If the outcome shows that there is no significant difference between the fair value and the carrying
amount, the fair value is assessed in more detail, with the relevant share price being used for listed
companies. In addition, valuation models are used which are similar to the initial recognition of an acquisition,
peer reviews, et cetera. The valuation models are assessed and include the development of the activities since
the acquisition, the most recent comprehensive income forecasts drawn up by management, as well as
updated forecasts, assessments of discount rates, end values of growth rates, et cetera. Peer reviews include
an assessment of the price/earnings ratio and price/carrying amount ratio of similar listed companies, or
similar market transactions. Assumptions are generally based on experience, management’s best estimates
of future developments and, if available, external data.
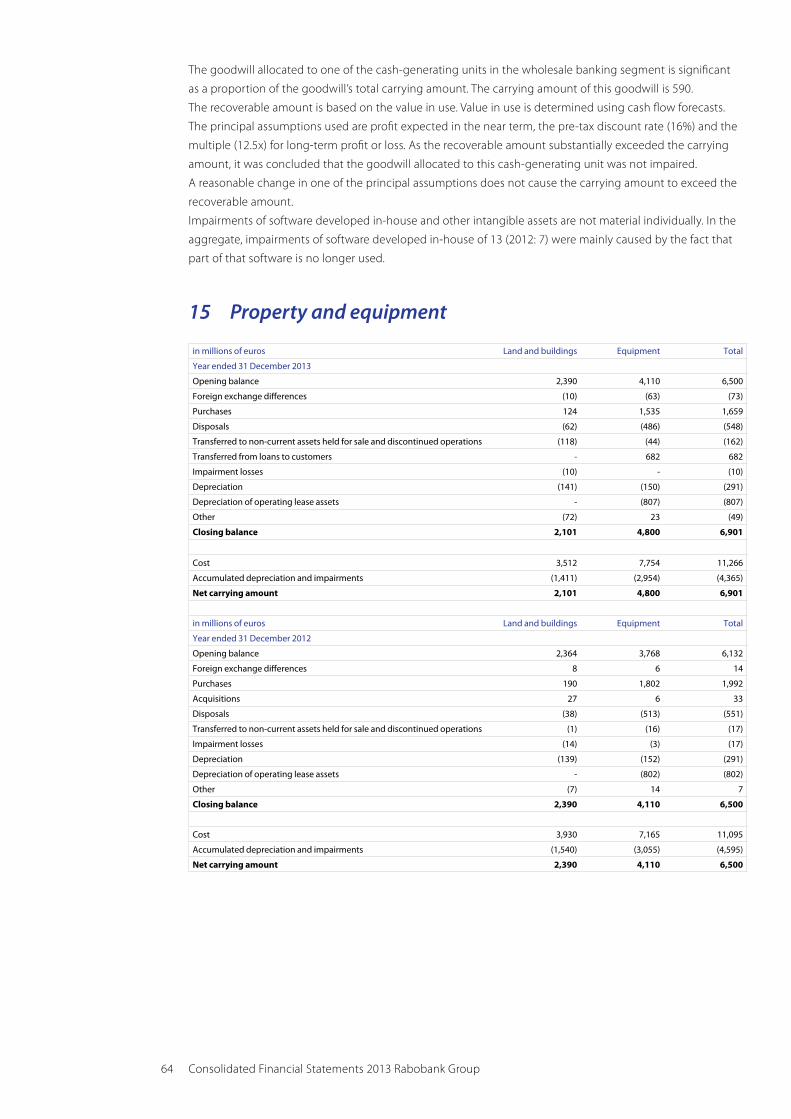
64 Consolidated Financial Statements 2013 Rabobank Group
The goodwill allocated to one of the cash-generating units in the wholesale banking segment is significant
as a proportion of the goodwill’s total carrying amount. The carrying amount of this goodwill is 590.
The recoverable amount is based on the value in use. Value in use is determined using cash flow forecasts.
The principal assumptions used are profit expected in the near term, the pre-tax discount rate (16%) and the
multiple (12.5x) for long-term profit or loss. As the recoverable amount substantially exceeded the carrying
amount, it was concluded that the goodwill allocated to this cash-generating unit was not impaired.
A reasonable change in one of the principal assumptions does not cause the carrying amount to exceed the
recoverable amount.
Impairments of software developed in-house and other intangible assets are not material individually. In the
aggregate, impairments of software developed in-house of 13 (2012: 7) were mainly caused by the fact that
part of that software is no longer used.
15 Property and equipment
in millions of euros Land and buildings Equipment Total
Year ended 31 December 2013
Opening balance 2,390 4,110 6,500
Foreign exchange differences (10) (63) (73)
Purchases 124 1,535 1,659
Disposals (62) (486) (548)
Transferred to non-current assets held for sale and discontinued operations (118) (44) (162)
Transferred from loans to customers - 682 682
Impairment losses (10) - (10)
Depreciation (141) (150) (291)
Depreciation of operating lease assets - (807) (807)
Other (72) 23 (49)
Closing balance 2,101 4,800 6,901
Cost 3,512 7,754 11,266
Accumulated depreciation and impairments (1,411) (2,954) (4,365)
Net carrying amount 2,101 4,800 6,901
in millions of euros Land and buildings Equipment Total
Year ended 31 December 2012
Opening balance 2,364 3,768 6,132
Foreign exchange differences 8 6 14
Purchases 190 1,802 1,992
Acquisitions 27 6 33
Disposals (38) (513) (551)
Transferred to non-current assets held for sale and discontinued operations (1) (16) (17)
Impairment losses (14) (3) (17)
Depreciation (139) (152) (291)
Depreciation of operating lease assets - (802) (802)
Other (7) 14 7
Closing balance 2,390 4,110 6,500
Cost 3,930 7,165 11,095
Accumulated depreciation and impairments (1,540) (3,055) (4,595)
Net carrying amount 2,390 4,110 6,500

65 Notes to the consolidated financial statements
16 Investment properties
Investment properties are stated at cost.
in millions of euros 2013 2012
Opening balance 1,489 784
Purchases 132 33
Transferred from Other assets - 905
Sales (75) (211)
Transferred to non-current assets held for sale (274) -
Depreciation (11) (16)
Impairments (172) (32)
Other (16) 26
Closing balance 1,073 1,489
The fair value approximates the carrying amount (2012: approximated the carrying amount)
Cost 1,615 1,950
Accumulated depreciation (542) (461)
Net carrying amount 1,073 1,489
Valuations
2013 2012
External valuations 76% 77%
Internal valuations 24% 23%
External valuations of the investment property were performed by duly certified external parties in accordance
with RICS valuation standards or other equivalent standards, in compliance with the guidelines of the
Dutch Valuers and Auditors Platform (PTA) as much as possible. The investment property was valued based
on the methodologies which are most appropriate for the property in question. This includes the discounted
cash-flow valuation method and the capitalisation based on net initial yields for comparable transactions.
Real estate expertise available in-house is used for internal valuations of investment properties, and
20% (2012: 20%) were valued by certified staff of Rabo Real Estate Group. Investment properties valued
internally are typically measured using a discounted cash flow valuation technique.
A large portion of the investment property of Rabo Real Estate Group are unique properties. In addition,
the number of property transactions in the current market is limited, and there is often no active market for
similar properties in the same location and in the same condition. A large number of parameters are used for
the valuations of the various types of property investments, based on existing contracts and market data if
possible. A certain level of assessment and estimation is generally unavoidable, which is why all property
investments are classified in category 3. The parameters used to determine the fair value of the property
investments, depending on the type of real estate, include: the current and expected market rent per square
metre, current and expected future vacancy rates, the location of the property, the marketability of the
property, the average discount rate, development budget and any credit risk.
The following key parameters were used for calculation in the various valuations conducted in 2013:
Shopping centresOffices/
warehouses Homes Other
Market rent in EUR/m2 per annum 547 304 95 204
Average discount rate 6.2% 6.8% 7.9% 7.9%
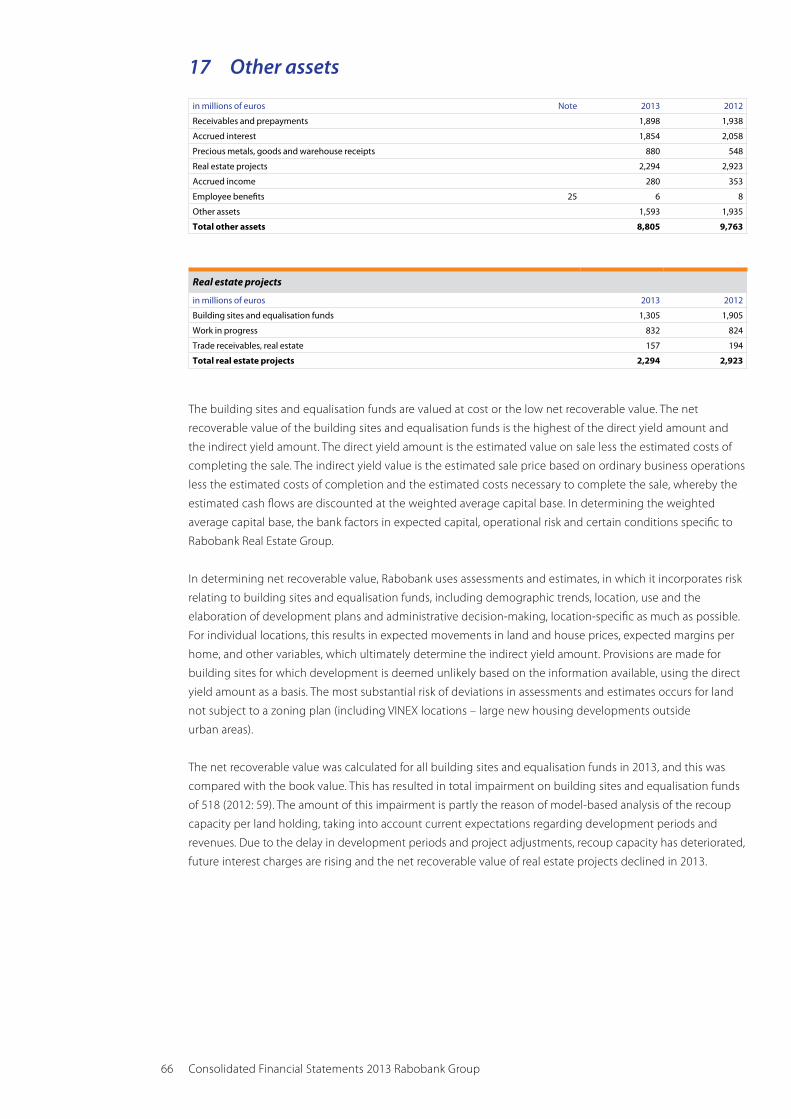
66 Consolidated Financial Statements 2013 Rabobank Group
17 Other assets
in millions of euros Note 2013 2012
Receivables and prepayments 1,898 1,938
Accrued interest 1,854 2,058
Precious metals, goods and warehouse receipts 880 548
Real estate projects 2,294 2,923
Accrued income 280 353
Employee benefits 25 6 8
Other assets 1,593 1,935
Total other assets 8,805 9,763
Real estate projects
in millions of euros 2013 2012
Building sites and equalisation funds 1,305 1,905
Work in progress 832 824
Trade receivables, real estate 157 194
Total real estate projects 2,294 2,923
The building sites and equalisation funds are valued at cost or the low net recoverable value. The net
recoverable value of the building sites and equalisation funds is the highest of the direct yield amount and
the indirect yield amount. The direct yield amount is the estimated value on sale less the estimated costs of
completing the sale. The indirect yield value is the estimated sale price based on ordinary business operations
less the estimated costs of completion and the estimated costs necessary to complete the sale, whereby the
estimated cash flows are discounted at the weighted average capital base. In determining the weighted
average capital base, the bank factors in expected capital, operational risk and certain conditions specific to
Rabobank Real Estate Group.
In determining net recoverable value, Rabobank uses assessments and estimates, in which it incorporates risk
relating to building sites and equalisation funds, including demographic trends, location, use and the
elaboration of development plans and administrative decision-making, location-specific as much as possible.
For individual locations, this results in expected movements in land and house prices, expected margins per
home, and other variables, which ultimately determine the indirect yield amount. Provisions are made for
building sites for which development is deemed unlikely based on the information available, using the direct
yield amount as a basis. The most substantial risk of deviations in assessments and estimates occurs for land
not subject to a zoning plan (including VINEX locations – large new housing developments outside
urban areas).
The net recoverable value was calculated for all building sites and equalisation funds in 2013, and this was
compared with the book value. This has resulted in total impairment on building sites and equalisation funds
of 518 (2012: 59). The amount of this impairment is partly the reason of model-based analysis of the recoup
capacity per land holding, taking into account current expectations regarding development periods and
revenues. Due to the delay in development periods and project adjustments, recoup capacity has deteriorated,
future interest charges are rising and the net recoverable value of real estate projects declined in 2013.

67 Notes to the consolidated financial statements
in millions of euros At 1 January 2013 AdditionsWithdrawals/
other changes At 31 December 2013
Movements in provisions for property projects
Building sites and equalisation funds 351 518 (19) 850
Work in progress 113 119 34 266
Trade debtors – property 11 - (2) 9
Total 475 637 13 1,125
in millions of euros At 1 January 2012 AdditionsWithdrawals/
other changes At 31 December 2012
Movements in provisions for property projects
Building sites and equalisation funds 298 59 (6) 351
Work in progress 355 104 (346) 113
Trade debtors – property 7 - 4 11
Total 660 163 (348) 475
Work in progress
in millions of euros 2013 2012
Housing development planned and under construction 677 696
Commercial real estate under development and under construction 1,018 954
Housing construction instalments invoiced in advance (317) (309)
Commercial real estate instalments invoiced in advance (546) (517)
Total work in progress 832 824
18 Due to other banks
in millions of euros 2013 2012
Loans 3,287 3,794
Repurchase agreements 808 1,986
Deposits 11,401 21,279
Total due to other banks 15,496 27,059
19 Due to customers
in millions of euros 2013 2012
Savings 151,516 149,661
Current accounts/settlement accounts 97,461 96,763
Time deposits 56,418 56,006
Repurchase agreements 1,474 2,299
Other due to customers 22,531 29,542
Total due to customers 329,400 334,271
Due to customers also includes the investments of central banks amounting to 22 (2012: 21) billion.

68 Consolidated Financial Statements 2013 Rabobank Group
20 Debt securities in issue
in millions of euros 2013 2012
Certificates of deposit 42,796 40,400
Commercial paper 11,620 21,076
Bonds 137,482 154,590
Other debt securities 3,463 7,270
Total debt securities in issue 195,361 223,336
Rabobank Nederland issued 900 in Rabo Extra Member Notes in 2010. Their nominal value is EUR 100,
the interest rate is 3.5% per annum (which is above the rate for similar instruments with no conversion right)
and their term is 47 months (until 30 December 2013).
During the term of the Notes, Rabobank will have the right, on four annual exchange dates, to exchange 25%
of their original nominal value for one Rabobank Certificate or Member Certificate. It will have this right only if
the trade price of the Rabobank (Member) Certificates is EUR 24 or more on one of the three trading days
immediately preceding the exchange. If Rabobank does not or may not use this right on the relevant
exchange date, EUR 25 of the nominal amount of each Rabo Extra Member Note will be paid in cash.
The Rabo Extra Member Notes are accounted for as debt securities in issue. In 2010, the equity instrument
was charged to equity in the amount of 26. In 2013, Rabobank used its conversion right, issuing Rabobank
(Member) Certificates to the amount of 225 (2012: 225).
21 Other liabilities
in millions of euros 2013 2012
Payables 3,831 5,522
Accrued interest 2,422 2,768
Employee benefits 288 1,464
Other 867 1,375
Provision for day 1 profit 27 37
Total other liabilities 7,435 11,166
22 Other financial liabilities at fair value through profit or loss
The change in the fair value of the other financial liabilities at fair value through profit or loss that is
attributable to changes in Rabobank’s credit risk is a gain of 272 after taxes (2012: a charge of 335 after taxes).
The cumulative change in fair value attributable to changes in Rabobank’s credit risk since the issue of the
structured notes amounts to 1,821 before taxes (2012: 1,458). The book value of the structured notes is
5,061 (2012: 7,941) lower than the amount Rabobank is obliged to repay the holders of the structured notes.
The change in fair value that is attributable to changes in credit risk is calculated by establishing a connection
with the change in credit mark-up of structured notes issued by Rabobank.
in millions of euros 2013 2012
(Structured) notes 14,116 19,792
Other debt securities 1,928 4,242
Time deposits 3,025 57
Total other financial liabilities at fair value through profit or loss 19,069 24,091

69 Notes to the consolidated financial statements
23 Provisions
in millions of euros 2013 2012
Restructuring provision 396 120
Provision for tax and legal issues 268 304
Other 308 328
Total provisions 972 752
Changes in provisions were as follows:
Restructuring provision
Opening balance 120 105
Interest - 1
Additions charged to profit 381 79
Withdrawals (95) (62)
Release (10) (3)
Closing balance 396 120
Provision for tax and legal issues
Opening balance 304 325
Additions charged to profit 579 40
Withdrawals (582) (39)
Release (33) (22)
Closing balance 268 304
Other
Opening balance 328 335
Additions charged to profit 75 43
Withdrawals (61) (26)
Release (34) (24)
Closing balance 308 328
Total provisions 972 752
The additions deducted from profit from the restructuring provision is an amount of 283 for the reorganisation
programme for the local Rabobanks. This reorganisation provision consists of future payments relating to
redundancy pay and other costs directly attributable to the reorganisation programme. These costs are
accounted for once a detailed redundancy plan is in place. The expected outflow of funds will occur in 2014
and 2015.
Approximately 32% (2012: 36%) of the provision for tax and legal issues relates to tax claims. The provision for
tax and legal issues is based on the best possible estimates available at year-end, taking into account legal
and tax advice. The timing of the cash outflow of these provisions is uncertain because the outcome of the
disputes and the time involved are unpredictable.
‘Other’ includes provisions for onerous contracts, credit guarantees and obligations under the terms of the
deposit guarantee scheme.
Maturity of the Rabobank Group provisions (excluding provisions for employee benefits and doubtful debts)
in millions of euros Less than 1 year 1-5 years More than 5 years Total
At 31 December 2013 207 765 - 972
At 31 December 2012 245 505 2 752

70 Consolidated Financial Statements 2013 Rabobank Group
24 Deferred tax
Deferred tax assets and liabilities are measured for all temporary differences using the ‘liability’ method.
The effective tax rate in the Netherlands for measuring deferred tax is 25% (2012: 25%). There were no changes
in deferred tax assets and liabilities resulting from changes in the effective tax rate in the Netherlands.
No deferred tax asset has been recognised for carry forward losses totalling 1,738 (2012: 1,759). These carry
forward losses relate to various tax authorities and their term to maturity is largely unlimited. Deferred tax
assets recognised in respect of carry forward losses can only be utilised if taxable profits are realised in the
future. At 31 December 2013, there are no reasons to believe that they will not be sufficient.
Deferred tax assets
Deferred tax liabilities
Deferred tax charges
Tax on other comprehensive
income
in millions of euros
For the year ended 31 December 2013
Pensions and other post-employment benefits 35 - 502 (252)
Impairments 641 (1) 116 -
Financial liabilities at fair value (455) - 91 -
Other provisions 75 142 77 -
Hedging of interest rate risk 445 - (278) -
Carry forward losses 1,451 128 (784) -
Intangible assets (68) - (5) -
Revaluation reserve for available-for-sale financial assets 1 7 - 34
Revaluation reserve - cash flow hedges (110) - - (4)
Property and equipment, including leases (20) 75 2 -
Other temporary differences (84) (61) (14) -
Total 1,911 290 (293) (222)
Deferred tax assets
Deferred tax liabilities
Deferred tax charges
Tax on other comprehensive
income
in millions of euros
For the year ended 31 December 2012
Pensions and other post-employment benefits 361 (13) 15 (537)
Impairments 564 (355) 59 -
Financial liabilities at fair value - 364 (112) -
Other provisions 38 88 (52) -
Hedging of interest rate risk - (177) 238 -
Carry forward losses 184 21 (21) -
Intangible assets (14) 83 (50) -
Revaluation reserve for available-for-sale financial assets 23 94 - (89)
Revaluation reserve - cash flow hedges - (5) - (48)
Property and equipment, including leases 10 138 (12) -
Other temporary differences (206) (52) 21 -
Total 960 186 86 (674)
25 Employee benefits
in millions of euros 2013 2012
Employee benefits – assets (6) (8)
Employee benefits – liabilities 288 1,464
Net pension liabilities 282 1,456
Pension plans 66 1,262
Other employee benefits 216 194
Net pension liabilities 282 1,456

71 Notes to the consolidated financial statements
25.1 Pension schemesIn May 2013, Rabobank reached agreement with the trade unions regarding the amendment to the Collective
Labour Agreement (CAO). The parties agreed on a new pension scheme to replace the current scheme
administered by the Rabobank Pension Fund. The new pension scheme, which became effective with
retroactive effect on 1 January 2013, is a group defined-benefit scheme based on a retirement age of 67
and a target accrual rate of 2 percent. Each year Rabobank deposits pension contributions into the Rabobank
Pension Fund based on a fixed system in an attempt to achieve the target pension accrual for services
provided during the year of service based on a conditional career-average scheme with a conditional
indexation. In paying the annual pension contributions, Rabobank will fully and finally have satisfied all its
pension obligations and will no longer have any financial commitments in relation to the underlying years of
participation and pensions previously accrued. In the context of the risks transferred, Rabobank paid a
one-time amount of 500 towards the creation of an index deposit. In addition, Rabobank will act as a
guarantor during the period 2014-2020 for the realisation of the target pension accrual for the services
provided during this period up to a maximum amount of 250.
The new pension scheme qualifies as a defined contribution plan under IAS 19. Rabobank’s obligation is
limited to the premium payments owed, less previously made payments. Actuarial assumptions are no longer
a factor in determining the obligation. During the reporting period until the time of settlement of the
defined-benefit pension scheme, revaluations of the net liability of the Rabobank Pension Scheme of -667
were taken directly to equity. On settlement of the defined-benefit scheme, the revaluation of the liability as
part of the profit was taken to the profit or loss account. On the effective date of the new pension scheme,
the total cumulative actuarial gains and losses under the old defined-benefit pension scheme, which are
recognised under equity, totalled -2,320. The pension obligation came to 1,100. This was released in the profit
or loss account as a portion of profit on termination of the defined-benefit scheme, after deduction of tax in
the amount of 275. The one-time payment of 500 was also taken to the profit or loss account as a portion of
profit on termination of the defined-benefit scheme (375 after taxes). The profit or loss on termination of the
defined-benefit scheme is included in the ‘Other income’ item. The regular pension charges, included in the
‘Personnel charges’ item, for the scheme administered by the Rabobank Pension Fund were, on average,
486 (2012: 359) after taxes. The comprehensive income after taxation during the period under review as
recognised in the consolidated statement of comprehensive income, under the scheme administered by
Stichting Rabobank Pensioenfonds, amounted to -11.
in millions of euros 2013
Revaluation of net liabilities (667)
Profit from termination of defined-benefit pension scheme 1,517
Payment relating to termination of defined-benefit pension scheme (375)
Regular pension charges of Rabobank Pensioenfonds (486)
Comprehensive income after taxes (11)
Since the pension scheme administered by Stichting Rabobank Pensioenfonds no longer qualifies as a
defined-benefit pension scheme, practically the only pension schemes that continue to qualify as defined-
benefit schemes are those of Friesland Bank and ACCBank as at 31 December 2013. These are career-average
defined-benefit schemes, administered by a fund or otherwise. The assets are valued each year by
independent actuaries based on the method prescribed by IFRS. The most recent actuarial valuations were
performed at the end of 2013. The tables relating to the weighted averages of the main actuarial assumptions
and the future premium payments in 2013 relate to these two pension schemes. The table showing
investments in plan assets are based on the pension scheme administered by ACCBank.
in millions of euros 2013 2012
Present value of liabilities administered by funds 545 19,464
Fair value of plan assets 479 18,202
Net liabilities 66 1,262

72 Consolidated Financial Statements 2013 Rabobank Group
Movements in plan assets and liabilities:
in millions of euros 2013 2012
Present value of liabilities administered by funds
Present value of entitlements at 1 January 19,464 15,405
Foreign exchange differences - 2
Interest 244 708
Increase in entitlements during the year 225 471
Premiums contributed by the employees 16 40
Benefits paid (119) (289)
Transfer of accrued benefits - 27
Pension plan termination (20,620) (127)
Transferred to non-current assets held for sale and discontinued operations - (334)
Acquisition of Friesland Bank - 290
Curtailments (6) (12)
Other (3) 59
Actuarial gains and losses arising from changes in demographic assumptions (47) 30
Actuarial gains and losses arising from changes in financial assumptions 1,391 3,194
Present value of liabilities held in a fund as at 31 December 545 19,464
Fair value of plan assets
Fair value of assets at 1 January 18,202 16,208
Foreign exchange differences - 1
Interest 230 752
Premium contributed by the employer 491 573
Premiums contributed by the employees 17 40
Benefits paid (119) (289)
Transfer of accrued benefits and costs (5) (5)
Pension plan termination (18,779) (94)
Transferred to non-current assets held for sale and discontinued operations - (284)
Acquisition of Friesland Bank - 288
Other (3) (76)
Actuarial result 445 1,088
Fair value of assets at 31 December 479 18,202
Estimated premium contributions for 2014 are approximately 7. Plan assets have been allocated as follows:
2013 2012
Shares and alternatives 31.6% 41.6%
Interest-bearing securities 26.4% 48.8%
Real estate 6.2% 6.1%
Cash and cash equivalents 35.8% 3.5%
Total 100% 100%
The costs recognised in the consolidated profit or loss account are shown in the table below. Profit arising
from the conversion of the Rabobank Pension Fund from a defined-benefit pension scheme to a defined
contribution plan is included in Note 36, ‘Other income’.
in millions of euros 2013 2012
Interest on liabilities 244 708
Interest on plan assets (230) (752)
Costs based on period of employment during the year 225 471
Losses/(gains) on discounts, settlements and costs (1) 76
Total cost of defined benefit plans 238 503

73 Notes to the consolidated financial statements
The weighted averages of the main actuarial assumptions for the valuation of the pension provision (defined-
benefit pension schemes) as at 31 December are shown in the table below (in % per year).
2013 2012
Discount rate 3.8% 3.5%
Wage inflation 2.5% 1.7%
Price inflation 2.0% 2.0%
25.2 Other employee benefitsOther employee benefits mainly comprise early retirement liabilities for an amount of 1 (2012: -4) and
liabilities for future long-service awards for an amount of 96 (2012: 99).
26 Subordinated debt
in millions of euros 2013 2012
Rabobank Nederland 7,782 4,620
Trust Preferred Securities II - 415
Friesland Bank 9 345
Other 24 27
Total subordinated debt 7,815 5,407
Changes in the Trust Preferred Securities II are stated in the table below.
in millions of euros 2013 2012
Trust Preferred Securities II
At 1 January 415 429
Redemption of Trust Preferred Securities II (415) -
Foreign exchange differences and other - (14)
At 31 December - 415
Rabobank Nederland issued three subordinated loans in 2013: a 1,000 loan with a fixed interest rate of 3.875%
and a maturity date of 2023; a USD 1,750 loan with a fixed interest rate of 4.625% and a maturity date of 2023;
and a USD 1,250 loan with a fixed interest rate of 5.75% and a maturity date of 2043.
Rabobank Nederland issued three subordinated loans in 2012: a 1,000 loan with a fixed interest rate of 4.125%
and a maturity date of 2022; a GBP 500 loan with a fixed interest rate of 5.25% and a maturity date of 2027;
and a USD 1,500 loan with a fixed interest rate of 3.95% and a maturity date of 2022.
Rabobank Nederland issued a 1,000 loan in 2010 with a fixed interest rate of 3.75% and a maturity date of 2020.
Rabobank Nederland issued a 1,000 loan in 2009 with a fixed interest rate of 5.875% and a maturity date of 2019.
In 2003, Rabobank Capital Funding Trust II, Delaware, a group company of Rabobank Nederland, issued
1.75 million non-cumulative Trust Preferred Securities. The distribution is 5.26% until 31 December 2013,
after which the expected distribution is equal to the three-month USD Libor plus 1.6275%. The total proceeds
from this issue amounted to USD 1,750. As of 31 December 2013, these Trust Preferred Securities were
redeemed, with the prior written consent of the Dutch Central Bank.
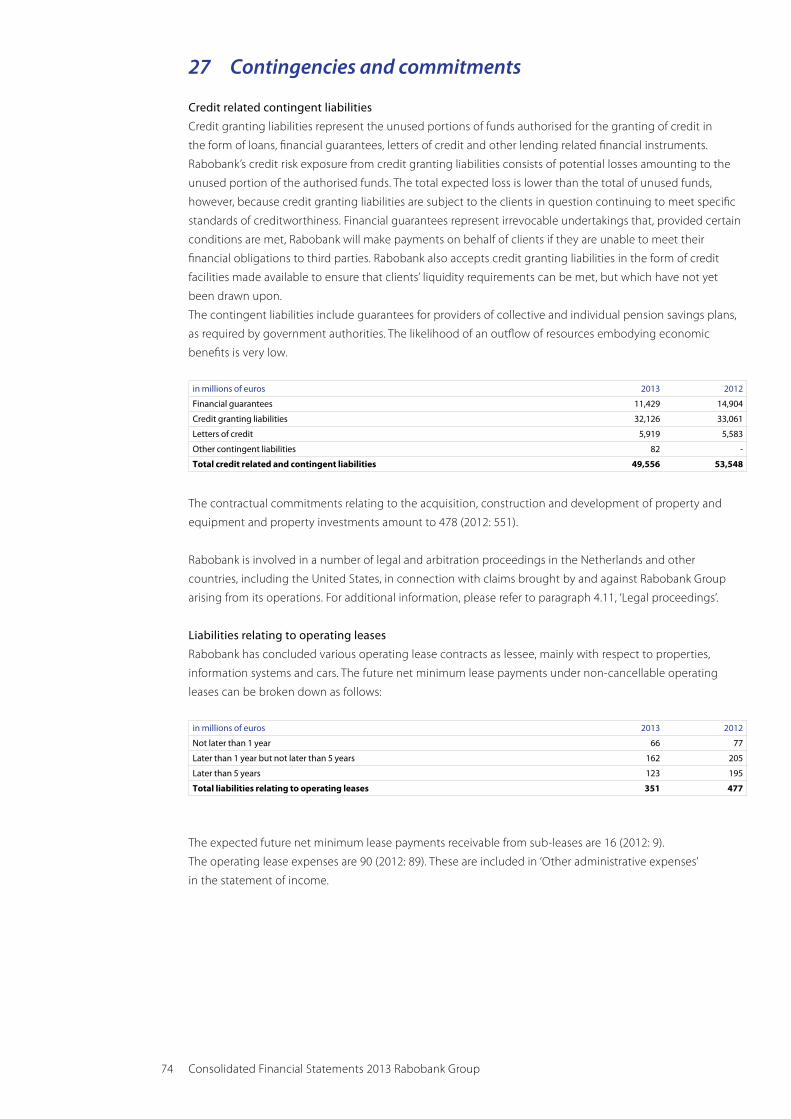
74 Consolidated Financial Statements 2013 Rabobank Group
27 Contingencies and commitments
Credit related contingent liabilities
Credit granting liabilities represent the unused portions of funds authorised for the granting of credit in
the form of loans, financial guarantees, letters of credit and other lending related financial instruments.
Rabobank’s credit risk exposure from credit granting liabilities consists of potential losses amounting to the
unused portion of the authorised funds. The total expected loss is lower than the total of unused funds,
however, because credit granting liabilities are subject to the clients in question continuing to meet specific
standards of creditworthiness. Financial guarantees represent irrevocable undertakings that, provided certain
conditions are met, Rabobank will make payments on behalf of clients if they are unable to meet their
financial obligations to third parties. Rabobank also accepts credit granting liabilities in the form of credit
facilities made available to ensure that clients’ liquidity requirements can be met, but which have not yet
been drawn upon.
The contingent liabilities include guarantees for providers of collective and individual pension savings plans,
as required by government authorities. The likelihood of an outflow of resources embodying economic
benefits is very low.
in millions of euros 2013 2012
Financial guarantees 11,429 14,904
Credit granting liabilities 32,126 33,061
Letters of credit 5,919 5,583
Other contingent liabilities 82 -
Total credit related and contingent liabilities 49,556 53,548
The contractual commitments relating to the acquisition, construction and development of property and
equipment and property investments amount to 478 (2012: 551).
Rabobank is involved in a number of legal and arbitration proceedings in the Netherlands and other
countries, including the United States, in connection with claims brought by and against Rabobank Group
arising from its operations. For additional information, please refer to paragraph 4.11, ‘Legal proceedings’.
Liabilities relating to operating leases
Rabobank has concluded various operating lease contracts as lessee, mainly with respect to properties,
information systems and cars. The future net minimum lease payments under non-cancellable operating
leases can be broken down as follows:
in millions of euros 2013 2012
Not later than 1 year 66 77
Later than 1 year but not later than 5 years 162 205
Later than 5 years 123 195
Total liabilities relating to operating leases 351 477
The expected future net minimum lease payments receivable from sub-leases are 16 (2012: 9).
The operating lease expenses are 90 (2012: 89). These are included in ‘Other administrative expenses’
in the statement of income.

75 Notes to the consolidated financial statements
Payments receivable from operating leases
Rabobank has concluded various operating lease contracts as lessor. The future minimum lease payments
receivable from non-cancellable operating leases can be broken down as follows:
in millions of euros 2013 2012
Not later than 1 year 1,137 1,032
Later than 1 year but not later than 5 years 2,210 1,900
Later than 5 years 172 20
Total payments receivable from operating leases 3,519 2,952
No contingent lease payments were recognised as assets during the year under review.
28 Equity of Rabobank Nederland and local Rabobanks
This item includes equity of Rabobank Nederland and local Rabobanks
in millions of euros 2013 2012
Foreign currency translation reserves (575) (163)
Revaluation reserve for available-for-sale financial assets 282 420
Revaluation reserve for associates 29 50
Revaluation reserve - cash flow hedges 49 40
Revaluation reserve - pensions (3,251) (2,493)
Retained earnings 28,107 27,457
Total reserves and retained earnings at year-end 24,641 25,311
Changes in reserves were as follows:
in millions of euros 2013 2012
Translation differences emerging during the year
Opening balance (163) 86
Currency translation differences emerging during the year (412) (249)
Closing balance (575) (163)
The recalculation reserves for foreign currencies include no amounts (2012: -6) relating to non-current assets
held for sale and discontinued operations.
in millions of euros 2013 2012
Revaluation reserve for available-for-sale financial assets
Opening balance 420 93
Foreign exchange differences (43) 21
Changes in associates (28) 59
Fair value changes (34) 393
Amortisation of reclassified assets 37 55
Transferred to profit or loss (70) (201)
Closing balance 282 420
The revaluation reserve for available-for-sale financial assets includes an amount of 20 (2012: 24) in non-current
assets held for sale and discontinued operations.

76 Consolidated Financial Statements 2013 Rabobank Group
in millions of euros 2013 2012
Revaluation reserve for associates
Opening balance 50 66
Fair value changes (21) (16)
Closing balance 29 50
Stakes can be increased such that they are classified as consolidations. In that case, the original stake is
revalued at the fair valued at the time the stake was increased. The revaluation reserves – equity interests
contain no amounts (2012: 20) relating to non-current assets held for sale and discontinued operations.
in millions of euros 2013 2012
Revaluation reserve - cash flow hedges
Opening balance 40 (112)
Fair value changes 1,450 145
Transferred to profit or loss (1,459) 7
Closing balance 49 40
in millions of euros 2013 2012
Revaluation reserve – pensions
Opening balance (2,493) (882)
Fair value changes (758) (1,611)
Closing balance (3,251) (2,493)
in millions of euros 2013 2012
Retained earnings
Opening balance 27,457 26,367
Net profit attributable to Rabobank Nederland and local Rabobanks 929 843
Other (279) 247
Closing balance 28,107 27,457
Total reserves and retained earnings 24,641 25,311
29 Rabobank (Member) Certificates
As part of its member loyalty programme, Rabobank issued certificates and member certificates between
2000 and 2005. They were depositary receipts for registered shares in the following investment institutions:
Rabobank Ledencertificaten I N.V., Rabobank Ledencertificaten II N.V. and Rabobank Ledencertificaten III N.V..
There were four issues, in 2000, 2001, 2002 and 2005, raising more than 6,300 in total. On 30 December 2008,
the investment institutions merged to form a single investment institution, Rabobank Ledencertificaten N.V..
In 2011, changes in international laws and regulations, known as the Basel III arrangements, required
modification of the Rabobank (Member) Certificates. The new Rabobank (Member) Certificates are certificates
of units of participation directly issued by Rabobank Nederland. The exchange enables the new Rabobank
(Member) Certificates to count towards Rabobank Group’s equity (common equity tier 1), as did the former
certificates. Until around February 2013, when supply and demand in the internal market were virtually in
balance, supply increased and demand – in particular subordinated bonds – fell as a result of the debt crisis
and market conditions and as a result of Rabobank Nederland’s duty-of-care programme. Rabobank
Nederland purchased in the internal market Rabobank (Member) Certificates for which there was no demand.
The company received permission from the Dutch Central Bank in October 2012 to purchase EUR 1 billion
worth of Rabobank (Member) Certificates in its purchase fund (Treasury Stock). In August 2013, Rabobank
Nederland then announced that, on reaching EUR 1 billion in Rabobank (Member) Certificates in the Treasury
Stock, the Dutch Central Bank gave its consent to withdraw this 1 billion so as to create another EUR 1 billion
facility. This made it possible to purchase an amount of up to EUR 2 billion in Rabobank (Member) Certificates.

77 Notes to the consolidated financial statements
Up to around the end of October, the oversupply of Rabobank (Member) Certificates was in line with
expectations. However, there was an increase in the supply of Rabobank (Member) Certificates in the internal
market after the announcement of the Libor settlement. On 6 November 2013, Rabobank Nederland reduced
the number of outstanding Rabobank (Member) Certificates by 40 million (EUR 1 billion).
In early December 2013, Rabobank entered into an agreement with a third party in order to transfer Rabobank
(Member) Certificates to institutional investors. At the same time, it was announced that the planned
minimum distribution would be raised from 5.2% to 6.5% on an annual basis and that Rabobank intended to
list the Rabobank (Member) Certificates on the stock exchange. The listing will expand our investor base as
well as improve tradability. The option to issue a total of EUR 1 billion (nominal) was used twice in
December 2013.
On 14 January 2014, the certificate holder meeting approved the proposed change in order to facilitate a
Euronext Amsterdam listing. The Rabobank Certificates have been listed on Euronext Amsterdam since
27 January 2014. The distribution paid per certificate in 2013 was EUR 1.275 (2012: EUR 1.25). The Executive
Board is entitled not to pay the distribution. Unpaid distribution will not be paid at a later date. At year-end
2013, the total number of certificates was 237,961,365. At the end of 2013, around 125,000 investors put their
funds into the Rabobank Certificates and Member Certificates.
The amounts listed in the table below are based on the par value of EUR 25 per Rabobank Certificate or
Member Certificate. Premiums and discounts on Rabobank (Member) Certificates issued and recouped and
the costs of the issue after taxation are included in retained earnings (see the consolidated statement of
assets). Cash flows arising from changes during the year in the Rabobank (Member) Certificates are included
in the consolidated statement of cash flows. Paragraph 4.9, ‘Fair values of financial assets and liabilities’,
contains further information on the derivatives acquired from the December 2013 issues.
Rabobank (Member) Certificates
in millions of euros 2013 2012
Changes during the year:
Opening balance 6,672 6,614
Rabobank (Member) Certificates redeemed during the year (2,074) (167)
Exchange of Rabobank Extra Member Notes 225 225
Rabobank (Member) Certificates issued during the year 1,000 -
Closing balance 5,823 6,672
30 Capital Securities and Trust Preferred Securities III to VI
Capital Securities and Trust Preferred Securities III to VI can be broken down as follows:
in millions of euros 2013 2012
Capital Securities 7,265 7,350
Trust Preferred Securities III to VI 1,269 1,340
Total Capital Securities and Trust Preferred Securities III to VI 8,534 8,690
Capital SecuritiesAll Capital Securities are perpetual and have no expiry date. The distribution on the Capital Securities per issue
is as follows.
Issue of USD 2,000 millionThe distribution is 8.40% per year and is made payable every six months in arrears as of the issue date
(9 November 2011), for the first time on 29 December 2011. The Capital Securities are perpetual and first
redeemable on 29 June 2017. If the Capital Securities are not redeemed early, the distribution is set for a
further five-year period, without a step-up, based on the US Treasury Benchmark Rate plus a 7.49% mark-up.
78 Consolidated Financial Statements 2013 Rabobank Group
Issue of USD 2,000 millionThe distribution is 8.375% per year and is made payable every six months in arrears as of the issue date
(26 January 2011), for the first time on 26 July 2011. With effect from 26 July 2016 and if the Capital Securities
are not redeemed early, the distribution is set for a further five-year period, without a step-up, based on the
US Treasury Benchmark Rate plus a 6.425% mark-up.
Issue of EUR 500 millionThe distribution is 9.94% per year and is made payable annually in arrears as of the issue date
(27 February 2009), for the first time on 27 February 2010. As from 27 February 2019, the distribution will
be made payable every quarter based on the three-month Euribor plus an annual 7.50% mark-up.
Issue of NZD 280 millionThe distribution equals the five-year swap interest plus an annual 3.75% mark-up and was set at 8.7864% per
annum on 25 May 2009. As from the issue date (27 May 2009), the distribution is made payable every quarter
in arrears, for the first time on 18 June 2009 (short first interest period). From 18 June 2014, the distribution
will be made payable every quarter based on five-year swap interest plus an annual 3.75% mark-up to be set
on 18 June 2014. From 18 June 2019, the distribution will be made payable every quarter based on the 90-day
bank bill swap interest rate plus an annual 3.75% mark-up.
Issue of USD 2,868 millionThe distribution is 11.0% per year and is made payable every six months in arrears as of the issue date
(4 June 2009), for the first time on 31 December 2009 (long first interest period). As from 30 June 2019 the
distribution will be made payable every quarter based on the three-month USD Libor plus an annual 10.868%
mark-up.
Issue of CHF 750 millionThe distribution is 6.875% per year and is made payable annually in arrears as of the issue date (14 July 2009),
for the first time on 12 November 2009 (short first interest period). As from 12 November 2014 the distribution
will be made payable every six months based on the six-month CHF Libor plus an annual 4.965% mark-up.
Issue of USD 130 millionThe distribution is 7% per year and is made payable every six months in arrears as of the issue date (6 June
2008), for the first time on 6 December 2008. This issue was redeemed early on the first early redemption date
in 2013.
Issue of GBP 250 millionThe distribution is 6.567% per year and is made payable every six months in arrears as of the issue date
(10 June 2008), for the first time on 10 December 2008. As from 10 June 2038, the distribution will be made
payable every six months based on the six-month GBP Libor plus an annual 2.825% mark-up.
Issue of CHF 350 millionThe distribution is 5.50% per year and is made payable annually in arrears as of the issue date (27 June 2008),
for the first time on 27 June 2009. As from 27 June 2018, the distribution will be made payable every six
months on 27 June and 27 December based on the six-month CHF Libor plus an annual 2.80% mark-up.
Issue of ILS 323 millionThe distribution is 4.15% per year and is made payable annually in arrears as of the issue date (14 July 2008),
for the first time on 14 July 2009. As from 14 July 2018, the distribution will be made payable annually based
on an index related to the interest rate paid on Israeli government bonds with terms between 4.5 and 5.5
years plus an annual 2.0% mark-up.

79 Notes to the consolidated financial statements
Issue of USD 225 millionThe distribution is 7.375% per year and is made payable every six months in arrears as of the issue date
(24 September 2008), for the first time on 24 March 2009.
Issue of USD 750 millionThe distribution on the USD Capital Securities is 7% per year and is made payable every six months in arrears
as of the issue date (22 October 2007), for the first time on 22 April 2008. This issue was redeemed early on the
first early redemption date, 22 October 2012.
Issue of NZD 900 millionThe distribution on the NZD Capital Securities equals the one-year swap interest rate plus an annual 0.76%
mark-up and is made payable annually on 8 October, until 8 October 2017. As from 8 October 2017, the
distribution will be made payable every quarter based on the 90-day bank bill swap interest rate plus the
same mark-up.
The level of Rabobank Nederland’s profit may influence the distribution on the Capital Securities. Should
Rabobank Nederland become insolvent, the Capital Securities are subordinate to the rights of all other
(current and future) creditors of Rabobank Nederland, unless the rights of those other creditors substantively
determine otherwise.
Issue of EUR 125 millionFriesland Bank N.V. issued perpetual Capital Securities in November 2004. These are undated bonds, listed at
the Euronext stock exchange. As from 3 December 2014, the loan may be redeemed in full after prior approval
is received from the supervisory authority. The bonds are subordinated to the bank’s all other present and
future liabilities. For supervisory purposes, the bond loan qualifies as part of the bank’s core capital.
The distribution on the bond loan is linked to the yield on Dutch 10-year government bonds. A 0.125% mark-up
applies, subject to a maximum distribution of 8%. The interest rate is reset on a quarterly basis. Interest
payments must be deferred if, 20 days prior to the date of payment, it is known that payment of interest will
cause the solvency ratio to drop below the minimum capital required by the supervisory authority. In
addition, the bank may decide to defer interest payments.
Trust Preferred Securities III to VI issued by group companiesIn 2004, four tranches of non-cumulative Trust Preferred Securities were issued.
• Rabobank Capital Funding Trust III, Delaware, a group company of Rabobank Nederland, issued 1.50 million
non-cumulative Trust Preferred Securities. The expected distribution is 5.254% until 21 October 2016. For
the period 21 October 2016 to 31 December 2016 inclusive, the expected distribution is equal to the USD
Libor interpolated for the period, plus 1.5900%. The company has the right not to make a distribution.
Thereafter, the expected distribution is equal to the three-month USD Libor plus 1.5900%. The total
proceeds from this issue amounted to USD 1,500 million. As from 21 October 2016, these Trust Preferred
Securities can be repurchased on each distribution date (which is once a quarter) after prior written
approval is received from the Dutch Central Bank.
• Rabobank Capital Funding Trust IV, Delaware, a group company of Rabobank Nederland, issued
350 thousand non-cumulative Trust Preferred Securities. The expected distribution is 5.556% until
31 December 2019, after which the expected distribution is equal to the six-month GBP Libor plus 1.4600%.
The company has the right not to make a distribution. The total proceeds from this issue amounted to GBP
350 million. As from 31 December 2019, these Trust Preferred Securities can be repurchased on each
distribution date (which is once every half-year) after prior written approval is received from the Dutch
Central Bank.

80 Consolidated Financial Statements 2013 Rabobank Group
• Rabobank Capital Funding Trust V, Delaware, a group company of Rabobank Nederland, issued 250 thousand
non-cumulative Trust Preferred Securities. The expected distribution is three-month BBSW plus 0.6700%
until 31 December 2014, after which the expected distribution is equal to the three-month BBSW plus
1.6700%. The company has the right not to make a distribution. The total proceeds from this issue
amounted to AUD 250 million. As from 31 December 2014, these Trust Preferred Securities can be
repurchased on each distribution date (which is once a quarter) after prior written approval is received
from the Dutch Central Bank.
• Rabobank Capital Funding Trust VI, Delaware, a group company of Rabobank Nederland, issued 250 thousand
non-cumulative Trust Preferred Securities. The expected distribution is 6.415% until 31 December 2014,
after which the expected distribution is equal to the three-month BBSW plus 1.6700%. The company has
the right not to make a distribution. The total proceeds from this issue amounted to AUD 250 million.
As from 31 December 2014, these Trust Preferred Securties can be repurchased on each distribution date
(which is once a quarter) after prior written approval is received from the Dutch Central Bank.
A distribution becomes due on the Trust Preferred Securities issued in 1999 and 2003 included under
subordinated debt if:
(I) the most recent, audited and adopted consolidated financial statements of Rabobank Nederland show
that Rabobank Group realised a net profit (after tax and extraordinary expenses) in the previous year; or
(II) a distribution is made on securities that are more subordinated (such as Rabobank (Member) Certificates)
or on securities of equal rank (pari passu); subject to the provision that no distribution becomes due
should the Dutch Central Bank object (for example, if Rabobank Group’s solvency ratio is below 8%).
The condition stated under (i) does not apply to Trust Preferred Securities issued in 2004. The other conditions
do apply. If Rabobank Group realises a profit, Rabobank Nederland can make a distribution on these securities
at its own discretion.
Trust Preferred Securities
in millions of euros 2013 2012
Changes during the year:
Opening balance 1,340 1,399
Foreign exchange differences and other (71) (59)
Closing balance 1,269 1,340
31 Other non-controlling interests
This item relates to shares held by third parties in subsidiaries and other group companies. The amount listed
in ‘Other third-party interests’ relating to non-current assets and liabilities held for sale and discontinued
operations is nil (2012: 3).
in millions of euros 2013 2012
Opening balance 1,407 2,676
Net profit 52 95
Currency translation differences (16) (5)
Entities included in consolidation/deconsolidated - (8)
Sale of Sarasin - (661)
Increase in equity interests in Obvion and Bank BGZ - (591)
Revaluation reserve - available-for-sale financial assets - 22
Increase in stake in structured finance deal (360) -
Other (44) (121)
Closing balance 1,039 1,407
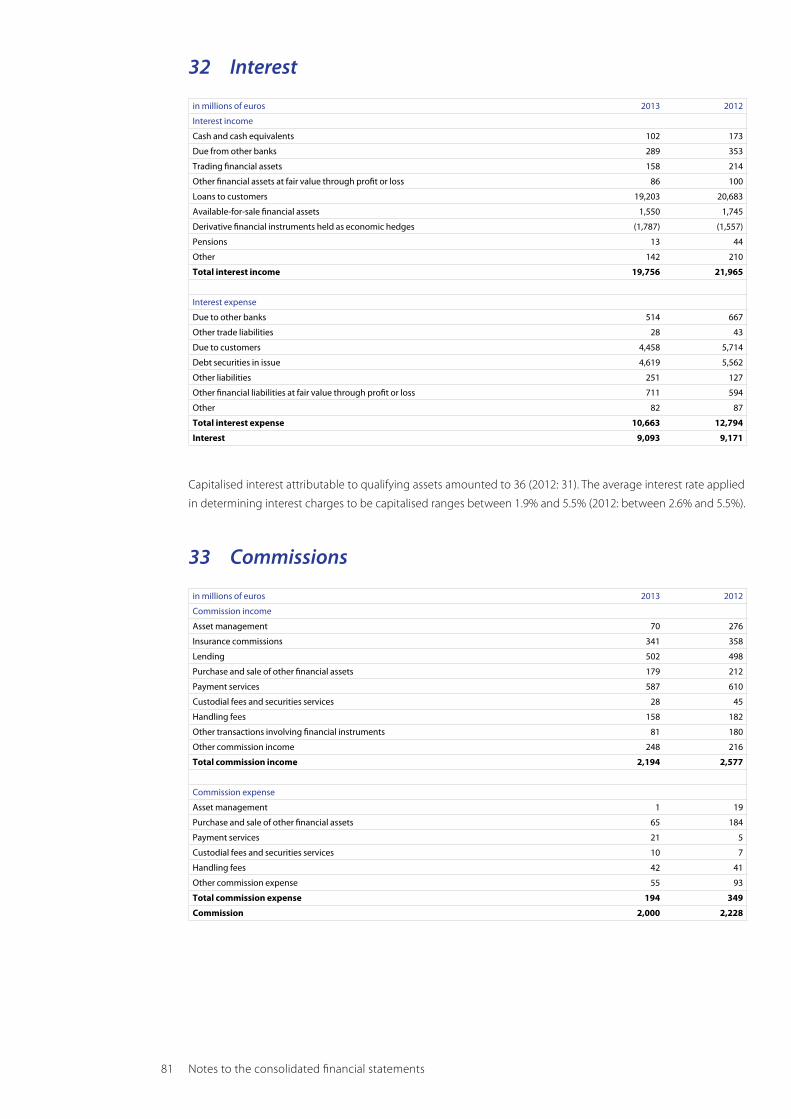
81 Notes to the consolidated financial statements
32 Interest
in millions of euros 2013 2012
Interest income
Cash and cash equivalents 102 173
Due from other banks 289 353
Trading financial assets 158 214
Other financial assets at fair value through profit or loss 86 100
Loans to customers 19,203 20,683
Available-for-sale financial assets 1,550 1,745
Derivative financial instruments held as economic hedges (1,787) (1,557)
Pensions 13 44
Other 142 210
Total interest income 19,756 21,965
Interest expense
Due to other banks 514 667
Other trade liabilities 28 43
Due to customers 4,458 5,714
Debt securities in issue 4,619 5,562
Other liabilities 251 127
Other financial liabilities at fair value through profit or loss 711 594
Other 82 87
Total interest expense 10,663 12,794
Interest 9,093 9,171
Capitalised interest attributable to qualifying assets amounted to 36 (2012: 31). The average interest rate applied
in determining interest charges to be capitalised ranges between 1.9% and 5.5% (2012: between 2.6% and 5.5%).
33 Commissions
in millions of euros 2013 2012
Commission income
Asset management 70 276
Insurance commissions 341 358
Lending 502 498
Purchase and sale of other financial assets 179 212
Payment services 587 610
Custodial fees and securities services 28 45
Handling fees 158 182
Other transactions involving financial instruments 81 180
Other commission income 248 216
Total commission income 2,194 2,577
Commission expense
Asset management 1 19
Purchase and sale of other financial assets 65 184
Payment services 21 5
Custodial fees and securities services 10 7
Handling fees 42 41
Other commission expense 55 93
Total commission expense 194 349
Commission 2,000 2,228
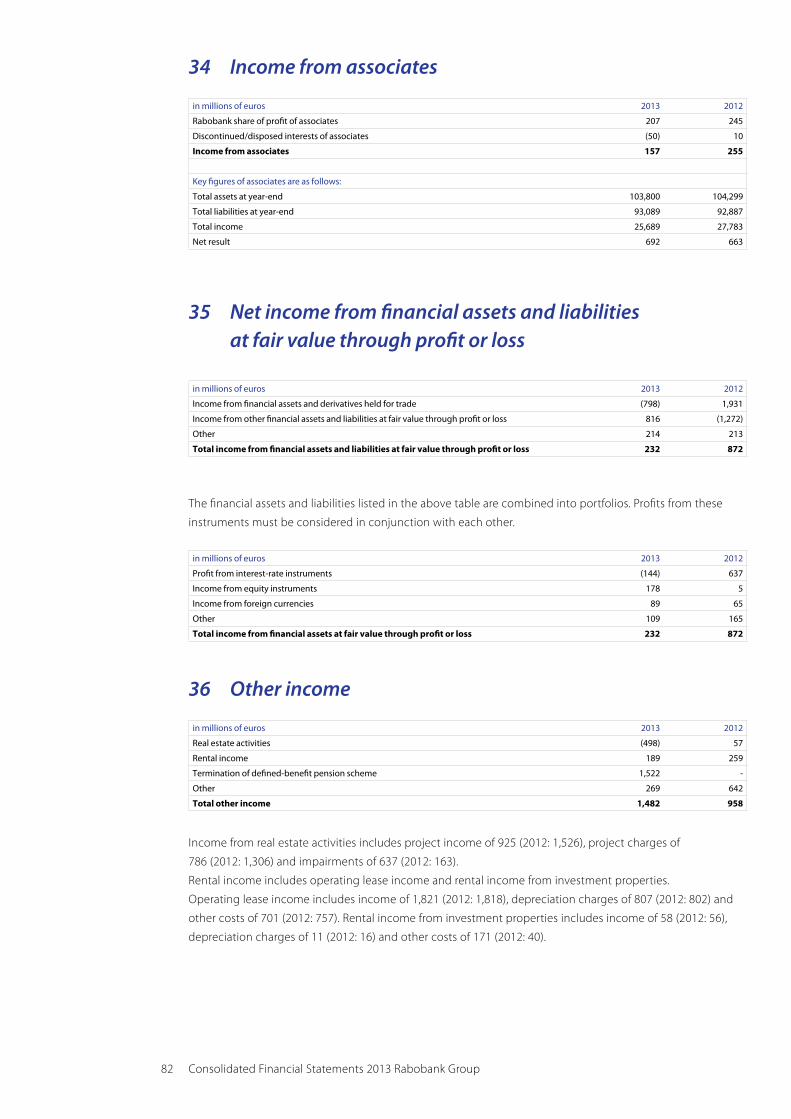
82 Consolidated Financial Statements 2013 Rabobank Group
34 Income from associates
in millions of euros 2013 2012
Rabobank share of profit of associates 207 245
Discontinued/disposed interests of associates (50) 10
Income from associates 157 255
Key figures of associates are as follows:
Total assets at year-end 103,800 104,299
Total liabilities at year-end 93,089 92,887
Total income 25,689 27,783
Net result 692 663
35 Net income from financial assets and liabilities at fair value through profit or loss
in millions of euros 2013 2012
Income from financial assets and derivatives held for trade (798) 1,931
Income from other financial assets and liabilities at fair value through profit or loss 816 (1,272)
Other 214 213
Total income from financial assets and liabilities at fair value through profit or loss 232 872
The financial assets and liabilities listed in the above table are combined into portfolios. Profits from these
instruments must be considered in conjunction with each other.
in millions of euros 2013 2012
Profit from interest-rate instruments (144) 637
Income from equity instruments 178 5
Income from foreign currencies 89 65
Other 109 165
Total income from financial assets at fair value through profit or loss 232 872
36 Other income
in millions of euros 2013 2012
Real estate activities (498) 57
Rental income 189 259
Termination of defined-benefit pension scheme 1,522 -
Other 269 642
Total other income 1,482 958
Income from real estate activities includes project income of 925 (2012: 1,526), project charges of
786 (2012: 1,306) and impairments of 637 (2012: 163).
Rental income includes operating lease income and rental income from investment properties.
Operating lease income includes income of 1,821 (2012: 1,818), depreciation charges of 807 (2012: 802) and
other costs of 701 (2012: 757). Rental income from investment properties includes income of 58 (2012: 56),
depreciation charges of 11 (2012: 16) and other costs of 171 (2012: 40).

83 Notes to the consolidated financial statements
37 Staff costs
in millions of euros 2013 2012
Wages and salaries 3,457 3,684
Social security contributions and insurance costs 420 444
Pension costs for defined contribution plans 463 58
Pension costs for defined benefit plans 224 547
Other post-employment benefits 9 (5)
Other staff costs 752 766
Total staff costs 5,325 5,494
Expressed in FTEs, the average number of employees was 58,249 (2012: 59,649).
In 2011, following implementation of CRD III and the regulations governing a restrained remuneration policy,
Rabobank Group adopted an amended remuneration policy. Accordingly, variable remuneration is paid to
identified staff (those capable of exercising material influence on Rabobank Group’s risk profile) during such a
period as to adequately take account of the risks inherent in the underlying business operations. Hence,
payment of a significant portion – at least 50% – of variable remuneration is deferred. The immediate portion
of variable remuneration is unconditional, whereas the deferred portion is conditional. The deferred portion
vests after three years if the conditions are met. Among other things, it is assessed whether there has been a
significant reduction in financial performance or a significant change in risk management at Rabobank Group
and/or the relevant subsidiary or business unit that puts the circumstances assessed when the relevant
variable remuneration was awarded in a different perspective (both personal performance and financial
performance of the business unit and Rabobank Group in that year). As a rule, the right to any outstanding
deferred remuneration lapses if the staff member’s employment ends before the deferred portion of the
variable remuneration vests.
Fifty percent of both the immediate and the deferred portion is awarded in cash. The cash component of the
immediate portion is paid out immediately following its award, whereas the cash component of the deferred
portion is paid out after the three-year vesting period, including the interest at a market rate accrued at the
end of the vesting period.
Of both the direct and the deferred portion of the variable remuneration, 50% is allocated in the form of an
instrument (instrument component), i.e. the Deferred Remuneration Note (DRN). Up to 2014, the amount of a
DRN was linked directly to the price of a Rabobank Certificate/Member Certificate (RMC) and, after 2014, to
the price of Rabobank Certificates (RC), as listed on NYSE Euronext. The instrument component is converted
into DRNs at the time of allocation on completion of the performance year. The number of DRNs is based on
the average closing prices for Rabobank Certificates as established on the NYSE Euronext exchange on the
first five trading days in February of each year, with the exception of 2014, during which the average closing
price for Rabobank Certificates will be the average of the closing prices of Rabobank Certificates as
established on NYSE Euronext on the five trading days from 17-21 February 2014 (inclusive). Accordingly,
this represents both the instrument component of the direct and the deferred portion of the variable
remuneration. The final number of DRNs relating to the deferred portion is established on vesting (i.e. after
a 3-year period).
The payment of the instrument component is subject to a 1-year retention period. On expiry of this period,
employees receive a cash amount for each DRN held (or a portion thereof ) corresponding to the amount of
(I) the DRN at that time and (II) an amount equal to the payments made for RCs during the period of
allocation until the expiry of the retention period.
Payment of the cash component of the variable remuneration is measured in accordance with IAS 19
Employee benefits, whereas payment of the DRNs is measured in accordance with IFRS 2 Share-based
Payment. The immediate portion of the variable remuneration is recognised in the performance year,
whereas the deferred portion is recognised in the years before vesting.
By and large, the same system is used for non-identified staff. Both the immediate and the deferred portion
are paid fully in cash, which means that no DRNs are awarded.

84 Consolidated Financial Statements 2013 Rabobank Group
At 31 December 2013, the costs of equity instrument-based payments were 8 (2012: 8). At 31 December 2013,
a liability of 18 was recognised (2012: 16). The costs of variable remuneration paid in cash were 109 (2012: 117).
The number of DRNs outstanding is presented below.
in thousands 2013 2012
Opening balance 986 547
Awarded during the year 308 439
Paid during the year (223) -
Changes from previous year (119) -
Closing balance 952 986
The amount of a DRN is linked directly to the price of an RC. The estimated payments to be made for the
variable remuneration are shown in the table below.
At 31 December 2013 Year of payment
in millions of euros 2014 2015 2016 2017 2018 Total
Variable remuneration, not including DRNs 102.0 13.9 7.5 7.3 - 130.7
DRNs 4.2 3.6 8.5 4.9 4.3 25.4
Total 106.2 17.5 16.0 12.2 4.3 156.1
At 31 December 2012 Year of payment
in millions of euros 2013 2014 2015 2016 2017 Total
Variable remuneration, not including DRNs 109.8 - 14.4 12.6 - 136.8
DRNs 5.6 4.5 - 8.3 6.5 24.9
Total 115.4 4.5 14.4 20.9 6.5 161.7
38 Other administrative expenses
The other administrative charges include the costs associated with the completion of the Libor settlement at
an amount of 774 and the addition to the reorganisation provision at an amount of 381. In addition, this item
also includes travel expenses, automation costs, IT-related costs, postage costs, publicity costs, office supplies,
rents and building maintenance expenses.
39 Depreciation and amortisation
in millions of euros 2013 2012
Depreciation of property and equipment 291 291
Amortisation of intangible assets 237 236
Total depreciation and amortisation 528 527
40 Value adjustments
in millions of euros 2013 2012
Due from other banks (7) (11)
Loans to customers 2,746 2,437
Receipts following write-offs (103) (87)
Credit related liabilities 6 8
Other assets 1 3
Total value adjustments 2,643 2,350

85 Notes to the consolidated financial statements
41 Bank tax
Banks operating in the Netherlands on 1 October of the year under review are required to pay bank tax.
There are two rates of bank tax: a rate of 0.044% for current liabilities and a rate of 0.022% for long-term
liabilities, based on the balance recorded in December 2012. Rabobank Group was charged a total of 197
in bank tax in 2013 (2012: 196).
42 Taxation
in millions of euros 2013 2012
Current income tax
Reporting period 351 55
Prior years 10 17
Deferred tax (293) 86
Income tax expense 68 158
The taxation on operating profit before taxation of Rabobank differs from the nominal amount based on
Dutch standard tax rates. The reconciliation between the two amounts is shown below:
in millions of euros 2013 2012
Operating profit before taxation 415 2,067
Tax exempt income (374) (731)
Non-deductible expenses 854 129
Tax losses not recognised in prior years (7) (10)
Other (11) 11
877 1,466
Income tax expense based on a rate of 25.0% (2012: 25.0%) 219 367
Effect of different tax rates and other non-recurring tax gains or losses (151) (209)
Income tax expense 68 158
The non-tax-deductible charges consist mainly of the non-deduction of the settlement amount agreed by
Rabobank following the Libor investigations.
43 Non-current assets and liabilities held for sale
Sale of Bank BGZ In December 2013, Rabobank and BNP Paribas reached agreement regarding the cash sale of 98.5% of the
shares in Rabobank in Bank Gospodarki Zywnosciowej (Bank BGZ) for an amount of 4.2 billion Polish Zloty
(approximately EUR 1 billion). Impairment on goodwill is 10. The financial completion of the sale is scheduled
for the second half of 2014. The reserves included in equity in relation to Bank BGZ were added to profit and
result in a gain of approximately 21 after taxation.

86 Consolidated Financial Statements 2013 Rabobank Group
The following assets and liabilities are included in non-current assets and liabilities held for the BGZ sale:
in millions of euros 2013
AssetsCash and cash equivalents 390
Due from other banks 121
Loans to customers 6,346
Available-for-sale financial assets 1,163
Other assets 807
Total assets 8,827
LiabilitiesDue to other banks 828
Due to customers 6,408
Other liabilities 589
Total liabilities 7,825
The consolidated profit or loss account includes the following amounts:
in millions of euros 2013
Interest 243
Fees and commissions 65
Other income 31
Total income 339
Staff costs 110
Other costs 197
Operating profit before taxation 32
Taxation 7
Net profit 25
Other non-current assets held for saleThe non-current assets held for sale in the amount of 353 (2012: 137) mainly comprise various types of real
estate (including residential and commercial) in a variety of countries. The book value is expected to be
realised through sale rather than through continued operation. The real estate properties which have been
classified as ‘held for sale’ are mostly unique properties, with no active market for similar real estate in the
same location and the same condition. A large number of parameters are used for the valuations of the
various types of property investments, based on existing contracts and market data if possible. A certain level
of assessment and estimation is generally unavoidable, which is why all non-current assets classified as ‘held
for sale’ are classified in category III.
The parameters used to determine the fair value of the property investments, depending on the type of real
estate, include: the current and expected market rent per square metre, current and expected future vacancy
rates, the location of the property, the marketability of the property, the average discount rate, development
budget and any credit risk.
44 Acquisitions and disposals
Sale of RobecoIn February 2013, Rabobank signed a purchase agreement with the Japanese-based financial services provider
Orix regarding the sale of 90% of Robeco. In anticipation of future laws and regulations, Rabobank decided to
sell Robeco. The sale is also expected to increase the growth outlook for Robeco. Robeco is a strategic
acquisition of Orix and will be the main platform for future growth objectives relating to asset management.
Robeco will continue to provide services to its customers under the existing brand names.

87 Notes to the consolidated financial statements
The exact outcome of the negotiations regarding the sales agreements did not become clear until a later
stage. In the consolidated financial statements for 2012, the banking activities of Robeco (Roparco) are also
recognised as assets and liabilities held for sale and discontinued operations. The Robeco operations were not
sold and remain part of Rabobank Group. On 21 June 2013, Rabobank Nederland acquired Robeco’s banking
business – these operations will be accounted for in the Domestic Banking Retail business segment.
The comparative figures contained in the profit or loss account have been adjusted because the Robeco
banking business is no longer classified as a discontinued operation. Paragraph 2.1.1 shows the effect of the
elimination of the classification of Robeco’s banking business as a discontinued operation.
The acquisition was completed on 1 July 2013 and deconsolidated as of that date. The sales profit of 1,585 is
included in the net profit from discontinued operations. Rabobank retains a 10% stake in Robeco; this stake is
classified as held for sale, while the revaluation of 159 is included in the sales profit.
The table below shows the profit after taxation from discontinued operations.
in millions of euros 2013 2012
Interest 10 (8)
Fees and commissions 340 658
Other income 1,647 10
Total income 1,997 660
Staff costs 208 255
Other costs 70 172
Operating profit before taxation 1,719 233
Taxation 54 84
Impairment on goodwill - -
Net profit from discontinued operations 1,665 149
Of which attributable to Rabobank Nederland and local Rabobanks 1,665 149
Net profit from discontinued operations 1,665 149
The table below shows cash flows upon sale.
in millions of euros
Sale price 1,938
Shares in Orix (150)
Net cash flow 1,788
45 Transactions with related parties
Two parties are considered related if one party exercises control or has significant influence over the other
party (regarding finance or operating decisions). In the normal course of business, Rabobank conducts a wide
variety of transactions with related entities, involving different types of loans, deposits and transactions in
foreign currencies. Transactions between related parties also include transactions with associates, pension
funds, joint ventures, the Executive Board and the Supervisory Board. These transactions are conducted at
arm’s length conditions and against market prices. In accordance with IAS 24.4, transactions within Rabobank
Group are not disclosed in the consolidated financial statements.
In the normal course of Rabobank’s business operations, banking transactions are carried out with related
parties. These involve loans, deposits and transactions in foreign currencies. All these transactions were
conducted at arm’s length and against market prices. The volumes of related party transactions, year-end
outstanding balances and the corresponding income and expenses during the year are presented in the table
on the next page. Transactions and balances outstanding with members of the Executive Board and members
of the Supervisory Board are disclosed in note 47. Transactions with pension funds are disclosed in note 25.
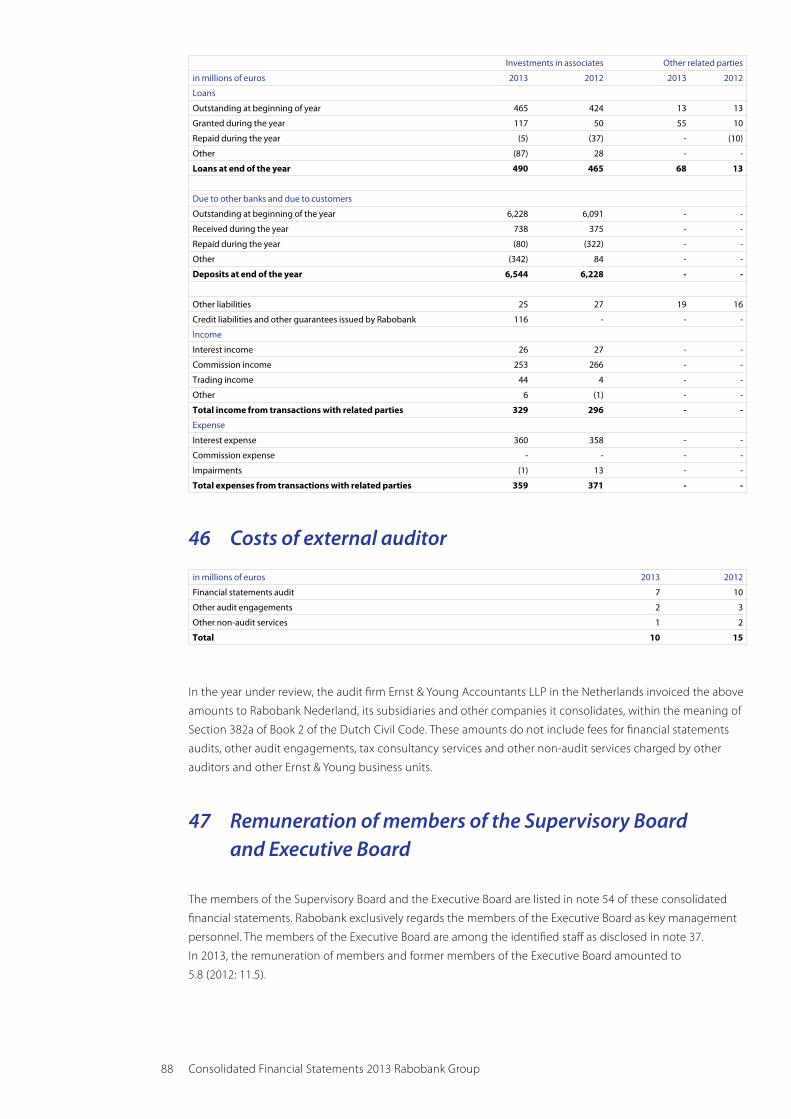
88 Consolidated Financial Statements 2013 Rabobank Group
Investments in associates Other related parties
in millions of euros 2013 2012 2013 2012
Loans
Outstanding at beginning of year 465 424 13 13
Granted during the year 117 50 55 10
Repaid during the year (5) (37) - (10)
Other (87) 28 - -
Loans at end of the year 490 465 68 13
Due to other banks and due to customers
Outstanding at beginning of the year 6,228 6,091 - -
Received during the year 738 375 - -
Repaid during the year (80) (322) - -
Other (342) 84 - -
Deposits at end of the year 6,544 6,228 - -
Other liabilities 25 27 19 16
Credit liabilities and other guarantees issued by Rabobank 116 - - -
Income
Interest income 26 27 - -
Commission income 253 266 - -
Trading income 44 4 - -
Other 6 (1) - -
Total income from transactions with related parties 329 296 - -
Expense
Interest expense 360 358 - -
Commission expense - - - -
Impairments (1) 13 - -
Total expenses from transactions with related parties 359 371 - -
46 Costs of external auditor
in millions of euros 2013 2012
Financial statements audit 7 10
Other audit engagements 2 3
Other non-audit services 1 2
Total 10 15
In the year under review, the audit firm Ernst & Young Accountants LLP in the Netherlands invoiced the above
amounts to Rabobank Nederland, its subsidiaries and other companies it consolidates, within the meaning of
Section 382a of Book 2 of the Dutch Civil Code. These amounts do not include fees for financial statements
audits, other audit engagements, tax consultancy services and other non-audit services charged by other
auditors and other Ernst & Young business units.
47 Remuneration of members of the Supervisory Board and Executive Board
The members of the Supervisory Board and the Executive Board are listed in note 54 of these consolidated
financial statements. Rabobank exclusively regards the members of the Executive Board as key management
personnel. The members of the Executive Board are among the identified staff as disclosed in note 37.
In 2013, the remuneration of members and former members of the Executive Board amounted to
5.8 (2012: 11.5).

89 Notes to the consolidated financial statements
in thousands of eurosTotal
salariesPension
contributions
Total performance-related bonus
Redemption of remuneration
component Total
P.W. Moerland (served until 29 October 2013) 862 255 6 - 1,123
M. Minderhoud (joined on 29 October 2013) 164 - - - 164
A. Bruggink 884 261 7 - 1,152
R.J. Dekker (joined 1 November 2013) 118 35 - - 153
J.A.M. van der Linden (served until 4 September 2013) 600 177 13 - 790
B.J. Marttin 884 261 - - 1,145
H. Nagel (joined on 1 November 2013) 118 35 - - 153
S.N. Schat (served until 18 November 2013) 810 239 7 - 1,056
A.G. Silvis (served until 25 January 2013) 74 22 - - 96
Total for 2013 4,514 1,285 33 - 5,832
Total for 2012 6,905 1,607 177 2,791 11,480
Mr Moerland resigned from the Executive Board on 29 October and subsequently retired on 1 November.
Mr Moerland’s remuneration was accounted for until 1 November. He did not receive any severance pay.
Mr Schat resigned from the Executive Board effective 18 November; his remuneration was accounted for until
1 December. The standard notice period of four months until 1 April 2014 will be complied with. Based on an
arbitration decision, Mr Schat received severance pay equivalent to one year’s salary. The severance pay and
the four months of remuneration during the notice period (including three months in 2014) were accounted
for in the 2013 financial year, but are not included in the table above. Ms Silvis resigned from the Executive
Board effective 25 January; one month of remuneration has been accounted for on her behalf.
Mr Van der Linden resigned from the Executive Board on 4 September for health reasons; a total of nine
months of remuneration was accounted for on his behalf. Mr Minderhoud joined the Executive Board on
29 October, followed by Mr Nagel and Mr Dekker on 1 November. Two months of remuneration has been
accounted for all three members. Mr Minderhoud does not participate in the pension scheme.
The voluntary repayment of 2 made by members of the Executive Board as part of the settlements made in
relation to the Libor investigations are not included in the table.
The amounts included in the table are also exclusive of the (non-recurrent) tax of 16% on the wages from
current employment, provided this wage was in excess of EUR 150,000. The levy is 0.8 (2012: 1.4).
Although no performance-related bonuses were paid during either remuneration year 2012 or remuneration
year 2013, a modest amount was paid under this heading in 2013. This represents interest paid on amounts
deferred in accordance with the Group Remuneration Policy, along with the difference between the price of
DRNs during the remuneration year and those during the year of allocation, 2011.
Total charges under staff costs fell to 5.0 (2012: 11.8). The decline in 2013 is mainly the result of the expiry of
the redemption of a remuneration component completed in 2012 which was intended primarily for early
retirement or as a pension supplement, the regular expiry of this remuneration component, the voluntary
repayment of part of the variable remuneration and the fact that the Executive Board was not complete in
2013, on the one hand, and the severance pay awarded to Mr Schat, on the other.
Since the variable remuneration for members of the Executive Board was discontinued in 2013, the number of
DRNs granted for the performance year 2013 to members and former members of the Executive Board is
0 (2012: 0). The number of DRNs outstanding with members and former members of the Executive Board was
7,409 units at year-end 2013 (year-end 2012: 41,177 units).
The pension scheme of the members of the Executive Board qualifies as a group defined-benefit scheme.
Expenses relating to members and former members of the Supervisory Board came to a total of 1.6 (2012: 1.5).
This includes the VAT and employer’s contributions payable. The increase is mainly the result of the fact that,
since 1 January 2013, the remuneration of supervisory board members has been subject to VAT. In addition to
remuneration for the role of member of the Supervisory Board of Rabobank Nederland, the remuneration also
depends on the roles of the various committees. The composition of these committees is included in the annual
report. The table on the next page shows the compensation structure for 2013 (excluding VAT and other charges).

90 Consolidated Financial Statements 2013 Rabobank Group
in euros Chairperson Deputy Chairperson Member
Supervisory Board 288,750 71,500 55,000
Audit, Compliance & Risk Committee (until 25 September 2013) 65,000 30,000 30,000
Audit Committee (as from 25 September 2013) 32,500 15,000 15,000
Risk Committee (as from 25 September 2013) 32,500 15,000 15,000
Appeals Committee 7,500 - 7,500
Cooperative Issues Committee 15,000 - 15,000
Appointments Committee 3,750 - 3,750
Remuneration Committee 3,750 - 3,750
The table below shows the remuneration (excluding VAT and other charges) for individual Supervisory
Board members.
in thousands of euros Remuneration
W. Dekker (chairman effective 20 June 2013) 231
Ms I.P. Asscher-Vonk 85
A. de Bruijn (served until 1 July 2013) 35
C.H. van Dalen (joined on 1 September 2013) 26
L.N. Degle 85
Ms L.O. Fresco 77
S.L.J. Graafsma 95
L. Koopmans (served until 1 July 2013) 171
E.A.J. van de Merwe 91
M. Minderhoud (served until 29 October 2013) 97
R. Teerlink (joined on 1 September 2013) 28
M.J.M. Tielen (served until 1 July 2013) 39
C.P. Veerman 75
A.J.A.M. Vermeer 121
Total for 2013 1,256
Total for 2012 1,298
At Rabobank, the Chairman of the Supervisory Board holds a number of roles which are related to the
cooperative. These roles are specified in the Annual Report.
The loans, advances and guarantees of the members of the Executive Board who were in office on
31 December 2013 and the average interest rates are shown in the table below.
in millions of eurosOutstanding
loansAverage interest
rate (in %)
As at 31 December 2013
M. Minderhoud 0.2 1.4
R.J. Dekker 1.3 2.8
H. Nagel 1.0 2.1
B.J. Marttin 0.9 4.0
The loans, advances and guarantees of the members of the Supervisory Board in office at 31 December 2013
and the average interest rates are shown in the table below.
in millions of eurosOutstanding
loansAverage interest
rate (in %)
As at 31 December 2013
C.H. van Dalen 0.6 4.2
C.P. Veerman* 0.9 3.8
A.J.A.M. Vermeer** 0.0 2.9
* Excluding business loans in the amount of 4.1 at an average interest rate of 5.4%
** Excluding business loans in the amount of 1.2 at an average interest rate of 3.8%

91 Notes to the consolidated financial statements
The Supervisory Board members not listed in the table did not receive any loans, advances or guarantees
at the end of 2013. These transactions with Executive Board members and Supervisory Board members in
person were completed based on employee terms and/or market-level rates for the Supervisory Board.
The amount of the rates depends in part on the currency, the agreed fixed-interest period and the time the
transaction was completed or the time a new fixed-interest term becomes effective.
Several members of the Executive Board and Supervisory Board have invested in Rabobank Certificates in
person and/or through their own pension B.V.s. This involved a total number of 28,101 certificates at the end
of 2013.
Number of Rabobank Certificates
As at 31 December 2013
A. Bruggink 12,166
Ms I.P. Asscher-Vonk 6,894
L.N. Degle 4,000 (in pension B.V.)
S.L.J. Graafsma 4,050 (in pension B.V.)
A.J.A.M. Vermeer 991 (including 800 in pension B.V.)
48 Principal subsidiaries and associates
Name Share Voting rights
Subsidiaries
The Netherlands
De Lage Landen International B.V. 100% 100%
Rabo Vastgoedgroep N.V. 100% 100%
OWM Rabobanken B.A. 100% 100%
Obvion N.V. 100% 100%
Friesland Bank N.V. 100% 100%
Rabohypotheekbank N.V. 100% 100%
Rabo Merchant Bank N.V. 100% 100%
Raiffeisenhypotheekbank N.V. 100% 100%
Schretlen & Co N.V. 100% 100%
Other eurozone/EU countries
ACCBank Plc 100% 100%
North America
Rabobank Capital Funding LCC II to VI 100% 100%
Rabobank Capital Funding Trust II to VI 100% 100%
Utrecht America Holdings Inc. 100% 100%
Australia and New Zealand
Rabobank Australia Limited 100% 100%
Rabobank New Zealand Limited 100% 100%
Investments in associates
The Netherlands
Achmea B.V. 29% 29%
Equens N.V. 15% 15%
Gilde Venture Capital fondsen Divers Divers
Rabobank holds less than 20% of the voting rights in Equens, but has significant influence over Equens.
For instance, two members of the Supervisory Board of Equens, as well as the chairman of the
Audit & Compliance Committee, are Rabobank representatives. On account of Rabobank’s significant
influence over Equens, the interest qualifies as an associate.

92 Consolidated Financial Statements 2013 Rabobank Group
49 Joint ventures
The table includes the assets and liabilities and the income and expense items of joint ventures listed below.
The amounts reflect Rabobank’s interests. Most joint ventures are entities of Rabo Real Estate Group.
in millions of euros 2013 2012
AssetsLoans and due from other banks 52 56
Loans and due from private and public-sector clients 98 120
Real estate 621 594
Other assets 25 21
Total assets 796 791
LiabilitiesDue to other banks 227 184
Due to private and public-sector clients 366 364
Other liabilities 203 243
Total liabilities 796 791
Operating income (34) -
Operating expense 3 3
Operating profit before taxation (37) (3)
Taxation 1 1
Net profit (36) (4)
The principal joint ventures in which Rabo Real Estate Group participates are:
Inflation Exchange Fund Capital N.V., Netherlands (40%)
ZOM Real Estate Service B.V., Netherlands (50%)
Ontwikkelingscombinatie Wateringse Veld C.V., Netherlands (50%)
Rotij Planontwikkeling B.V., Netherlands (25%)
Bouwfonds - Fortis Vastgoedontwikkeling Leidsche Rijn V.O.F., Netherlands (50%)
IJ-Delta Ontwikkeling V.O.F., Netherlands (25%)
V.O.F. Leidschendam Centrum, Netherlands (25%)
50 Transfer of financial assets and financial assets provided as collateral
Reverse repurchase transactions and securities borrowing agreementsReverse repurchase transactions and securities borrowing agreements concluded by Rabobank are included
under ‘Due from other banks’ or ‘Loans to customers’. At 31 December, they amounted to:
in millions of euros 2013 2012
Due from other banks 22,418 16,848
Loans to customers 10,697 11,410
Total reverse repurchase transactions and securities borrowing agreements 33,115 28,258
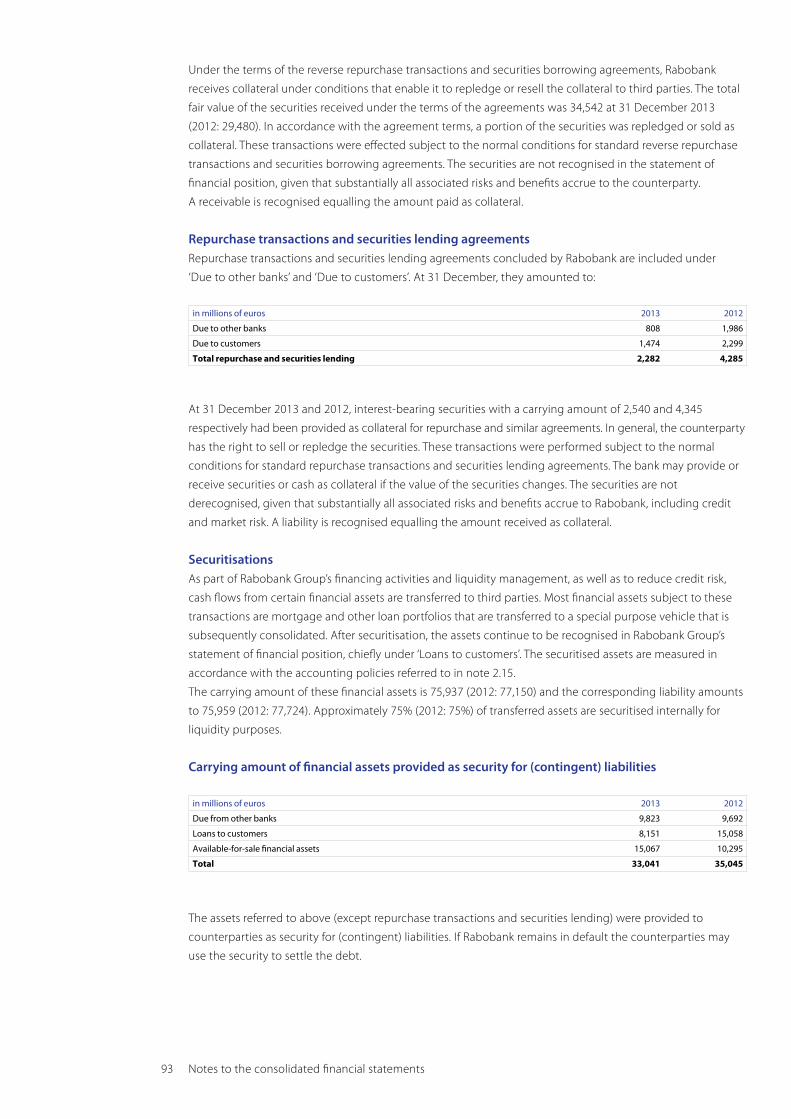
93 Notes to the consolidated financial statements
Under the terms of the reverse repurchase transactions and securities borrowing agreements, Rabobank
receives collateral under conditions that enable it to repledge or resell the collateral to third parties. The total
fair value of the securities received under the terms of the agreements was 34,542 at 31 December 2013
(2012: 29,480). In accordance with the agreement terms, a portion of the securities was repledged or sold as
collateral. These transactions were effected subject to the normal conditions for standard reverse repurchase
transactions and securities borrowing agreements. The securities are not recognised in the statement of
financial position, given that substantially all associated risks and benefits accrue to the counterparty.
A receivable is recognised equalling the amount paid as collateral.
Repurchase transactions and securities lending agreementsRepurchase transactions and securities lending agreements concluded by Rabobank are included under
‘Due to other banks’ and ‘Due to customers’. At 31 December, they amounted to:
in millions of euros 2013 2012
Due to other banks 808 1,986
Due to customers 1,474 2,299
Total repurchase and securities lending 2,282 4,285
At 31 December 2013 and 2012, interest-bearing securities with a carrying amount of 2,540 and 4,345
respectively had been provided as collateral for repurchase and similar agreements. In general, the counterparty
has the right to sell or repledge the securities. These transactions were performed subject to the normal
conditions for standard repurchase transactions and securities lending agreements. The bank may provide or
receive securities or cash as collateral if the value of the securities changes. The securities are not
derecognised, given that substantially all associated risks and benefits accrue to Rabobank, including credit
and market risk. A liability is recognised equalling the amount received as collateral.
SecuritisationsAs part of Rabobank Group’s financing activities and liquidity management, as well as to reduce credit risk,
cash flows from certain financial assets are transferred to third parties. Most financial assets subject to these
transactions are mortgage and other loan portfolios that are transferred to a special purpose vehicle that is
subsequently consolidated. After securitisation, the assets continue to be recognised in Rabobank Group’s
statement of financial position, chiefly under ‘Loans to customers’. The securitised assets are measured in
accordance with the accounting policies referred to in note 2.15.
The carrying amount of these financial assets is 75,937 (2012: 77,150) and the corresponding liability amounts
to 75,959 (2012: 77,724). Approximately 75% (2012: 75%) of transferred assets are securitised internally for
liquidity purposes.
Carrying amount of financial assets provided as security for (contingent) liabilities
in millions of euros 2013 2012
Due from other banks 9,823 9,692
Loans to customers 8,151 15,058
Available-for-sale financial assets 15,067 10,295
Total 33,041 35,045
The assets referred to above (except repurchase transactions and securities lending) were provided to
counterparties as security for (contingent) liabilities. If Rabobank remains in default the counterparties may
use the security to settle the debt.

94 Consolidated Financial Statements 2013 Rabobank Group
51 Events after the reporting date
No events occurred following the reporting date that provide additional information on the actual situation
on the reporting date.
52 Balance sheet as at 1 January 2012
in millions of euros At 1 January 2012
AssetsCash and cash equivalents 70,430
Due from other banks 25,221
Trading financial assets 8,112
Other financial assets at fair value through profit or loss 7,015
Derivative financial instruments 58,973
Loans to customers 468,085
Available-for-sale financial assets 51,930
Held-to-maturity financial assets 109
Investments in associates 3,340
Intangible assets 2,802
Property and equipment 6,132
Investment properties 784
Current tax assets 571
Deferred tax assets 995
Other assets 11,035
Non-current assets held for sale and discontinued operations 14,956
Total assets 730,490
LiabilitiesDue to other banks 26,259
Due to customers 329,892
Debt securities in issue 213,441
Derivative financial instruments and other trade liabilities 64,931
Other debts 8,422
Other financial liabilities at fair value through profit or loss 25,889
Provisions 765
Current tax liabilities 324
Deferred tax liabilities 600
Subordinated debt 2,413
Liabilities held for sale and discontinued operations 13,435
Total liabilities 686,371
EquityEquity of Rabobank Nederland and local Rabobanks 25,618
Equity instruments issued directly
Rabobank (Member) Certificates 6,614
Capital Securities 7,645
14,259
Equity instruments issued by subsidiaries
Capital Securities 167
Trust Preferred Securities III to VI 1,399
1,566
Other non-controlling interests 2,676
Total equity 44,119
Total equity and liabilities 730,490

95 Notes to the consolidated financial statements
53 Management’s report on internal control over financial reporting
The management of Coöperatieve Centrale Raiffeisen-Boerenleenbank B.A. (Rabobank Nederland)
is responsible for establishing and maintaining adequate internal control over financial reporting.
Management is also responsible for the preparation and fair presentation of the consolidated
financial statements.
Rabobank Nederland’s internal control over financial reporting is a process designed to provide reasonable
assurance regarding the reliability of financial reporting and the preparation and fair presentation of financial
statements for external purposes in accordance with International Financial Reporting Standards as adopted
by the European Union.
All internal control systems, no matter how well designed, have inherent limitations. Because of its inherent
limitations, internal control over financial reporting may not prevent or detect misstatements. Also, projections
of any evaluation of effectiveness to future periods are subject to the risk that control may become
inadequate, because of changes in conditions, or that the degree of compliance with the policies or
procedures may deteriorate.
Management assessed the effectiveness of Rabobank Nederland’s internal control over financial reporting as
of 31 December 2013 based on the framework set forth by the Committee of Sponsoring Organisations of the
Treadway Commission (COSO) established in Internal Control - Integrated Framework. Based on that
assessment, management concluded that, as of 31 December 2013, Rabobank Nederland’s internal control
over financial reporting is effective based on the criteria established by COSO.
Ernst & Young Accountants LLP, which has audited the consolidated financial statements of Rabobank
Nederland for the financial year ended 31 December 2013, also examined management’s assessment of
the effectiveness of Rabobank Nederland’s internal control over financial reporting and the effectiveness
of Rabobank Nederland’s internal control over financial reporting; its report is included on page 97.
M. Minderhoud A. Bruggink
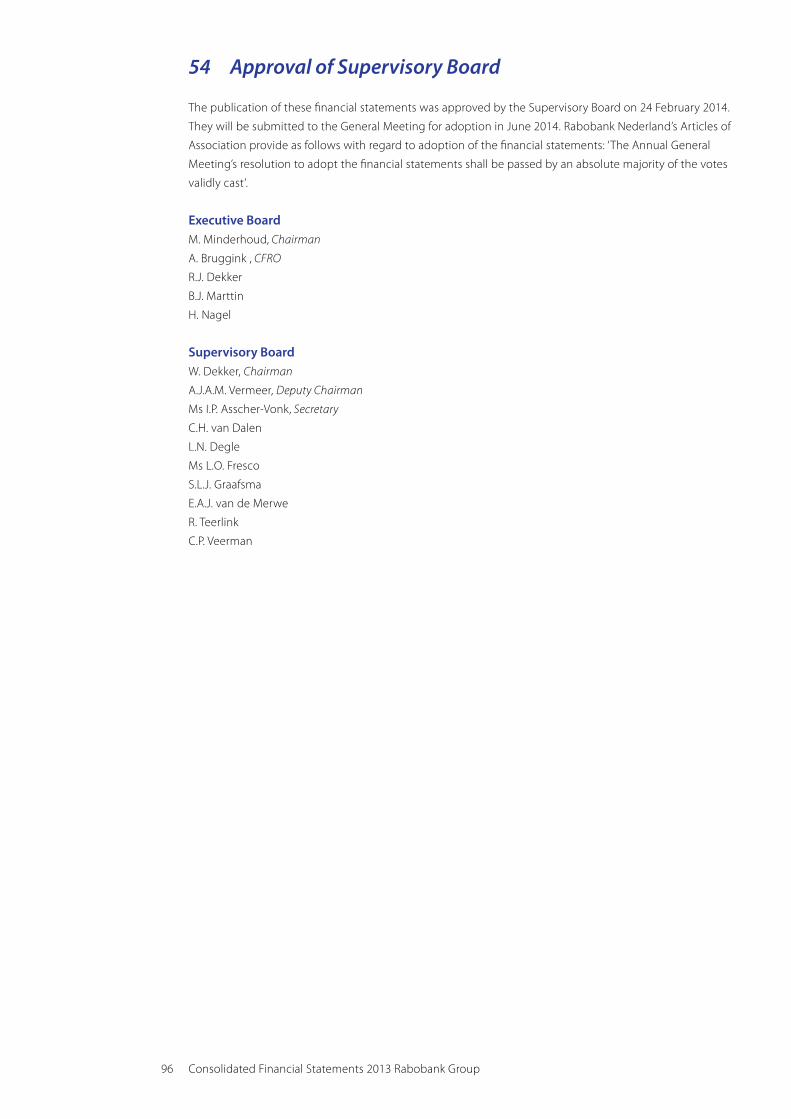
96 Consolidated Financial Statements 2013 Rabobank Group
54 Approval of Supervisory Board
The publication of these financial statements was approved by the Supervisory Board on 24 February 2014.
They will be submitted to the General Meeting for adoption in June 2014. Rabobank Nederland’s Articles of
Association provide as follows with regard to adoption of the financial statements: ‘The Annual General
Meeting’s resolution to adopt the financial statements shall be passed by an absolute majority of the votes
validly cast’.
Executive BoardM. Minderhoud, Chairman
A. Bruggink , CFRO
R.J. Dekker
B.J. Marttin
H. Nagel
Supervisory BoardW. Dekker, Chairman
A.J.A.M. Vermeer, Deputy Chairman
Ms I.P. Asscher-Vonk, Secretary
C.H. van Dalen
L.N. Degle
Ms L.O. Fresco
S.L.J. Graafsma
E.A.J. van de Merwe
R. Teerlink
C.P. Veerman
97 Independant auditor’s report
Independant auditor’s report
To the executive board and supervisory board of Rabobank Nederland
Report on the consolidated financial statementsWe have audited the consolidated financial statements 2013 which are part of the financial statements of
Coöperatieve Centrale Raiffeisen-Boerenleenbank B.A. (Rabobank Nederland), Amsterdam, and comprise the
consolidated statement of financial position as at 31 December 2013, the consolidated statement of income,
consolidated statement of comprehensive income, consolidated statement of changes in equity and
consolidated statement of cash flows for the year then ended and notes, comprising a summary of significant
accounting policies and other explanatory information.
Executive board’s responsibility The executive board of Rabobank Nederland is responsible for the preparation and fair presentation of these
consolidated financial statements in accordance with International Financial Reporting Standards as adopted
by the European Union and with Part 9 of Book 2 of the Dutch Civil Code, and for the preparation of the
executive board report in accordance with Part 9 of Book 2 of the Dutch Civil Code. Furthermore the executive
board is responsible for such internal control as it determines is necessary to enable the preparation of the
consolidated financial statements that are free from material misstatement, whether due to fraud or error.
Auditor’s responsibilityOur responsibility is to express an opinion on these consolidated financial statements based on our audit. We
conducted our audit in accordance with Dutch law, including the Dutch Standards on Auditing. This requires
that we comply with ethical requirements and plan and perform the audit to obtain reasonable assurance
about whether the consolidated financial statements are free from material misstatement.
An audit involves performing procedures to obtain audit evidence about the amounts and disclosures in the
consolidated financial statements. The procedures selected depend on the auditor’s judgment, including the
assessment of the risks of material misstatement of the consolidated financial statements, whether due to
fraud or error.
In making those risk assessments, the auditor considers internal control relevant to the entity’s preparation
and fair presentation of the consolidated financial statements in order to design audit procedures that are
appropriate in the circumstances. An audit also includes evaluating the appropriateness of accounting
policies used and the reasonableness of accounting estimates made by the executive board of Rabobank
Nederland, as well as evaluating the overall presentation of the consolidated financial statements.
We believe that the audit evidence we have obtained is sufficient and appropriate to provide a basis for our
audit opinion.
Opinion with respect to the consolidated financial statementsIn our opinion, the consolidated financial statements give a true and fair view of the financial position of
Rabobank Nederland as at 31 December 2013, and of its result and its cash flows for the year then ended in
accordance with International Financial Reporting Standards as adopted by the European Union and with
Part 9 of Book 2 of the Dutch Civil Code.

98 Consolidated Financial Statements 2013 Rabobank Group
Report on other legal and regulatory requirementsPursuant to the legal requirement under Section 2:393 sub 5 at e and f of the Dutch Civil Code, we have no
deficiencies to report as a result of our examination whether the management board report , to the extent we
can assess, has been prepared in accordance with Part 9 of Book 2 of this Code, and whether the information
as required under Section 2:392 sub 1 at b-h has been annexed. Further we report that the management
board report , to the extent we can assess, is consistent with the consolidated financial statements as required
by Section 2:391 sub 4 of the Dutch Civil Code.
Amsterdam, 24 February 2014
Ernst & Young Accountants LLP
/s/ C.B. Boogaart
99 Independant auditor’s assurance report
To the executive board and supervisory board of Rabobank Nederland
Assurance reportWe have performed an assurance engagement on internal control over financial reporting of Coöperatieve
Centrale Raiffeisen-Boerenleenbank B.A. (Rabobank Nederland).
A company’s internal control over financial reporting is a process designed to provide reasonable assurance
regarding the reliability of financial reporting and the preparation of consolidated financial statements in
accordance with generally accepted accounting policies. A company’s internal control over financial reporting
includes those policies and procedures that:
1. pertain to the maintenance of records that, in reasonable detail, accurately and fairly reflect the transactions
and dispositions of the assets of the company;
2. provide reasonable assurance that transactions are recorded as necessary to permit preparation of
consolidated financial statements in accordance with generally accepted accounting policies, and that
receipts and expenditures of the company are being made only in accordance with authorisations of
management and directors of the company; and
3. provide reasonable assurance regarding prevention or timely detection of unauthorised acquisition, use, or
disposition of the company’s assets that could have a material effect on the consolidated financial statements.
Inherent limitationsBecause of its inherent limitations, internal control over financial reporting may not prevent or detect
misstatements. Also, projections of any evaluation of effectiveness to future periods are subject to the risk that
controls may become inadequate because of changes in conditions, or that the degree of compliance with
the policies or procedures may deteriorate.
Executive Board’s responsibilityThe Executive Board of Rabobank Nederland is responsible for maintaining effective internal control over
financial reporting and for its assessment of the effectiveness of internal control over financial reporting.
Auditor’s responsibilityOur responsibility is to conclude on the Executive Board’s assessment and on the effectiveness of Rabobank
Nederland’s internal control over financial reporting based on the procedures performed during our
assurance engagement.
We conducted our assurance engagement in accordance with Dutch law, including ISAE 3000 ‘Assurance
engagements other than audits or reviews of historical financial information’ based on criteria established in
‘Internal Control – Integrated Framework’, issued by the Committee of Sponsoring Organisations of the
Treadway Commission (the COSO criteria).
This requires that we plan and perform the assurance engagement to obtain reasonable assurance about
whether effective internal control over financial reporting was maintained in all material respects. Our assurance
engagement included obtaining an understanding of internal control over financial reporting, evaluating
the assessment of Rabobank Nederland’s Executive Board, testing and evaluate the design and operating
effectiveness of internal control, and performing such other procedures as we considered necessary in the
circumstances.
Independent auditor’s Assurance report

100 Consolidated Financial Statements 2013 Rabobank Group
We believe that the evidence we have obtained is sufficient and appropriate to provide a basis for our
conclusion.
ConclusionBased on the procedures performed we conclude that the Executive Board’s conclusion that, as of 31
December 2013, Rabobank Nederland’s internal control over financial reporting is effective, is fairly stated, in
all material respects, based on the COSO criteria.
Amsterdam, 24 February 2014
Ernst & Young Accountants LLP
/s/ C.B. Boogaart

101 Independant auditor’s assurance report

102 Consolidated Financial Statements 2013 Rabobank Group
Colophon
Published byRabobank Nederland Communications Departments
DisclaimerThese Consolidated Financial Statements are a translation of the Dutch Consolidated Financial
Statements. In the event of any conflict in interpretation, the Dutch original takes precedence.
About the Consolidated Financial StatementsThis publication, the financial statements and the separate edition ‘Annual Report 2013
Rabobank Group’ together form the annual report, the financial statements and other
information of the Coöperatieve Centrale Raiffeisen-Boerenleenbank B.A.
FilingAfter they have been adopted, the Annual Report 2013, the Financial Statements 2013 and
other information will be filed at the offices of Trade Registry of the Chamber of Commerce
and Industries under number 30.046.259.
Annual ReportingIn 2014 Rabobank Group publishes the following annual reporting documents, both in English
and in Dutch:
• Annual Summary 2013 Rabobank Group - Jaarbericht 2013 Rabobank Groep
• Annual Report 2013 Rabobank Group - Jaarverslag 2013 Rabobank Groep
• Consolidated Financial Statements 2013 Rabobank Group - Geconsolideerde jaarrekening 2013
Rabobank Groep
• Financial Statements 2013 Rabobank Nederland - Jaarrekening 2013 Rabobank Nederland
• Capital Adequacy and Risk Management Report 2013 (Pillar 3) - only in English
• Sustainability Report 2013 Rabobank Group - Duurzaamheidsverslag 2013 Rabobank Groep
• Interim Report 2014 Rabobank Group - Halfjaarverslag 2014 Rabobank Groep
Rabobank Group’s annual reporting is online available on www.rabobank.com/annualreports
and www.rabobank.com/jaarverslagen.
Materials usedRabobank Group uses environmentally-friendly materials when printing this document.
ContactRabobank Group has exercised the utmost care in compiling the information contained in these
Consolidated Financial Statements. If you have any questions or wish to suggest any
improvements to our reporting, please contact us at [email protected].
Coöperatieve Centrale Raiffeisen-Boerenleenbank B.A. (Rabobank Nederland)Croeselaan 18, P.O. Box 17100, 3500 HG Utrecht, The Netherlands
+31 30 216 0000

Consolidated Financial Statements 2013 Rabobank GroupApril 2014www.rabobank.com/annualreports
Rabobank Group
Consolidated Financial Statements 2013