conservation planning at the landscape scale: …reon/nick_reos_personal_website/...journal of...
TRANSCRIPT
Journal of Environmental Planning and Management,Vol. 47, No. 5, 709–736, September 2004
Conservation Planning at the Landscape Scale:A Landscape Ecology Method for Regional Land Trusts
JONATHAN KAZMIERSKI, MEGAN KRAM, ELIZABETH MILLS,DAVID PHEMISTER, NICHOLAS REO, CHRISTOPHER RIGGS,RYAN TEFERTILLER & DONNA ERICKSON
(Received July 2003; revised January 2004)
ABSTRACT This paper illustrates a landscape ecology approach for land trusts under-taking conservation at the watershed scale. A conservation plan was created for theGrand Traverse Regional Land Conservancy (GTRLC) in the headwaters of Michigan’sManistee River Watershed (USA). Eight conservation drivers were devised to identifyConservation Focus Areas (CFAs) of highest ecological importance. The CFAs wereranked based on ecological importance, feasibility of protection and size. Parcels wereranked, totalling nearly 5000 ha, within the three highest-ranking CFAs in one keycounty. This approach is useful to land trusts trying to operationalize three distinctgoals in conservation planning: to find areas of high ecological importance, to promotethe landscape’s spatial integrity and to delineate threats to ecological systems andprocesses.
Introduction
Non-profit land trusts play an increasingly important role in protecting millionsof hectares of private land throughout the USA. Private land conservation is oneof the fastest-growing segments of the environmental movement. Currently 1263local and regional non-profit land trusts are operating in the USA, a 42%increase over 1990 levels (Land Trust Alliance, 2002). While land trusts’ growthand achievements have been significant, these organizations often lack a clearprocess for identifying the most important areas to conserve. Given persistentresource constraints and the vast number of conservation opportunities, organi-zations clearly benefit from a systematic method for ranking land for potentialprotection. Such methods are becoming even more important as land trustsevolve from making opportunistic land deals to developing more active conser-vation strategies.
This project develops a method of applying a landscape ecology approachto land trust conservation at the landscape scale. (Landscape scale is used here
Correspondence Address: Donna Erickson, School of Natural Resources and Environment,University of Michigan, 430 E. University Avenue, Ann Arbor, Michigan, USA. Tel:734-763-4457. Fax: 734-936-2195. Email: [email protected]
0142-6397 Print/1469-9710 Online/04/050709-28 ! 2004 University of Newcastle upon TyneDOI: 10.1080/0964056042000274443
710 J. Kazmierski et al.
as the scale at which multiple ecosystems are situated across the landscape. It isthe scale at which ecological processes and human use are critically linkedthrough developed infrastructure, ownership, and management.) A land conser-vation plan was designed to guide the efforts of the Grand Traverse RegionalLand Conservancy (GTRLC) in the 12 uppermost sub-watersheds of the Manis-tee River in northwestern Lower Michigan. By ranking lands for conservationaccording to ecological criteria, the research team identified over 4856 ha across63 parcels on which to focus GTRLC’s protection efforts in the upper part of thewatershed, and documented the threats to ecological integrity. This method canbe useful to land trusts or conservancies wishing to find areas of high ecologicalimportance, based not only on species richness or rarity, but also on other factorscontributing to ecological soundness.
Background
Transition from Species to Landscape Approach to Conservation
Natural areas have often been characterized and evaluated in terms of the rarespecies, exemplary communities or other unique features they contain. Individ-ual species harbour unique genetic material and comprise important compo-nents of functional ecosystems, making the preservation of species undeniablyimportant (Knight, 1998). Such scientific evidence has supported a strong pushfor conserving biodiversity in the USA and around the world.
With the passage of the Endangered Species Act and the development ofstate and federal threatened and endangered species lists, the public began toadvocate for protection of individual species and community types. Proponentsof the species-level approach stress that the public easily grasps its aims. Peopleinherently understand, and feel more emotionally connected to, individualspecies more than they do large ecosystem processes. Species gain more publicsupport because people can see the results of conservation efforts more clearlywith the survival or improvement of a population (Knight, 1998).
Given this traditional focus, most conservation efforts protect local, island-like preserves. However, a landscape-scale approach is gaining scientificjustification, public credibility and conservation funding (Slocombe, 1993; Lapin& Barnes, 1995; Cowell, 1998; Soule & Terborgh, 1999; Poiani et al., 2000).According to O’Neill et al. (1997), the simplest indicator of biotic integrity is totalchange in land cover; therefore, understanding and guiding larger landscapechanges will help protect biodiversity. Conservation biologists Soule & Terborgh(1999) proposed a national scientific programme for ecosystem protection,regional connectivity and ecological restoration at unprecedented scales.Their work promotes what they call “geographically extensive conservationprojects”.
Since political decisions are made at broad scales—river basins, forestdistricts, counties—protection at that scale is logical. The argument that theenvironment should be managed in whole ecological units based on integratedbiological, physical and/or socio-economic analyses is not a new one. However,the shift from species to landscape conservation has generated a number of newquestions. Implementation is difficult, and a number of scholars have proposedorganizing frameworks (Slocombe, 1993; Poiani et al., 2000; Shindler, 2000;Loehle et al., 2002; Ferrier, 2002). In addition, various reserve selection al-
Conservation Planning at the Landscape Scale 711
gorithms have been devised for selecting conservation sites (Csuti et al., 1997),although these are usually limited to species richness or rarity. They do nottypically address size, location or quality of a natural area—all factors that playinto functional ecosystems.
Proponents of landscape-level approaches assert that long-term mainte-nance of biodiversity requires a strategy that considers regional biogeographyand landscape pattern above local concerns. Landscape ecology offers a frame-work for broader landscape planning; it is being used as a framework for thepreservation of spatial connections among ecosystems to maintain importantecological structures, such as corridors for animal movement, and vital ecologi-cal functions such as hydrological flux and storage (Knight, 1998). Landscapeecology also emphasizes the interface between humans and nature and recog-nizes that change is a fundamental landscape component (Naveh & Lieberman,1984; Forman & Godron, 1986; Hall, 1991; Hersperger, 1994).
Over the past 20 years, the literature describing landscape ecological ap-proaches to conservation has proliferated. For example, Hawkins & Selman(2002) explored the methodological issues in landscape ecological planning bycomparing three schools of thought, which they categorize as landscape stabi-lization, focal species and greenways. Vos et al. (2001) proposed a framework ofecologically scaled landscape indices and Botequilha Leitao & Ahern (2002)devised a conceptual framework for sustainable landscape planning, applyingmultiple metrics in a landscape ecology model for a Massachusetts (US) water-shed.
Increasingly, watersheds are used as the logical boundaries for undertakinglandscape ecological planning (Daily, 1997; Wooley & McGinnis, 1999; Kraft &Penberthy, 2000; Randhir et al., 2001) and for predicting landscape change(Steinitz et al., 2003). Some state governments are developing their own large-scale conservation plans based on watershed boundaries and landscape ecologyprinciples (Michaels, 1999), aided by contemporary Geographic InformationSystems (GIS). GIS is a primary tool for much of the work being done inlandscape and watershed planning (Lovejoy et al., 1997; O’Neill et al., 1997;Heikkila, 1998; Theobald et al., 2000).
Importance of Conservation Strategies for Private Land: The Role of Land Trusts
Decisions about changing land uses are generally made by individual landown-ers; cumulatively these decisions drastically change spatial landscape patterns(Beatley, 2000). Suitability analysis methods for landscape planning, used pri-marily to find suitable locations for development and protected farmland, weredeveloped in the last third of the 20th century (Pease & Coughlin, 1996;Hopkins, 1999; Steiner, 2000). The ranking and weighting schemes that weredeveloped have been used for selecting conservation sites on both public andprivate land. There is a growing awareness, within both private organizationsand public agencies, of the importance of protecting ecological values on privatelands (Morrisette, 2001), but few frameworks for choosing which lands toprotect. Over 90% of endangered species in the USA are estimated to occur onat least some private land (James, 1999). Habitat Conservation Planning at thefederal level is a prime example of public efforts to control landscape change on
712 J. Kazmierski et al.
private landscapes, but its effectiveness is debated (Noss et al., 1997; Polasky etal., 1997).
Land trusts and conservancies play an increasingly important role inlandscape-scale conservation, in partnership with governmental jurisdictions. By2000, land trusts had protected more than 2.5 million ha in the USA, a 226%increase over the 769 000 ha protected as of 1990 (Land Trust Alliance, 2002).Granted, most of this protection is site specific and does not encompass entirelandscapes. However, the pace of large-scale conservation by land trusts isincreasing, particularly as land trusts collaborate with government agencies,citizen groups, and other non-profit organizations. (Brammeier, et al., 1998;MacDonald, 2002). Examples are diverse, from the Fox River Watershed LandAlliance in Illinois, to the New England Forestry Foundation in Massachusetts,and the Wildlands Conservancy in California (Land Trust Alliance, 2002).
Many of these projects have adopted a landscape ecology approach (Poianiet al., 2000). The Trust for Public Land and the Open Space Institute usedlandscape ecology principles to protect the 7244-hectare Sterling Forest on theNew York-New Jersey border from large-scale commercial and residentialdevelopment (Lathrop & Bognar, 1998). On the other coast, the non-profitEnvironmental Alliance in Contra Costa County, California worked with federalpartners on a watershed plan for the Alhambra Creek Watershed (Myers et al.,1999). Both The Nature Conservancy (TNC) and World Wildlife Fund (WWF)have set conservation priorities at the scale of eco-regions, or large geographicareas delineated by climate, vegetation, geology and other ecological patterns(Groves et al., 2002). TNC seeks to protect biodiversity by using two complemen-tary planning activities (Poiani et al., 1998). An eco-regional plan identifies aportfolio of priority sites within a particular TNC-delineated eco-region. A siteconservation plan then more closely examines the ranked sites within theeco-region and offers on-the-ground conservation strategies. Each of the selectedsites contains a subset of the entire eco-region’s biodiversity so that, in theory,the conservation of all sites will collectively safeguard the biodiversity unique tothat eco-region. TNC conservation sites range in size from a few to millions ofhectares. TNC identifies species and natural communities as targets, analysesthreats to their viability and ranks land areas most important to conservebiodiversity (The Nature Conservancy, 2001).
The conservation planning efforts described above share a number ofcommon strategies for ranking protected lands: established conservation goals;designated conservation targets; and weighted schemes to rank targets. Landtrusts without the resources of the nation-wide organizations, such as smallerregional conservancies, need methods that are explicit, efficient, and reliable(Church et al., 1996) and they need to do the work in a cost-effective manner(Polasky et al., 2001). This project developed a method for conservation planningthat builds on landscape ecological approaches and is replicable for otherregional land trusts.
Research Objectives
This project was designed to identify areas of high conservation value and rankprivately owned land parcels for the Grand Traverse Regional Land Conserv-ancy (GTRLC) in the upper Manistee River Watershed. Conservation planninginvolves a number of stages, participants, and processes. Although the results
Conservation Planning at the Landscape Scale 713
are only briefly summarized here, the research team did a comprehensiveanalysis of historical land use, current land use and ownership, demographiccomposition, land-use regulation and stakeholder groups. Subsequent planningby GTRLC will involve continued work with watershed stakeholders.
The first goal was to find areas of high ecological importance, judging a landarea’s conservation value based on its ecological soundness relative to thesurrounding landscape. Specific objectives included protecting hydrologic in-tegrity, conserving wetland ecosystems, maintaining species biodiversity, pro-tecting a diversity of local ecosystems and conserving natural areas with a highquality and resiliency.
The second goal was to promote the landscape’s spatial integrity, using theknowledge that large and intact natural areas ensure greater ecological healththan do smaller, fragmented areas (Noss & Cooperrider, 1994; Dale et al., 1999).Specific objectives included conserving unfragmented landscapes, promoting theexpansion and connectivity of existing protected areas, and targeting large landparcels.
The third goal was to identify and delineate threats to ecological systemsand processes. This goal sought to present the extent, severity and location ofkey threats and, where possible, illustrate their geographic and causal relation-ships to identified areas of conservation importance.
Project Context
Grand Traverse Regional Land Conservancy
Founded in 1991, the Grand Traverse Regional Land Conservancy is a leadingregional land conservancy in Michigan’s northwestern Lower Peninsula. It hasa five-county service area. In the face of the area’s struggle with sprawl,farmland loss, fragmented forests and degraded natural areas, GTRLC’s missionis “to protect significant natural, scenic and farm lands for present and futuregenerations”. By 2002 GTRLC had preserved over 5800 ha, including 27 naturepreserves, 108 conservation easements, and nearly 66 km of lake, river andstream shoreline (Grand Traverse Regional Land Conservancy, 2003). In ad-dition, GTRLC often assists governmental and local communities working toconserve land. To address the growing impact of development in the region,GTRLC is transforming its land protection efforts from an opportunistic to aproactive and planned operation. It wants to generate long-term watershedplans that will maximize landscape impact and avoid protecting isolated tractsof land in a sea of development.
Spurred by The Nature Conservancy’s designation of the Manistee River asregionally significant within the larger Great Lakes eco-region (DePhillips, 2001),GTRLC turned its attention to the Manistee River and its watershed. GTRLCconducted a quick assessment of the area and reached two conclusions. First, theecological features and processes present in the watershed were a high priorityfor conservation. Second, the size of the watershed, coupled with its boundariesbeyond GTRLC’s traditional service area, meant that GTRLC had limited knowl-edge of the key lands to protect. Therefore, the Manistee River watershedrepresented a significant opportunity for the organization to develop its conser-vation planning and prioritization protocols.
714 J. Kazmierski et al.
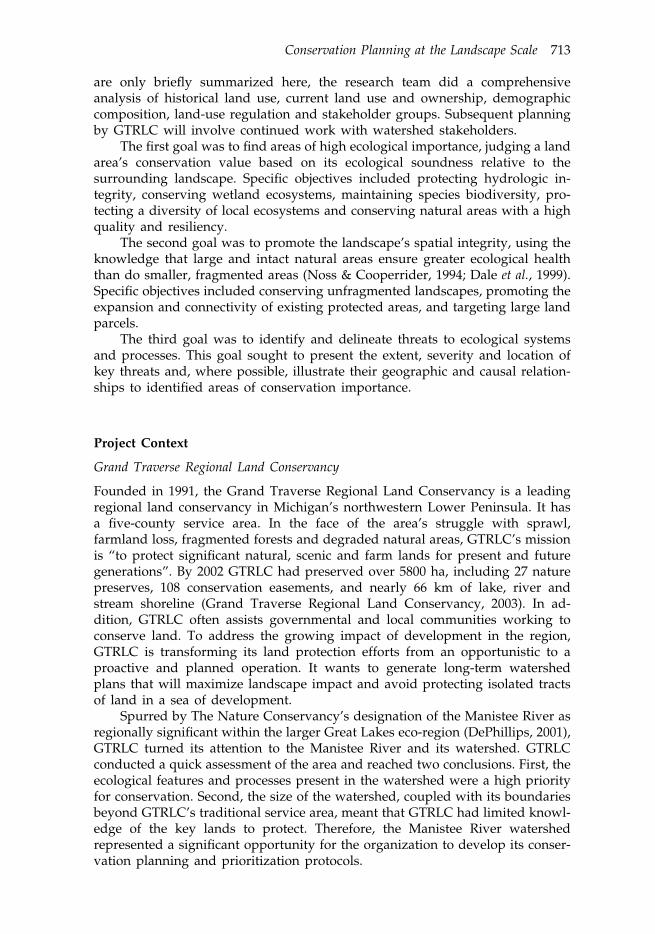
Figure 1. Location of the Manistee River Watershed in northern Michigan.
The Manistee River Watershed
The Manistee River lies in the northwestern portion of Michigan’s LowerPeninsula, flowing south and then southwest for nearly 371 km from itsheadwaters in Antrim County to its mouth at Lake Michigan in ManisteeCounty (Figure 1). The river’s watershed is one of the largest and healthiest inthe state. It drains over 5000 km2 and covers portions of twelve counties (Rozich,1998). Forty-two kilometers of the river are designated under the National Wildand Scenic Rivers system (US Forest Service, 1983) and the Upper Manistee wasincluded in Michigan’s Natural Rivers Program in 2003 (a programme protectingrivers by establishing management practices for development on and immedi-ately near the water).
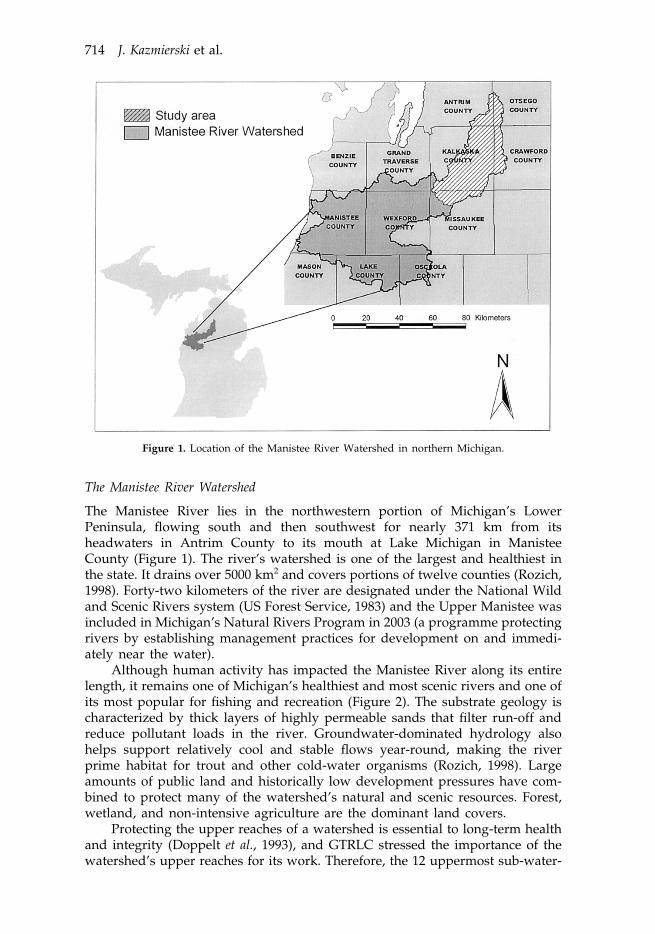
Although human activity has impacted the Manistee River along its entirelength, it remains one of Michigan’s healthiest and most scenic rivers and one ofits most popular for fishing and recreation (Figure 2). The substrate geology ischaracterized by thick layers of highly permeable sands that filter run-off andreduce pollutant loads in the river. Groundwater-dominated hydrology alsohelps support relatively cool and stable flows year-round, making the riverprime habitat for trout and other cold-water organisms (Rozich, 1998). Largeamounts of public land and historically low development pressures have com-bined to protect many of the watershed’s natural and scenic resources. Forest,wetland, and non-intensive agriculture are the dominant land covers.
Protecting the upper reaches of a watershed is essential to long-term healthand integrity (Doppelt et al., 1993), and GTRLC stressed the importance of thewatershed’s upper reaches for its work. Therefore, the 12 uppermost sub-water-
Conservation Planning at the Landscape Scale 715
Figure 2. The Manistee River and its floodplain in northern Michigan.
sheds were selected for conservation planning (Figure 1). The study area coversapproximately 1370 km2 and includes portions of five counties.
Social/Political Setting
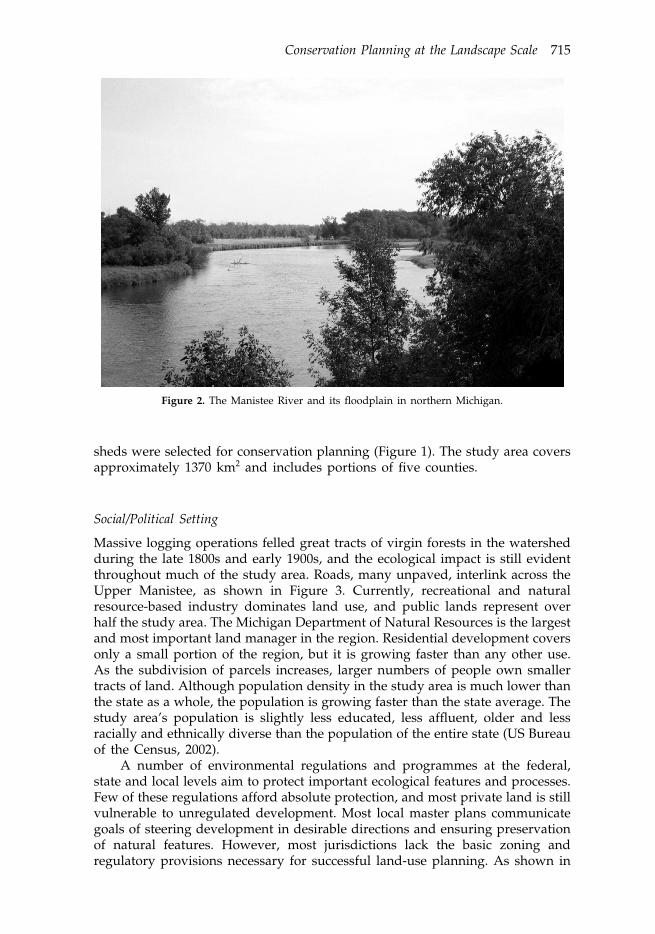
Massive logging operations felled great tracts of virgin forests in the watershedduring the late 1800s and early 1900s, and the ecological impact is still evidentthroughout much of the study area. Roads, many unpaved, interlink across theUpper Manistee, as shown in Figure 3. Currently, recreational and naturalresource-based industry dominates land use, and public lands represent overhalf the study area. The Michigan Department of Natural Resources is the largestand most important land manager in the region. Residential development coversonly a small portion of the region, but it is growing faster than any other use.As the subdivision of parcels increases, larger numbers of people own smallertracts of land. Although population density in the study area is much lower thanthe state as a whole, the population is growing faster than the state average. Thestudy area’s population is slightly less educated, less affluent, older and lessracially and ethnically diverse than the population of the entire state (US Bureauof the Census, 2002).
A number of environmental regulations and programmes at the federal,state and local levels aim to protect important ecological features and processes.Few of these regulations afford absolute protection, and most private land is stillvulnerable to unregulated development. Most local master plans communicategoals of steering development in desirable directions and ensuring preservationof natural features. However, most jurisdictions lack the basic zoning andregulatory provisions necessary for successful land-use planning. As shown in
716 J. Kazmierski et al.
Figure 3. A grid of unpaved roads fragments the landscape across the Upper Manistee RiverWatershed.
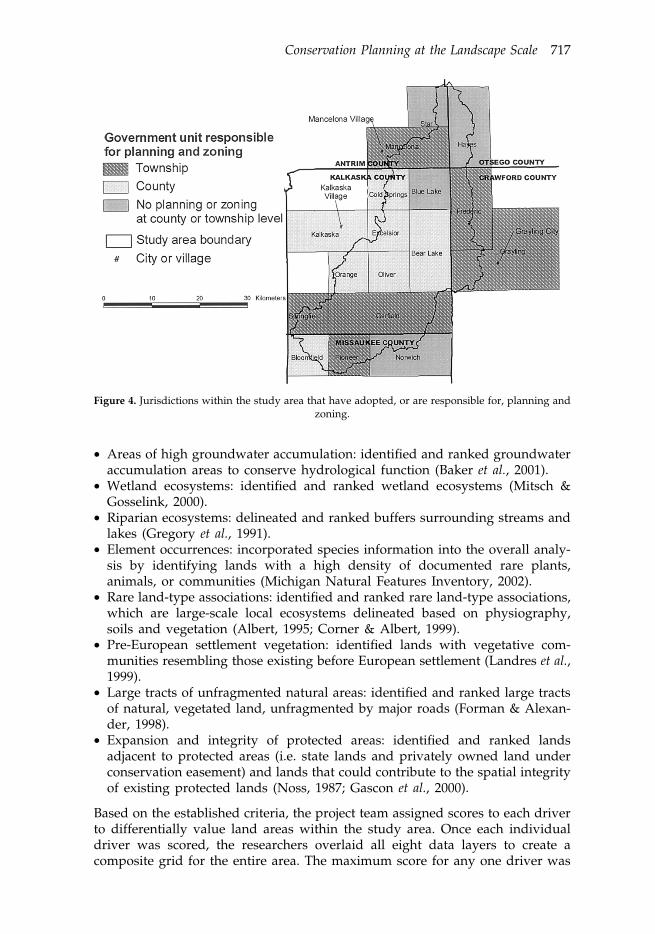
Figure 4, a patchwork of governmental units is responsible for planning andzoning activities in the study area.
Research Methods
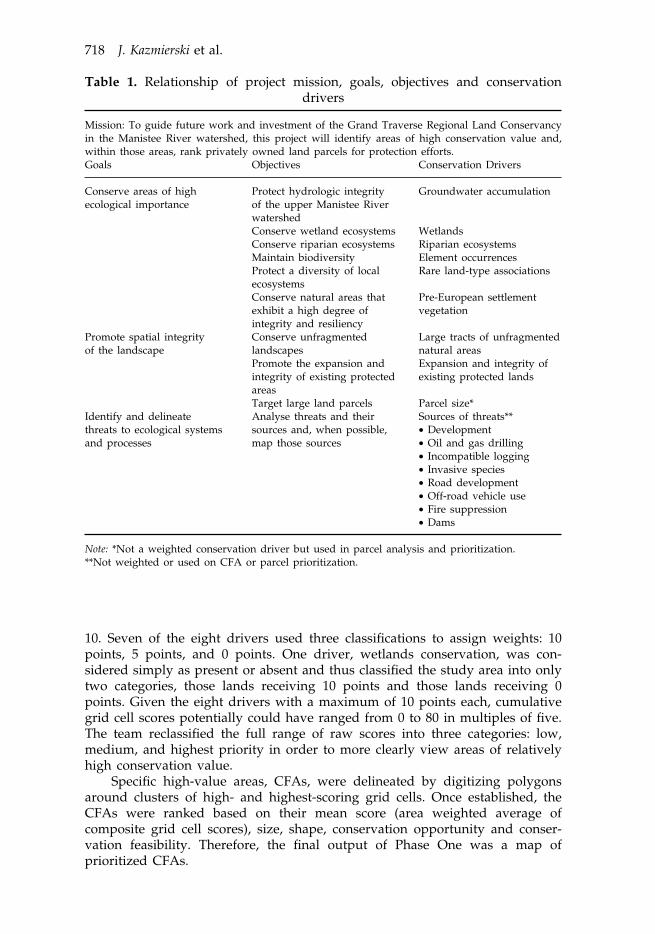
The conservation planning method occurred in three main phases. The firstphase involved ranking lands for protection at the regional scale. Landsidentified as high priority formed discrete units called Conservation Focus Areas(CFAs). The second phase consisted of ranking individual land parcels withinthe larger CFAs (Figure 5). A third phase analysed threats and sources of threatsin relationship to CFAs. Table 1 summarizes the relationship of project goals,objectives and conservation drivers.
Phase One
The basic steps in the Phase One analysis included:
(1) Develop conservation drivers to represent project objectives spatially.(2) Spatially represent and weight conservation drivers.(3) Use raster grids in GIS to conduct overall ranking analysis.(4) Delineate CFAs.(5) Rank CFAs according to ecological, spatial, opportunity and feasibility
criteria.
The study area was analysed using a GIS. Conservation drivers—spatial repre-sentations of the project’s objectives—were the foundation of this analysis. Theconservation drivers included:
Conservation Planning at the Landscape Scale 717
Figure 4. Jurisdictions within the study area that have adopted, or are responsible for, planning andzoning.
• Areas of high groundwater accumulation: identified and ranked groundwateraccumulation areas to conserve hydrological function (Baker et al., 2001).
• Wetland ecosystems: identified and ranked wetland ecosystems (Mitsch &Gosselink, 2000).
• Riparian ecosystems: delineated and ranked buffers surrounding streams andlakes (Gregory et al., 1991).
• Element occurrences: incorporated species information into the overall analy-sis by identifying lands with a high density of documented rare plants,animals, or communities (Michigan Natural Features Inventory, 2002).
• Rare land-type associations: identified and ranked rare land-type associations,which are large-scale local ecosystems delineated based on physiography,soils and vegetation (Albert, 1995; Corner & Albert, 1999).
• Pre-European settlement vegetation: identified lands with vegetative com-munities resembling those existing before European settlement (Landres et al.,1999).
• Large tracts of unfragmented natural areas: identified and ranked large tractsof natural, vegetated land, unfragmented by major roads (Forman & Alexan-der, 1998).
• Expansion and integrity of protected areas: identified and ranked landsadjacent to protected areas (i.e. state lands and privately owned land underconservation easement) and lands that could contribute to the spatial integrityof existing protected lands (Noss, 1987; Gascon et al., 2000).
Based on the established criteria, the project team assigned scores to each driverto differentially value land areas within the study area. Once each individualdriver was scored, the researchers overlaid all eight data layers to create acomposite grid for the entire area. The maximum score for any one driver was
718 J. Kazmierski et al.
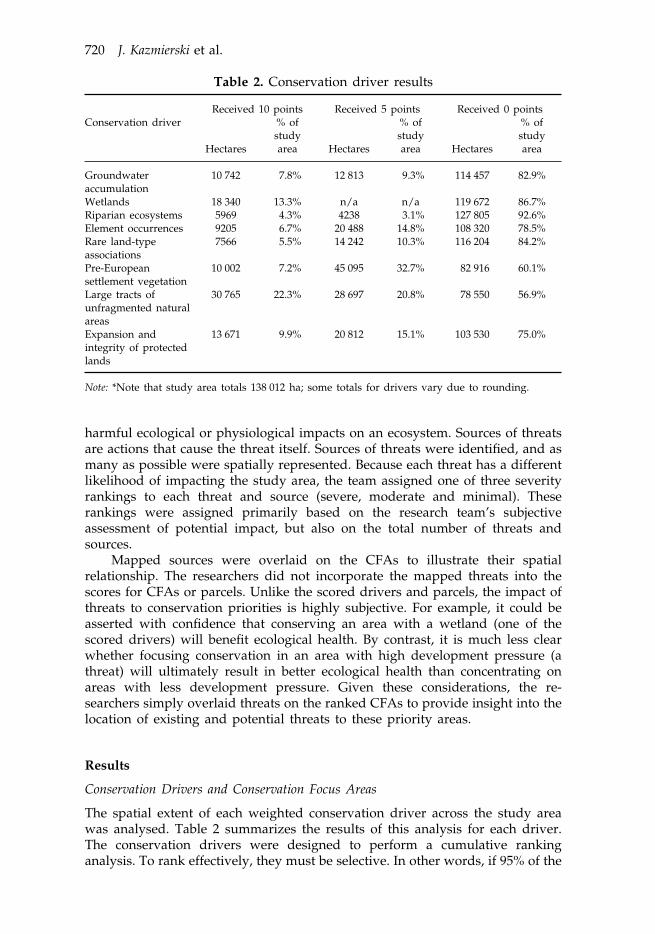
Table 1. Relationship of project mission, goals, objectives and conservationdrivers
Mission: To guide future work and investment of the Grand Traverse Regional Land Conservancyin the Manistee River watershed, this project will identify areas of high conservation value and,within those areas, rank privately owned land parcels for protection efforts.Goals Conservation DriversObjectives
Groundwater accumulationProtect hydrologic integrityConserve areas of highecological importance of the upper Manistee River
watershedWetlandsConserve wetland ecosystems
Conserve riparian ecosystems Riparian ecosystemsMaintain biodiversity Element occurrences
Rare land-type associationsProtect a diversity of localecosystemsConserve natural areas that Pre-European settlement
vegetationexhibit a high degree ofintegrity and resiliencyConserve unfragmentedPromote spatial integrity Large tracts of unfragmented
natural areaslandscapesof the landscapePromote the expansion and Expansion and integrity of
existing protected landsintegrity of existing protectedareasTarget large land parcels Parcel size*
Identify and delineate Sources of threats**Analyse threats and theirthreats to ecological systems • Developmentsources and, when possible,
map those sources • Oil and gas drillingand processes• Incompatible logging• Invasive species• Road development• Off-road vehicle use• Fire suppression• Dams
Note: *Not a weighted conservation driver but used in parcel analysis and prioritization.**Not weighted or used on CFA or parcel prioritization.
10. Seven of the eight drivers used three classifications to assign weights: 10points, 5 points, and 0 points. One driver, wetlands conservation, was con-sidered simply as present or absent and thus classified the study area into onlytwo categories, those lands receiving 10 points and those lands receiving 0points. Given the eight drivers with a maximum of 10 points each, cumulativegrid cell scores potentially could have ranged from 0 to 80 in multiples of five.The team reclassified the full range of raw scores into three categories: low,medium, and highest priority in order to more clearly view areas of relativelyhigh conservation value.
Specific high-value areas, CFAs, were delineated by digitizing polygonsaround clusters of high- and highest-scoring grid cells. Once established, theCFAs were ranked based on their mean score (area weighted average ofcomposite grid cell scores), size, shape, conservation opportunity and conser-vation feasibility. Therefore, the final output of Phase One was a map ofprioritized CFAs.
Conservation Planning at the Landscape Scale 719
Figure 5. Spatial analysis: relationship of phases one and two.
Phase Two
In the second phase, the researchers examined, analysed and scored everyprivate parcel 16 ha or larger associated with the top three CFAs in KalkaskaCounty (GTRLC’s highest-priority county within the watershed). The team usedthe 16-ha threshold since GTRLC is interested in conserving parcels of at least16 ha, and usually much larger. To complement available GIS data, aerialphotographs from 1998 and 1999 were interpreted for the highest-ranking CFAs.Photographs of each parcel revealed the parcel’s land cover and land use, as wellas disturbances such as roads and extractive operations. Using the results of theinterpretation, the team scored the parcels based on three criteria: ecologicalscore, number of hectares in natural cover, and contribution to the connectivityof the landscape.
The parcel’s individual score was not the sole consideration in prioritizingparcels within CFAs for protection. To emphasize the protection of large,contiguous landscapes, the authors also considered the parcels’ relationship tothe CFA and, when applicable, the landscape feature (a sizable, intact naturalarea), before determining its final priority. There were thus three basic hierarchi-cal levels: (1) the CFA, (2) the landscape feature, and (3) the parcel itself. Aftereach CFA was ranked, those data served as the foundation for parcel ranking.Then, when determining parcel priority within a given CFA, landscape featureswere used to provide a second level of ranking hierarchy. Finally, to determinerelative conservation priority within a landscape feature, the parcel’s final scorewas used.
Phase Three
Using a framework originally developed by The Nature Conservancy as part ofits 5-S Framework to Site Conservation (The Nature Conservancy, 2000), theauthors identified and assessed the study area’s key threats and their sources.Threats, in this context, are considered processes and events that may cause
720 J. Kazmierski et al.
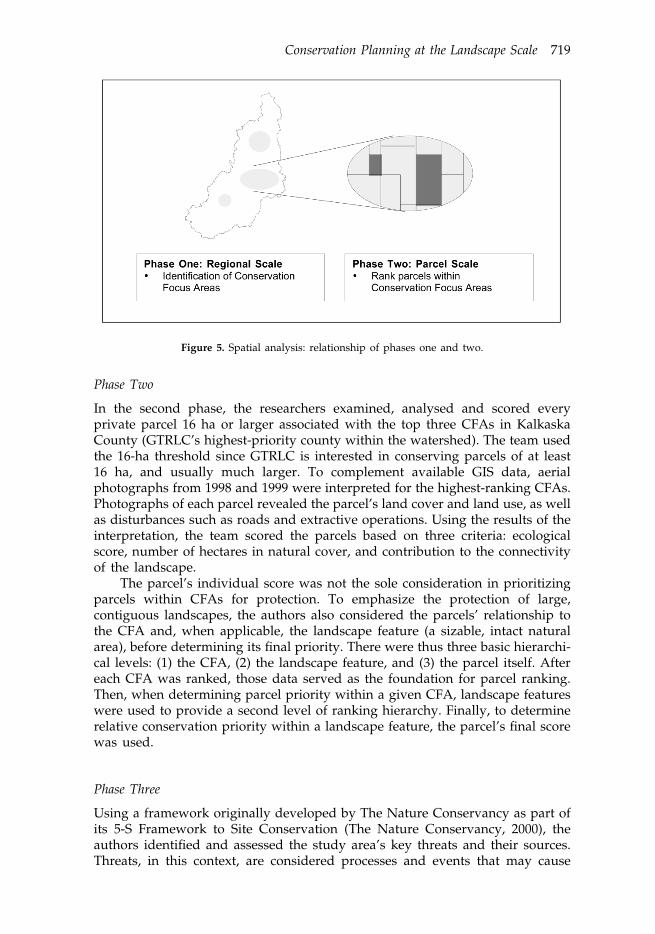
Table 2. Conservation driver results
Received 10 points Received 5 points Received 0 pointsConservation driver % of% of % of
studystudy studyarea areaHectares HectaresHectares area
Groundwater 9.3% 82.9%10 742 114 4577.8% 12 813accumulationWetlands 18 340 13.3% n/a n/a 86.7%119 672Riparian ecosystems 5969 4.3% 4238 3.1% 127 805 92.6%Element occurrences 9205 78.5%6.7% 108 32020 488 14.8%
10.3% 84.2%Rare land-type 116 2047566 5.5% 14 242associationsPre-European 60.1%10 002 7.2% 45 095 32.7% 82 916settlement vegetationLarge tracts of 28 697 56.9%78 55020.8%30 765 22.3%unfragmented naturalareasExpansion and 103 530 75.0%13 671 9.9% 20 812 15.1%integrity of protectedlands
Note: *Note that study area totals 138 012 ha; some totals for drivers vary due to rounding.
harmful ecological or physiological impacts on an ecosystem. Sources of threatsare actions that cause the threat itself. Sources of threats were identified, and asmany as possible were spatially represented. Because each threat has a differentlikelihood of impacting the study area, the team assigned one of three severityrankings to each threat and source (severe, moderate and minimal). Theserankings were assigned primarily based on the research team’s subjectiveassessment of potential impact, but also on the total number of threats andsources.
Mapped sources were overlaid on the CFAs to illustrate their spatialrelationship. The researchers did not incorporate the mapped threats into thescores for CFAs or parcels. Unlike the scored drivers and parcels, the impact ofthreats to conservation priorities is highly subjective. For example, it could beasserted with confidence that conserving an area with a wetland (one of thescored drivers) will benefit ecological health. By contrast, it is much less clearwhether focusing conservation in an area with high development pressure (athreat) will ultimately result in better ecological health than concentrating onareas with less development pressure. Given these considerations, the re-searchers simply overlaid threats on the ranked CFAs to provide insight into thelocation of existing and potential threats to these priority areas.
Results
Conservation Drivers and Conservation Focus Areas
The spatial extent of each weighted conservation driver across the study areawas analysed. Table 2 summarizes the results of this analysis for each driver.The conservation drivers were designed to perform a cumulative rankinganalysis. To rank effectively, they must be selective. In other words, if 95% of the
Conservation Planning at the Landscape Scale 721
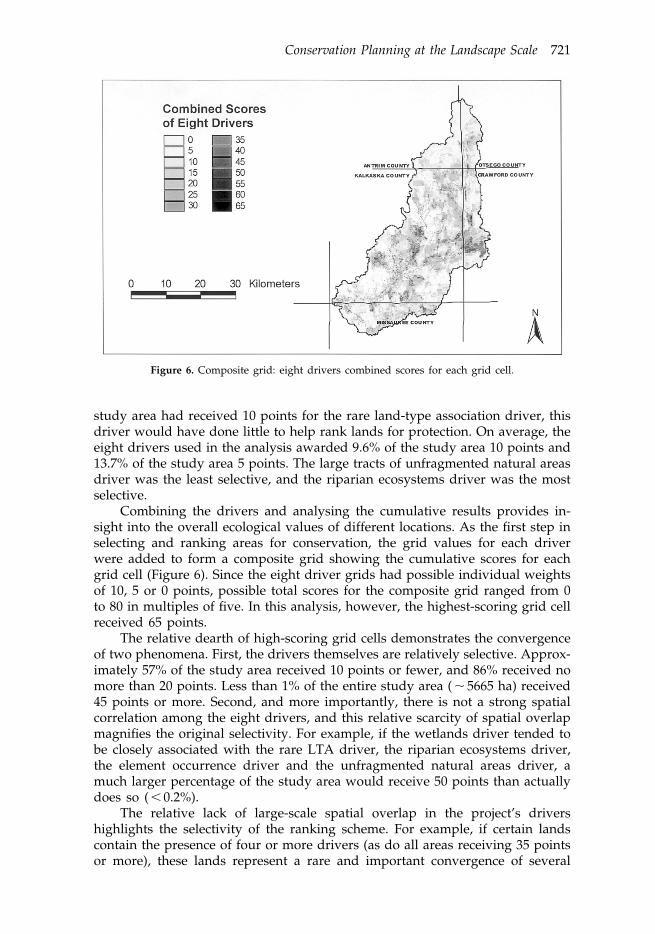
Figure 6. Composite grid: eight drivers combined scores for each grid cell.
study area had received 10 points for the rare land-type association driver, thisdriver would have done little to help rank lands for protection. On average, theeight drivers used in the analysis awarded 9.6% of the study area 10 points and13.7% of the study area 5 points. The large tracts of unfragmented natural areasdriver was the least selective, and the riparian ecosystems driver was the mostselective.
Combining the drivers and analysing the cumulative results provides in-sight into the overall ecological values of different locations. As the first step inselecting and ranking areas for conservation, the grid values for each driverwere added to form a composite grid showing the cumulative scores for eachgrid cell (Figure 6). Since the eight driver grids had possible individual weightsof 10, 5 or 0 points, possible total scores for the composite grid ranged from 0to 80 in multiples of five. In this analysis, however, the highest-scoring grid cellreceived 65 points.
The relative dearth of high-scoring grid cells demonstrates the convergenceof two phenomena. First, the drivers themselves are relatively selective. Approx-imately 57% of the study area received 10 points or fewer, and 86% received nomore than 20 points. Less than 1% of the entire study area ( ! 5665 ha) received45 points or more. Second, and more importantly, there is not a strong spatialcorrelation among the eight drivers, and this relative scarcity of spatial overlapmagnifies the original selectivity. For example, if the wetlands driver tended tobe closely associated with the rare LTA driver, the riparian ecosystems driver,the element occurrence driver and the unfragmented natural areas driver, amuch larger percentage of the study area would receive 50 points than actuallydoes so ( ! 0.2%).
The relative lack of large-scale spatial overlap in the project’s drivershighlights the selectivity of the ranking scheme. For example, if certain landscontain the presence of four or more drivers (as do all areas receiving 35 pointsor more), these lands represent a rare and important convergence of several
722 J. Kazmierski et al.
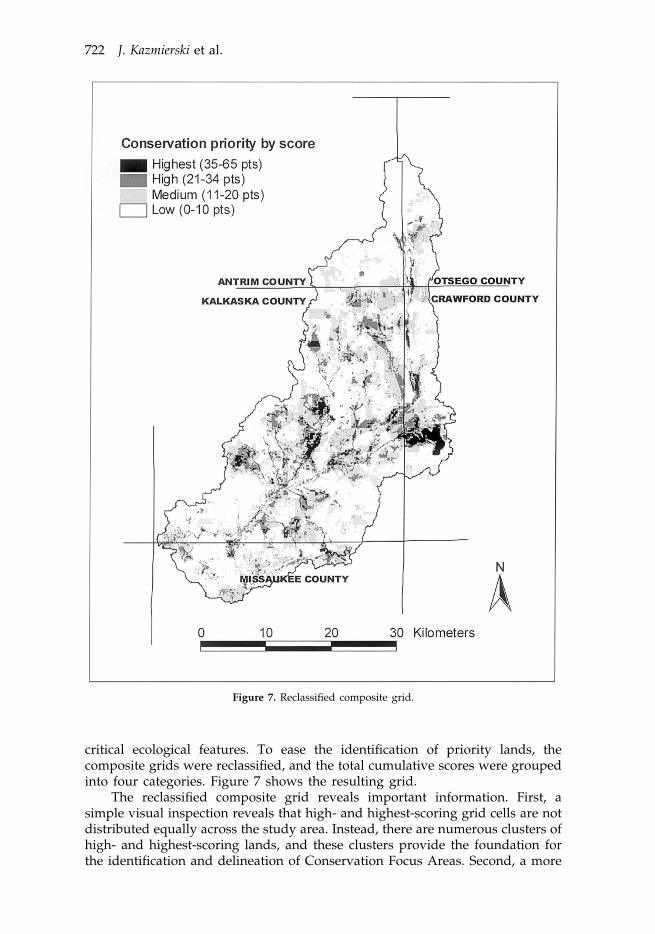
Figure 7. Reclassified composite grid.
critical ecological features. To ease the identification of priority lands, thecomposite grids were reclassified, and the total cumulative scores were groupedinto four categories. Figure 7 shows the resulting grid.
The reclassified composite grid reveals important information. First, asimple visual inspection reveals that high- and highest-scoring grid cells are notdistributed equally across the study area. Instead, there are numerous clusters ofhigh- and highest-scoring lands, and these clusters provide the foundation forthe identification and delineation of Conservation Focus Areas. Second, a more
Conservation Planning at the Landscape Scale 723
Table 3. Reclassified composite grid scores
Classification HectaresScore range % of study area
56.9%Low priority 78 5120–1040 591Medium priority 29.4%11–20
10.3%High priority 14 24521–344638Highest priority 3.4%35–65
quantitative examination of the reclassified data reveals that high- and highest-scoring lands account for nearly 19 000 ha, or 13.7% of the study area (Table 3).While only a small fraction of the study area (highest category) received scoresabove 35 points, this scoring distribution still selects an amount of land smallenough to narrow GTRLC’s focus yet large enough to provide the organizationwith a meaningful slate of options.
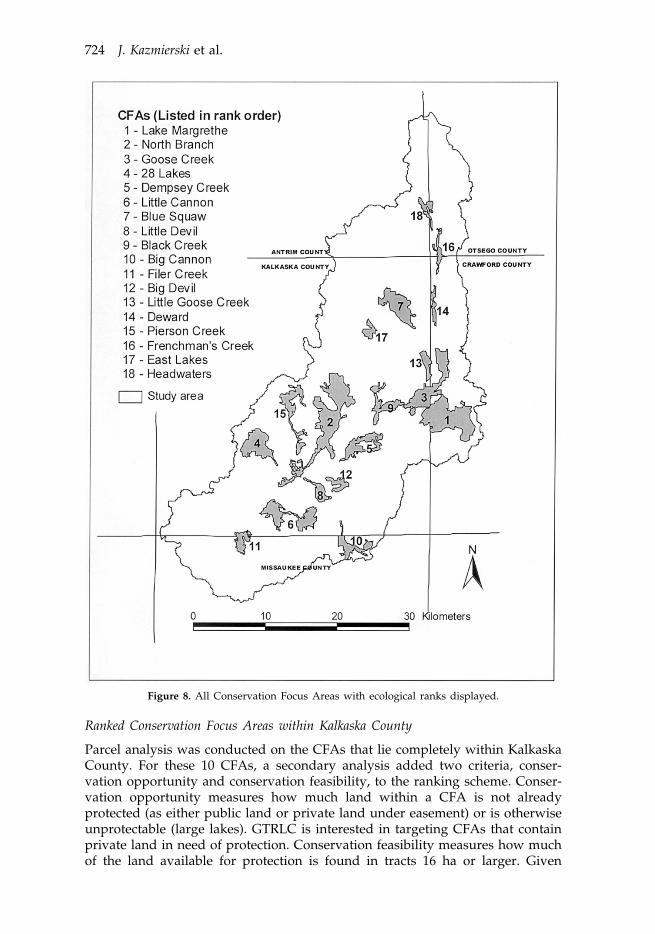
Around these clusters of high and highest priority lands, 60 discretepolygons were digitized. These polygons totaled 19 287 ha and fell into threecategories based on size: Conservation Focus Areas (largest), 2nd TierConservation Areas (next largest) and 3rd Tier Conservation Areas (smallest). Asthe largest priority areas, the CFAs represent the top-priority lands and are theclear category of emphasis for further analysis and eventual parcel rankingefforts. Eighteen CFAs were delineated, totaling 16 094 ha, or roughly 12% of thestudy area. To help reference each CFA individually, each was named based onnearby streams, lakes or other distinctive features (Figure 8). To compare eachCFA to its counterparts, all 18 were ranked on three criteria: mean score, sizeand shape.
Assigning the final rank for CFAs based on the sum total of the individualranks for size, mean score, and shape allowed analysis of a broader range ofimportant attributes than relying on a single criterion would have done.The Deward CFA provides a good example. With a mean score of 29.9,Deward received the second-highest mean score rank of all the CFAs. However,Deward is also the smallest CFA, and its small size and irregular boundary gaveit the second-worst shape rank. Deward’s final rank of 14 provides a moreaccurate measure of its true conservation priority than would its mean score orsize alone.
The map of the ranked CFAs (Figure 8) illustrates several interesting factsabout the spatial extent and distribution of CFAs. First, CFAs are not clusteredin only one or two small portions of the study area. Rather, they are distributedfairly widely and occur in all five counties. However, some parts of the studyarea support higher concentrations of CFAs than do other parts. Nine of the 18CFAs are found in a belt that runs through central Kalkaska County to westernCrawford County. Second, the CFAs themselves are irregularly shaped; high-scoring lands along stream corridors help shape many of the more linear CFAs.Third, CFAs vary widely in size: the largest (North Branch) is nearly 3240 ha andthe smallest (Deward) is less than 240 ha. Finally, the protectable lands (privatelands excluding large lakes) within individual CFAs often are disconnected fromone another, separated by protected lands or large lakes.
724 J. Kazmierski et al.
Figure 8. All Conservation Focus Areas with ecological ranks displayed.
Ranked Conservation Focus Areas within Kalkaska County
Parcel analysis was conducted on the CFAs that lie completely within KalkaskaCounty. For these 10 CFAs, a secondary analysis added two criteria, conser-vation opportunity and conservation feasibility, to the ranking scheme. Conser-vation opportunity measures how much land within a CFA is not alreadyprotected (as either public land or private land under easement) or is otherwiseunprotectable (large lakes). GTRLC is interested in targeting CFAs that containprivate land in need of protection. Conservation feasibility measures how muchof the land available for protection is found in tracts 16 ha or larger. Given
Conservation Planning at the Landscape Scale 725
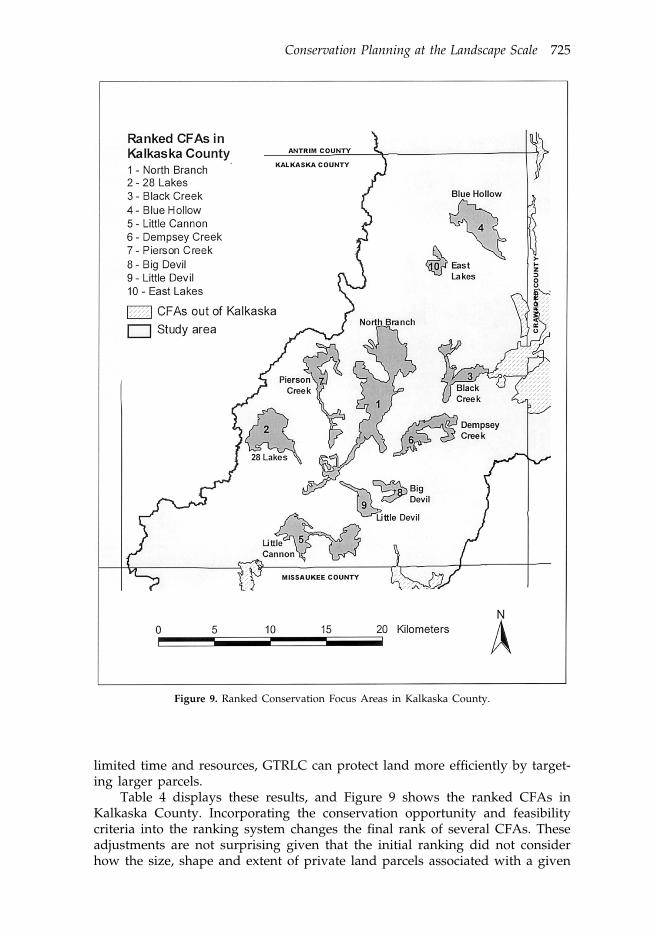
Figure 9. Ranked Conservation Focus Areas in Kalkaska County.
limited time and resources, GTRLC can protect land more efficiently by target-ing larger parcels.
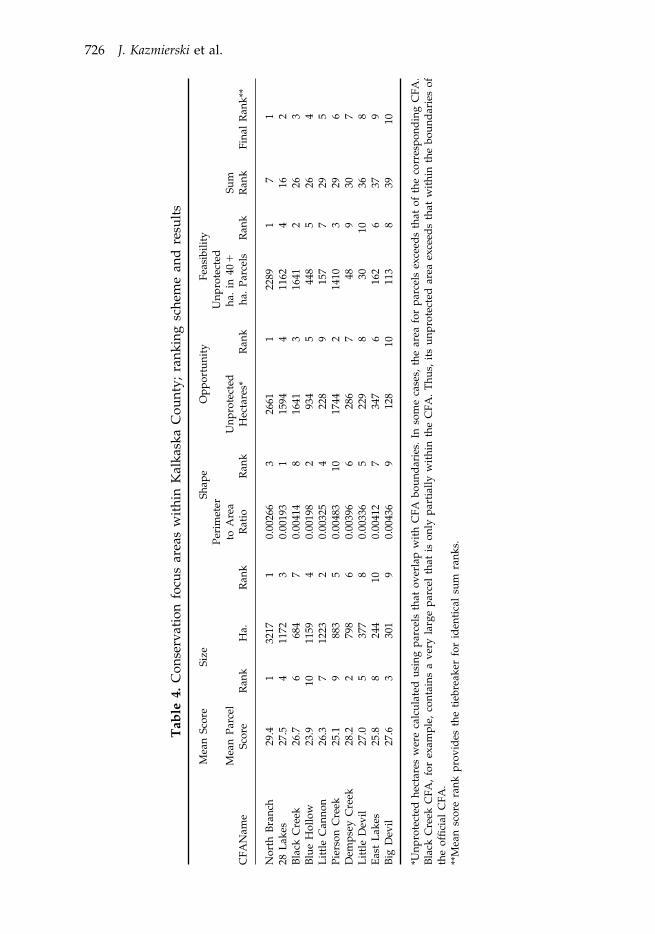
Table 4 displays these results, and Figure 9 shows the ranked CFAs inKalkaska County. Incorporating the conservation opportunity and feasibilitycriteria into the ranking system changes the final rank of several CFAs. Theseadjustments are not surprising given that the initial ranking did not considerhow the size, shape and extent of private land parcels associated with a given
726 J. Kazmierski et al.
Tab
le4.
Con
serv
atio
nfo
cus
area
sw
ithin
Kal
kask
aC
ount
y;ra
nkin
gsc
hem
ean
dre
sults
Mea
nSc
ore
Size
Shap
eO
ppor
tuni
tyFe
asib
ility
Peri
met
erU
npro
tect
edha
.in
40"
toA
rea
Mea
nPa
rcel
Unp
rote
cted
Sum
Rat
ioha
.Pa
rcel
sR
ank
Ha.
Ran
kR
ank
Scor
eC
FAN
ame
Ran
kH
ecta
res*
Ran
kR
ank
Fina
lR
ank*
*
29.4
132
171
0.00
266
3N
orth
Bran
ch26
611
2289
17
127
.54
1172
30.
0019
31
28La
kes
1594
411
624
162
26.7
668
47
0.00
414
8Bl
ack
Cre
ek16
413
1641
226
323
.910
1159
Blue
Hol
low
40.
0019
82
934
544
85
264
26.3
712
232
0.00
325
4Li
ttle
Can
non
228
915
77
295
25.1
988
35
0.00
483
1017
44Pi
erso
nC
reek
214
103
296
28.2
279
86
0.00
396
6D
emps
eyC
reek
286
748
930
727
.05
Litt
leD
evil
377
80.
0033
65
229
830
1036
825
.88
244
100.
0041
27
East
Lake
s34
76
162
637
927
.63
Big
Dev
il30
19
0.00
436
912
810
113
839
10
*Unp
rote
cted
hect
ares
wer
eca
lcul
ated
usin
gpa
rcel
sth
atov
erla
pw
ithC
FAbo
unda
ries
.In
som
eca
ses,
the
area
for
parc
els
exce
eds
that
ofth
eco
rres
pond
ing
CFA
.Bl
ack
Cre
ekC
FA,f
orex
ampl
e,co
ntai
nsa
very
larg
epa
rcel
that
ison
lypa
rtia
llyw
ithin
the
CFA
.Thu
s,its
unpr
otec
ted
area
exce
eds
that
with
inth
ebo
unda
ries
ofth
eof
ficia
lC
FA.
**M
ean
scor
era
nkpr
ovid
esth
etie
brea
ker
for
iden
tical
sum
rank
s.
Conservation Planning at the Landscape Scale 727
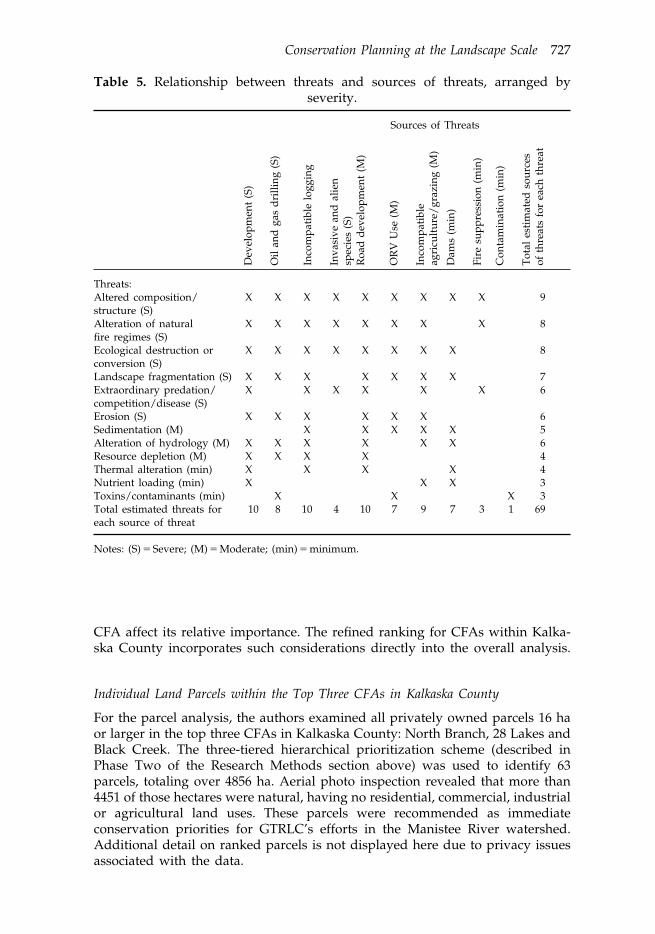
Table 5. Relationship between threats and sources of threats, arranged byseverity.
Sources of Threats
Threats:Altered composition/ XX X X 9X X X X Xstructure (S)Alteration of natural XX X X X X X X 8fire regimes (S)Ecological destruction or X X 8X X X X X Xconversion (S)Landscape fragmentation (S) X X X X X X X 7Extraordinary predation/ X X X X X X 6competition/disease (S)Erosion (S) X X X 6X X XSedimentation (M) X X X X X 5Alteration of hydrology (M) X X X 6X X XResource depletion (M) X X X X 4Thermal alteration (min) X X X X 4Nutrient loading (min) X 3X XToxins/contaminants (min) X X X 3Total estimated threats for 6910 8 10 4 10 7 9 7 3 1each source of threat
Notes: (S) # Severe; (M) # Moderate; (min) # minimum.
CFA affect its relative importance. The refined ranking for CFAs within Kalka-ska County incorporates such considerations directly into the overall analysis.
Individual Land Parcels within the Top Three CFAs in Kalkaska County
For the parcel analysis, the authors examined all privately owned parcels 16 haor larger in the top three CFAs in Kalkaska County: North Branch, 28 Lakes andBlack Creek. The three-tiered hierarchical prioritization scheme (described inPhase Two of the Research Methods section above) was used to identify 63parcels, totaling over 4856 ha. Aerial photo inspection revealed that more than4451 of those hectares were natural, having no residential, commercial, industrialor agricultural land uses. These parcels were recommended as immediateconservation priorities for GTRLC’s efforts in the Manistee River watershed.Additional detail on ranked parcels is not displayed here due to privacy issuesassociated with the data.
Dev
elop
men
t(S
)
Oil
and
gas
drill
ing
(S)
Inco
mpa
tible
logg
ing
Inva
sive
and
alie
nsp
ecie
s(S
)R
oad
deve
lopm
ent
(M)
OR
VU
se(M
)
Inco
mpa
tible
agri
cultu
re/g
razi
ng(M
)
Dam
s(m
in)
Fire
supp
ress
ion
(min
)
Con
tam
inat
ion
(min
)
Tota
lest
imat
edso
urce
sof
thre
ats
for
each
thre
at
728 J. Kazmierski et al.
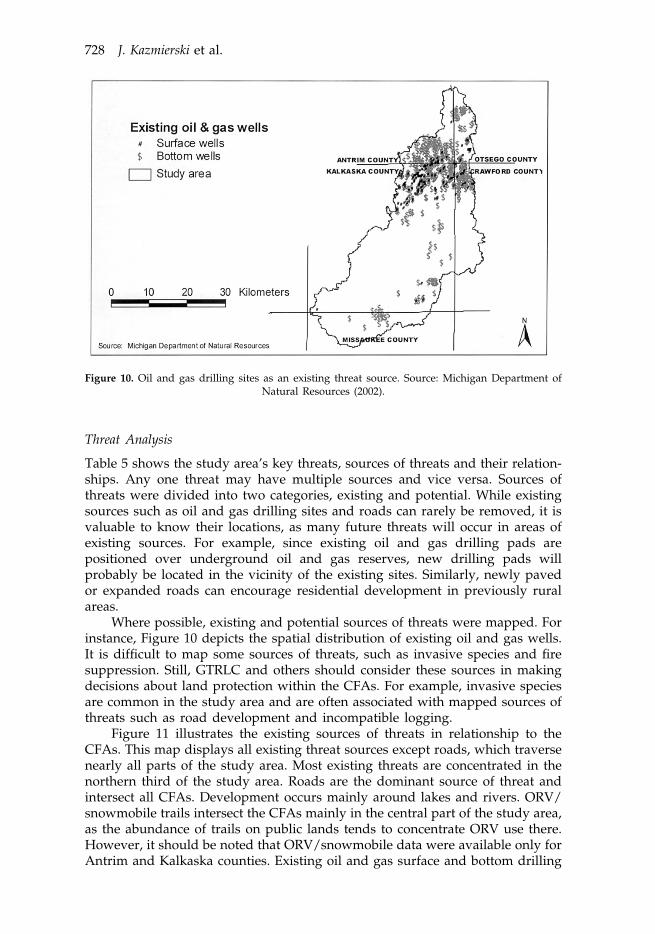
Figure 10. Oil and gas drilling sites as an existing threat source. Source: Michigan Department ofNatural Resources (2002).
Threat Analysis
Table 5 shows the study area’s key threats, sources of threats and their relation-ships. Any one threat may have multiple sources and vice versa. Sources ofthreats were divided into two categories, existing and potential. While existingsources such as oil and gas drilling sites and roads can rarely be removed, it isvaluable to know their locations, as many future threats will occur in areas ofexisting sources. For example, since existing oil and gas drilling pads arepositioned over underground oil and gas reserves, new drilling pads willprobably be located in the vicinity of the existing sites. Similarly, newly pavedor expanded roads can encourage residential development in previously ruralareas.
Where possible, existing and potential sources of threats were mapped. Forinstance, Figure 10 depicts the spatial distribution of existing oil and gas wells.It is difficult to map some sources of threats, such as invasive species and firesuppression. Still, GTRLC and others should consider these sources in makingdecisions about land protection within the CFAs. For example, invasive speciesare common in the study area and are often associated with mapped sources ofthreats such as road development and incompatible logging.
Figure 11 illustrates the existing sources of threats in relationship to theCFAs. This map displays all existing threat sources except roads, which traversenearly all parts of the study area. Most existing threats are concentrated in thenorthern third of the study area. Roads are the dominant source of threat andintersect all CFAs. Development occurs mainly around lakes and rivers. ORV/snowmobile trails intersect the CFAs mainly in the central part of the study area,as the abundance of trails on public lands tends to concentrate ORV use there.However, it should be noted that ORV/snowmobile data were available only forAntrim and Kalkaska counties. Existing oil and gas surface and bottom drilling

Conservation Planning at the Landscape Scale 729
Figure 11. Relationship of Conservation Focus Areas to existing threat sources.
sites occur in CFAs in the northern half of the study area, while agriculture andgrazing activity are concentrated on the western side.
Potential sources of threats are scattered throughout the study area. Devel-opment potential is highest in CFAs that contain the mainstem of the ManisteeRiver, tributaries and lakes. Potential logging threatens all CFAs, since they allcontain forested areas. All lands within CFAs that are close to current oil and gasdevelopment are potential lease sites. Although no oil or gas drilling now existsin the East Lakes and Headwaters CFAs, they are still vulnerable to drillingactivities because they are located above the Antrim Shale and Niagaran Reef
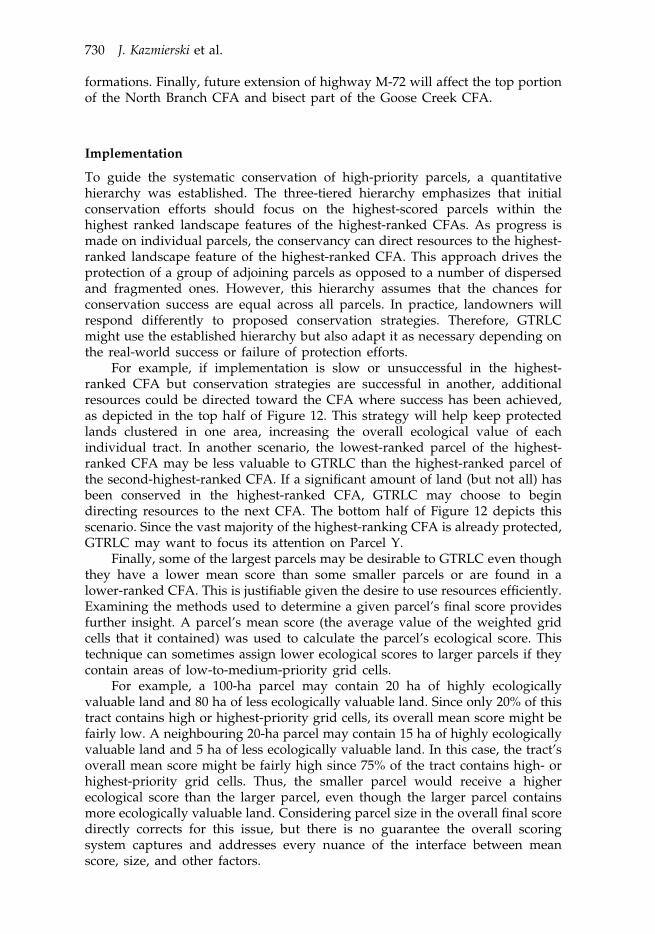
730 J. Kazmierski et al.
formations. Finally, future extension of highway M-72 will affect the top portionof the North Branch CFA and bisect part of the Goose Creek CFA.
Implementation
To guide the systematic conservation of high-priority parcels, a quantitativehierarchy was established. The three-tiered hierarchy emphasizes that initialconservation efforts should focus on the highest-scored parcels within thehighest ranked landscape features of the highest-ranked CFAs. As progress ismade on individual parcels, the conservancy can direct resources to the highest-ranked landscape feature of the highest-ranked CFA. This approach drives theprotection of a group of adjoining parcels as opposed to a number of dispersedand fragmented ones. However, this hierarchy assumes that the chances forconservation success are equal across all parcels. In practice, landowners willrespond differently to proposed conservation strategies. Therefore, GTRLCmight use the established hierarchy but also adapt it as necessary depending onthe real-world success or failure of protection efforts.
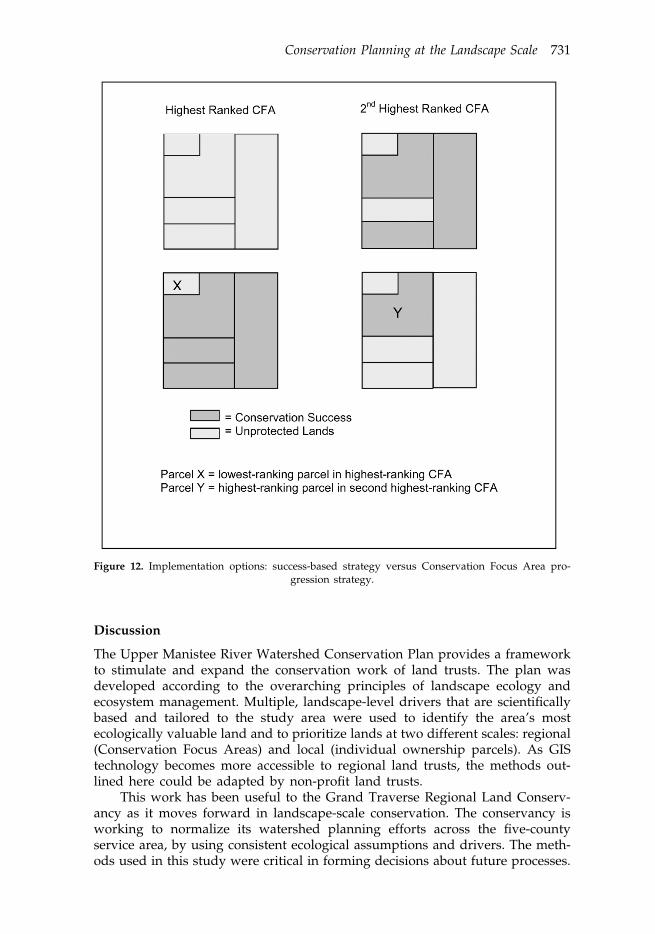
For example, if implementation is slow or unsuccessful in the highest-ranked CFA but conservation strategies are successful in another, additionalresources could be directed toward the CFA where success has been achieved,as depicted in the top half of Figure 12. This strategy will help keep protectedlands clustered in one area, increasing the overall ecological value of eachindividual tract. In another scenario, the lowest-ranked parcel of the highest-ranked CFA may be less valuable to GTRLC than the highest-ranked parcel ofthe second-highest-ranked CFA. If a significant amount of land (but not all) hasbeen conserved in the highest-ranked CFA, GTRLC may choose to begindirecting resources to the next CFA. The bottom half of Figure 12 depicts thisscenario. Since the vast majority of the highest-ranking CFA is already protected,GTRLC may want to focus its attention on Parcel Y.
Finally, some of the largest parcels may be desirable to GTRLC even thoughthey have a lower mean score than some smaller parcels or are found in alower-ranked CFA. This is justifiable given the desire to use resources efficiently.Examining the methods used to determine a given parcel’s final score providesfurther insight. A parcel’s mean score (the average value of the weighted gridcells that it contained) was used to calculate the parcel’s ecological score. Thistechnique can sometimes assign lower ecological scores to larger parcels if theycontain areas of low-to-medium-priority grid cells.
For example, a 100-ha parcel may contain 20 ha of highly ecologicallyvaluable land and 80 ha of less ecologically valuable land. Since only 20% of thistract contains high or highest-priority grid cells, its overall mean score might befairly low. A neighbouring 20-ha parcel may contain 15 ha of highly ecologicallyvaluable land and 5 ha of less ecologically valuable land. In this case, the tract’soverall mean score might be fairly high since 75% of the tract contains high- orhighest-priority grid cells. Thus, the smaller parcel would receive a higherecological score than the larger parcel, even though the larger parcel containsmore ecologically valuable land. Considering parcel size in the overall final scoredirectly corrects for this issue, but there is no guarantee the overall scoringsystem captures and addresses every nuance of the interface between meanscore, size, and other factors.
Conservation Planning at the Landscape Scale 731
Figure 12. Implementation options: success-based strategy versus Conservation Focus Area pro-gression strategy.
Discussion
The Upper Manistee River Watershed Conservation Plan provides a frameworkto stimulate and expand the conservation work of land trusts. The plan wasdeveloped according to the overarching principles of landscape ecology andecosystem management. Multiple, landscape-level drivers that are scientificallybased and tailored to the study area were used to identify the area’s mostecologically valuable land and to prioritize lands at two different scales: regional(Conservation Focus Areas) and local (individual ownership parcels). As GIStechnology becomes more accessible to regional land trusts, the methods out-lined here could be adapted by non-profit land trusts.
This work has been useful to the Grand Traverse Regional Land Conserv-ancy as it moves forward in landscape-scale conservation. The conservancy isworking to normalize its watershed planning efforts across the five-countyservice area, by using consistent ecological assumptions and drivers. The meth-ods used in this study were critical in forming decisions about future processes.
732 J. Kazmierski et al.
The conservancy is now preparing watershed plans for all nine watershedswithin the five counties of its service area, building on the work shown here. Ithopes eventually to protect about 80% of the parcels in the highest-priorityprotection categories (Rigney, 2003). This study helps highlight issues that willbe encountered as conservancies attempt landscape-scale conservation planning,with this or similar methods.
Volume of High-priority Land
One of the potential challenges facing GTRLC as it strives to implement thisproject’s recommendations and achieve landscape-scale success is the sheeramount of land outlined for protection. The study highlights over 4856 ha ofprivate lands as suitable for protection in the top three CFAs in Kalkaska Countyalone. When all 18 CFAs in the study area are considered, that total rises above8000 ha. While not an impossible task, it is a challenge to directly protect thismuch land before it is lost to development or other threats. A number of lessonshave been learned in the attempt to focus on the most important conservationopportunities; other questions remain.
Decision Making
Developing a conservation plan requires making numerous discrete decisionsthat hinge on unique and hard-to-quantify variables. The scientific literatureprovides few black-and-white answers or objective criteria. For example, it iswell established that larger tracts of natural areas are more valuable than smallertracts, but how large is large enough? Specifically, what area threshold isappropriate for the CFAs? Is 200 ha too small to represent a significant land-scape, or does 200 ha set too high a hurdle and exclude more localized, but stillhighly valuable, sites? While decisions in this study were based on the best dataand most relevant conservation principles, there is no denying the subjectivity ofsome choices. Nor can the potential cumulative impact of that subjectivity on theoverall analysis be overlooked.
Data Limitations and Ground Truthing
Existing data sources and simple research techniques were used extensively toidentify the most ecologically important lands within the study area. Usingexisting data was generally advantageous for the project as it greatly reducedcompletion time and costs. While the GIS data were the most complete andaccurate available, all data may have inaccuracies. Some data were collected forlarge regions, often through the use of remote sensing techniques. Using datacollected from imagery with a spatial resolution of 30 x 30 m for a parcel-levelanalysis may produce generalizations and possibly inaccurate conclusions.While aerial photographs of each parcel revealed important information on landcover, land use and disturbances, they provided little insight into the quality ofland cover or the occurrence of specific flora or fauna, such as threatened orendangered species. GTRLC should therefore conduct field analyses beforemaking conservation decisions on specific parcels.
Conservation Planning at the Landscape Scale 733
Driver Correlation
Prior to selecting the conservation drivers that form the backbone of thisanalysis, the authors did not determine the relative correlation among thedrivers. Nor was any preliminary research conducted to identify the sort oflands the cumulative overlay of all drivers would select as top priority. Oneinteresting issue to consider is the relative contribution of each driver to thecumulative mean score for each CFA. Each conservation driver had equalimportance in the overall weighting scheme, but some drivers were clearly moreresponsible for the high-scoring grid cells within certain CFAs than others. Inaddition, subtle connections between drivers influenced the location and relativeimportance of resulting CFAs. For example, many CFAs are focused aroundhydrologic features such as wetlands or streams. This emphasis may be causedby a correlation among numerous drivers, such as riparian ecosystems, ground-water accumulation and wetlands. Although the emphasis on hydrologic func-tions was intentional (because of the unique hydrologic characteristics of theManistee River), the possible correlation of the drivers may have devaluedcertain upland features such as northern hardwood forests found on glacialmoraines. A statistical regression analysis of the drivers would highlight thesesubtle correlation patterns and help GTRLC and others to better understand theresults and improve the replication of the project’s approach and method.
Conclusion
Although many conservation-planning schemes use species information to mo-tivate and shape conservation plans, models that include both species factorsand other ecosystem factors are needed for determining where to protect naturalvalues on private land. A number of schemes are proposed in the literature formathematically determining land areas most suitable for protection based onparticular wildlife species. This project builds on those ideas and on broaderlandscape ecology theory; the foundation of the project is built on the scientificliterature that documents the importance of groundwater, wetlands, riparianareas and rare land-types. It combines those factors with information not only onrare and endangered species, but also with important spatial variables (largetracts of unfragmented land and contiguity with protected lands).
This project is adapted from The Nature Conservancy’s model for conser-vation planning; however, instead of using specific conservation targets (individ-ual species), it used conservation drivers that represent both biological andphysical resources. The conservation drivers, as spatial representations of theproject’s objectives, were functional as the foundation of the analysis. Like theTNC approach, threats to the viability of ecosystems were analysed and landareas were ranked for protection. The approach taken for GTRLC is unique intrying to operationalize three distinct goals in conservation planning: to findareas of high ecological importance, to promote the landscape’s spatial integrityand to delineate threats to ecological systems and processes. The resultingplanning model, while imperfect, is pragmatic and feasible with basic GIS tools.
Land conservation organizations are shifting toward conserving the spatialand ecological integrity of landscapes. They face considerable challenges fromstate and federal policies, funding sources and public opinion, many of whichare more accustomed to and supportive of species-based protection efforts. In
734 J. Kazmierski et al.
light of these challenges, it is especially important for practitioners of thelandscape approach to rank their conservation efforts using scientifically-basedmethods. This study illustrates a GIS-based method that other organizations canadapt and apply to a variety of landscapes. In certain cases, an organization maywant to use the overall methodology but develop its own conservation goals,drivers and ranking schemes. Regardless, it is clear that conservation organiza-tions need strategies for shifting from site-specific conservation to more land-scape-level approaches.
Acknowledgments
The authors appreciate collaborations with the staff at the Grand TraverseRegional Land Conservancy, the editorial assistance of Julie Steiff, and helpfulsuggestions from two anonymous reviewers. This project was funded by ThePrentice Foundation and the Ecosystem Management Initiative, Rackham Schoolof Graduate Studies and School of Natural Resources and Environment at theUniversity of Michigan.
References
Albert, D. A. (1995) Regional landscape ecosystems of Michigan, Minnesota, and Wisconsin: aworking map and classification. Gen. Tech. Rep. NC-178 (North Central Forest Experiment Station:Forest Service, US Department of Agriculture).
Baker, M. E., Wiley, M. J. & Seelbach, P. W. (2001) GIS-based hydrological modeling of riparian areas:implications for stream water quality, Journal of the American Water Resources Association, 37,pp. 1615–1628.
Beatley, T. (2000) Preserving biodiversity, Journal of the American Planning Association, 66, pp. 5–20.Botequilha Leitao, A. & Ahern, J. (2002) Applying landscape ecological concepts and metrics in
sustainable landscape planning, Landscape and Urban Planning, 59, pp. 65–93.Brammeier, J., Capps, Y., Ellis, J. L., Gavin, A. P., Hall, J. S., Huffman, M. J., Hulleberg, T. &
Rodriguez, J. C. (1998) Strategies for land conservation in southeastern Michigan, Masters Thesis,School of Natural Resources and Environment, University of Michigan.
Church, R. L., Stroms, D. M. & Davis, F. W. (1996) Reserve selection as a maximal covering locationproblem, Biological Conservation, 76, pp. 105–112.
Corner, R. A. & Albert, D. A. (1999) Landtype associations of the high plains: Subsection VII.2.Michigan Natural Features Inventory. Prepared for the Northern Lower Michigan EcosystemManagement Project.
Cowell, D. W. (1998) Ecological landscape planning techniques for biodiversity and sustainability,Environmental Management and Health, 9, pp. 72–78.
Csuti, B., Polasky, S., Williams, P. H., Pressey, R. L., Camm, J. D., Kershaw, M., Kiester, A. R., Downs,B., Hamilton, R., Huso, M. & Sahr, K. (1997) A comparison of reserve selection algorithms usingdata on terrestrial vertebrates in Oregon, Biological Conservation, 80, pp. 83–97.
Daily, G. C. (Ed.) (1997) Nature’s Services: Societal Dependence on Natural Ecosystems (Washington, DC:Island Press).
Dale, V. H., Brown, S., Haeuber, R. A., Thompson Hobbs, N., Huntly, N. J., Naiman, R. J., Riebsame,W. E., Turner, M. G. & Valone, T. J. (1999) Ecological Principles and Guidelines for Managing the Useof Land. Ecological Society of America. White Paper. Available at http://www.esa.org/publica-tions/esalanduse.htm
DePhillips, M. (2001) Personal communication, 1 February.Doppelt, B., Scurlock, M., Frissell, C. & Carr, J. (1993) Entering the Watershed (Washington, DC: Island
Press).Ferrier, S. (2002) Mapping spatial pattern in biodiversity for regional conservation planning: where
to from here? Systematic Biology, 51, pp. 331–363.Forman, R. T. & Godron, M. (1986) Landscape Ecology (New York: John Wiley and Sons).Forman, R. T. & Alexander, L. E. (1998) Roads and their major ecological effects, Annual Review of
Ecology and Systematics, 29, pp. 207–231.
Conservation Planning at the Landscape Scale 735
Gascon, C., Williamson, G. B. & de Fonseca, G. A. B. (2000) Receding forest edges and vanishingreserves, Science, 288, p. 5470.
Grand Traverse Regional Land Conservancy (2003) Available at http://www.gtrlc.org/Gregory, S. V., Swanson, F. J., McKee, W. A. & Cummins, K. W. (1991) An ecosystem perspective of
riparian zones: focus on links between land and water, BioScience, 41, pp. 540–550.Groves, C. R., Jensen, D. B., Valutis, L. L. & Redford, K. H. (2002) Planning for biodiversity
conservation: putting conservation science into practice, BioScience, 52, pp. 499–512.Hall, D. L. (1991) Landscape planning: functionalism as a motivating concept from landscape ecology
and human ecology, Landscape and Urban Planning, 22, pp. 13–19.Hawkins, V. & Selman, P. (2002) Landscape scale planning: exploring alternative land use scenarios,
Landscape and Urban Planning, 60, pp. 211–224.Heikkila, E. J. (1998) GIS is dead; long live GIS! Journal of the American Planning Association, 64,
pp. 350–360.Hersperger, A. M. (1994) Landscape ecology and its potential application to planning, Journal of
Planning Literature, 9(1), pp. 14–29.Hopkins, L. D. (1999) Structure of a planning support system for urban development, Environment
and Planning B: Planning and Design, 26, pp. 333–343.James, F. C. (1999) Lessons learned from a study of habitat conservation planning, BioScience, 49,
pp. 871–874.Knight, R. (1998) Ecosystem management and conservation biology, Landscape and Urban Planning,
40, pp. 41–45.Kraft, S. E. & Penberthy, J. (2000) Conservation policy for the future: what lessons have we learned
from watershed planning and research? Journal of Soil and Water Conservation, 55, pp. 327–333.Landres, P. B., Morgan, P. & Swanson, F. J. (1999) Overview of the use of natural variability concepts
in managing ecological systems, Ecological Applications, 9, pp. 1179–1188.Land Trust Alliance (2002) National land trust census. Available at http://www.lta.orgLapin, M. & Barnes, B. V. (1995) Using the landscape ecosystem approach to assess species and
ecosystem diversity, Conservation Biology, 9, pp. 1148–1158.Lathrop, R. G., Jr. & Bognar, J. A. (1998) Applying GIS and landscape ecological principles to
evaluate land conservation alternatives, Landscape and Urban Planning, 41, pp. 27–41.Loehle, C., MacCracken, J. G., Runde, D. & Hicks, L. (2002) Forest management at landscape scales:
solving the problems, Journal of Forestry, 100, pp. 25–33.Lovejoy, S. B., Lee, J. G., Randhir, T. O. & Engel, B. A. (1997) Research needs for water quality
management in the 21st century: a spatial decision support system, Journal of Soil and WaterConservation, 52, pp. 18–22.
MacDonald, M. (2002) The role of land trusts in landscape-scale collaborative initiatives, Master’sThesis, School of Natural Resources and Environment, University of Michigan.
Michaels, S. (1999) Configuring who does what in watershed management: the Massachusettswatershed initiative, Policy Studies Journal, 27, pp. 565–577.
Michigan Department of Natural Resources (2002) Oil and gas wells in Michigan. Available athttp://www.dnr.state.mi.us/spatialdatalibrary/PDF Maps/Oil and Gas/Oil Gas Well Map 2002.pdf
Michigan Natural Features Inventory (2002) Michigan Natural Features Inventory. Available athttp://www.dnr.state.mi.us/wildlife/heritage/mnfi/.
Mitsch, W. J. & Gosselink, J. G. (2000) Wetlands, 3rd edn (New York: John Wiley and Sons).Morrisette, P. M. (2001) Conservation easements and the public good: preserving the environment
on private lands, Natural Resources Journal, 41, pp. 373–426.Myers, R. L., Stein, N. & Fishleder, J. (1999) Planning in the Alhambra Creek watershed, Geo Info
Systems, 9, pp. 30–35.Naveh, Z. & Lieberman, A. S. (1984) The Evolution of Landscape Ecology: Theory and Application (New
York: Springer-Verlag).Noss, R. F. (1987) Protecting natural areas in fragmented landscapes, Natural Areas Journal, 7,
pp. 2–13.Noss, R. F. & Cooperrider, A. Y. (1994) Saving Nature’s Legacy: Protecting and Restoring Biodiversity
(Washington, DC: Island Press).Noss, R. F., O’Connell, M. A. & Murphy, D. D. (1997) The Science of Conservation Planning: Habitat
Conservation under the Endangered Species Act (Washington, DC: Island Press).O’Neill, R. V., Hunsaker, C. T., Jones, K. B., Riitters, K. H., Wickham, J. D., Schwarz, P., Goodman,
I. A., Jackson, B. & Baillargeon, W. S. (1997) Monitoring environmental quality at the landscapescale, BioScience, 47, pp. 513–519.
736 J. Kazmierski et al.
Pease, J. R. & Coughlin, R. E. (1996) Land Evaluation and Site Assessment: A Guidebook for RatingAgricultural Lands (Ankeny, IA: Soil and Water Conservation Society).
Poiani, K. A., Baumgartner, J. V., Buttrick, S. C., Green, S. L., Hopkins, E., Ivey, G. D., Seaton, K. P.& Sutter, R. D. (1998) A scale independent, site conservation planning framework in The NatureConservancy, Landscape and Urban Planning, 43, pp. 143–156.
Poiani, K. A., Richter, B., Anderson, M. G. & Richter, H. E. (2000) Biodiversity conservation atmultiple scales: functional sites, landscapes, and networks, BioScience, 50, pp. 133–146.
Polasky, S., Doremus, H. & Rettig, B. (1997) Endangered species conservation on private land,Contemporary Economic Policy, 15, pp. 66–76.
Polasky, S., Camm, J. D. & Garber-Yonts, B. (2001) Selecting biological reserves cost-effectively: anapplication to terrestrial vertebrate conservation in Oregon, Land Economics, 77, pp. 68–78.
Randhir, T. O., O’Connor, R., Penner, P. R. & Goodwin, D. W. (2001) A watershed-based landprioritization model for water supply protection, Forest Ecology and Management, 143, pp. 47–56.
Rigney, H., Grand Traverse Regional Land Conservancy, Land Protection Specialist (2003) Personalcommunication, May.
Rozich, T. J. State of Michigan Department of Natural Resources (1998) Manistee River Assessment,Fisheries Division Special Report 20.
Shindler, B. (2000) Landscape-level management: it’s all about context, Journal of Forestry, 98,pp. 10–14.
Slocombe, D. S. (1993) Implementing ecosystem-based management, BioScience, 43, pp. 612–622.Soule, M. E. & Terborgh, J. (1999) Conserving nature at regional and continental scales—a scientific
program for North America, BioScience, 49, pp. 809–817.Steiner, F. (2000) The Living Landscape (New York: McGraw-Hill).Steinitz, C., Arias, H., Bassett, S., Flaxman, M., Goode, T., Maddock, T. III, Mouat, D., Peiser, R. &
Shearer, A. (2003) Alternative Futures for Changing Landscapes: The Upper San Pedro River Basin inArizona and Sonora (Washington, DC: Island Press).
The Nature Conservancy (2000) The five-S framework for site conservation: a practitioner’s hand-book for site conservation planning and measuring conservation success. Report published by TheNature Conservancy.
The Nature Conservancy (2001) Landscape project area strategic plan for the Shiawassee Huron-Clinton Headwaters and Shiawassee River. Report published by The Nature Conservancy.
Theobald, D. M., Hobbs, N. T., Bearly, T., Zack, J. A., Shenk, T. & Riebsame, W. E. (2000)Incorporating biological information in local land-use decision making: designing a system forconservation planning, Landscape Ecology, 15, pp. 35–45.
US Bureau of the Census (2002) Available at http://www.census.gov (Washington, DC: US Bureauof the Census).
US Forest Service (1983) Manistee River wild and scenic study report (Cadillac, Michigan: US ForestService).
Vos, C. C., Verboom, J., Opdam, P. F. M. & TerBraak, C. J. F. (2001) Toward ecologically scaledlandscape indices, American Naturalist, 157, pp. 24–41.
Wooley, J. T. & McGinnis, M. V. (1999) The politics of watershed policymaking, Policy Studies Journal,27, pp. 578–594.