conservation and demand management: where we … paper... · achieve environmental, financial,...
TRANSCRIPT

Conservation and Demand Management:
Where We Are Today
Jessie Ma, Danilo Yu, Craig Brown, and Bala Venkatesh
April 2015
2
Table of Contents
1. Executive Summary ................................................................................................................. 4
2. Introduction ............................................................................................................................ 5
3. Conservation Background ....................................................................................................... 5
3.1. Definitions ........................................................................................................................ 5
3.2. Goals of Conservation ...................................................................................................... 6
3.3. Ingredients for Effective Conservation Programs ............................................................7
4. Ontario Context ....................................................................................................................... 8
4.1. Energy Sources ................................................................................................................. 8
4.2. Carbon Emissions ............................................................................................................ 8
4.3. Price Signals ..................................................................................................................... 8
4.3.1. Electricity .................................................................................................................. 9
4.3.2. Gas ............................................................................................................................ 9
4.4. Key Stakeholders in Conservation ................................................................................... 9
4.5. Conservation First ...........................................................................................................10
5. Academic Research on Conservation ..................................................................................... 11
5.1. Electricity ........................................................................................................................ 12
5.1.1. Residential – Intervention Strategies ...................................................................... 12
5.1.2. Residential – Rates .................................................................................................. 15
5.1.3. Residential – Energy Efficiency ............................................................................... 16
5.2. Gas ................................................................................................................................... 18
5.2.1. Commercial – Energy Efficiency ............................................................................. 18
5.2.2. Industrial - Intervention .......................................................................................... 21
6. Existing Conservation & Demand Management Programs .................................................. 22
6.1. Select Ontario Programs ................................................................................................ 22
6.1.1. Toronto Hydro: Residential Appliance Retirement ............................................... 22
6.1.2. Toronto Hydro: Residential and Small Commercial Demand Response ............... 22
6.1.3. Enbridge: Low Income Program ............................................................................ 23
6.1.4. OPA/IESO Commercial Retrofit Program .............................................................. 24
6.1.5. Outreach Methods .................................................................................................. 24
6.2. Programs In Other Jurisdictions ................................................................................... 25

3
6.2.1. Canadian Programs ................................................................................................ 25
6.2.2. American Programs ................................................................................................ 26
7. Potential Areas for Future Research ..................................................................................... 27
8. References ............................................................................................................................. 29
Appendix A: Conservation Programs in Ontario ........................................................................... 31
List of Figures
Figure 1 – Tree structure of all possible intervention strategies [11] ............................................ 12
List of Tables
Table 1 – Demand Response, Conservation, and Energy Efficiency for Electricity ....................... 6
Disclaimer:
The authors do not represent the views of the Independent Electricity System Operator.
4
1. Executive Summary
In Ontario, conservation and demand management (CDM) has long been a priority. This paper
reviews some of our lessons from the past, in Ontario and beyond, as we look to the future.
First, conservation rationale and program designs are explored. Conservation can be a tool to
achieve environmental, financial, health, and resiliency goals. Effective conservation programs
should be designed with a focus on the desired outcomes.
Second, the electricity and gas landscape in Ontario is summarized. Ontario’s electricity has a
relatively low carbon content; coals plants have been phased out, and nuclear power is the largest
energy source. Natural gas is responsible for more of the province’s carbon emissions, but the
cost of natural gas is relatively low, making conservation programs more difficult to justify.
Further, natural gas is billed volumetrically, without any time-dependent component, whereas
electricity is traded in a real-time market operated by the Independent Electricity System
Operator (IESO). This allows for more options for the creative design of conservation programs
in electricity than in natural gas.
Third, academic literature is surveyed to distill findings from conservation programs around the
world. Behavioural interventions are most effective when tailored to specific target groups, taking
into account factors such as wealth, education, culture, and age. Price is also an effective tool to
encourage conservation; artificially low prices deter consumers from pursuing conservation.
Fourth, a sampling of current conservation programs in Ontario and in select jurisdictions is
profiled. (These are in flux as Local Distribution Companies – LDCs – take on responsibility for
designing conservation programs for their customers. Programs offered in Ontario include
appliance retirement, demand response, low-income, and retrofits.
Lastly, potential areas for future research are identified. Demand response for electricity is a
promising area in which multiple conservation goals can be reached in a targeted manner. Gas
and water conservation could be further explored, as most existing efforts appear to be
concentrated in electricity. The governance and structure of the electricity, gas, and water
landscapes could be analyzed to better align incentives for key stakeholders to encourage
conservation. Goals could be used to drive the design of conservation programs. Commercial
and industrial consumers could be the focus of new research. The rate structure and price of
resources could be adjusted so that conservation is promoted. Monitoring and evaluation of
existing conservation programs could be further explored. Consumer segmentation could yield
programs tailored to specific key characteristics of consumer groups. Industry experts’ feedback
in a series of interviews could also be documented in a future research paper.
5
2. Introduction
Throughout history, energy has been the driving force behind the advancement of our society.
While energy delivers unprecedented benefits, it comes at a cost – both economic and
environmental. One way to manage those costs is through conservation, and conservation is
particularly powerful in instances where the incremental costs outweigh the displaced benefits of
energy consumption. In Ontario, momentum for conservation has been growing with the
provincial government’s Conservation First framework. In light of this renewed focus on
conservation, this paper explores conservation rationale, the Ontario context, academic research,
and existing programs in conservation. Promising opportunities for further academic inquiry are
also identified.
3. Conservation Background
Some foundational concepts about conservation are explored in this section. Key definitions are
reviewed, goals are articulated, and key elements for effective conservation programs are
identified.
3.1. Definitions
Conservation and Demand Management (CDM) can take various forms. Some key concepts in
the electricity context are summarized in Table 1.
Reduce Peak Reduce Volume (Total Energy Consumed)
Demand Response Conservation Energy Efficiency
Changes in electric usage in
response to financial signals
• Using less energy
• Usually behavioural
• Using energy more
effectively
• Usually technological
Can defer building new peaking
generation, transmission &
distribution infrastructure
• Can save on generation fuel costs
• Fixed costs still apply
Lower carbon emissions, since
peaking plants are typically
fossil fuels
Reduced emissions if displaced fuel is carbon-based
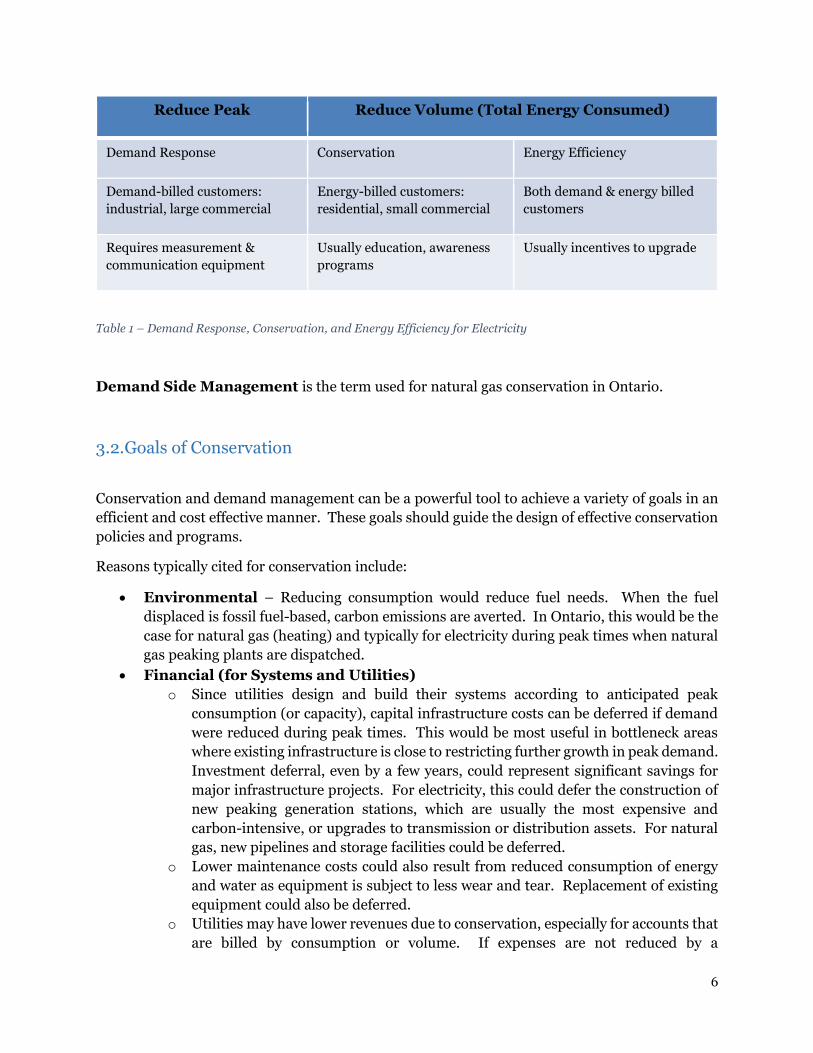
6
Reduce Peak Reduce Volume (Total Energy Consumed)
Demand Response Conservation Energy Efficiency
Demand-billed customers:
industrial, large commercial
Energy-billed customers:
residential, small commercial
Both demand & energy billed
customers
Requires measurement &
communication equipment
Usually education, awareness
programs
Usually incentives to upgrade
Table 1 – Demand Response, Conservation, and Energy Efficiency for Electricity
Demand Side Management is the term used for natural gas conservation in Ontario.
3.2. Goals of Conservation
Conservation and demand management can be a powerful tool to achieve a variety of goals in an
efficient and cost effective manner. These goals should guide the design of effective conservation
policies and programs.
Reasons typically cited for conservation include:
Environmental – Reducing consumption would reduce fuel needs. When the fuel
displaced is fossil fuel-based, carbon emissions are averted. In Ontario, this would be the
case for natural gas (heating) and typically for electricity during peak times when natural
gas peaking plants are dispatched.
Financial (for Systems and Utilities)
o Since utilities design and build their systems according to anticipated peak
consumption (or capacity), capital infrastructure costs can be deferred if demand
were reduced during peak times. This would be most useful in bottleneck areas
where existing infrastructure is close to restricting further growth in peak demand.
Investment deferral, even by a few years, could represent significant savings for
major infrastructure projects. For electricity, this could defer the construction of
new peaking generation stations, which are usually the most expensive and
carbon-intensive, or upgrades to transmission or distribution assets. For natural
gas, new pipelines and storage facilities could be deferred.
o Lower maintenance costs could also result from reduced consumption of energy
and water as equipment is subject to less wear and tear. Replacement of existing
equipment could also be deferred.
o Utilities may have lower revenues due to conservation, especially for accounts that
are billed by consumption or volume. If expenses are not reduced by a
7
proportional amount, utilities could seek rate increases in their next rate
applications to offset the reduced revenues.
Financial (for Consumers) – Consumers who reduce their consumption would lower
their bills. Rational consumers who actively manage their energy consumption would be
expected to conserve when the value they place on their consumption is less than the
incremental costs in their bills. While natural gas consumers are billed volumetrically,
electricity consumers are categorized in a variety of rate classes, which would affect the
overall bill savings from conservation.
Financial (for Economy) – For some businesses, energy bills constitute a significant
expense, and these costs can affect the companies’ and region’s competitiveness.
Conservation is one tool for businesses to manage their costs, and this could affect siting
decisions (and jobs) and product competitiveness.
Health – Fossil fuel-based generation facilities also emit harmful pollutants that increase
the risks to human health, even when environmental regulations are followed. For
electricity, these are typically associated with peaking natural gas plants. If demand could
be reduced during peak periods, then pollutants from these gas plants could be averted.
Resiliency – Reduced consumption would lower the stress on the equipment in energy
systems, thereby reducing maintenance costs. Systems not operating near its limits are
also easier to operate, allowing for more flexibility in taking outages and transferring loads
for scheduled maintenance.
3.3. Ingredients for Effective Conservation Programs
Conservation and demand management are tools or means to achieve certain goals, rather than
goals in and of themselves. As such, designers of CDM programs should consider these key
elements of effective CDM:
Focus on Key Goals – The design of CDM programs should centre on clearly articulated
goals. These goals should be monitored regularly to assess the programs’ performance.
Efficiency – Costs and benefits should be weighed for each option to ensure that funds
are used efficiently.
Sustainability – Long-term environmental impacts and economic viability should be
considered.
Flexibility – Robust programs should be adaptable to changing conditions. Programs’
performance should be regularly measured and monitored, while the external context
should be routinely surveyed to update and improve the programs. Ideas and best
practices from other jurisdictions should also be considered periodically.

8
4. Ontario Context
Ontario has a distinctive energy landscape. Understanding this landscape is crucial for identifying
ways in which conservation can add value. Ontario’s energy sources, carbon emissions, price
signals, and key stakeholders are discussed. The provincial government’s Conservation First
framework is also highlighted as it is a guiding policy agenda.
4.1. Energy Sources
Electricity – Ontario supply is dominated by nuclear power, which represented 56% of the
supply mix in 2013 and is typically operating all the time to supply the “base load.” Hydroelectric
power provided 22%, while gas supplied 10%. Natural gas plants are often peaking plants,
meaning they typically supply power during times of high system demand, such as the hottest
days of summer. Other energy sources were conservation (5%), wind (3%), solar (1%), and coal
(2%), which has since been phased out. [10]
Gas – Most of Ontario’s natural gas is brought into Ontario through transmission pipelines from
Alberta and Saskatchewan. Gas is then supplied to consumers in Ontario primarily by Enbridge
and Union Gas. Both have storage and distribution facilities in Ontario.
4.2. Carbon Emissions
Ontario’s climate goals are to reduce emissions by 15% from 1990 levels by 2020 and 80% by
2050. Conservation has the potential to help Ontario reach these targets.
Transportation was responsible for the largest share of Ontario’s carbon emissions at 34% in 2012.
Industry was next at 30%, followed by buildings at 17%. Electricity contributed only 9%. [18]
The most prominent conservation programs are in the electricity sector, although their goals
extend beyond carbon emission reductions.
4.3. Price Signals
Price signals could be a tool to nudge consumers of electricity, gas, and water to adjust their
behaviour and consumption levels. Therefore, it is important to understand the rate structure for
these services.

9
4.3.1. Electricity
The electricity bill is broken down into several components: Electricity, Delivery, Regulatory
Charges, the Debt Retirement Charge, the Ontario Clean Energy Benefit, and Tax. (The Debt
Retirement Charge and the Ontario Clean Energy Benefit will soon be removed from bills.)
Consumers’ conservation efforts are directed primarily at the Electricity portion, although there
could be some savings in the Delivery portion depending on their rate class.
Ontario’s Independent Electricity System Operator (IESO) runs the electricity market, where
buyers and sellers of electricity are matched in real-time at the market clearing price. Therefore,
electricity is more expensive in times of high demand and short supply, while prices are lower
when demand is low and supply is plentiful. Large electricity consumers are usually market
participants and pay market rates. Residential are usually on the Regulated Price Plan (RPP) and
have time-of-use rates that are adjusted twice a year. (Consumers who enter into agreements with
retailers are an exception.)
4.3.2. Gas
Natural gas consumers are billed by their volumetric consumption.
4.4. Key Stakeholders in Conservation
Consumers – Main consumer groups are residential, commercial and industrial, and all are
primarily interested in reliable electricity, gas and water service at low prices.
Provincial Government – Ontario’s Ministry of Environment and Climate Change has goals
to reduce emissions by 15% from 1990 levels by 2020 and 80% by 2050. Meanwhile, Ontario’s
Ministry of Energy has a Conservation First framework that aims to reduce electricity
consumption by 7 TWh by 2032. Both electricity and gas fall under the Ministry of Energy’s
mandate. The provincial government is also interested in maintaining reasonable electricity rates
for Ontario’s residents and businesses, especially high-volume consumers such as manufacturers,
so that Ontario is competitive.
Local Distribution Companies – Ontario has over 70 Local Distribution Companies (LDCs)
that deliver electricity directly to consumers. Most are owned by local municipalities. Rates
charged by LDCs are regulated by the Ontario Energy Board, and profits generated by LDCs flow
back to their owners. For municipally-owned LDCs, the profits from LDCs go into general
revenues to provide municipal services. LDCs have been delivering conservation programs
designed and funded by the Ontario Power Authority (now IESO), but under the new conservation
framework, they will have more power to tailor conservation programs to their own customer
bases. While LDCs are mandated to increase shareholder value and maximize returns,

10
conservation can negatively impact their revenues. However, the costs to run the conservation
programs themselves are recovered from ratepayers.
Natural Gas Utilities – Ontario is largely served by two private gas utilities: Enbridge and
Union Gas. As private companies, their profits go to their shareholders. Both companies also
have conservation programs, which are funded through OEB-approved rates.
Independent Electricity System Operator (IESO) – The IESO runs the electricity market
in Ontario, dispatching generators in real time to meet the demand at market prices. The IESO
also now has responsibility for electricity conservation. (This was previously the purview of the
Ontario Power Authority, which merged with the IESO on January 1, 2015.)
Ontario Energy Board – The Ontario Energy Board regulates the rates that electricity and gas
utilities can charge consumers.
4.5. Conservation First
Ontario has acknowledged that conservation must play an important role in managing the energy
requirements of the future. The Ontario government expressed this principle in a discussion
paper, Conservation First: A Renewed Vision for Energy Conservation in Ontario, released in
2013. The paper stated that conservation is “the cleanest and least costly energy resource.” [8]
To this end, Ontario has adopted a policy of ‘Conservation First’. “The [Conservation First] vision
is guided by the principle that conservation should be the first resource considered in meeting
power needs” [8]. Using this approach, Ontario aims to “offset almost all of the growth in
electricity demand to 2032 by using programs and improved codes and standards. This will lessen
the need for new supply” [10]. “Ontario is aiming to use Demand Response (DR) to meet 10% of
peak demand by 2025, equivalent to approximately 2,400 megawatts (MW) under forecast
conditions” and conservation is expected to grow from 5% of forecast energy production in 2014
to 16% of forecast energy production in 2032 [10].
“To identify how much electricity Ontario could conserve over the next two decades, the [IESO]
commissioned an Achievable Potential study. The study’s results were used by the Ministry of
Energy to reset Ontario’s electricity conservation targets” [8]. See ICF Marbek (2014) for the full
report. [13]
To work towards achieving these targets, “the Independent Electricity System Operator (IESO)
will evolve existing [demand response] DR programs and introduce new DR initiatives” [10]. For
example, the “Green Button Initiative gives consumers access to their energy data and the ability
to connect to mobile and web-based applications so they can analyze and manage their energy
use. The combination of data and the innovative applications could also guide them in making the
investment decisions necessary to improve their energy efficiency” [10]. Similarly, “a social
benchmarking pilot program is under way, led by the [IESO], to test different approaches that
enable consumers to compare their energy consumption with other similar consumers. Pending
the success of the pilot program, the government will explore expanding social benchmarking”
[10].
11
It should also be noted that the “calculation of conservation program cost-effectiveness must
include a 15 per cent adder to account for the environmental, economic and social (i.e., non-
energy) benefits of conservation. The adder should enable more potential conservation and
demand management (CDM) programs to meet the framework’s cost-effectiveness requirements.
The Ministry’s decision to account for non-energy benefits in the calculation of cost-effectiveness
is laudable and in line with best practices in other jurisdictions”. [8]
Below is a list from the Environmental Commissioner of Ontario (2014) [8] which provides some
additional context.
“The key actions taken by the ministry to date are:
Releasing the [Long Term Energy Plan Achieving Balance, 2013 [10]], which
establishes the role of conservation in provincial electricity system planning and
makes commitments to implement some of the other Conservation First proposals,
such as on-bill financing (December 2, 2013);
Directing the Ontario Energy Board (OEB) to establish a new conservation framework
for natural gas distributors covering the 2015-2020 period and to review how to
integrate conservation into electricity and natural gas infrastructure planning at the
regional and local levels (March 26, 2014);
Directing the Ontario Power Authority (OPA) to implement elements of the
Government of Ontario, 2013, including the transition of demand response programs
to the Independent Electricity System Operator (March 31, 2014); and,
Establishing the new policy framework for the delivery of electricity conservation
programs between 2015 and 2020, through directions to the OEB (March 26, 2014)
and the OPA (March 31, 2014).”
5. Academic Research on Conservation
This section contains an overview of conservation and demand management topics for found in
academic literature for electricity and gas.
For electricity, there is a wealth of research studies on residential conservation and energy
efficiency, including various intervention strategies. Factors such as public commitments,
targeted information, feedback, social benchmarking, and rewards all encourage conservation
behaviour. Electricity rates and pricing structure were also influential in conservation.
Meanwhile, energy efficiency in residential electricity use is driven by technology diffusion in the
marketplace.
For natural gas, conservation research weighs more heavily on the commercial sector. Building
automated control systems can reduce gas consumption with minimal to no impact on comfort of
building occupants. Industrial consumers consider factors such as potential cost savings, brand
image, and organizational capacity.
12
5.1. Electricity
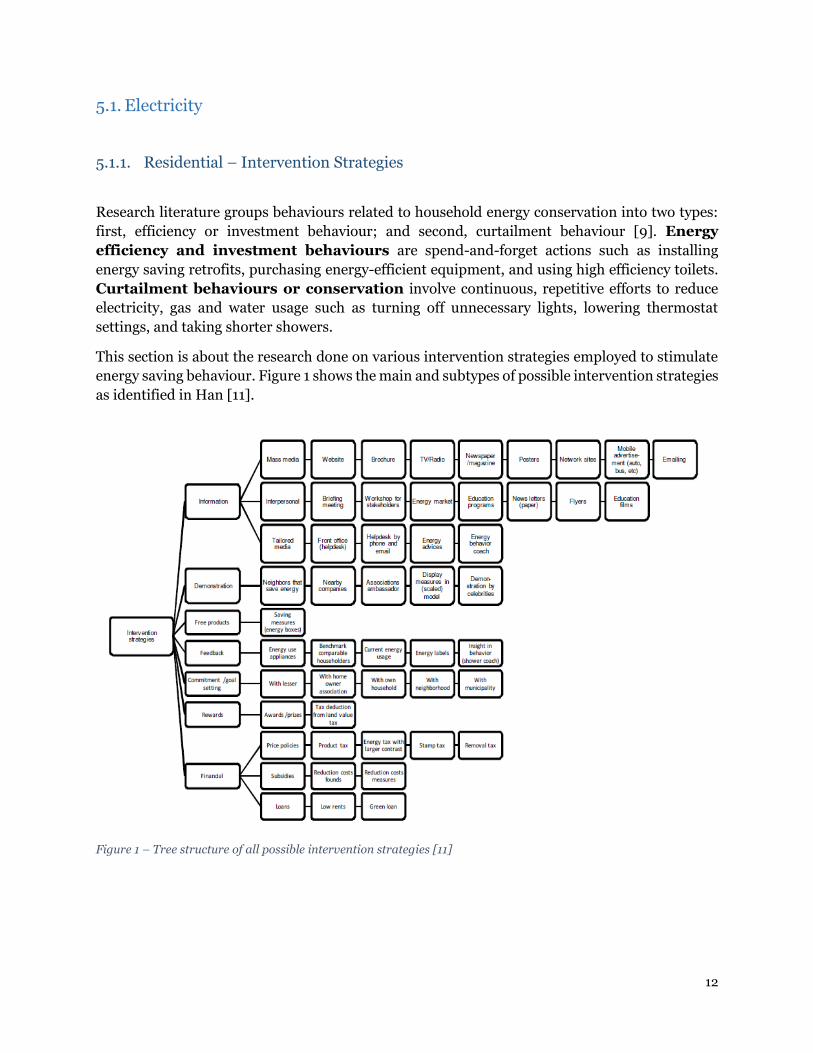
5.1.1. Residential – Intervention Strategies
Research literature groups behaviours related to household energy conservation into two types:
first, efficiency or investment behaviour; and second, curtailment behaviour [9]. Energy
efficiency and investment behaviours are spend-and-forget actions such as installing
energy saving retrofits, purchasing energy-efficient equipment, and using high efficiency toilets.
Curtailment behaviours or conservation involve continuous, repetitive efforts to reduce
electricity, gas and water usage such as turning off unnecessary lights, lowering thermostat
settings, and taking shorter showers.
This section is about the research done on various intervention strategies employed to stimulate
energy saving behaviour. Figure 1 shows the main and subtypes of possible intervention strategies
as identified in Han [11].
Figure 1 – Tree structure of all possible intervention strategies [11]
13
1) Commitment / Goal setting
In this type of intervention, homeowners are asked to make a written pledge to conserve energy.
This commitment can be private, where the participant’s name is kept confidential, or public,
where the program participants’ names will be publicized and social pressure used as a
determinant in conservation behaviour. Homeowners are asked to fill out a questionnaire and
sign a request to conserve energy by a certain percentage. Results from a study by Pallack [20]
show that those who agreed to have their names published have a lower rate of
increase in consumption of natural gas and electricity usage. Feedback to indicate how
the household is performing relative to the goal was based on self-monitoring of energy and gas
usage through meter readings.
A review and evaluation of various studies by Abrahamse [1] to assess the effectiveness of various
household energy conservation programs found conflicting results in this type of intervention.
Two studies (1976, 1983) showed long-term effects while another (1984) showed short-term
effects only. Abrahamse [1] found that setting a high goal results in higher energy savings and
setting a low goal appeared to be not effective, e.g. 2% reduction may be perceived as not worth
the effort.
2) Information
Providing information is a commonly-used strategy to promote conservation. This could be in
the form of general energy- and water- related topics or specific saving measures that households
can adopt. Different methods of disseminating information are listed in Figure 1.
Workshops are one of the best medium to distribute efficiency devices, such as shower flow
restrictors, but these do not result in behavioural changes [1].
Mass media campaigns increase awareness, but there is no clear evidence that they
result in energy savings. A mass media campaign conducted by the Dutch government aimed
at informing their citizens on the possible ways of dealing with global warming did not result in
behavioural changes [1]. A 2012 study [26] of 581 households in six cities of Jiangsu Province in
China showed that publications and activities related to energy savings are more effective if
women and older people are targeted because they have more interpersonal interaction with
members of the community. It shows that knowing your target group is an important
factor when choosing which strategy to use. For example, a study in 2008 for the state of
Florida, USA [12] found that a majority of the participants thought the best way to meet Florida’s
long-term electricity needs is through the supply side by building more generating capacity using
renewable resources. A majority that supported using renewable resources were Democrats.
More Republicans than Democrats preferred the supply side solution of using existing fuel
sources. Only a few (both Republicans and Democrats) believed changes in consumer behaviour
is the best way to meet Florida’s future electricity demand.
Households chosen in tailored home audits could be given highly personalized options to save
electricity, gas and water: efficiency (e.g. installation of energy-saving retrofits, purchase of
energy efficient appliances, use of high efficiency toilets & washing machines, etc.) and
14
curtailment behaviour (e.g. taking shorter showers, turning off unnecessary lights, turning down
thermostats, watering the lawn deep but once a week, etc.). It was found that tailored home
audits are more effective in terms of efficiency actions taken than curtailment
behaviour [1]. However, this finding though does not apply to the low-income demographic
because the additional expenses are too burdensome [5]. A study in 1988 showed that a trained
auditor was a requirement to be able to persuade residents to adopt energy saving measures [1].
A trained auditor resulted in more homeowners applying for a financial rebate, but no difference
in actual energy use was found. One of the studies (1982-1983) evaluated in Abrahamse [1] found
that households who received home audits had a more positive attitude towards gas conservation
and saved gas more than the unaudited group, but it also resulted in higher gas use. However, the
authors of the study did expressed doubts about the quality of the data. The ENERSAVE program
of Canada (1982-1983) did not produce positive results. A possible explanation is the elapsed
time (2 years) between the intervention & the effect measurement [1]. A 2012 study in the United
Kingdom found that home energy visits did not produce any change in the participants’ energy-
and water-related efficiency behaviours and did not overcome the barriers to the installation of
more significant retrofit measures [22].
3) Modeling/Demonstration
This strategy provides examples of various energy-saving measures. It could be delivered through
websites, model homes, or TV ads. A study (1985) reviewed by Abrahamse [1] used TV ads
targeting middle-class homeowners resulted in increased knowledge and energy savings. Another
study (1986) found conflicting results in two samples. One sample of participants showed
behavioural effect but no learning effect. The reverse was found on another sample.
4) Feedback
The evaluation of intervention studies by Abrahamse [1] showed that the effectiveness of
intervention strategies increased when participants were given feedback on how
they fared in their energy saving efforts. The more frequent the feedback, the more
effective it was. A 1986 study evaluated a feedback monitor that displayed monetary costs
installed in households of two Canadian and one American city. The Canadian participants used
less energy than the control group, but no change in knowledge were observed. In the American
city, the opposite effect occurred. The authors attribute this to what is called the “ceiling effect”
(knowledge about energy issues were already high in Canada when compared to the US).
Abrahamse [1] evaluated the effect of the frequency of the feedback. Providing continuous
feedback about difference between monetary cost used during on- and off-peak periods resulted
in a shift to off-peak hours in a 1986 study, but total electricity consumption did not change. In
another study (1989), providing continuous feedback by means of a feedback monitor displaying
daily gas use as well as daily target consumption based on historical annual gas used resulted in
more gas savings than those who received monthly feedback. The authors found that when weekly
or monthly feedback was provided, knowledge and behavioural commitment have stronger effects
than price.
15
Comparing one’s performance to others (comparative feedback) appeared to help
in reducing household energy consumption because of a sense of competition or
social pressure. Netherland’s EcoTeam Program (like a book club, the members meet regular
to exchange information about energy-saving options) appeared to save electricity, gas and water
because of the comparative feedback given to each team. Feedback seems to work on high
consumers but has a negative effect on low consumers.
5) Rewards
Rewards can be tied to the amount of energy saved or to a fixed amount awarded when a certain
percentage is attained. Combined with feedback and information on electricity used, a
study in 1977 found all participating households reduced electricity use. However, this
had a short-term effect – the savings decreased as the treatment period progressed. Another
study (1981) lowered the reward but awarded a bonus if the total consumption of the participants
exceeded a certain percentage [1]. In that case, the savings did not decline during the treatment
period. A study in 1981 found that government tax credits did not result in consumers’ decisions
to buy and install in-home insulation [1]. Households that took advantage of tax credit programs
were not the ones affected most by high energy prices [5]. Studies using comparative feedback did
not find it more effective than individual feedback, but combining comparative feedback with
rewards in a contest setting proved to be successful [1].
5.1.2. Residential – Rates
The aim of intervention is to encourage voluntary behavioural change or to change the context in
which decisions are being made. Examples of intervention include laws that prohibit watering
lawns on certain days, financial rewards (rebates, tax credits) or giving away or subsidizing energy
efficient devices and equipment [9][11].
Another form of intervention that changes the context through which decisions are made is
pricing structure. There are several factors that can complicate pricing incentives, including:
(1) low-income residents in poorly insulated houses with inefficient appliances and few resources
to reduce their consumption; and (2) renters who do not have control over their utility bills
because they do not own the appliances and lack the incentive to insulate a building they do not
own.
Rate designs to make consumers more aware of the actual cost of resource used include: (1)
inclining block rates, for which one pays more as consumption increases; (2) time-of-use rates,
where rates differ during low and high demands; and (3) revenue decoupled rates, which break
the tie between a utility’s revenues through sale of energy and its profits. When utilities’ revenues
are tied directly to its retail sales, any reduction in energy consumption would reduce its profits.
This situation creates a disincentive for utilities to support energy efficiency.
16
In a 2008 study [12] in Florida, the majority of respondents thought the best way to meet the
state’s energy needs was by increasing capacity through renewable resources. For Floridians,
higher electricity rates would make them use electricity more efficiently or consume less energy
over other factors such as serious energy shortage, major environmental factors, government or
utility financial incentives, and environmental awareness.
With the installation of smart meters in homes, Ontario introduced the time-of-use (TOU) pricing
in 2006. The purpose of the program is to encourage consumers to switch energy usage to off-
peak hours to even out the daily load resulting in a Peak-to-Average (PTA) ratio of 1.0. The 2013
hourly aggregate load data of Ontario was analyzed by Adepetu [2] to determine if the Time-Of-
Use (TOU) pricing scheme used in Ontario actually resulted in a decrease in the mean peak-to-
average load ratio. The authors concluded that since the introduction of the TOU pricing, the
mean peak-to-average ratio actually increased. The authors made recommendations to decrease
this ratio, such as increasing the number of seasons from two to four. Or, if two seasons are kept,
the seasonal boundaries should be shifted two weeks back so the TOU scheme would better reflect
the actual distribution of peak, mid-peak and off-peak times of the load.
There are also other approaches that can be employed to reduce the electricity usage and the
utility’s peak demand without changing the rate structure: (1) self-programming major appliances
(such as heating and cooling systems) to respond automatically to price changes; and (2) shutting
on and off a homeowner’s major appliances during high demand by the utilities.
5.1.3. Residential – Energy Efficiency
The predominant approach of research studies is through curtailment behaviour rather than
efficiency, however, the energy-saving potential of efficiency is considered greater than that of
curtailment [9].
New technology must be developed into a marketable product or process to make it attractive
enough for consumers to adopt. There is an abundance of research on invention and innovation,
but researchers and policy makers have typically given less attention to the diffusion phase
(market penetration), which is crucial [16]. Accelerating the deployment of energy technologies
and systems is needed to promote the efficient use and production of energy and ensuring security
of supply. Factors that determined the adoption of energy-conserving technologies and the effects
of economic incentives and conventional regulations in encouraging such adoption are examined
in [13]. In the case of new building construction, the authors found that ‘artificially low’ energy
prices add to the slow adoption of energy-efficient technology. To accelerate the diffusion of
technology into the marketplace, the following factors are needed: low cost of
purchasing and installing the equipment; regulations (such as building codes),
subsidies, and tax credits; and an increase in income and education.
In the case of retrofitting existing residential homes with energy-efficiency technologies, the
authors found that the decision is based on current energy prices with no regards to future energy
trends; low cost of purchasing and installing the equipment; and government subsidies or tax

17
credits. Interestingly, the study conducted by Abrahamse [1] found that government subsidies or
tax credits do not affect consumers’ decision to install energy-saving measures, such as in-home
insulation. The adoption of new technology in retrofitting existing homes is a slow process
because of the fact that it involves individual decisions by millions of homeowners [5]. A 2012
study conducted by Yue [26] in China, found that introducing new energy-efficient
products or providing incentive programs for the use of energy-efficient technology
is more effective if a middle-aged group is targeted because they have more buying
power while providing subsidies on energy-efficient products could improve the
paying capacity of people at the lower-income level.
Accelerating the design and deployment of technologies and systems for existing buildings will
provide a huge potential for energy savings. Some energy savings are already achieved by
providing rebates and incentives through retrofits of existing components such as windows, roofs,
facades and heating and cooling systems. In the study conducted by the International Energy
Agency (IEA) [14], greater savings can be achieved through full residential building retrofits using
prefabricated renovations modules for both facades and roofs; 80%-90% or 30kWh-50kWh per
square meter per year of energy is possible.
Existing energy-saving technology currently available are:
1) Appliances with 1 watt standby power as mandated by the G8 member nations
when they approved IEA’s 1-Watt plan
2) Heat Pumping Technologies: Using heat from the air, ground, and water is an
efficient way to cover all building energy needs, including dehumidification. Actual
energy savings of heat pumps are difficult to measure because their market share
remains low [14]. Some heat pump concepts developed within the IEA project are now
commercially available in North America. Most common forms of heat pumps in the
residential sector are:
a. Air-to-air central, split and room air conditioners: This is the standard technology
for single room or centralized air conditioning.
b. Air-to-water heat pumps: These are often called air source heat pumps (ASHP).
They provide sanitary hot water and space heating.
c. Water-to-water and water-to-air heat pumps: These use water as the heat source
or sink, and they’re typically more efficient than ASHPs.
d. Ground-source heat pumps (GSHP): These use brine-to-water or brine-to-air heat
pumps coupled with a heat exchanger buried in the ground, and they’re more
efficient in cold weather than ASHPs.
3) Demand Response: This involves shaping and levelling electricity load profiles.
4) Solar Heating and Cooling Technologies: An active solar thermal system can be
used for hot water and space heating and cooling.
18
5.2. Gas
5.2.1. Commercial – Energy Efficiency
Building automation and control systems (BACS) can monitor and control the indoor and outdoor
environment of commercial, industrial and institutional facilities. It can control a building’s
heating, cooling, ventilation, lighting, security and other systems. It is not uncommon for older
buildings to have simple programmable thermostats to control the HVAC system. Some buildings
have basic control systems that do not allow building owners to implement aggressive energy
management strategies to respond to rising energy costs. There are advanced building
automation and control systems today that use technology that can help building owners and
tenants conserve energy. This technology can control every piece of equipment in the building:
pumps, fans, valves, dampers, compressors, boilers, motors, lighting and more. Integrated
systems can divide a building into zones. Individual access cards can also be linked to the lighting
and climate control system of a specific zone.
A well-designed building automation system can save the owner 5%-20% annually in energy costs
[23]. Below is a list of best practice basic control strategies recommended by Schneider Electric
[23]:
1) Zone Scheduling: A building can be divided into zones based on occupancy schedule
such that lighting and space heating/cooling can be reduced or shut down in a zone
with fewer or no occupants.
2) Night/Unoccupied Setback: This is more flexible than thermostats. Comfort
settings of space heating and cooling can be programmed to change based on season
so that demand can be reduced during unoccupied hours.
3) After-Hours Override: This allows comfort settings to be adjusted temporarily after
office hours. This will prevent the change to become permanent without human
intervention. Together with zoning, it will prevent the whole building to be set t0 100%
comfort level to meet the needs of a small group.
4) Occupancy Sensors: These are motion or infrared signature sensors to detect
occupants and turn on lights or HVAC accordingly. In the server room, infrared
signatures can be used to detect heat and divert cooling in that area.
5) Holiday Scheduling: An annual calendar can be programmed into the automated
system to ensure the building does not operate in occupied mode during holidays.
Below is a list of more advanced control strategies that can be implemented [23]:
1) Follow Sunrise & Sunset: This feature is used to control lighting schedules in
different areas (parking lots, signs and outdoor access lighting) throughout the year as
the duration of daylight changes.
2) Daylight Harvesting: Photocells are used to control lighting in areas near exterior
walls and windows. Motorized shades can be activated to optimize the availability of
natural light while at the same time minimizing the effect of solar radiant heat to the
indoor temperature.
19
3) Optimum Start: Morning warm-up or cool-down cycles can be optimized based on
outside and indoor temperatures to bring the building to the required comfort level of
the occupants.
4) Optimum Stop or Coasting: This initiates setback temperatures at the earliest
possible time before the building is fully unoccupied while still maintaining occupant
comfort level.
5) Ventilation on Demand: This detects CO2 levels in occupied space and calculates
when more outdoor air is needed. CO2 levels are also used to assist heating and cooling
anticipation to optimize comfort and air circulation.
6) Variable Air Volume Supply Air Temperature Reset: This improves occupant
comfort by reducing drafts due to the movement of excessively cold air.
7) Demand Limiting or Load Shedding: This uses smart meters to monitor high-
demand equipment and relaxes setpoints during peak hours to avoid high utility
charges. This technique can also be used to shut off non-critical equipment and
lighting loads during peak hours.
8) Chiller Optimization: This raises chilled water temperature when cooling
requirements for the building are reduced.
9) Cooling Tower Optimization: This calculates the optimal water supply setpoint
using outside air wet-bulb temperature and the cooling tower approach temperature.
The reduced water temperature improves the chiller’s partial load efficiency.
10) Hot Water Reset: This saves energy by reducing heat loss in the supply pipes and
makes office space more comfortable by reducing localized heating caused by
excessively hot pipes.
Below is a sample list of integrated control that links the basic and advanced control strategies
[23]:
1) Variable Frequency Drives (VFDs): These optimize the power consumed by
HVAC fans by speeding up or slowing down the fan based on climate demands of the
space being controlled. This technology can also be applied as part of the load shedding
strategy
2) Card Access Activating HVAC and Lighting: Card readers used to enter the
building are programmed to turn on the lights and climate control for the specific area
where cardholders works. Together with motion or infrared signature sensors, lights
can be turned off if no activity is detected. This strategy can save energy in buildings
with multiple tenants and unpredictable occupant activity.
3) Reporting and Billing: Together with the indoor and outdoor temperature, the
operation of equipment (HVAC, smart meters, chillers, boilers, etc.) connected to the
system can be recorded. Trends in energy consumption can then be produced using
this data.
4) Smart Circuit Breakers: These breakers can be turned on and off as needed to
conserve energy.
5) Third Party Equipment: Heating and cooling equipment, fire detection systems,
alarm systems, smoke and carbon monoxide detection systems and elevators can be
integrated into a single building automation control system.

20
6) Central Monitoring and Control: The whole building can be monitored and
controlled from a single console, on-site or remotely. System can be programmed to
send alerts via email or text messages when a failure occurs.
Through the use of a building automated control system, owners of tenant-occupied buildings can
increase tenant occupancy and retention rates. Tenants will help save energy when they are
rewarded by lower rent if they reduce consumption.
Installing a BACS is only one part of the complete building energy management approach to
maximize savings and minimize costs. Another part of the complete building envelope that must
be looked into is the building structure: windows, walls, foundation, basement slab, ceiling, roof
and insulation.
Space heating and cooling and hot water final energy consumption is estimated by IEA [15] to
account for roughly half of the global energy consumption in buildings. In Ontario, natural gas is
the primary energy source for space and water heating while electricity is the primary energy
source for space cooling [18]. Energy-efficient and low/zero-carbon energy technology for heating
and cooling in buildings is a key part of the global energy initiative. By improving their efficiency,
the following technologies have been identified to provide the greatest long term potential for
reducing CO2 emissions [15]:
1) Active Solar Thermal System (AST): This collects the incoming radiation from
the sun by heating a liquid (occasionally air). This technology can be used for space
and water heating. An emerging technology is solar cooling. Coupled with thermally
driven chillers, this technology can supply the heating and cooling requirements of
service-sector buildings. This technology is attractive for this application since solar
radiation usually coincides with cooling loads.
2) Combined Heat and Power (CHP): This involves the simultaneous production of
electricity and heat (and potentially of cooling). Newer technologies that are not yet
fully commercialized are fuel cells and Stirling engines. The main CHP technologies
are:
a) Microturbines: Smaller versions of gas turbines and can use recuperators to
preheat combustion air. This technology is not widely deployed despite being
available since the 1990s.
b) Fuel cells: This uses an electrochemical process that releases energy stored in
natural gas or hydrogen fuel.
c) Reciprocating engines: This is the most common CHP type today. It uses Spark
or compression-ignited internal combustion engines.
d) Stirling engines: These are external combustion engines and are not widely
deployed.
e) Gas turbines: These use high-temperature, high-pressure hot gases to produce
electricity and heat.
f) Heat pumps: These are the predominant technology used for space cooling (in
simple air conditioners, reversible air conditioners or chillers) and are proven,
commercially available technologies. The commercial sector uses the same
basic technologies as in the residential sector but on a larger scale. The key
21
cooling technology for service-sector buildings is the packaged air conditioners
placed on the roof.
3) Thermal Storage: These are charged with heat or cold, and they hold the energy over
time. (e.g. sanitary hot water tanks) Three major reasons for using thermal energy
storage in the building sector are to:
a) Improve efficiency by avoiding partial load operation or operation at sub-
optimal times or by taking advantage of heat release from chillers, for example.
b) Shift demand to reduce peak load
c) Facilitate greater use of renewable energy by storing the energy produced and
release it to coincide with demand.
5.2.2. Industrial - Intervention
Barriers to the diffusion of energy-efficient technologies in the industrial sector were studied in
Palm [21] and Aflaki [3]. Swedish small- and medium-sized enterprises (SMEs) were studied in
Palm [21] and Pfizer Corporation’s Freiburg facility was used as a case study in Aflaki [3].
There are two schools of thoughts in relation to energy policies and programs [21]:
1) Technological advances and high energy prices will force industries to implement
energy efficiency measures. Therefore, government intervention is not needed.
2) Market barriers prevent the deployment of energy-efficient technologies. Therefore,
government help is needed.
In the study of Swedish small- and medium-sized enterprises (SMEs) conducted by [21], the
following barriers to the implementation of energy-efficient technologies were identified:
1) Risk of production disruption
2) Lack of time
3) Lack of capital
4) Difficulty and cost of obtaining information about the energy consumption of
purchased equipment
In the study by Aflaki [3], three critical drivers that propel industries into implementing energy-
efficiency projects were identified:
1) Magnitude of potential savings: The Highveld Steel & Vanadium Corporation
(South Africa) implemented a highly complex project to retrofit its five furnaces with
new electric arc furnaces to reduce its electricity consumption.
2) Company brand image as a proponent of sustainability and energy
conservation: More customers are willing to pay a premium for green products.
Examples include Philips promoting itself as “the leading company in health and well-
being” and Unilever (Netherlands) receiving several awards for its bio-reactor. The
bio-reactor is an innovative yet proven technology that saved energy and wastewater.
22
3) Capacity: Corporate organizational alignment and competence in implementing
energy efficiency projects is necessary to reduce the risk of production disruptions,
maintain adequate cash flow, and ensure that the projects are in line with the corporate
strategy.
6. Existing Conservation & Demand Management Programs
The following section explores the types of conservation programs currently offered in Ontario as
well as other jurisdictions. Select programs are profiled in this section, and Appendix A:
Conservation Programs in Ontario contains a more exhaustive list.
6.1. Select Ontario Programs
The following section will profile some representative programs from each of the major customer
types. The conservation landscape will continue to evolve over the next six years as Local
Distribution Companies (LDCs) gain more responsibility over conservation programs. See
Appendix A: Conservation Programs in Ontario for a description of programs being offered
currently in Ontario.
6.1.1. Toronto Hydro: Residential Appliance Retirement
An example of this type of program is Toronto Hydro’s “Fridge and Freezer Pickup” program
which ran from 2011 to 2014. The program was offered by the OPA and Toronto Hydro targeted
their residential customers using bill stuffers, advertisements in local media, direct mail, e-
newsletters and community events. The program achieved savings of 66,697,599 kWh from 2011
to 2014 and cost $1,596,910, which equates to $0.024/kWh saved. The program was terminated
last year because it had “reached market saturation. The change of the applicable appliance age
to 20 years and older has curbed the number of eligible appliances.”
Some bill stuffers appeal to customers focused on the cost associated with operating an old fridge,
although there is research suggesting that people are not always economically rational actors. For
example, if consumers attach nostalgic feelings to their beer fridge, a different appeal is needed.
6.1.2. Toronto Hydro: Residential and Small Commercial Demand Response
The objective of Toronto Hydro’s peaksaver PLUS program is to “control residential and small
commercial electrical end use loads, including air conditioners, pool pumps and electric water
23
heaters, to make available for dispatch during IESO demand response events.” The program
would reduce energy costs during expensive peak times and help defer investment in new
infrastructure, which is designed for peak demands.
The program also offers as an incentive a free in-home display. Beyond motivating free-stuff-
lovers to join the program, this device displays real-time electricity consumption and cost data
that is meant to help consumers “conserve and manage their electricity bill using time-of-use
rates.”
Between 2011 and 2014, peaksaver PLUS cost $12,492,174 and saved 410,345 kWh, or
$30.44/kWh saved. This should be less than the cost of electricity that it’s displacing.
There is considerable outreach effort dedicated towards publicizing the program and ensuring
ongoing enrolment. This outreach led to “continued strong peaksaver PLUS enrolments [in 2013]
and expanded the base of participants to 54,451.” “The program has been well received and take-
up rates continue to exceed expectations in the residential sector, while recognizing the number
of eligible participants is diminishing.”
6.1.3. Enbridge: Low Income Program
In 2012, Enbridge’s Home Weatherization Program was offered to tenants and homeowners
meeting the eligibility criteria of 135% of Statistics Canada’s Low Income Cut-off (LICO) measure
and/or a recipient of social benefits or social housing. The Low Income TAPS program was
combined with the Weatherization program to offer a full suite of thermal envelope improvement
and water conservation measures. The program was delivered by community-based organizations
with strong links to social service agencies. Those participating in the program were, and continue
to be, referred to the electricity conservation weatherization program. The Multi-Residential
program addresses comprehensive energy efficiency needs in social housing buildings by offering
direct installation of energy saving measures as well as financial support for custom retrofits such
as boilers, thermal envelope improvements, and controls.
The following presents the achieved results of the program:
2012 Single family savings: 24,710,000 cumulative cubic meters [CCM]
($0.2331/CCM)
Savings to customers = $4,942,000 (using $0.20/m3)
2012 Multi-family savings: 43,410,000 CCM ($0.0315/CCM)
Savings to customers = $8,682,000 (using $0.20/m3)
Total Cost for 2012: $7,126,628/CCM
In order to improve delivery to residential customers, “partnering with identified delivery agents
and social agencies to promote low-income initiatives to customers will continue to be a key
component in successfully reaching this market” (Enbridge, 2014). When commenting about the
24
future of their multi-family program, Enbridge (2014) wrote that “program fatigue has set in,
along with sector pressing issues such as health and crime prevention, making it more difficult to
get the attention of the social housing providers to participate in energy efficiency programs.”
6.1.4. OPA/IESO Commercial Retrofit Program
The OPA Commercial Retrofit Program (previously called the Equipment Replacement Incentive
Initiative) encourages participants to “install energy efficient equipment and receive up to 50% of
your project costs.” The following represent the savings and costs associated with the project:
Savings from 2011-2014: 591,225,618 kWh
Spending from 2011-2014: $22,260,388
Net peak demand savings = 15,424 kW for 2013
Net energy savings = 90,527,082 kWh for 2013
$0.038/kWh saved
This program was publicized using a variety of channels, including “technical energy consultants
[who] were hired to target all market sectors and assisting customers to identify energy savings
opportunities and submit applications. THESL also contracted with the City of Toronto Better
Buildings Partnership as its channel partner in the municipal, academic, social, and health care
sectors to leverage long-standing relationships in those markets” (Toronto Hydro-Electric System
Limited, 2014). Bill stuffers to residential customers also publicized this program (see Appendix).
“As in previous years, the Business Program for commercial and institutional customers
accounted for most of the overall energy savings from electricity conservation programs.
Participation in the Retrofit initiative, which provides incentives for energy efficiency
improvements (particularly lighting upgrades) in existing commercial and institutional buildings,
increased by more than 40 per cent. The addition of light emitting diode [LED] technologies and
higher incentive levels helped the Direct Install Lighting initiative continue to reach new
customers, despite previous concerns from LDCs that the market for this initiative was close to
being saturated. The New Construction initiative, targeting higher-efficiency new commercial
buildings, saw little uptake among builders, which was also the case for its program counterpart
in the residential sector” (Environmental Commissioner of Ontario, 2014).
6.1.5. Outreach Methods
The following is taken from Toronto Hydro-Electric System Limited (2014) and shows the
methods through which campaigns are publicized. Beginning in January 2013, THESL reached
out to its consumer sector to promote the OPA’s saveONenergy programs as follows:
• Advertisements using local print media, digital and radio
• Direct mail (spring and fall) to targeted customers promoting key programs
25
• Bill inserts
• Direct to customer E-newsletters
• Events – local community events and festivals
• Company website pages and social media – Facebook, YouTube and Twitter
• Outbound calling campaign to re-enroll customers to peaksaver PLUS
• Public relation events and new releases
The following is from the 2014 annual report for Toronto Hydro (THESL) and shows the efficacy
of various outreach methods:
“THESL heavily promoted the peaksaver PLUS, Coupon Event, HVAC and Appliance Retirement
during 2013:
• THESL launched a spring and fall media campaign which incorporated radio ads,
community newspapers, ethnic advertising, unaddressed direct mail, digital/online and
out-of-home (total 8 million impressions).
• Community outreach is important in educating customers. In 2013, events included 20
festivals and shopping centre visits which generated more than 8,858 interactions and 225
program enrolments.
• A unique ethnic campaign was executed to the Asian and South Asian market that included
radio, theatre advertising, direct mail, and ethnic advertising as well as a translated micro
site for registrations.
• THESL ran in-store events in conjunction with the OPA bi-annual coupon event in the
spring and fall of 2013. This included 16 stores (Home Depot and Lowes). The stores
generated 7,646 interactions and 1,187 peaksaver PLUS enrolments.
• THESL piloted a “trike” campaign where representatives cycled to 11 events to promote
peaksaver PLUS and handed out freezies to the public. This campaign generated 32
peaksaverPLUS enrolments.
• THESL utilized “Air Miles” on applicable collateral during its time in market.
• Outbound calling was a major contributor to exceeding peaksaver PLUS targets with
approximately 45,000 of the original 65,000 participants extending their participation.”
These outreach strategies largely rely on conveying information to customers in the hopes of
creating behaviour change. See Section 5.1.1 for a detailed discussion on this. It is also worth
noting that behaviour change practitioner Doug McKenzie-Mohr commonly asserts that
information campaigns ought to include other components (e.g., social benchmarking) in order
to maximize their efficacy.
6.2. Programs In Other Jurisdictions
6.2.1. Canadian Programs
A sampling of relevant programs from across Canada is discussed in this section.

26
An innovative program from Manitoba Hydro called On-Bill Financing “offers a financing
program that makes energy efficiency accessible to homeowners. Using on-bill financing, the
Power Smart PAYS Financing Program provides Manitoba residential customers with a
convenient option for completing energy-efficient upgrades to their homes while keeping the
upfront costs and future monthly finance payments as small as possible” (Government of Ontario,
2013). This program is expected to roll out in Ontario in 2015.
Quebec shares many of the same programs as Ontario. Two that are different include:
1) Rebate on the Purchase of Certified ENERGY STAR Windows: The program pays five
dollars per square foot of ENERGY STAR qualified energy-efficient sliding doors and
windows installed in the home, up to a maximum of $500. The program targets Gaz Métro
customers who own or rent a single-family home, a duplex, triplex or condo, whose
principal heating is natural gas.
2) Energy Wise Home Diagnostic: This is essentially a home energy audit that results in a
report.
British Columbia has fewer programs than Ontario and Quebec. BC has the energy manager
program from Ontario, as well as various fuel switching, auditing and other programs which are
similar to Ontario. Two unique programs are:
1) Power Smart for Low-Income Households - Energy Conservation Assistance Program:
The purpose of the Energy Conservation Assistance Program is to help low-income
customers to make their homes more energy efficient and lower their energy bills. Because
every home is different, an evaluator will review how a home uses energy to determine
what products the home is eligible to receive. Eligibility for product installation is based
on the existing efficiency of the home, as well as a number of other factors.
2) Residential Lighting Program: This is a good example of framing a program in terms of
cost to the consumer, instead of in terms of resources. The video below is effective in
addressing performance of the bulbs themselves, but the appeal to save a few dollars per
year will not resonate. Some larger appeal (e.g., your grandkids will thank you) perhaps
needs to accompany the message.
http://www.bchydro.com/powersmart/residential/rebates_savings/lighting_rebates.ht
ml
Alberta offers six programs. Three of these are in Banff and are aimed at reducing energy and
water use in buildings, but the other programs are innovation funds.
6.2.2. American Programs
In Illinois, Commonwealth Edison’s programs appear very similar to Ontario’s, and they
include:
Fridge & Freezer Recycling
Lighting Discounts
27
Home Energy Assessment
Home Energy Rebates
Multi-Family Efficiency
Energy Efficiency Loan
Central AC Cycling
Peak Time Savings
Low Cost/No Cost Tips
They also offer real time feedback devices.
Customers can sign up for email alerts.
ConEd also hosts community events like Toronto Hydro.
Sacramento Municipal Utility District (SMUD) in California offers rebates on home
improvements (e.g. HVAC, insulation, lighting, etc.). They also have contractor-performed audits
and upgrades, similar to EcoEnergy. Multifamily rebate programs are available.
TXU Energy in Texas offers the following programs offered to their residential customers:
iThermostat, MyEnergy Dashboard, Personal Energy Advisor, Energy Management
Alerts, Control Your Bill
Seasonal Saving Tips, Online Energy Store, Energy Saving DIY Projects, Energy Saving
DIY Videos, Business Energy Savings Tips
They do not do social benchmarking, instead they compare individuals to their past
performance or self-imposed targets.
Their performance dashboard displays monthly usage, not real-time feedback.
7. Potential Areas for Future Research
The following areas hold promise for future research in conservation:
Demand response – Targeting conservation efforts at particular times and areas would
maximize the benefits for both infrastructure deferral and displacement of high-cost
electricity. Capacity markets offer a promising channel of capturing that value by securing
cost-competitive conservation at peak times. Bottleneck areas in transmission and
distribution systems could also be targeted for conservation.
Gas and water – Much of the academic research has been focussed on electricity
conservation; there is much less on gas and water conservation. However, the potential
for greenhouse gas reductions is much larger for gas than for electricity in Ontario. In his
annual report, the Environmental Commissioner of Ontario was “persuaded by arguments
that conservation was never given a fair chance as an alternative” when justifying the need
28
for a new gas pipeline [8]. Further, water conservation programs could have similar
messages and concepts as electricity and gas ones; there is potential shared value in
delivering them together. While gas and water are ripe for more research, prices for both
are relatively low and consumption (or volume) based in Ontario, so there is less room for
innovation in conservation.
Governance – The roles and responsibilities of all stakeholders could be better aligned
to increase conservation levels and achieve goals more efficiently and effectively. This
could involve examining and aligning incentives and disincentives for each major
stakeholder.
Goals – Multiple conservation programs could be designed around the goals they aim to
achieve – be they infrastructure deferral, consumer bill management, or reduction of
greenhouse gas emissions.
Commercial & industrial consumers – This paper primarily explored conservation
programs targeted at residential consumers; programs directed at commercial and
industrial consumers could be explored in future papers. These could be areas of high
promise for value and scale.
Rate structure – The Environmental Commissioner of Ontario “recommends that the
Ontario Energy Board significantly widen the peak to off-peak price differential.” In 2010
the Ontario ratio was 1.9; “The average price ratio in other jurisdictions was much steeper:
approximately 4 to 1 (with a mean ratio of 3.8 to 1)” [8]
Monitoring & evaluation – There could be an opportunity for standardized, third party
evaluation of the programs that the LDCs roll out in Ontario over the next five years. There
is a lot of pressure for LDCs to design and report on programs that work, and external
evaluation could validate internal evaluations.
Consumer segmentation – Knowing the targeted group very well was a recurring
theme in the academic literature surveyed in this paper. Research into segmenting
consumer groups by common characteristics and tailoring conservation programs for each
group could be explored further.
Interviews with industry experts – This paper surveyed both academic literature and
current conservation programs in Ontario. Future papers could include feedback from
industry experts and professionals through a series of interviews.
29
8. References
[1] Abrahamse, Wokje, Linda Steg, Charles Vlek and Talib Rothngatter. “A review of
intervention studies aimed at household energy conservation.” Journal of
Environmental Psychology 25 (2005): 273-291. ELSEVIER. Web. 30 Jan 2015.
[2] Adepetu, Adedamola, Elnaz Rezaei, Daniel Lizotte, and Srinivasan Keshav. “Critiquing
Time-of-Use Pricing in Ontario.” IEEE SmartGridComm 2013 Symposium – Demand
Side Management, Demand Response, Dynamic Pricing. Web. 30 Jan 2015.
[3] Aflaki, Sam, Paul R. Kleindorfer, and Victor Saenz de Miera Polvorinos. “Finding and
implementing energy efficiency projects in industrial facilities.” Production &
Operations Management 22(3) (2013): 503-517. POMS. Web. 31 Jan 2015.
[4] Dietz, Thomas, Gerald T. Gardner, Jonathan Gilligan, Paul C. Stern, and Michael P.
Vandenbergh. “Household actions can provide a behavioral wedge to rapidly reduce US
carbon emissions.” Proceedings of the National Academy of Sciences 106(44) (2009):
18452-18456.
[5] Dillman, Don A., Eugene A. Rosa, and Joye J. Dilman. “Lifestyle and Home Energy
Conservation in the United States: the poor accept lifestyle cutbacks while the wealthy
invest in conservation.” Journal of Economic Psychology 3 (1983): 290-315. Web. 5
Feb 2015.
[6] Enbridge. “2012: Demand side management revised annual report.” Web. 11 Mar 2015.
<http://www.ontarioenergyboard.ca/oeb/_Documents/RRR/RRR_EGDI_DSM_Repor
ts_2-1-12_2011.pdf>
[7] Energy Information Administration. “2009 Residential Energy Consumption Survey.”
2009. Web. 27 Apr 2015.
<http://www.eia.gov/consumption/residential/data/2009/index.cfm?view=consumptio
n>.
[8] Environmental Commissioner of Ontario. “Planning to Conserve; 2014: Annual Energy
Conservation Progress Report.” Web. 11 Mar 2015.
<http://www.eco.on.ca/index.php/en_US/pubs/energy-conservation-reports>
[9] Gardner, Gerald T. and Paul C. Stern. Environmental problems and human behavior.
Second Edition. Boston: Pearson Custom Publishing, 2002.
[10] Government of Ontario. “Achieving Balance: Ontario’s Long-Term Energy Plan.” (2013)
Web. 11 Mar 2015. <http://www.energy.gov.on.ca/en/ltep/>
[11] Han, Q., Nieuwenhijsen, I, de Vries, B., Blokhuis, E.G.J. and Schaefer, W.F. 2011.
"Urging Residents To Save Energy." In: Second International Choice Modeling
Conference, Leeds, UK, July 2011.
30
[12] Holt, Lynne and Carol Jacobson Larson. “Consumers’ attitudes toward energy
conservation and energy efficiency: the role of electric rates.” Florida Focus. 4.4 (2008).
Web. 2 Feb 2015.
[13] ICF Marbek. “Achievable Potential: Estimated Range of Electricity Savings from Energy
Efficiency and Energy Management.” (2014). Web. 11 Mar 2015.
<http://www.powerauthority.on.ca/news/conservation-achievable-potential-study>
[14] International Energy Agency. “Energy Technology Initiatives, 2013: Implementation
through Multilateral Co-operation.” Web. 27 Apr 2015.
[15] International Energy Agency. “Technology Roadmap, Energy Efficient Buildings:
Heating & Cooling Equipment.” (2011) Web. 27 Apr 2015.
[16] Jaffe, Adam B. and Robert N. Stavins. “The Energy Paradox and the Diffusion of
Conservation Technology.” Resource and Energy Economics 16 (1994): 91-122.
ELSEVIER. Web. 5 Feb 2015.
[17] McKenzie-Mohr, Doug. Fostering Sustainable Behavior: An Introduction to
Community-Based Social Marketing. Gabriola Island, BC: New Society Publishers, 2011.
[18] Ministry of the Environment and Climate Change. “Ontario’s Climate Change
Discussion Paper 2015.” Web. 12 Feb 2015.
[19] Natural Resources Canada. “Commercial and Institutional Consumption of Energy
Survey: Summary Report, June 2007.” Web. 27 Apr 2015.
[20] Pallack, Michael S., and William Cummings. “Commitment & Voluntary Energy
Conservation.” University of Iowa, 1973. Web. 17 Feb 2015.
[21] Palm, Jenny and Patrik Thollander. “An interdisciplinary perspective on industrial
energy efficiency.” Applied Energy 87 (2010): 3255-3261. Web. 20 Mar 2015.
[22] Revell, Kristy. “Estimating the environmental impact of home energy visits and extent of
behavior change.” Energy Policy 73 (2014): 461-470. ELSEVIER. Web. 5 Feb 2015.
[23] Schneider Electric. “Leading techniques for energy savings in commercial office
buildings.” Web. 30 Jan 2015. <www.tac.com>.
[24] Statistics Canada. “Energy Use by Sector.” Web. 27 Apr 2015.
<http://www.statcan.gc.ca/tables-tableaux/sum-som/l01/cst01/envi41a-eng.htm>.
[25] Toronto Hydro-Electric System Limited. “Conservation and Demand Management:
2013 Annual Report.” Web. 11 Mar 2015.
<http://www.ontarioenergyboard.ca/OEB/Industry/Regulatory+Proceedings/Policy+In
itiatives+and+Consultations/Conservation+and+Demand+Management+%28CDM%29
/CDM+Code/CDM+Strategies+Programs+and+Reports>
[26] Yue, Ting, Ruyin Long, and Hong Chen. “Factors influencing energy-saving behavior of
urban households in Jiangsu Province.” Energy Policy 62 (2013): 665-675. ELSEVIER.
Web. 5 Feb 2015.
31
Appendix A: Conservation Programs in Ontario
Program Name Offered By Target Group Description
Residential - Single
Family Homes
Appliance Retirement
(Fridge & Freezer
Pickup)
IESO Homeowners Now Closed. Since 2006, more than 365,000 fridges and freezers have been
removed. The electricity saved could power 19,000 home for an entire year.
Heating and Cooling
Incentive
IESO Homeowners Participants can receive up to $650 in incentives.
peaksaver PLUS IESO Homeowners Participants’ appliances can be switched off during peak demand times.
Participants also receive an in-home energy display.
saveONenergy COUPONS IESO Homeowners Coupons for various household items (e.g., LED bulbs) were distributed.
Home Weatherization
Program
Enbridge via
GLOBE
Low-income
single family
homes in
Enbridge territory
This program is being offered at no cost to housing providers and includes
pre and post audits and weatherization retrofits.
Home Winterproofing
Program
Enbridge Low Income,
homeowners
The Home Winterproofing Program is free to all qualifying homes. Enbridge
will pay for the cost of the energy efficiency improvements such as insulation
and draft proofing measures.
Free Energy Saving Kit Union Gas Union Gas residential customers with a natural gas water heater are eligible
for an energy savings kit.
Home Reno Rebate Union Gas Detached or semi-
detached home
Participants receive up to $2,500 towards home energy efficiency
improvements.
Programmable
Thermostat Rebate
Union Gas Union gas
customers
Participants receive a $25 rebate coupon for the purchase of a programmable
thermostat.
Home Energy Loan
Program (HELP)
City of
Toronto
Homeowners Low interest loans are available to qualifying homeowners who are interested
in improving the energy and water efficiency of their home. Through HELP,
the City will provide the funding required to complete the improvements and
the homeowner will repay the City over time through installments on their
property tax bill.
32
Program Name Offered By Target Group Description
Rush Hour Rewards Cambridge
and North
Dumfries
Hydro
Homeowners with
A/C
Cambridge and North Dumfries Hydro offers $200 when a customer
purchase a Nest Thermostat and sign up for the Nest Rush Hour Rewards
program. Rush Hour Rewards will automatically make temperature tweaks to
use less energy during peak energy hours.
Residential - Multi-Unit
Residential Buildings
Showerhead Rebate
Program
Enbridge Commercial
multi-residential
Enbridge Gas
customers
The customer incentive amounts to $6/showerhead. A rebate is given for each
standard showerhead of 2.5 gallons per minute (gpm) or greater that is
replaced with an energy efficient showerhead of 1.5 gpm or less.
Multi-residential
Incentive Program.
Enbridge via
GLOBE
Multi-residential
owners
Incentive calculated based on projected first year natural gas savings at a rate
of $0.40/m3 saved, up to 50% of the cost of the retrofit to a limit of $100,000
TowerWise Toronto
Atmospheric
fund
Toronto’s
residential high-
rise owners
TowerWise helps buildings reduce their greenhouse gas emissions and energy
use by 30%. Through a combination of innovative financial products,
technical research, and policy development, TowerWise has accelerated
adoption of energy efficiency technologies in Toronto.
GridSaver Toronto
Hydro
Large buildings There is a minimum requirement of 20 kilowatts of controllable cooling load
to participate. Participants receive a one-time incentive of $40/kW of
controllable cooling load. Incentives start at $800.
Commercial/Institutional
/Industrial
Commercial Retrofit
Program
Enbridge Commercial/Insti
tutional
This program helps to develop a comprehensive energy management
approach that identifies high-return energy efficiency investments,
maximizes returns through incentives and helps customers' operations run
better.
saveONenergy AUDIT
FUNDING Program
IESO/Hydro
One
Industrial
Commercial/Insti
tutional
Agriculture
The energy audit identifies how a business can save on operating costs while
maintaining utmost performance in the future. Energy audits assess the
potential for electricity savings to be achieved through equipment
replacement, operational practices, or participation in Demand Response
initiatives and other building systems and envelopes projects.
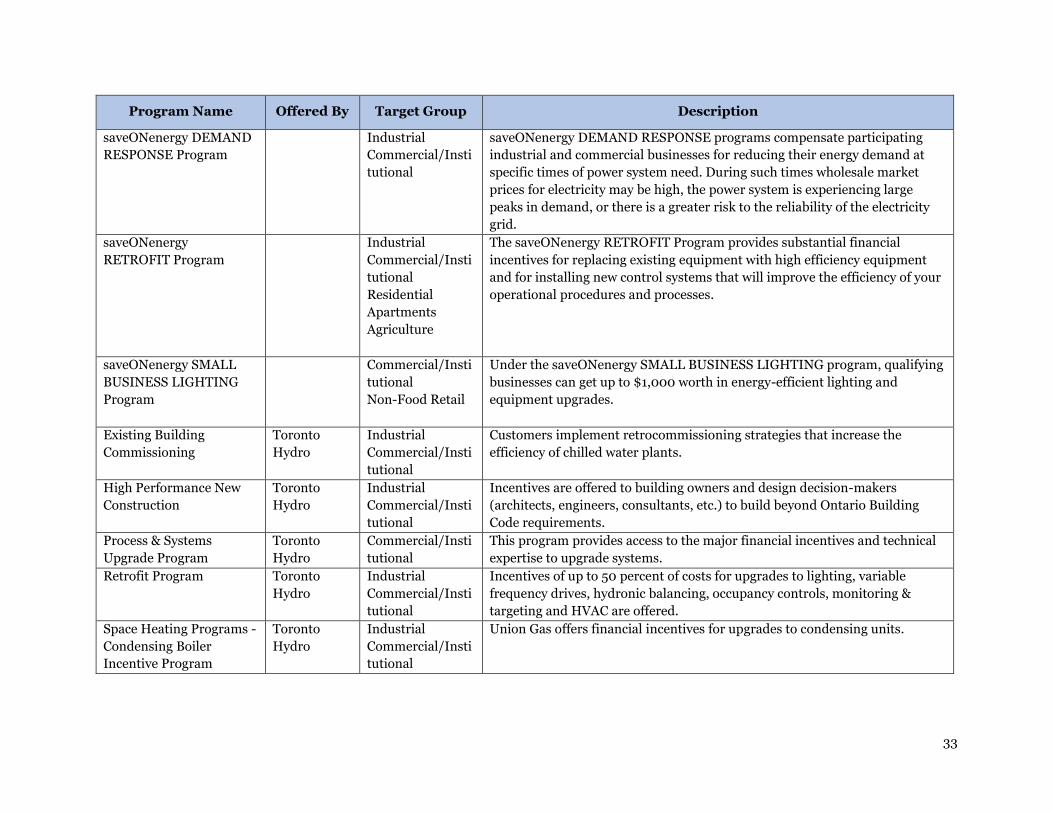
33
Program Name Offered By Target Group Description
saveONenergy DEMAND
RESPONSE Program
Industrial
Commercial/Insti
tutional
saveONenergy DEMAND RESPONSE programs compensate participating
industrial and commercial businesses for reducing their energy demand at
specific times of power system need. During such times wholesale market
prices for electricity may be high, the power system is experiencing large
peaks in demand, or there is a greater risk to the reliability of the electricity
grid.
saveONenergy
RETROFIT Program
Industrial
Commercial/Insti
tutional
Residential
Apartments
Agriculture
The saveONenergy RETROFIT Program provides substantial financial
incentives for replacing existing equipment with high efficiency equipment
and for installing new control systems that will improve the efficiency of your
operational procedures and processes.
saveONenergy SMALL
BUSINESS LIGHTING
Program
Commercial/Insti
tutional
Non-Food Retail
Under the saveONenergy SMALL BUSINESS LIGHTING program, qualifying
businesses can get up to $1,000 worth in energy-efficient lighting and
equipment upgrades.
Existing Building
Commissioning
Toronto
Hydro
Industrial
Commercial/Insti
tutional
Customers implement retrocommissioning strategies that increase the
efficiency of chilled water plants.
High Performance New
Construction
Toronto
Hydro
Industrial
Commercial/Insti
tutional
Incentives are offered to building owners and design decision-makers
(architects, engineers, consultants, etc.) to build beyond Ontario Building
Code requirements.
Process & Systems
Upgrade Program
Toronto
Hydro
Commercial/Insti
tutional
This program provides access to the major financial incentives and technical
expertise to upgrade systems.
Retrofit Program Toronto
Hydro
Industrial
Commercial/Insti
tutional
Incentives of up to 50 percent of costs for upgrades to lighting, variable
frequency drives, hydronic balancing, occupancy controls, monitoring &
targeting and HVAC are offered.
Space Heating Programs -
Condensing Boiler
Incentive Program
Toronto
Hydro
Industrial
Commercial/Insti
tutional
Union Gas offers financial incentives for upgrades to condensing units.
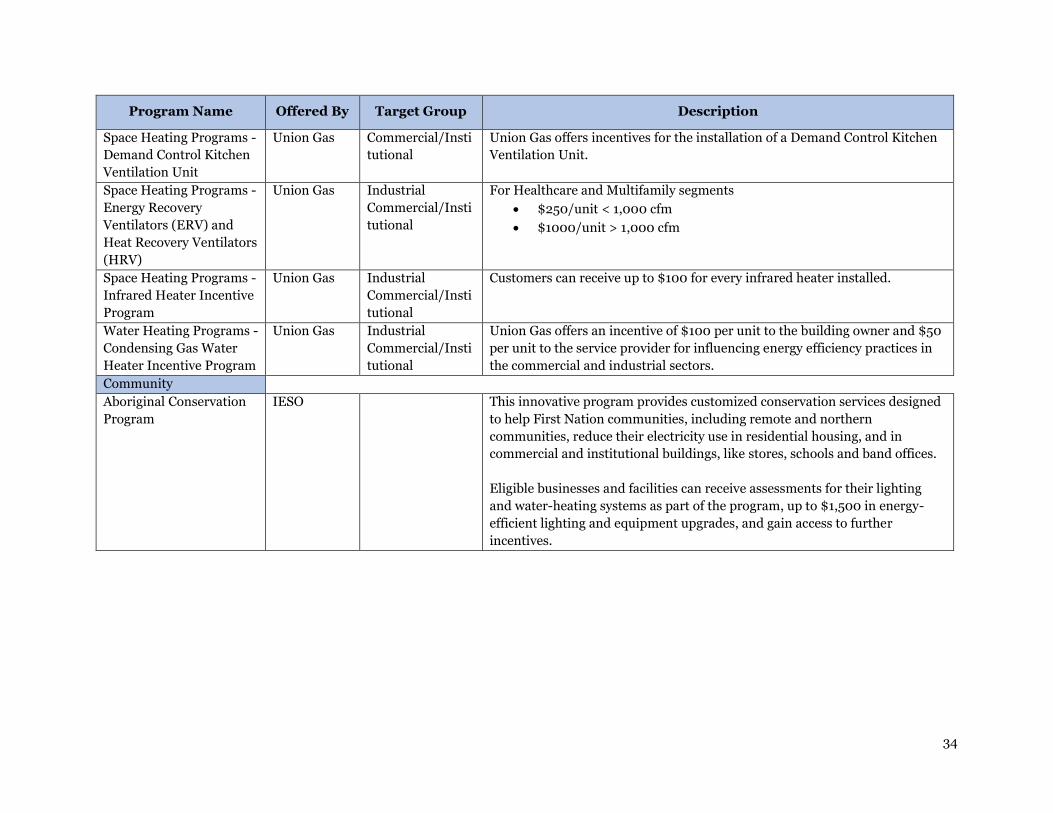
34
Program Name Offered By Target Group Description
Space Heating Programs -
Demand Control Kitchen
Ventilation Unit
Union Gas Commercial/Insti
tutional
Union Gas offers incentives for the installation of a Demand Control Kitchen
Ventilation Unit.
Space Heating Programs -
Energy Recovery
Ventilators (ERV) and
Heat Recovery Ventilators
(HRV)
Union Gas Industrial
Commercial/Insti
tutional
For Healthcare and Multifamily segments
$250/unit < 1,000 cfm
$1000/unit > 1,000 cfm
Space Heating Programs -
Infrared Heater Incentive
Program
Union Gas Industrial
Commercial/Insti
tutional
Customers can receive up to $100 for every infrared heater installed.
Water Heating Programs -
Condensing Gas Water
Heater Incentive Program
Union Gas Industrial
Commercial/Insti
tutional
Union Gas offers an incentive of $100 per unit to the building owner and $50
per unit to the service provider for influencing energy efficiency practices in
the commercial and industrial sectors.
Community
Aboriginal Conservation
Program
IESO This innovative program provides customized conservation services designed
to help First Nation communities, including remote and northern
communities, reduce their electricity use in residential housing, and in
commercial and institutional buildings, like stores, schools and band offices.
Eligible businesses and facilities can receive assessments for their lighting
and water-heating systems as part of the program, up to $1,500 in energy-
efficient lighting and equipment upgrades, and gain access to further
incentives.