connectional characteristics of areas in walker's map of primate prefrontal cortex
TRANSCRIPT
Neurocomputing 38}40 (2001) 741}746
Connectional characteristics of areas in Walker's map ofprimate prefrontal cortex
Rolf KoK tter����*, Claus C. Hilgetag�, Klaas E. Stephan��Computational Systems Neuroscience Group, C.&O. Vogt Brain Research Institute Heinrich Heine University,
Moorenstra}e 5, D-40225 Du( sseldorf, Germany�Department of Anatomy II, Heinrich Heine University, Moorenstra}e 5 , D-40225 Du( sseldorf, Germany
�Department of Anatomy & Neurobiology, Boston University School of Medicine, 700 Albany Street,Boston, MA 02118, USA
Abstract
Systematic collations and computational analyses of connectivity data from anatomical tracttracing can yield reliable and valuable insights into the principles governing cortical networkorganization. Based on an innovative databasing approach (http://www.cocomac.org) wepresent a preliminary analysis of the connectional organization of primate prefrontal cortex.Multivariate statistics of the connections between Walker's areas reveal distinct orbito-medialand lateral networks linked by anterior cingulate and dorsal prefrontal areas. Novel indices ofareal network participation show that ventrolateral prefrontal cortex is a unique relay ofinformation from lateral areas a!ecting the entire region. � 2001 Elsevier Science B.V. Allrights reserved.
Keywords: Cortex; Connectivity; Database; Multivariate statistics; Optimization method
1. Introduction
The organization of primate prefrontal cortex has remained controversial despitemany structural and functional investigations. More reliable insights could arise fromanalyses of intra-prefrontal connectivity similar to those obtained previously for thetwo processing streams in the visual cortex or the global organization of the cortex in
*Corresponding author. Heinrich Heine UniversitaK t, C. & O. Vogt-Institut fuK r Hirnforschung,Moorenstra{e 5, 40225 DuK sseldorf, Germany. Tel.: #49-211-81-12095; fax: #49-211-81-12336.E-mail address: [email protected] (R. KoK tter).
0925-2312/01/$ - see front matter � 2001 Elsevier Science B.V. All rights reservedPII: S 0 9 2 5 - 2 3 1 2 ( 0 1 ) 0 0 3 9 7 - 6

Table 1Connectivity matrix listing relative strengths of intra-prefrontal projections from source areas to targetareas. 1, 2, 3, X: existing projection of weak, moderate, strong, or unknown strength; 0: projection found tobe absent; missing entries: no information available on existence of projection.
Source Target areasareas
W10 W11 W12 W13 W14 W24 W25 W45 W46 W8A W8B W9
W10 2 2 1 2 X 2 0 0 X 0 3W11 1 1 1 X X X 0 0 0 3W12 2 3 1 3 1 2 0 X X X 2W13 1 X 2 2 1 X 0 0 0 X XW14 1 X X 1 X 1 0 0 0 0 XW24 0 X 1 0 X 3 1 1 1 3 3W25 2 X 2 2 3 3 0 X 0 X 2W45 1 3 2 1 1 1 0 X 2 X XW46 3 X X 0 0 1 1 2 X 3 XW8A X 0 2 0 0 1 0 2 X XW8B 3 X X XW9 X X X 1 0 3 X X X X X
primates [8,9]. Prerequisite for such a project is the comprehensive and systematiccollation of connectivity information from the wealth of published anatomical tracingstudies, and the reliable conversion of these diverse data into a comparable format,a common brain map of the prefrontal cortex. Over the last "ve years, we havedesigned and implemented an advanced framework for connectivity databases [5]and created algorithmic tools that successfully tackle the mapping problem betweennon-spatially de"ned cortical parcellation schemes [6]. In addition, we have de-veloped and applied multivariate analytical tools that explore the global organiza-tional principles inherent in these large connectivity data sets [1].
2. Methods
We performed a systematic collation of published tracing studies in the prefrontalcortex of macaque monkeys within the framework of the connectivity databaseCoCoMac (see http://www.cocomac.org). Data from 148 tracer injections were map-ped into Walker's parcellation scheme (W, [7]) using objective relational transforma-tion (ORT, [6]). The resulting connectivity matrix contained nearly complete ('90%)information on the existence and density of connectivity between Walker's corticalareas (Table 1).This information was analyzed using several complementary statistical methods.(1) Hierarchical clustering compares the inter-areal projection vectors and amalga-
mates the corresponding areas successively according to a non-metric distancemeasure (percent, complete linkage; Systat 9, SPSS Inc.). This procedure was executed
742 R. Ko( tter et al. / Neurocomputing 38}40 (2001) 741}746
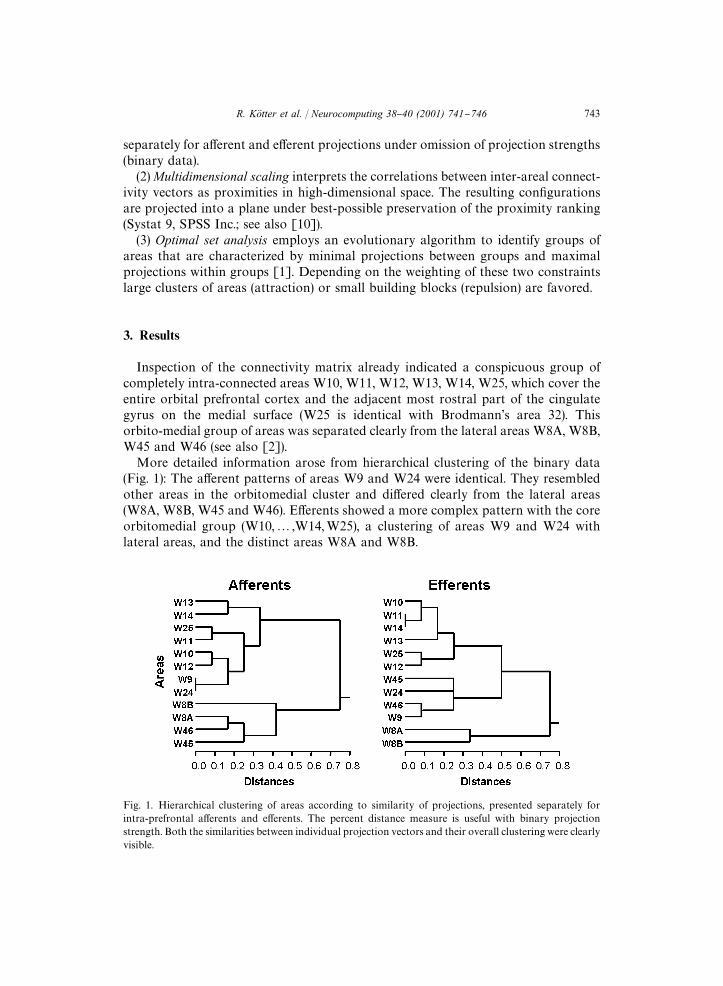
Fig. 1. Hierarchical clustering of areas according to similarity of projections, presented separately forintra-prefrontal a!erents and e!erents. The percent distance measure is useful with binary projectionstrength. Both the similarities between individual projection vectors and their overall clustering were clearlyvisible.
separately for a!erent and e!erent projections under omission of projection strengths(binary data).(2)Multidimensional scaling interprets the correlations between inter-areal connect-
ivity vectors as proximities in high-dimensional space. The resulting con"gurationsare projected into a plane under best-possible preservation of the proximity ranking(Systat 9, SPSS Inc.; see also [10]).(3) Optimal set analysis employs an evolutionary algorithm to identify groups of
areas that are characterized by minimal projections between groups and maximalprojections within groups [1]. Depending on the weighting of these two constraintslarge clusters of areas (attraction) or small building blocks (repulsion) are favored.
3. Results
Inspection of the connectivity matrix already indicated a conspicuous group ofcompletely intra-connected areas W10, W11, W12, W13, W14, W25, which cover theentire orbital prefrontal cortex and the adjacent most rostral part of the cingulategyrus on the medial surface (W25 is identical with Brodmann's area 32). Thisorbito-medial group of areas was separated clearly from the lateral areas W8A, W8B,W45 and W46 (see also [2]).More detailed information arose from hierarchical clustering of the binary data
(Fig. 1): The a!erent patterns of areas W9 and W24 were identical. They resembledother areas in the orbitomedial cluster and di!ered clearly from the lateral areas(W8A, W8B, W45 and W46). E!erents showed a more complex pattern with the coreorbitomedial group (W10,2,W14,W25), a clustering of areas W9 and W24 withlateral areas, and the distinct areas W8A and W8B.
R. Ko( tter et al. / Neurocomputing 38}40 (2001) 741}746 743
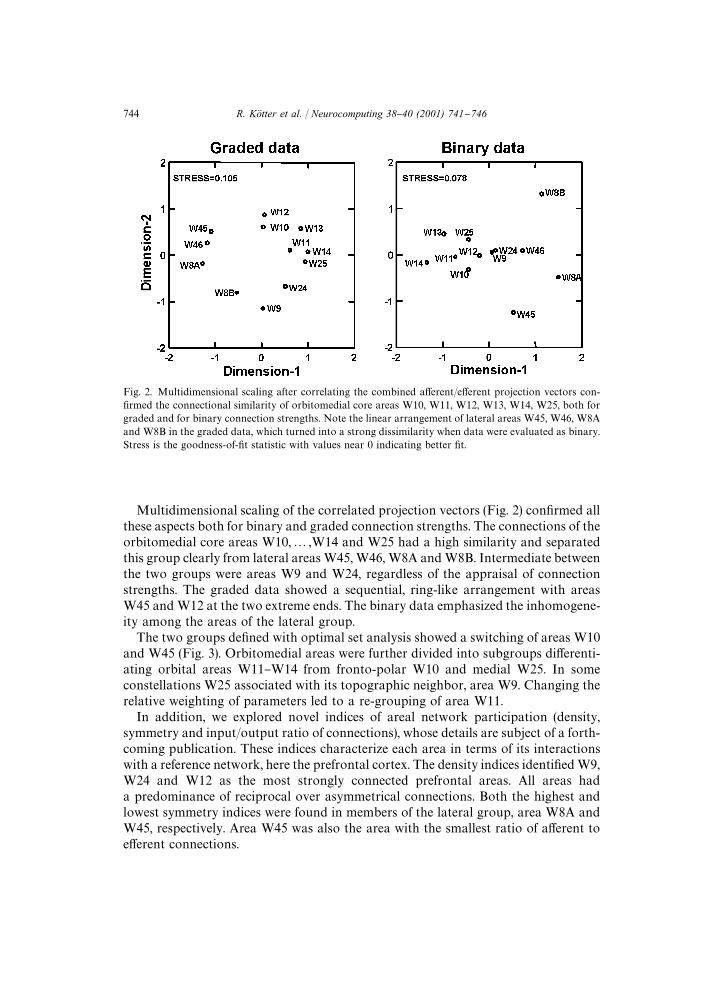
Fig. 2. Multidimensional scaling after correlating the combined a!erent/e!erent projection vectors con-"rmed the connectional similarity of orbitomedial core areas W10, W11, W12, W13, W14, W25, both forgraded and for binary connection strengths. Note the linear arrangement of lateral areas W45, W46, W8Aand W8B in the graded data, which turned into a strong dissimilarity when data were evaluated as binary.Stress is the goodness-of-"t statistic with values near 0 indicating better "t.
Multidimensional scaling of the correlated projection vectors (Fig. 2) con"rmed allthese aspects both for binary and graded connection strengths. The connections of theorbitomedial core areas W10,2,W14 and W25 had a high similarity and separatedthis group clearly from lateral areasW45,W46, W8A andW8B. Intermediate betweenthe two groups were areas W9 and W24, regardless of the appraisal of connectionstrengths. The graded data showed a sequential, ring-like arrangement with areasW45 andW12 at the two extreme ends. The binary data emphasized the inhomogene-ity among the areas of the lateral group.The two groups de"ned with optimal set analysis showed a switching of areas W10
and W45 (Fig. 3). Orbitomedial areas were further divided into subgroups di!erenti-ating orbital areas W11}W14 from fronto-polar W10 and medial W25. In someconstellations W25 associated with its topographic neighbor, area W9. Changing therelative weighting of parameters led to a re-grouping of area W11.In addition, we explored novel indices of areal network participation (density,
symmetry and input/output ratio of connections), whose details are subject of a forth-coming publication. These indices characterize each area in terms of its interactionswith a reference network, here the prefrontal cortex. The density indices identi"edW9,W24 and W12 as the most strongly connected prefrontal areas. All areas hada predominance of reciprocal over asymmetrical connections. Both the highest andlowest symmetry indices were found in members of the lateral group, area W8A andW45, respectively. Area W45 was also the area with the smallest ratio of a!erent toe!erent connections.
744 R. Ko( tter et al. / Neurocomputing 38}40 (2001) 741}746
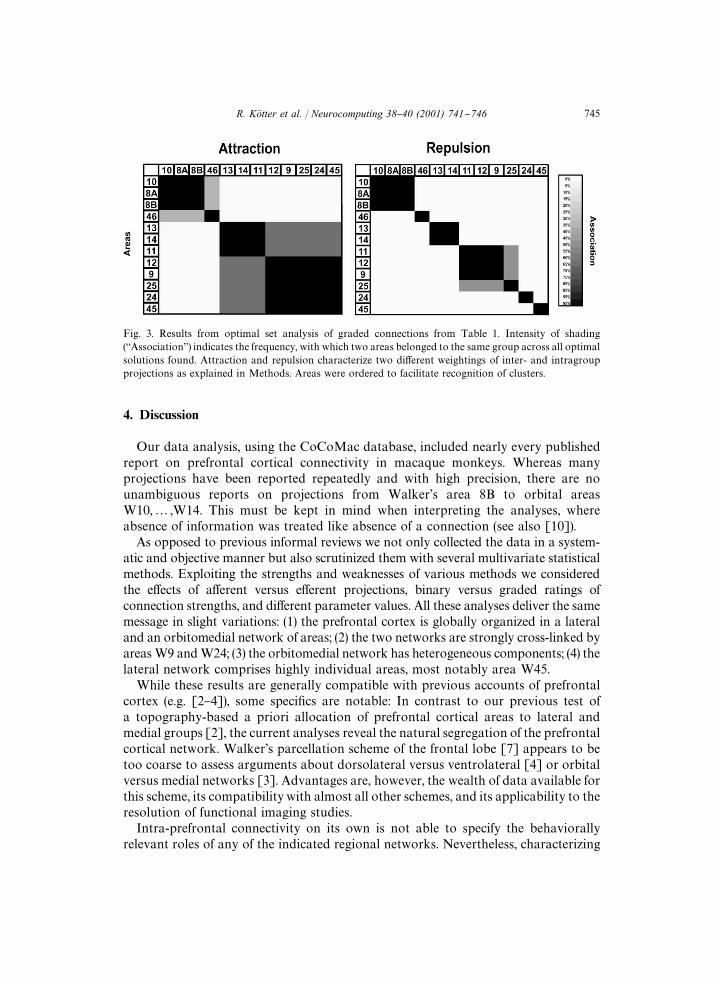
Fig. 3. Results from optimal set analysis of graded connections from Table 1. Intensity of shading(`Associationa) indicates the frequency, with which two areas belonged to the same group across all optimalsolutions found. Attraction and repulsion characterize two di!erent weightings of inter- and intragroupprojections as explained in Methods. Areas were ordered to facilitate recognition of clusters.
4. Discussion
Our data analysis, using the CoCoMac database, included nearly every publishedreport on prefrontal cortical connectivity in macaque monkeys. Whereas manyprojections have been reported repeatedly and with high precision, there are nounambiguous reports on projections from Walker's area 8B to orbital areasW10,2,W14. This must be kept in mind when interpreting the analyses, whereabsence of information was treated like absence of a connection (see also [10]).As opposed to previous informal reviews we not only collected the data in a system-
atic and objective manner but also scrutinized them with several multivariate statisticalmethods. Exploiting the strengths and weaknesses of various methods we consideredthe e!ects of a!erent versus e!erent projections, binary versus graded ratings ofconnection strengths, and di!erent parameter values. All these analyses deliver the samemessage in slight variations: (1) the prefrontal cortex is globally organized in a lateraland an orbitomedial network of areas; (2) the two networks are strongly cross-linked byareasW9 andW24; (3) the orbitomedial network has heterogeneous components; (4) thelateral network comprises highly individual areas, most notably area W45.While these results are generally compatible with previous accounts of prefrontal
cortex (e.g. [2}4]), some speci"cs are notable: In contrast to our previous test ofa topography-based a priori allocation of prefrontal cortical areas to lateral andmedial groups [2], the current analyses reveal the natural segregation of the prefrontalcortical network. Walker's parcellation scheme of the frontal lobe [7] appears to betoo coarse to assess arguments about dorsolateral versus ventrolateral [4] or orbitalversus medial networks [3]. Advantages are, however, the wealth of data available forthis scheme, its compatibility with almost all other schemes, and its applicability to theresolution of functional imaging studies.Intra-prefrontal connectivity on its own is not able to specify the behaviorally
relevant roles of any of the indicated regional networks. Nevertheless, characterizing
R. Ko( tter et al. / Neurocomputing 38}40 (2001) 741}746 745
the connectional patterns of these areas is of great use: it helps to classify corticalstructures in terms of their network participation rather than intrinsic functions. Thisapproach is most clearly expressed by the areal network indices: density, symmetry,and input/output ratio. Areas W9 and W24 can integrate information from theorbitomedial and lateral networks since both are densely connected and receivea!erents from every prefrontal area. In addition, the two areas have strong reciprocalprojections and, thus, may be functionally similar. In contrast, area W45 receives noinput from the orbitomedial group, but sends output to all prefrontal areas. Sinceconnections between areas W45 and W9#W24 are weak or of unknown strength,these areas are likely to display two di!erent aspects of integrative prefrontal processing.
References
[1] C.C. Hilgetag, G.A.P.C. Burns, M.A. O'Neill, J.W. Scannell, M.P. Young, Anatomical connectivityde"nes the organization of clusters of cortical areas in the macaque monkey and the cat, Phil. Trans.R. Soc. Lond. B 355 (2000) 91}110.
[2] G. Northo! et al., Functional dissociation between medial and lateral orbitofrontal cortical spa-tiotemporal activation in negative and positive emotions: A combined FMRI/MEG study, Cereb.Cortex 10 (2000) 93}107.
[3] D. OG nguK r, J.L. Price, The organization of networks within the orbital and medial prefrontal cortex ofrats, monkeys and humans, Cereb. Cortex 10 (2000) 206}219.
[4] A.C. Roberts, T.W. Robbins, L. Weiskrantz, The Prefrontal Cortex, Oxford University Press, Oxford,1998.
[5] K.E. Stephan, L. Kamper, A. Bozkurt, G.A.P.C. Burns, M.P. Young, R. KoK tter, CoCoMac: advanceddatabase methodology for complex connectivity data of the primate brain, Phil. Trans. R. Soc. Lond.B, in press.
[6] K.E. Stephan, K. Zilles, R. KoK tter, Coordinate-independentmapping of structural and functional databy objective relational transformation (ORT), Phil. Trans. R. Soc. Lond. B 355 (2000) 37}54.
[7] A.E. Walker, A cytoarchitectural study of the prefrontal areas of macaque monkey, J. Comp. Neurol.98 (1940) 59}86.
[8] M.P. Young, Objective analysis of the topological organization of the primate cortical visual system,Nature 358 (1992) 152}155.
[9] M.P. Young, The organization of neural systems in the primate cerebral cortex, Proc. R. Soc. Lond.B 252 (1993) 13}18.
[10] M.P. Young, J.W. Scannell, M.A. O'Neill, C.C. Hilgetag, G.A.P.C. Burns, C. Blakemore, Non-metricmultidimensional scaling in the analysis of neuroanatomical connection data and the organization ofthe primate cortical visual system, Phil. Trans. R. Soc. Lond. B 348 (1995) 281}308.
Rolf KoK tter studied medicine and computer science in Germany, Britain and France. He leads theComputational Systems Neuroscience group at the Centre of Anatomy and Brain Research, DuK sseldorfUniversity, to establish structure-function relationships in the brain by experimental and computationalapproaches.
Claus C. Hilgetag studied Biophysics in Berlin, and Neuroscience in Edinburgh, Oxford and Newcastle. Heis currently a Wellcome Trust International Fellow in the Department of Anatomy and Neurobiology,Boston University School of Medicine. His research focuses on the organization of brain connectivity andthe neural mechanisms of spatial attention.
Klaas Enno Stephan studies medicine at the Heinrich-HeineUniversity DuK sseldorf and Computer Science atthe University of Hagen. Working at the C.&O. Vogt Brain Research Institute in DuK sseldorf with RolfKoK tter and Karl Zilles as well as with the Neural Systems Group of Malcolm Young at Newcastle. Hisresearch focuses on computational approaches to analysis of structural and functional connectivity in thebrains of macaque and man.
746 R. Ko( tter et al. / Neurocomputing 38}40 (2001) 741}746