connecticut rider education program 2011 - ct.gov · connecticut . rider education program . 2011 ....
TRANSCRIPT
CONNECTICUT
RIDER EDUCATION PROGRAM
2011
Motorcycle Safety Report
Connecticut Department of Transportation Division of Highway Safety
P.O. Box 317546 2800 Berlin Turnpike
Newington, CT 06131-7546
SECTIONS
SECTION 1: CT 2011 MOTORCYCLE SAFETY OVERVIEW
AND GRAPHICAL DATA
SECTION 2: COUNT OF COURSES & STUDENTS PER SITE
SECTION 3: STUDENT STATUS COUNT BY SITE & COURSE
SECTION 4: STATUS COUNT BY SITE & COURSE (BRC, ERC, IRC, IPW, IPA, ARC)
SECTION 5: STUDENT STATUS COUNT BY SITE, COURSE, & SEX
SECTION 6: COUNT OF STUDENTS TRAINED BY AGE GROUP
SECTION 7: GRAPHICAL DATA
SECTION 1
CT 2011 MOTORCYCLE SAFETY OVERVIEW
Motorcycle Safety The general goal of Connecticut’s Motorcycle Safety Program is to reduce the number of injuries and deaths among motorcycle operators and passengers. Performance goals set during the previous planning period included;
• Decreasing the number of un-helmeted fatalities below the five year average of 33 (2004-2008) to 25 by 2012.
• Decrease the number of fatalities below the five year average (2004-2008) of 51
by 10 percent to 46 by 2012.
• Decreasing the percentage of fatally injured motorcycle operators with BACs greater than 0.00 from 39.5 percent in 2008 to 30 percent in 2012.
The latest available data from 2010 indicates that the three year moving average of un-helmeted fatalities is 35 (Graph 8). During the same time period, the three year moving average for fatalities was 53 (Graph 8). Un-helmeted fatalities over the last three years have remained largely the same while overall motorcycle fatalities have shown a decline in relation to total fatalities 16% or (52 out of 319).
This data also indicates that in 2010, 21 out of 52 (41 percent) of the fatalities tested had a BAC greater than 0.00. This is the highest since 2003. The three year moving average for this group is 38 percent, (Graph 9) During Fiscal Year 2011, DOT’s Connecticut Rider Education Program (CONREP) continued motorcycle rider safety training at fifteen locations
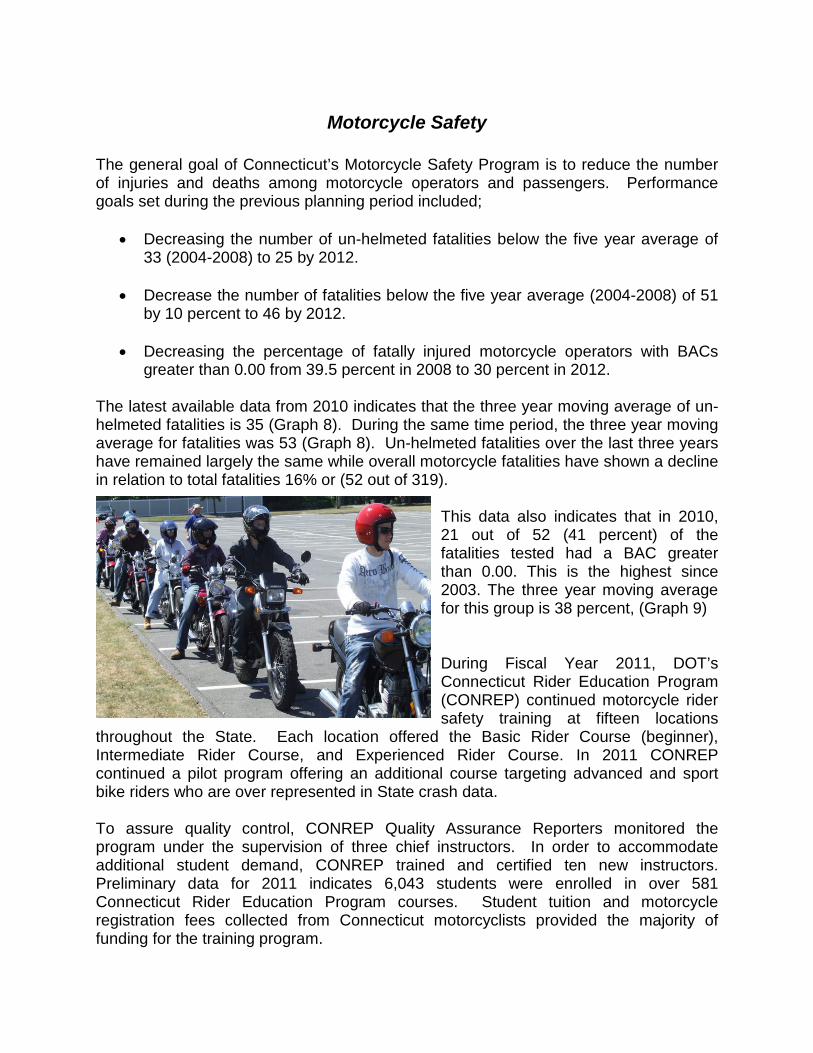
throughout the State. Each location offered the Basic Rider Course (beginner), Intermediate Rider Course, and Experienced Rider Course. In 2011 CONREP continued a pilot program offering an additional course targeting advanced and sport bike riders who are over represented in State crash data. To assure quality control, CONREP Quality Assurance Reporters monitored the program under the supervision of three chief instructors. In order to accommodate additional student demand, CONREP trained and certified ten new instructors. Preliminary data for 2011 indicates 6,043 students were enrolled in over 581 Connecticut Rider Education Program courses. Student tuition and motorcycle registration fees collected from Connecticut motorcyclists provided the majority of funding for the training program.

In January 2011 newly enacted state law requires motorcycle operator safety training for all new license applicants. CONREP experienced a substantial increase in students during the 2011 training season. CONREP trained over 6,000 students, a 20% increase from the previous year, largely in part to the new requirement. Providing public information and education materials that promote safety is an important component of the motorcycle safety program. Motorcycle organizations and several Connecticut motorcycle dealerships helped in this effort by distributing the materials. The materials included information on training course availability, safe riding gear, alcohol and/or drug impairment, safe riding tips, and motorist awareness of motorcycles. One popular item was the State motorcycle-specific map that incorporates NHTSA motorcycle safety educational information. CONREP was also represented and promoted at several grassroots events. Preliminary estimates indicate that over 10,000 Connecticut motorcyclists received NHTSA and State motorcycle safety education and rider impairment informational materials during this reporting period. CONREP previously used NHTSA funding to purchase two Safe Motorcyclist Awareness and Recognition Trainers (SMARTrainer) The SMARTrainer is an advanced, interactive instructional tool with standard motorcycle controls and realistic traffic situations. The SMARTrainer leads a rider through a computer simulated ride designed to develop and apply risk-management and crash avoidance strategies. Instructors received training on SMARTrainer procedures and instructional applications. This team conducted successful presentations at numerous grassroots events throughout the State. A total of 87 events took place over the course of the year, where over 2100 people participated in the SMARTrainer exercises. The largest event was in January at the Hartford Motorcycle Expo. CONREP used NHTSA funding to purchase 68 Suzuki TU250X motorcycles and 15 Yamaha Zuma scooters. These motorcycles and scooters are fuel injected and were necessary to keep up with the increasing student demand.
A successful statewide campaign, “Open the Throttle. Not the Bottle,” continued to address motorcycle rider impairment and the impact of alcohol, drugs, and

fatigue on riding ability. Funded by a NHTSA grant, the campaign was developed to increase awareness of the dangers of riding impaired, with a focus on fatal injuries, and to encourage safe motorcycle riding practices. The campaign Web site (www.ride4ever.org) contains impaired riding messages and includes downloadable ride maps, digital postcards, and articles. The site showed 26,000+ visits over the course of the year, with the bulk of them coming in the spring and summer. Partners in this Program include the American Motorcyclists Association, and the Connecticut Motorcycle Riders Association. The campaign continued throughout the year with public service announcements and campaign message events at motorcycle gatherings. CONREP received fifth year Section 2010 motorcycle safety funding from NHTSA. These funds were programmed to support the expansion of motorcycle rider training courses during 2011. This includes the addition of new motorcycles and other training equipment necessary to allow the program to offer more safety classes for novice riders. Additional funding will also be reserved to support our efforts to reduce rider impairment fatalities. During 2011, approximately $432,550 of federal funds ($250,950 of Sections 402, and $181,600 of Section 2010) and a combined $1,469,194 from both Connecticut’s Motorcycle Safety fund and CONREP course fees were spent to accomplish these activities.
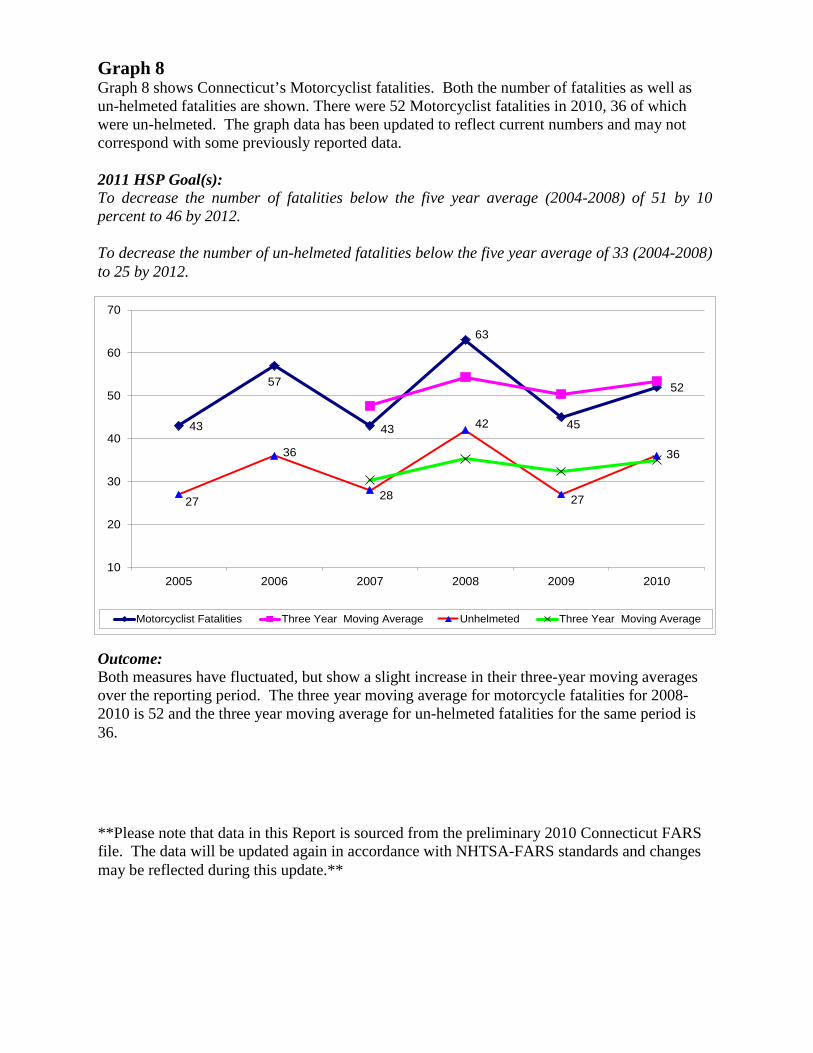
Graph 8 Graph 8 shows Connecticut’s Motorcyclist fatalities. Both the number of fatalities as well as un-helmeted fatalities are shown. There were 52 Motorcyclist fatalities in 2010, 36 of which were un-helmeted. The graph data has been updated to reflect current numbers and may not correspond with some previously reported data. 2011 HSP Goal(s): To decrease the number of fatalities below the five year average (2004-2008) of 51 by 10 percent to 46 by 2012. To decrease the number of un-helmeted fatalities below the five year average of 33 (2004-2008) to 25 by 2012.
Outcome: Both measures have fluctuated, but show a slight increase in their three-year moving averages over the reporting period. The three year moving average for motorcycle fatalities for 2008-2010 is 52 and the three year moving average for un-helmeted fatalities for the same period is 36.
**Please note that data in this Report is sourced from the preliminary 2010 Connecticut FARS file. The data will be updated again in accordance with NHTSA-FARS standards and changes may be reflected during this update.**
43
57
43
63
45
52
27
36
28
42
27
36
10
20
30
40
50
60
70
2005 2006 2007 2008 2009 2010
Motorcyclist Fatalities Three Year Moving Average Unhelmeted Three Year Moving Average
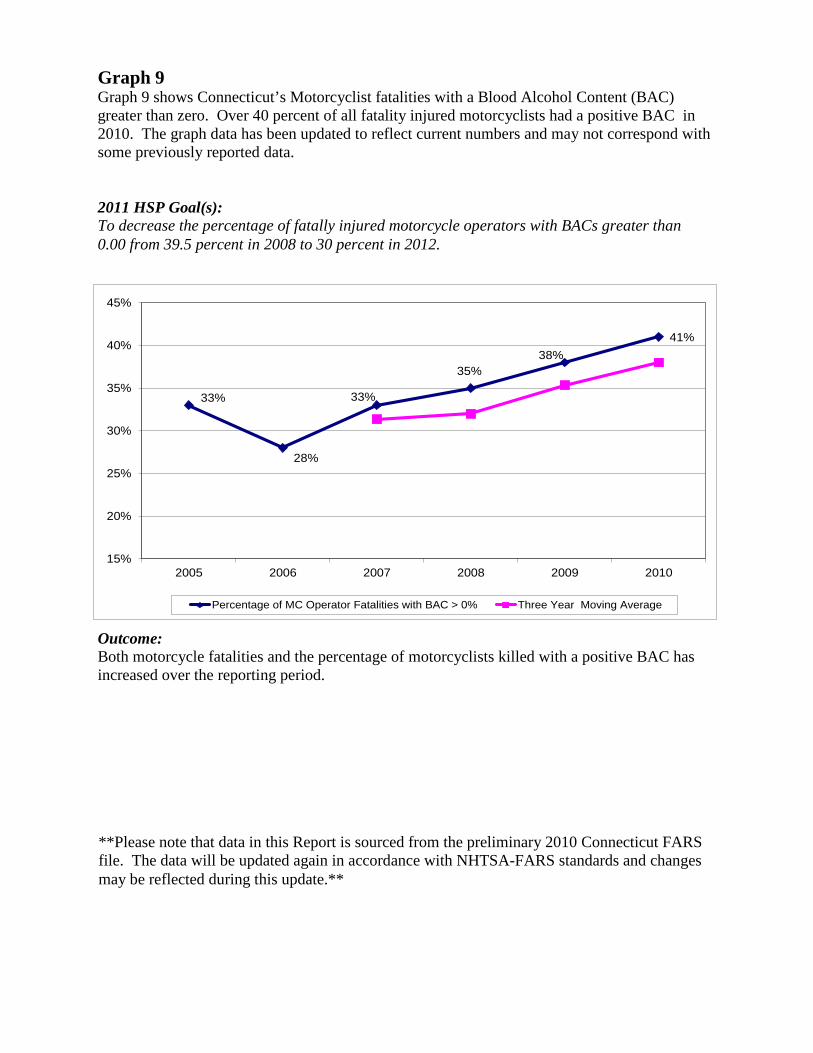
Graph 9 Graph 9 shows Connecticut’s Motorcyclist fatalities with a Blood Alcohol Content (BAC) greater than zero. Over 40 percent of all fatality injured motorcyclists had a positive BAC in 2010. The graph data has been updated to reflect current numbers and may not correspond with some previously reported data. 2011 HSP Goal(s): To decrease the percentage of fatally injured motorcycle operators with BACs greater than 0.00 from 39.5 percent in 2008 to 30 percent in 2012.
Outcome: Both motorcycle fatalities and the percentage of motorcyclists killed with a positive BAC has increased over the reporting period.
**Please note that data in this Report is sourced from the preliminary 2010 Connecticut FARS file. The data will be updated again in accordance with NHTSA-FARS standards and changes may be reflected during this update.**
33%
28%
33%
35%38%
41%
15%
20%
25%
30%
35%
40%
45%
2005 2006 2007 2008 2009 2010
Percentage of MC Operator Fatalities with BAC > 0% Three Year Moving Average
SECTION 2
COUNT OF COURSES & STUDENTS PER SITE

CONREP Count of Courses and Students per Site for: 03-Jan-1211
Sponsor
Site Location
BRC ERC IPW
BRC ERC IPW
Courses
Students Totals
IRC
IRC
IPA
IPA
ARC
ARC
TUNXIS COMM-TECH COLLEGE
ARMY ENGINE PLANT
56
511
Courses
Students
56
511
N WESTERN COMM COLLEGE
AIR NATIONAL GUARD
19 2
193 3
Courses
Students
27
22215
3 3
11
GATEWAY COMM COLLEGE
ELI WHITNEY TECH
18 2
196 16
Courses
Students
20
212
GATEWAY COMM COLLEGE
GATEWAY NR. HAVEN CAMPUS
53
632
Courses
Students
53
632
MANCHESTER COMM COLLEGE
MCC CAMPUS
30
356
Courses
Students
30
356
MANCHESTER COMM COLLEGE
COMMUTER LOT BUCK HIL
21
249
Courses
Students
21
249
MSTC OF NEW ENGLAND
EXCALIBUR BOULEVARD
101 1
961 4
Courses
Students
105
992
3
27
N WESTERN COMM COLLEGE
UCONN TORRINGTON CAMPUS
14
163
Courses
Students
20
20730
3 3
14
NAUGATUCK VALLEY COMM COL
NAUGATUCK CAMPUS
67 2 1
759 16 16
Courses
Students
78
88695
8
QUINEBAUG VALLEY COLLEGE
GROTON AIRPORT
3
22
Courses
Students
3
22
QUINEBAUG VALLEY COLLEGE
LAKE HAYWARD RD COMMUTER LOT
16
155
Courses
Students
16
155
QUINEBAUG VALLEY COLLEGE
GRASSO TECH HIGH SCHOOL
19
177
Courses
Students
20
1869
1
QUINEBAUG VALLEY COLLEGE
KILLINGLY MEMORIAL SCHOOL
14
111
Courses
Students
14
111
QUINEBAUG VALLEY COLLEGE
NORWICH DOT DISTRICT 2
12
108
Courses
Students
12
108
TUNXIS COMM-TECH COLLEGE
FAIRFIELD COMMUTER LOT
15
167
Courses
Students
15
167
TUNXIS COMM-TECH COLLEGE
TUNXIS CAMPUS
88 3
992 35
Courses
Students
91
1027
546 10 1
5752 74 16
Total Courses
Total Students
581
6043
15
149
9
52
1REPORT NAME: Course and Student Count per Year

SECTION 3
STUDENT STATUS COUNT BY SITE & COURSE

Student Status Count by Site and Course for the Year: 04-Jan-12
11
Site Course Total DropFail IncompleteNo ShowPassTUNXIS COMM-TECH COLLEGEARMY ENGINE PLANT
511 1113 1022455BRC511 1113 1022455AEPTotal
N WESTERN COMM COLLEGEAIR NATIONAL GUARD
11 47ARC
193 59 212165BRC
3 3ERC
15 15IRC222 59 612190ANGTotal
GATEWAY COMM COLLEGEELI WHITNEY TECH
196 145 9168BRC
16 1114ERC212 156 9182GEWTotal
GATEWAY COMM COLLEGEGATEWAY NR. HAVEN CAMPUS
632 4135 730519BRC632 4135 730519GNHTotal
MANCHESTER COMM COLLEGEMCC CAMPUS
356 1912 120304BRC356 1912 120304MCCTotal
MANCHESTER COMM COLLEGECOMMUTER LOT BUCK HIL
249 1326 113196BRC249 1326 113196MCPTotal
MSTC OF NEW ENGLANDEXCALIBUR BOULEVARD
27 1422ARC
961 1831 1229871BRC
4 4ERC992 1831 1333897MSCTotal
N WESTERN COMM COLLEGEUCONN TORRINGTON CAMPUS
14 2 111ARC
1

Site Course Total DropFail IncompleteNo ShowPass
163 55 58140BRC
30 1 227IRC207 58 79178NUTTotal
NAUGATUCK VALLEY COMM COLNAUGATUCK CAMPUS
759 4118 930661BRC
16 16ERC
16 5 110IPW
95 12 21377IRC886 4720 1144764NVCTotal
QUINEBAUG VALLEY COLLEGEGROTON AIRPORT
22 2 119BRC22 2 119QAPTotal
QUINEBAUG VALLEY COLLEGELAKE HAYWARD RD COMMUTER LOT
155 74 67131BRC155 74 67131QCLTotal
QUINEBAUG VALLEY COLLEGEGRASSO TECH HIGH SCHOOL
177 17 98152BRC
9 18IRC186 17 99160QGTTotal
QUINEBAUG VALLEY COLLEGEKILLINGLY MEMORIAL SCHOOL
111 11109BRC111 11109QKMTotal
QUINEBAUG VALLEY COLLEGENORWICH DOT DISTRICT 2
108 23 4594BRC108 23 4594QNOTotal
TUNXIS COMM-TECH COLLEGEFAIRFIELD COMMUTER LOT
167 136 515128BRC167 136 515128TFXTotal
TUNXIS COMM-TECH COLLEGETUNXIS CAMPUS
992 3438 642872BRC
35 11 231ERC
2

Site Course Total DropFail IncompleteNo ShowPass1027 3539 644903TXCTotal
6043 233222 862735229Grand Total:
Summary of Course
REPORT NAME: STUDENT STATUS COUNT BY SITE AND COURSE
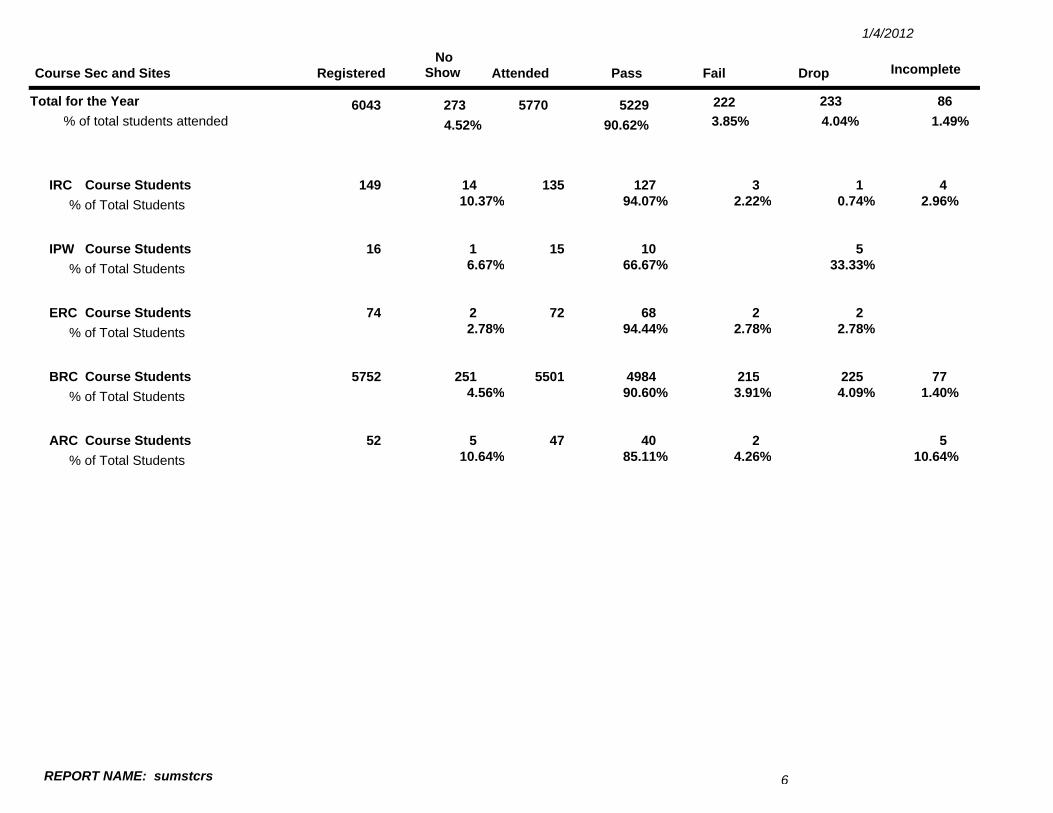
Course Total DropFail IncompleteNo ShowPassIRC 13 4127 14149IPW 510 116ERC 2268 274BRC 225215 774984 2515752ARC 2 540 552
3
SECTION 4
STATUS COUNT BY SITE & COURSE (BRC, ERC, IRC, IPW, ARC)

Status Count by Site and Course for the Year '11
CONREP Report
Course Sec and Sites Registered Attended DropFail IncompleteNo
Show Pass
1/4/2012
TUNXIS COMM-TECH COLLEGE
% of total students attended
511 1113 1022 455489
93.05% 2.66% 2.25% 2.04%4.31%AEPARMY ENGINE PLANT
511 1113 1022 455BRC% of total students attended
48993.05% 2.66% 2.25% 2.04%4.31%
N WESTERN COMM COLLEGE
% of total students attended
222 59 612 190210
90.48% 4.29% 2.38% 2.86%5.41%ANGAIR NATIONAL GUARD
11 47ARC% of total students attended
1163.64% 36.36%
193 59 212 165BRC% of total students attended
18191.16% 4.97% 2.76% 1.10%6.22%
3 3ERC% of total students attended
3100.00%
15 15IRC% of total students attended
15100.00%
GATEWAY COMM COLLEGE
% of total students attended
212 1569 182203
89.66% 2.96% 7.39%4.25%GEWELI WHITNEY TECH
1REPORT NAME: sumstcrs
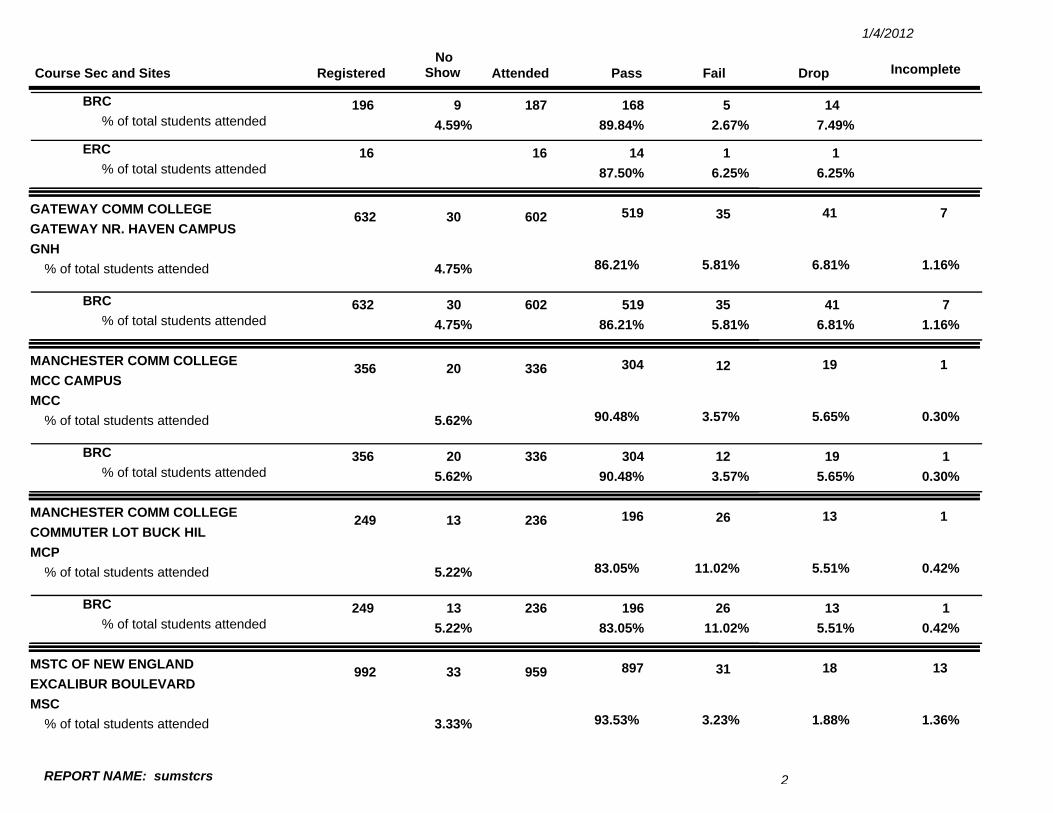
Course Sec and Sites Registered Attended DropFail IncompleteNo
Show Pass
1/4/2012
196 1459 168BRC% of total students attended
18789.84% 2.67% 7.49%4.59%
16 1114ERC% of total students attended
1687.50% 6.25% 6.25%
GATEWAY COMM COLLEGE
% of total students attended
632 4135 730 519602
86.21% 5.81% 6.81% 1.16%4.75%GNHGATEWAY NR. HAVEN CAMPUS
632 4135 730 519BRC% of total students attended
60286.21% 5.81% 6.81% 1.16%4.75%
MANCHESTER COMM COLLEGE
% of total students attended
356 1912 120 304336
90.48% 3.57% 5.65% 0.30%5.62%MCCMCC CAMPUS
356 1912 120 304BRC% of total students attended
33690.48% 3.57% 5.65% 0.30%5.62%
MANCHESTER COMM COLLEGE
% of total students attended
249 1326 113 196236
83.05% 11.02% 5.51% 0.42%5.22%MCPCOMMUTER LOT BUCK HIL
249 1326 113 196BRC% of total students attended
23683.05% 11.02% 5.51% 0.42%5.22%
MSTC OF NEW ENGLAND
% of total students attended
992 1831 1333 897959
93.53% 3.23% 1.88% 1.36%3.33%MSCEXCALIBUR BOULEVARD
2REPORT NAME: sumstcrs
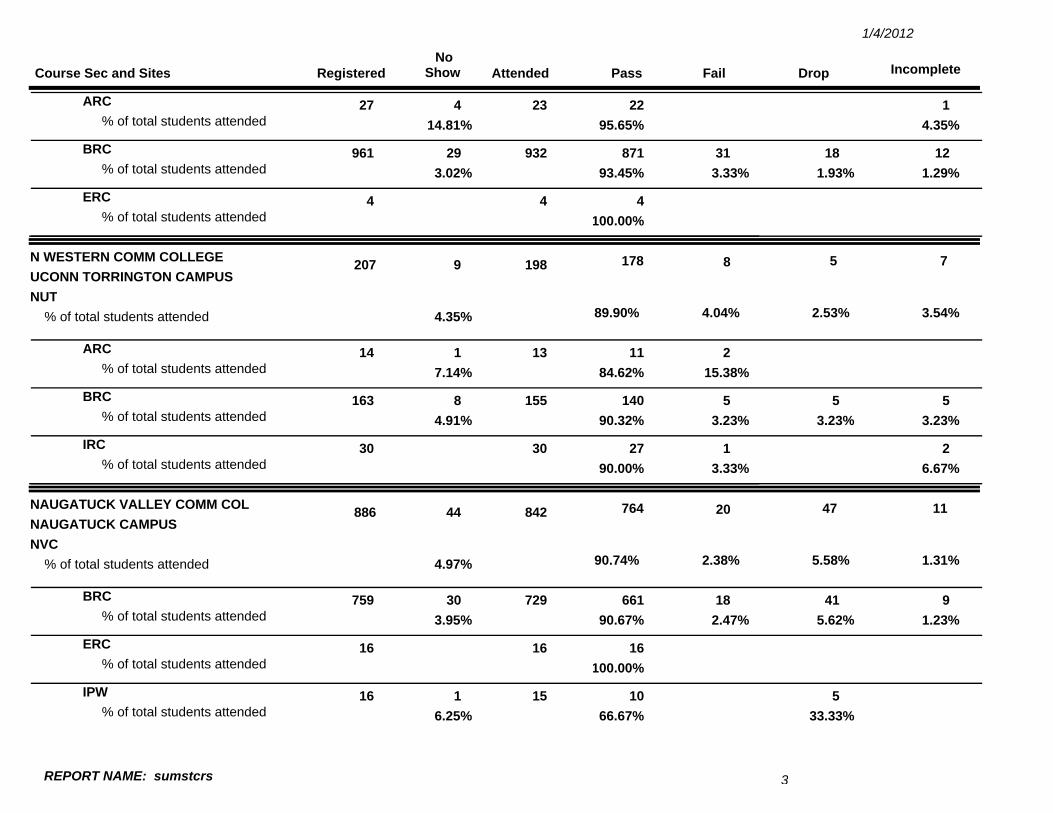
Course Sec and Sites Registered Attended DropFail IncompleteNo
Show Pass
1/4/2012
27 14 22ARC% of total students attended
2395.65% 4.35%14.81%
961 1831 1229 871BRC% of total students attended
93293.45% 3.33% 1.93% 1.29%3.02%
4 4ERC% of total students attended
4100.00%
N WESTERN COMM COLLEGE
% of total students attended
207 58 79 178198
89.90% 4.04% 2.53% 3.54%4.35%NUTUCONN TORRINGTON CAMPUS
14 21 11ARC% of total students attended
1384.62% 15.38%7.14%
163 55 58 140BRC% of total students attended
15590.32% 3.23% 3.23% 3.23%4.91%
30 1 227IRC% of total students attended
3090.00% 3.33% 6.67%
NAUGATUCK VALLEY COMM COL
% of total students attended
886 4720 1144 764842
90.74% 2.38% 5.58% 1.31%4.97%NVCNAUGATUCK CAMPUS
759 4118 930 661BRC% of total students attended
72990.67% 2.47% 5.62% 1.23%3.95%
16 16ERC% of total students attended
16100.00%
16 51 10IPW% of total students attended
1566.67% 33.33%6.25%
3REPORT NAME: sumstcrs

Course Sec and Sites Registered Attended DropFail IncompleteNo
Show Pass
1/4/2012
95 12 213 77IRC% of total students attended
8293.90% 2.44% 1.22% 2.44%13.68%
QUINEBAUG VALLEY COLLEGE
% of total students attended
22 21 1921
90.48% 9.52%4.55%QAPGROTON AIRPORT
22 21 19BRC% of total students attended
2190.48% 9.52%4.55%
QUINEBAUG VALLEY COLLEGE
% of total students attended
155 74 67 131148
88.51% 2.70% 4.73% 4.05%4.52%QCLLAKE HAYWARD RD COMMUTER LOT
155 74 67 131BRC% of total students attended
14888.51% 2.70% 4.73% 4.05%4.52%
QUINEBAUG VALLEY COLLEGE
% of total students attended
186 17 99 160177
90.40% 3.95% 0.56% 5.08%4.84%QGTGRASSO TECH HIGH SCHOOL
177 17 98 152BRC% of total students attended
16989.94% 4.14% 0.59% 5.33%4.52%
9 1 8IRC% of total students attended
8100.00%11.11%
QUINEBAUG VALLEY COLLEGE
% of total students attended
111 11109111
98.20% 0.90% 0.90%QKMKILLINGLY MEMORIAL SCHOOL
4REPORT NAME: sumstcrs
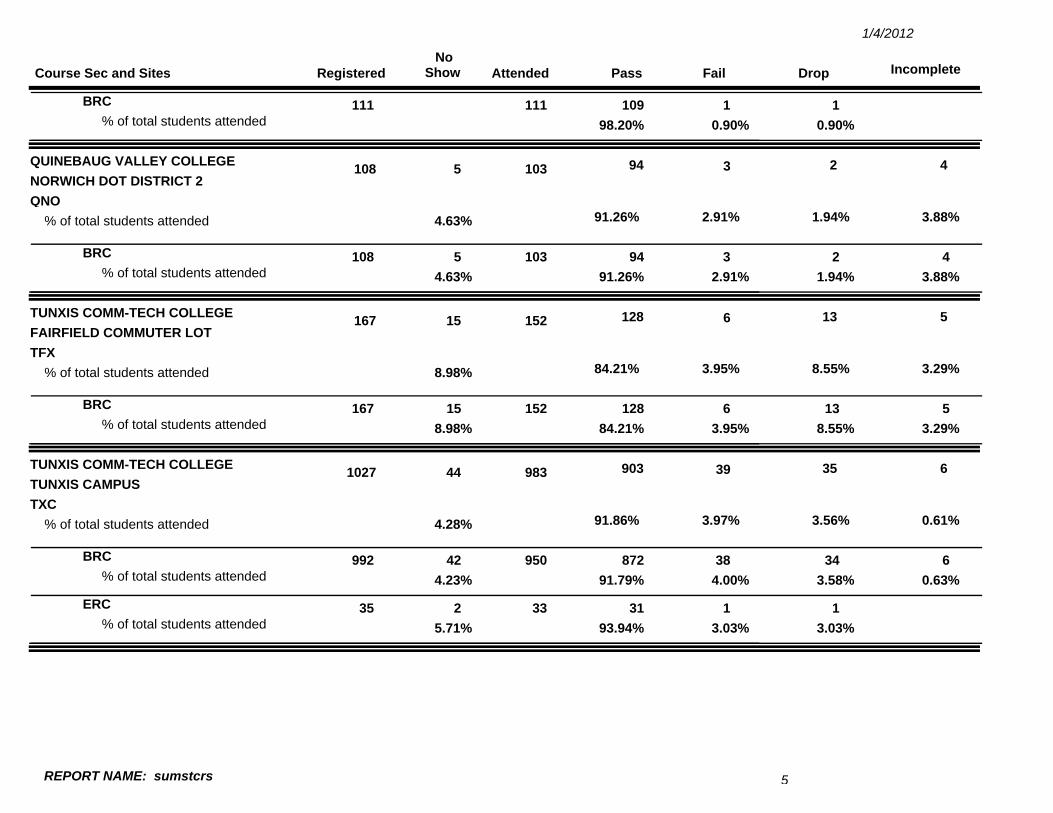
Course Sec and Sites Registered Attended DropFail IncompleteNo
Show Pass
1/4/2012
111 11109BRC% of total students attended
11198.20% 0.90% 0.90%
QUINEBAUG VALLEY COLLEGE
% of total students attended
108 23 45 94103
91.26% 2.91% 1.94% 3.88%4.63%QNONORWICH DOT DISTRICT 2
108 23 45 94BRC% of total students attended
10391.26% 2.91% 1.94% 3.88%4.63%
TUNXIS COMM-TECH COLLEGE
% of total students attended
167 136 515 128152
84.21% 3.95% 8.55% 3.29%8.98%TFXFAIRFIELD COMMUTER LOT
167 136 515 128BRC% of total students attended
15284.21% 3.95% 8.55% 3.29%8.98%
TUNXIS COMM-TECH COLLEGE
% of total students attended
1027 3539 644 903983
91.86% 3.97% 3.56% 0.61%4.28%TXCTUNXIS CAMPUS
992 3438 642 872BRC% of total students attended
95091.79% 4.00% 3.58% 0.63%4.23%
35 112 31ERC% of total students attended
3393.94% 3.03% 3.03%5.71%
5REPORT NAME: sumstcrs
Course Sec and Sites Registered Attended DropFail IncompleteNo
Show Pass
1/4/2012
6043 233222 86273 522990.62% 3.85% 4.04% 1.49%4.52%
Total for the Year% of total students attended
5770
IRC 13 4127Course Students% of Total Students
14 13514910.37% 94.07% 2.22% 0.74% 2.96%
IPW 510Course Students% of Total Students
1 15166.67% 66.67% 33.33%
ERC 2268Course Students% of Total Students
2 72742.78% 94.44% 2.78% 2.78%
BRC 225215 774984Course Students% of Total Students
251 550157524.56% 90.60% 3.91% 4.09% 1.40%
ARC 2 540Course Students% of Total Students
5 475210.64% 85.11% 4.26% 10.64%
6REPORT NAME: sumstcrs
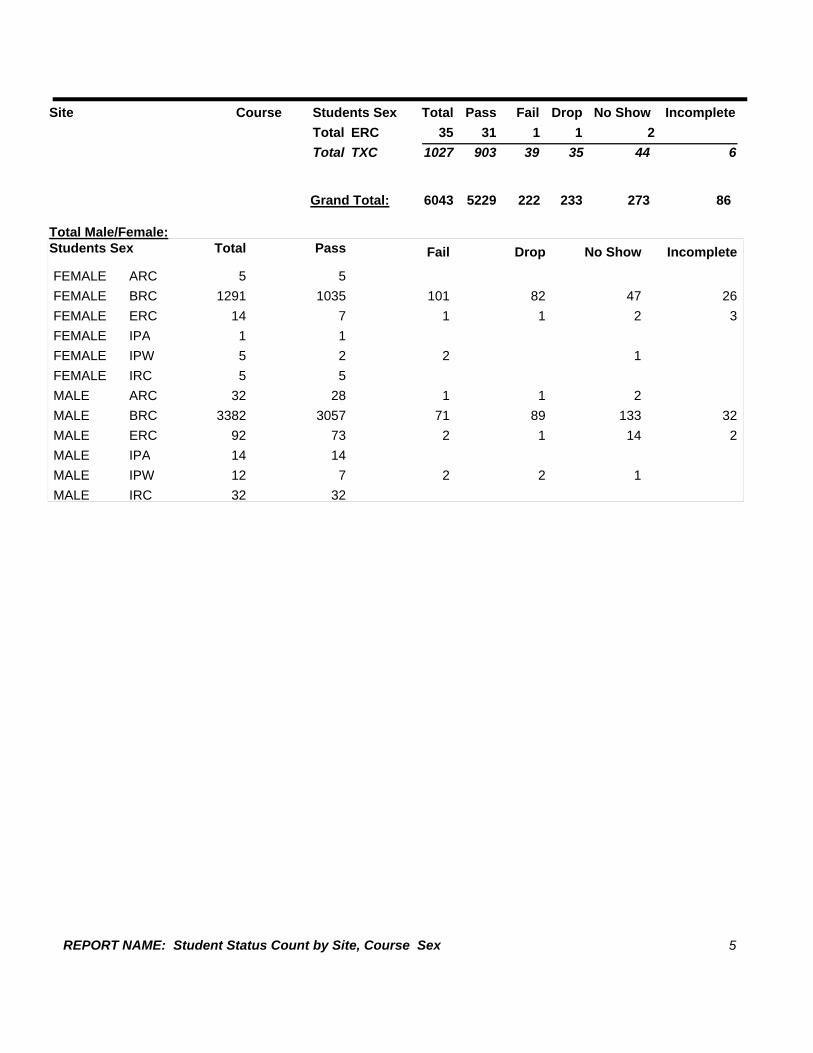
SECTION 5
STUDENT STATUS COUNT BY SITE, COURSE & SEX
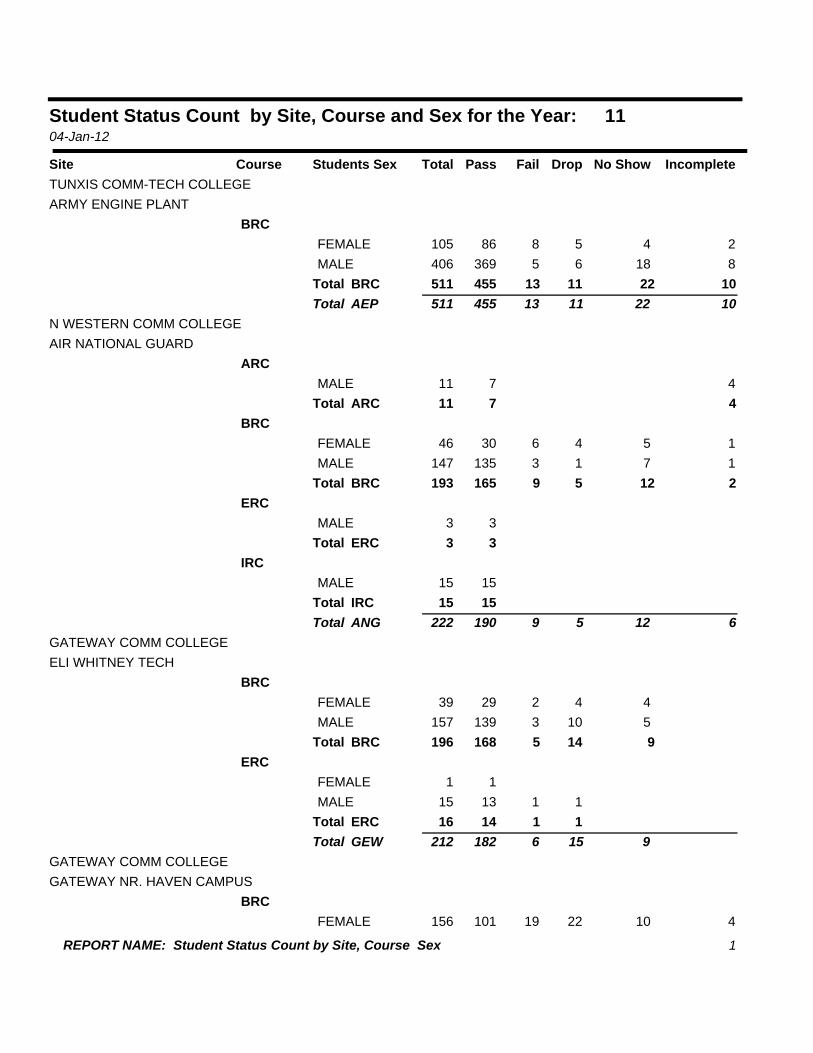
Student Status Count by Site, Course and Sex for the Year: 04-Jan-12
11
Site Course Students Sex Total DropFail IncompleteNo ShowPassTUNXIS COMM-TECH COLLEGEARMY ENGINE PLANT
BRCFEMALE 5 248105 86MALE 6 8185406 369
511 1113 1022455BRCTotal511 1113 1022455AEPTotal
N WESTERN COMM COLLEGEAIR NATIONAL GUARD
ARCMALE 411 7
11 47ARCTotalBRC
FEMALE 4 15646 30MALE 1 173147 135
193 59 212165BRCTotalERC
MALE 3 33 3ERCTotal
IRCMALE 15 15
15 15IRCTotal222 59 612190ANGTotal
GATEWAY COMM COLLEGEELI WHITNEY TECH
BRCFEMALE 4 4239 29MALE 10 53157 139
196 145 9168BRCTotalERC
FEMALE 1 1MALE 1115 13
16 1114ERCTotal212 156 9182GEWTotal
GATEWAY COMM COLLEGEGATEWAY NR. HAVEN CAMPUS
BRCFEMALE 22 41019156 101
1REPORT NAME: Student Status Count by Site, Course Sex

Site Course Students Sex Total DropFail IncompleteNo ShowPassMALE 19 32016476 418
632 4135 730519BRCTotal632 4135 730519GNHTotal
MANCHESTER COMM COLLEGEMCC CAMPUS
BRCFEMALE 9 6692 71MALE 10 1146264 233
356 1912 120304BRCTotal356 1912 120304MCCTotal
MANCHESTER COMM COLLEGECOMMUTER LOT BUCK HIL
BRCFEMALE 10 141778 46MALE 3 99171 150
249 1326 113196BRCTotal249 1326 113196MCPTotal
MSTC OF NEW ENGLANDEXCALIBUR BOULEVARD
ARCFEMALE 2 2MALE 1425 20
27 1422ARCTotalBRC
FEMALE 13 6710160 124MALE 5 62221801 747
961 1831 1229871BRCTotalERC
FEMALE 1 1MALE 3 3
4 4ERCTotal992 1831 1333897MSCTotal
N WESTERN COMM COLLEGEUCONN TORRINGTON CAMPUS
ARCFEMALE 1 1MALE 1213 10
14 2 111ARCTotalBRC
FEMALE 4 33441 27
2REPORT NAME: Student Status Count by Site, Course Sex
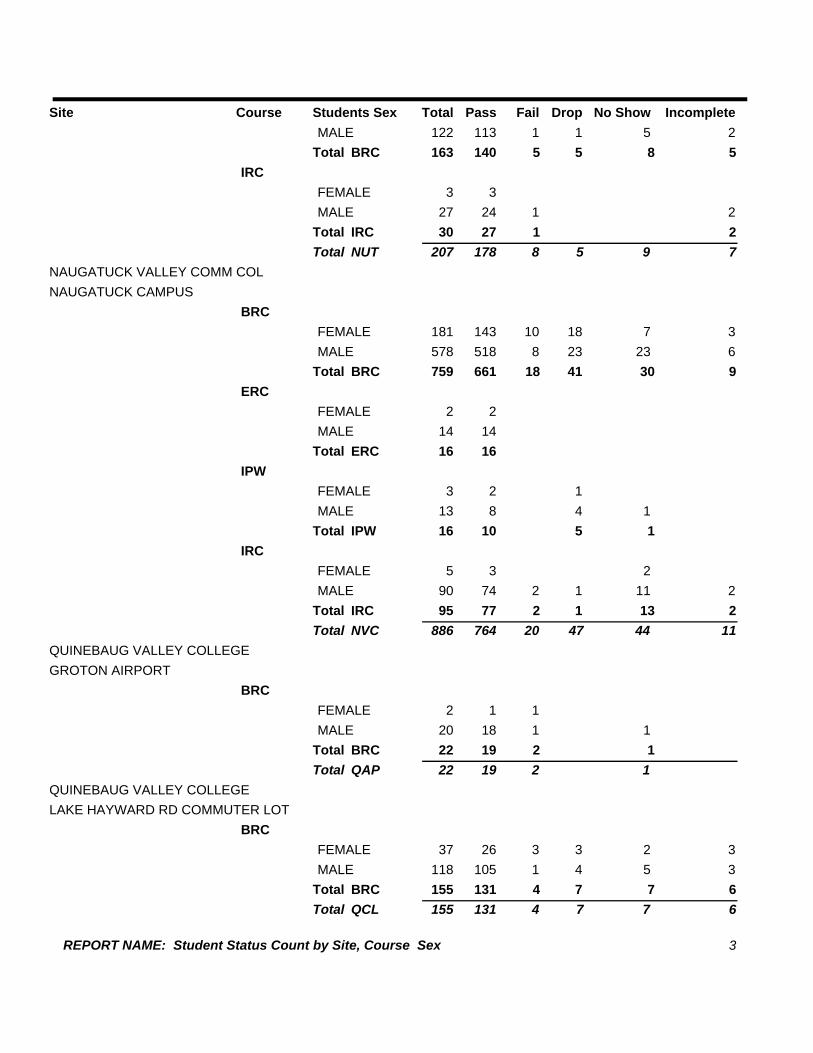
Site Course Students Sex Total DropFail IncompleteNo ShowPassMALE 1 251122 113
163 55 58140BRCTotalIRC
FEMALE 3 3MALE 2127 24
30 1 227IRCTotal207 58 79178NUTTotal
NAUGATUCK VALLEY COMM COLNAUGATUCK CAMPUS
BRCFEMALE 18 3710181 143MALE 23 6238578 518
759 4118 930661BRCTotalERC
FEMALE 2 2MALE 14 14
16 16ERCTotalIPW
FEMALE 13 2MALE 4 113 8
16 5 110IPWTotalIRC
FEMALE 25 3MALE 1 211290 74
95 12 21377IRCTotal886 4720 1144764NVCTotal
QUINEBAUG VALLEY COLLEGEGROTON AIRPORT
BRCFEMALE 12 1MALE 1120 18
22 2 119BRCTotal22 2 119QAPTotal
QUINEBAUG VALLEY COLLEGELAKE HAYWARD RD COMMUTER LOT
BRCFEMALE 3 32337 26MALE 4 351118 105
155 74 67131BRCTotal155 74 67131QCLTotal
3REPORT NAME: Student Status Count by Site, Course Sex

Site Course Students Sex Total DropFail IncompleteNo ShowPassQUINEBAUG VALLEY COLLEGEGRASSO TECH HIGH SCHOOL
BRCFEMALE 1 41650 38MALE 571127 114
177 17 98152BRCTotalIRC
MALE 19 89 18IRCTotal
186 17 99160QGTTotal
QUINEBAUG VALLEY COLLEGEKILLINGLY MEMORIAL SCHOOL
BRCFEMALE 132 31MALE 179 78
111 11109BRCTotal111 11109QKMTotal
QUINEBAUG VALLEY COLLEGENORWICH DOT DISTRICT 2
BRCFEMALE 2 21229 22MALE 24179 72
108 23 4594BRCTotal108 23 4594QNOTotal
TUNXIS COMM-TECH COLLEGEFAIRFIELD COMMUTER LOT
BRCFEMALE 8 12437 22MALE 5 4132130 106
167 136 515128BRCTotal167 136 515128TFXTotal
TUNXIS COMM-TECH COLLEGETUNXIS CAMPUS
BRCFEMALE 20 2417209 166MALE 14 43821783 706
992 3438 642872BRCTotalERC
FEMALE 5 5MALE 1 2130 26
4REPORT NAME: Student Status Count by Site, Course Sex
Site Course Students Sex Total DropFail IncompleteNo ShowPass35 11 231ERCTotal
1027 3539 644903TXCTotal
6043 233222 862735229Grand Total:
Total Male/Female:Students Sex Total DropFail IncompleteNo ShowPass
FEMALE 5 5ARCFEMALE 1291 1035 101 82 47 26BRCFEMALE 14 7 1 1 2 3ERCFEMALE 1 1IPAFEMALE 5 2 2 1IPWFEMALE 5 5IRCMALE 32 28 1 1 2ARCMALE 3382 3057 71 89 133 32BRCMALE 92 73 2 1 14 2ERCMALE 14 14IPAMALE 12 7 2 2 1IPWMALE 32 32IRC
5REPORT NAME: Student Status Count by Site, Course Sex

SECTION 6
COUNT OF STUDENTS TRAINED BY AGE GROUP
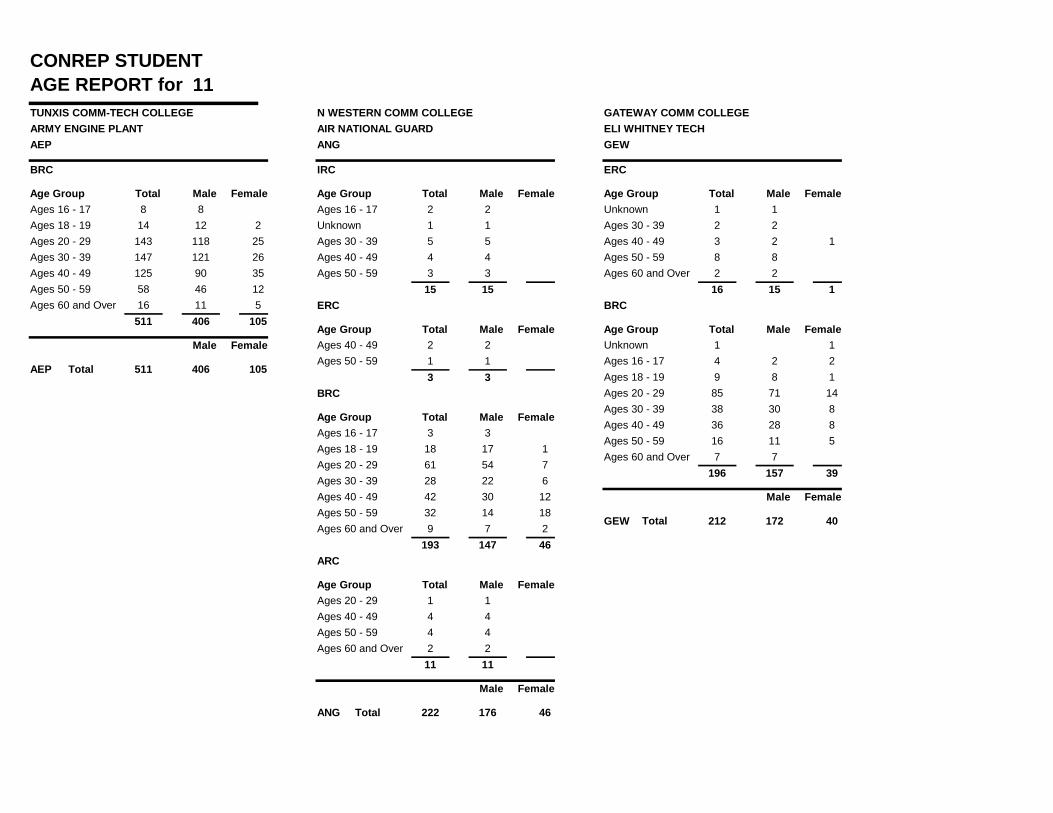
CONREP STUDENTAGE REPORT for 11
AEP
TUNXIS COMM-TECH COLLEGEARMY ENGINE PLANT
BRC
Total Male FemaleAge Group88Ages 16 - 17
12 214Ages 18 - 19118 25143Ages 20 - 29121 26147Ages 30 - 3990 35125Ages 40 - 4946 1258Ages 50 - 5911 516Ages 60 and Over
511 406 105
Male Female
Total 511 406 105AEP
ANG
N WESTERN COMM COLLEGEAIR NATIONAL GUARD
IRC
Total Male FemaleAge Group22Ages 16 - 1711Unknown55Ages 30 - 3944Ages 40 - 4933Ages 50 - 59
15 15ERC
Total Male FemaleAge Group22Ages 40 - 4911Ages 50 - 59
3 3BRC
Total Male FemaleAge Group33Ages 16 - 1717 118Ages 18 - 1954 761Ages 20 - 2922 628Ages 30 - 3930 1242Ages 40 - 4914 1832Ages 50 - 597 29Ages 60 and Over
193 147 46ARC
Total Male FemaleAge Group11Ages 20 - 2944Ages 40 - 4944Ages 50 - 5922Ages 60 and Over
11 11
Male Female
Total 222 176 46ANG
GEW
GATEWAY COMM COLLEGEELI WHITNEY TECH
ERC
Total Male FemaleAge Group11Unknown22Ages 30 - 392 13Ages 40 - 4988Ages 50 - 5922Ages 60 and Over
16 15 1BRC
Total Male FemaleAge Group11Unknown
2 24Ages 16 - 178 19Ages 18 - 19
71 1485Ages 20 - 2930 838Ages 30 - 3928 836Ages 40 - 4911 516Ages 50 - 5977Ages 60 and Over
196 157 39
Male Female
Total 212 172 40GEW

CONREP STUDENTAGE REPORT for 11
GNH
GATEWAY COMM COLLEGEGATEWAY NR. HAVEN CAMPUS
BRC
Total Male FemaleAge Group1 23Unknown4 26Ages 16 - 17
22 628Ages 18 - 19200 54254Ages 20 - 2998 31129Ages 30 - 3984 36120Ages 40 - 4950 2272Ages 50 - 5917 320Ages 60 and Over
632 476 156
Male Female
Total 632 476 156GNH
MCC
MANCHESTER COMM COLLEGEMCC CAMPUS
BRC
Total Male FemaleAge Group5 16Ages 16 - 1710 515Ages 18 - 19
137 32169Ages 20 - 2962 2183Ages 30 - 3924 2448Ages 40 - 4920 828Ages 50 - 596 17Ages 60 and Over
356 264 92
Male Female
Total 356 264 92MCC
MCP
MANCHESTER COMM COLLEGECOMMUTER LOT BUCK HIL
BRC
Total Male FemaleAge Group55Ages 16 - 17
2020Ages 18 - 1961 3091Ages 20 - 2932 1648Ages 30 - 3932 2153Ages 40 - 4918 1028Ages 50 - 593 14Ages 60 and Over
249 171 78
Male Female
Total 249 171 78MCP
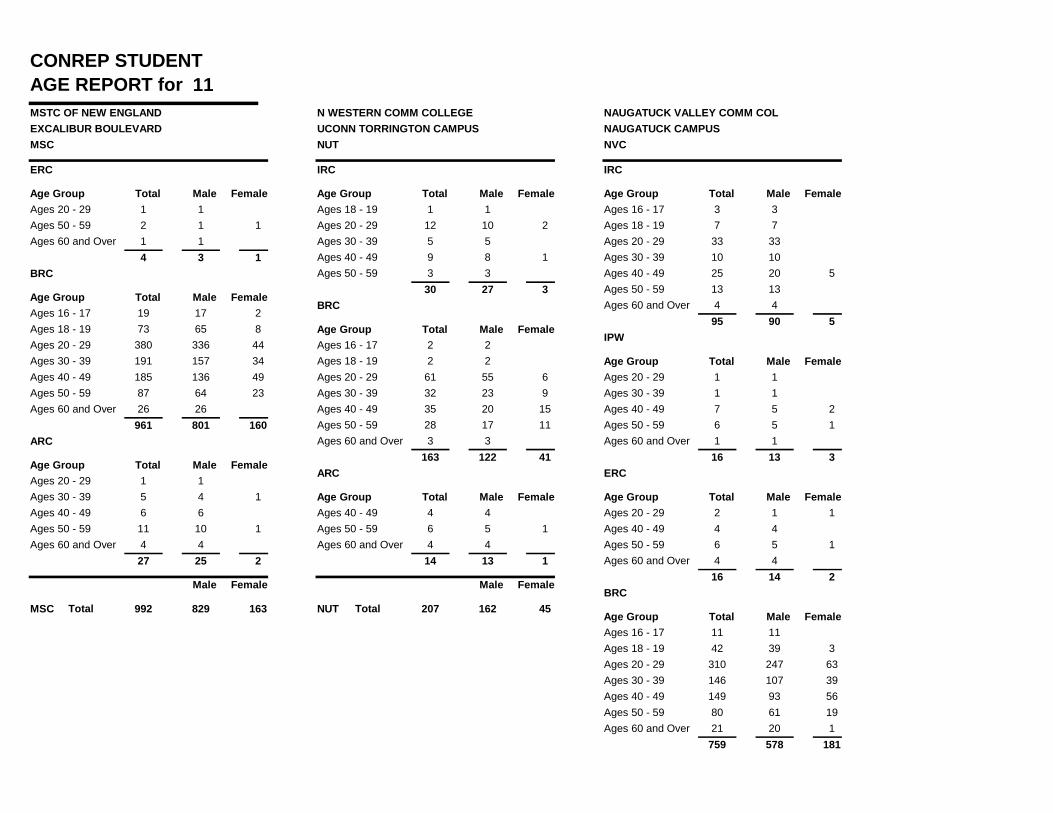
CONREP STUDENTAGE REPORT for 11
MSC
MSTC OF NEW ENGLANDEXCALIBUR BOULEVARD
ERC
Total Male FemaleAge Group11Ages 20 - 291 12Ages 50 - 5911Ages 60 and Over
4 3 1BRC
Total Male FemaleAge Group17 219Ages 16 - 1765 873Ages 18 - 19336 44380Ages 20 - 29157 34191Ages 30 - 39136 49185Ages 40 - 4964 2387Ages 50 - 592626Ages 60 and Over
961 801 160ARC
Total Male FemaleAge Group11Ages 20 - 294 15Ages 30 - 3966Ages 40 - 49
10 111Ages 50 - 5944Ages 60 and Over
27 25 2
Male Female
Total 992 829 163MSC
NUT
N WESTERN COMM COLLEGEUCONN TORRINGTON CAMPUS
IRC
Total Male FemaleAge Group11Ages 18 - 1910 212Ages 20 - 2955Ages 30 - 398 19Ages 40 - 4933Ages 50 - 59
30 27 3BRC
Total Male FemaleAge Group22Ages 16 - 1722Ages 18 - 1955 661Ages 20 - 2923 932Ages 30 - 3920 1535Ages 40 - 4917 1128Ages 50 - 5933Ages 60 and Over
163 122 41ARC
Total Male FemaleAge Group44Ages 40 - 495 16Ages 50 - 5944Ages 60 and Over
14 13 1
Male Female
Total 207 162 45NUT
NVC
NAUGATUCK VALLEY COMM COLNAUGATUCK CAMPUS
IRC
Total Male FemaleAge Group33Ages 16 - 1777Ages 18 - 19
3333Ages 20 - 291010Ages 30 - 3920 525Ages 40 - 491313Ages 50 - 5944Ages 60 and Over
95 90 5IPW
Total Male FemaleAge Group11Ages 20 - 2911Ages 30 - 395 27Ages 40 - 495 16Ages 50 - 5911Ages 60 and Over
16 13 3ERC
Total Male FemaleAge Group1 12Ages 20 - 2944Ages 40 - 495 16Ages 50 - 5944Ages 60 and Over
16 14 2BRC
Total Male FemaleAge Group1111Ages 16 - 1739 342Ages 18 - 19247 63310Ages 20 - 29107 39146Ages 30 - 3993 56149Ages 40 - 4961 1980Ages 50 - 5920 121Ages 60 and Over
759 578 181

CONREP STUDENTAGE REPORT for 11
Male Female
Total 886 695 191NVC QAP
QUINEBAUG VALLEY COLLEGEGROTON AIRPORT
BRC
Total Male FemaleAge Group22Ages 16 - 1711Ages 18 - 1999Unknown11Ages 30 - 3933Ages 40 - 494 26Ages 50 - 59
22 20 2
Male Female
Total 22 20 2QAP
QCL
QUINEBAUG VALLEY COLLEGELAKE HAYWARD RD COMMUTER LOT
BRC
Total Male FemaleAge Group22Ages 16 - 179 211Ages 18 - 19
45 752Ages 20 - 2919 322Ages 30 - 3923 1437Ages 40 - 4910 1020Ages 50 - 5910 111Ages 60 and Over
155 118 37
Male Female
Total 155 118 37QCL

CONREP STUDENTAGE REPORT for 11
QGT
QUINEBAUG VALLEY COLLEGEGRASSO TECH HIGH SCHOOL
IRC
Total Male FemaleAge Group11Ages 18 - 1944Ages 20 - 2933Ages 40 - 4911Ages 50 - 59
9 9BRC
Total Male FemaleAge Group1 12Ages 16 - 175 16Ages 18 - 19
57 1976Ages 20 - 2917 1027Ages 30 - 3919 827Ages 40 - 4921 930Ages 50 - 597 29Ages 60 and Over
177 127 50
Male Female
Total 186 136 50QGT
QKM
QUINEBAUG VALLEY COLLEGEKILLINGLY MEMORIAL SCHOOL
BRC
Total Male FemaleAge Group22Ages 16 - 175 38Ages 18 - 1932 638Ages 20 - 2912 315Ages 30 - 3910 1121Ages 40 - 4914 923Ages 50 - 5944Ages 60 and Over
111 79 32
Male Female
Total 111 79 32QKM
QNO
QUINEBAUG VALLEY COLLEGENORWICH DOT DISTRICT 2
BRC
Total Male FemaleAge Group5 27Ages 18 - 19
27 633Ages 20 - 2913 720Ages 30 - 3915 1025Ages 40 - 4918 321Ages 50 - 591 12Ages 60 and Over
108 79 29
Male Female
Total 108 79 29QNO

CONREP STUDENTAGE REPORT for 11
TFX
TUNXIS COMM-TECH COLLEGEFAIRFIELD COMMUTER LOT
BRC
Total Male FemaleAge Group4 15Ages 16 - 175 16Ages 18 - 19
41 1253Ages 20 - 2929 433Ages 30 - 3931 1344Ages 40 - 4914 620Ages 50 - 5966Ages 60 and Over
167 130 37
Male Female
Total 167 130 37TFX
TXC
TUNXIS COMM-TECH COLLEGETUNXIS CAMPUS
ERC
Total Male FemaleAge Group33Unknown33Ages 20 - 2911Ages 30 - 3910 313Ages 40 - 499 110Ages 50 - 594 15Ages 60 and Over
35 30 5BRC
Total Male FemaleAge Group11Unknown7 29Ages 16 - 1759 1473Ages 18 - 19
317 49366Ages 20 - 29155 42197Ages 30 - 39139 60199Ages 40 - 4976 35111Ages 50 - 5929 736Ages 60 and Over
992 783 209
Male Female
Total 1027 813 214TXC
CONREP STUDENTAGE REPORT for 11
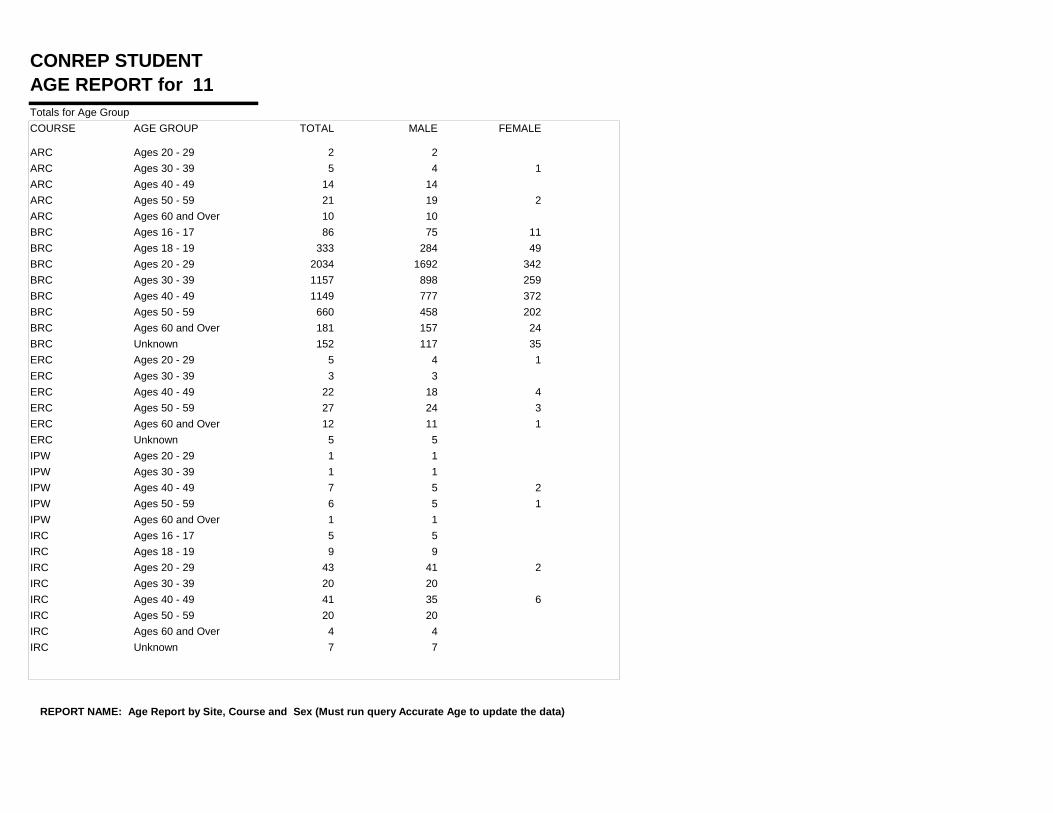
REPORT NAME: Age Report by Site, Course and Sex (Must run query Accurate Age to update the data)
Totals for Age GroupCOURSE AGE GROUP TOTAL MALE FEMALE
Ages 20 - 29 2 2ARCAges 30 - 39 5 4 1ARCAges 40 - 49 14 14ARCAges 50 - 59 21 19 2ARCAges 60 and Over 10 10ARCAges 16 - 17 86 75 11BRCAges 18 - 19 333 284 49BRCAges 20 - 29 2034 1692 342BRCAges 30 - 39 1157 898 259BRCAges 40 - 49 1149 777 372BRCAges 50 - 59 660 458 202BRCAges 60 and Over 181 157 24BRCUnknown 152 117 35BRCAges 20 - 29 5 4 1ERCAges 30 - 39 3 3ERCAges 40 - 49 22 18 4ERCAges 50 - 59 27 24 3ERCAges 60 and Over 12 11 1ERCUnknown 5 5ERCAges 20 - 29 1 1IPWAges 30 - 39 1 1IPWAges 40 - 49 7 5 2IPWAges 50 - 59 6 5 1IPWAges 60 and Over 1 1IPWAges 16 - 17 5 5IRCAges 18 - 19 9 9IRCAges 20 - 29 43 41 2IRCAges 30 - 39 20 20IRCAges 40 - 49 41 35 6IRCAges 50 - 59 20 20IRCAges 60 and Over 4 4IRCUnknown 7 7IRC
SECTION 7
GRAPHICAL DATA
STUDENT NOVICE REGISTRATION
STUDENT EXPERIENCED REGISTRATION
STUDENT REGISTRATION FOR BRC, ERC, IRC, IPW
BASIC RIDER COURSE AGE GROUP
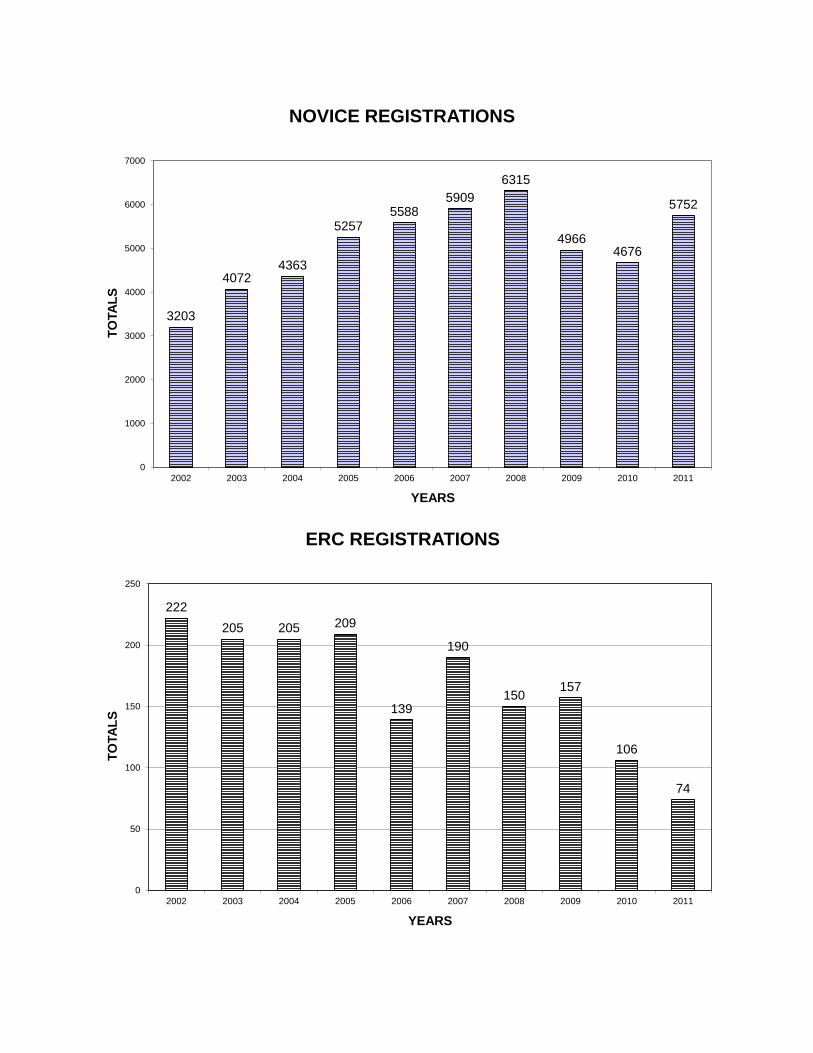
3203
40724363
52575588
59096315
49664676
5752
0
1000
2000
3000
4000
5000
6000
7000
2002 2003 2004 2005 2006 2007 2008 2009 2010 2011
TOTA
LS
YEARS
NOVICE REGISTRATIONS
222205 205 209
139
190
150 157
106
74
0
50
100
150
200
250
2002 2003 2004 2005 2006 2007 2008 2009 2010 2011
TOTA
LS
YEARS
ERC REGISTRATIONS
BRC93.98%
ERC1.72%
IRC2.58%
IPW0.17%
IPA0.00%
ARC1.55%
TOTAL REGISTERED 2011
75
284
1692
898
777
458
157
0
117
11 49
342259
372
202
24 0 350
200
400
600
800
1000
1200
1400
1600
1800
TOTA
LS
AGE GROUP
BASIC RIDER COURSE AGE GROUP 2011
MALE
FEMALE