connecticut is changing.... the economy is red hot. there is money and opportunity
TRANSCRIPT

2020Connecticut is changing...

2020The economy is red hot. There is money and
opportunity...

2020And our workforce for the next 20 years has already
been born.

They are Connecticut’s children and youth.

Will they be ready to become Connecticut’s next generation of workers, parents, inventors, citizens, leaders? ??Will their skills and
accomplishments enable Connecticut to retain its leadership position in The New Economy?

The answers to these questions
are largely up to us.

SCHOOL READINESS AND WORKFORCE READINESS: TWO SIDES OF THE SAME
COIN
Connecticut Voices for Children
Leadership Fairfield 2000
September 2000

“Today, a New Economy is clearly emerging:
It is a knowledge and idea-based economy
where the keys to wealth and job creation
are the extent to which ideas, innovation, and
technology are embedded in all sectors of the economy.”
Source: The State New Economy Index, July 1999

From The State New Economy Index: Benchmarking Economic
Transformation in the States, July 1999:
“For most of the 20th century, the vitality of the US economy was determined by the success
of its major manufacturing industries.”
“Today, information, technology, communications,
and intellectual capital, rather than energy and raw materials, power business.”

The National Governors’ Association Has Identified Five
Key Factors in the “New Economy”
Demand for skills and knowledge in the workforce
Increasing competition at a global scale Progress fueled by technology
Growth driven by innovation, invention and re-invention by small and large businesses
Continual pressure for deregulation
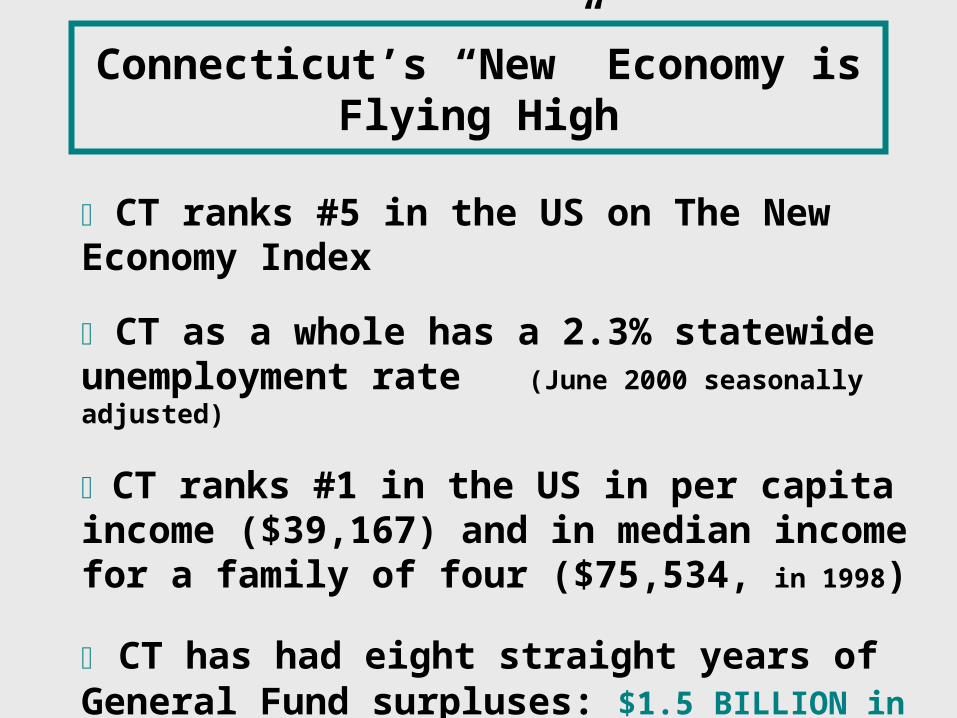
Connecticut’s “New” Economy is Flying High
CT ranks #5 in the US on The New Economy Index
CT as a whole has a 2.3% statewide unemployment rate (June 2000 seasonally adjusted)
CT ranks #1 in the US in per capita income ($39,167) and in median income for a family of four ($75,534, in
1998)
CT has had eight straight years of General Fund surpluses: $1.5 BILLION in the last three years, and over $500 million in FY 1999-2000.

But The Prosperity of Connecticut’s New Economy Has Not Reached All Families
Since 1989, Connecticut has had a 127% increase the in the proportion of poor working families, the greatest in the US. Between 1989 and 1998, our child poverty rate, as measured by the federal poverty level ($16,700 for a family of four), rose from 7% to 12%. Today, 96,000 CT children live at or below the federal poverty level -- 40,000 more than in 1989. 2/3s of CT’s poor children live in families with at least one working parent. Based on eligibility for the Free and Reduced Price Meal Program, 25% of CT’s children are poor, and 2/3 of Connecticut’s school districts have had an increase in this measure of poverty since 1992-3.

CT’s Lower and Middle Income Families Lost Economic Ground Between the Late 80s and Late
90s, and the Gap in “Real” Income
IncreasedIncome Quintile Late '80s Late '90s
% Change
Lowest fifth $23,775 $17,615 -26%Second fifth $45,458 $37,953 -17%Top fifth $148,011 $174,149 18%

Family with one infant and one school age child:(1999$)
2 Working Parents Single Working Parent
Middletown Region -- $ 39,723 $ 34,695
Northeast Region -- $ 40,300 $ 35,320
Waterbury Region -- $ 40,876 $ 35,897
New Haven Region -- $ 41,097 $ 36,166
Stamford-Norwalk -- $ 52,895 $ 48,081
What Annual Income Is Needed in Connecticut for Economic
Self-sufficiency? (OPM CT Self-Sufficiency Standard, 1999)

SOME IMPORTANT CT FAMILY CHANGES
I. More children have working mothers
II. Parents have less time with children
III. Risks to children continue and more are
cared for out of their homes
IV. More children in single parent families
V. Single parents are disproportionately poor
Children with Working Moms
0
20
40
60
80
Under 6 Under 18
Perc
ent
1970 1995
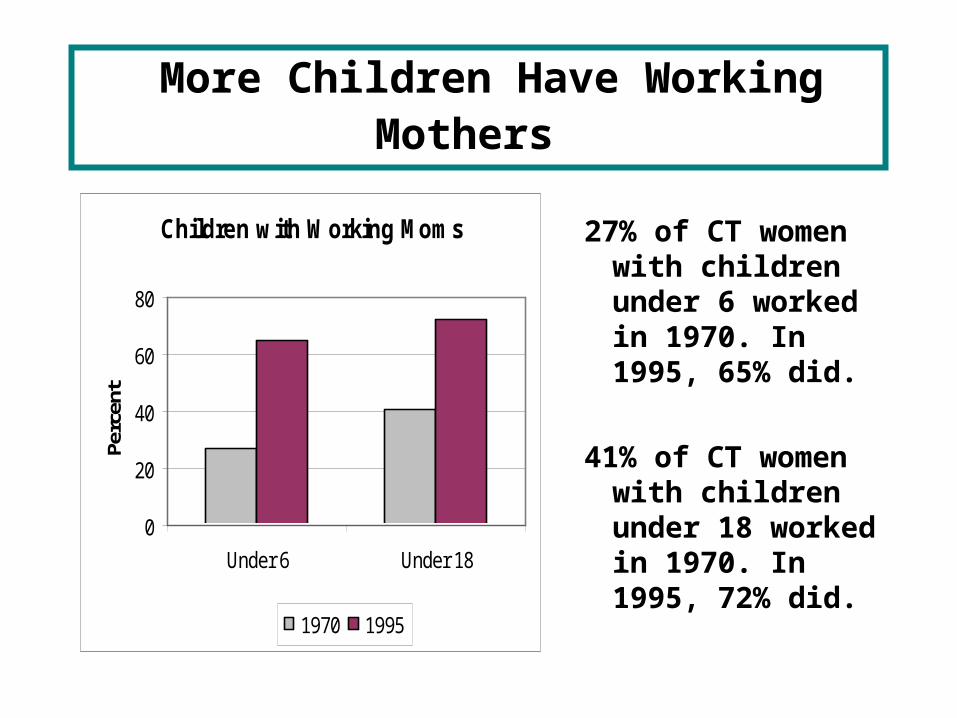
27% of CT women with children under 6 worked in 1970. In 1995, 65% did.
41% of CT women with children under 18 worked in 1970. In 1995, 72% did.
•
More Children Have Working Mothers

In a 1997 study, 70% of all employed parents felt they did not
spend enough time with their children.
Between 1979-1998, the annual work hours of middle class couples with children increased from 3,041
to 3,600 -- nearly 13 extra weeks of work per
year.
•
Parents Have Less Time with Children

From 1970 to 1996, CT families headed by a single parent
increased from 10% to 27%.
It is estimated the 1/2 of US children born in the1980s and in the 1990s will live apart from a
parent before age 18.
More Children Live In Single Parent Families

62% of CT’s “working poor” families are headed by single mothers (as compared to 48%
nationally).
Single CT mothers, with children under age 18, are
17 times more likely to be poor than CT couples
with children the same age.
•
Single Parent Families Are Disproportionately Poor

Abuse/Neglect: In 1994, there were about 7,200
open child abuse/neglect cases at DCF. Now, there are more than 14,000 open
cases.
Out-of-Home Care: The number of children in out-of-home care continues to
grow: from 2,377 in 1994 to 9,980 in 1999.
Risks to Children Continue and More Are Cared for Out of Their
Homes

The National Governors’ Association Has Identified A
Critical “Downside” Of The New Economy
“Job growth in the new economy has become
more polarized (with) high-skill, high-wage,
technical and professional jobs that
tend to be full-time with generous benefits
and low-skill, low-wage, service jobs that are often part time with
few benefits…”

Total Service Jobs Gained: 123,000
Manufacturing Jobs Lost: 99,000
(as of 7/00)
In Connecticut, Service Jobs Have Replaced
Manufacturing Jobs: 1989 - 2000
-80000
-60000
-40000
-20000
0
20000
40000
60000
80000
100000
120000
140000
Manufacturing Services
2/89-12/92 12/92-7/00

The Wages of Many New CT Service Jobs Qualify Employees’ Children for
the School Lunch Program
Average Annual Wages -- Top 10 CT Service Sector Jobs
Added Between 1992-1998
Management and PR $86,189 Amusement & Recreation $21,999
Medical Offices/Clinics $62,333 Personnel Supply Services $22,927 Computer Related $74,802 Misc. Business Services $29,956
Home Health Care $20,260
Nursing/Personal Care $25,760 Residential Care $23,218
Child Day Care $13,675
Source: The CT Economic Digest, December 1999

Why Does This Matter? Because Research Shows That Child
Poverty Has Predictable Negative Outcomes
Health problems--such as low birth weight, asthma and lead poisoning
The risk of growing up in in unsafe home and neighborhood circumstances
Impaired cognitive development
Poor school outcomes

Katherine McFateThe Rockefeller Foundation
“The relationship between income inequality and educational inequality is…at the core of our concern about
the long-term social impacts of inequality.
American education tends to fall short in providing a “good education” for the bottom 20 to 30% of the income
distribution.”
Source: Economic Policy Review (Federal Reserve Bank of NY,
1999)

CT Ranks High Among States on National Educational
Performance Measures
CT ranks #1 on 4th grade reading as well as 8th grade reading and
writing (NAEP)
CT ranks #5 in the nation on combined SAT scores (1019)
CT ranks #7 in the nation on students passing AP exams (71%)

Yet Significant Educational Performance Disparities Exist
Across Our Communities
Students in ERG A -- as compared to ERG I -- are:
2x more likely to attend preschool
5x more likely to pass the CMT at Grade 4
7x more likely to pass the CMT at Grade 8
12x more likely to pass the CAPT in 10th grade
14x more likely NOT to drop out of high school
Source: Strategic School Profiles, CT Department of Education, 1998-99
Source: KIDS Count Data Book, 1999
The Annie E. Casey Foundation

In CT, Higher Education Equals Higher Income
Educational Level Median Salary No HS Degree $14,920 HS Degree $21,680 Associate’s Degree $29,749 Bachelor’s Degree $40,695 Master’s Degree $52,771 Professional/Doctoral Degree $93,714
Source: US Census, 1997
Source: KIDS Count Data Book, 1999
The Annie E. Casey Foundation

Post-Secondary Education Is A Defensive Necessity In
Connecticut’s The New EconomyChange in real hourly wages: 1979-1999 (1999$)
Economic Policy Institute analysis of US Labor Department data
-23.7
-8.9
-3.7
13
18.9
-30
-25
-20
-15
-10
-5
0
5
10
15
20
25
Less Than HighSchool
High School/GED Some College College Degree Advanced Degree
% C
han
ge
in R
eal
Wag
es

Connecticut’s 1998-99 cumulative drop out rate was 14.3%.
Source: Strategic School Profiles, 1999
Yet, CT’s Cumulative High School Drop Out Rates
Are Too High
2.66
21
36.2
0
5
10
15
20
25
30
35
40
ERG A ERG B ERG H ERG I
Perc
ent

Finally, Many CT Families Are Caught
in The Digital Divide
Unequal access to electronic information and services, and
technology by:
RaceIncome
Geography and CommunityGender
Age

Why Does This Matter? Because of the Critical Role of Technology in The New
EconomyThe number of US households connected to the Internet will increase from 44.4 million
in 2000 to 60 million in 2004.
In 1998, Internet business transactions were valued at $43 billion. By 2003, IT
business transactions are expected to reach $1.3 trillion.
In 1999, American consumers spent $20 billion online. In 2004, they will spend an
estimated $184 billion, an increase of 900%.
By 2006, 49% of all private sector employees will work in industries that
produce or are heavy users of IT equipment or services.

Connecticut ranks #42 out of all states in the infusion of technology in its K-12
public schools.
CT ranks among the bottom ten on school-based “technology
sophistication”, along with Louisiana, Mississippi, and Arkansas.
On Technology Measures, CT’s Public Schools Rank
Poorly Against Those In Other States

And Children in Poorer Families have Less Home Access
to Computers and the Internet
0
20
40
60
80
100
Per
cent Computers
Internet

“It will take political will and imaginative policies in education, economic development, and social safety nets to harness the potential of the new technologies to reverse the trend of rising inequality.” Laura Tyson, Haas School of Business, Business Week, January 10, 2000
“If states do not respond to these challenges and create the right environment for businesses and workers to succeed, they will lose the human and physical capital that powers economic growth.” National Governors’ Association, 1999

What Does This All Mean In Fairfield
County?

Fairfield County Districts By Highest and Lowest ERG
ERG A ERG B ERG H ERG I
Darien Bethel Danbury Bridgeport
Easton Brookfield Norwalk
New Canaan Fairfield Stamford
Redding Greenwich
Ridgefield Monroe
Weston New Fairfield
Westport Newtown
Wilton Trumbull

1998 Per Capita Income By Town and ERG
Darien 107,225 Bethel 41,118 Danbury 39,048 Bridgeport 21,581Easton 68,941 Brookfield 49,556 Norwalk 46,332N. Canaan 108,008 Fairfield 54,172 Stamford 54,894Redding 76,816 Greenwich 95,634Ridgefield 70,316 Monroe 42,702Weston 101,386 N. Fairfield 47,505Westport 94,023 Newtown 45,625Wilton 84,035 Trumbull 50,976

Darien 84 Bethel 54 Danbury 36 Bridgeport 6Easton 76 Brookfield 63 Norwalk 29New Canaan 84 Fairfield 61 Stamford 32Redding 67 Greenwich 63Ridgefield 79 Monroe 58Weston 93 New Fairfield 51Westport 79 Newtown 63Wilton 84 Trumbull 67
1997-98 % of Children Whose Parents Have At
Least a Bachelor’s Degree By Town and ERG

Darien 99 Bethel 71 Danbury 62 Bridgeport 57Easton 96 Brookfield 88 Norwalk 78New Canaan 99 Fairfield 94 Stamford 72Redding 86 Greenwich 92Ridgefield 88 Monroe 97Weston 100 New Fairfield 71Westport 100 Newtown 84Wilton 98 Trumbull 85
1997-98 % of Kindergartners Who Attended Formal
Preschool By Town and ERG (state average =72%)

Darien 80 Bethel 56 Danbury 43 Bridgeport 19Easton 73 Brookfield 69 Norwalk 47New Canaan 79 Fairfield 69 Stamford 47Redding 54 Greenwich 77Ridgefield 70 Monroe 77Weston 77 New Fairfield 68Westport 78 Newtown 72Wilton 84 Trumbull 75
1998 % of 4th Graders Who Passed the CMT State Goal
in Reading By Town and ERG

School enrollment 1998-99 by Town and ERG
Darien 3526 Bethel 3259 Danbury 8984 Bridgeport 23027Easton 1271 Brookfield 2810 Norwalk 10762N Canaan 3417 Fairfield 7643 Stamford 14762Redding 1637 Greenwich 8038Ridgefield 4667 Monroe 3806Weston 2125 N Fairfield 2814Westport 4362 Newtown 4612Wilton 3726 Trumbull 5879Totals 24861 38861 34508 23027

There is now only one CT child for every three CT adults. We have no children to waste... Connecticut
’s workforce for the next 20 years has already been born.

School Readiness Policy Issues
I. Kids must be “ready” for school
--Connecticut’s children need stable, caring, functionally literate adults in their lives while they are young and the opportunity for learning-based preschool experiences so they start school ready to learn
--They also need economically secure, safe and healthy home and neighborhood environments while they are in school, so they arrive ready to learn each day
Source: KIDS Count Data Book, 1999
The Annie E. Casey Foundation

School Readiness Policy Issues
II. Schools must be “ready” for kids
--Schools must be appropriately staffed and resourced, including with technology. And schools must be safe places open for activity through afternoon hours
--Schools need strong formal partnerships with parents, other agencies serving kids and families, and with the business community
--Schools need to address, through curriculum and enrichment activities, the varied learning backgrounds, experiences and styles of today’s young people
Source: KIDS Count Data Book, 1999
The Annie E. Casey Foundation

Some Questions to Frame A School and Workforce Readiness
ACTION Agenda For The Connecticut Business Community
I. Start Early
1. Do your business practices promote parental involvement among your employees when their kids are young?
2. Are you willing to advocate for learning-based preschool opportunities for all kids in your community and our state

Some Questions to Frame A School and Workforce Readiness
ACTION Agenda For The Connecticut Business Community
II. Expect Public Accomplishment By All of CT’s Kids
1. Does your business or organization expect CT’s youngsters to be able to read at grade level by 4th grade and to be technologically competent by 6th grade?
2. Will your organization participate in creation of real opportunities for young people, beginning in middle school, to learn about and experience a wide range of work and career options?
3. Will you use your considerable power of persuasion to support changes in policy, program and resources to accomplish this?
Source: KIDS Count Data Book, 1999
The Annie E. Casey Foundation

Some Questions to Frame A School and Workforce Readiness
ACTION Agenda For The Connecticut Business Community
III. Don’t Accept Less than High School Completion
1. Will your business or organization work to continue and expand opportunities, linked to career and work opportunities, that encourage and incentive school completion?
2. Will you support the expansion of need-based aid for higher education for CT’s future college students?

Some Questions to Frame A School and Workforce Readiness
ACTION Agenda For The Connecticut Business Community
IV. Focus on Parents and Their Learning Too
1. Does your business have resources that can assist parents to re-invent their skills and competence appropriate to economic requirements and opportunities in The New Economy?
2. Can your business offer media and marketing help to send the message about the importance of lifelong learning and skills re-invention?
Source: KIDS Count Data Book, 1999
The Annie E. Casey Foundation

2020Connecticut’s workforce for the next 20 years has already been born. What
happens next is largely up to us...
For more information or for a copy
that you can use: contact
CT Voices for Children
203.498.4240
Janice Gruendel, Ph.D. -- [email protected]
Shelley Geballe, JD, MPH --
www.ctkidslink.org