connecticut 2015 annual air monitoring plan · connecticut 2015 annual air monitoring network ......
TRANSCRIPT
Connecticut 2015 Annual Air Monitoring Network Plan
Connecticut Department of Energy and Environmental Protection
Bureau of Air Management June 22, 2015
The Department of Energy and Environmental Protection (DEEP) is an affirmative action/equal opportunity employer and service provider. In conformance with the Americans with Disabilities Act, DEEP makes every effort to provide equally effective services for persons with disabilities. Individuals with disabilities who need this information in an alternative format, to allow them to benefit and/or participate in the agency’s programs and services, should call 860-424-3035 or e-mail the ADA Coordinator, at [email protected]. Persons who are hearing impaired should call the State of Connecticut relay number 711.
Connecticut 2015 Annual Air Monitoring Network Plan 2
Table of Contents Table of Contents ......................................................................................................................... 2 Introduction ................................................................................................................................ 4 Background ................................................................................................................................. 4 Network Overview ........................................................................................................................ 4 Proposed Network Changes ........................................................................................................... 5 Monitoring Site Information ........................................................................................................... 7 National Ambient Air Quality Standards (NAAQS) ............................................................................. 8
PM2.5 Annual Design Values (2014) ............................................................................................. 9 PM2.5 Daily Design Values (2014) ................................................................................................ 9 Ozone Design Values (2014) ..................................................................................................... 10 CO, SO2, NO2, PM10 and Pb NAAQS Comparisons (2014) ............................................................... 10
Overview of Network Operation ..................................................................................................... 12 PM2.5 Network ......................................................................................................................... 12 PM10/PM10-2.5 FRM Network........................................................................................................ 15 PM Speciation Network ............................................................................................................. 15 Ozone Network ....................................................................................................................... 16 PAMS Network ........................................................................................................................ 16 NO2 Network ........................................................................................................................... 17 CO Network ............................................................................................................................ 17 SO2 Network ........................................................................................................................... 18 Lead (Pb) Network ................................................................................................................... 18
Detailed Site Information ............................................................................................................. 20 References ................................................................................................................................. 36 Appendix A PM2.5 FRM vs Continuous Correlation Charts .......................................................... A-1 Appendix B Public Comments Received With DEEP Responses ................................................... B-1 Figure 1: Connecticut DEEP Air Monitoring Network .......................................................................... 5 Figure 2: CT PM2.5 FEM Comparison with EPA Performance Standards (2012-2013 data)..................... 14 Figure 3: Pb-PM10 Monitored Levels, 2010-2014 ............................................................................. 19 Table 1: Monitoring Network Summary ........................................................................................... 7 Table 2: National Ambient Air Quality Standards .............................................................................. 8 Table 3:PM2.5 FRM/FEM Current Network Summary ........................................................................ 12 Table 4: CT PM2.5 FEM Performance Criteria Evaluation Summary (2012-2014 Data) .......................... 13 Table 5: Proposed PM2.5 Network Configuration ............................................................................. 14
Connecticut 2015 Annual Air Monitoring Network Plan 3
Acronyms and Abbreviations AQI – Air Quality Index AQS – Air Quality System BAM – Beta Attenuation Monitor BC – Black Carbon (Aethalometer) CAA – Clean Air Act CFR – Code of Federal Regulations CO – carbon monoxide CSA – combined statistical area CSN – Chemical Speciation Network DEEP – Connecticut Department of Energy and Environmental Protection DAS – data acquisition system EC/OC – Elemental Carbon/Organic Carbon EPA – Environmental Protection Agency FEM – Federal Equivalent Method FRM – Federal Reference Method GC – gas chromatography GC/MS – gas chromatography/mass spectrometry HAP – hazardous air pollutant IMPROVE – Interagency Monitoring of Protected Visual Environments LMP – limited maintenance plan MPA – monitoring planning area MSA – metropolitan statistical area NAAQS – National Ambient Air Quality Standards NOAA – National Oceanic and Atmospheric Administration NOx – nitrogen oxides NOy – reactive oxides of nitrogen OAQPS – Office of Air Quality Planning and Standards PAMS – Photochemical Assessment Monitoring Stations PM2.5 – fine particulate matter (<2.5 microns) PM10 – respirable particulate matter (<10 microns) PM10-2.5 – coarse particulate matter (PM10 – PM2.5) QA – quality assurance QA/QC – quality assurance/quality control QAPP – quality assurance project plan QMP – quality management plan RH – relative humidity SIP – State Implementation Plan SLAMS – state and local monitoring stations SO2 – sulfur dioxide SOP – standard operating procedure TSA – technical system audit TSP – total suspended particulate UVC – Ultra-violet carbon (aethalometer) VOC – volatile organic compound
Connecticut 2015 Annual Air Monitoring Network Plan 4
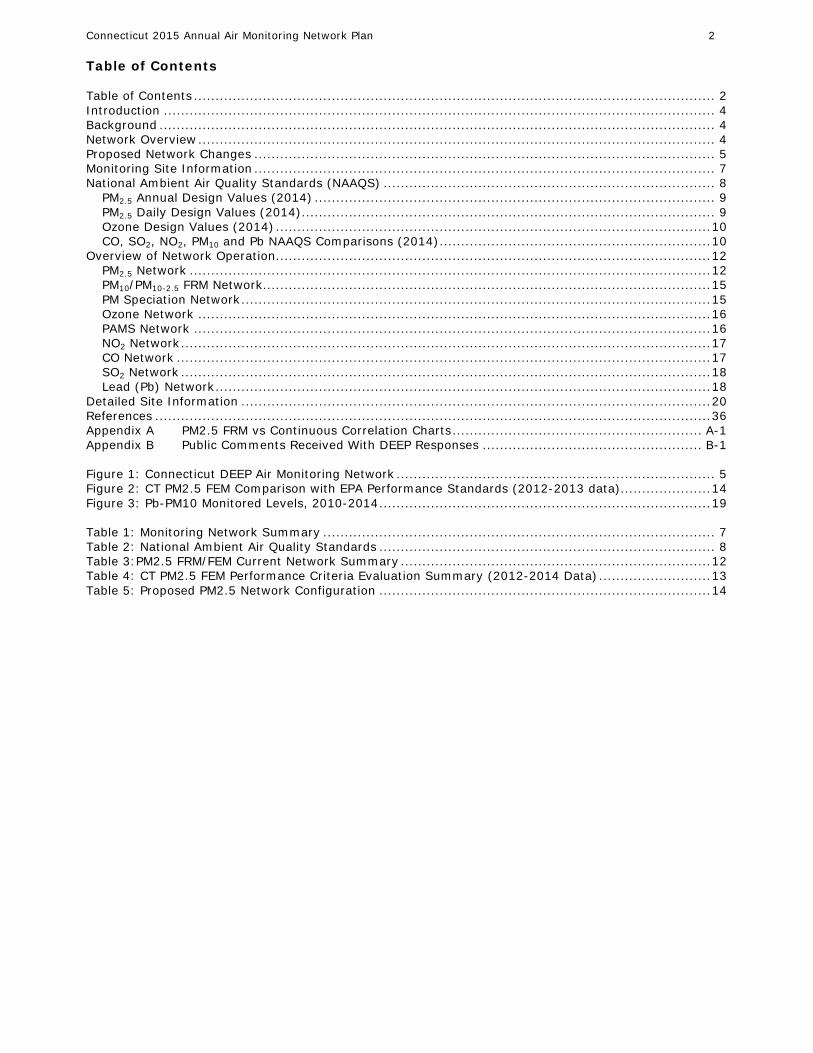
Introduction This document is the Connecticut 2015 Air Monitoring Network Plan (Network Plan), prepared by the Connecticut Department of Energy and Environmental Protection (DEEP) in accordance with 40 CFR 58.10. This plan meets the requirement to develop and submit to the Environmental Protection Agency (EPA) an annual air quality monitoring network plan to describe the air monitoring network and propose any changes of air quality monitoring sites and monitored air pollutants planned in the 18 months following submittal. DEEP held a public comment period from May 15, 2015 to June 14, 2015, for the draft Network Plan. The Network Plan is posted on DEEP’s website at DEEP: Air Monitoring Network. Background The Clean Air Act of 1970 (CAA) established the Environmental Protection Agency as the principal administrative body to enact regulations to meet the requirements of the CAA and subsequent amendments thereto. One such requirement directed EPA to set primary and secondary air quality standards, known as the National Ambient Air Quality Standards (NAAQS) for the six “criteria pollutants” that Congress determined presented serious negative impacts to human health and welfare. For areas within Connecticut that do not meet a NAAQS, DEEP develops State Implementation Plans (SIPs) to detail the steps to be taken to bring air quality into attainment. Ambient air quality monitoring is essential to track progress towards meeting clean air goals and demonstrate attainment. While DEEP monitors ambient air quality in Connecticut primarily for comparison with the NAAQS, there are other important objectives to ambient air quality monitoring. This monitoring provides local air quality data to the public, supports air quality forecasting and the Air Quality Index (AQI), supports long-term health assessments and other scientific research, assists with air permitting and identifying long-term air quality trends to gauge effectiveness of air pollution control strategies and serves as an accuracy check on computer based air quality models. DEEP’s ability to manage the air quality monitoring network depends significantly on federal support from EPA. Future federal funding levels for air monitoring programs remain uncertain. In addition, as with state governmental operations everywhere, state resources allocated to ambient air quality monitoring are unable to keep pace with rising costs. DEEP must continue to provide an acceptable level of service within these constraints by continually improving and focusing its efforts to ensure the completion of the most critical ambient air quality monitoring. As operating costs and federal monitoring requirements increase, DEEP must do more with fewer resources by either improving operational efficiencies or reducing other aspects of the air monitoring network. Efficiencies being employed include improvements to data acquisition (through software upgrades and the automating of data streams previously manual), to public data access (thorough Kiosks and improvements to the website), and to reduction of the number of monitoring sites by increasing multi-pollutant monitoring (resulting in consolidation of resources). Network Overview DEEP currently operates 15 stations in its air monitoring network (Figure 1). Given continuously evolving standards, this Plan assumes the current level of staffing and federal funding will be maintained through federal FY15. Should EPA monitoring requirements significantly increase or should DEEP be impacted by staff attrition or a reduction in federal funding, the level of effort proposed in this Plan will have to be revisited. In October 2006, EPA established a network of core multi-pollutant sites. These sites are known as the National Core (NCore) network, the primary purpose of which is to consolidate monitoring of multiple pollutants at fewer sites for efficiency and cost savings. In addition, the NCore sites provide a comprehensive suite of high-resolution pollutant data for NAAQS compliance assessment, research studies and long-term trends analysis. There are two NCore sites located in Connecticut: Criscuolo Park in New Haven, and Mohawk Mountain in Cornwall. Although these sites predated NCore, DEEP upgraded both sites consistent with NCore requirements.
Connecticut 2015 Annual Air Monitoring Network Plan 5
Figure 1: Connecticut DEEP Air Monitoring Network
Proposed Network Changes Details of the proposed monitoring network configuration are described in the following site information pages. In addition to infrastructure maintenance and improvements, DEEP proposes to make the following changes to the monitoring network during the period 2015-2016:
• Discontinuing Pb-PM10 (lead) sampling at the New Haven Criscuolo Park NCore site on September 30, 2015 (end of EPA fiscal year).
• Commencing reporting of continuous PM2.5 data from all remaining non-FEM continuous PM2.5 monitoring sites as federal equivalent method (FEM) data eligible for comparison to the PM2.5 NAAQS on January 1, 2016.
• Discontinuing FRM PM2.5 monitoring at the Westport Sherwood Island State Park site on December 31, 2015.
• Reducing sampling frequencies to one-in-six days for PM2.5 FRM monitors at Bridgeport Roosevelt School, Danbury WCSU, East Hartford McAuliffe Park and Waterbury Bank Street on January 1, 2016.
• Reducing sampling frequency from every day to one-in-three days for the PM2.5 FRM monitor at New Haven Criscuolo Park on January 1, 2016.
• Discontinuing PAMS VOC and NO/NO2/NOX monitoring at the Westport Sherwood Island State Park as of January 1, 2015.
DEEP maintains its air monitoring network to fulfill critical data needs. Recent EPA NAAQS rule revisions have mandated additional monitoring, reporting and analysis associated with the SLAMS networks, and, consistent with the LEAN culture embraced by DEEP, this Network Plan calls for continued efforts to streamline data handling, while also looking for opportunities to identify and address low value added monitoring sites. If limited opportunities exist to disinvest from low value added monitoring sites, efficiencies nonetheless will occur by eliminating lower value data collection. Such efficiencies will be

Connecticut 2015 Annual Air Monitoring Network Plan 6
necessary to enable limited staff resources to focus on competing priorities, which may not be limited to air quality monitoring. If efficiencies alone are insufficient, either additional resources will be required or the scope of the monitoring program will need to be revisited. Decommissioning Discontinued Sites:
DEEP is planning to take steps to ensure that all former monitoring sites are properly decommissioned with regard to shelter, landscaping, security, monitoring, electronics and utility equipment during 2015-2016.
Connecticut 2015 Annual Air Monitoring Network Plan 7
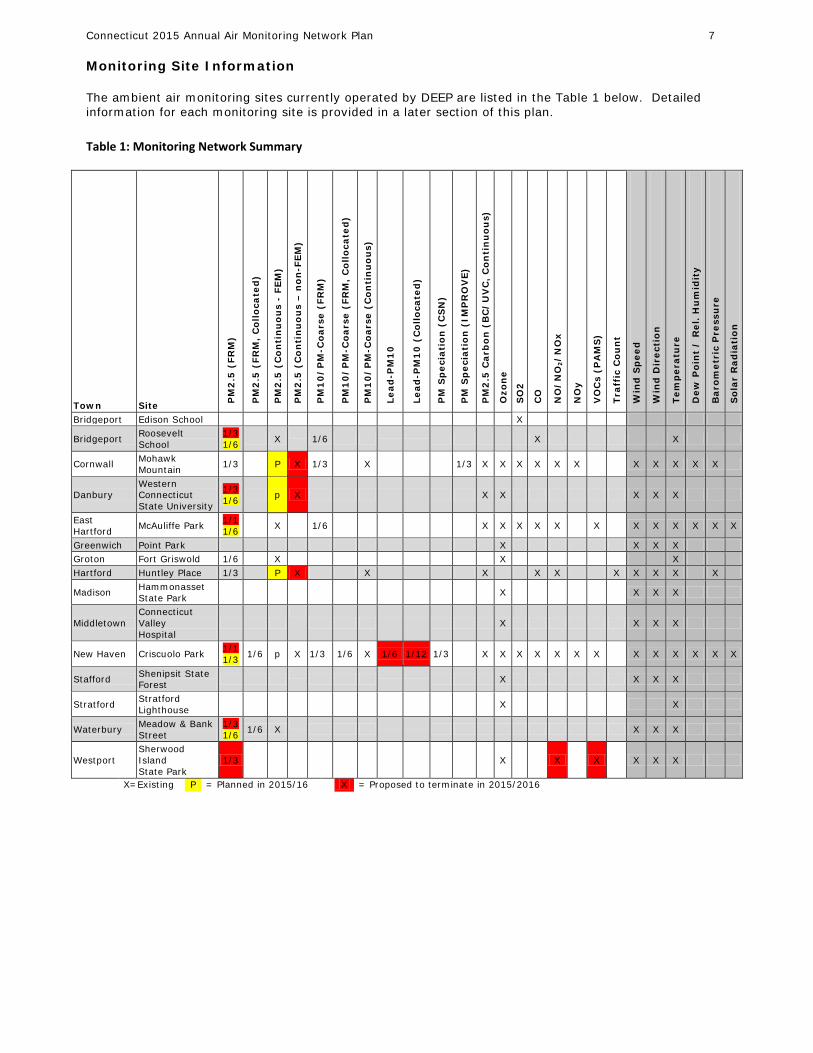
Monitoring Site Information The ambient air monitoring sites currently operated by DEEP are listed in the Table 1 below. Detailed information for each monitoring site is provided in a later section of this plan.
Table 1: Monitoring Network Summary
Town Site PM
2.5
(FR
M)
PM
2.5
(FR
M,
Co
llo
cate
d)
PM
2.5
(C
on
tin
uo
us
- FE
M)
PM
2.5
(C
on
tin
uo
us
– n
on
-FE
M)
PM
10
/P
M-C
oar
se (
FRM
)
PM
10
/P
M-C
oar
se (
FRM
, C
oll
oca
ted
)
PM
10
/P
M-C
oar
se (
Co
nti
nu
ou
s)
Lead
-PM
10
Lead
-PM
10
(C
oll
oca
ted
)
PM
Sp
ecia
tio
n (
CS
N)
PM
Sp
ecia
tio
n (
IMP
RO
VE
)
PM
2.5
Car
bo
n (
BC
/U
VC
, C
on
tin
uo
us)
Ozo
ne
SO
2
CO
NO
/N
O2/
NO
x
NO
y
VO
Cs
(PA
MS
)
Tra
ffic
Co
un
t
Win
d S
pee
d
Win
d D
irec
tio
n
Tem
per
atu
re
Dew
Po
int
/ R
el.
Hu
mid
ity
Bar
om
etri
c P
ress
ure
So
lar
Rad
iati
on
Bridgeport Edison School X
Bridgeport Roosevelt School
1/3 1/6 X 1/6 X X
Cornwall Mohawk Mountain 1/3 P X 1/3 X 1/3 X X X X X X X X X X X
Danbury Western Connecticut State University
1/3 1/6 p X
X X X X X
East Hartford McAuliffe Park 1/1
1/6 X 1/6 X X X X X X X X X X X X
Greenwich Point Park X X X X Groton Fort Griswold 1/6 X X X Hartford Huntley Place 1/3 P X X X X X X X X X X
Madison Hammonasset State Park X X X X
Middletown Connecticut Valley Hospital
X X X X
New Haven Criscuolo Park 1/1 1/3 1/6 p X 1/3 1/6 X 1/6 1/12 1/3 X X X X X X X X X X X X X
Stafford Shenipsit State Forest X X X X
Stratford Stratford Lighthouse X X
Waterbury Meadow & Bank Street
1/3 1/6 1/6 X X X X
Westport Sherwood Island State Park
1/3
X X X X X X
X=Existing P = Planned in 2015/16 X = Proposed to terminate in 2015/2016
Connecticut 2015 Annual Air Monitoring Network Plan 8
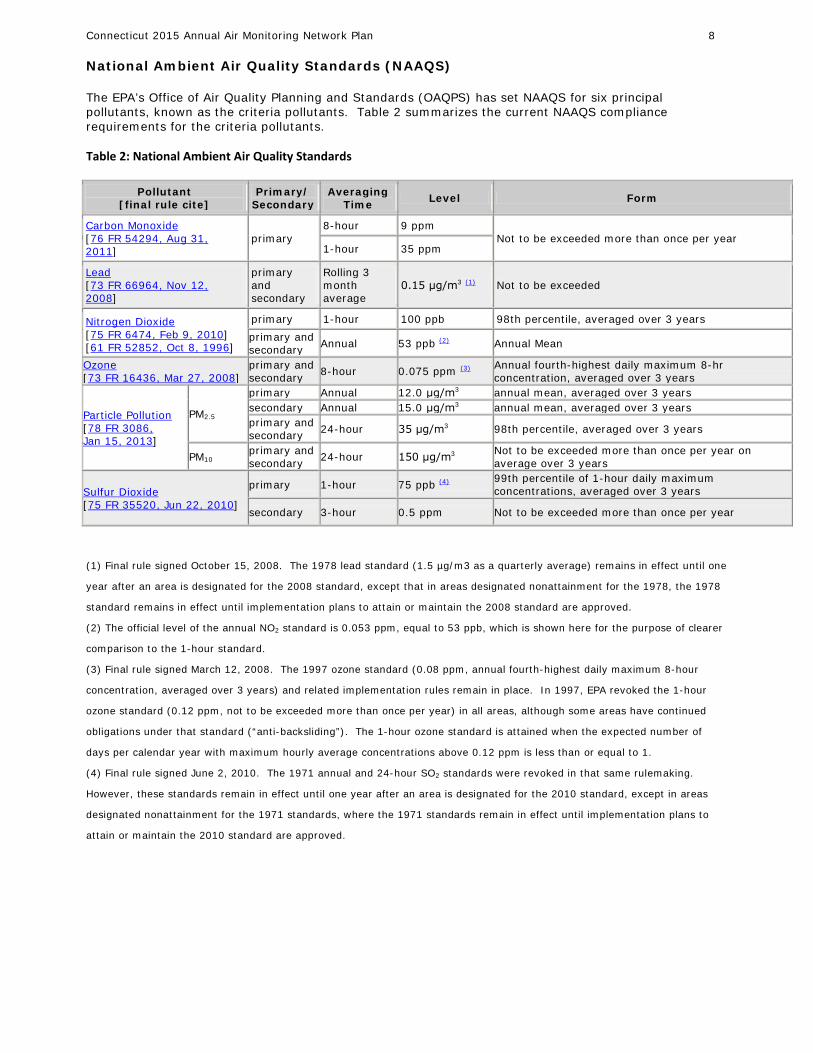
National Ambient Air Quality Standards (NAAQS) The EPA’s Office of Air Quality Planning and Standards (OAQPS) has set NAAQS for six principal pollutants, known as the criteria pollutants. Table 2 summarizes the current NAAQS compliance requirements for the criteria pollutants.
Table 2: National Ambient Air Quality Standards
Pollutant [final rule cite]
Primary/ Secondary
Averaging Time Level Form
Carbon Monoxide [76 FR 54294, Aug 31, 2011]
primary 8-hour 9 ppm
Not to be exceeded more than once per year 1-hour 35 ppm
Lead [73 FR 66964, Nov 12, 2008]
primary and secondary
Rolling 3 month average
0.15 μg/m3 (1) Not to be exceeded
Nitrogen Dioxide [75 FR 6474, Feb 9, 2010] [61 FR 52852, Oct 8, 1996]
primary 1-hour 100 ppb 98th percentile, averaged over 3 years
primary and secondary Annual 53 ppb (2) Annual Mean
Ozone [73 FR 16436, Mar 27, 2008]
primary and secondary 8-hour 0.075 ppm (3) Annual fourth-highest daily maximum 8-hr
concentration, averaged over 3 years
Particle Pollution [78 FR 3086, Jan 15, 2013]
PM2.5
primary Annual 12.0 μg/m3 annual mean, averaged over 3 years secondary Annual 15.0 μg/m3 annual mean, averaged over 3 years primary and secondary 24-hour 35 μg/m3 98th percentile, averaged over 3 years
PM10 primary and secondary 24-hour 150 μg/m3 Not to be exceeded more than once per year on
average over 3 years
Sulfur Dioxide [75 FR 35520, Jun 22, 2010]
primary 1-hour 75 ppb (4) 99th percentile of 1-hour daily maximum concentrations, averaged over 3 years
secondary 3-hour 0.5 ppm Not to be exceeded more than once per year
(1) Final rule signed October 15, 2008. The 1978 lead standard (1.5 µg/m3 as a quarterly average) remains in effect until one
year after an area is designated for the 2008 standard, except that in areas designated nonattainment for the 1978, the 1978
standard remains in effect until implementation plans to attain or maintain the 2008 standard are approved.
(2) The official level of the annual NO2 standard is 0.053 ppm, equal to 53 ppb, which is shown here for the purpose of clearer
comparison to the 1-hour standard.
(3) Final rule signed March 12, 2008. The 1997 ozone standard (0.08 ppm, annual fourth-highest daily maximum 8-hour
concentration, averaged over 3 years) and related implementation rules remain in place. In 1997, EPA revoked the 1-hour
ozone standard (0.12 ppm, not to be exceeded more than once per year) in all areas, although some areas have continued
obligations under that standard (“anti-backsliding”). The 1-hour ozone standard is attained when the expected number of
days per calendar year with maximum hourly average concentrations above 0.12 ppm is less than or equal to 1.
(4) Final rule signed June 2, 2010. The 1971 annual and 24-hour SO2 standards were revoked in that same rulemaking.
However, these standards remain in effect until one year after an area is designated for the 2010 standard, except in areas
designated nonattainment for the 1971 standards, where the 1971 standards remain in effect until implementation plans to
attain or maintain the 2010 standard are approved.
Connecticut 2015 Annual Air Monitoring Network Plan 9
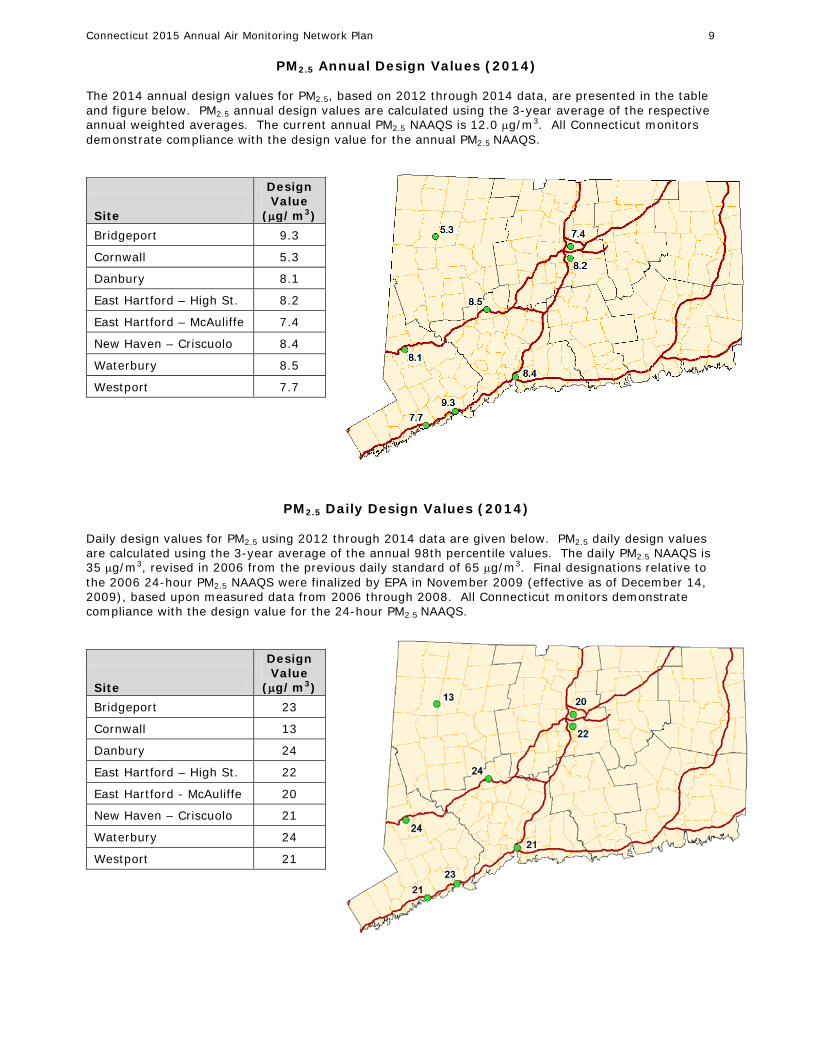
PM2.5 Annual Design Values (2014) The 2014 annual design values for PM2.5, based on 2012 through 2014 data, are presented in the table and figure below. PM2.5 annual design values are calculated using the 3-year average of the respective annual weighted averages. The current annual PM2.5 NAAQS is 12.0 µg/m3. All Connecticut monitors demonstrate compliance with the design value for the annual PM2.5 NAAQS.
Site
Design Value
(µg/m3) Bridgeport 9.3
Cornwall 5.3
Danbury 8.1
East Hartford – High St. 8.2
East Hartford – McAuliffe 7.4
New Haven – Criscuolo 8.4
Waterbury 8.5
Westport 7.7
PM2.5 Daily Design Values (2014) Daily design values for PM2.5 using 2012 through 2014 data are given below. PM2.5 daily design values are calculated using the 3-year average of the annual 98th percentile values. The daily PM2.5 NAAQS is 35 µg/m3, revised in 2006 from the previous daily standard of 65 µg/m3. Final designations relative to the 2006 24-hour PM2.5 NAAQS were finalized by EPA in November 2009 (effective as of December 14, 2009), based upon measured data from 2006 through 2008. All Connecticut monitors demonstrate compliance with the design value for the 24-hour PM2.5 NAAQS.
Site
Design Value
(µg/m3) Bridgeport 23
Cornwall 13
Danbury 24
East Hartford – High St. 22
East Hartford - McAuliffe 20
New Haven – Criscuolo 21
Waterbury 24
Westport 21
Connecticut 2015 Annual Air Monitoring Network Plan 10
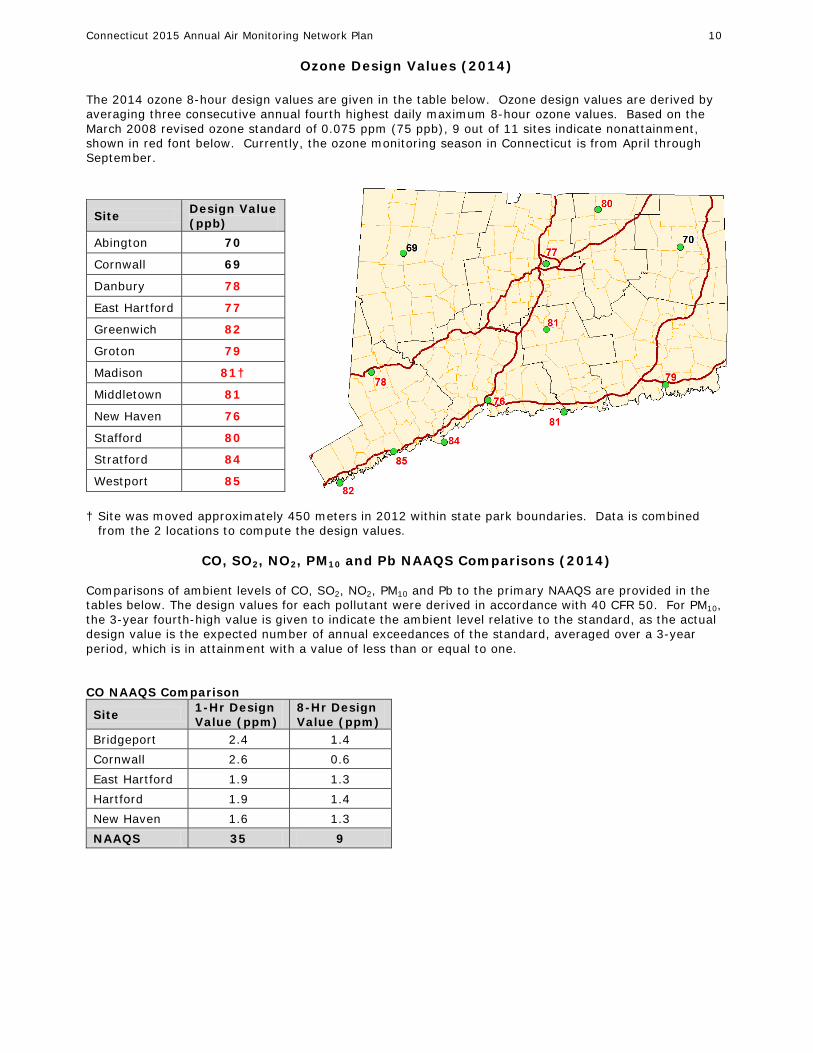
Ozone Design Values (2014) The 2014 ozone 8-hour design values are given in the table below. Ozone design values are derived by averaging three consecutive annual fourth highest daily maximum 8-hour ozone values. Based on the March 2008 revised ozone standard of 0.075 ppm (75 ppb), 9 out of 11 sites indicate nonattainment, shown in red font below. Currently, the ozone monitoring season in Connecticut is from April through September.
Site Design Value (ppb)
Abington 70
Cornwall 69
Danbury 78
East Hartford 77
Greenwich 82
Groton 79
Madison 81†
Middletown 81
New Haven 76
Stafford 80
Stratford 84
Westport 85 † Site was moved approximately 450 meters in 2012 within state park boundaries. Data is combined
from the 2 locations to compute the design values.
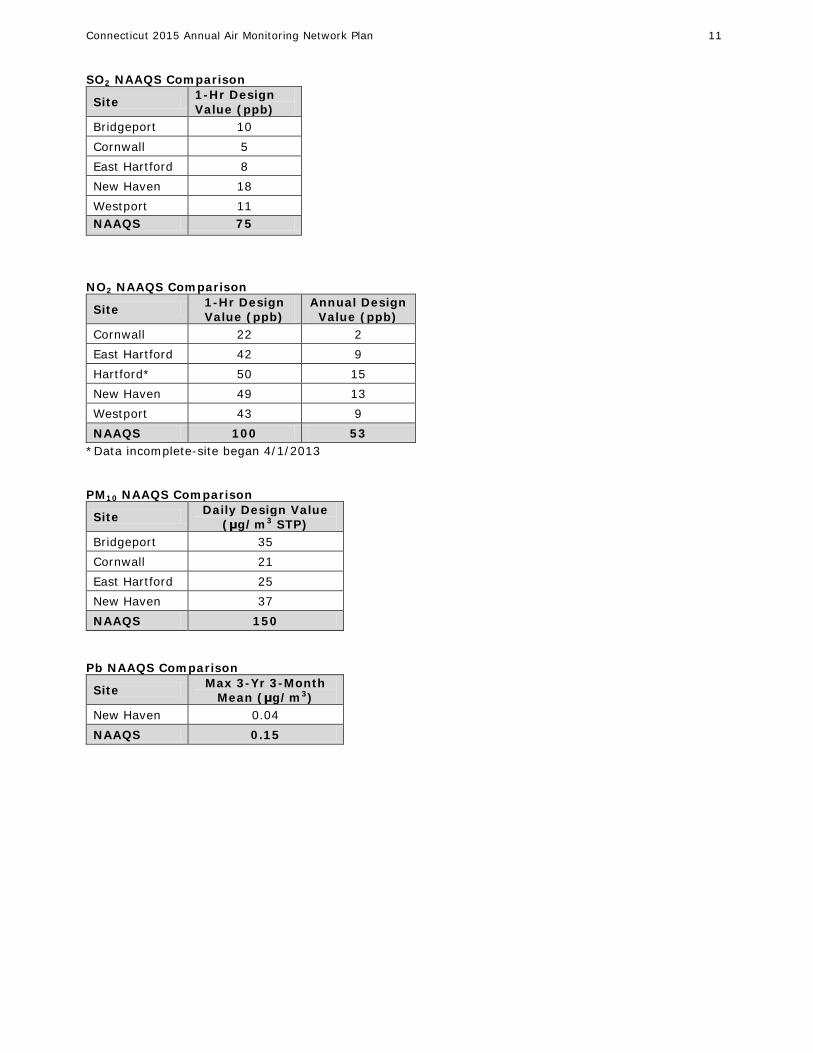
CO, SO2, NO2, PM10 and Pb NAAQS Comparisons (2014) Comparisons of ambient levels of CO, SO2, NO2, PM10 and Pb to the primary NAAQS are provided in the tables below. The design values for each pollutant were derived in accordance with 40 CFR 50. For PM10, the 3-year fourth-high value is given to indicate the ambient level relative to the standard, as the actual design value is the expected number of annual exceedances of the standard, averaged over a 3-year period, which is in attainment with a value of less than or equal to one. CO NAAQS Comparison
Site 1-Hr Design Value (ppm)
8-Hr Design Value (ppm)
Bridgeport 2.4 1.4 Cornwall 2.6 0.6 East Hartford 1.9 1.3 Hartford 1.9 1.4 New Haven 1.6 1.3 NAAQS 35 9
Connecticut 2015 Annual Air Monitoring Network Plan 11
SO2 NAAQS Comparison
Site 1-Hr Design Value (ppb)
Bridgeport 10 Cornwall 5 East Hartford 8 New Haven 18 Westport 11 NAAQS 75
NO2 NAAQS Comparison
Site 1-Hr Design Value (ppb)
Annual Design Value (ppb)
Cornwall 22 2 East Hartford 42 9 Hartford* 50 15 New Haven 49 13 Westport 43 9 NAAQS 100 53
*Data incomplete-site began 4/1/2013 PM10 NAAQS Comparison
Site Daily Design Value (μg/m3 STP)
Bridgeport 35 Cornwall 21 East Hartford 25 New Haven 37 NAAQS 150
Pb NAAQS Comparison
Site Max 3-Yr 3-Month Mean (μg/m3)
New Haven 0.04 NAAQS 0.15
Connecticut 2015 Annual Air Monitoring Network Plan 12
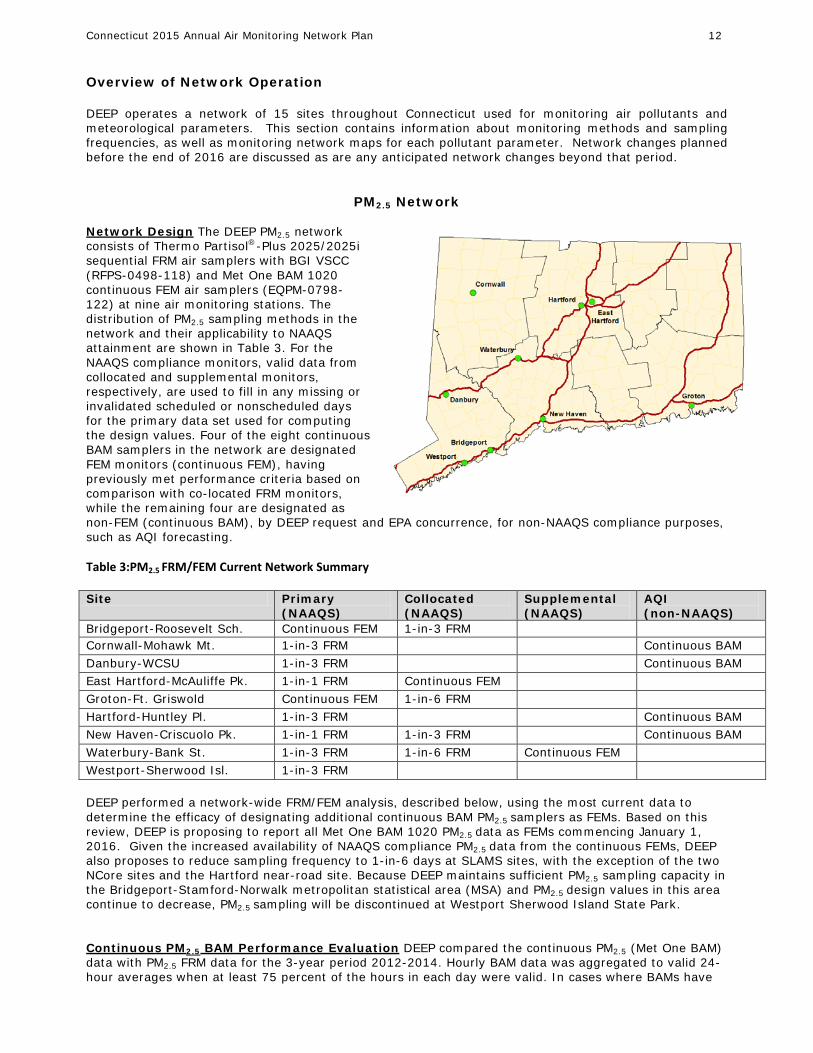
Overview of Network Operation DEEP operates a network of 15 sites throughout Connecticut used for monitoring air pollutants and meteorological parameters. This section contains information about monitoring methods and sampling frequencies, as well as monitoring network maps for each pollutant parameter. Network changes planned before the end of 2016 are discussed as are any anticipated network changes beyond that period.
PM2.5 Network Network Design
The DEEP PM2.5 network consists of Thermo Partisol®-Plus 2025/2025i sequential FRM air samplers with BGI VSCC (RFPS-0498-118) and Met One BAM 1020 continuous FEM air samplers (EQPM-0798-122) at nine air monitoring stations. The distribution of PM2.5 sampling methods in the network and their applicability to NAAQS attainment are shown in Table 3. For the NAAQS compliance monitors, valid data from collocated and supplemental monitors, respectively, are used to fill in any missing or invalidated scheduled or nonscheduled days for the primary data set used for computing the design values. Four of the eight continuous BAM samplers in the network are designated FEM monitors (continuous FEM), having previously met performance criteria based on comparison with co-located FRM monitors, while the remaining four are designated as non-FEM (continuous BAM), by DEEP request and EPA concurrence, for non-NAAQS compliance purposes, such as AQI forecasting.
Table 3:PM2.5 FRM/FEM Current Network Summary
Site Primary (NAAQS)
Collocated (NAAQS)
Supplemental (NAAQS)
AQI (non-NAAQS)
Bridgeport-Roosevelt Sch. Continuous FEM 1-in-3 FRM Cornwall-Mohawk Mt. 1-in-3 FRM Continuous BAM Danbury-WCSU 1-in-3 FRM Continuous BAM East Hartford-McAuliffe Pk. 1-in-1 FRM Continuous FEM Groton-Ft. Griswold Continuous FEM 1-in-6 FRM Hartford-Huntley Pl. 1-in-3 FRM Continuous BAM New Haven-Criscuolo Pk. 1-in-1 FRM 1-in-3 FRM Continuous BAM Waterbury-Bank St. 1-in-3 FRM 1-in-6 FRM Continuous FEM Westport-Sherwood Isl. 1-in-3 FRM DEEP performed a network-wide FRM/FEM analysis, described below, using the most current data to determine the efficacy of designating additional continuous BAM PM2.5 samplers as FEMs. Based on this review, DEEP is proposing to report all Met One BAM 1020 PM2.5 data as FEMs commencing January 1, 2016. Given the increased availability of NAAQS compliance PM2.5 data from the continuous FEMs, DEEP also proposes to reduce sampling frequency to 1-in-6 days at SLAMS sites, with the exception of the two NCore sites and the Hartford near-road site. Because DEEP maintains sufficient PM2.5 sampling capacity in the Bridgeport-Stamford-Norwalk metropolitan statistical area (MSA) and PM2.5 design values in this area continue to decrease, PM2.5 sampling will be discontinued at Westport Sherwood Island State Park. Continuous PM2.5 BAM Performance Evaluation DEEP compared the continuous PM2.5 (Met One BAM) data with PM2.5 FRM data for the 3-year period 2012-2014. Hourly BAM data was aggregated to valid 24-hour averages when at least 75 percent of the hours in each day were valid. In cases where BAMs have
Connecticut 2015 Annual Air Monitoring Network Plan 13
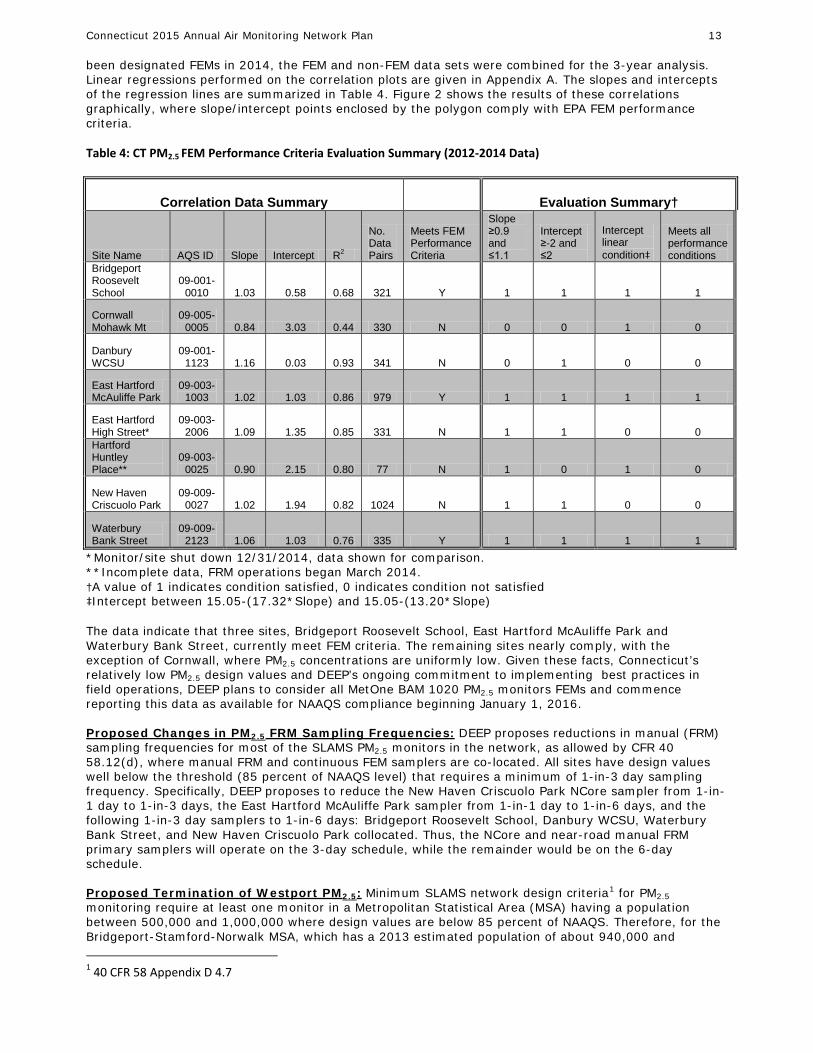
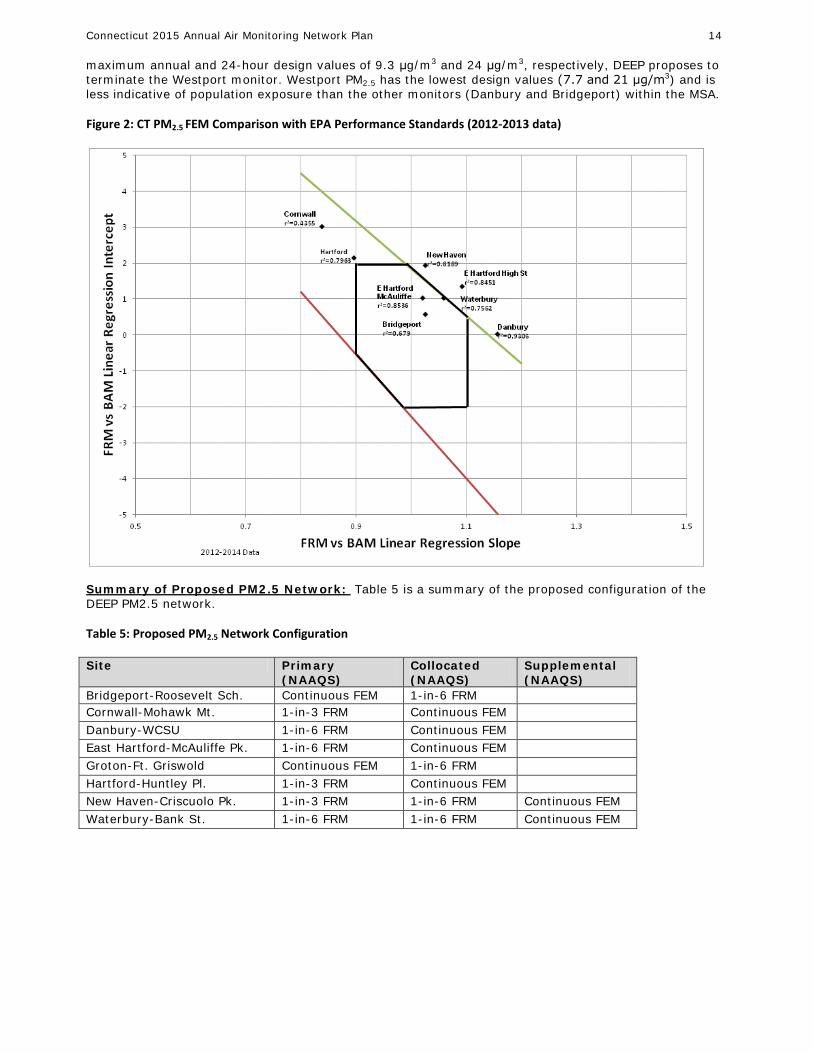
been designated FEMs in 2014, the FEM and non-FEM data sets were combined for the 3-year analysis. Linear regressions performed on the correlation plots are given in Appendix A. The slopes and intercepts of the regression lines are summarized in Table 4. Figure 2 shows the results of these correlations graphically, where slope/intercept points enclosed by the polygon comply with EPA FEM performance criteria. Table 4: CT PM2.5 FEM Performance Criteria Evaluation Summary (2012-2014 Data)
Correlation Data Summary Evaluation Summary†
Site Name AQS ID Slope Intercept R2
No. Data Pairs
Meets FEM Performance Criteria
Slope ≥0.9 and ≤1.1
Intercept ≥-2 and ≤2
Intercept linear condition‡
Meets all performance conditions
Bridgeport Roosevelt School
09-001-0010 1.03 0.58 0.68 321 Y 1 1 1 1
Cornwall Mohawk Mt
09-005-0005 0.84 3.03 0.44 330 N 0 0 1 0
Danbury WCSU
09-001-1123 1.16 0.03 0.93 341 N 0 1 0 0
East Hartford McAuliffe Park
09-003-1003 1.02 1.03 0.86 979 Y 1 1 1 1
East Hartford High Street*
09-003-2006 1.09 1.35 0.85 331 N 1 1 0 0
Hartford Huntley Place**
09-003-0025 0.90 2.15 0.80 77 N 1 0 1 0
New Haven Criscuolo Park
09-009-0027 1.02 1.94 0.82 1024 N 1 1 0 0
Waterbury Bank Street
09-009-2123 1.06 1.03 0.76 335 Y 1 1 1 1
*Monitor/site shut down 12/31/2014, data shown for comparison. **Incomplete data, FRM operations began March 2014. †A value of 1 indicates condition satisfied, 0 indicates condition not satisfied ‡Intercept between 15.05-(17.32*Slope) and 15.05-(13.20*Slope) The data indicate that three sites, Bridgeport Roosevelt School, East Hartford McAuliffe Park and Waterbury Bank Street, currently meet FEM criteria. The remaining sites nearly comply, with the exception of Cornwall, where PM2.5 concentrations are uniformly low. Given these facts, Connecticut’s relatively low PM2.5 design values and DEEP’s ongoing commitment to implementing best practices in field operations, DEEP plans to consider all MetOne BAM 1020 PM2.5 monitors FEMs and commence reporting this data as available for NAAQS compliance beginning January 1, 2016. Proposed Changes in PM2.5 FRM Sampling Frequencies:
DEEP proposes reductions in manual (FRM) sampling frequencies for most of the SLAMS PM2.5 monitors in the network, as allowed by CFR 40 58.12(d), where manual FRM and continuous FEM samplers are co-located. All sites have design values well below the threshold (85 percent of NAAQS level) that requires a minimum of 1-in-3 day sampling frequency. Specifically, DEEP proposes to reduce the New Haven Criscuolo Park NCore sampler from 1-in-1 day to 1-in-3 days, the East Hartford McAuliffe Park sampler from 1-in-1 day to 1-in-6 days, and the following 1-in-3 day samplers to 1-in-6 days: Bridgeport Roosevelt School, Danbury WCSU, Waterbury Bank Street, and New Haven Criscuolo Park collocated. Thus, the NCore and near-road manual FRM primary samplers will operate on the 3-day schedule, while the remainder would be on the 6-day schedule.
Proposed Termination of Westport PM2.5: Minimum SLAMS network design criteria1
1 40 CFR 58 Appendix D 4.7
for PM2.5 monitoring require at least one monitor in a Metropolitan Statistical Area (MSA) having a population between 500,000 and 1,000,000 where design values are below 85 percent of NAAQS. Therefore, for the Bridgeport-Stamford-Norwalk MSA, which has a 2013 estimated population of about 940,000 and
Connecticut 2015 Annual Air Monitoring Network Plan 14
maximum annual and 24-hour design values of 9.3 μg/m3 and 24 μg/m3, respectively, DEEP proposes to terminate the Westport monitor. Westport PM2.5 has the lowest design values (7.7 and 21 μg/m3) and is less indicative of population exposure than the other monitors (Danbury and Bridgeport) within the MSA. Figure 2: CT PM2.5 FEM Comparison with EPA Performance Standards (2012-2013 data)
Summary of Proposed PM2.5 Network:
Table 5 is a summary of the proposed configuration of the DEEP PM2.5 network.
Table 5: Proposed PM2.5 Network Configuration
Site Primary (NAAQS)
Collocated (NAAQS)
Supplemental (NAAQS)
Bridgeport-Roosevelt Sch. Continuous FEM 1-in-6 FRM Cornwall-Mohawk Mt. 1-in-3 FRM Continuous FEM Danbury-WCSU 1-in-6 FRM Continuous FEM East Hartford-McAuliffe Pk. 1-in-6 FRM Continuous FEM Groton-Ft. Griswold Continuous FEM 1-in-6 FRM Hartford-Huntley Pl. 1-in-3 FRM Continuous FEM New Haven-Criscuolo Pk. 1-in-3 FRM 1-in-6 FRM Continuous FEM Waterbury-Bank St. 1-in-6 FRM 1-in-6 FRM Continuous FEM
Connecticut 2015 Annual Air Monitoring Network Plan 15
PM10/PM10-2.5 FRM Network
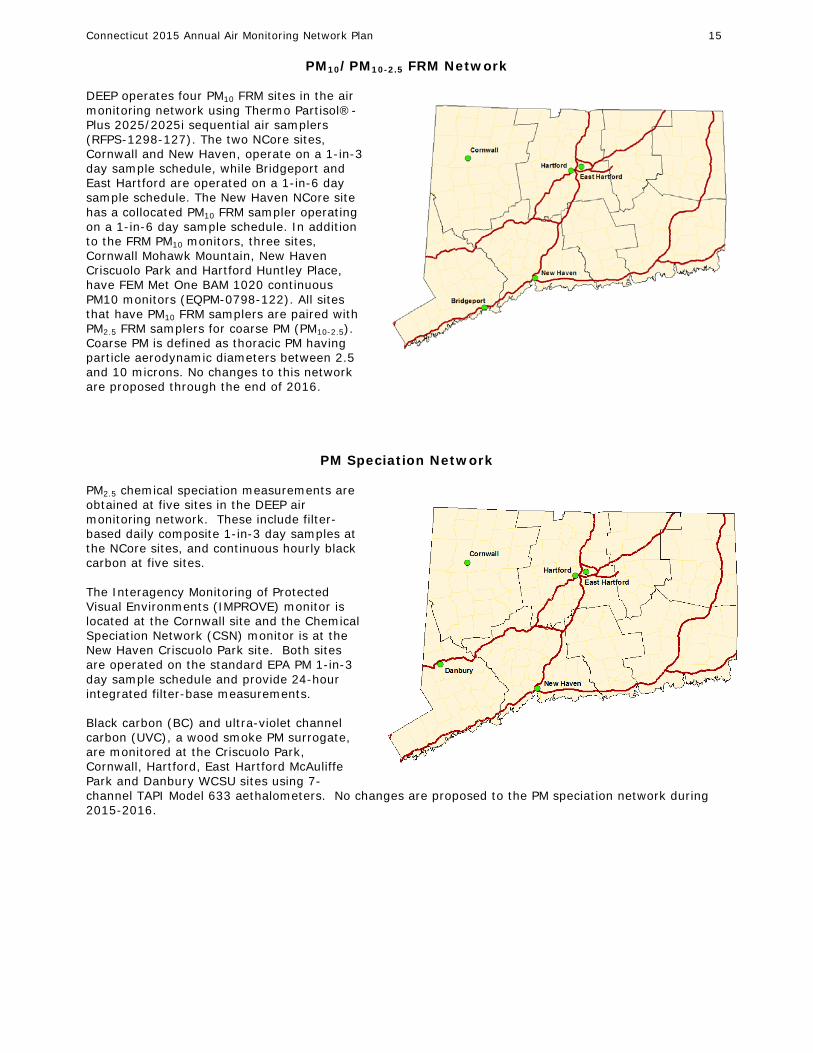
DEEP operates four PM10 FRM sites in the air monitoring network using Thermo Partisol®-Plus 2025/2025i sequential air samplers (RFPS-1298-127). The two NCore sites, Cornwall and New Haven, operate on a 1-in-3 day sample schedule, while Bridgeport and East Hartford are operated on a 1-in-6 day sample schedule. The New Haven NCore site has a collocated PM10 FRM sampler operating on a 1-in-6 day sample schedule. In addition to the FRM PM10 monitors, three sites, Cornwall Mohawk Mountain, New Haven Criscuolo Park and Hartford Huntley Place, have FEM Met One BAM 1020 continuous PM10 monitors (EQPM-0798-122). All sites that have PM10 FRM samplers are paired with PM2.5 FRM samplers for coarse PM (PM10-2.5). Coarse PM is defined as thoracic PM having particle aerodynamic diameters between 2.5 and 10 microns. No changes to this network are proposed through the end of 2016.
PM Speciation Network PM2.5 chemical speciation measurements are obtained at five sites in the DEEP air monitoring network. These include filter-based daily composite 1-in-3 day samples at the NCore sites, and continuous hourly black carbon at five sites. The Interagency Monitoring of Protected Visual Environments (IMPROVE) monitor is located at the Cornwall site and the Chemical Speciation Network (CSN) monitor is at the New Haven Criscuolo Park site. Both sites are operated on the standard EPA PM 1-in-3 day sample schedule and provide 24-hour integrated filter-base measurements. Black carbon (BC) and ultra-violet channel carbon (UVC), a wood smoke PM surrogate, are monitored at the Criscuolo Park, Cornwall, Hartford, East Hartford McAuliffe Park and Danbury WCSU sites using 7-channel TAPI Model 633 aethalometers. No changes are proposed to the PM speciation network during 2015-2016.
Connecticut 2015 Annual Air Monitoring Network Plan 16
Ozone Network
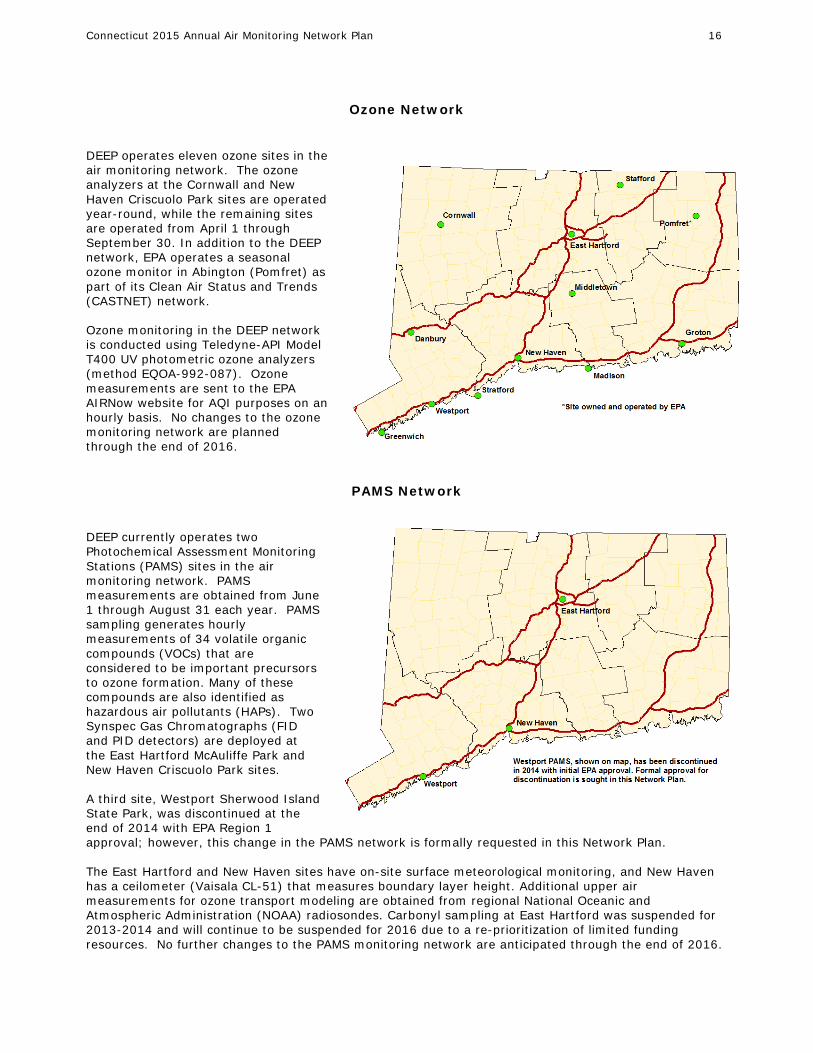
DEEP operates eleven ozone sites in the air monitoring network. The ozone analyzers at the Cornwall and New Haven Criscuolo Park sites are operated year-round, while the remaining sites are operated from April 1 through September 30. In addition to the DEEP network, EPA operates a seasonal ozone monitor in Abington (Pomfret) as part of its Clean Air Status and Trends (CASTNET) network. Ozone monitoring in the DEEP network is conducted using Teledyne-API Model T400 UV photometric ozone analyzers (method EQOA-992-087). Ozone measurements are sent to the EPA AIRNow website for AQI purposes on an hourly basis. No changes to the ozone monitoring network are planned through the end of 2016.
PAMS Network DEEP currently operates two Photochemical Assessment Monitoring Stations (PAMS) sites in the air monitoring network. PAMS measurements are obtained from June 1 through August 31 each year. PAMS sampling generates hourly measurements of 34 volatile organic compounds (VOCs) that are considered to be important precursors to ozone formation. Many of these compounds are also identified as hazardous air pollutants (HAPs). Two Synspec Gas Chromatographs (FID and PID detectors) are deployed at the East Hartford McAuliffe Park and New Haven Criscuolo Park sites. A third site, Westport Sherwood Island State Park, was discontinued at the end of 2014 with EPA Region 1 approval; however, this change in the PAMS network is formally requested in this Network Plan. The East Hartford and New Haven sites have on-site surface meteorological monitoring, and New Haven has a ceilometer (Vaisala CL-51) that measures boundary layer height. Additional upper air measurements for ozone transport modeling are obtained from regional National Oceanic and Atmospheric Administration (NOAA) radiosondes. Carbonyl sampling at East Hartford was suspended for 2013-2014 and will continue to be suspended for 2016 due to a re-prioritization of limited funding resources. No further changes to the PAMS monitoring network are anticipated through the end of 2016.
Connecticut 2015 Annual Air Monitoring Network Plan 17
NO2 Network
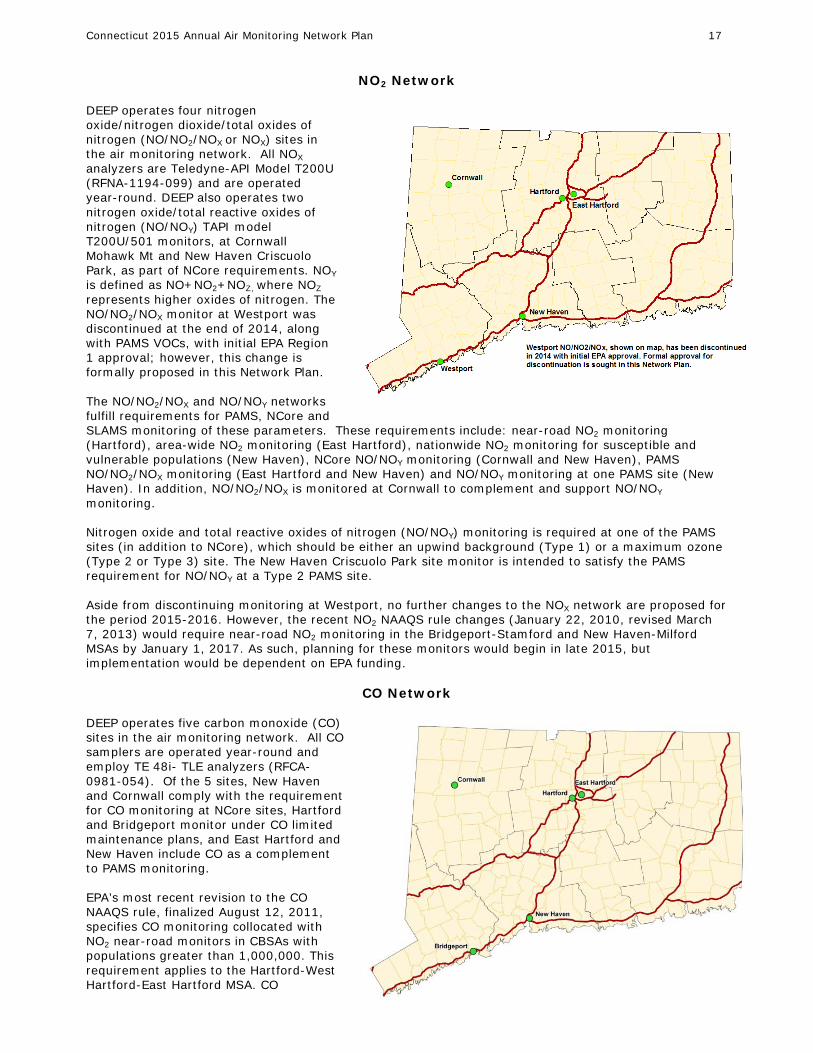
DEEP operates four nitrogen oxide/nitrogen dioxide/total oxides of nitrogen (NO/NO2/NOX or NOX) sites in the air monitoring network. All NOX analyzers are Teledyne-API Model T200U (RFNA-1194-099) and are operated year-round. DEEP also operates two nitrogen oxide/total reactive oxides of nitrogen (NO/NOY) TAPI model T200U/501 monitors, at Cornwall Mohawk Mt and New Haven Criscuolo Park, as part of NCore requirements. NOY is defined as NO+NO2+NOZ, where NOZ represents higher oxides of nitrogen. The NO/NO2/NOX monitor at Westport was discontinued at the end of 2014, along with PAMS VOCs, with initial EPA Region 1 approval; however, this change is formally proposed in this Network Plan. The NO/NO2/NOX and NO/NOY networks fulfill requirements for PAMS, NCore and SLAMS monitoring of these parameters. These requirements include: near-road NO2 monitoring (Hartford), area-wide NO2 monitoring (East Hartford), nationwide NO2 monitoring for susceptible and vulnerable populations (New Haven), NCore NO/NOY monitoring (Cornwall and New Haven), PAMS NO/NO2/NOX monitoring (East Hartford and New Haven) and NO/NOY monitoring at one PAMS site (New Haven). In addition, NO/NO2/NOX is monitored at Cornwall to complement and support NO/NOY monitoring. Nitrogen oxide and total reactive oxides of nitrogen (NO/NOY) monitoring is required at one of the PAMS sites (in addition to NCore), which should be either an upwind background (Type 1) or a maximum ozone (Type 2 or Type 3) site. The New Haven Criscuolo Park site monitor is intended to satisfy the PAMS requirement for NO/NOY at a Type 2 PAMS site. Aside from discontinuing monitoring at Westport, no further changes to the NOX network are proposed for the period 2015-2016. However, the recent NO2 NAAQS rule changes (January 22, 2010, revised March 7, 2013) would require near-road NO2 monitoring in the Bridgeport-Stamford and New Haven-Milford MSAs by January 1, 2017. As such, planning for these monitors would begin in late 2015, but implementation would be dependent on EPA funding.
CO Network
DEEP operates five carbon monoxide (CO) sites in the air monitoring network. All CO samplers are operated year-round and employ TE 48i- TLE analyzers (RFCA-0981-054). Of the 5 sites, New Haven and Cornwall comply with the requirement for CO monitoring at NCore sites, Hartford and Bridgeport monitor under CO limited maintenance plans, and East Hartford and New Haven include CO as a complement to PAMS monitoring. EPA’s most recent revision to the CO NAAQS rule, finalized August 12, 2011, specifies CO monitoring collocated with NO2 near-road monitors in CBSAs with populations greater than 1,000,000. This requirement applies to the Hartford-West Hartford-East Hartford MSA. CO
Connecticut 2015 Annual Air Monitoring Network Plan 18
monitoring at the Huntley Place site meets the local monitoring requirement for DEEP’s Hartford area CO limited maintenance plan (DEEP, 2004), as well as the near-road CO monitoring requirement. No changes to the CO monitoring network are anticipated through the end of 2016.
SO2 Network
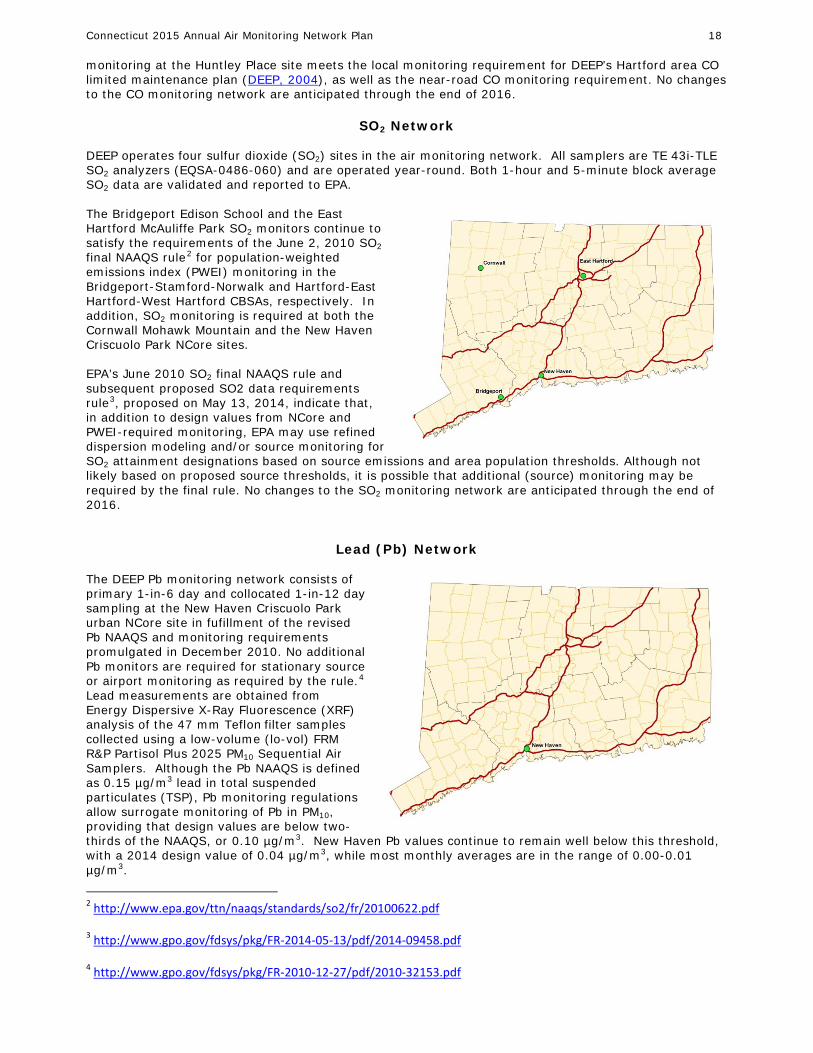
DEEP operates four sulfur dioxide (SO2) sites in the air monitoring network. All samplers are TE 43i-TLE SO2 analyzers (EQSA-0486-060) and are operated year-round. Both 1-hour and 5-minute block average SO2 data are validated and reported to EPA. The Bridgeport Edison School and the East Hartford McAuliffe Park SO2 monitors continue to satisfy the requirements of the June 2, 2010 SO2 final NAAQS rule2
for population-weighted emissions index (PWEI) monitoring in the Bridgeport-Stamford-Norwalk and Hartford-East Hartford-West Hartford CBSAs, respectively. In addition, SO2 monitoring is required at both the Cornwall Mohawk Mountain and the New Haven Criscuolo Park NCore sites.
EPA’s June 2010 SO2 final NAAQS rule and subsequent proposed SO2 data requirements rule3
, proposed on May 13, 2014, indicate that, in addition to design values from NCore and PWEI-required monitoring, EPA may use refined dispersion modeling and/or source monitoring for SO2 attainment designations based on source emissions and area population thresholds. Although not likely based on proposed source thresholds, it is possible that additional (source) monitoring may be required by the final rule. No changes to the SO2 monitoring network are anticipated through the end of 2016.
Lead (Pb) Network
The DEEP Pb monitoring network consists of primary 1-in-6 day and collocated 1-in-12 day sampling at the New Haven Criscuolo Park urban NCore site in fufillment of the revised Pb NAAQS and monitoring requirements promulgated in December 2010. No additional Pb monitors are required for stationary source or airport monitoring as required by the rule.4
2
Lead measurements are obtained from Energy Dispersive X-Ray Fluorescence (XRF) analysis of the 47 mm Teflon filter samples collected using a low-volume (lo-vol) FRM R&P Partisol Plus 2025 PM10 Sequential Air Samplers. Although the Pb NAAQS is defined as 0.15 µg/m3 lead in total suspended particulates (TSP), Pb monitoring regulations allow surrogate monitoring of Pb in PM10, providing that design values are below two-thirds of the NAAQS, or 0.10 µg/m3. New Haven Pb values continue to remain well below this threshold, with a 2014 design value of 0.04 µg/m3, while most monthly averages are in the range of 0.00-0.01 µg/m3.
http://www.epa.gov/ttn/naaqs/standards/so2/fr/20100622.pdf
3 http://www.gpo.gov/fdsys/pkg/FR-2014-05-13/pdf/2014-09458.pdf
4 http://www.gpo.gov/fdsys/pkg/FR-2010-12-27/pdf/2010-32153.pdf
Connecticut 2015 Annual Air Monitoring Network Plan 19
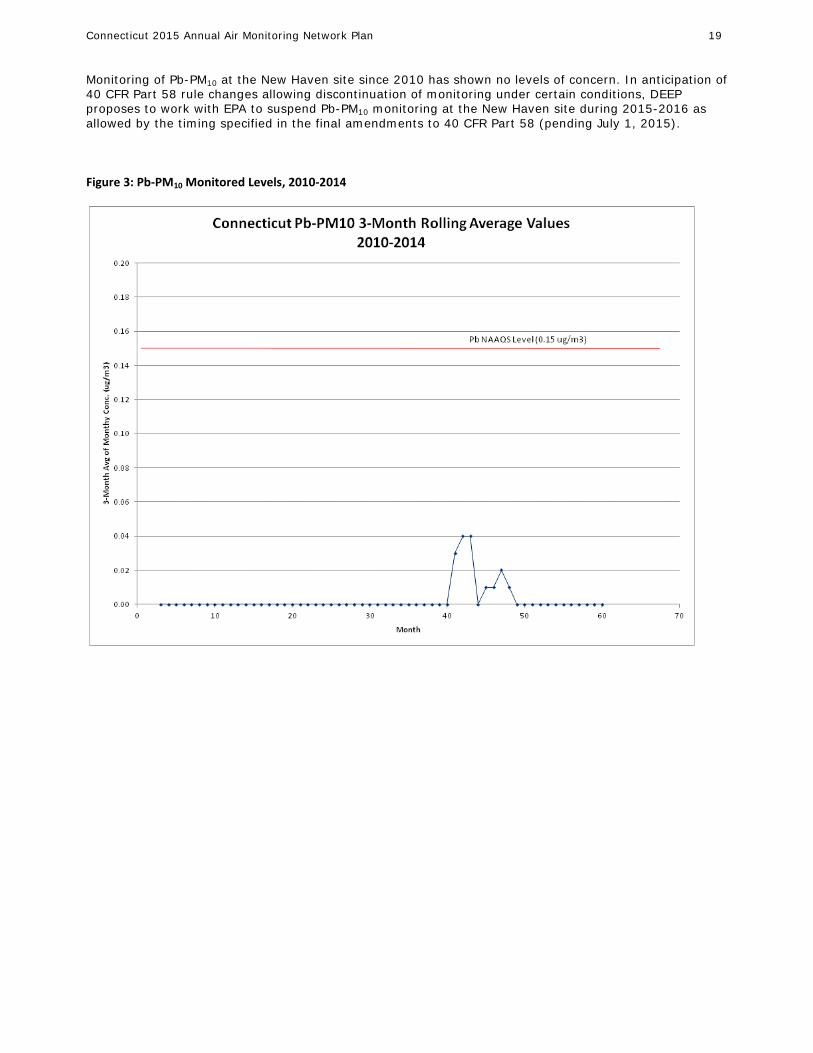
Monitoring of Pb-PM10 at the New Haven site since 2010 has shown no levels of concern. In anticipation of 40 CFR Part 58 rule changes allowing discontinuation of monitoring under certain conditions, DEEP proposes to work with EPA to suspend Pb-PM10 monitoring at the New Haven site during 2015-2016 as allowed by the timing specified in the final amendments to 40 CFR Part 58 (pending July 1, 2015). Figure 3: Pb-PM10 Monitored Levels, 2010-2014
Connecticut 2015 Annual Air Monitoring Network Plan 20
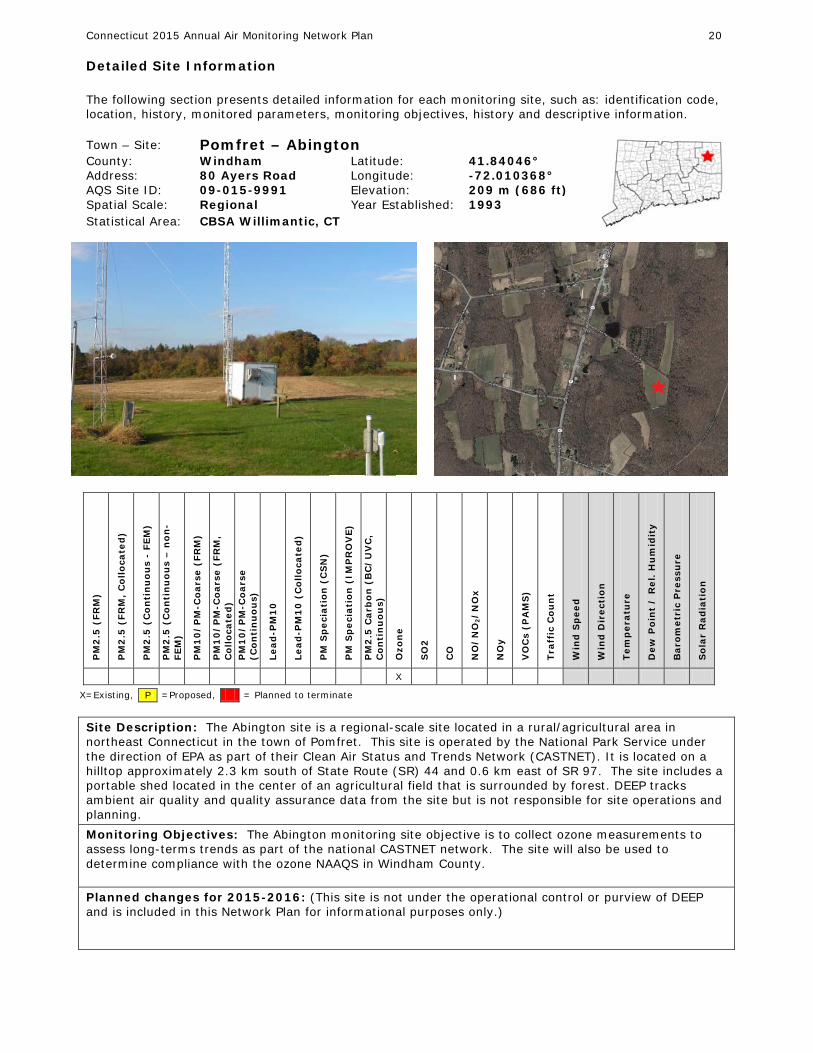
Detailed Site Information The following section presents detailed information for each monitoring site, such as: identification code, location, history, monitored parameters, monitoring objectives, history and descriptive information. Town – Site: Pomfret – Abington
County: Windham Latitude: 41.84046° Address: 80 Ayers Road Longitude: -72.010368° AQS Site ID: 09-015-9991 Elevation: 209 m (686 ft) Spatial Scale: Regional Year Established: 1993 Statistical Area: CBSA Willimantic, CT
PM
2.5
(FR
M)
PM
2.5
(FR
M,
Co
llo
cate
d)
PM
2.5
(C
on
tin
uo
us
- FE
M)
PM
2.5
(C
on
tin
uo
us
– n
on
-FE
M)
PM
10
/P
M-C
oar
se (
FRM
)
PM
10
/P
M-C
oar
se (
FRM
, C
oll
oca
ted
) P
M1
0/
PM
-Co
arse
(C
on
tin
uo
us)
Lead
-PM
10
Lead
-PM
10
(C
oll
oca
ted
)
PM
Sp
ecia
tio
n (
CS
N)
PM
Sp
ecia
tio
n (
IMP
RO
VE
)
PM
2.5
Car
bo
n (
BC
/U
VC
, C
on
tin
uo
us)
Ozo
ne
SO
2
CO
NO
/N
O2/
NO
x
NO
y
VO
Cs
(PA
MS
)
Tra
ffic
Co
un
t
Win
d S
pee
d
Win
d D
irec
tio
n
Tem
per
atu
re
Dew
Po
int
/ R
el.
Hu
mid
ity
Bar
om
etri
c P
ress
ure
So
lar
Rad
iati
on
X
X=Existing, P =Proposed, = Planned to terminate
Site Description: The Abington site is a regional-scale site located in a rural/agricultural area in northeast Connecticut in the town of Pomfret. This site is operated by the National Park Service under the direction of EPA as part of their Clean Air Status and Trends Network (CASTNET). It is located on a hilltop approximately 2.3 km south of State Route (SR) 44 and 0.6 km east of SR 97. The site includes a portable shed located in the center of an agricultural field that is surrounded by forest. DEEP tracks ambient air quality and quality assurance data from the site but is not responsible for site operations and planning. Monitoring Objectives: The Abington monitoring site objective is to collect ozone measurements to assess long-terms trends as part of the national CASTNET network. The site will also be used to determine compliance with the ozone NAAQS in Windham County. Planned changes for 2015-2016: (This site is not under the operational control or purview of DEEP and is included in this Network Plan for informational purposes only.)

Connecticut 2015 Annual Air Monitoring Network Plan 21
Town – Site: Bridgeport – Edison School
County: Fairfield Latitude: 41.19500° Address: 115 Boston Terrace Longitude: -73.16350° AQS Site ID: 09-001-0012 Elevation: 34 m (110 ft) Spatial Scale: Neighborhood Year Established: 1983
Statistical Area: CSA (New York-Newark-Bridgeport)
PM
2.5
(FR
M)
PM
2.5
(FR
M,
Co
llo
cate
d)
PM
2.5
(C
on
tin
uo
us
- FE
M)
PM
2.5
(C
on
tin
uo
us
– n
on
-FE
M)
PM
10
/P
M-C
oar
se (
FRM
)
PM
10
/P
M-C
oar
se (
FRM
, C
oll
oca
ted
)
PM
10
/P
M-C
oar
se (
Co
nti
nu
ou
s)
Lead
-PM
10
Lead
-PM
10
(C
oll
oca
ted
)
PM
Sp
ecia
tio
n (
CS
N)
PM
Sp
ecia
tio
n (
IMP
RO
VE
)
PM
2.5
Car
bo
n (
BC
/U
VC
, C
on
tin
uo
us)
Ozo
ne
SO
2
CO
NO
/N
O2/
NO
x
NO
y
VO
Cs
(PA
MS
)
Tra
ffic
Co
un
t
Win
d S
pee
d
Win
d D
irec
tio
n
Tem
per
atu
re
Dew
Po
int
/ R
el.
Hu
mid
ity
Bar
om
etri
c P
ress
ure
So
lar
Rad
iati
on
X X=Existing, P =Proposed, = Planned to terminate
Site Description: The Edison School site is a neighborhood-scale site located in southwestern Connecticut in the town of Bridgeport. This site is located 170 m to the north of Rte 1, 2.2 km to the north of I-95 and 2.7 km to the east of Rte 8. Residential neighborhoods are located in all directions of the site. This site meets all siting requirements and criteria and has been approved internally by DEEP and independently by EPA Region I.
Monitoring Objectives: The Bridgeport Edison School monitoring site objective is to collect SO2 measurements for compliance purposes and to potentially address the source-oriented monitoring requirement for the 2010 1-hour SO2 NAAQS. The monitor satisfies the requirement for population weighted emission index (PWEI) monitoring within the Bridgeport-Stamford-Norwalk CBSA. Planned changes for 2015-2016: None
Connecticut 2015 Annual Air Monitoring Network Plan 22
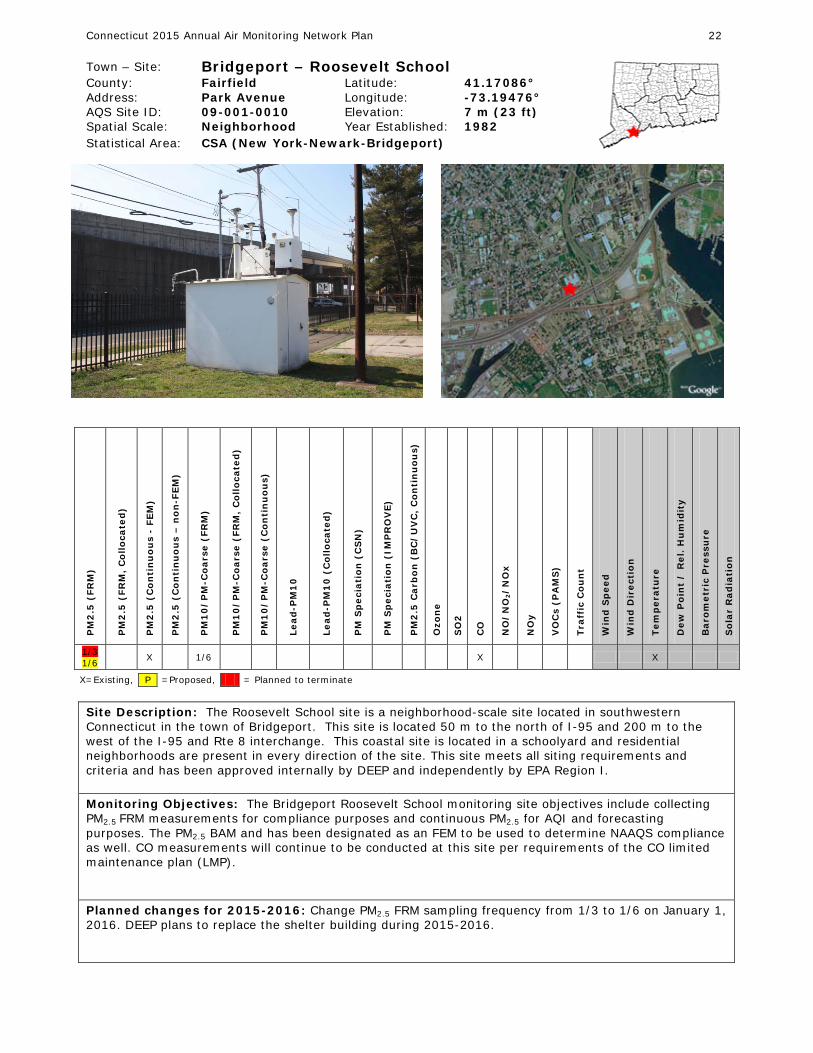
Town – Site: Bridgeport – Roosevelt School
County: Fairfield Latitude: 41.17086° Address: Park Avenue Longitude: -73.19476° AQS Site ID: 09-001-0010 Elevation: 7 m (23 ft) Spatial Scale: Neighborhood Year Established: 1982 Statistical Area: CSA (New York-Newark-Bridgeport)
PM
2.5
(FR
M)
PM
2.5
(FR
M,
Co
llo
cate
d)
PM
2.5
(C
on
tin
uo
us
- FE
M)
PM
2.5
(C
on
tin
uo
us
– n
on
-FE
M)
PM
10
/P
M-C
oar
se (
FRM
)
PM
10
/P
M-C
oar
se (
FRM
, C
oll
oca
ted
)
PM
10
/P
M-C
oar
se (
Co
nti
nu
ou
s)
Lead
-PM
10
Lead
-PM
10
(C
oll
oca
ted
)
PM
Sp
ecia
tio
n (
CS
N)
PM
Sp
ecia
tio
n (
IMP
RO
VE
)
PM
2.5
Car
bo
n (
BC
/U
VC
, C
on
tin
uo
us)
Ozo
ne
SO
2
CO
NO
/N
O2/
NO
x
NO
y
VO
Cs
(PA
MS
)
Tra
ffic
Co
un
t
Win
d S
pee
d
Win
d D
irec
tio
n
Tem
per
atu
re
Dew
Po
int
/ R
el.
Hu
mid
ity
Bar
om
etri
c P
ress
ure
So
lar
Rad
iati
on
1/3 1/6 X 1/6 X X
X=Existing, P =Proposed, = Planned to terminate
Site Description: The Roosevelt School site is a neighborhood-scale site located in southwestern Connecticut in the town of Bridgeport. This site is located 50 m to the north of I-95 and 200 m to the west of the I-95 and Rte 8 interchange. This coastal site is located in a schoolyard and residential neighborhoods are present in every direction of the site. This site meets all siting requirements and criteria and has been approved internally by DEEP and independently by EPA Region I. Monitoring Objectives: The Bridgeport Roosevelt School monitoring site objectives include collecting PM2.5 FRM measurements for compliance purposes and continuous PM2.5 for AQI and forecasting purposes. The PM2.5 BAM and has been designated as an FEM to be used to determine NAAQS compliance as well. CO measurements will continue to be conducted at this site per requirements of the CO limited maintenance plan (LMP). Planned changes for 2015-2016: Change PM2.5 FRM sampling frequency from 1/3 to 1/6 on January 1, 2016. DEEP plans to replace the shelter building during 2015-2016.
Connecticut 2015 Annual Air Monitoring Network Plan 23
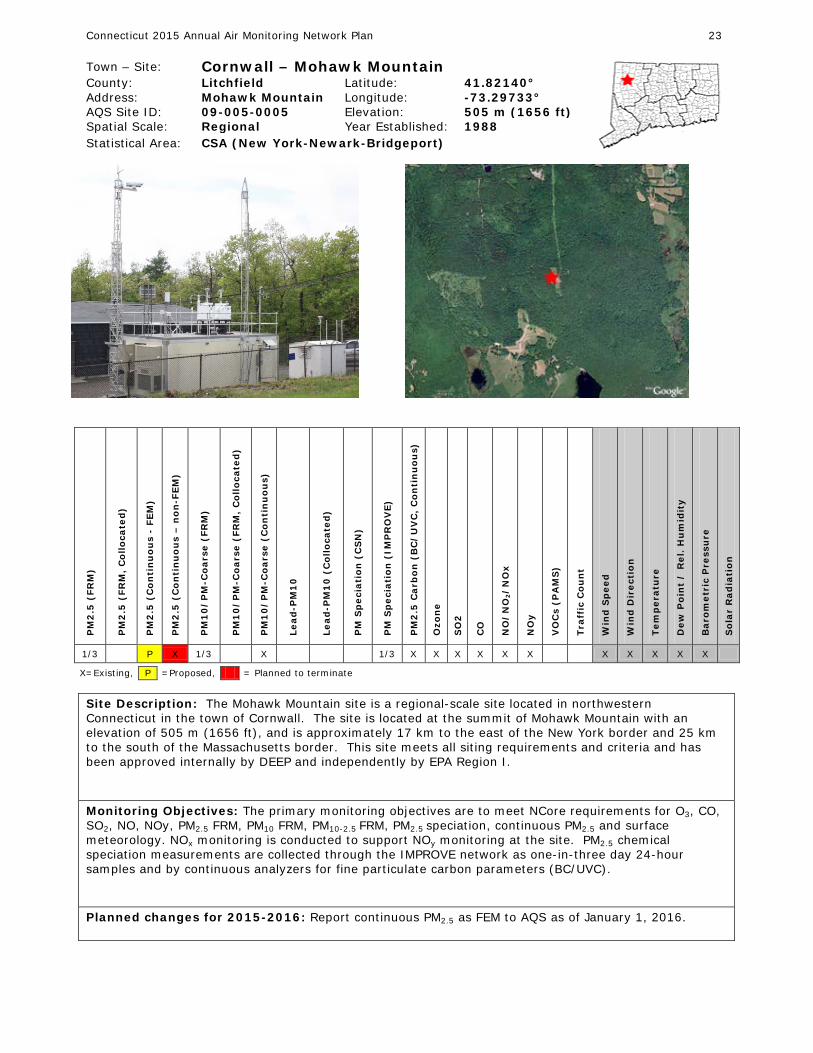
Town – Site: Cornwall – Mohawk Mountain
County: Litchfield Latitude: 41.82140° Address: Mohawk Mountain Longitude: -73.29733° AQS Site ID: 09-005-0005 Elevation: 505 m (1656 ft) Spatial Scale: Regional Year Established: 1988 Statistical Area: CSA (New York-Newark-Bridgeport)
PM
2.5
(FR
M)
PM
2.5
(FR
M,
Co
llo
cate
d)
PM
2.5
(C
on
tin
uo
us
- FE
M)
PM
2.5
(C
on
tin
uo
us
– n
on
-FE
M)
PM
10
/P
M-C
oar
se (
FRM
)
PM
10
/P
M-C
oar
se (
FRM
, C
oll
oca
ted
)
PM
10
/P
M-C
oar
se (
Co
nti
nu
ou
s)
Lead
-PM
10
Lead
-PM
10
(C
oll
oca
ted
)
PM
Sp
ecia
tio
n (
CS
N)
PM
Sp
ecia
tio
n (
IMP
RO
VE
)
PM
2.5
Car
bo
n (
BC
/U
VC
, C
on
tin
uo
us)
Ozo
ne
SO
2
CO
NO
/N
O2/
NO
x
NO
y
VO
Cs
(PA
MS
)
Tra
ffic
Co
un
t
Win
d S
pee
d
Win
d D
irec
tio
n
Tem
per
atu
re
Dew
Po
int
/ R
el.
Hu
mid
ity
Bar
om
etri
c P
ress
ure
So
lar
Rad
iati
on
1/3 P X 1/3 X 1/3 X X X X X X X X X X X
X=Existing, P =Proposed, = Planned to terminate Site Description: The Mohawk Mountain site is a regional-scale site located in northwestern Connecticut in the town of Cornwall. The site is located at the summit of Mohawk Mountain with an elevation of 505 m (1656 ft), and is approximately 17 km to the east of the New York border and 25 km to the south of the Massachusetts border. This site meets all siting requirements and criteria and has been approved internally by DEEP and independently by EPA Region I.
Monitoring Objectives: The primary monitoring objectives are to meet NCore requirements for O3, CO, SO2, NO, NOy, PM2.5 FRM, PM10 FRM, PM10-2.5 FRM, PM2.5 speciation, continuous PM2.5 and surface meteorology. NOx monitoring is conducted to support NOy monitoring at the site. PM2.5 chemical speciation measurements are collected through the IMPROVE network as one-in-three day 24-hour samples and by continuous analyzers for fine particulate carbon parameters (BC/UVC). Planned changes for 2015-2016: Report continuous PM2.5 as FEM to AQS as of January 1, 2016.
Connecticut 2015 Annual Air Monitoring Network Plan 24
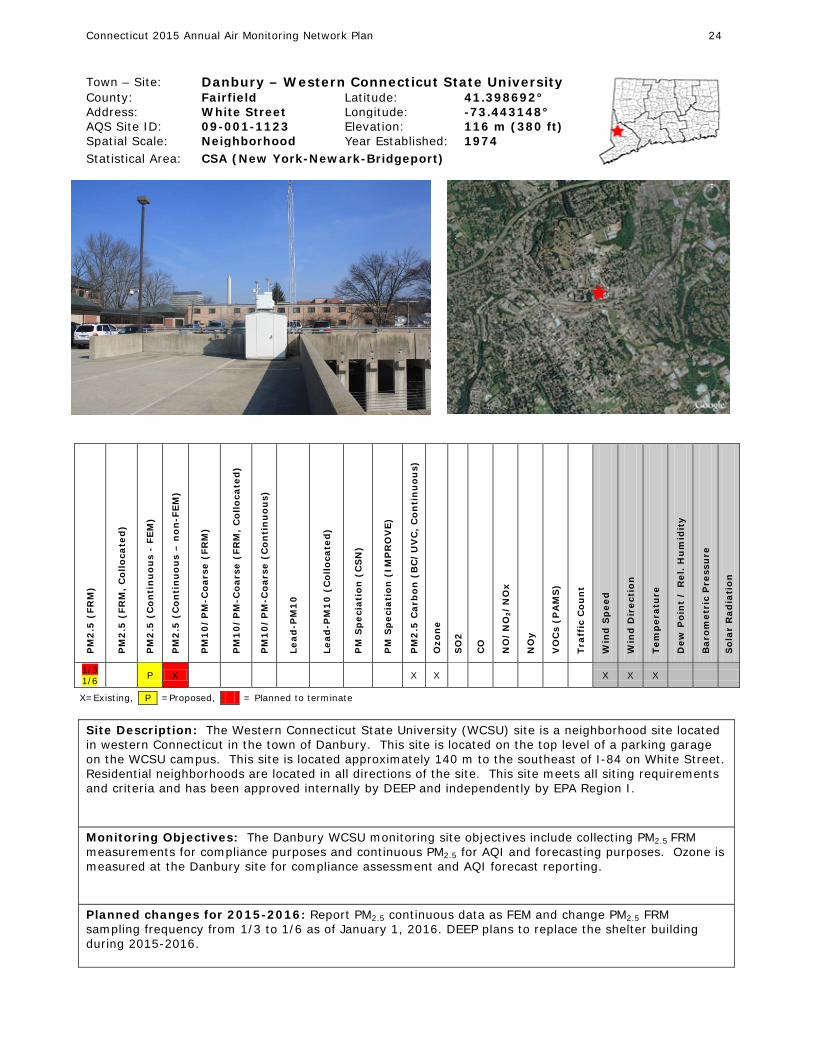
Town – Site: Danbury – Western Connecticut State University
County: Fairfield Latitude: 41.398692° Address: White Street Longitude: -73.443148° AQS Site ID: 09-001-1123 Elevation: 116 m (380 ft) Spatial Scale: Neighborhood Year Established: 1974 Statistical Area: CSA (New York-Newark-Bridgeport)
PM
2.5
(FR
M)
PM
2.5
(FR
M,
Co
llo
cate
d)
PM
2.5
(C
on
tin
uo
us
- FE
M)
PM
2.5
(C
on
tin
uo
us
– n
on
-FE
M)
PM
10
/P
M-C
oar
se (
FRM
)
PM
10
/P
M-C
oar
se (
FRM
, C
oll
oca
ted
)
PM
10
/P
M-C
oar
se (
Co
nti
nu
ou
s)
Lead
-PM
10
Lead
-PM
10
(C
oll
oca
ted
)
PM
Sp
ecia
tio
n (
CS
N)
PM
Sp
ecia
tio
n (
IMP
RO
VE
)
PM
2.5
Car
bo
n (
BC
/U
VC
, C
on
tin
uo
us)
Ozo
ne
SO
2
CO
NO
/N
O2/
NO
x
NO
y
VO
Cs
(PA
MS
)
Tra
ffic
Co
un
t
Win
d S
pee
d
Win
d D
irec
tio
n
Tem
per
atu
re
Dew
Po
int
/ R
el.
Hu
mid
ity
Bar
om
etri
c P
ress
ure
So
lar
Rad
iati
on
1/3 1/6 P X X X X X X
X=Existing, P =Proposed, = Planned to terminate
Site Description: The Western Connecticut State University (WCSU) site is a neighborhood site located in western Connecticut in the town of Danbury. This site is located on the top level of a parking garage on the WCSU campus. This site is located approximately 140 m to the southeast of I-84 on White Street. Residential neighborhoods are located in all directions of the site. This site meets all siting requirements and criteria and has been approved internally by DEEP and independently by EPA Region I. Monitoring Objectives: The Danbury WCSU monitoring site objectives include collecting PM2.5 FRM measurements for compliance purposes and continuous PM2.5 for AQI and forecasting purposes. Ozone is measured at the Danbury site for compliance assessment and AQI forecast reporting. Planned changes for 2015-2016: Report PM2.5 continuous data as FEM and change PM2.5 FRM sampling frequency from 1/3 to 1/6 as of January 1, 2016. DEEP plans to replace the shelter building during 2015-2016.
Connecticut 2015 Annual Air Monitoring Network Plan 25
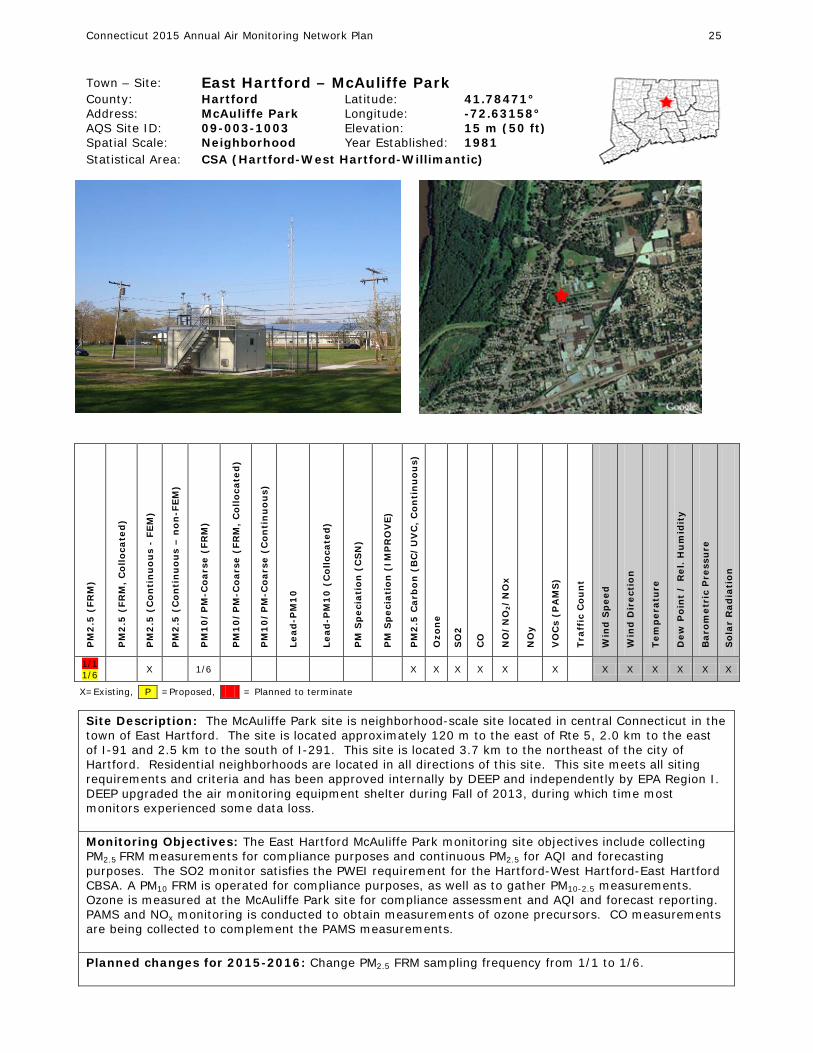
Town – Site: East Hartford – McAuliffe Park
County: Hartford Latitude: 41.78471° Address: McAuliffe Park Longitude: -72.63158° AQS Site ID: 09-003-1003 Elevation: 15 m (50 ft) Spatial Scale: Neighborhood Year Established: 1981 Statistical Area: CSA (Hartford-West Hartford-Willimantic)
PM
2.5
(FR
M)
PM
2.5
(FR
M,
Co
llo
cate
d)
PM
2.5
(C
on
tin
uo
us
- FE
M)
PM
2.5
(C
on
tin
uo
us
– n
on
-FE
M)
PM
10
/P
M-C
oar
se (
FRM
)
PM
10
/P
M-C
oar
se (
FRM
, C
oll
oca
ted
)
PM
10
/P
M-C
oar
se (
Co
nti
nu
ou
s)
Lead
-PM
10
Lead
-PM
10
(C
oll
oca
ted
)
PM
Sp
ecia
tio
n (
CS
N)
PM
Sp
ecia
tio
n (
IMP
RO
VE
)
PM
2.5
Car
bo
n (
BC
/U
VC
, C
on
tin
uo
us)
Ozo
ne
SO
2
CO
NO
/N
O2/
NO
x
NO
y
VO
Cs
(PA
MS
)
Tra
ffic
Co
un
t
Win
d S
pee
d
Win
d D
irec
tio
n
Tem
per
atu
re
Dew
Po
int
/ R
el.
Hu
mid
ity
Bar
om
etri
c P
ress
ure
So
lar
Rad
iati
on
1/1 1/6 X 1/6 X X X X X X X X X X X X
X=Existing, P =Proposed, = Planned to terminate
Site Description: The McAuliffe Park site is neighborhood-scale site located in central Connecticut in the town of East Hartford. The site is located approximately 120 m to the east of Rte 5, 2.0 km to the east of I-91 and 2.5 km to the south of I-291. This site is located 3.7 km to the northeast of the city of Hartford. Residential neighborhoods are located in all directions of this site. This site meets all siting requirements and criteria and has been approved internally by DEEP and independently by EPA Region I. DEEP upgraded the air monitoring equipment shelter during Fall of 2013, during which time most monitors experienced some data loss. Monitoring Objectives: The East Hartford McAuliffe Park monitoring site objectives include collecting PM2.5 FRM measurements for compliance purposes and continuous PM2.5 for AQI and forecasting purposes. The SO2 monitor satisfies the PWEI requirement for the Hartford-West Hartford-East Hartford CBSA. A PM10 FRM is operated for compliance purposes, as well as to gather PM10-2.5 measurements. Ozone is measured at the McAuliffe Park site for compliance assessment and AQI and forecast reporting. PAMS and NOx monitoring is conducted to obtain measurements of ozone precursors. CO measurements are being collected to complement the PAMS measurements. Planned changes for 2015-2016: Change PM2.5 FRM sampling frequency from 1/1 to 1/6.
Connecticut 2015 Annual Air Monitoring Network Plan 26
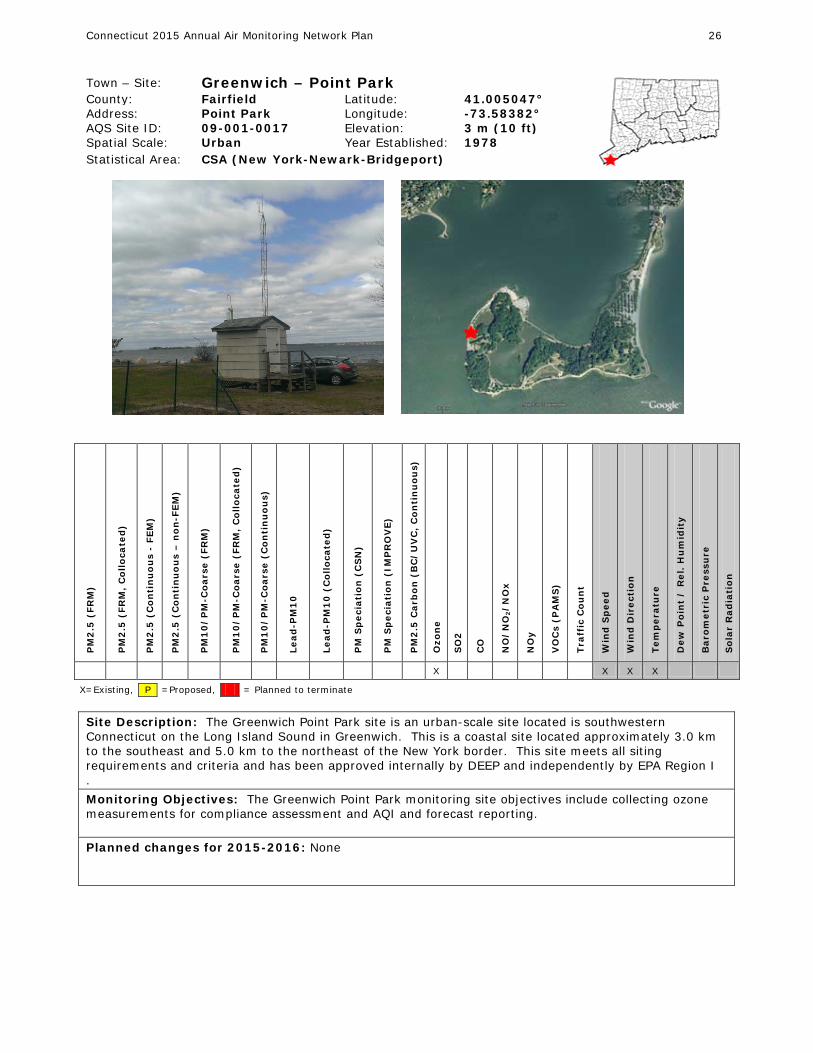
Town – Site: Greenwich – Point Park
County: Fairfield Latitude: 41.005047° Address: Point Park Longitude: -73.58382° AQS Site ID: 09-001-0017 Elevation: 3 m (10 ft) Spatial Scale: Urban Year Established: 1978 Statistical Area: CSA (New York-Newark-Bridgeport)
PM
2.5
(FR
M)
PM
2.5
(FR
M,
Co
llo
cate
d)
PM
2.5
(C
on
tin
uo
us
- FE
M)
PM
2.5
(C
on
tin
uo
us
– n
on
-FE
M)
PM
10
/P
M-C
oar
se (
FRM
)
PM
10
/P
M-C
oar
se (
FRM
, C
oll
oca
ted
)
PM
10
/P
M-C
oar
se (
Co
nti
nu
ou
s)
Lead
-PM
10
Lead
-PM
10
(C
oll
oca
ted
)
PM
Sp
ecia
tio
n (
CS
N)
PM
Sp
ecia
tio
n (
IMP
RO
VE
)
PM
2.5
Car
bo
n (
BC
/U
VC
, C
on
tin
uo
us)
Ozo
ne
SO
2
CO
NO
/N
O2/
NO
x
NO
y
VO
Cs
(PA
MS
)
Tra
ffic
Co
un
t
Win
d S
pee
d
Win
d D
irec
tio
n
Tem
per
atu
re
Dew
Po
int
/ R
el.
Hu
mid
ity
Bar
om
etri
c P
ress
ure
So
lar
Rad
iati
on
X X X X
X=Existing, P =Proposed, = Planned to terminate
Site Description: The Greenwich Point Park site is an urban-scale site located is southwestern Connecticut on the Long Island Sound in Greenwich. This is a coastal site located approximately 3.0 km to the southeast and 5.0 km to the northeast of the New York border. This site meets all siting requirements and criteria and has been approved internally by DEEP and independently by EPA Region I . Monitoring Objectives: The Greenwich Point Park monitoring site objectives include collecting ozone measurements for compliance assessment and AQI and forecast reporting. Planned changes for 2015-2016: None
Connecticut 2015 Annual Air Monitoring Network Plan 27
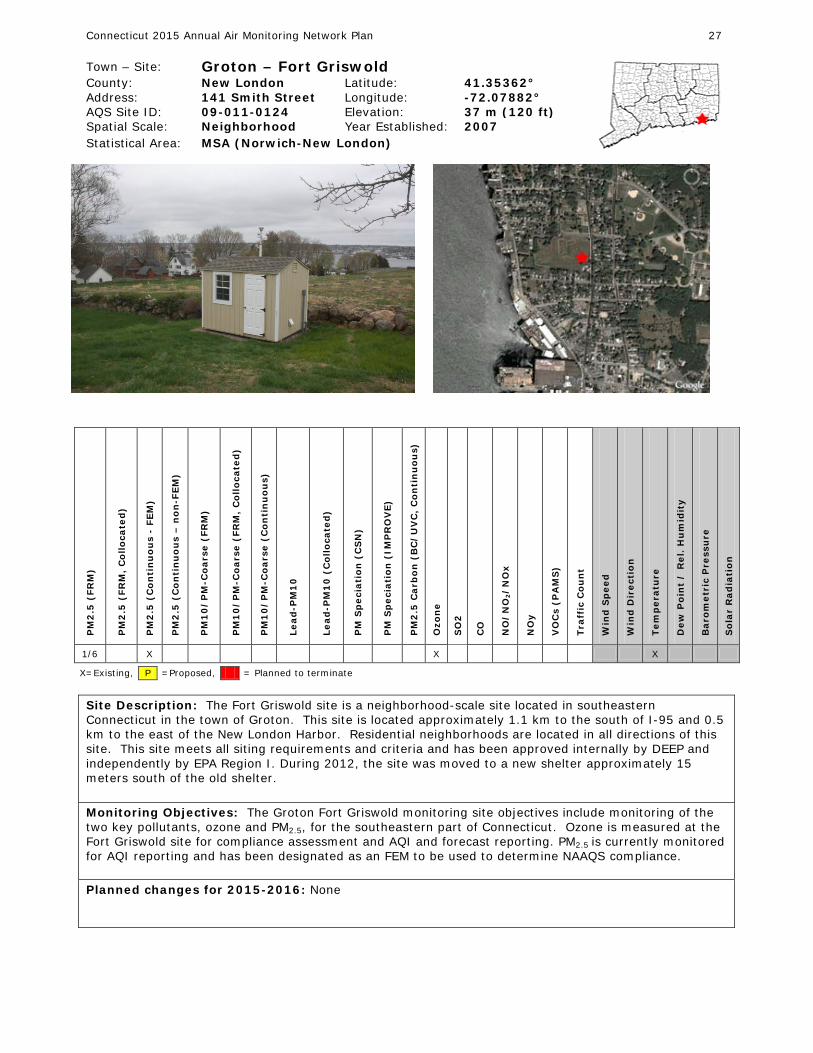
Town – Site: Groton – Fort Griswold
County: New London Latitude: 41.35362° Address: 141 Smith Street Longitude: -72.07882° AQS Site ID: 09-011-0124 Elevation: 37 m (120 ft) Spatial Scale: Neighborhood Year Established: 2007 Statistical Area: MSA (Norwich-New London)
PM
2.5
(FR
M)
PM
2.5
(FR
M,
Co
llo
cate
d)
PM
2.5
(C
on
tin
uo
us
- FE
M)
PM
2.5
(C
on
tin
uo
us
– n
on
-FE
M)
PM
10
/P
M-C
oar
se (
FRM
)
PM
10
/P
M-C
oar
se (
FRM
, C
oll
oca
ted
)
PM
10
/P
M-C
oar
se (
Co
nti
nu
ou
s)
Lead
-PM
10
Lead
-PM
10
(C
oll
oca
ted
)
PM
Sp
ecia
tio
n (
CS
N)
PM
Sp
ecia
tio
n (
IMP
RO
VE
)
PM
2.5
Car
bo
n (
BC
/U
VC
, C
on
tin
uo
us)
Ozo
ne
SO
2
CO
NO
/N
O2/
NO
x
NO
y
VO
Cs
(PA
MS
)
Tra
ffic
Co
un
t
Win
d S
pee
d
Win
d D
irec
tio
n
Tem
per
atu
re
Dew
Po
int
/ R
el.
Hu
mid
ity
Bar
om
etri
c P
ress
ure
So
lar
Rad
iati
on
1/6 X X X
X=Existing, P =Proposed, = Planned to terminate
Site Description: The Fort Griswold site is a neighborhood-scale site located in southeastern Connecticut in the town of Groton. This site is located approximately 1.1 km to the south of I-95 and 0.5 km to the east of the New London Harbor. Residential neighborhoods are located in all directions of this site. This site meets all siting requirements and criteria and has been approved internally by DEEP and independently by EPA Region I. During 2012, the site was moved to a new shelter approximately 15 meters south of the old shelter. Monitoring Objectives: The Groton Fort Griswold monitoring site objectives include monitoring of the two key pollutants, ozone and PM2.5, for the southeastern part of Connecticut. Ozone is measured at the Fort Griswold site for compliance assessment and AQI and forecast reporting. PM2.5 is currently monitored for AQI reporting and has been designated as an FEM to be used to determine NAAQS compliance. Planned changes for 2015-2016: None
Connecticut 2015 Annual Air Monitoring Network Plan 28
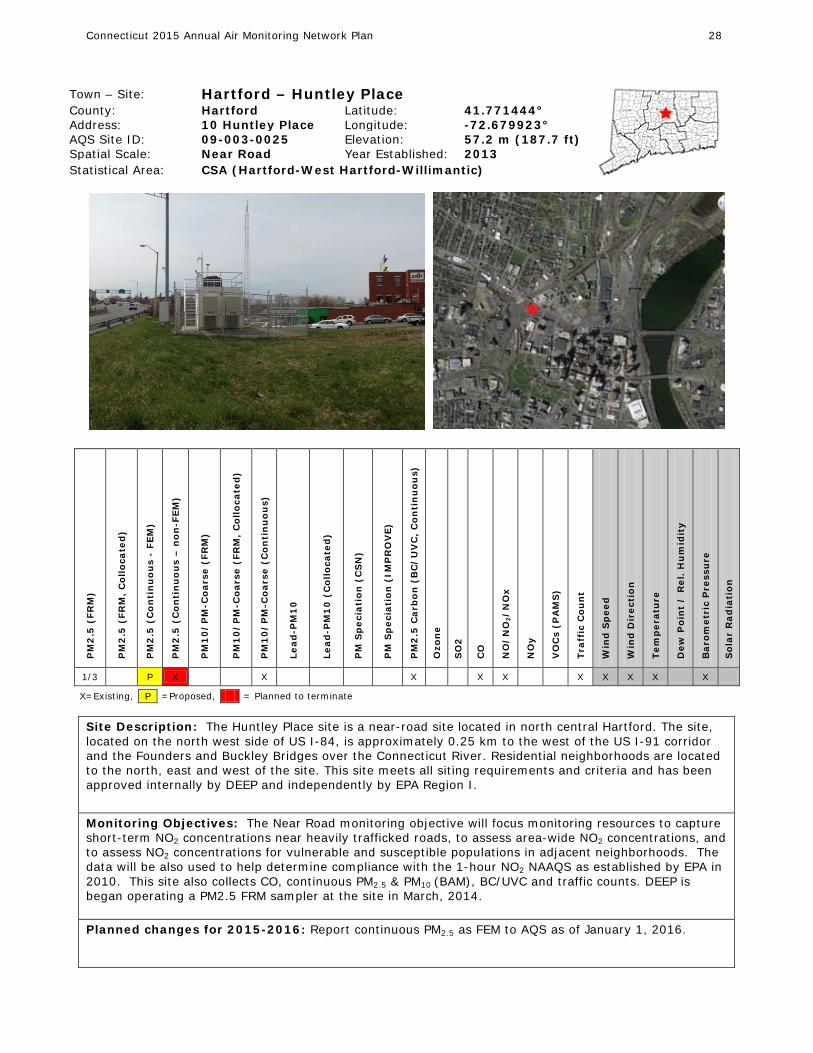
Town – Site: Hartford – Huntley Place
County: Hartford Latitude: 41.771444° Address: 10 Huntley Place Longitude: -72.679923° AQS Site ID: 09-003-0025 Elevation: 57.2 m (187.7 ft) Spatial Scale: Near Road Year Established: 2013 Statistical Area: CSA (Hartford-West Hartford-Willimantic)
PM
2.5
(FR
M)
PM
2.5
(FR
M,
Co
llo
cate
d)
PM
2.5
(C
on
tin
uo
us
- FE
M)
PM
2.5
(C
on
tin
uo
us
– n
on
-FE
M)
PM
10
/P
M-C
oar
se (
FRM
)
PM
10
/P
M-C
oar
se (
FRM
, C
oll
oca
ted
)
PM
10
/P
M-C
oar
se (
Co
nti
nu
ou
s)
Lead
-PM
10
Lead
-PM
10
(C
oll
oca
ted
)
PM
Sp
ecia
tio
n (
CS
N)
PM
Sp
ecia
tio
n (
IMP
RO
VE
)
PM
2.5
Car
bo
n (
BC
/U
VC
, C
on
tin
uo
us)
Ozo
ne
SO
2
CO
NO
/N
O2/
NO
x
NO
y
VO
Cs
(PA
MS
)
Tra
ffic
Co
un
t
Win
d S
pee
d
Win
d D
irec
tio
n
Tem
per
atu
re
Dew
Po
int
/ R
el.
Hu
mid
ity
Bar
om
etri
c P
ress
ure
So
lar
Rad
iati
on
1/3 P X X X X X X X X X X
X=Existing, P =Proposed, = Planned to terminate Site Description: The Huntley Place site is a near-road site located in north central Hartford. The site, located on the north west side of US I-84, is approximately 0.25 km to the west of the US I-91 corridor and the Founders and Buckley Bridges over the Connecticut River. Residential neighborhoods are located to the north, east and west of the site. This site meets all siting requirements and criteria and has been approved internally by DEEP and independently by EPA Region I.
Monitoring Objectives: The Near Road monitoring objective will focus monitoring resources to capture short-term NO2 concentrations near heavily trafficked roads, to assess area-wide NO2 concentrations, and to assess NO2 concentrations for vulnerable and susceptible populations in adjacent neighborhoods. The data will be also used to help determine compliance with the 1-hour NO2 NAAQS as established by EPA in 2010. This site also collects CO, continuous PM2.5 & PM10 (BAM), BC/UVC and traffic counts. DEEP is began operating a PM2.5 FRM sampler at the site in March, 2014. Planned changes for 2015-2016: Report continuous PM2.5 as FEM to AQS as of January 1, 2016.
Connecticut 2015 Annual Air Monitoring Network Plan 29
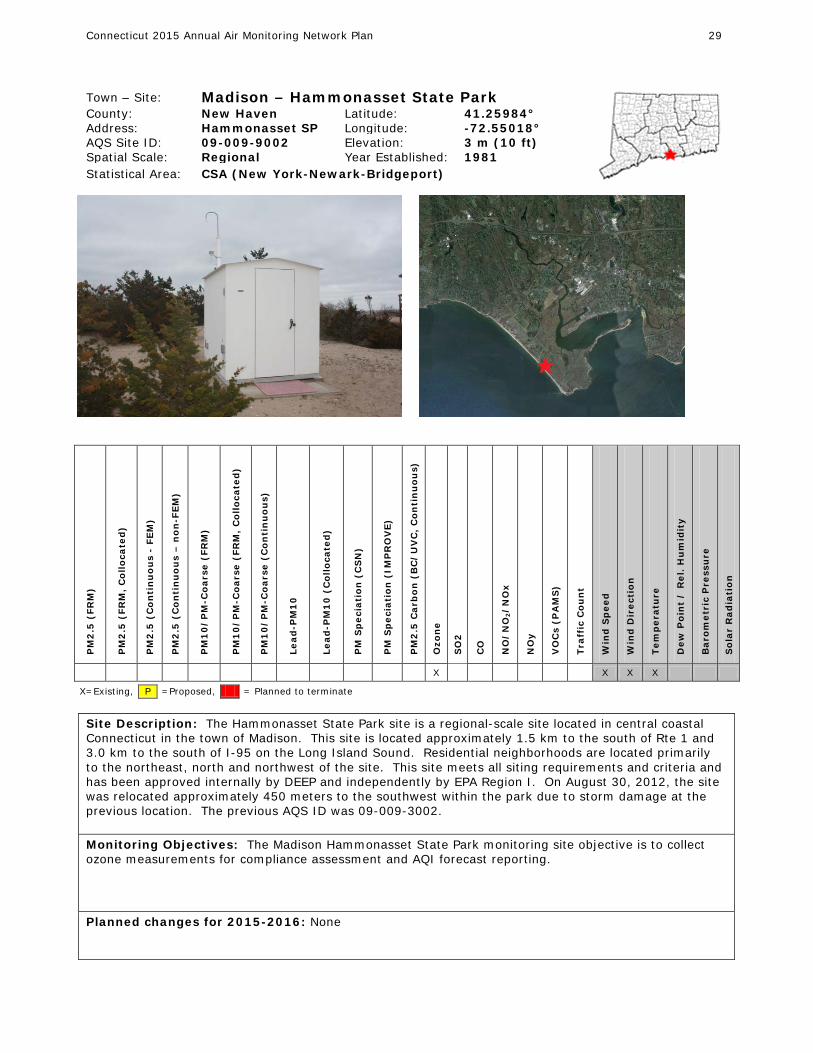
Town – Site: Madison – Hammonasset State Park
County: New Haven Latitude: 41.25984° Address: Hammonasset SP Longitude: -72.55018° AQS Site ID: 09-009-9002 Elevation: 3 m (10 ft) Spatial Scale: Regional Year Established: 1981 Statistical Area: CSA (New York-Newark-Bridgeport)
PM
2.5
(FR
M)
PM
2.5
(FR
M,
Co
llo
cate
d)
PM
2.5
(C
on
tin
uo
us
- FE
M)
PM
2.5
(C
on
tin
uo
us
– n
on
-FE
M)
PM
10
/P
M-C
oar
se (
FRM
)
PM
10
/P
M-C
oar
se (
FRM
, C
oll
oca
ted
)
PM
10
/P
M-C
oar
se (
Co
nti
nu
ou
s)
Lead
-PM
10
Lead
-PM
10
(C
oll
oca
ted
)
PM
Sp
ecia
tio
n (
CS
N)
PM
Sp
ecia
tio
n (
IMP
RO
VE
)
PM
2.5
Car
bo
n (
BC
/U
VC
, C
on
tin
uo
us)
Ozo
ne
SO
2
CO
NO
/N
O2/
NO
x
NO
y
VO
Cs
(PA
MS
)
Tra
ffic
Co
un
t
Win
d S
pee
d
Win
d D
irec
tio
n
Tem
per
atu
re
Dew
Po
int
/ R
el.
Hu
mid
ity
Bar
om
etri
c P
ress
ure
So
lar
Rad
iati
on
X X X X
X=Existing, P =Proposed, = Planned to terminate
Site Description: The Hammonasset State Park site is a regional-scale site located in central coastal Connecticut in the town of Madison. This site is located approximately 1.5 km to the south of Rte 1 and 3.0 km to the south of I-95 on the Long Island Sound. Residential neighborhoods are located primarily to the northeast, north and northwest of the site. This site meets all siting requirements and criteria and has been approved internally by DEEP and independently by EPA Region I. On August 30, 2012, the site was relocated approximately 450 meters to the southwest within the park due to storm damage at the previous location. The previous AQS ID was 09-009-3002. Monitoring Objectives: The Madison Hammonasset State Park monitoring site objective is to collect ozone measurements for compliance assessment and AQI forecast reporting. Planned changes for 2015-2016: None
Connecticut 2015 Annual Air Monitoring Network Plan 30
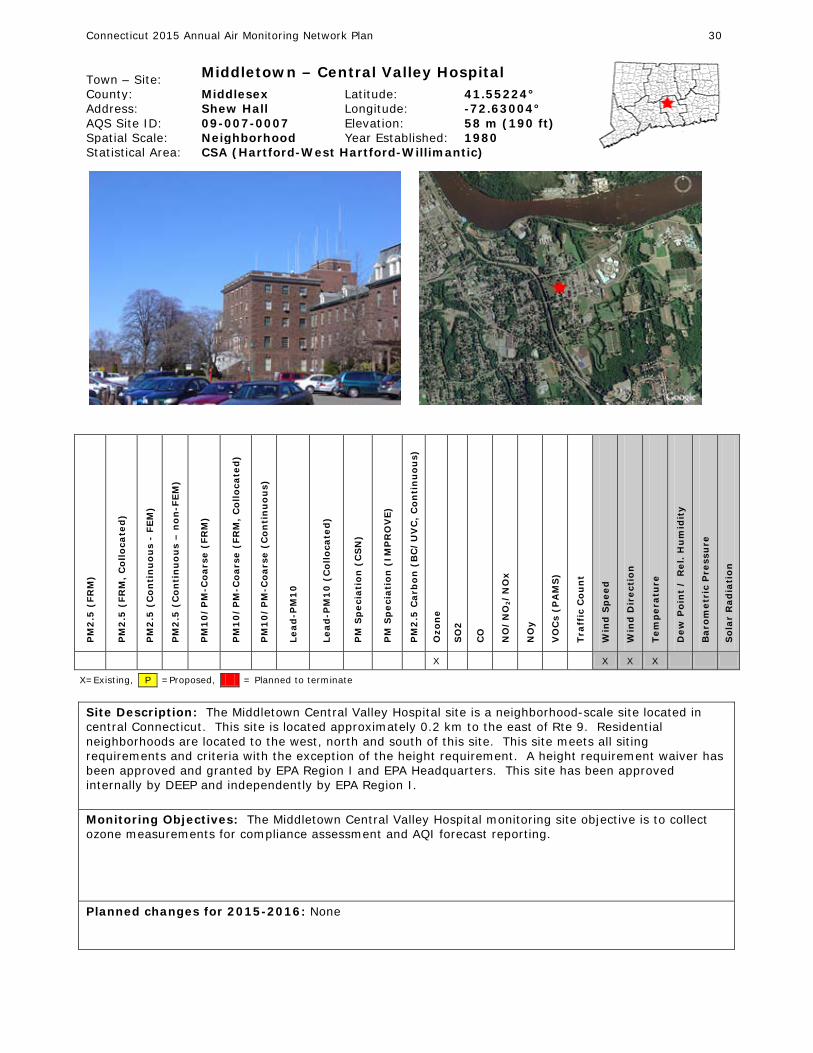
Town – Site: Middletown – Central Valley Hospital
County: Middlesex Latitude: 41.55224° Address: Shew Hall Longitude: -72.63004° AQS Site ID: 09-007-0007 Elevation: 58 m (190 ft) Spatial Scale: Neighborhood Year Established: 1980 Statistical Area: CSA (Hartford-West Hartford-Willimantic)
PM
2.5
(FR
M)
PM
2.5
(FR
M,
Co
llo
cate
d)
PM
2.5
(C
on
tin
uo
us
- FE
M)
PM
2.5
(C
on
tin
uo
us
– n
on
-FE
M)
PM
10
/P
M-C
oar
se (
FRM
)
PM
10
/P
M-C
oar
se (
FRM
, C
oll
oca
ted
)
PM
10
/P
M-C
oar
se (
Co
nti
nu
ou
s)
Lead
-PM
10
Lead
-PM
10
(C
oll
oca
ted
)
PM
Sp
ecia
tio
n (
CS
N)
PM
Sp
ecia
tio
n (
IMP
RO
VE
)
PM
2.5
Car
bo
n (
BC
/U
VC
, C
on
tin
uo
us)
Ozo
ne
SO
2
CO
NO
/N
O2/
NO
x
NO
y
VO
Cs
(PA
MS
)
Tra
ffic
Co
un
t
Win
d S
pee
d
Win
d D
irec
tio
n
Tem
per
atu
re
Dew
Po
int
/ R
el.
Hu
mid
ity
Bar
om
etri
c P
ress
ure
So
lar
Rad
iati
on
X X X X
X=Existing, P =Proposed, = Planned to terminate
Site Description: The Middletown Central Valley Hospital site is a neighborhood-scale site located in central Connecticut. This site is located approximately 0.2 km to the east of Rte 9. Residential neighborhoods are located to the west, north and south of this site. This site meets all siting requirements and criteria with the exception of the height requirement. A height requirement waiver has been approved and granted by EPA Region I and EPA Headquarters. This site has been approved internally by DEEP and independently by EPA Region I. Monitoring Objectives: The Middletown Central Valley Hospital monitoring site objective is to collect ozone measurements for compliance assessment and AQI forecast reporting. Planned changes for 2015-2016: None
Connecticut 2015 Annual Air Monitoring Network Plan 31
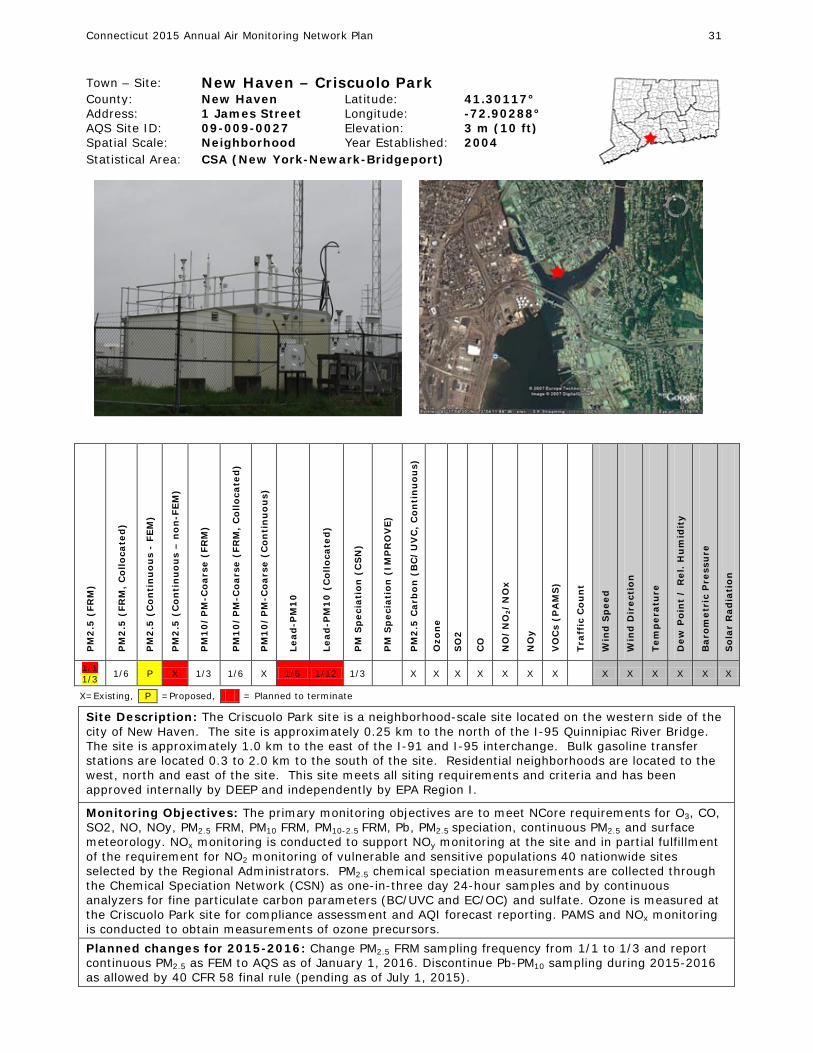
Town – Site: New Haven – Criscuolo Park
County: New Haven Latitude: 41.30117° Address: 1 James Street Longitude: -72.90288° AQS Site ID: 09-009-0027 Elevation: 3 m (10 ft) Spatial Scale: Neighborhood Year Established: 2004 Statistical Area: CSA (New York-Newark-Bridgeport)
PM
2.5
(FR
M)
PM
2.5
(FR
M,
Co
llo
cate
d)
PM
2.5
(C
on
tin
uo
us
- FE
M)
PM
2.5
(C
on
tin
uo
us
– n
on
-FE
M)
PM
10
/P
M-C
oar
se (
FRM
)
PM
10
/P
M-C
oar
se (
FRM
, C
oll
oca
ted
)
PM
10
/P
M-C
oar
se (
Co
nti
nu
ou
s)
Lead
-PM
10
Lead
-PM
10
(C
oll
oca
ted
)
PM
Sp
ecia
tio
n (
CS
N)
PM
Sp
ecia
tio
n (
IMP
RO
VE
)
PM
2.5
Car
bo
n (
BC
/U
VC
, C
on
tin
uo
us)
Ozo
ne
SO
2
CO
NO
/N
O2/
NO
x
NO
y
VO
Cs
(PA
MS
)
Tra
ffic
Co
un
t
Win
d S
pee
d
Win
d D
irec
tio
n
Tem
per
atu
re
Dew
Po
int
/ R
el.
Hu
mid
ity
Bar
om
etri
c P
ress
ure
So
lar
Rad
iati
on
1/1 1/3 1/6 P X 1/3 1/6 X 1/6 1/12 1/3 X X X X X X X X X X X X X
X=Existing, P =Proposed, = Planned to terminate
Site Description: The Criscuolo Park site is a neighborhood-scale site located on the western side of the city of New Haven. The site is approximately 0.25 km to the north of the I-95 Quinnipiac River Bridge. The site is approximately 1.0 km to the east of the I-91 and I-95 interchange. Bulk gasoline transfer stations are located 0.3 to 2.0 km to the south of the site. Residential neighborhoods are located to the west, north and east of the site. This site meets all siting requirements and criteria and has been approved internally by DEEP and independently by EPA Region I.
Monitoring Objectives: The primary monitoring objectives are to meet NCore requirements for O3, CO, SO2, NO, NOy, PM2.5 FRM, PM10 FRM, PM10-2.5 FRM, Pb, PM2.5 speciation, continuous PM2.5 and surface meteorology. NOx monitoring is conducted to support NOy monitoring at the site and in partial fulfillment of the requirement for NO2 monitoring of vulnerable and sensitive populations 40 nationwide sites selected by the Regional Administrators. PM2.5 chemical speciation measurements are collected through the Chemical Speciation Network (CSN) as one-in-three day 24-hour samples and by continuous analyzers for fine particulate carbon parameters (BC/UVC and EC/OC) and sulfate. Ozone is measured at the Criscuolo Park site for compliance assessment and AQI forecast reporting. PAMS and NOx monitoring is conducted to obtain measurements of ozone precursors. Planned changes for 2015-2016: Change PM2.5 FRM sampling frequency from 1/1 to 1/3 and report continuous PM2.5 as FEM to AQS as of January 1, 2016. Discontinue Pb-PM10 sampling during 2015-2016 as allowed by 40 CFR 58 final rule (pending as of July 1, 2015).
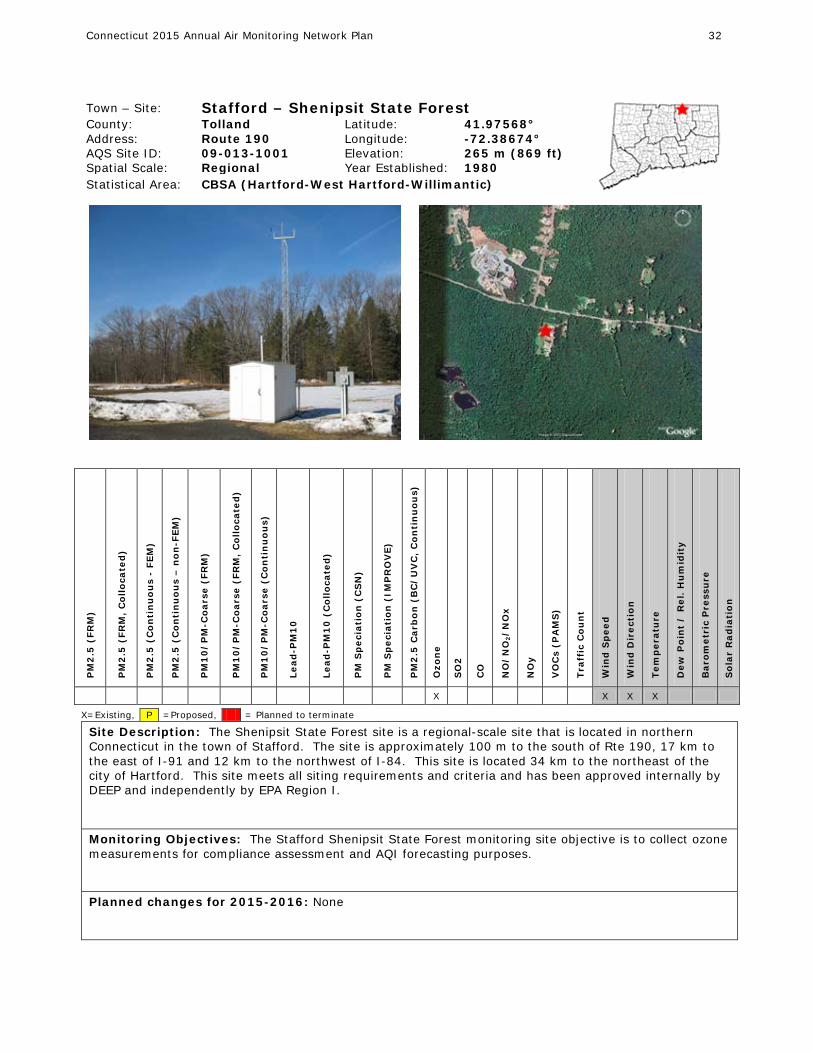
Connecticut 2015 Annual Air Monitoring Network Plan 32
Town – Site: Stafford – Shenipsit State Forest
County: Tolland Latitude: 41.97568° Address: Route 190 Longitude: -72.38674° AQS Site ID: 09-013-1001 Elevation: 265 m (869 ft) Spatial Scale: Regional Year Established: 1980 Statistical Area: CBSA (Hartford-West Hartford-Willimantic)
PM
2.5
(FR
M)
PM
2.5
(FR
M,
Co
llo
cate
d)
PM
2.5
(C
on
tin
uo
us
- FE
M)
PM
2.5
(C
on
tin
uo
us
– n
on
-FE
M)
PM
10
/P
M-C
oar
se (
FRM
)
PM
10
/P
M-C
oar
se (
FRM
, C
oll
oca
ted
)
PM
10
/P
M-C
oar
se (
Co
nti
nu
ou
s)
Lead
-PM
10
Lead
-PM
10
(C
oll
oca
ted
)
PM
Sp
ecia
tio
n (
CS
N)
PM
Sp
ecia
tio
n (
IMP
RO
VE
)
PM
2.5
Car
bo
n (
BC
/U
VC
, C
on
tin
uo
us)
Ozo
ne
SO
2
CO
NO
/N
O2/
NO
x
NO
y
VO
Cs
(PA
MS
)
Tra
ffic
Co
un
t
Win
d S
pee
d
Win
d D
irec
tio
n
Tem
per
atu
re
Dew
Po
int
/ R
el.
Hu
mid
ity
Bar
om
etri
c P
ress
ure
So
lar
Rad
iati
on
X X X X
X=Existing, P =Proposed, = Planned to terminate
Site Description: The Shenipsit State Forest site is a regional-scale site that is located in northern Connecticut in the town of Stafford. The site is approximately 100 m to the south of Rte 190, 17 km to the east of I-91 and 12 km to the northwest of I-84. This site is located 34 km to the northeast of the city of Hartford. This site meets all siting requirements and criteria and has been approved internally by DEEP and independently by EPA Region I. Monitoring Objectives: The Stafford Shenipsit State Forest monitoring site objective is to collect ozone measurements for compliance assessment and AQI forecasting purposes. Planned changes for 2015-2016: None
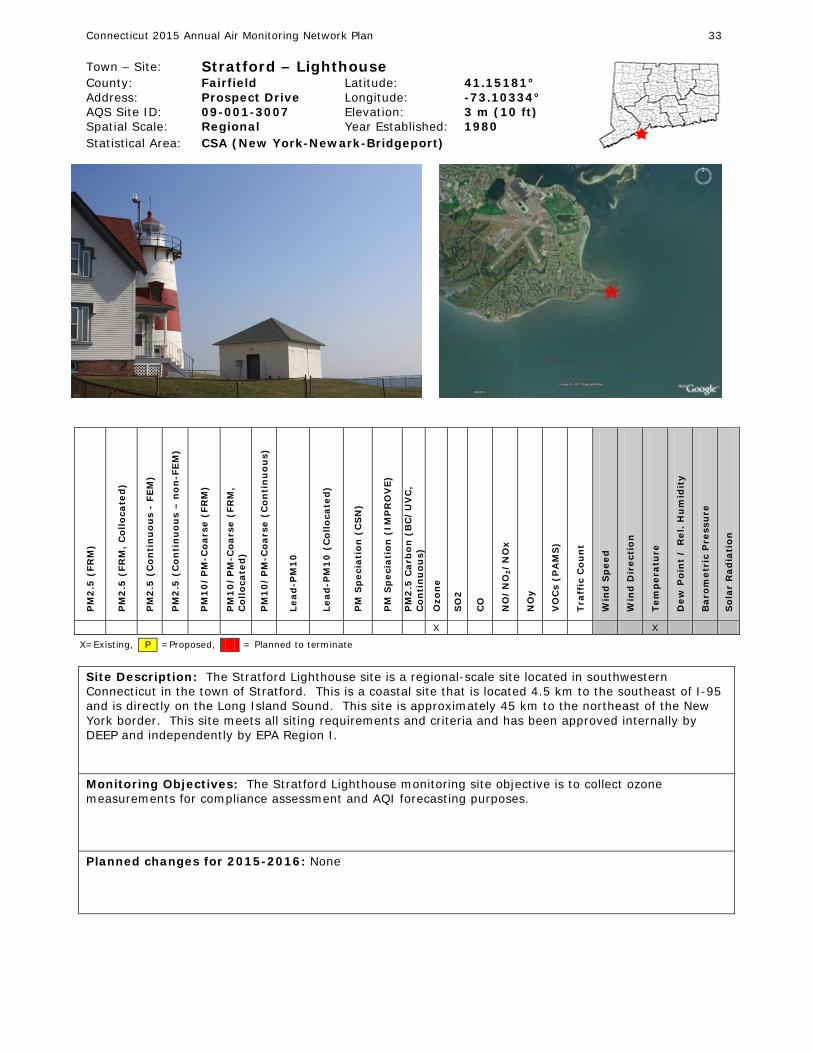
Connecticut 2015 Annual Air Monitoring Network Plan 33
Town – Site: Stratford – Lighthouse
County: Fairfield Latitude: 41.15181° Address: Prospect Drive Longitude: -73.10334° AQS Site ID: 09-001-3007 Elevation: 3 m (10 ft) Spatial Scale: Regional Year Established: 1980 Statistical Area: CSA (New York-Newark-Bridgeport)
PM
2.5
(FR
M)
PM
2.5
(FR
M,
Co
llo
cate
d)
PM
2.5
(C
on
tin
uo
us
- FE
M)
PM
2.5
(C
on
tin
uo
us
– n
on
-FE
M)
PM
10
/P
M-C
oar
se (
FRM
)
PM
10
/P
M-C
oar
se (
FRM
, C
oll
oca
ted
)
PM
10
/P
M-C
oar
se (
Co
nti
nu
ou
s)
Lead
-PM
10
Lead
-PM
10
(C
oll
oca
ted
)
PM
Sp
ecia
tio
n (
CS
N)
PM
Sp
ecia
tio
n (
IMP
RO
VE
)
PM
2.5
Car
bo
n (
BC
/U
VC
, C
on
tin
uo
us)
Ozo
ne
SO
2
CO
NO
/N
O2/
NO
x
NO
y
VO
Cs
(PA
MS
)
Tra
ffic
Co
un
t
Win
d S
pee
d
Win
d D
irec
tio
n
Tem
per
atu
re
Dew
Po
int
/ R
el.
Hu
mid
ity
Bar
om
etri
c P
ress
ure
So
lar
Rad
iati
on
X X
X=Existing, P =Proposed, = Planned to terminate
Site Description: The Stratford Lighthouse site is a regional-scale site located in southwestern Connecticut in the town of Stratford. This is a coastal site that is located 4.5 km to the southeast of I-95 and is directly on the Long Island Sound. This site is approximately 45 km to the northeast of the New York border. This site meets all siting requirements and criteria and has been approved internally by DEEP and independently by EPA Region I. Monitoring Objectives: The Stratford Lighthouse monitoring site objective is to collect ozone measurements for compliance assessment and AQI forecasting purposes. Planned changes for 2015-2016: None
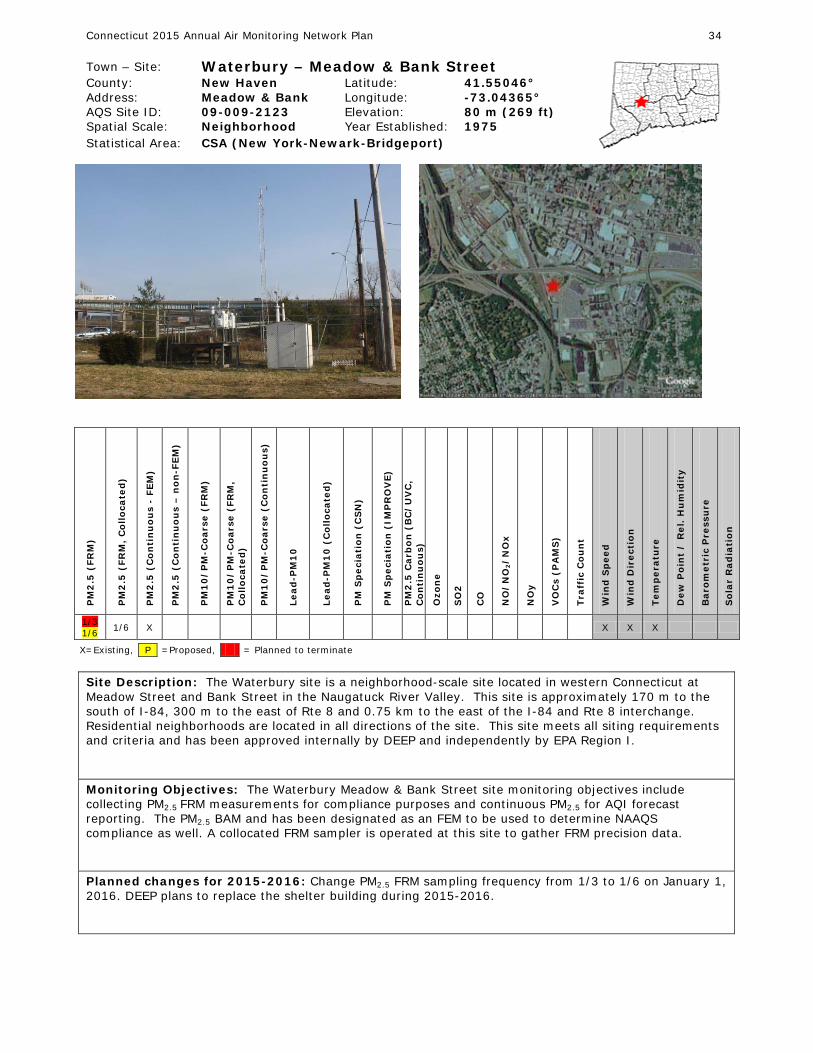
Connecticut 2015 Annual Air Monitoring Network Plan 34
Town – Site: Waterbury – Meadow & Bank Street
County: New Haven Latitude: 41.55046° Address: Meadow & Bank Longitude: -73.04365° AQS Site ID: 09-009-2123 Elevation: 80 m (269 ft) Spatial Scale: Neighborhood Year Established: 1975 Statistical Area: CSA (New York-Newark-Bridgeport)
PM
2.5
(FR
M)
PM
2.5
(FR
M,
Co
llo
cate
d)
PM
2.5
(C
on
tin
uo
us
- FE
M)
PM
2.5
(C
on
tin
uo
us
– n
on
-FE
M)
PM
10
/P
M-C
oar
se (
FRM
)
PM
10
/P
M-C
oar
se (
FRM
, C
oll
oca
ted
)
PM
10
/P
M-C
oar
se (
Co
nti
nu
ou
s)
Lead
-PM
10
Lead
-PM
10
(C
oll
oca
ted
)
PM
Sp
ecia
tio
n (
CS
N)
PM
Sp
ecia
tio
n (
IMP
RO
VE
)
PM
2.5
Car
bo
n (
BC
/U
VC
, C
on
tin
uo
us)
Ozo
ne
SO
2
CO
NO
/N
O2/
NO
x
NO
y
VO
Cs
(PA
MS
)
Tra
ffic
Co
un
t
Win
d S
pee
d
Win
d D
irec
tio
n
Tem
per
atu
re
Dew
Po
int
/ R
el.
Hu
mid
ity
Bar
om
etri
c P
ress
ure
So
lar
Rad
iati
on
1/3 1/6 1/6 X X X X
X=Existing, P =Proposed, = Planned to terminate
Site Description: The Waterbury site is a neighborhood-scale site located in western Connecticut at Meadow Street and Bank Street in the Naugatuck River Valley. This site is approximately 170 m to the south of I-84, 300 m to the east of Rte 8 and 0.75 km to the east of the I-84 and Rte 8 interchange. Residential neighborhoods are located in all directions of the site. This site meets all siting requirements and criteria and has been approved internally by DEEP and independently by EPA Region I.
Monitoring Objectives: The Waterbury Meadow & Bank Street site monitoring objectives include collecting PM2.5 FRM measurements for compliance purposes and continuous PM2.5 for AQI forecast reporting. The PM2.5 BAM and has been designated as an FEM to be used to determine NAAQS compliance as well. A collocated FRM sampler is operated at this site to gather FRM precision data. Planned changes for 2015-2016: Change PM2.5 FRM sampling frequency from 1/3 to 1/6 on January 1, 2016. DEEP plans to replace the shelter building during 2015-2016.
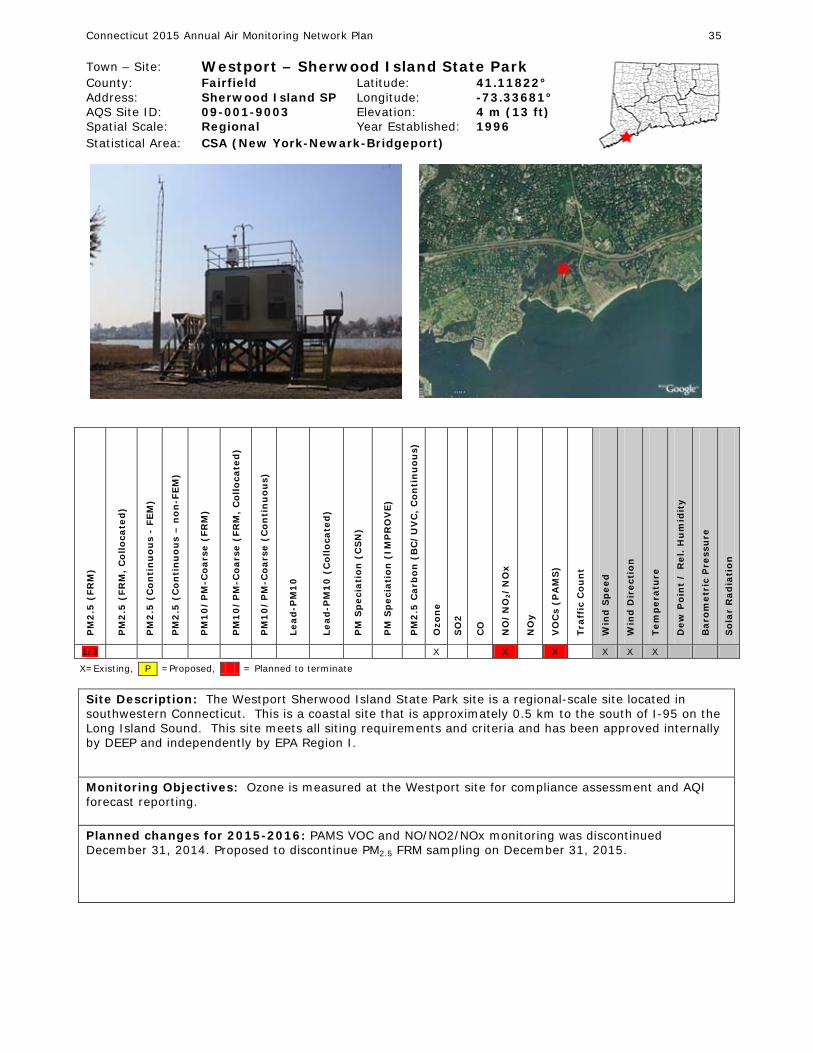
Connecticut 2015 Annual Air Monitoring Network Plan 35
Town – Site: Westport – Sherwood Island State Park
County: Fairfield Latitude: 41.11822° Address: Sherwood Island SP Longitude: -73.33681° AQS Site ID: 09-001-9003 Elevation: 4 m (13 ft) Spatial Scale: Regional Year Established: 1996 Statistical Area: CSA (New York-Newark-Bridgeport)
PM
2.5
(FR
M)
PM
2.5
(FR
M,
Co
llo
cate
d)
PM
2.5
(C
on
tin
uo
us
- FE
M)
PM
2.5
(C
on
tin
uo
us
– n
on
-FE
M)
PM
10
/P
M-C
oar
se (
FRM
)
PM
10
/P
M-C
oar
se (
FRM
, C
oll
oca
ted
)
PM
10
/P
M-C
oar
se (
Co
nti
nu
ou
s)
Lead
-PM
10
Lead
-PM
10
(C
oll
oca
ted
)
PM
Sp
ecia
tio
n (
CS
N)
PM
Sp
ecia
tio
n (
IMP
RO
VE
)
PM
2.5
Car
bo
n (
BC
/U
VC
, C
on
tin
uo
us)
Ozo
ne
SO
2
CO
NO
/N
O2/
NO
x
NO
y
VO
Cs
(PA
MS
)
Tra
ffic
Co
un
t
Win
d S
pee
d
Win
d D
irec
tio
n
Tem
per
atu
re
Dew
Po
int
/ R
el.
Hu
mid
ity
Bar
om
etri
c P
ress
ure
So
lar
Rad
iati
on
1/3 X X X X X X
X=Existing, P =Proposed, = Planned to terminate Site Description: The Westport Sherwood Island State Park site is a regional-scale site located in southwestern Connecticut. This is a coastal site that is approximately 0.5 km to the south of I-95 on the Long Island Sound. This site meets all siting requirements and criteria and has been approved internally by DEEP and independently by EPA Region I.
Monitoring Objectives: Ozone is measured at the Westport site for compliance assessment and AQI forecast reporting. Planned changes for 2015-2016: PAMS VOC and NO/NO2/NOx monitoring was discontinued December 31, 2014. Proposed to discontinue PM2.5 FRM sampling on December 31, 2015.

Connecticut 2015 Annual Air Monitoring Network Plan 36
References Connecticut Department of Environmental Protection (2004). Limited Maintenance Plans for the Hartford, the New Haven, and the Connecticut Portion of the New York/New Jersey/Connecticut Carbon Monoxide Maintenance Areas. June 18, 2004

Appendix A PM2.5 FRM vs Continuous Correlation Charts
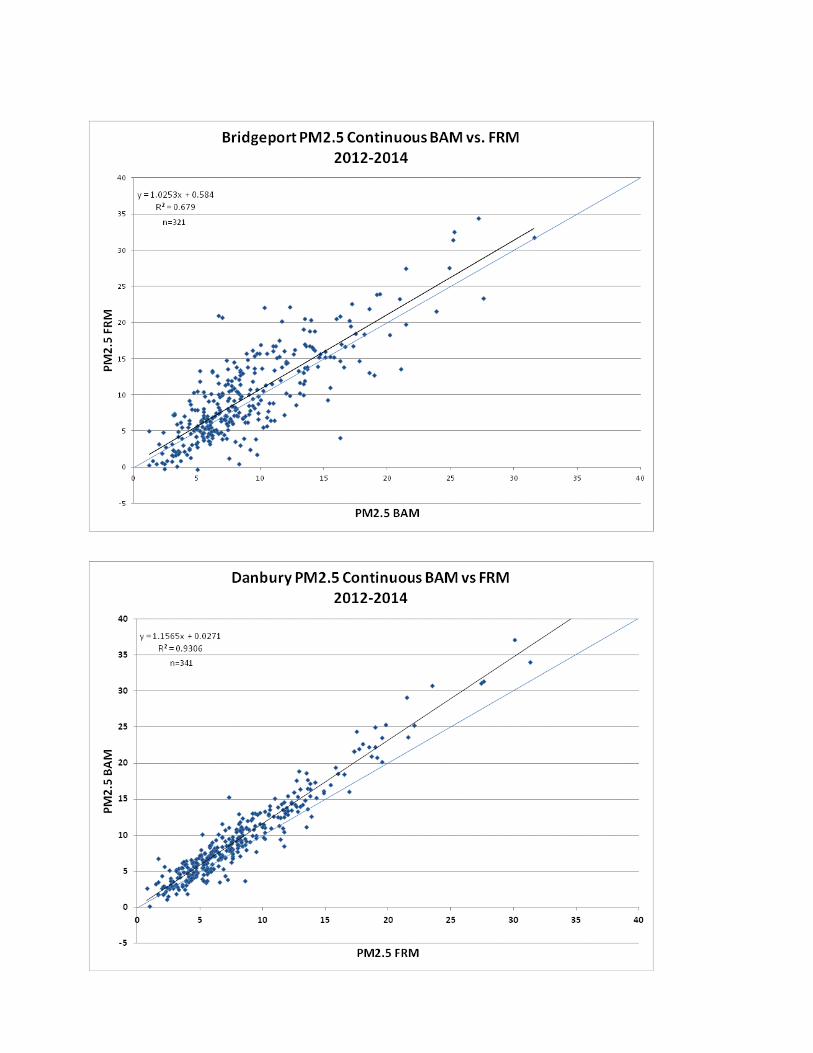
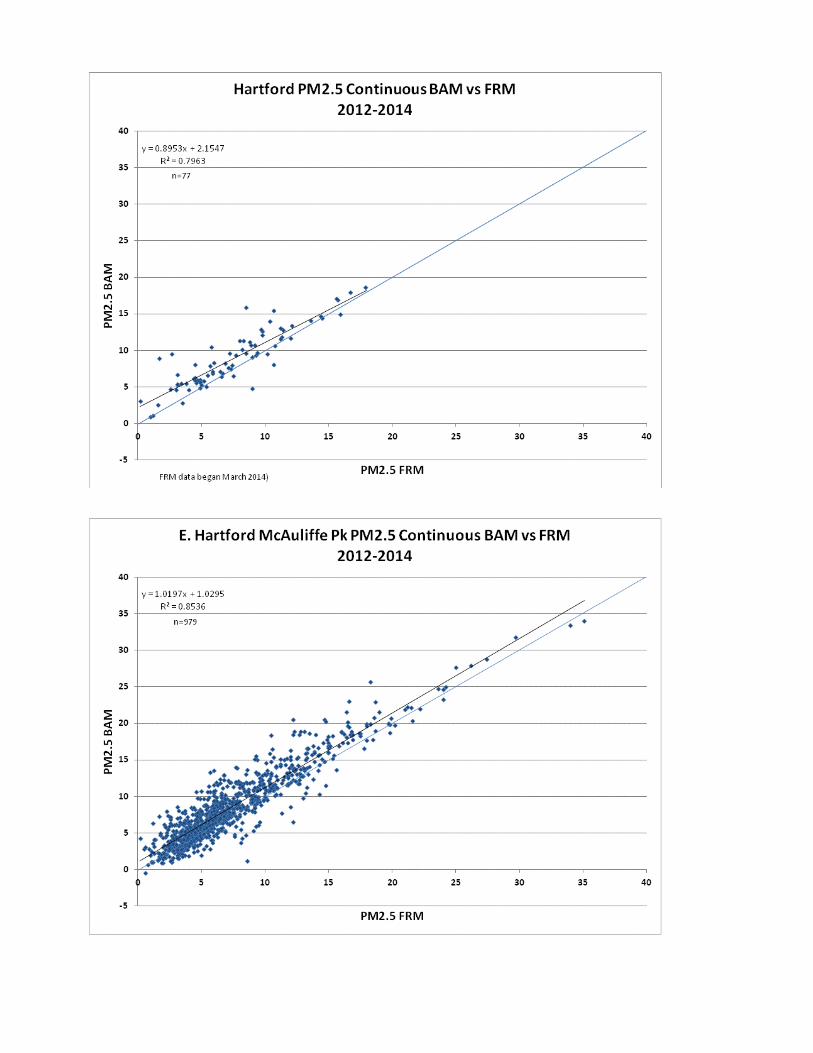
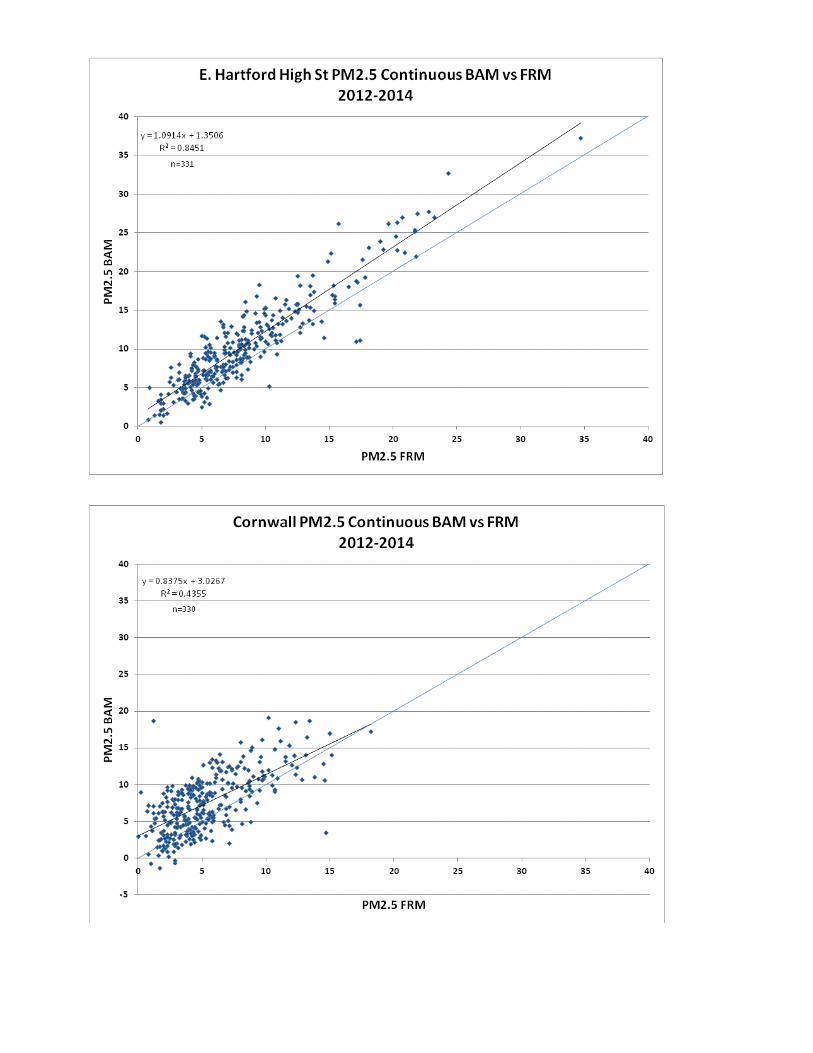
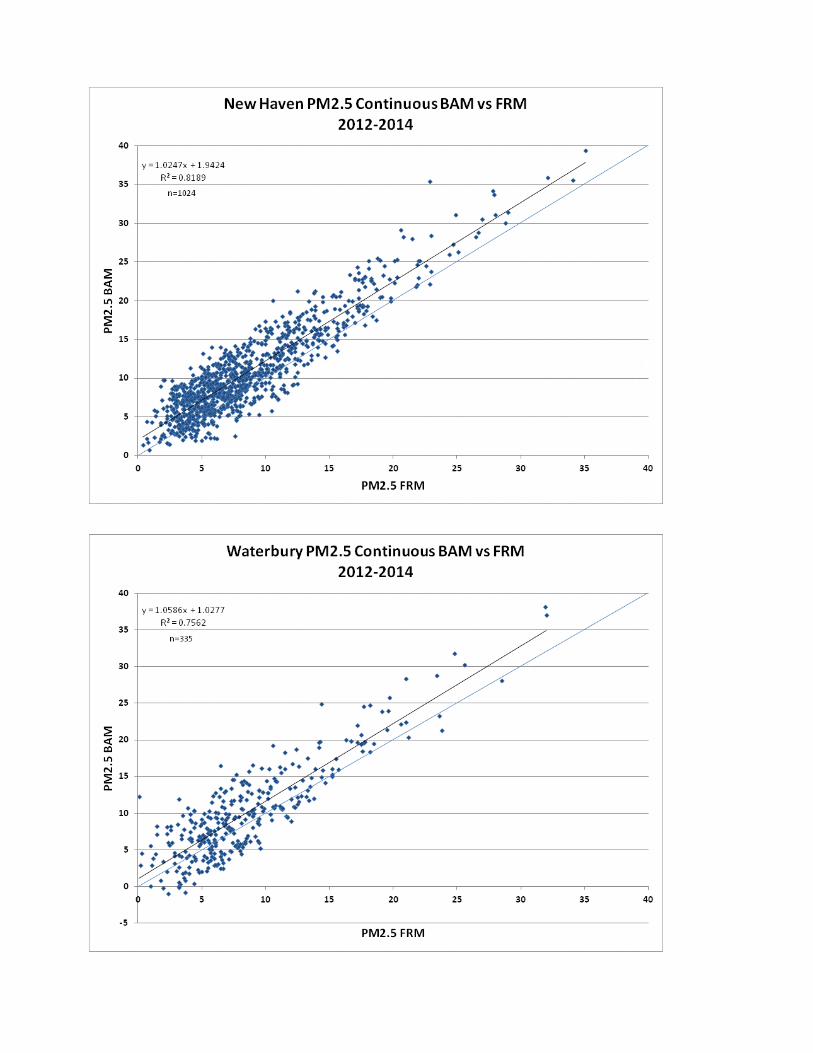

Appendix B Public Comments Received With DEEP Responses
Response to EPA-New England June 3, 2015 Comments on Network Plan DEEP acknowledges the following numbered comments that do not require a specific response or Network Plan edits: 1, 3, 5, 6, and 7. DEEP’s responses to the remaining comments are given below. 2. DEEP had proposed to discontinue lead (Pb-PM10) sampling on September 30, 2015. We acknowledge that shutdown of this monitor is contingent on the timing and final language of EPA’s 40 CFR Part 58 rulemaking. This has been clarified in the Lead Network discussion section on page 19 and in the New Haven monitoring summary on page 31. 4. The monitoring objectives for the Westport station have been edited to remove references to ozone (page 35), NOX and VOC monitoring. DEEP will consider adding VOC monitoring to the Hartford near road site in the future, but does not propose to do so within the time frame of this Network Plan. 8. Language has been added in the SO2 Network discussion (page 18) that allows that the SO2 Data Requirements Rule may require additional monitoring. 9. The color coding errors in the Cornwall monitoring summary chart on page 23 have been corrected to show PM2.5 (continuous FEM) as “proposed” and PM2.5 (continuous non-FEM) as “planned to terminate.” 10. The date for the planned PM2.5 sampling frequency changes at Waterbury has been corrected to January 1, 2016.