connected business strategy - goodyear corporate · deutsche bank iaa cars 2017 conference...
TRANSCRIPT

Deutsche Bank IAA Cars 2017 Conference
September 13, 2017
Connected Business Strategy
Forward-Looking Statements
Certain information contained in this presentation constitutes forward-looking statements for purposes of the safe
harbor provisions of The Private Securities Litigation Reform Act of 1995. There are a variety of factors, many of which
are beyond our control, that affect our operations, performance, business strategy and results and could cause our
actual results and experience to differ materially from the assumptions, expectations and objectives expressed in any
forward-looking statements. These factors include, but are not limited to: our ability to implement successfully our
strategic initiatives; actions and initiatives taken by both current and potential competitors; increases in the prices paid
for raw materials and energy; a labor strike, work stoppage or other similar event; foreign currency translation and
transaction risks; deteriorating economic conditions or an inability to access capital markets; work stoppages, financial
difficulties or supply disruptions at our suppliers or customers; the adequacy of our capital expenditures; our failure to
comply with a material covenant in our debt obligations; potential adverse consequences of litigation involving the
company; as well as the effects of more general factors such as changes in general market, economic or political
conditions or in legislation, regulation or public policy. Additional factors are discussed in our filings with the Securities
and Exchange Commission, including our annual report on Form 10-K, quarterly reports on Form 10-Q and current
reports on Form 8-K. In addition, any forward-looking statements represent our estimates only as of today and should
not be relied upon as representing our estimates as of any subsequent date. While we may elect to update forward-
looking statements at some point in the future, we specifically disclaim any obligation to do so, even if our estimates
change.
2
3
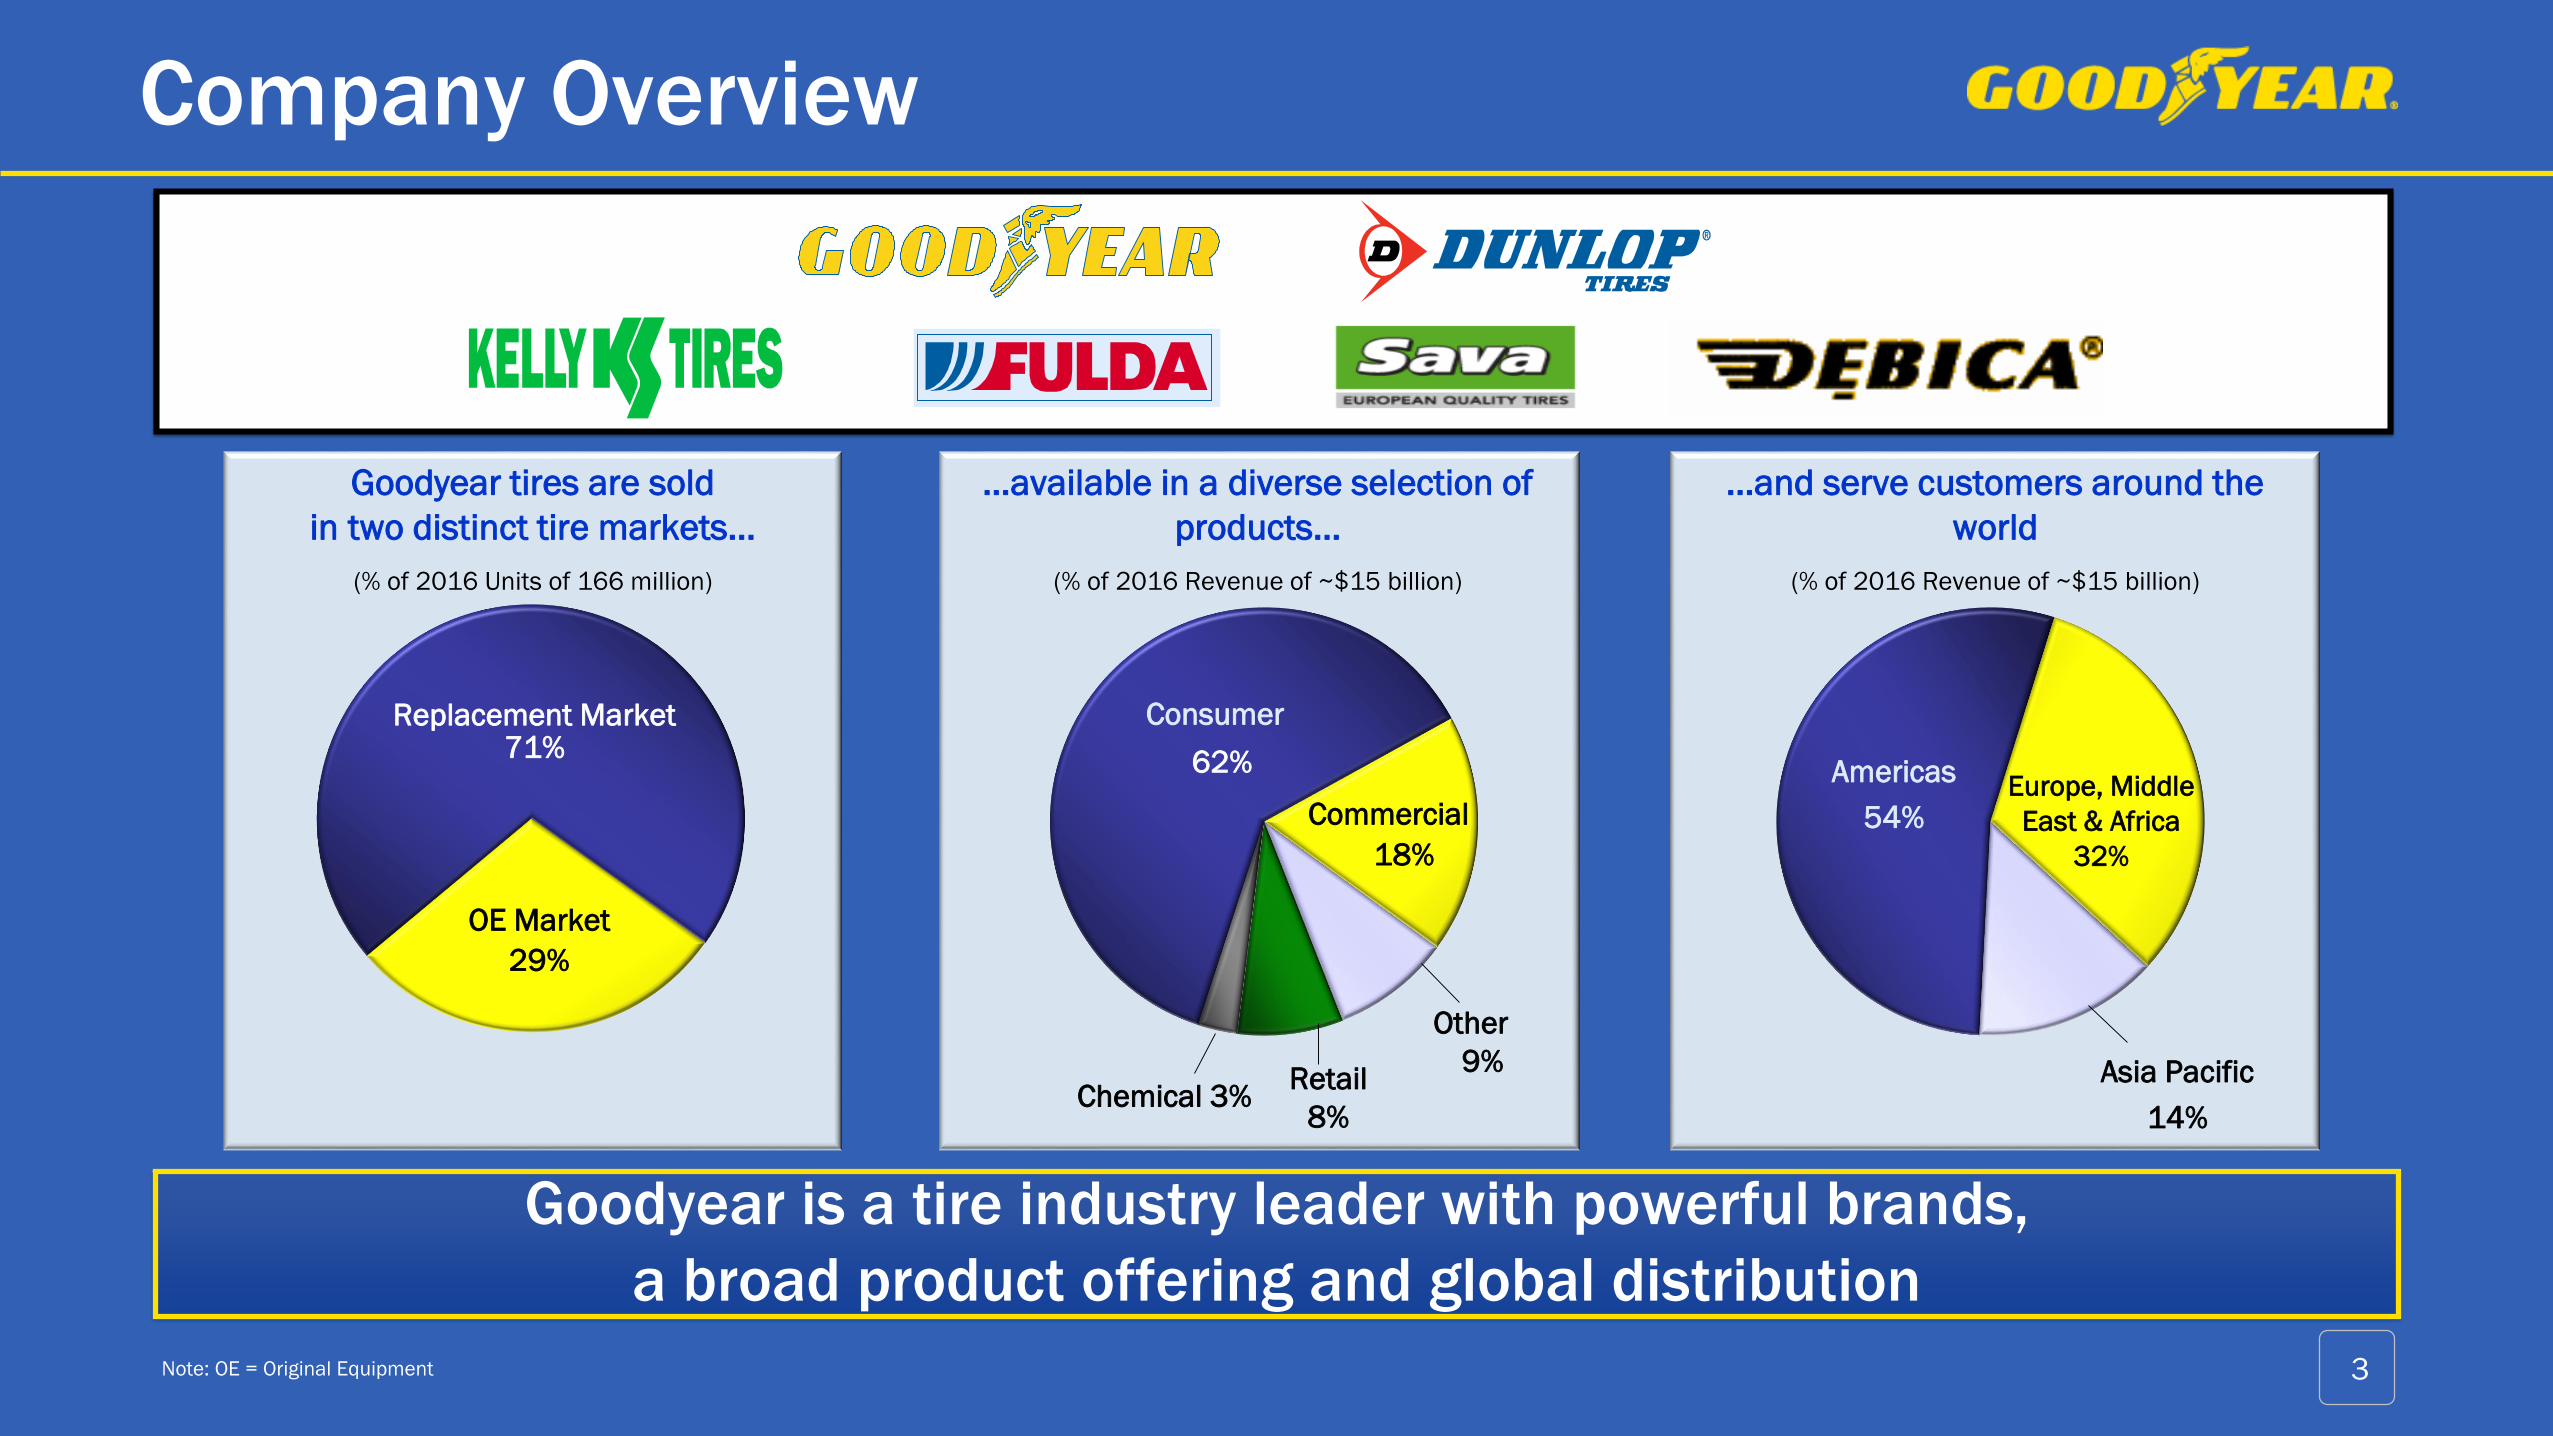
Company Overview
Goodyear is a tire industry leader with powerful brands,
a broad product offering and global distribution
Note: OE = Original Equipment
Replacement Market71%
OE Market
29%
Retail
8%
Other
9%Chemical 3%
Commercial
62%
Consumer
18%
Americas
54%Europe, Middle
East & Africa
32%
Asia Pacific
14%
Goodyear tires are sold
in two distinct tire markets...
(% of 2016 Units of 166 million)
...and serve customers around the
world
(% of 2016 Revenue of ~$15 billion)
…available in a diverse selection of
products...
(% of 2016 Revenue of ~$15 billion)
4
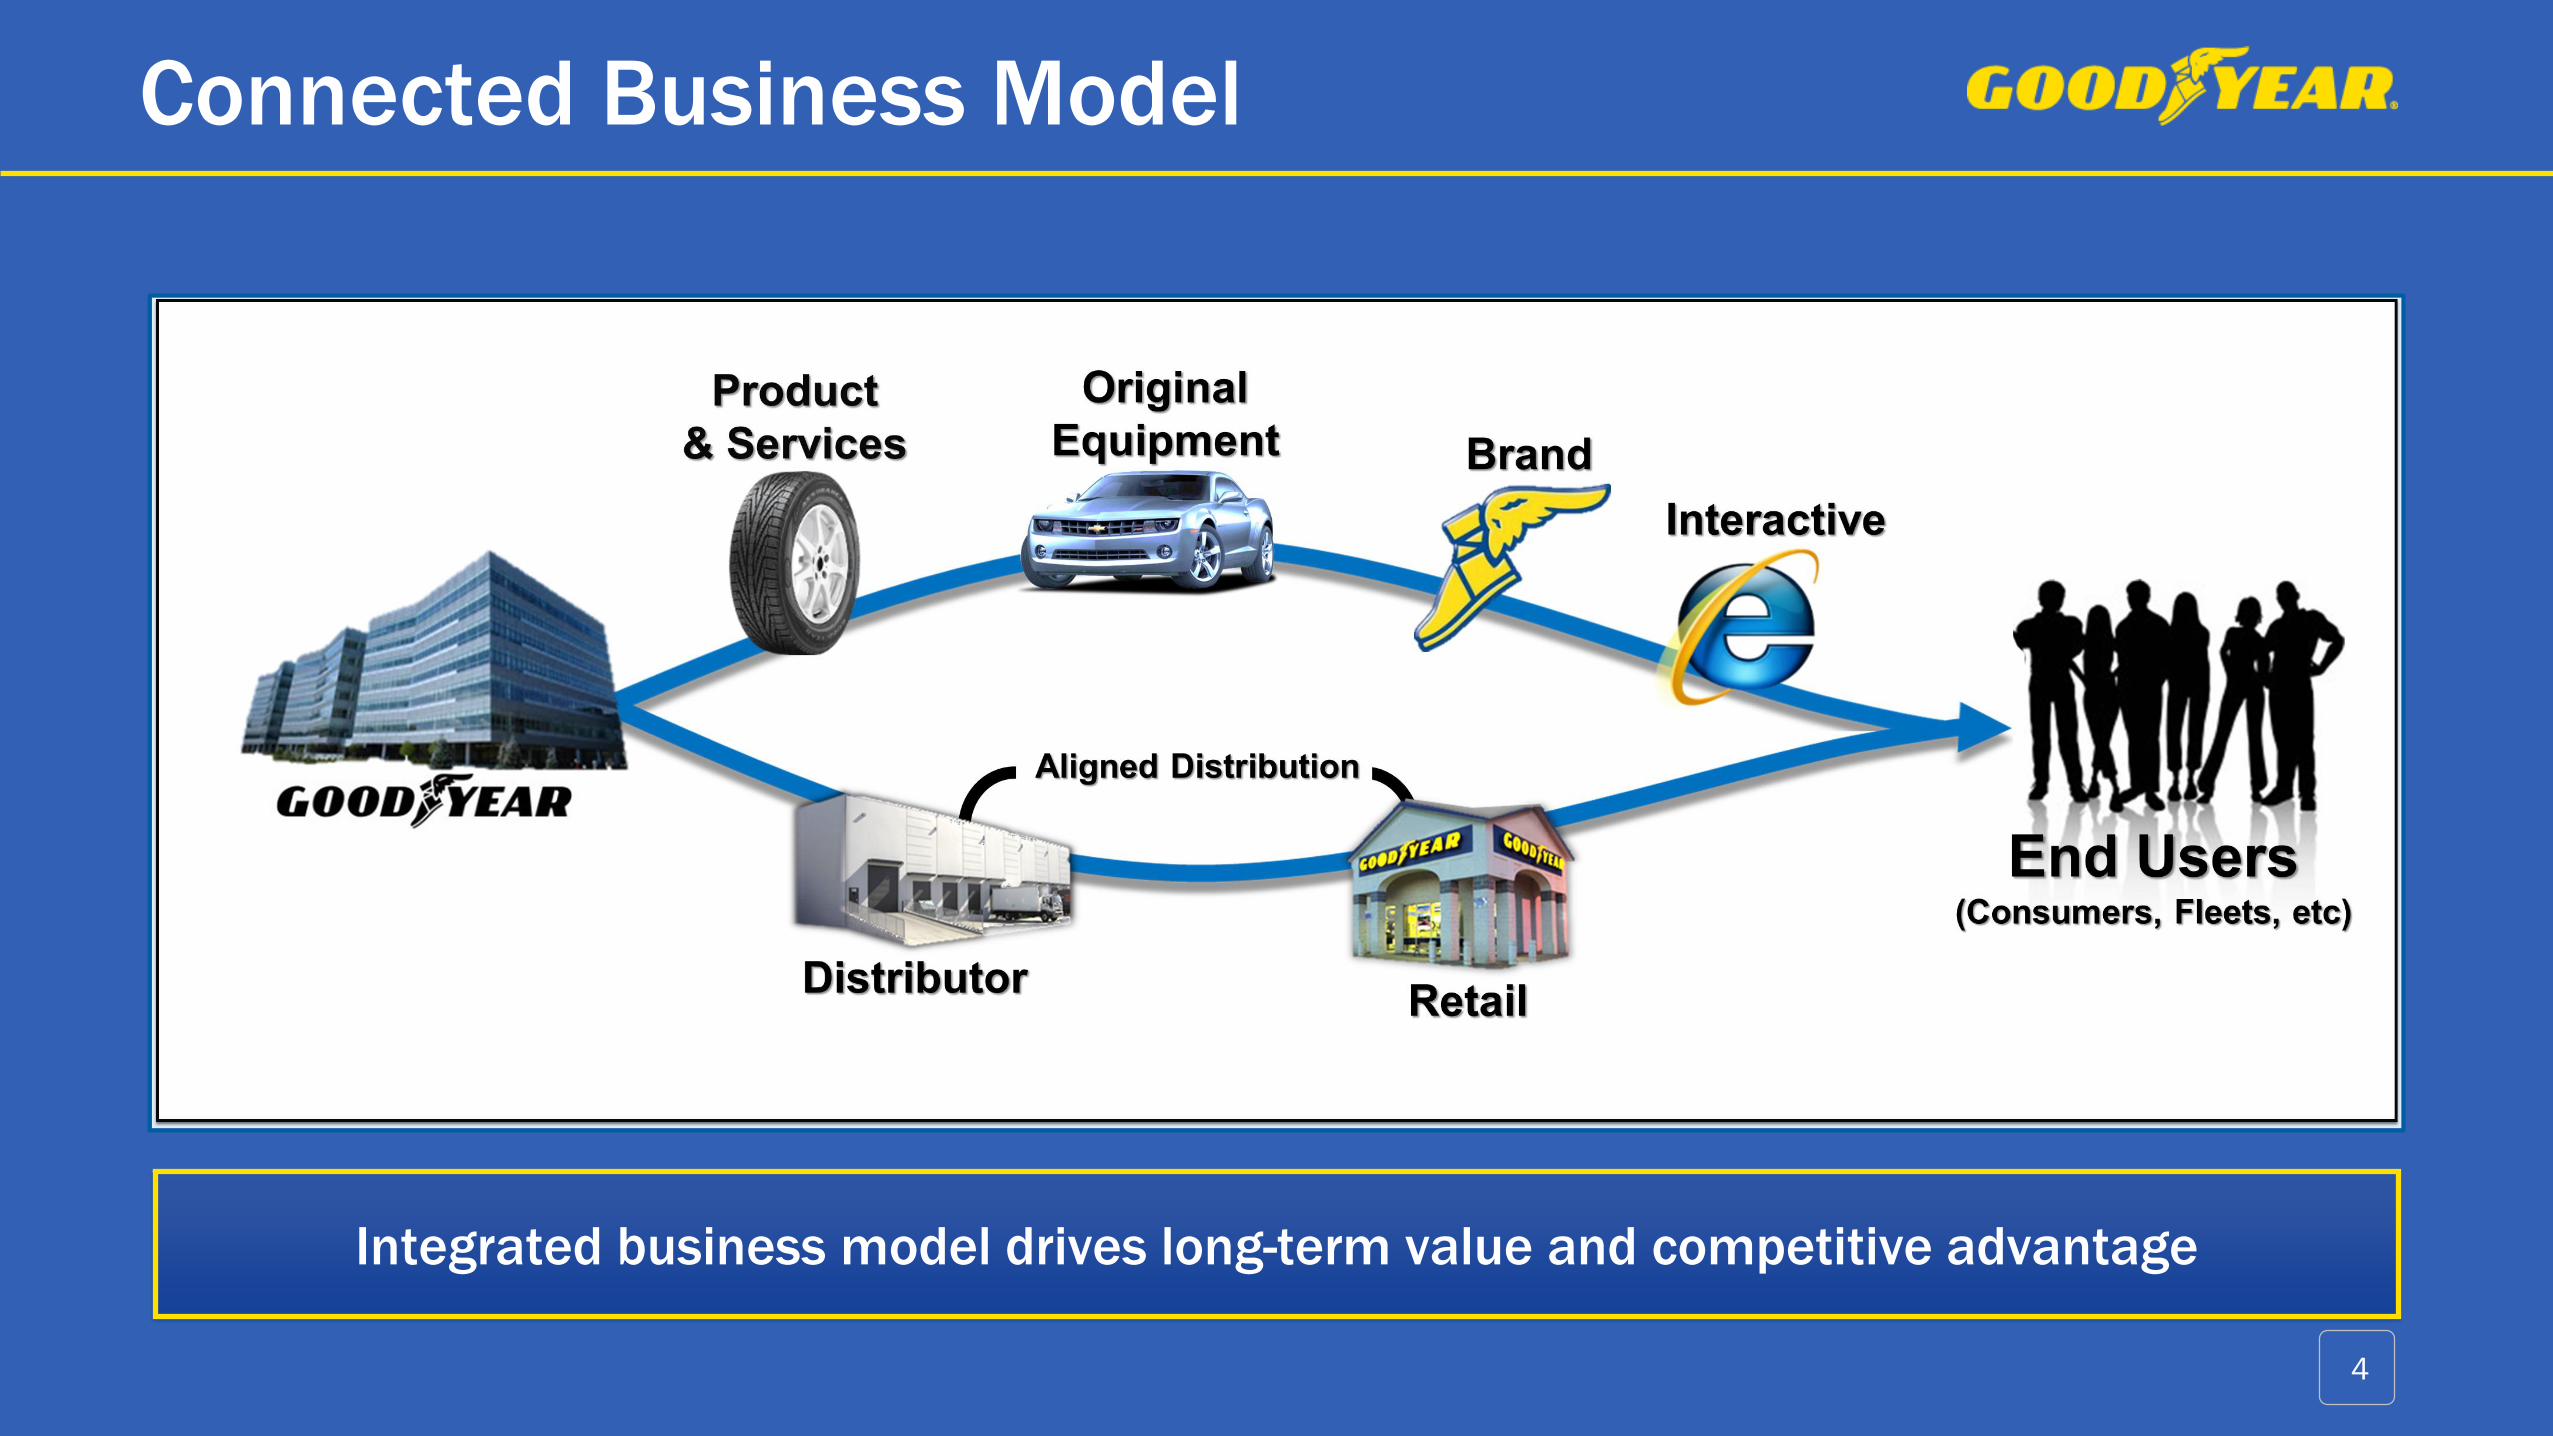
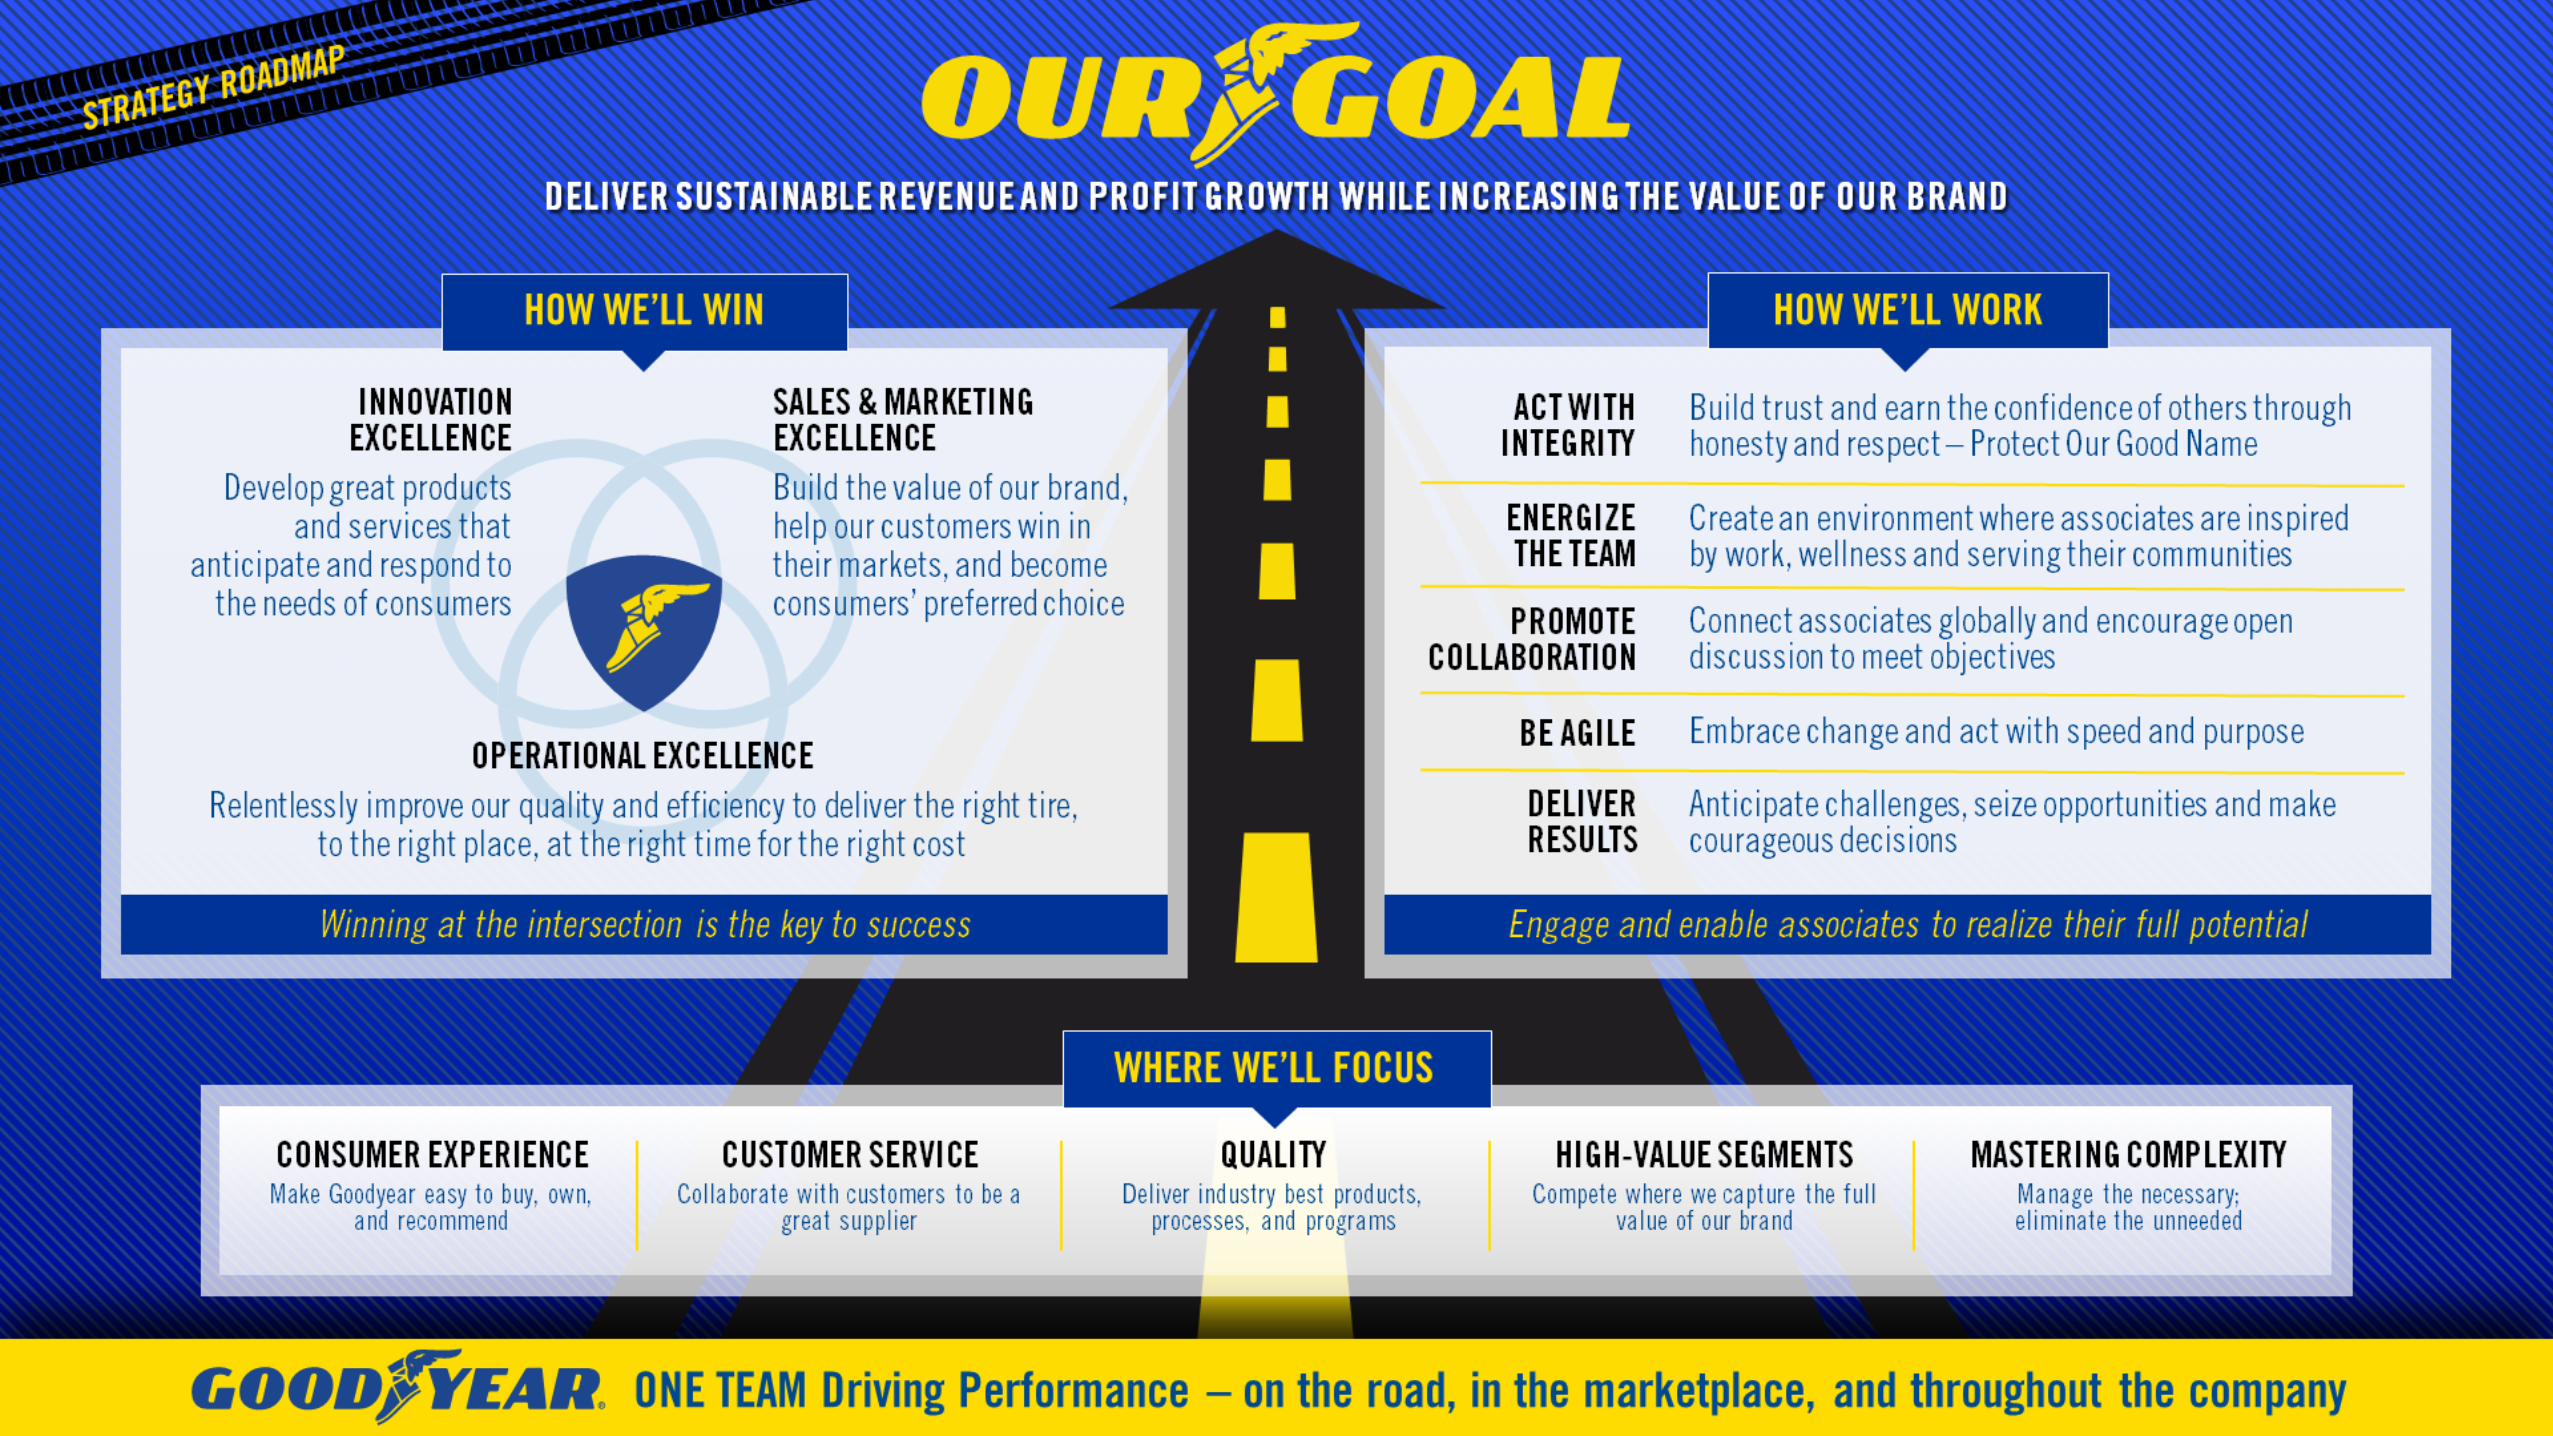
Connected Business Model
Integrated business model drives long-term value and competitive advantage
Proven ability to drive performance improvement … results reflect our progress
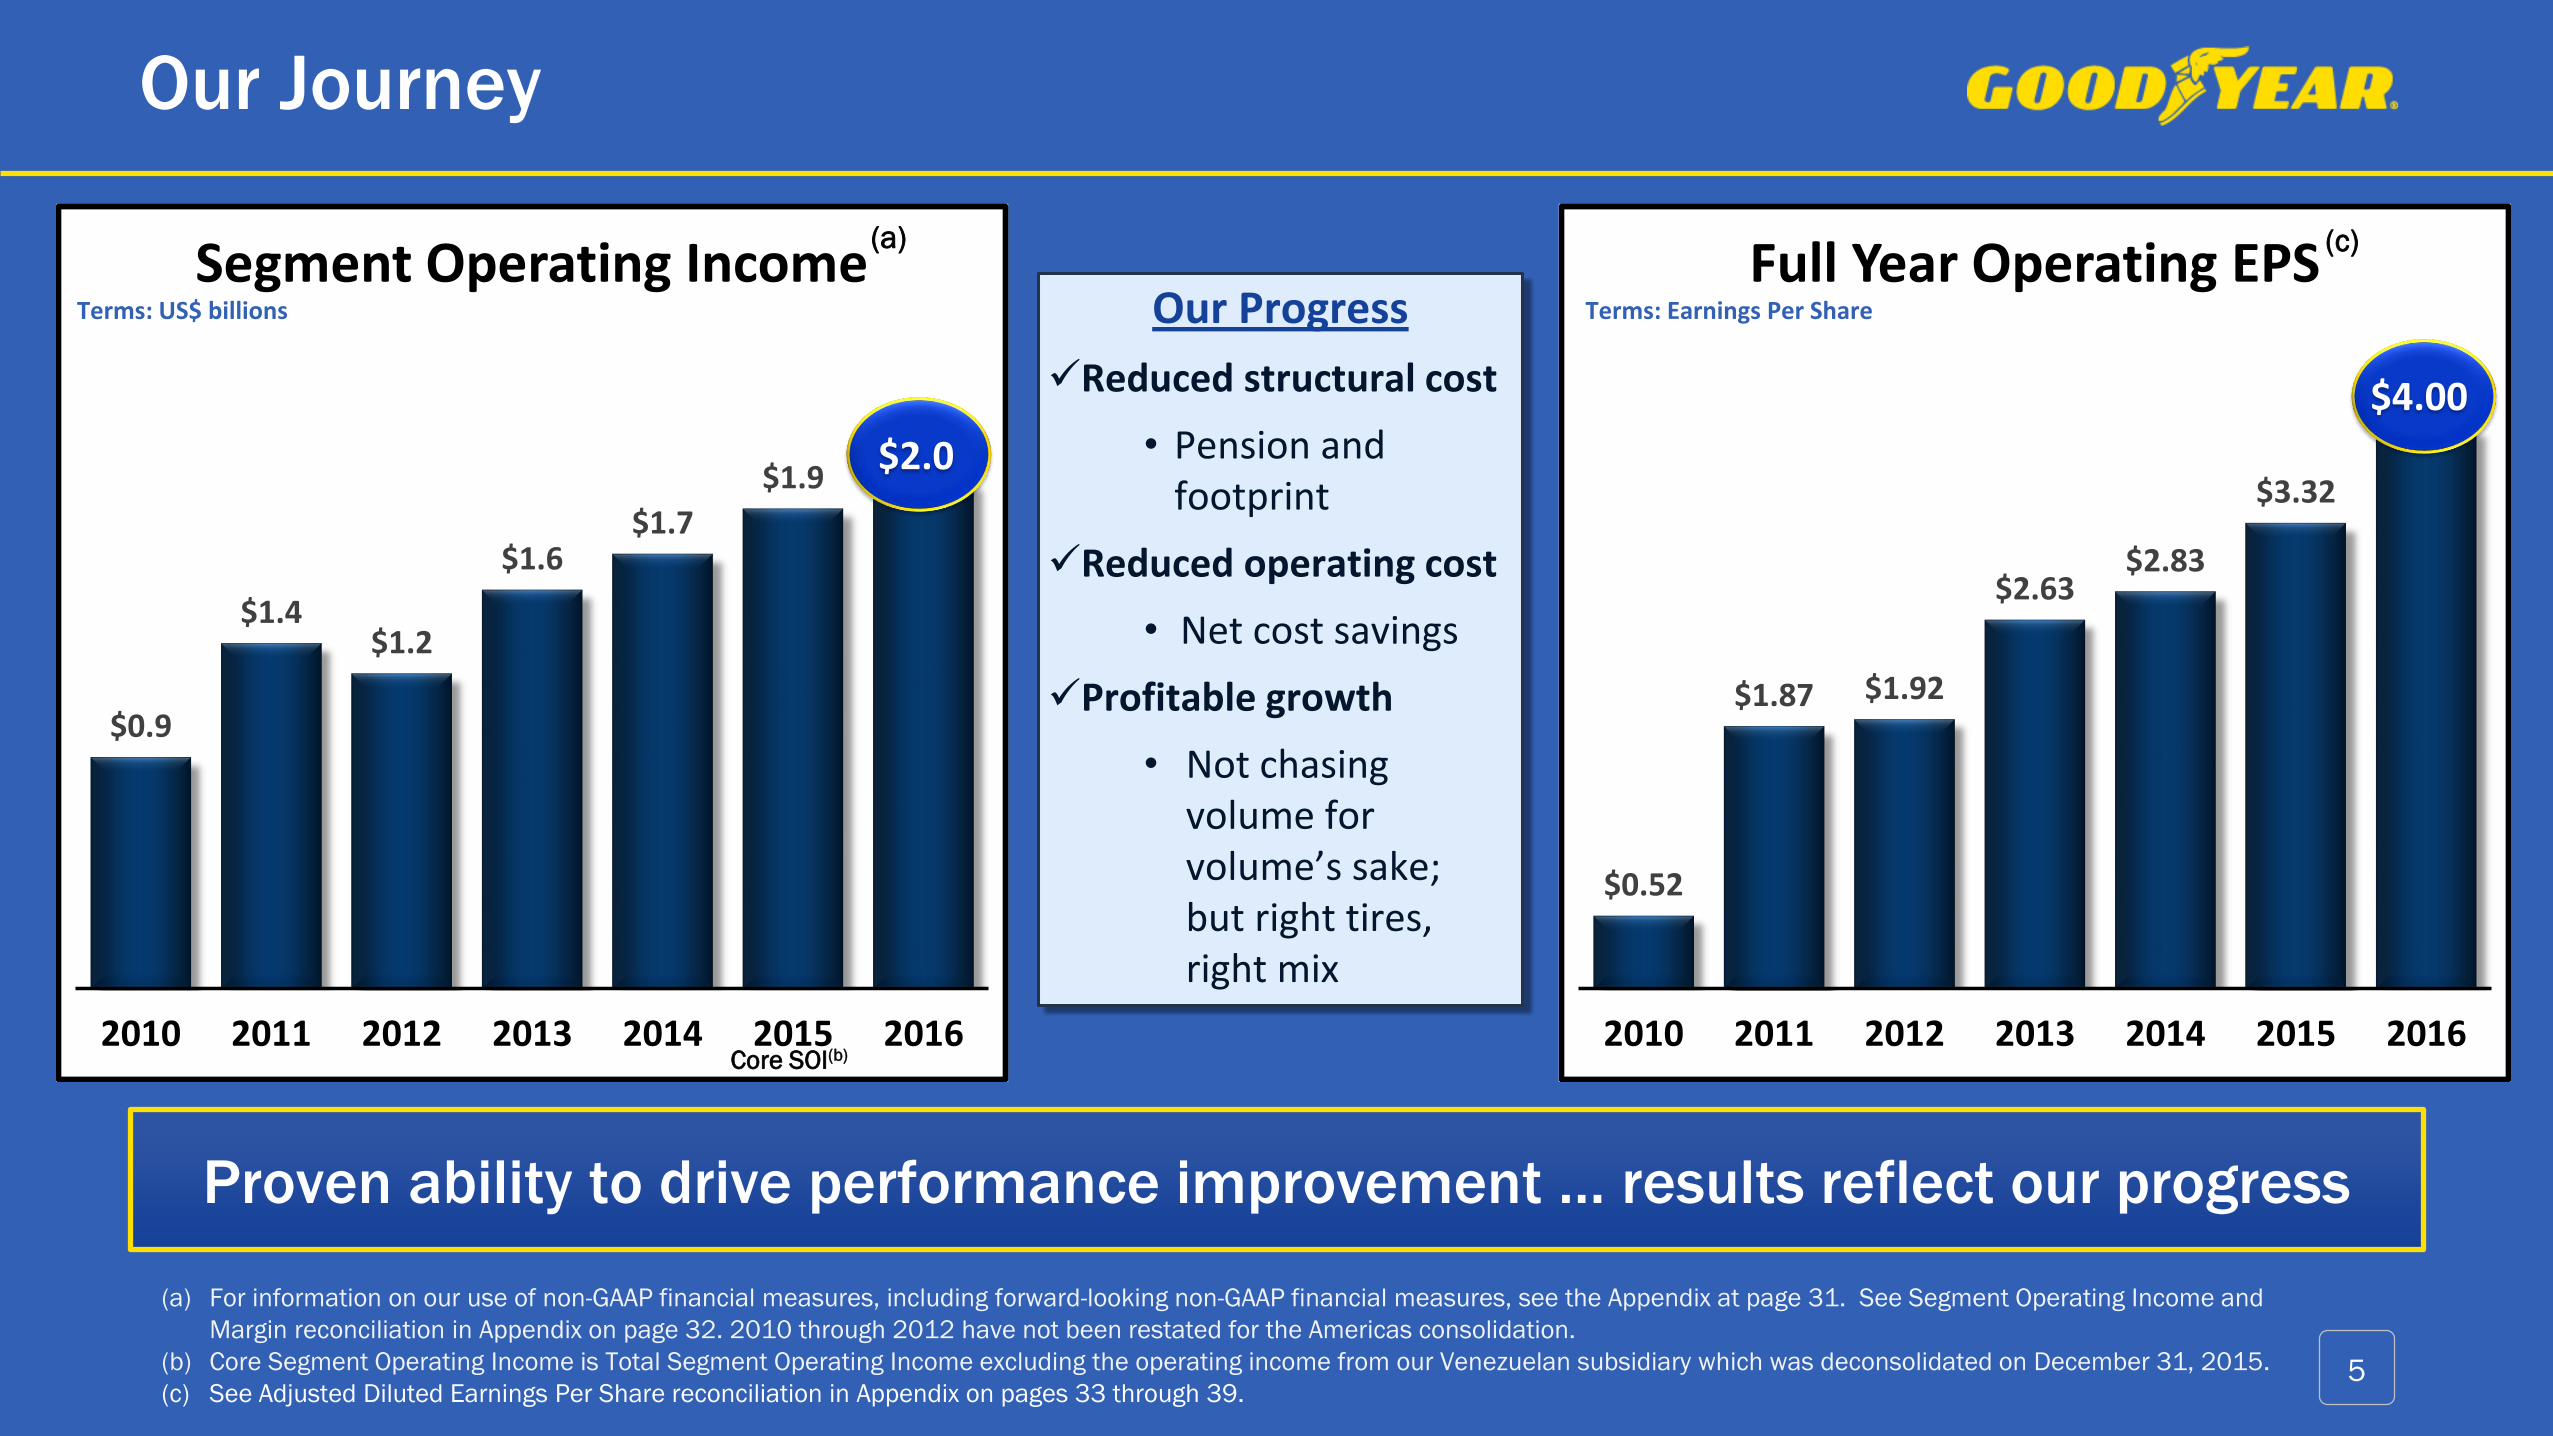
Our Journey
(a) For information on our use of non-GAAP financial measures, including forward-looking non-GAAP financial measures, see the Appendix at page 31. See Segment Operating Income and
Margin reconciliation in Appendix on page 32. 2010 through 2012 have not been restated for the Americas consolidation.
(b) Core Segment Operating Income is Total Segment Operating Income excluding the operating income from our Venezuelan subsidiary which was deconsolidated on December 31, 2015.
(c) See Adjusted Diluted Earnings Per Share reconciliation in Appendix on pages 33 through 39.5
$0.9
$1.4$1.2
$1.6$1.7
$1.9$2.0
2010 2011 2012 2013 2014 2015 2016
Segment Operating Income
Core SOI(b)
(a)
Terms: US$ billions
$2.0
Our Progress
✓Reduced structural cost
• Pension and footprint
✓Reduced operating cost
• Net cost savings
✓Profitable growth
• Not chasing volume for volume’s sake; but right tires, right mix
$0.52
$1.87 $1.92
$2.63$2.83
$3.32
$4.00
2010 2011 2012 2013 2014 2015 2016
Full Year Operating EPS(c)
Terms: Earnings Per Share
$4.00
6
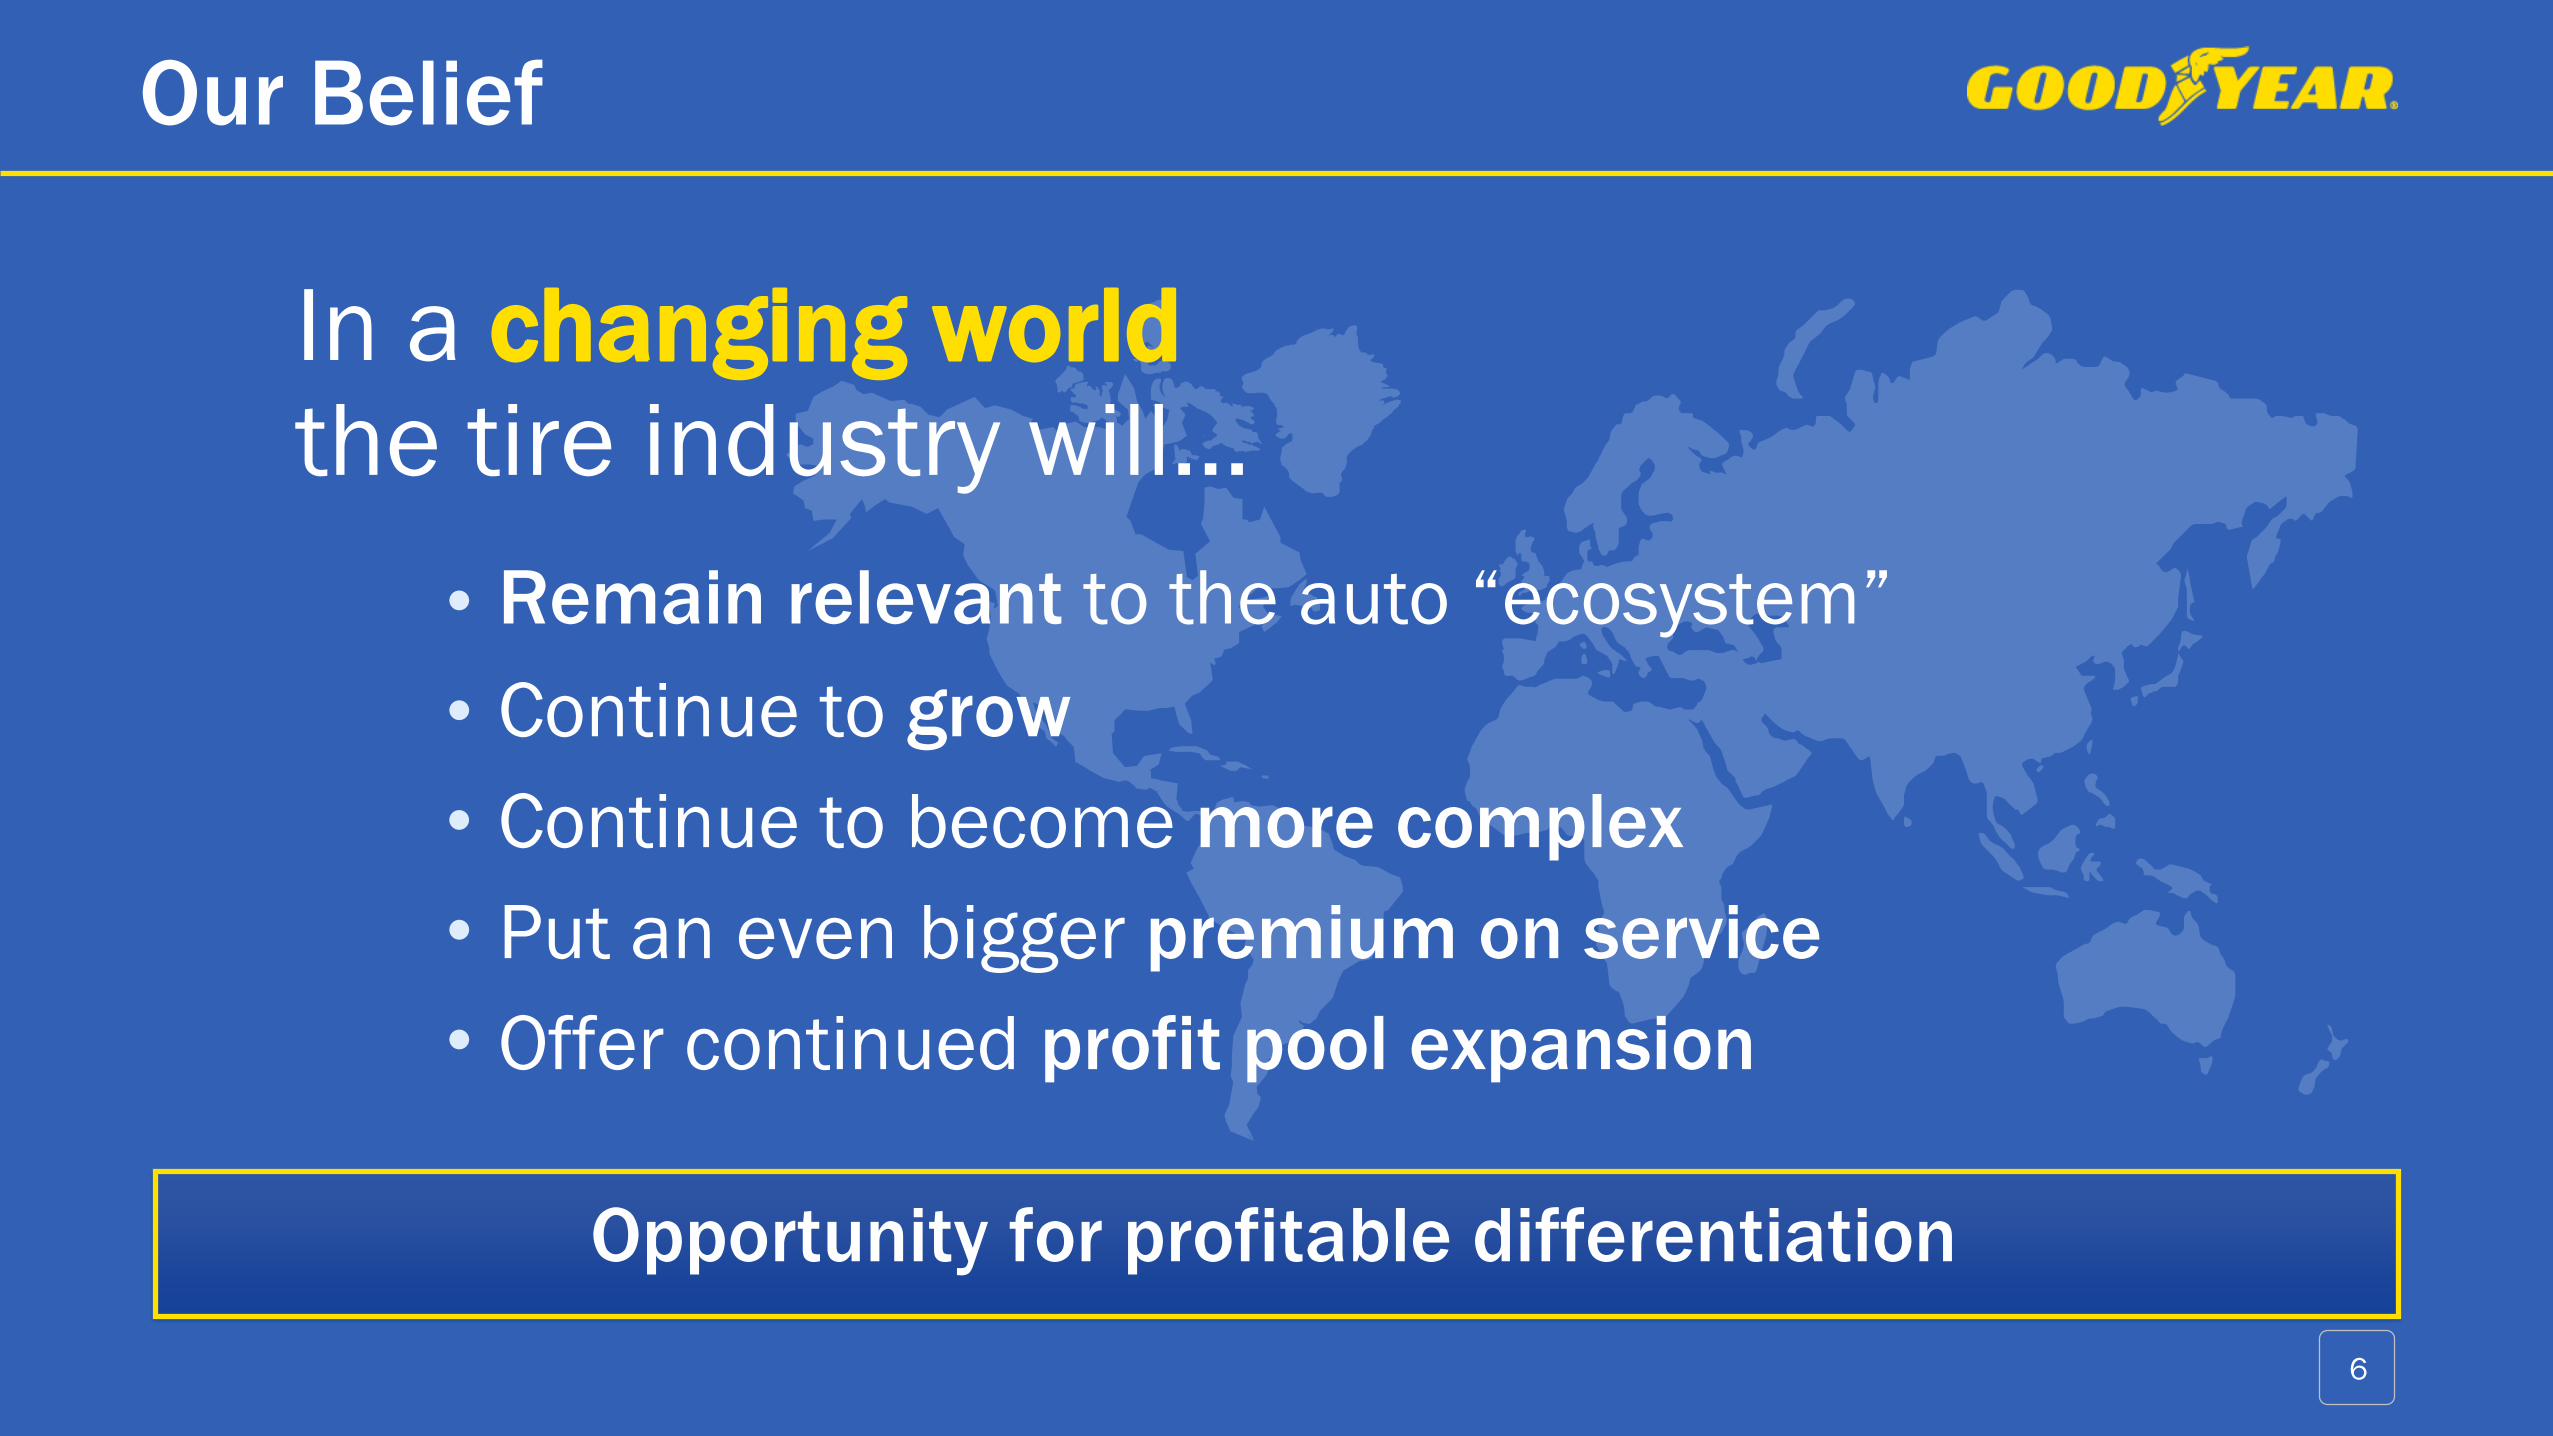
In a changing worldthe tire industry will…
Remain relevant to the auto “ecosystem”
Continue to grow
Continue to become more complex
Put an even bigger premium on service
Offer continued profit pool expansion
Our Belief
Opportunity for profitable differentiation
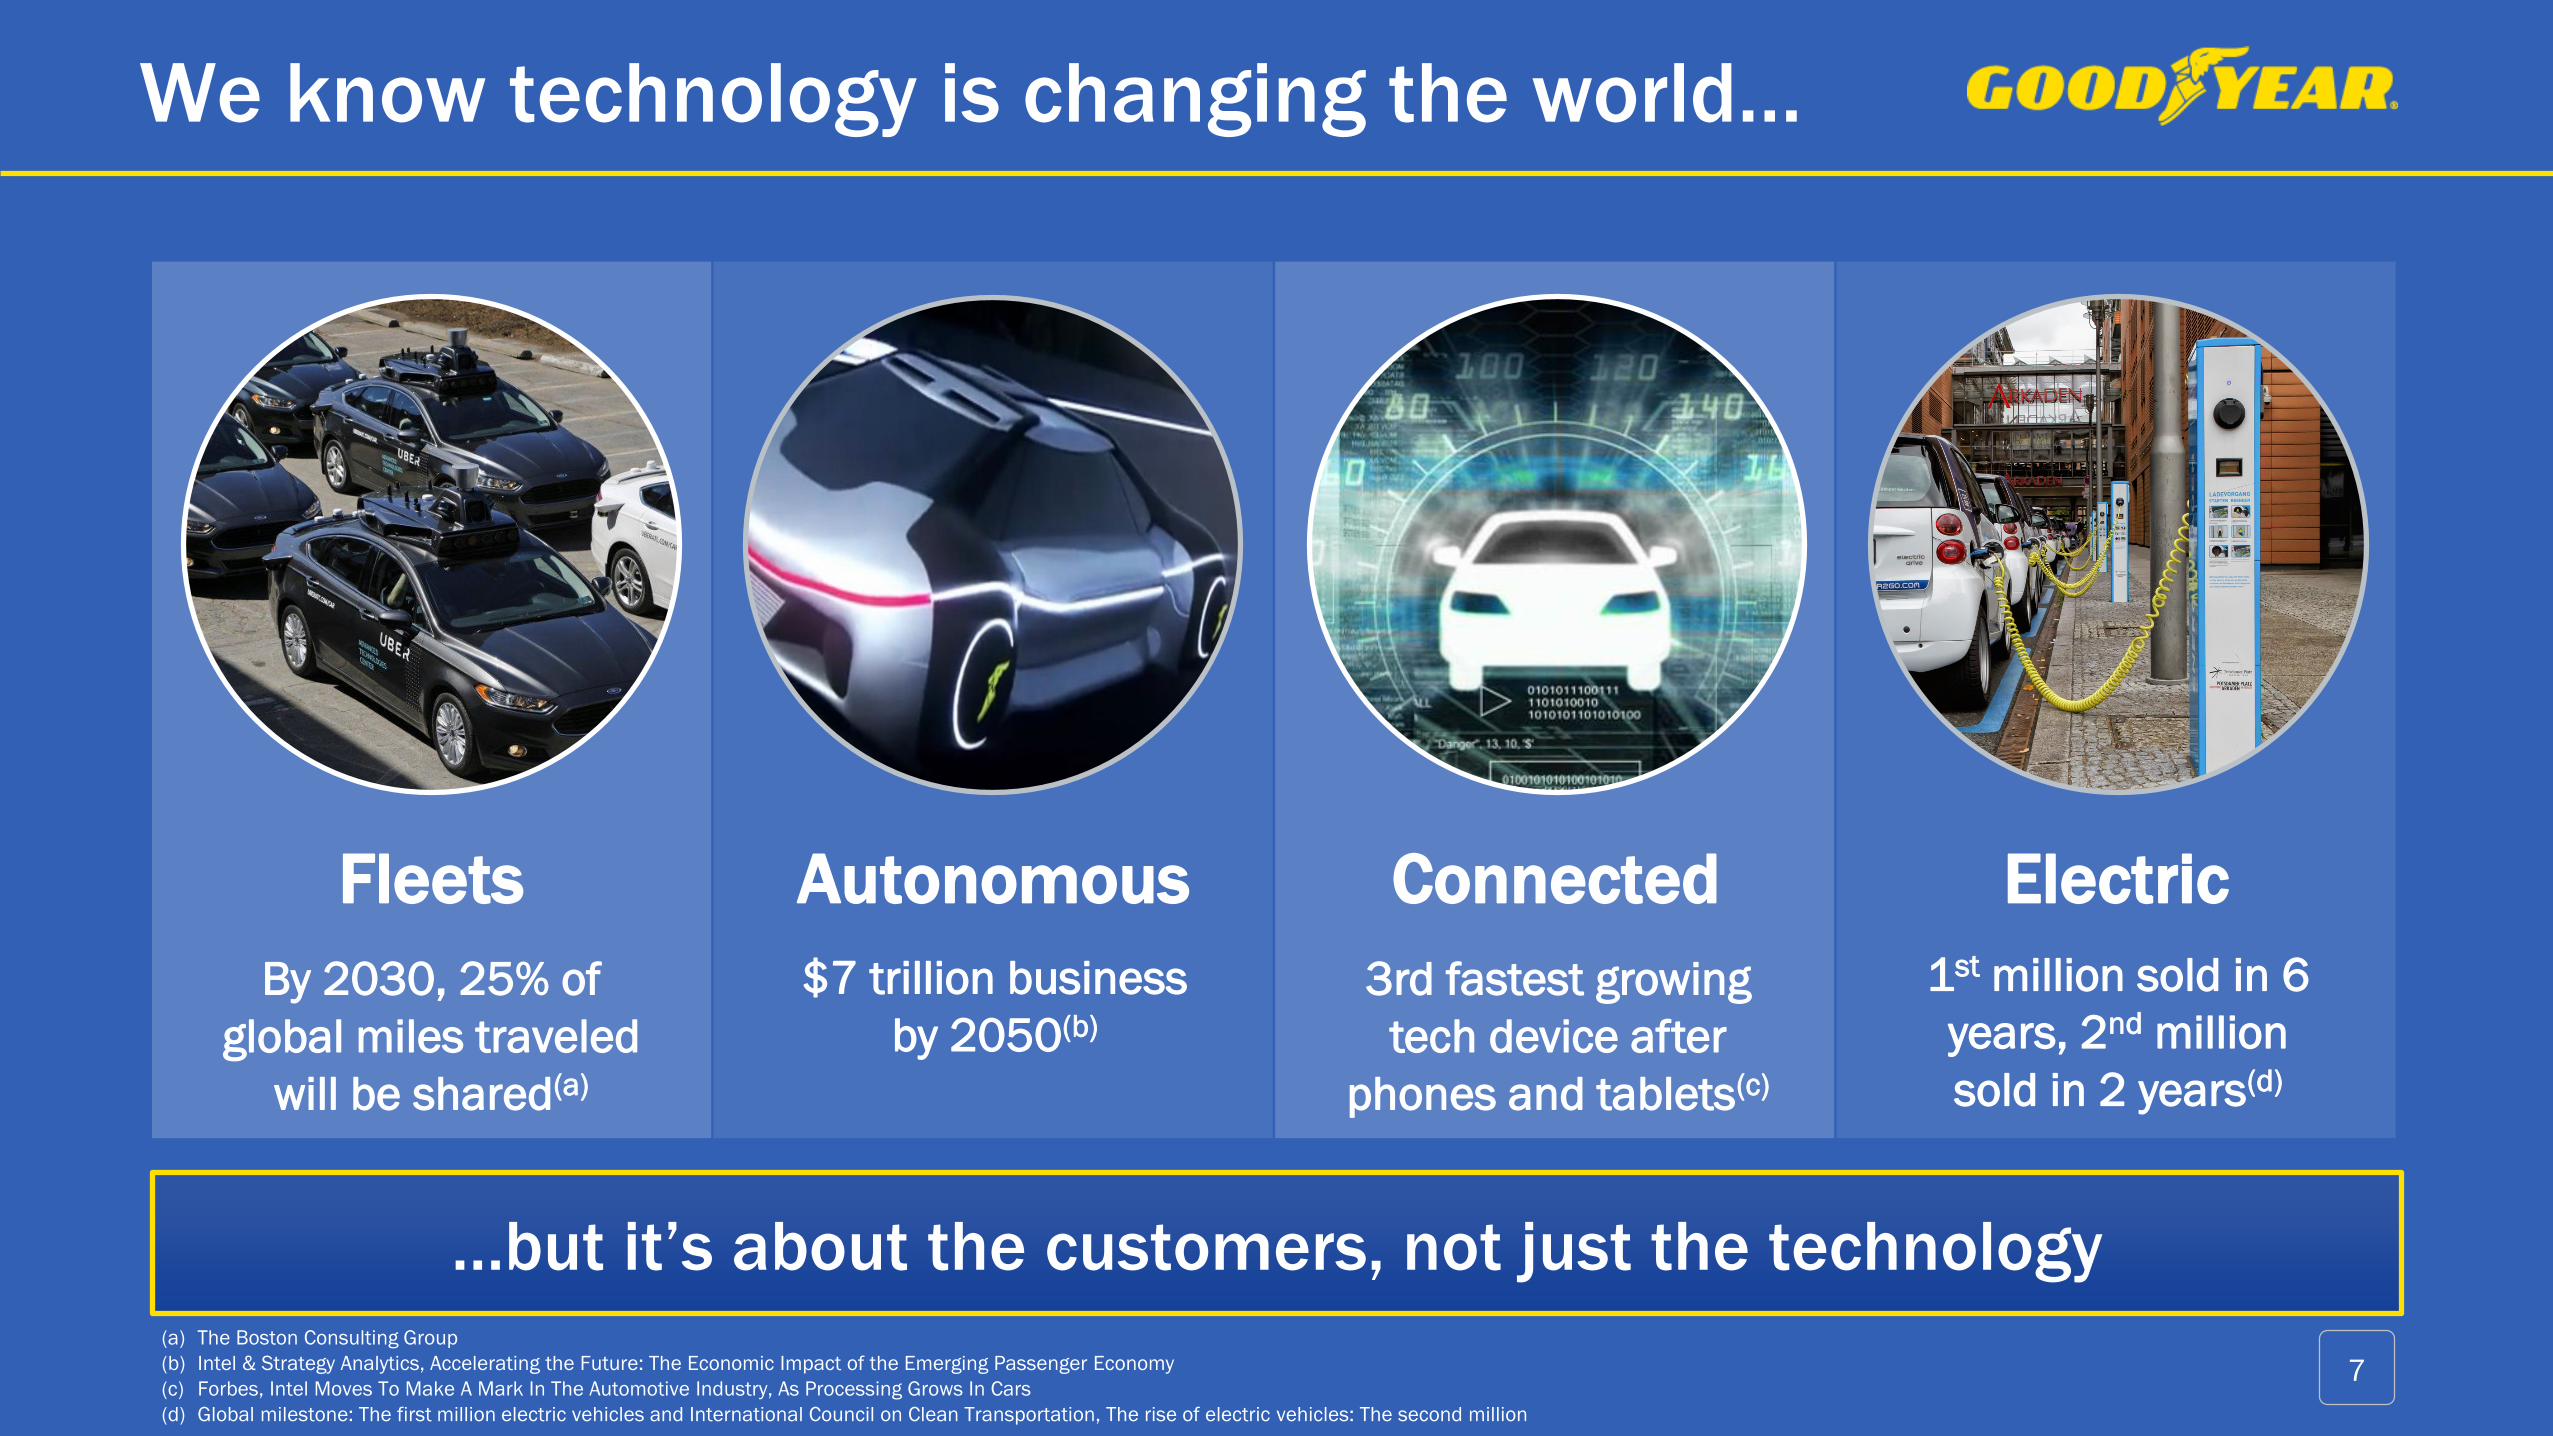
We know technology is changing the world…
(a) The Boston Consulting Group
(b) Intel & Strategy Analytics, Accelerating the Future: The Economic Impact of the Emerging Passenger Economy
(c) Forbes, Intel Moves To Make A Mark In The Automotive Industry, As Processing Grows In Cars
(d) Global milestone: The first million electric vehicles and International Council on Clean Transportation, The rise of electric vehicles: The second million
By 2030, 25% of
global miles traveled
will be shared(a)
$7 trillion business
by 2050(b)
3rd fastest growing
tech device after
phones and tablets(c)
1st million sold in 6
years, 2nd million
sold in 2 years(d)
Fleets Autonomous Connected Electric
…but it’s about the customers, not just the technology
7
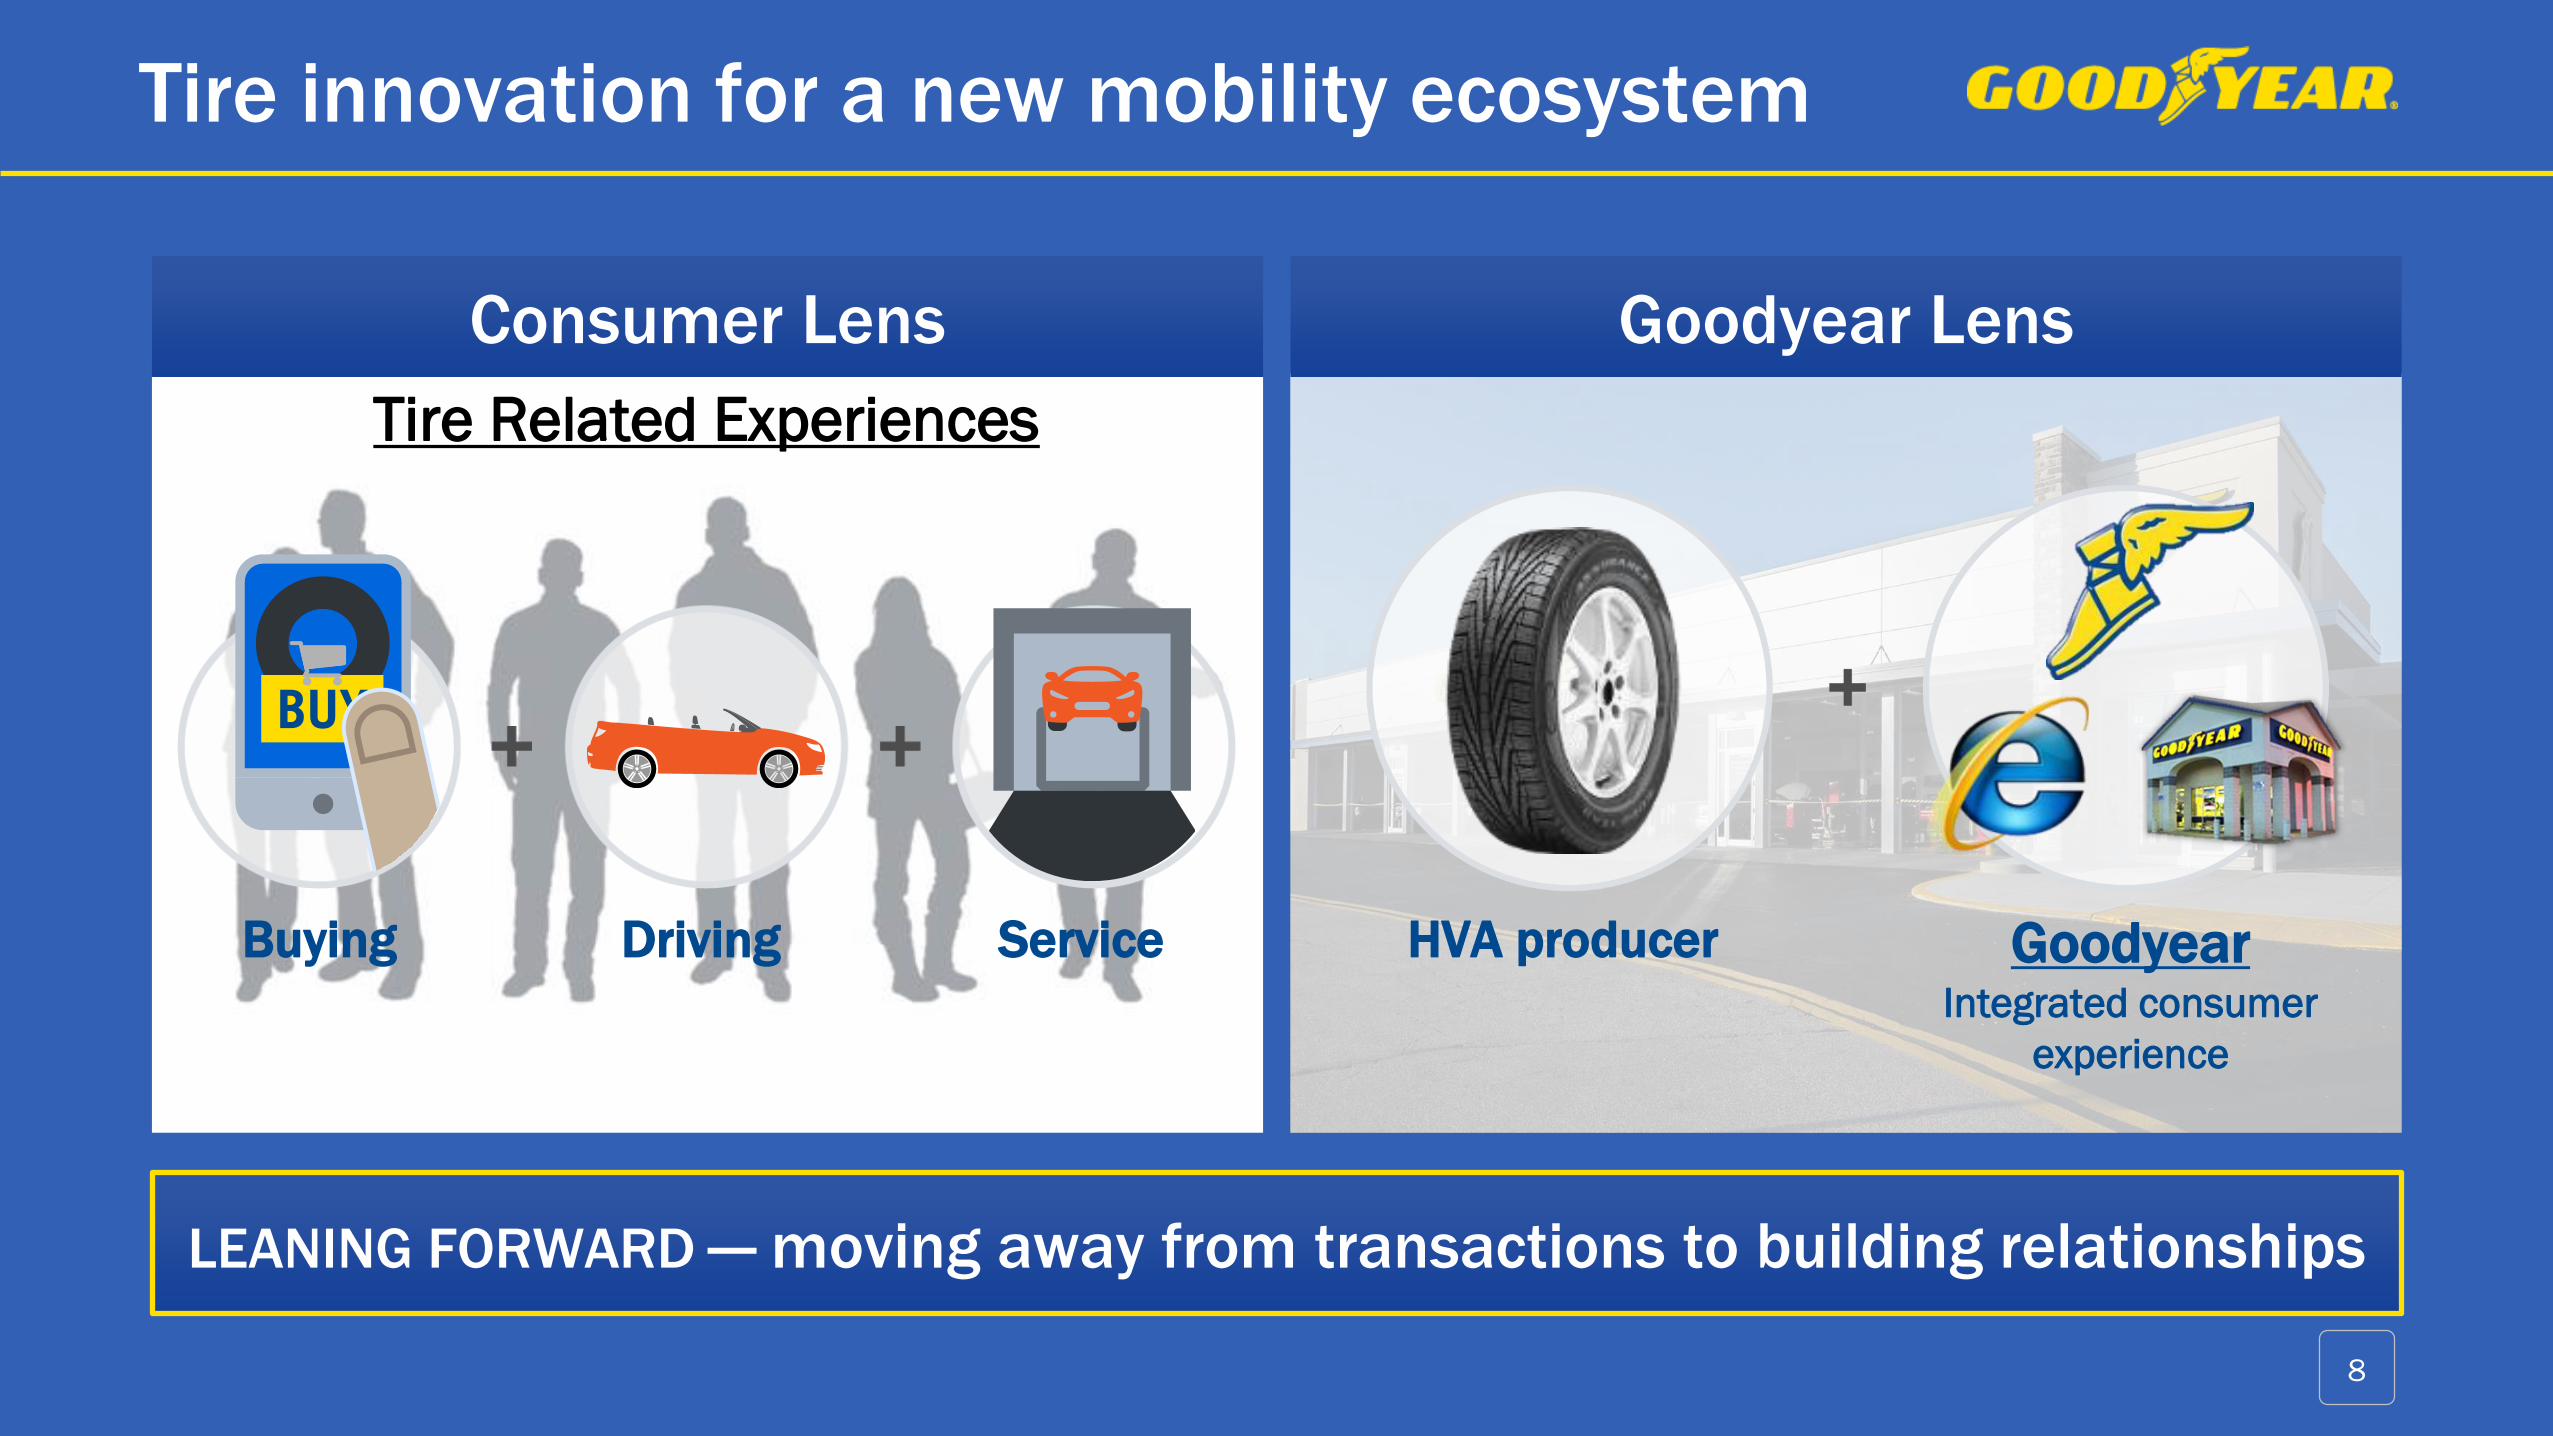
Tire innovation for a new mobility ecosystem
Consumer Lens Goodyear Lens
LEANING FORWARD — moving away from transactions to building relationships
HVA producer GoodyearIntegrated consumer
experience
Tire Related Experiences
DrivingBuying Service
8
9
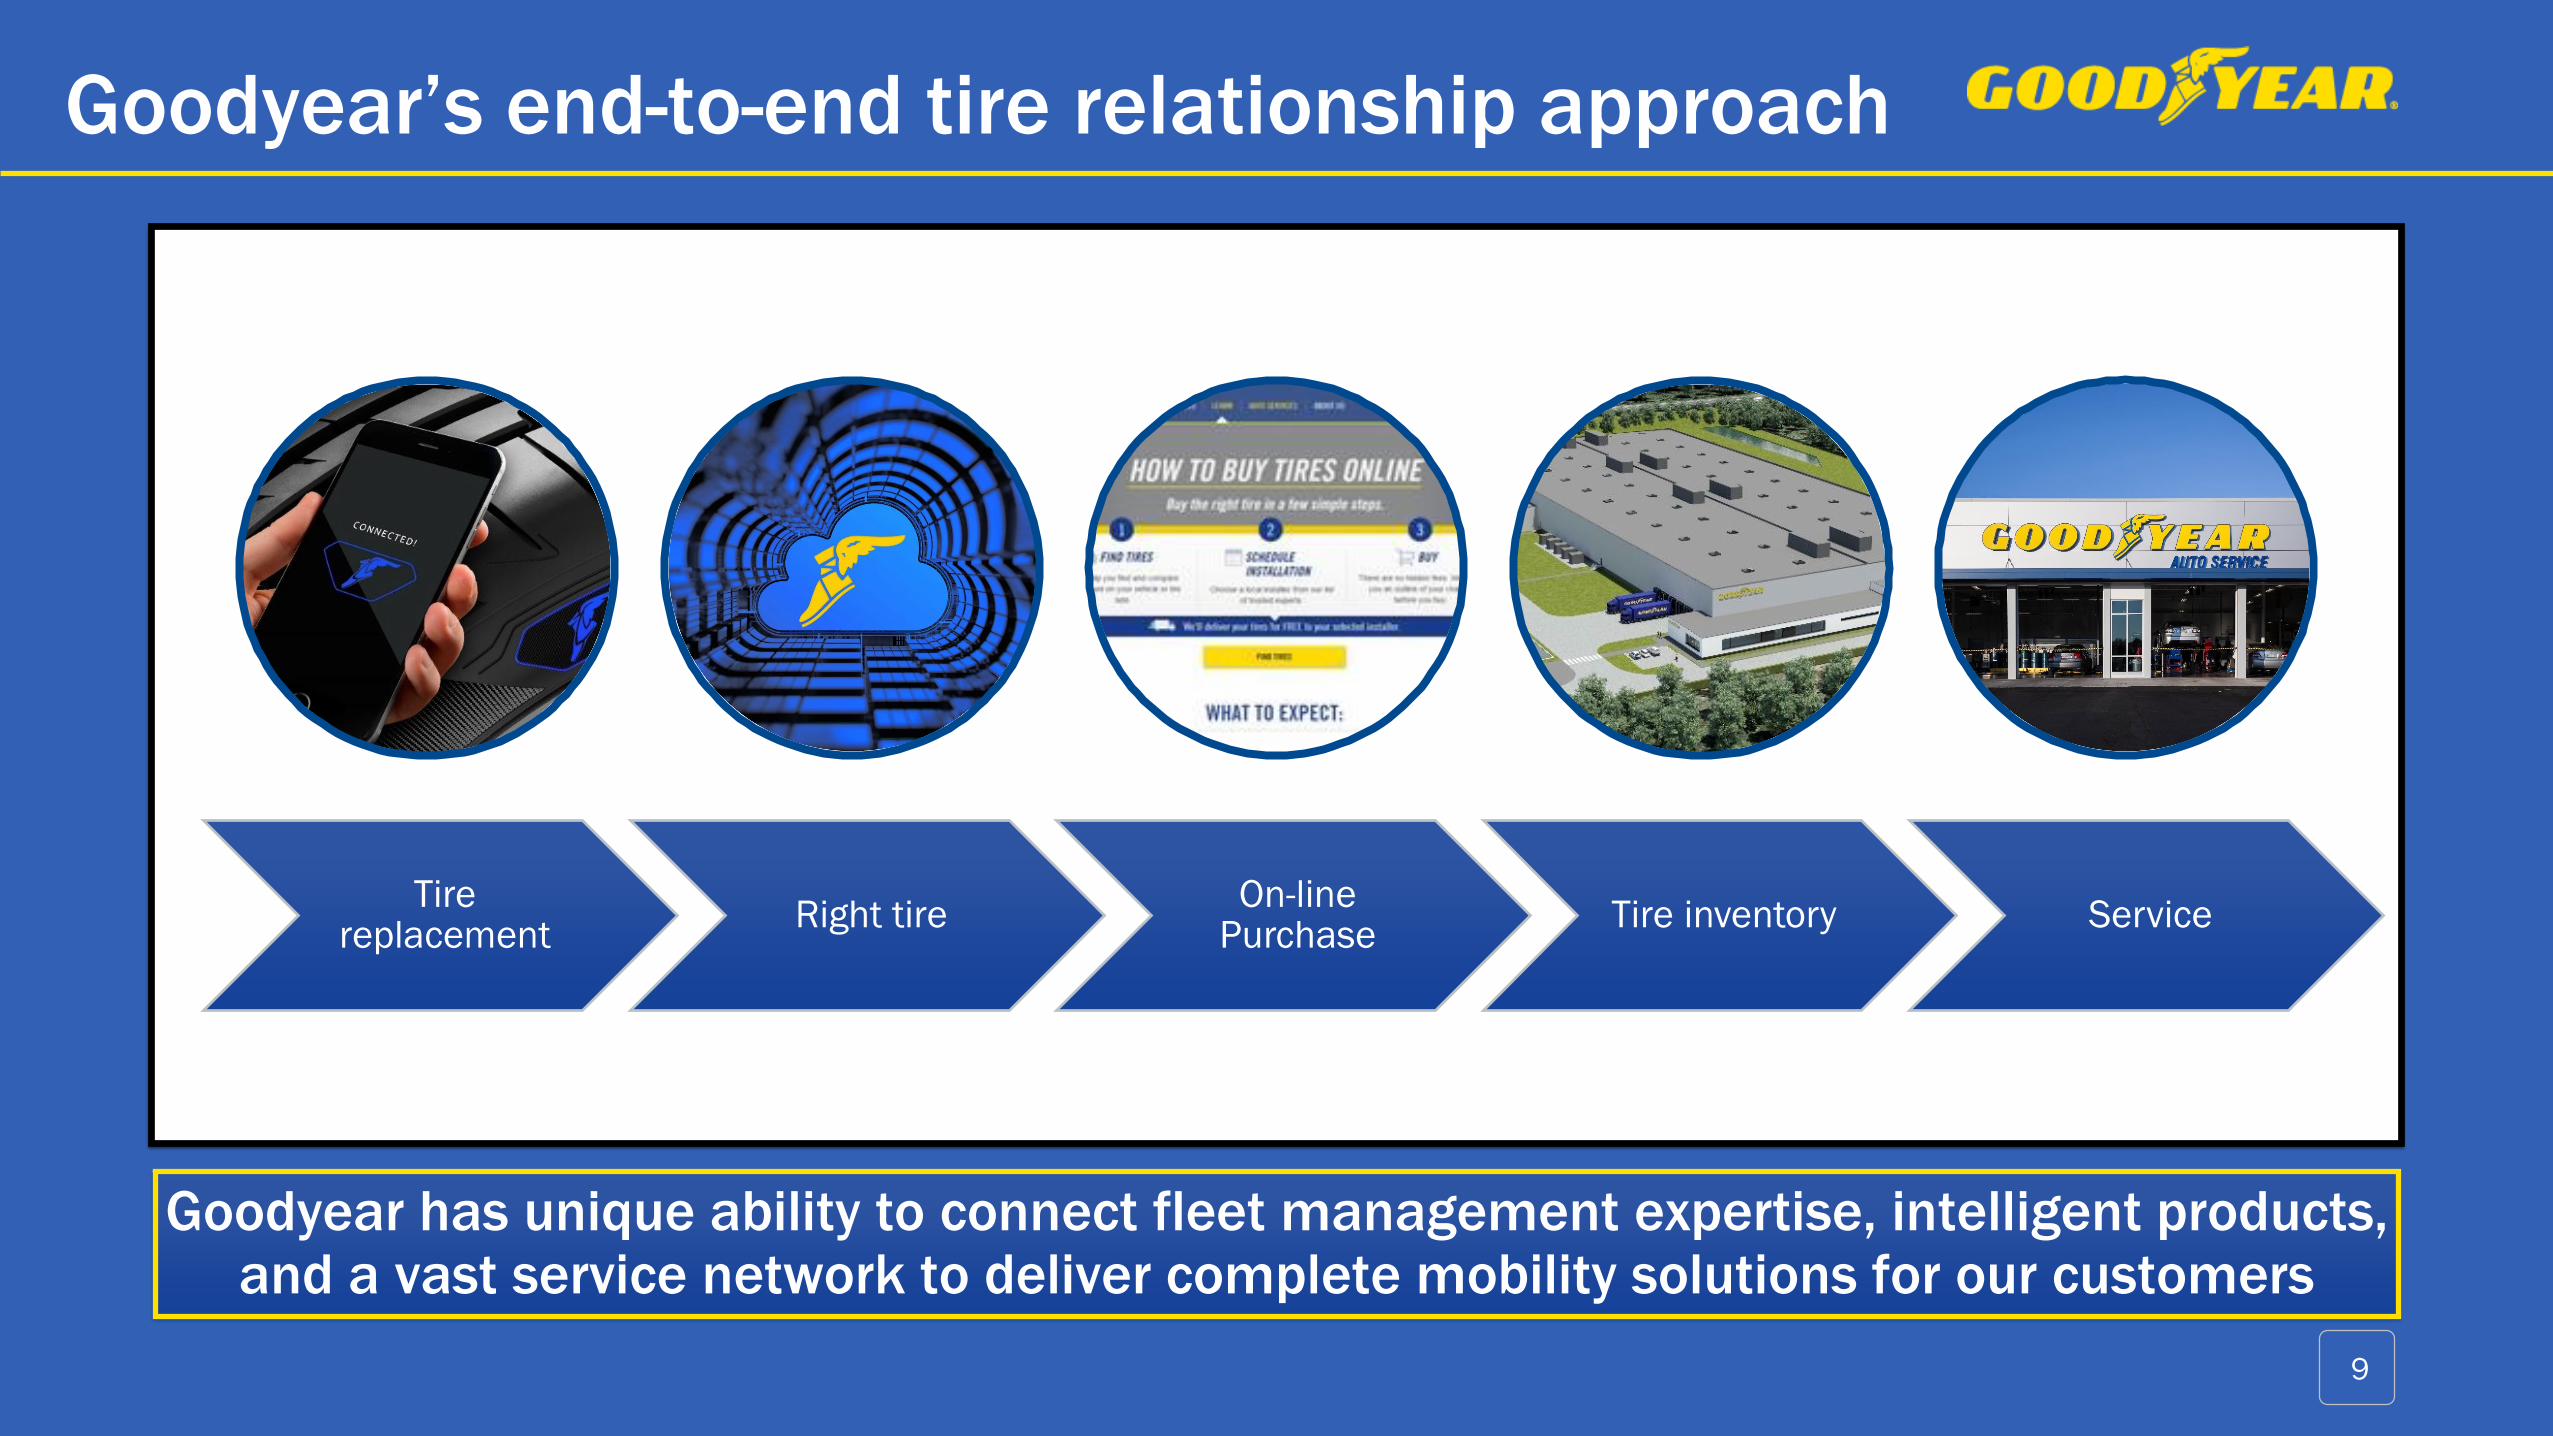
Goodyear’s end-to-end tire relationship approach
Goodyear has unique ability to connect fleet management expertise, intelligent products, and a vast service network to deliver complete mobility solutions for our customers
Tire replacement
Right tireOn-line
PurchaseTire inventory Service
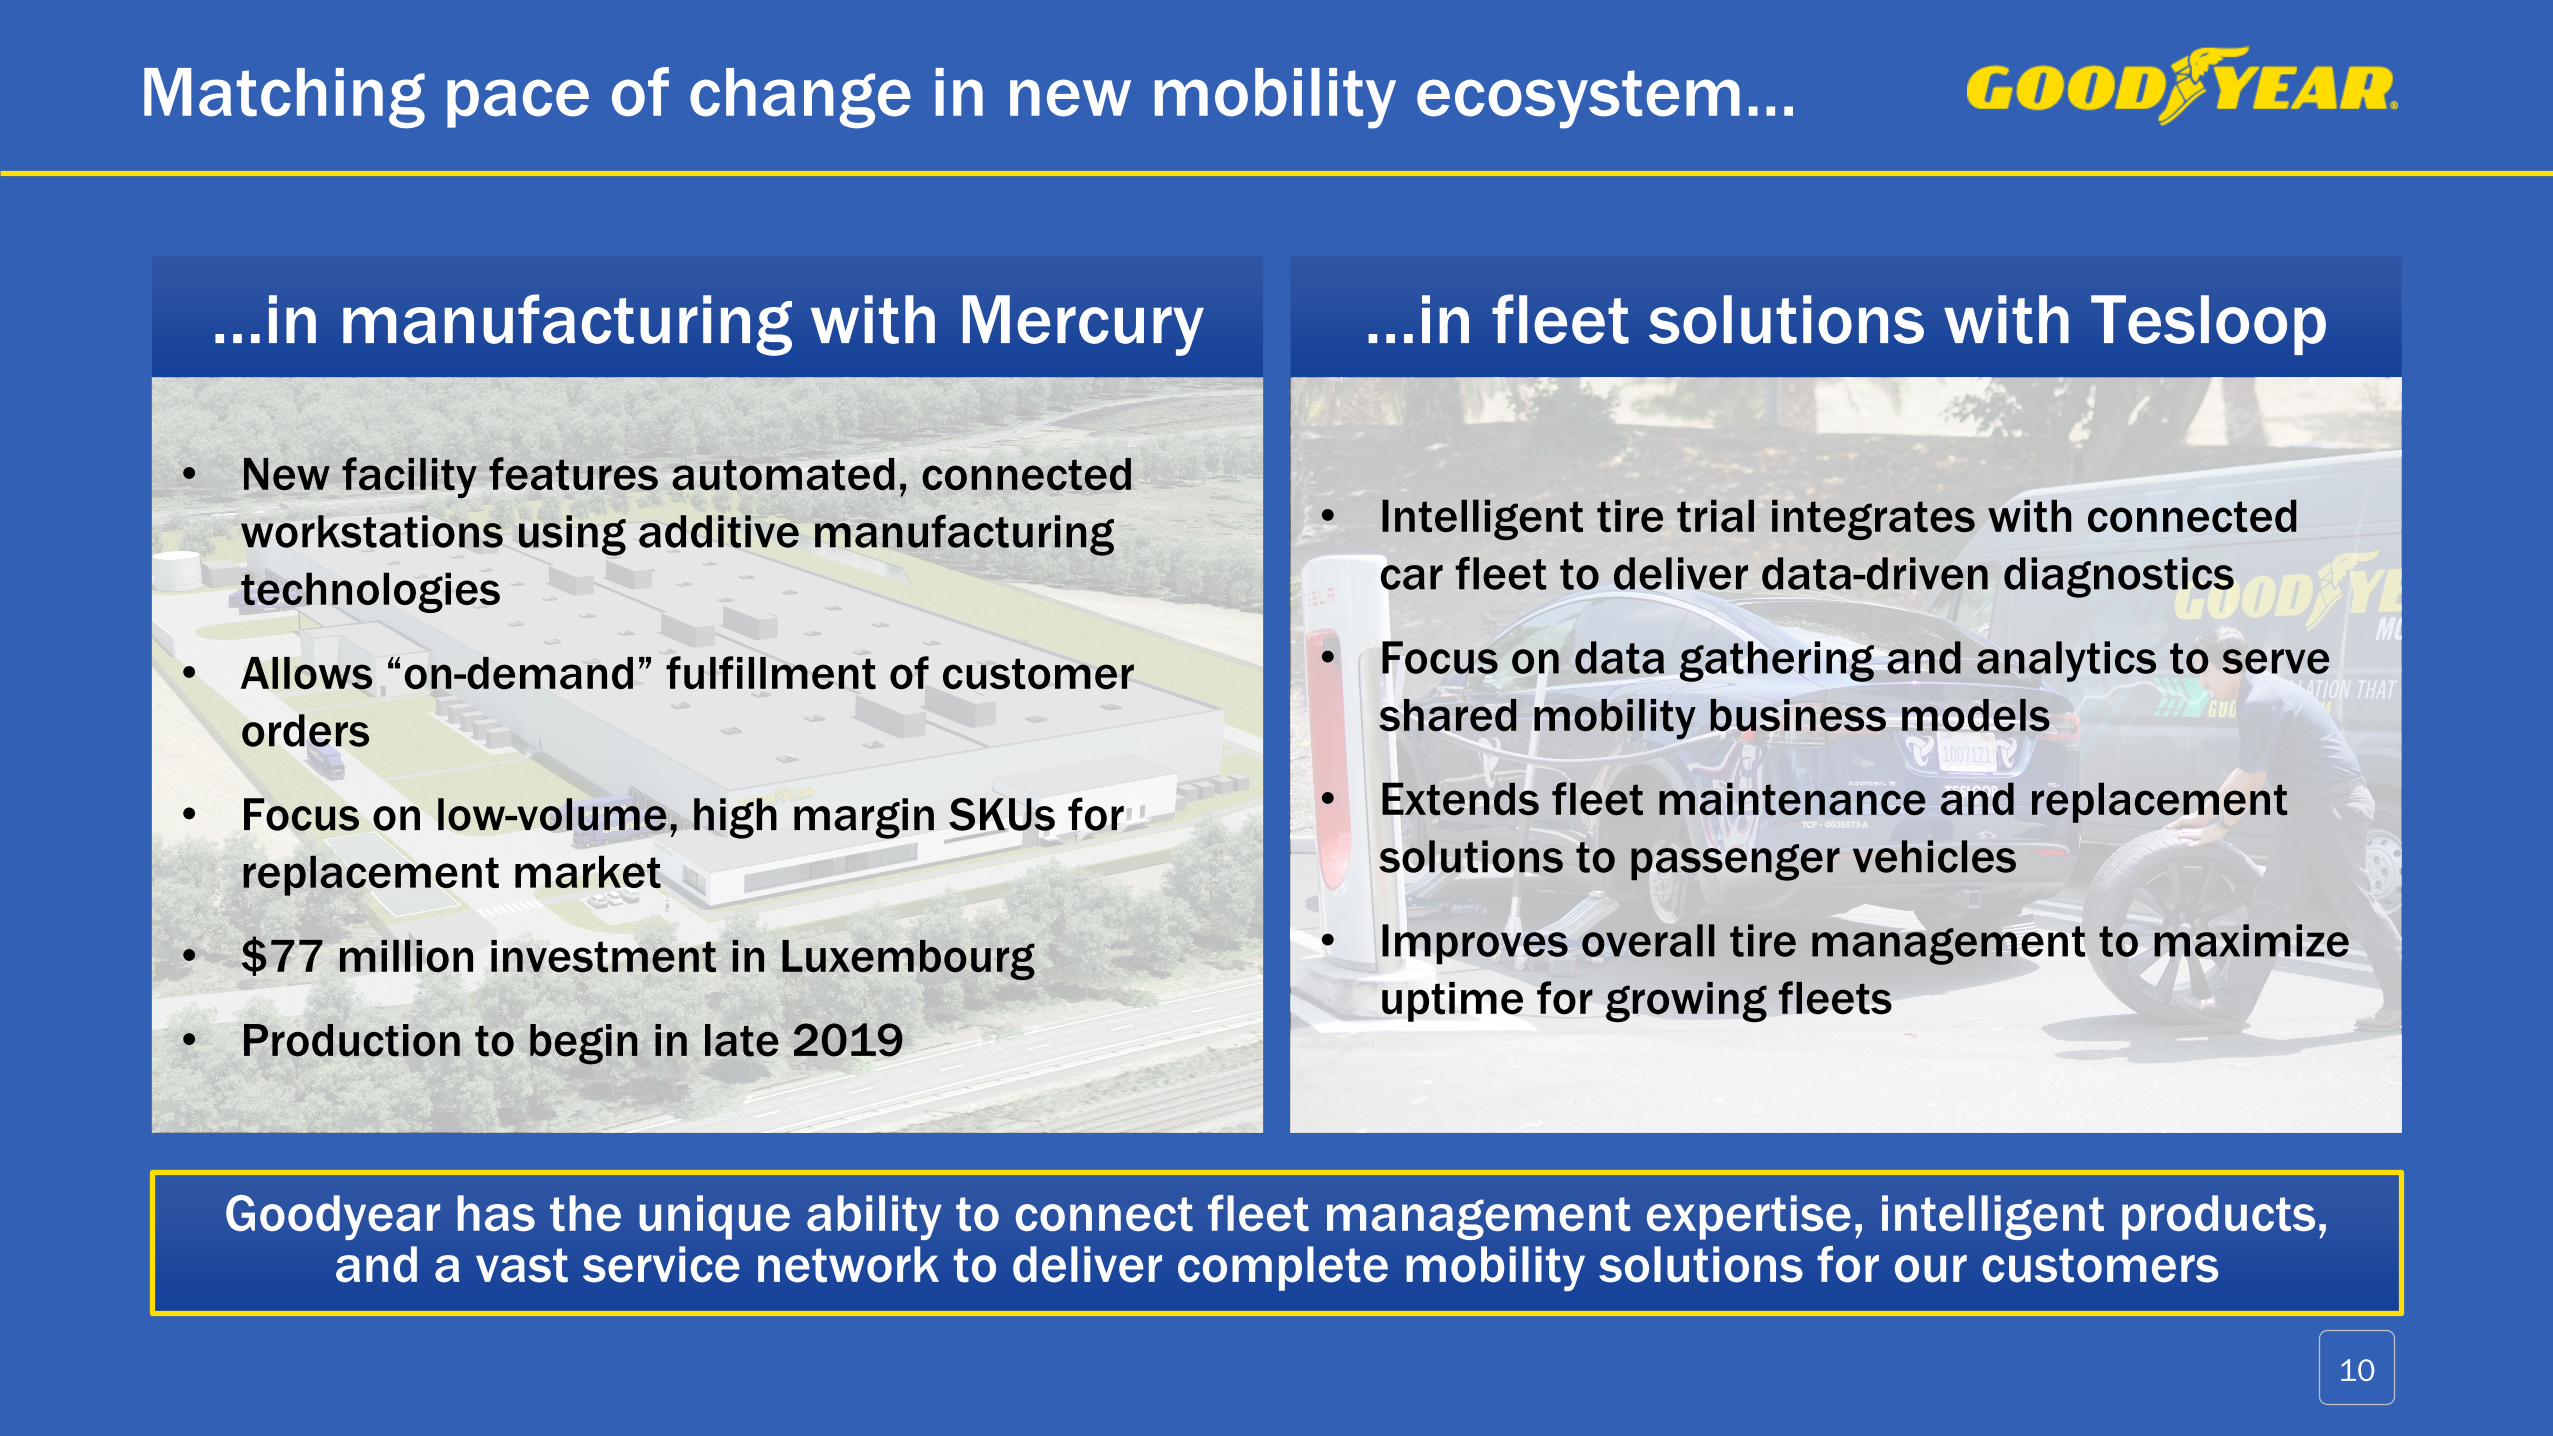
• New facility features automated, connected
workstations using additive manufacturing
technologies
• Allows “on-demand” fulfillment of customer
orders
• Focus on low-volume, high margin SKUs for
replacement market
• $77 million investment in Luxembourg
• Production to begin in late 2019
• Intelligent tire trial integrates with connected
car fleet to deliver data-driven diagnostics
• Focus on data gathering and analytics to serve
shared mobility business models
• Extends fleet maintenance and replacement
solutions to passenger vehicles
• Improves overall tire management to maximize
uptime for growing fleets
Matching pace of change in new mobility ecosystem…
…in manufacturing with Mercury …in fleet solutions with Tesloop
Goodyear has the unique ability to connect fleet management expertise, intelligent products,and a vast service network to deliver complete mobility solutions for our customers
10
Leadership in technology and connected business model a competitive advantage
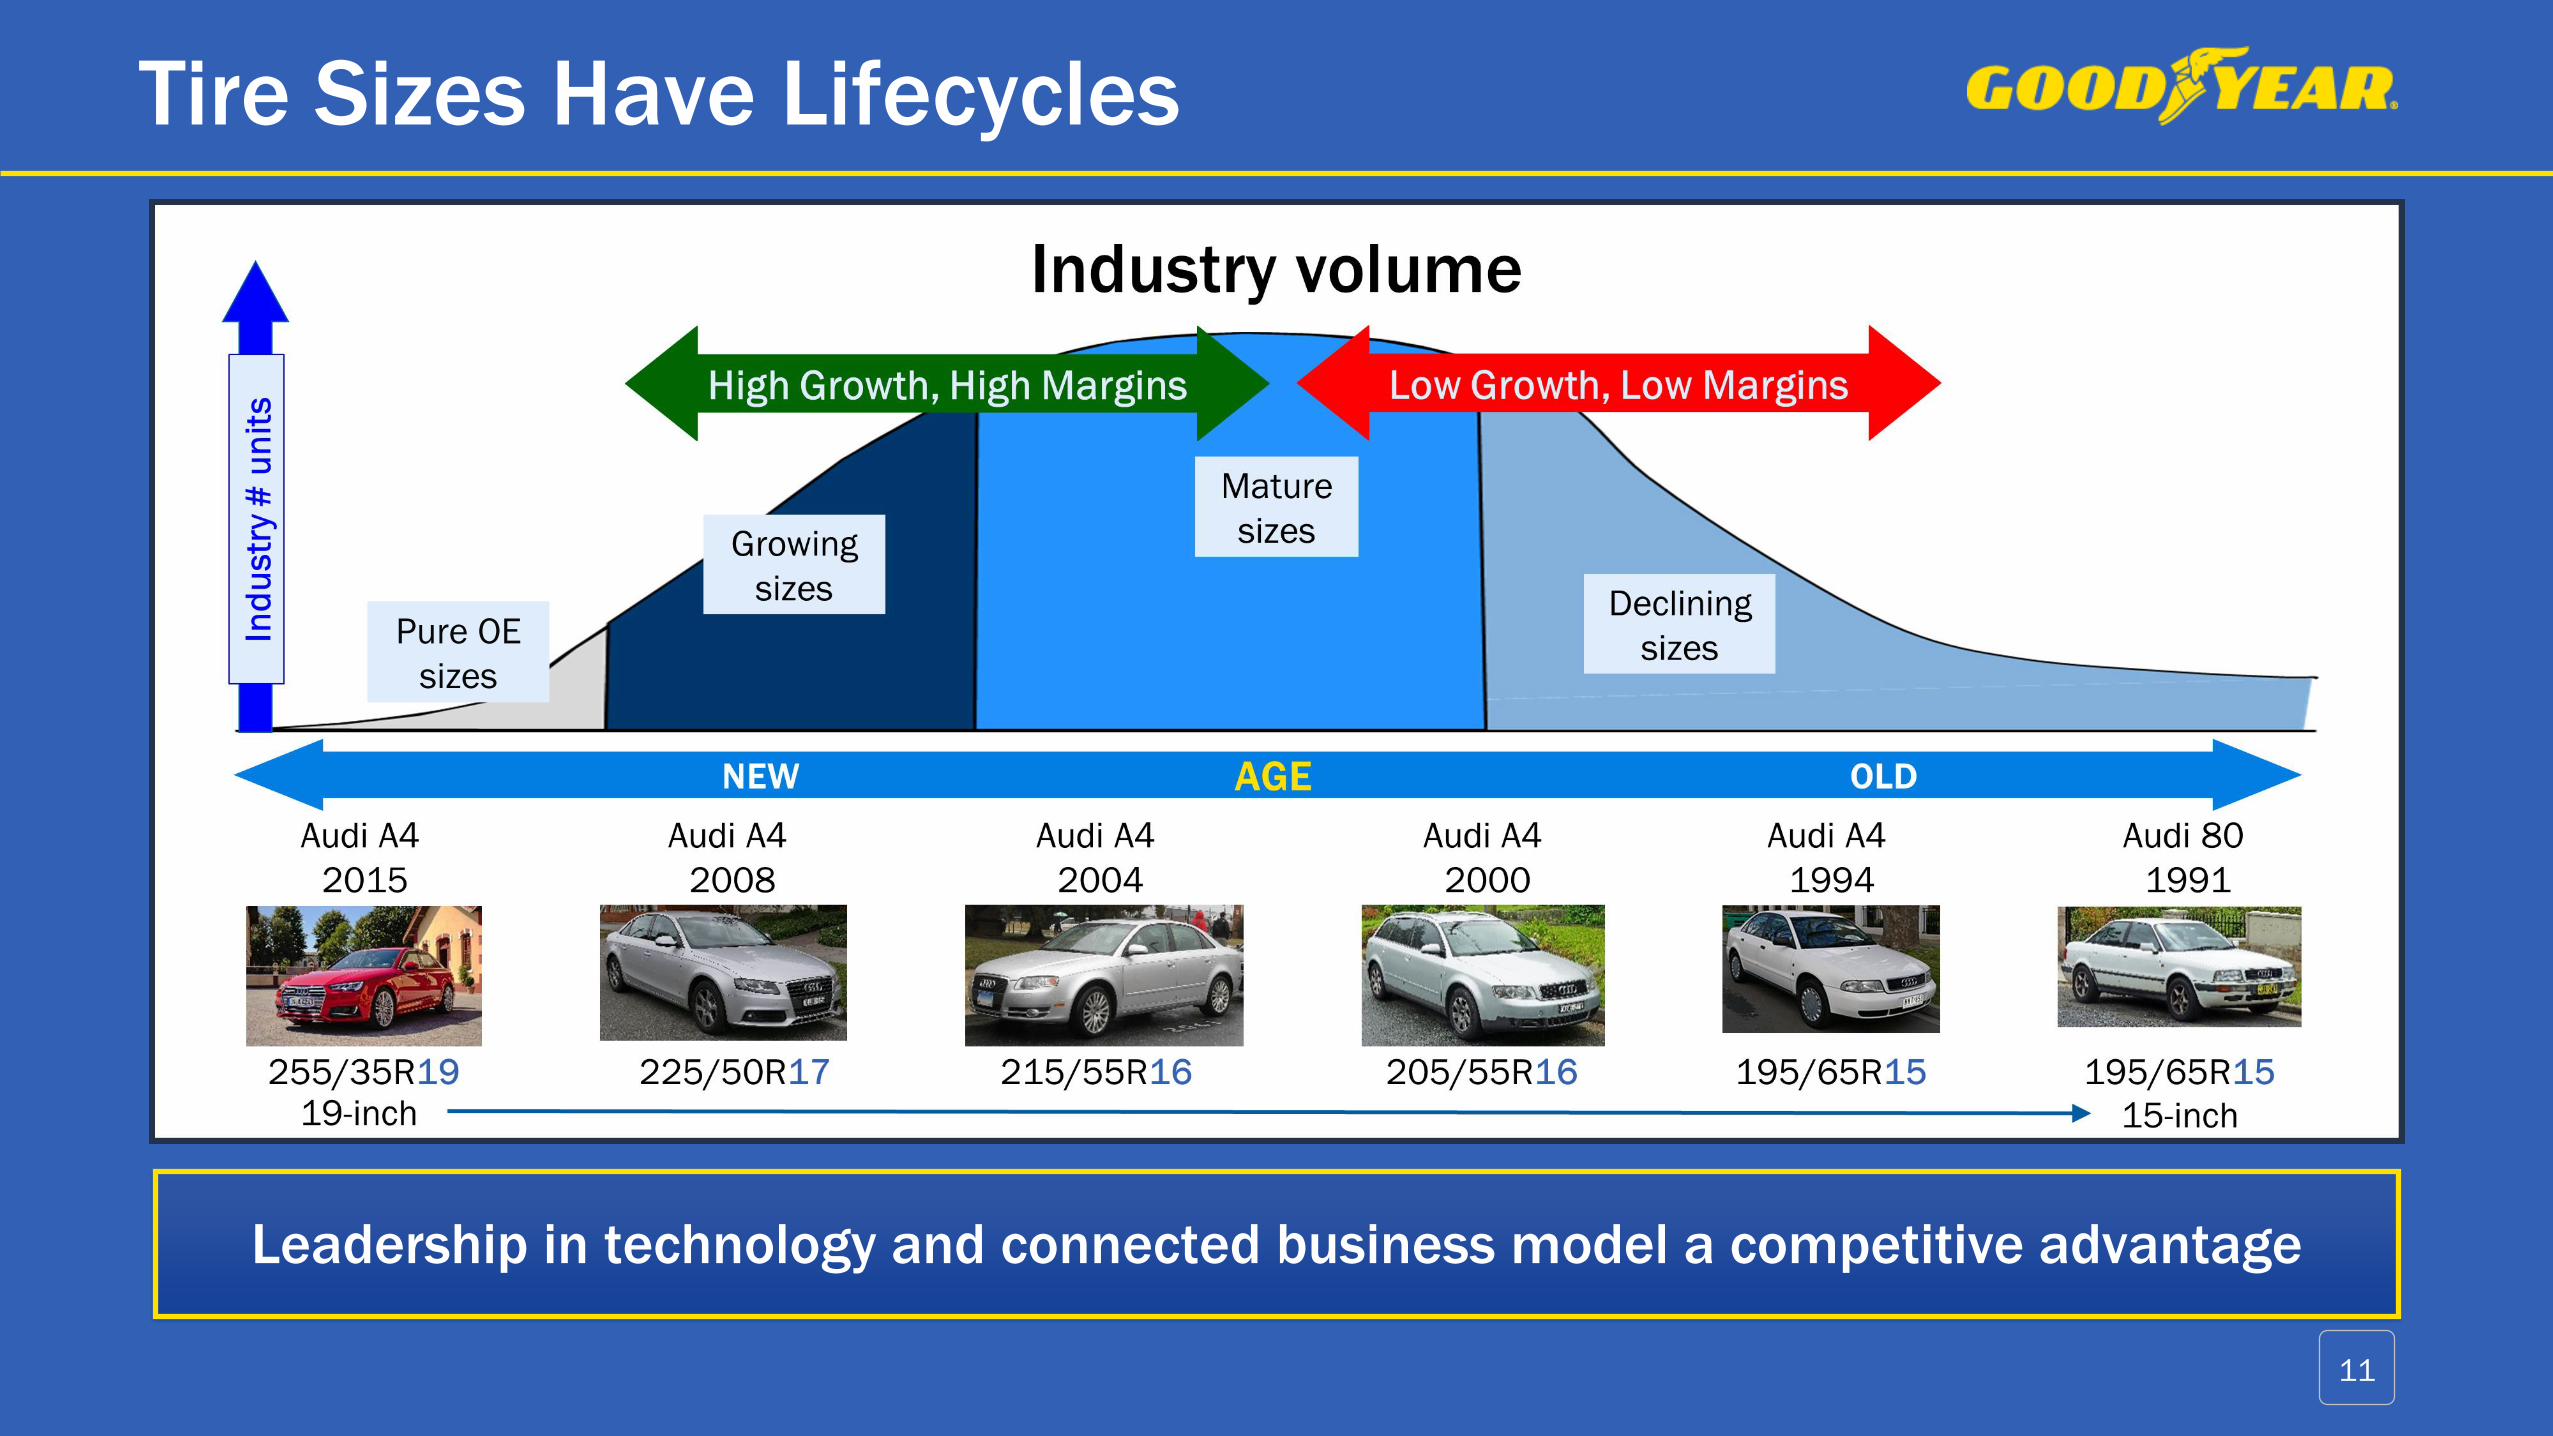
Tire Sizes Have Lifecycles
11
Pure OE
sizes
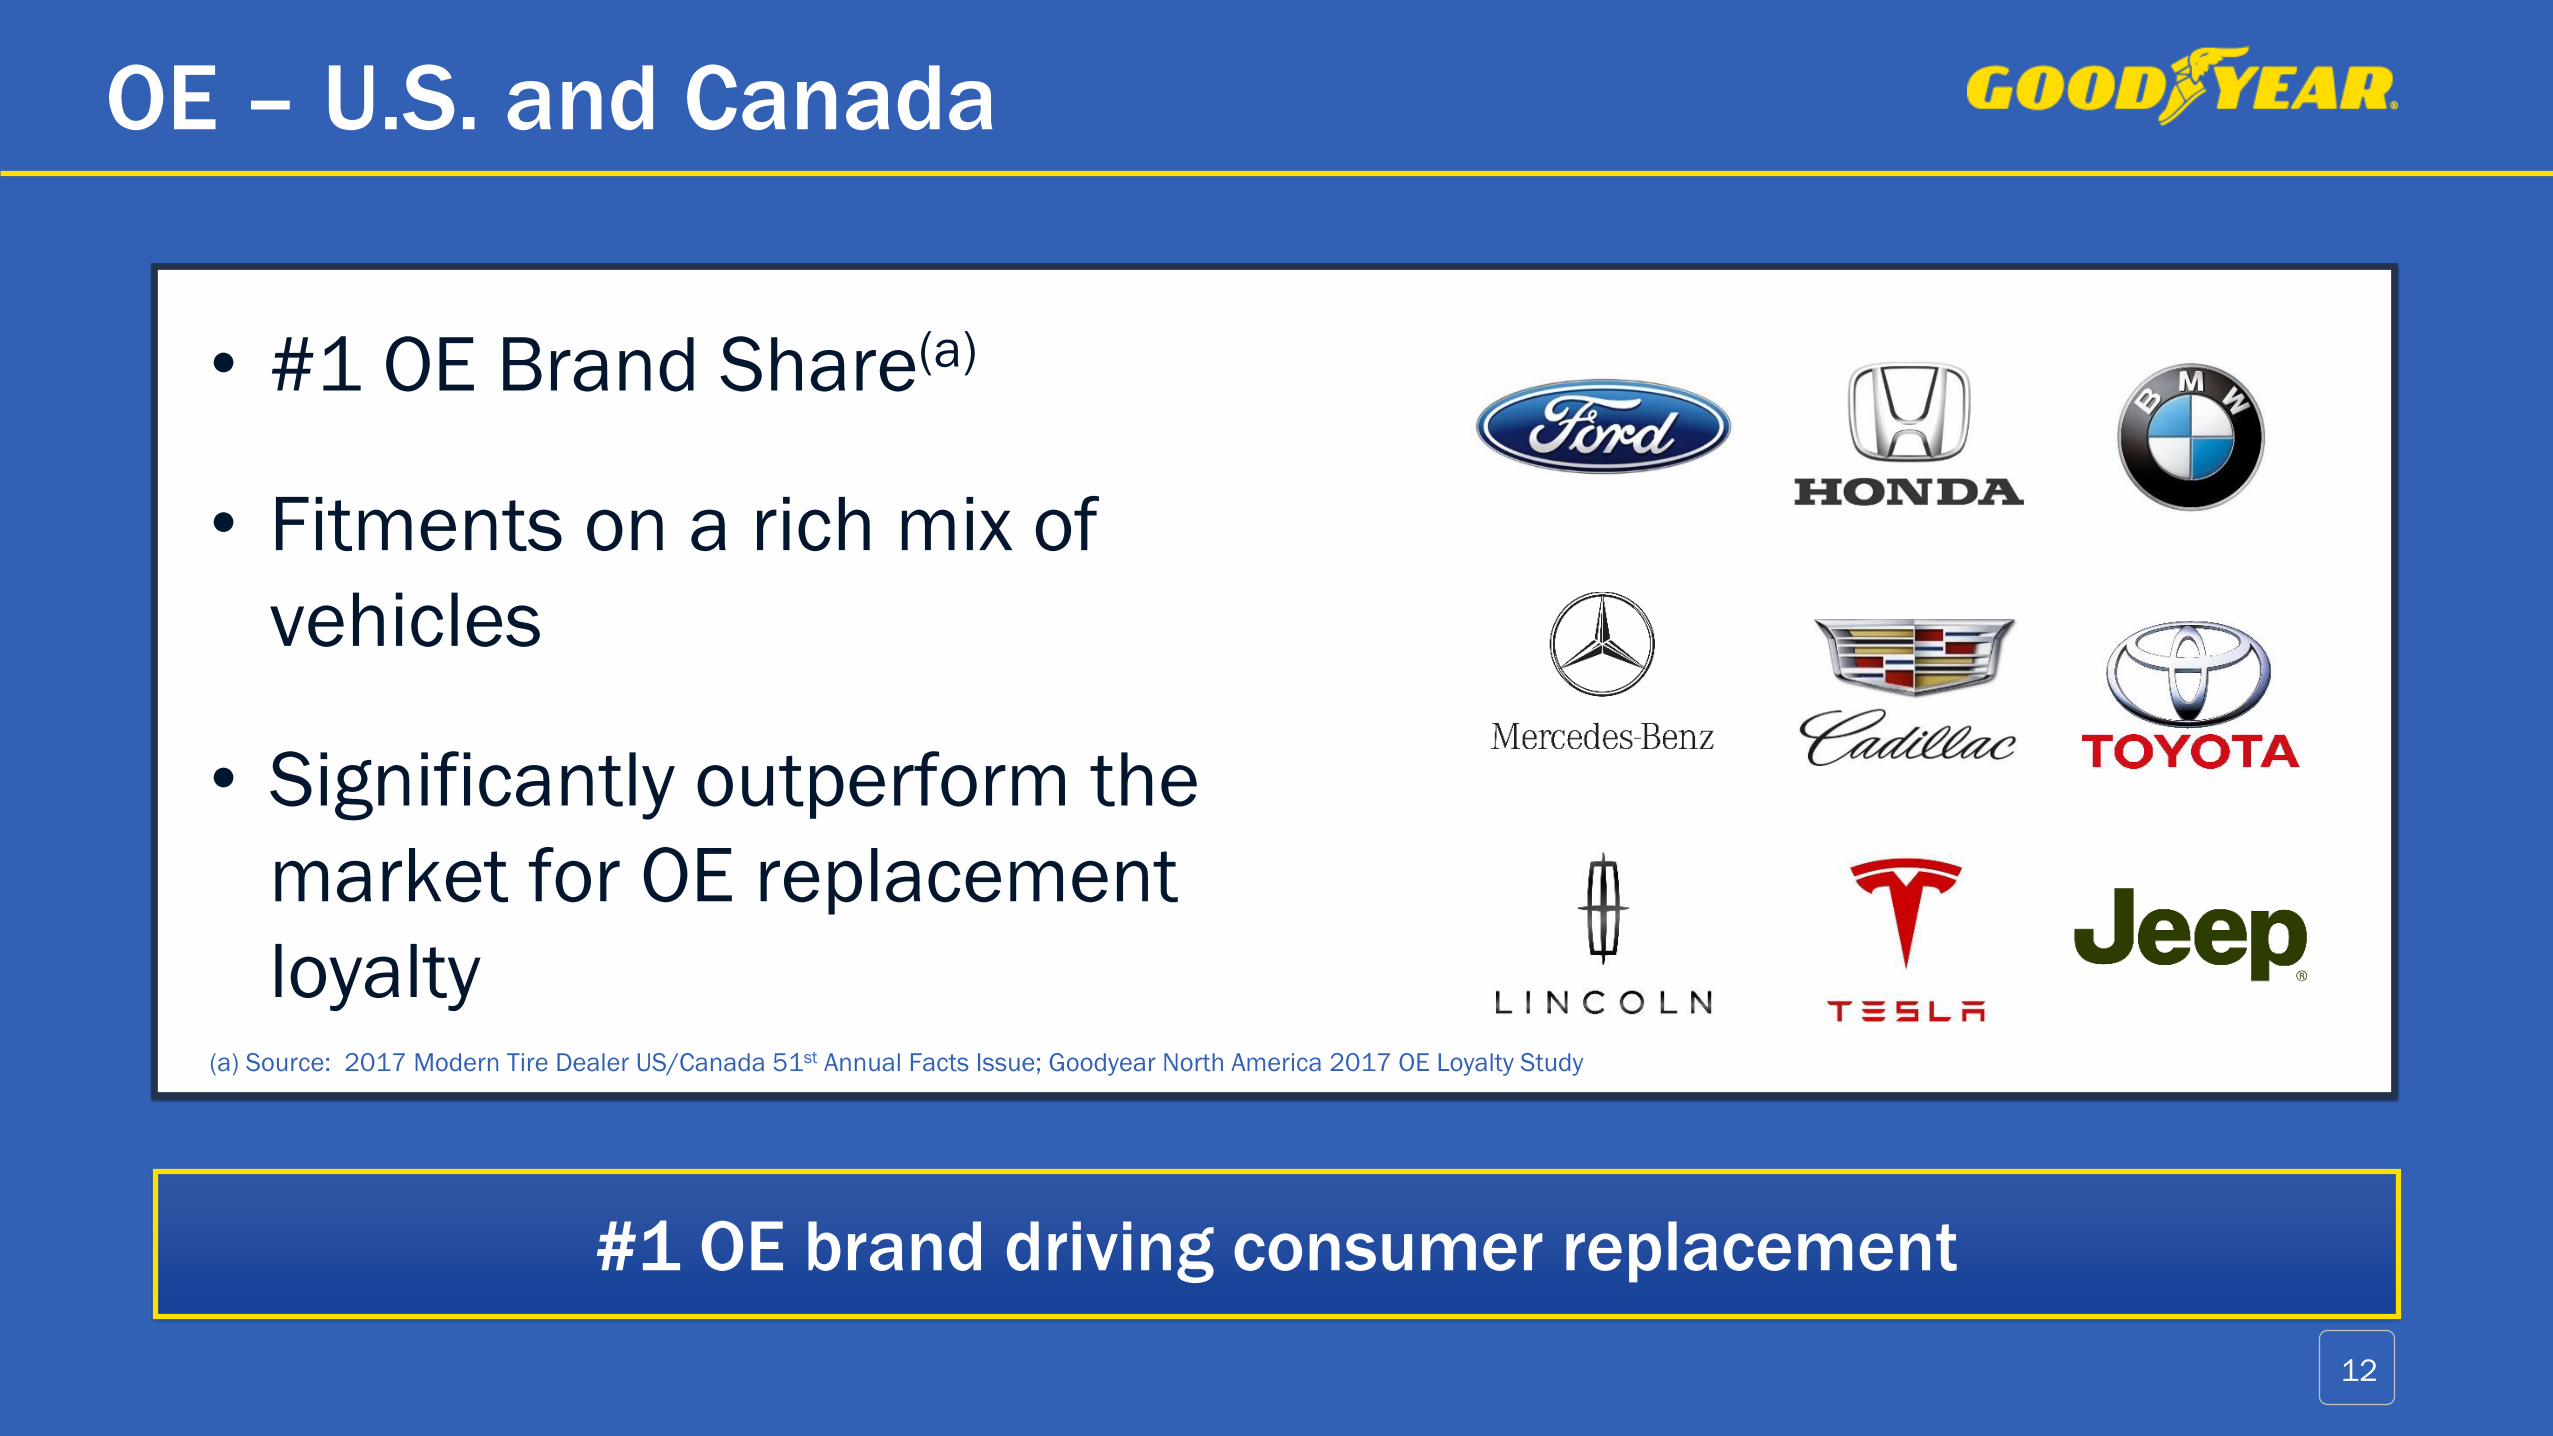
• #1 OE Brand Share(a)
• Fitments on a rich mix of
vehicles
• Significantly outperform the
market for OE replacement
loyalty
#1 OE brand driving consumer replacement
12
(a) Source: 2017 Modern Tire Dealer US/Canada 51st Annual Facts Issue; Goodyear North America 2017 OE Loyalty Study
OE – U.S. and Canada
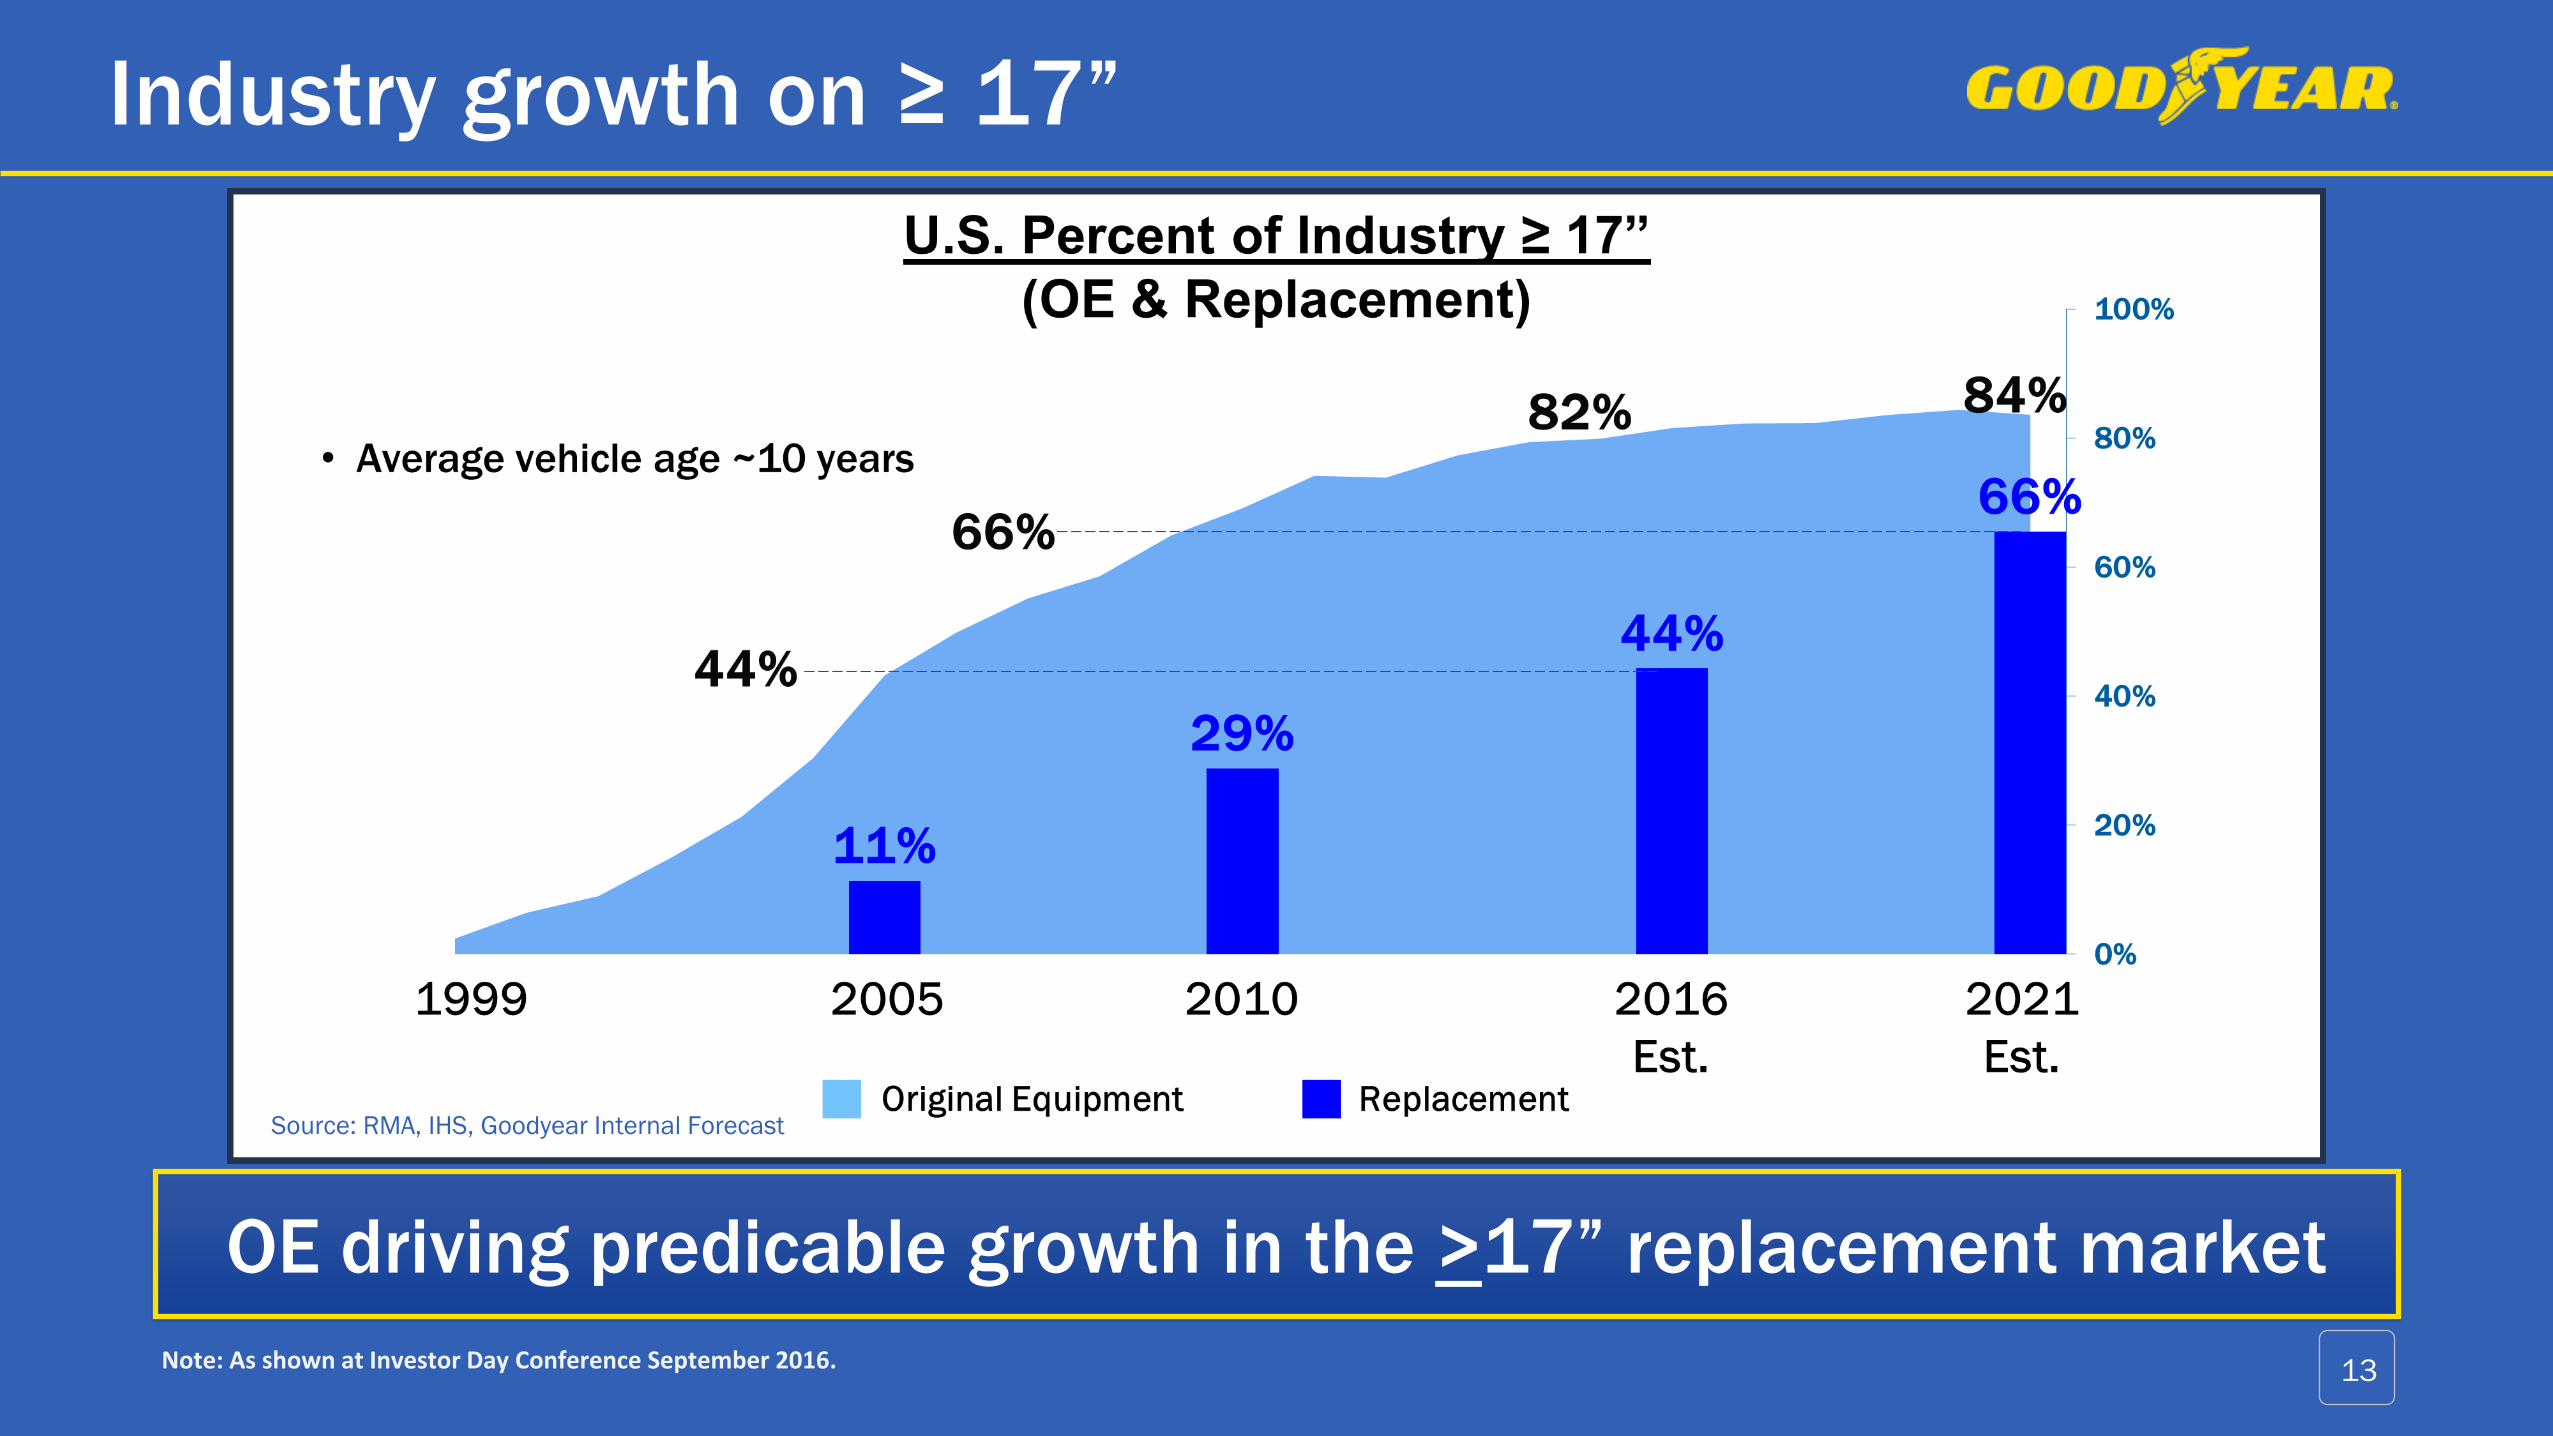
OE driving predicable growth in the >17” replacement market
13
Source: RMA, IHS
Industry growth on ≥ 17”
Source: RMA, IHS, Goodyear Internal Forecast
Note: As shown at Investor Day Conference September 2016.
14
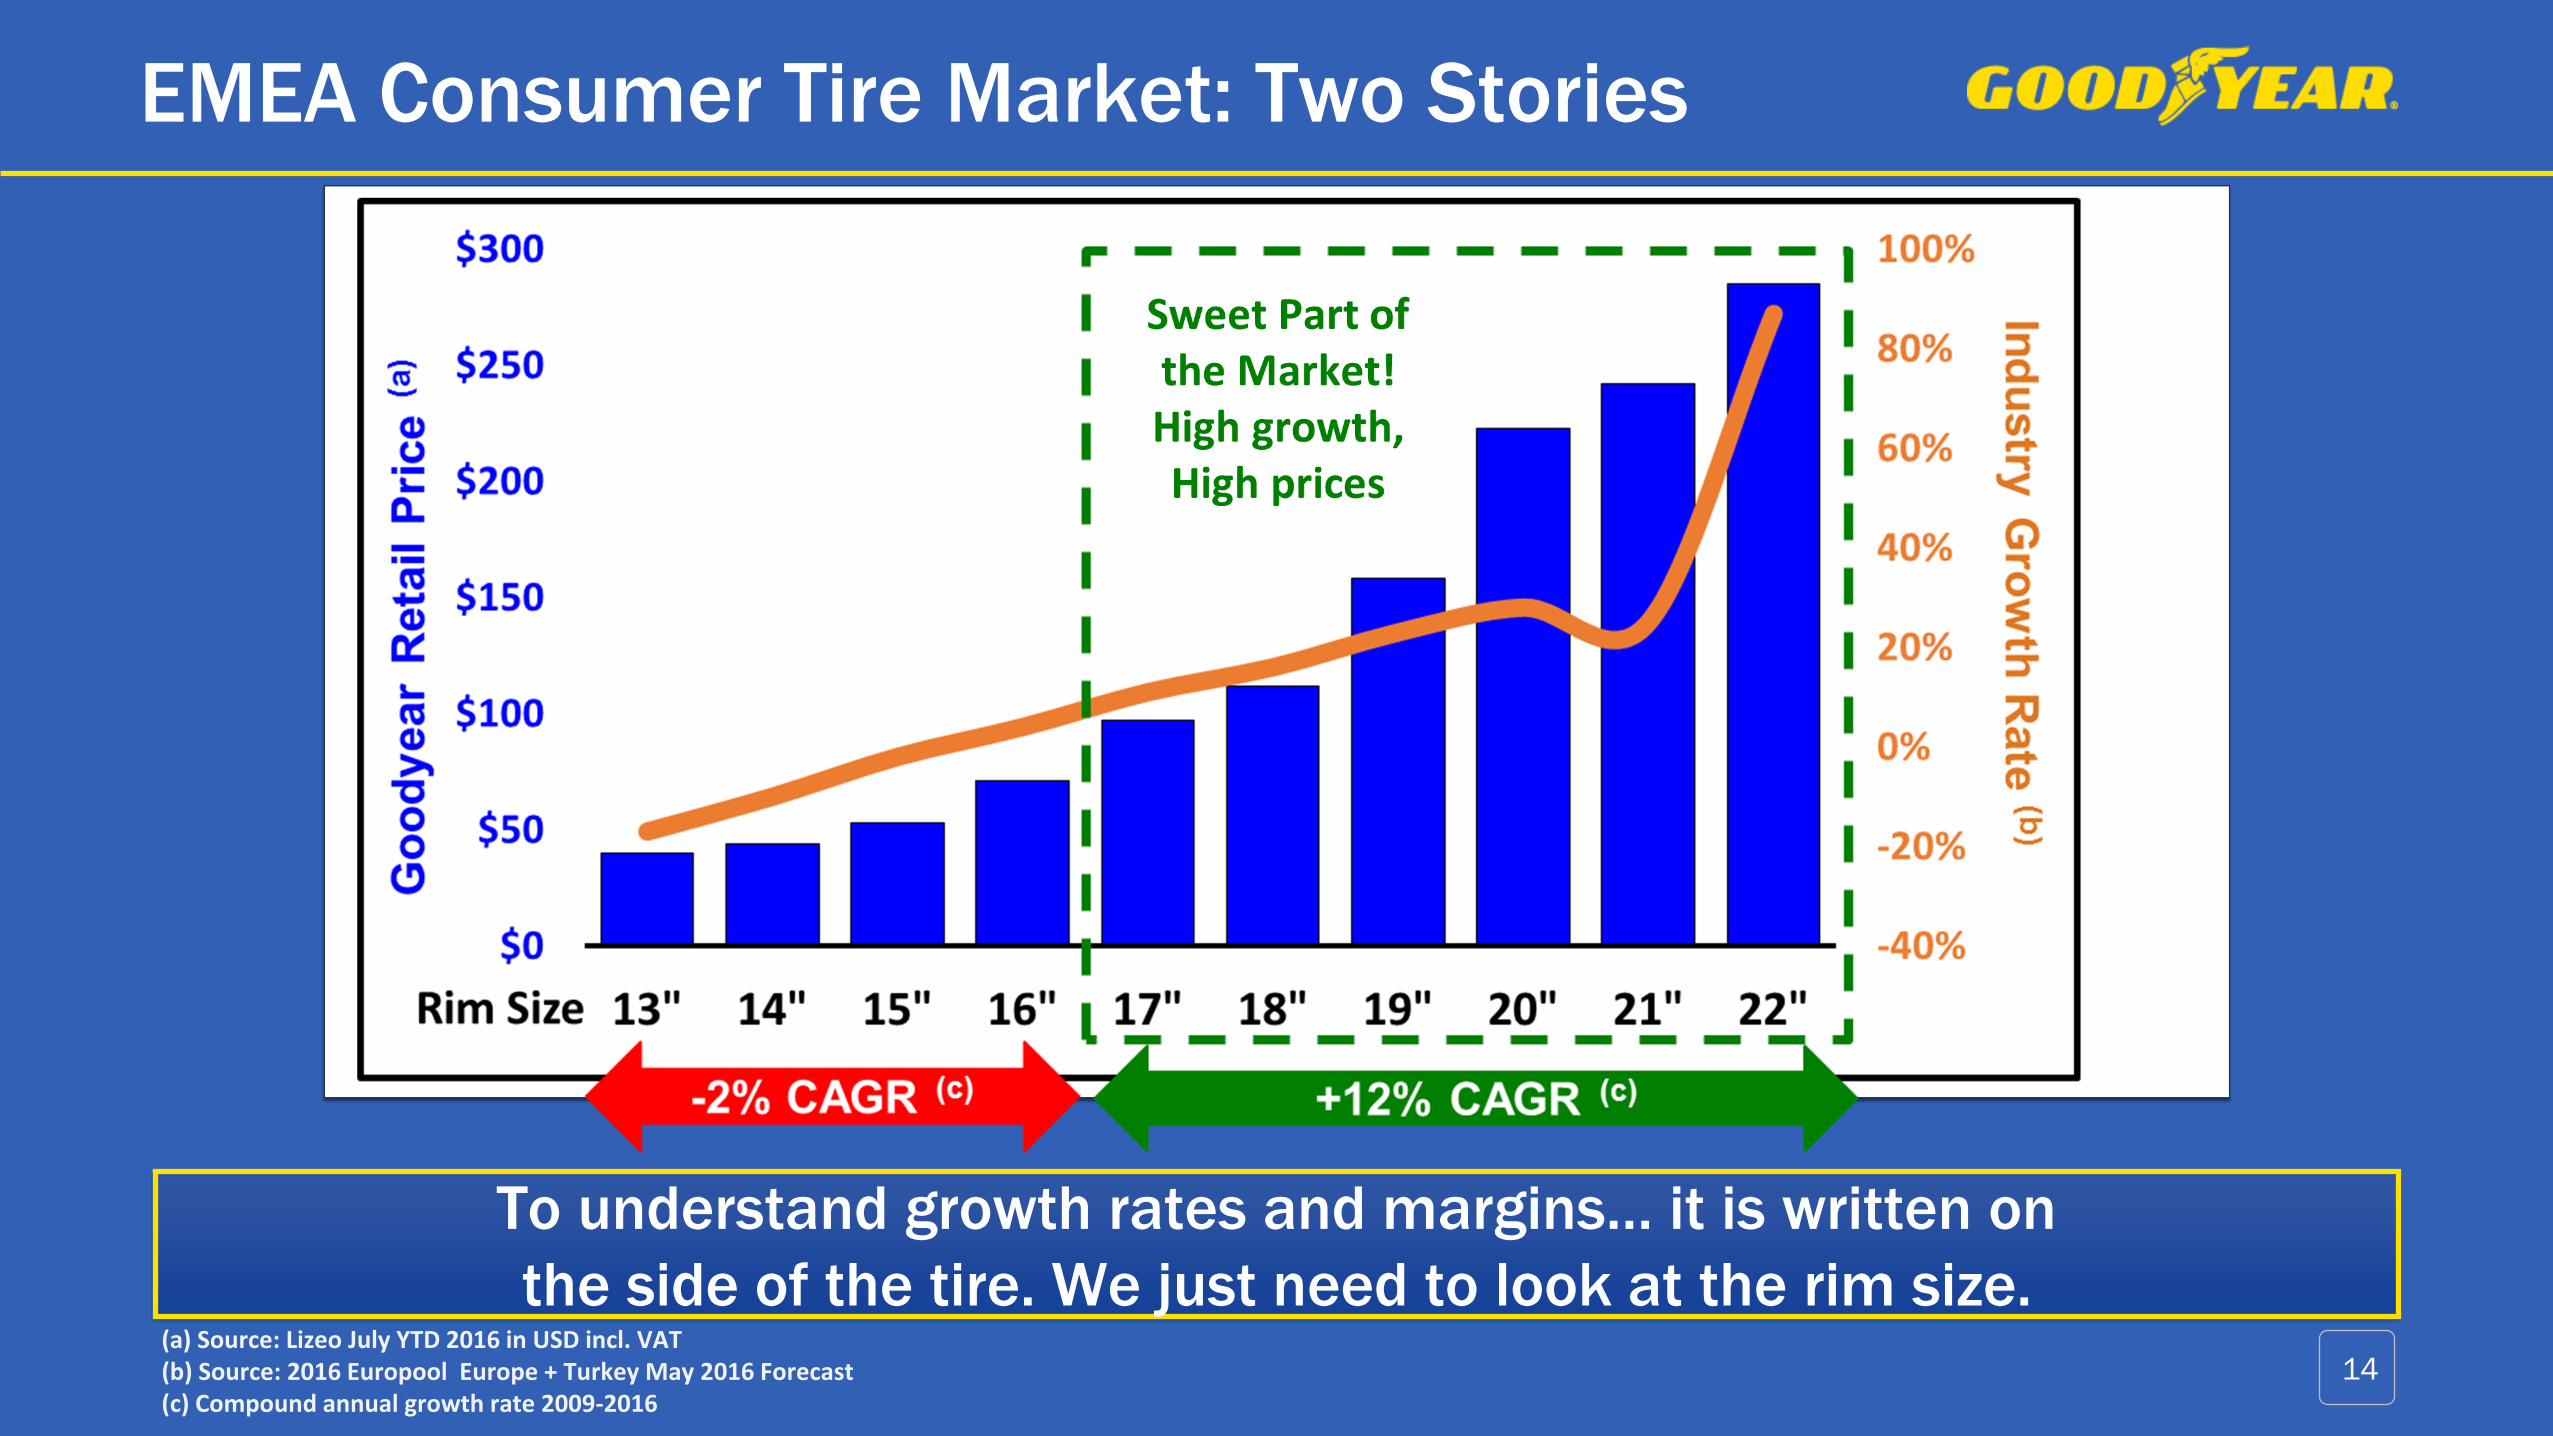
EMEA Consumer Tire Market: Two Stories
To understand growth rates and margins… it is written on
the side of the tire. We just need to look at the rim size.(a) Source: Lizeo July YTD 2016 in USD incl. VAT(b) Source: 2016 Europool Europe + Turkey May 2016 Forecast(c) Compound annual growth rate 2009-2016
Of


Appendix
-2.0%
-1.0%
0.0%
1.0%
2.0%
3.0%
4.0%
5.0%
6.0%
Dec
2016
Jan
2017
Feb
2017
Mar
2017
Apr
2017
May
2017
Jun
2017
May YTD Actual / June Trend
Industry PPI(b)
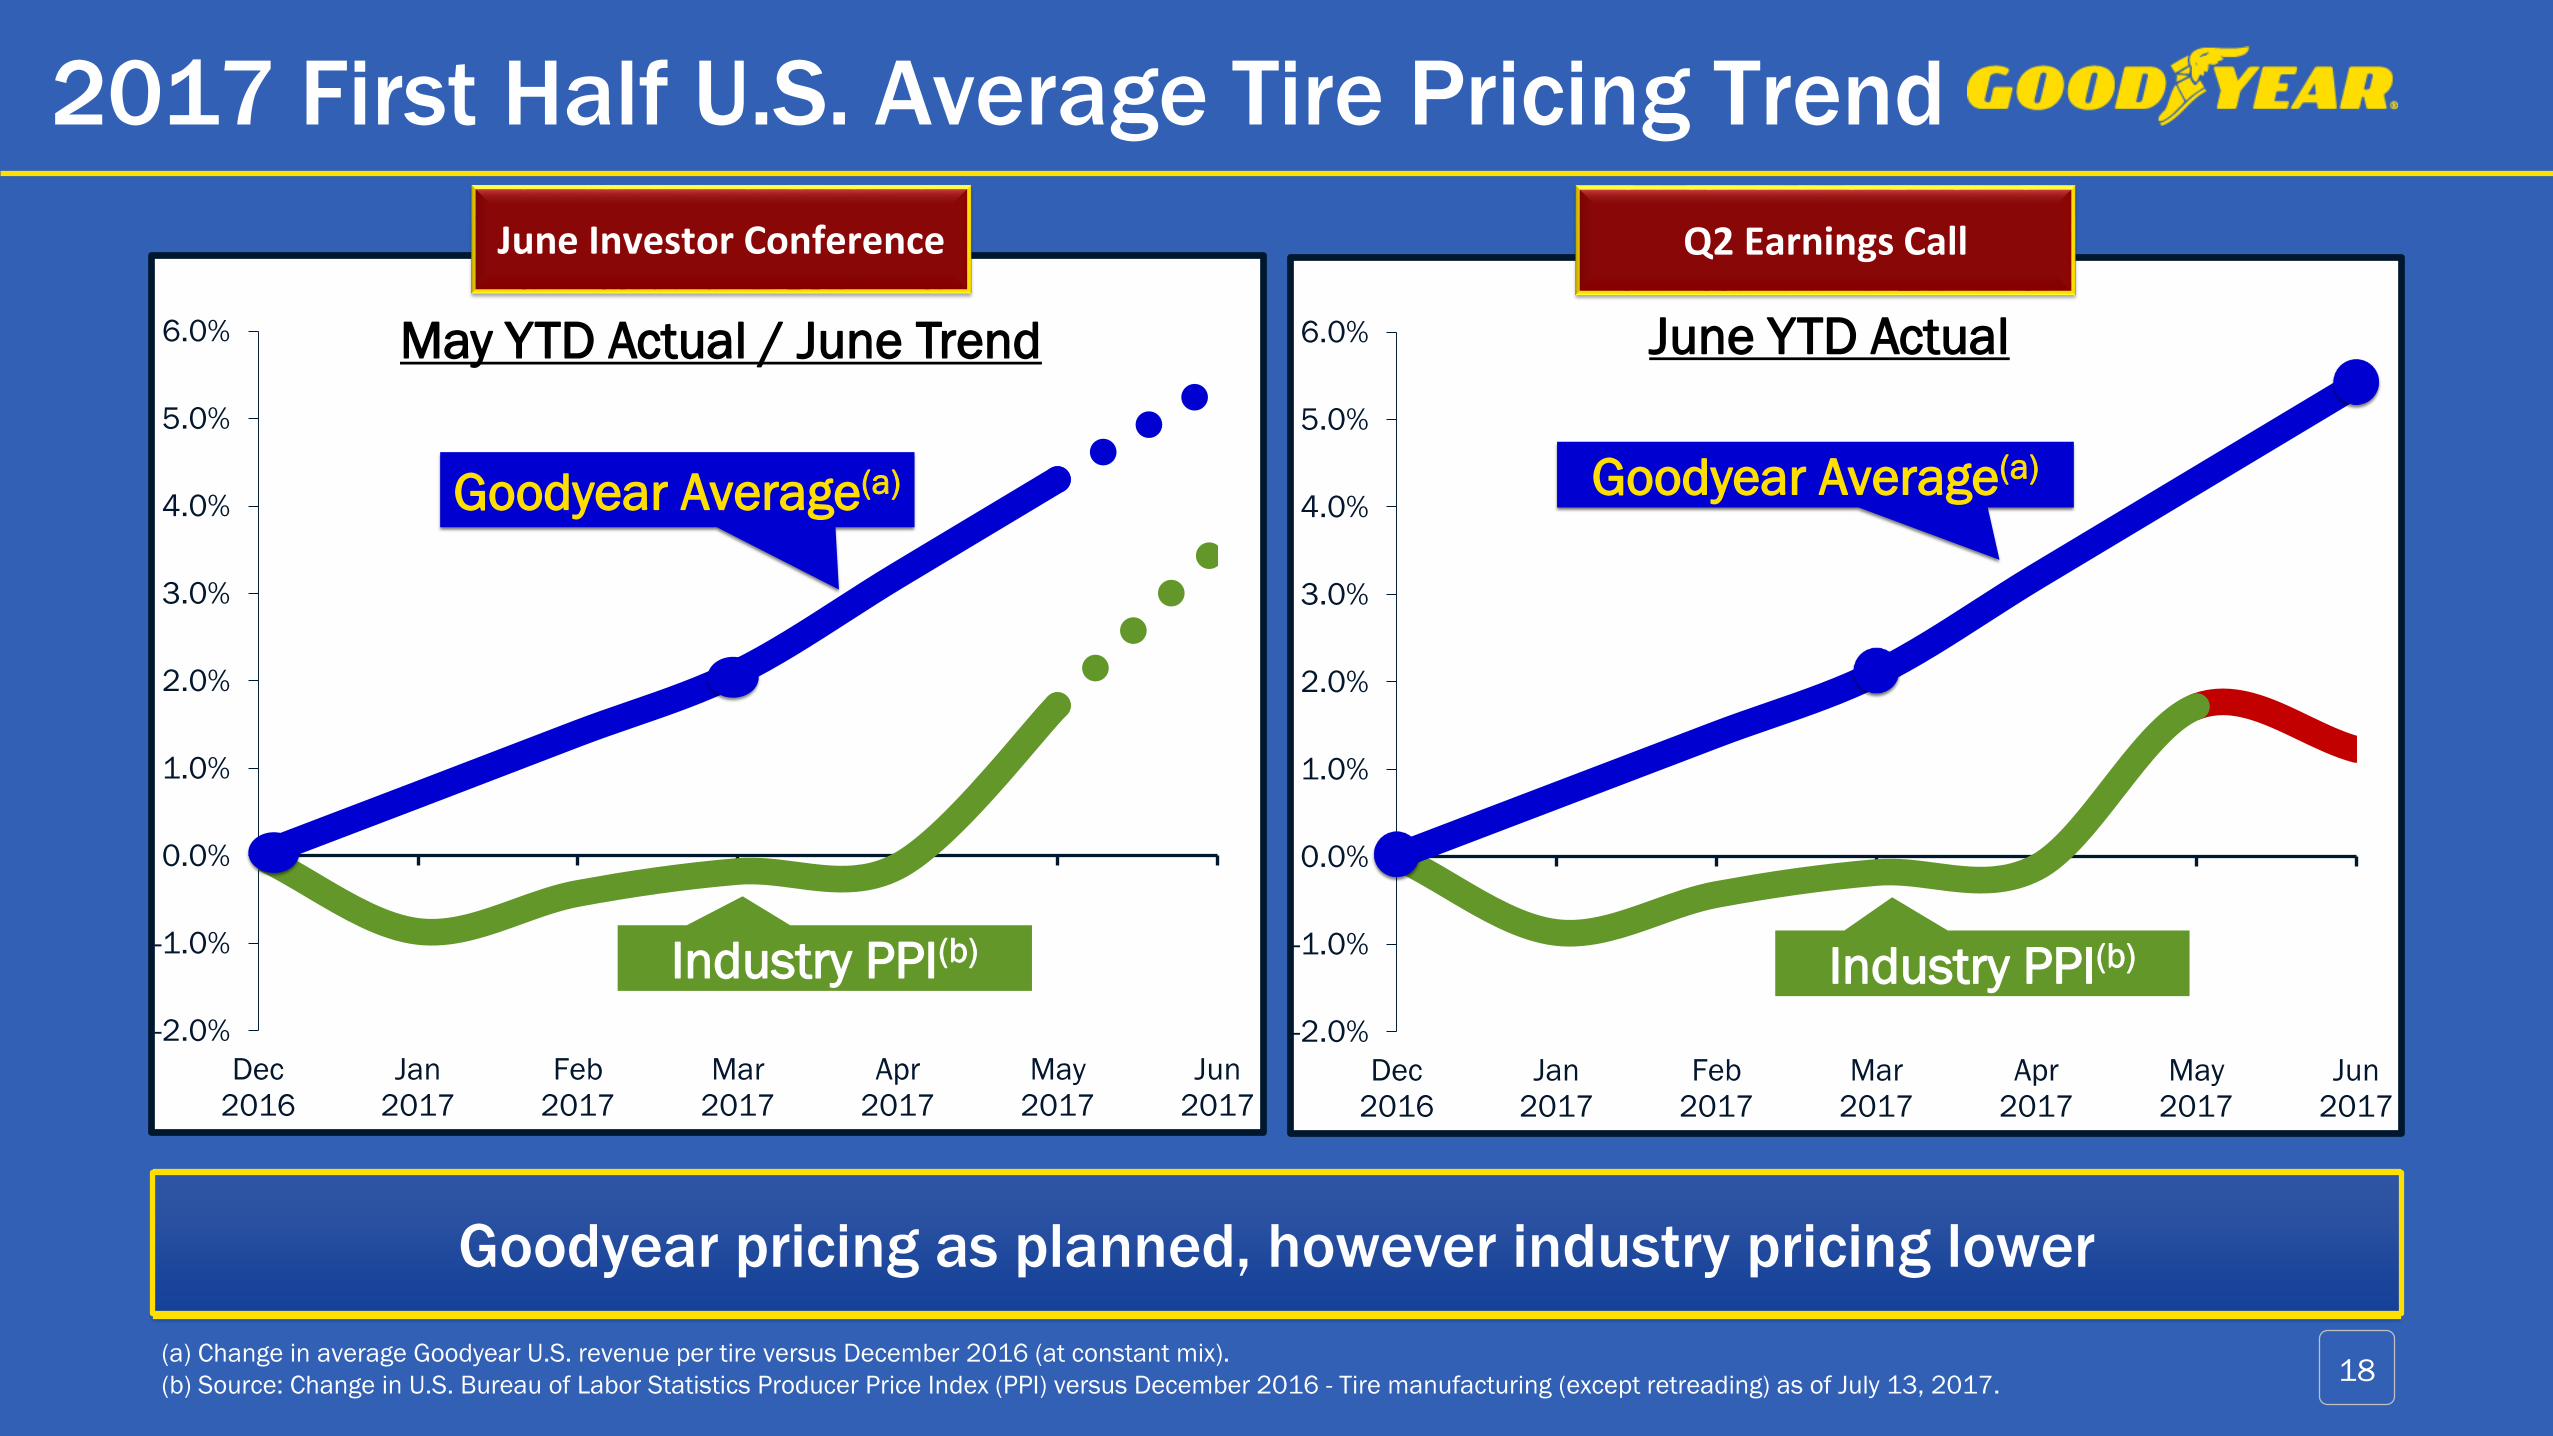
2017 First Half U.S. Average Tire Pricing Trend
(a) Change in average Goodyear U.S. revenue per tire versus December 2016 (at constant mix).
(b) Source: Change in U.S. Bureau of Labor Statistics Producer Price Index (PPI) versus December 2016 - Tire manufacturing (except retreading) as of July 13, 2017.18
Goodyear Average(a)
-2.0%
-1.0%
0.0%
1.0%
2.0%
3.0%
4.0%
5.0%
6.0%
Dec
2016
Jan
2017
Feb
2017
Mar
2017
Apr
2017
May
2017
Jun
2017
June YTD Actual
Industry PPI(b)
Goodyear Average(a)
June Investor Conference Q2 Earnings Call
Goodyear pricing as planned, however industry pricing lower
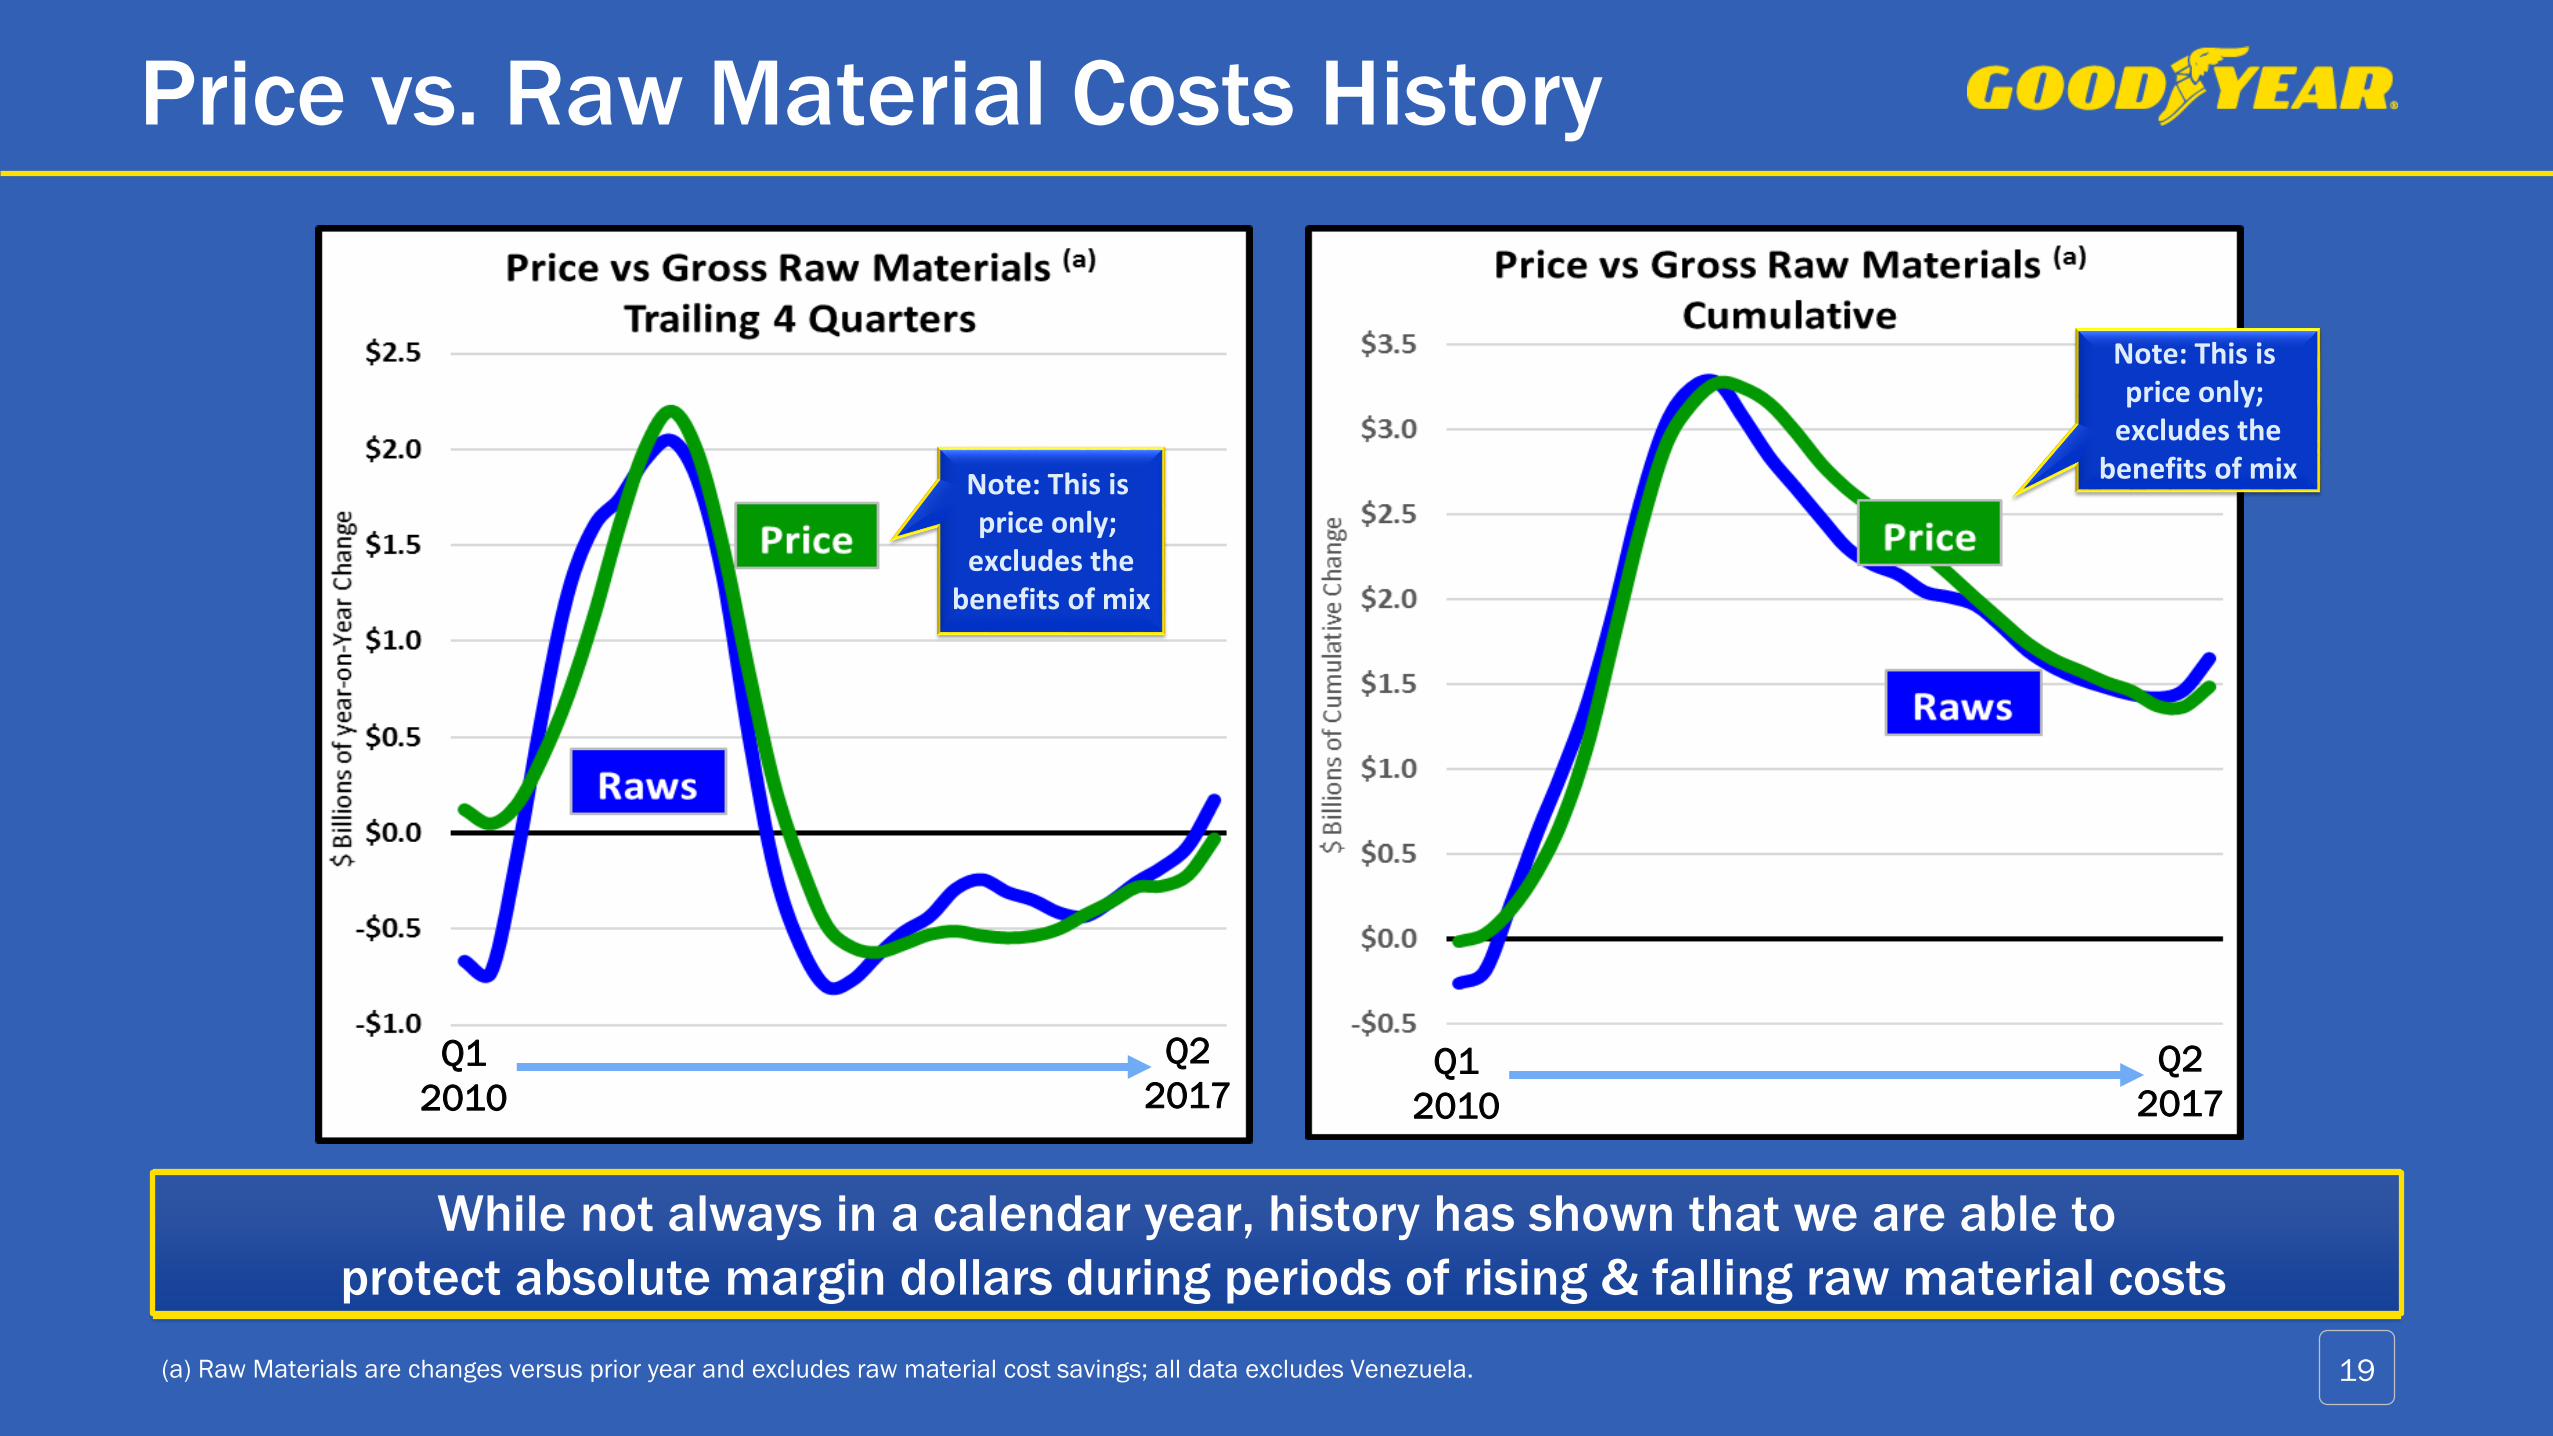
While not always in a calendar year, history has shown that we are able to
protect absolute margin dollars during periods of rising & falling raw material costs
Price vs. Raw Material Costs History
(a) Raw Materials are changes versus prior year and excludes raw material cost savings; all data excludes Venezuela.
Note: This is price only;
excludes thebenefits of mix
Note: This is price only;
excludes thebenefits of mix
Q1
2010
Q2
2017Q1
2010
Q2
2017
19
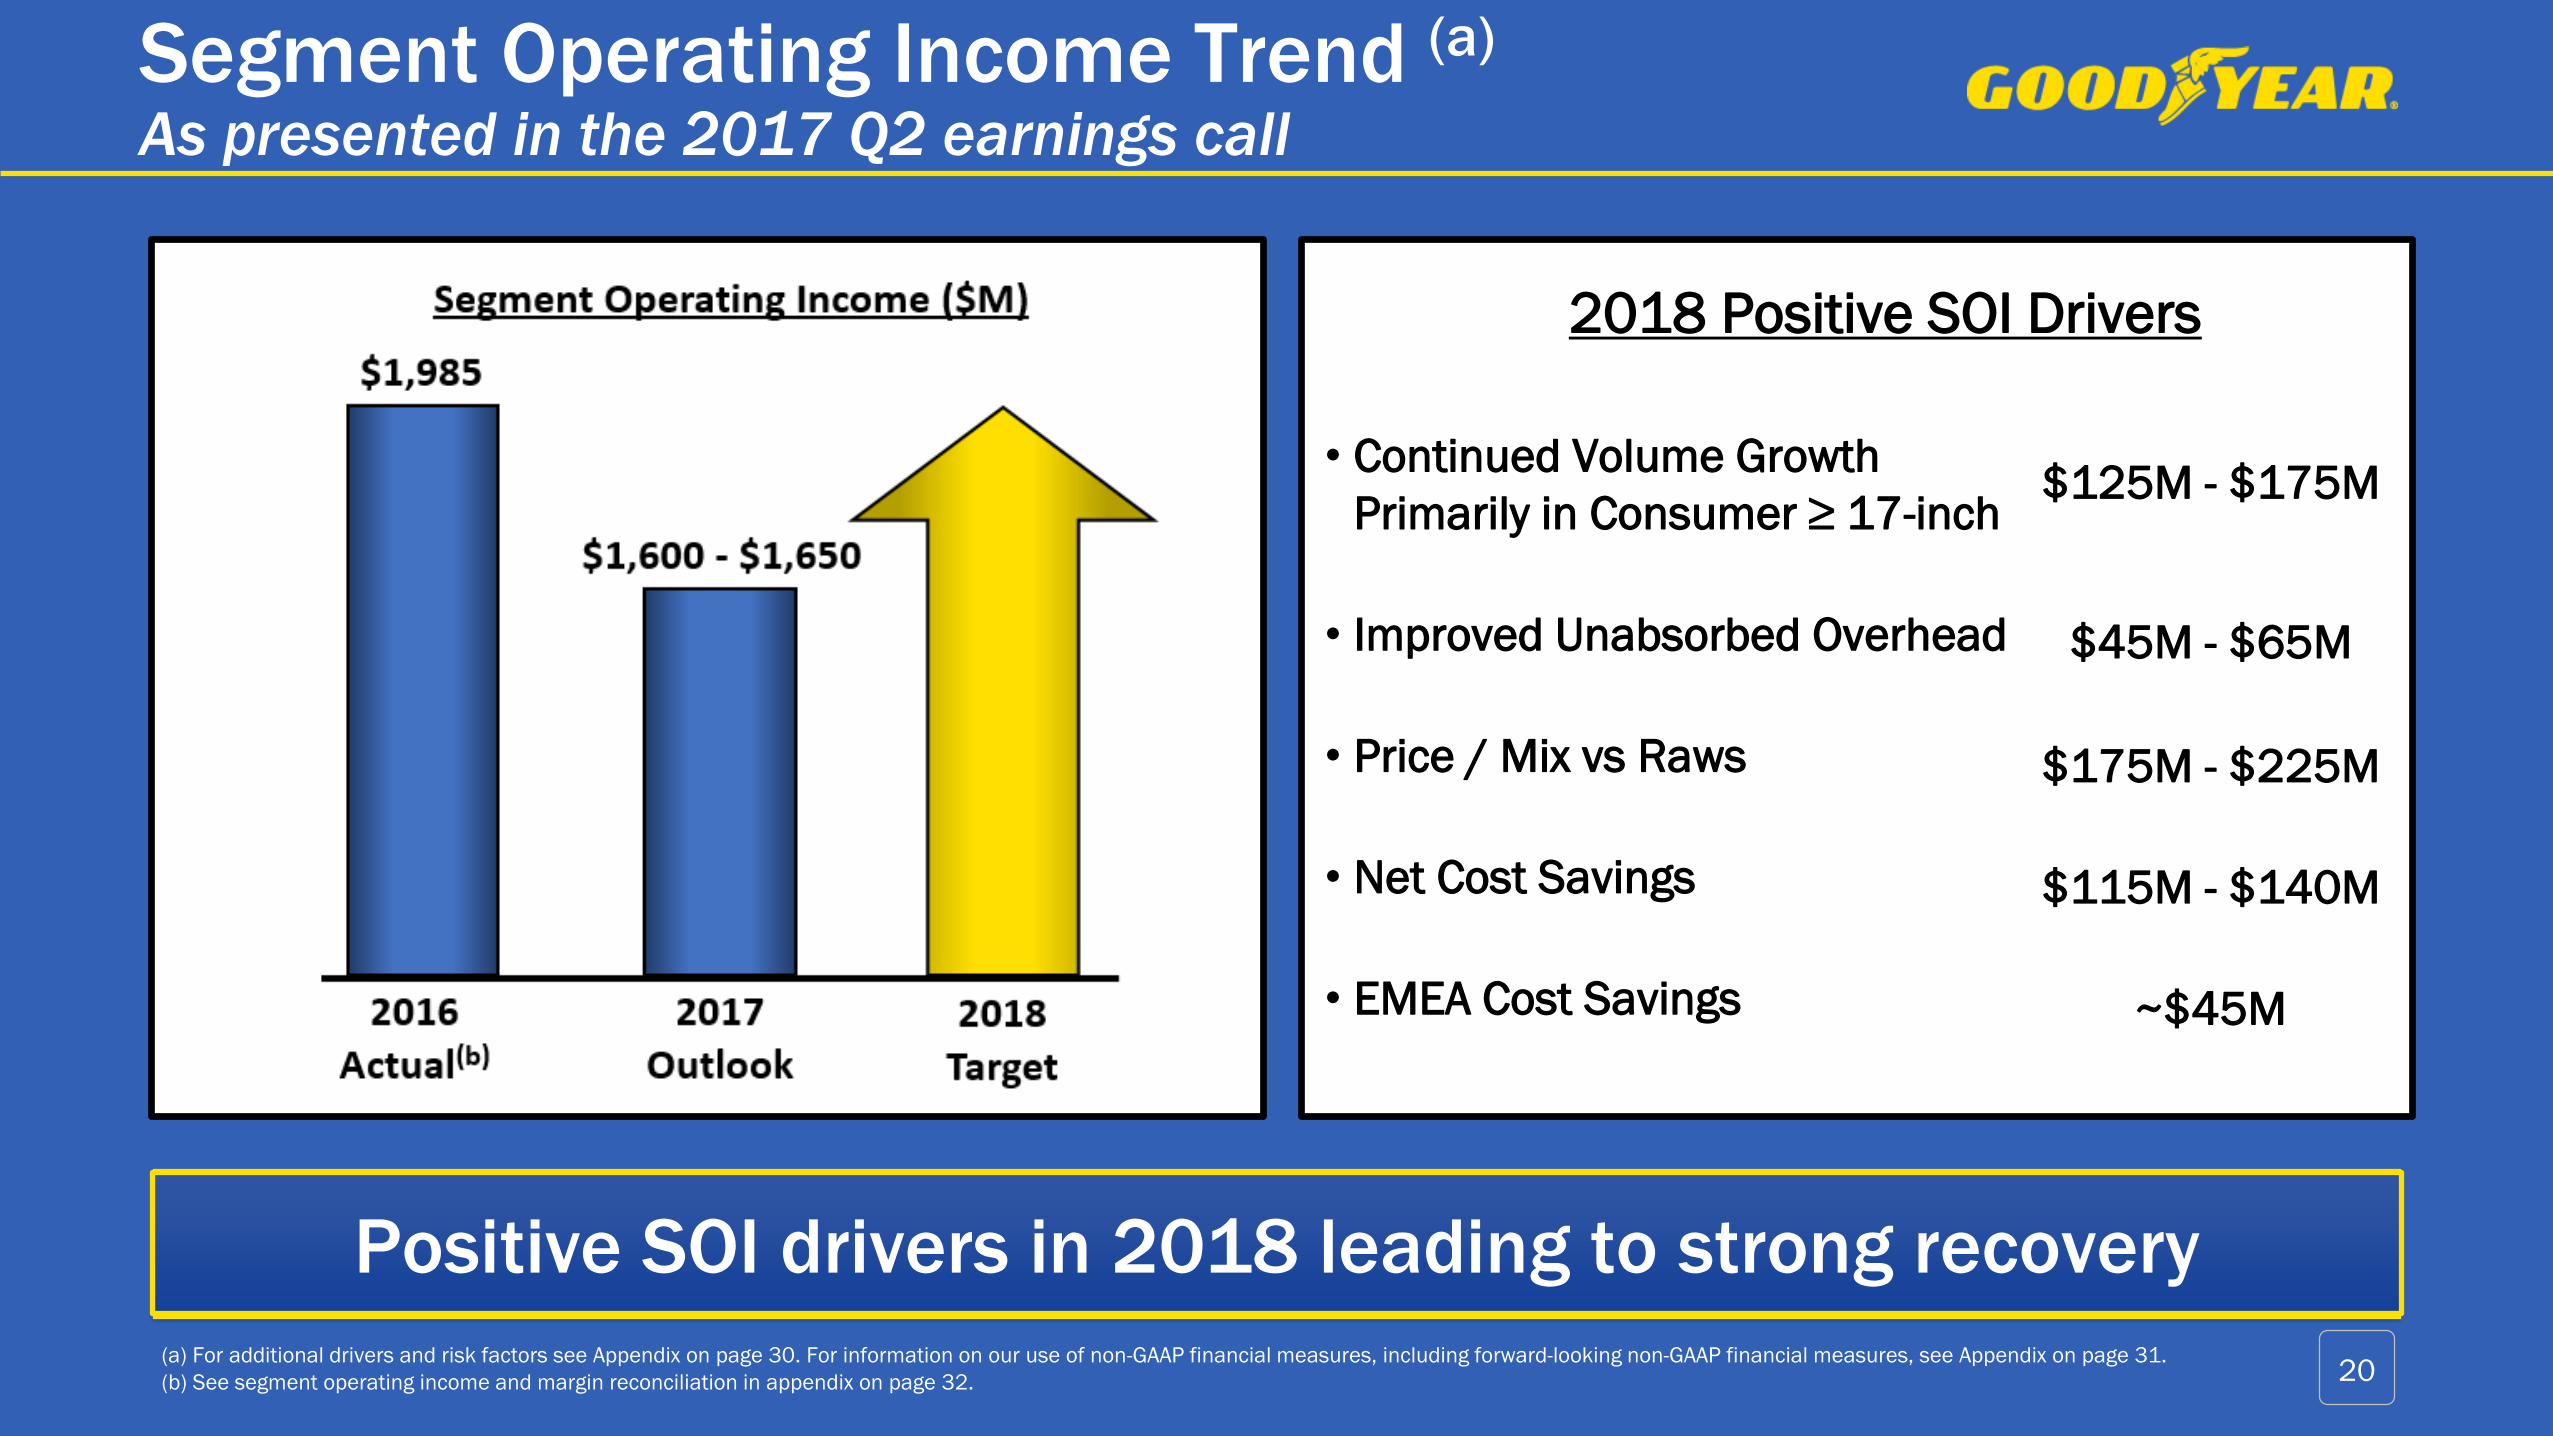
(a) For additional drivers and risk factors see Appendix on page 30. For information on our use of non-GAAP financial measures, including forward-looking non-GAAP financial measures, see Appendix on page 31.
(b) See segment operating income and margin reconciliation in appendix on page 32. 20
2018 Positive SOI Drivers
Segment Operating Income Trend (a)
As presented in the 2017 Q2 earnings call
• Continued Volume Growth
Primarily in Consumer ≥ 17-inch
• Improved Unabsorbed Overhead
• Price / Mix vs Raws
• Net Cost Savings
• EMEA Cost Savings
$125M - $175M
$45M - $65M
$175M - $225M
$115M - $140M
~$45M
Positive SOI drivers in 2018 leading to strong recovery

2017 Key Segment Operating Income Drivers(a)
As presented in the 2017 Q2 earnings call
(a) For information on our use of non-GAAP financial measures, including forward-looking non-GAAP financial measures, see Appendix on page 31.
DriverApril Outlook
2017 vs 2016
July Outlook
2017 vs 2016Comments
Global Volume ~Flat ~(3.5%)Disciplined volume execution;
Expecting positive volume trends in Q4
Net Price/Mix vs Raw
Materials~$25 million ~($175) million
Negative P/M vs raws continues into Q3,
improving to neutral in Q4
Overhead Absorption ~($85) million ~($155) million Impact of lower volume in 1st half; Q3 similar to Q2
Cost Savings vs Inflation ~$140 million ~$140 million No change
Foreign Exchange ~($30) million ~Flat Based on July spot rates
Other ~($50) million ~($30) million Lower incentive compensation
21
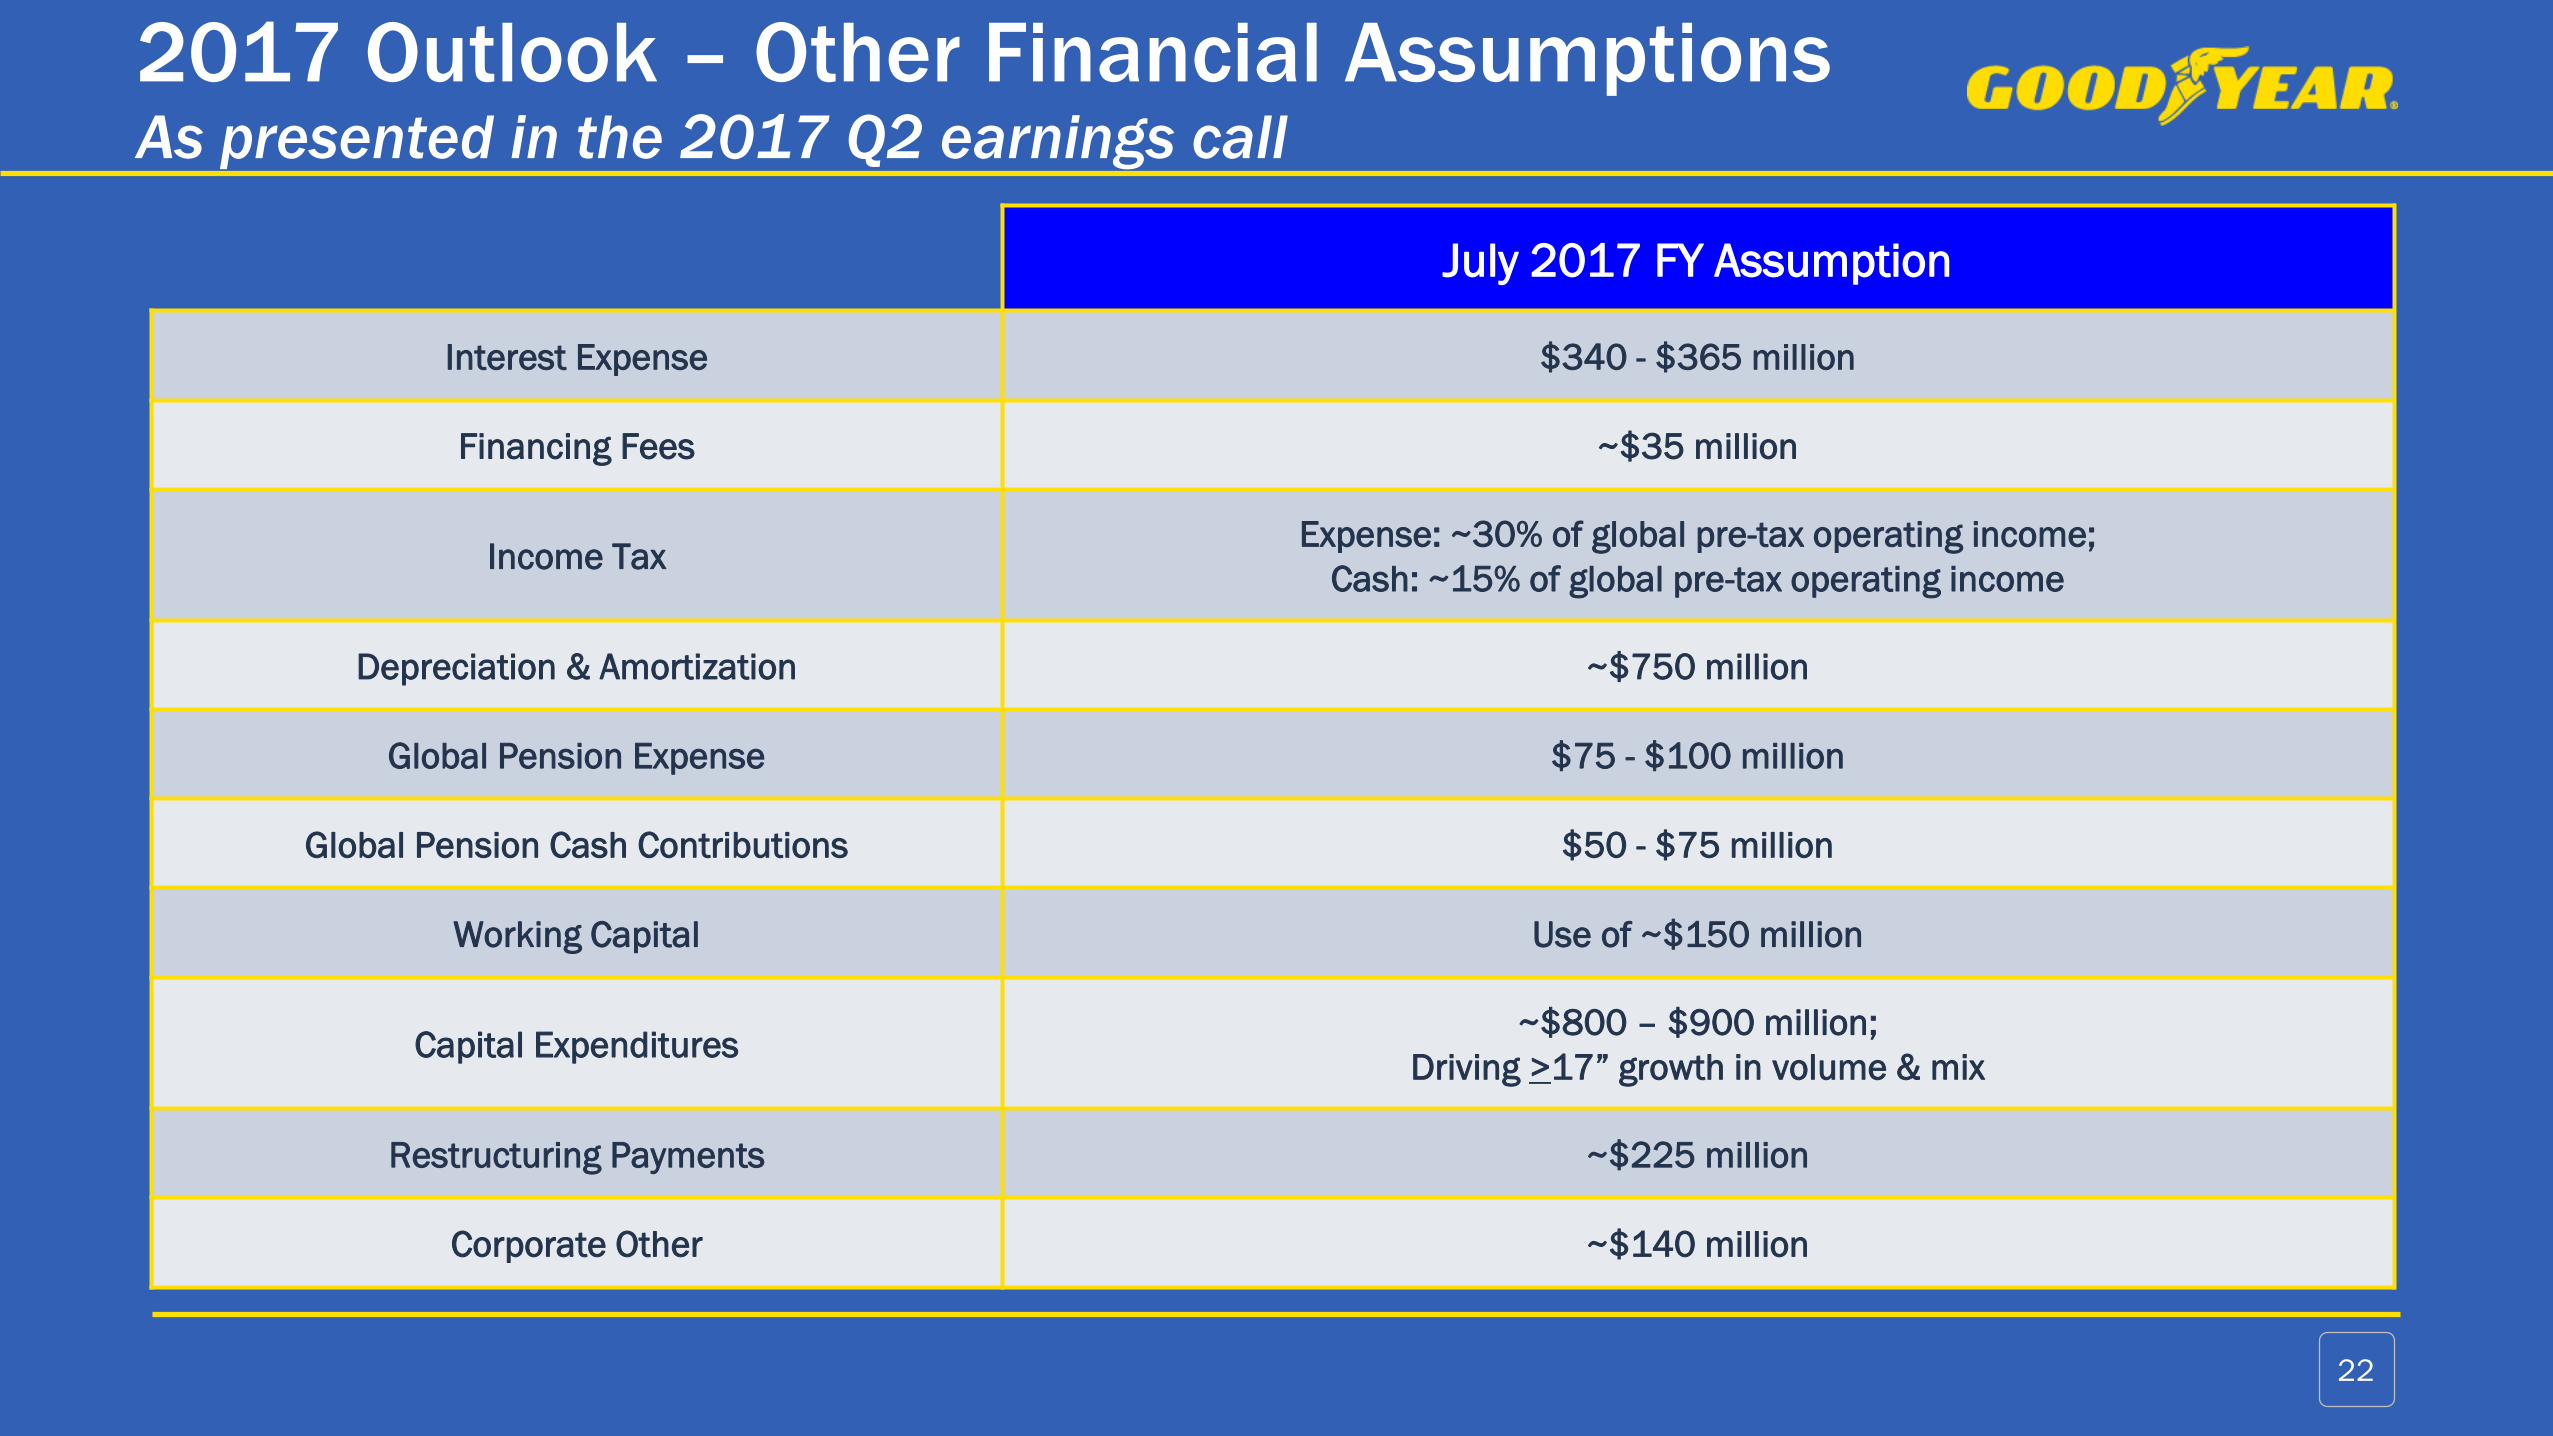
2017 Outlook – Other Financial AssumptionsAs presented in the 2017 Q2 earnings call
22
July 2017 FY Assumption
Interest Expense $340 - $365 million
Financing Fees ~$35 million
Income TaxExpense: ~30% of global pre-tax operating income;
Cash: ~15% of global pre-tax operating income
Depreciation & Amortization ~$750 million
Global Pension Expense $75 - $100 million
Global Pension Cash Contributions $50 - $75 million
Working Capital Use of ~$150 million
Capital Expenditures~$800 – $900 million;
Driving >17” growth in volume & mix
Restructuring Payments ~$225 million
Corporate Other ~$140 million
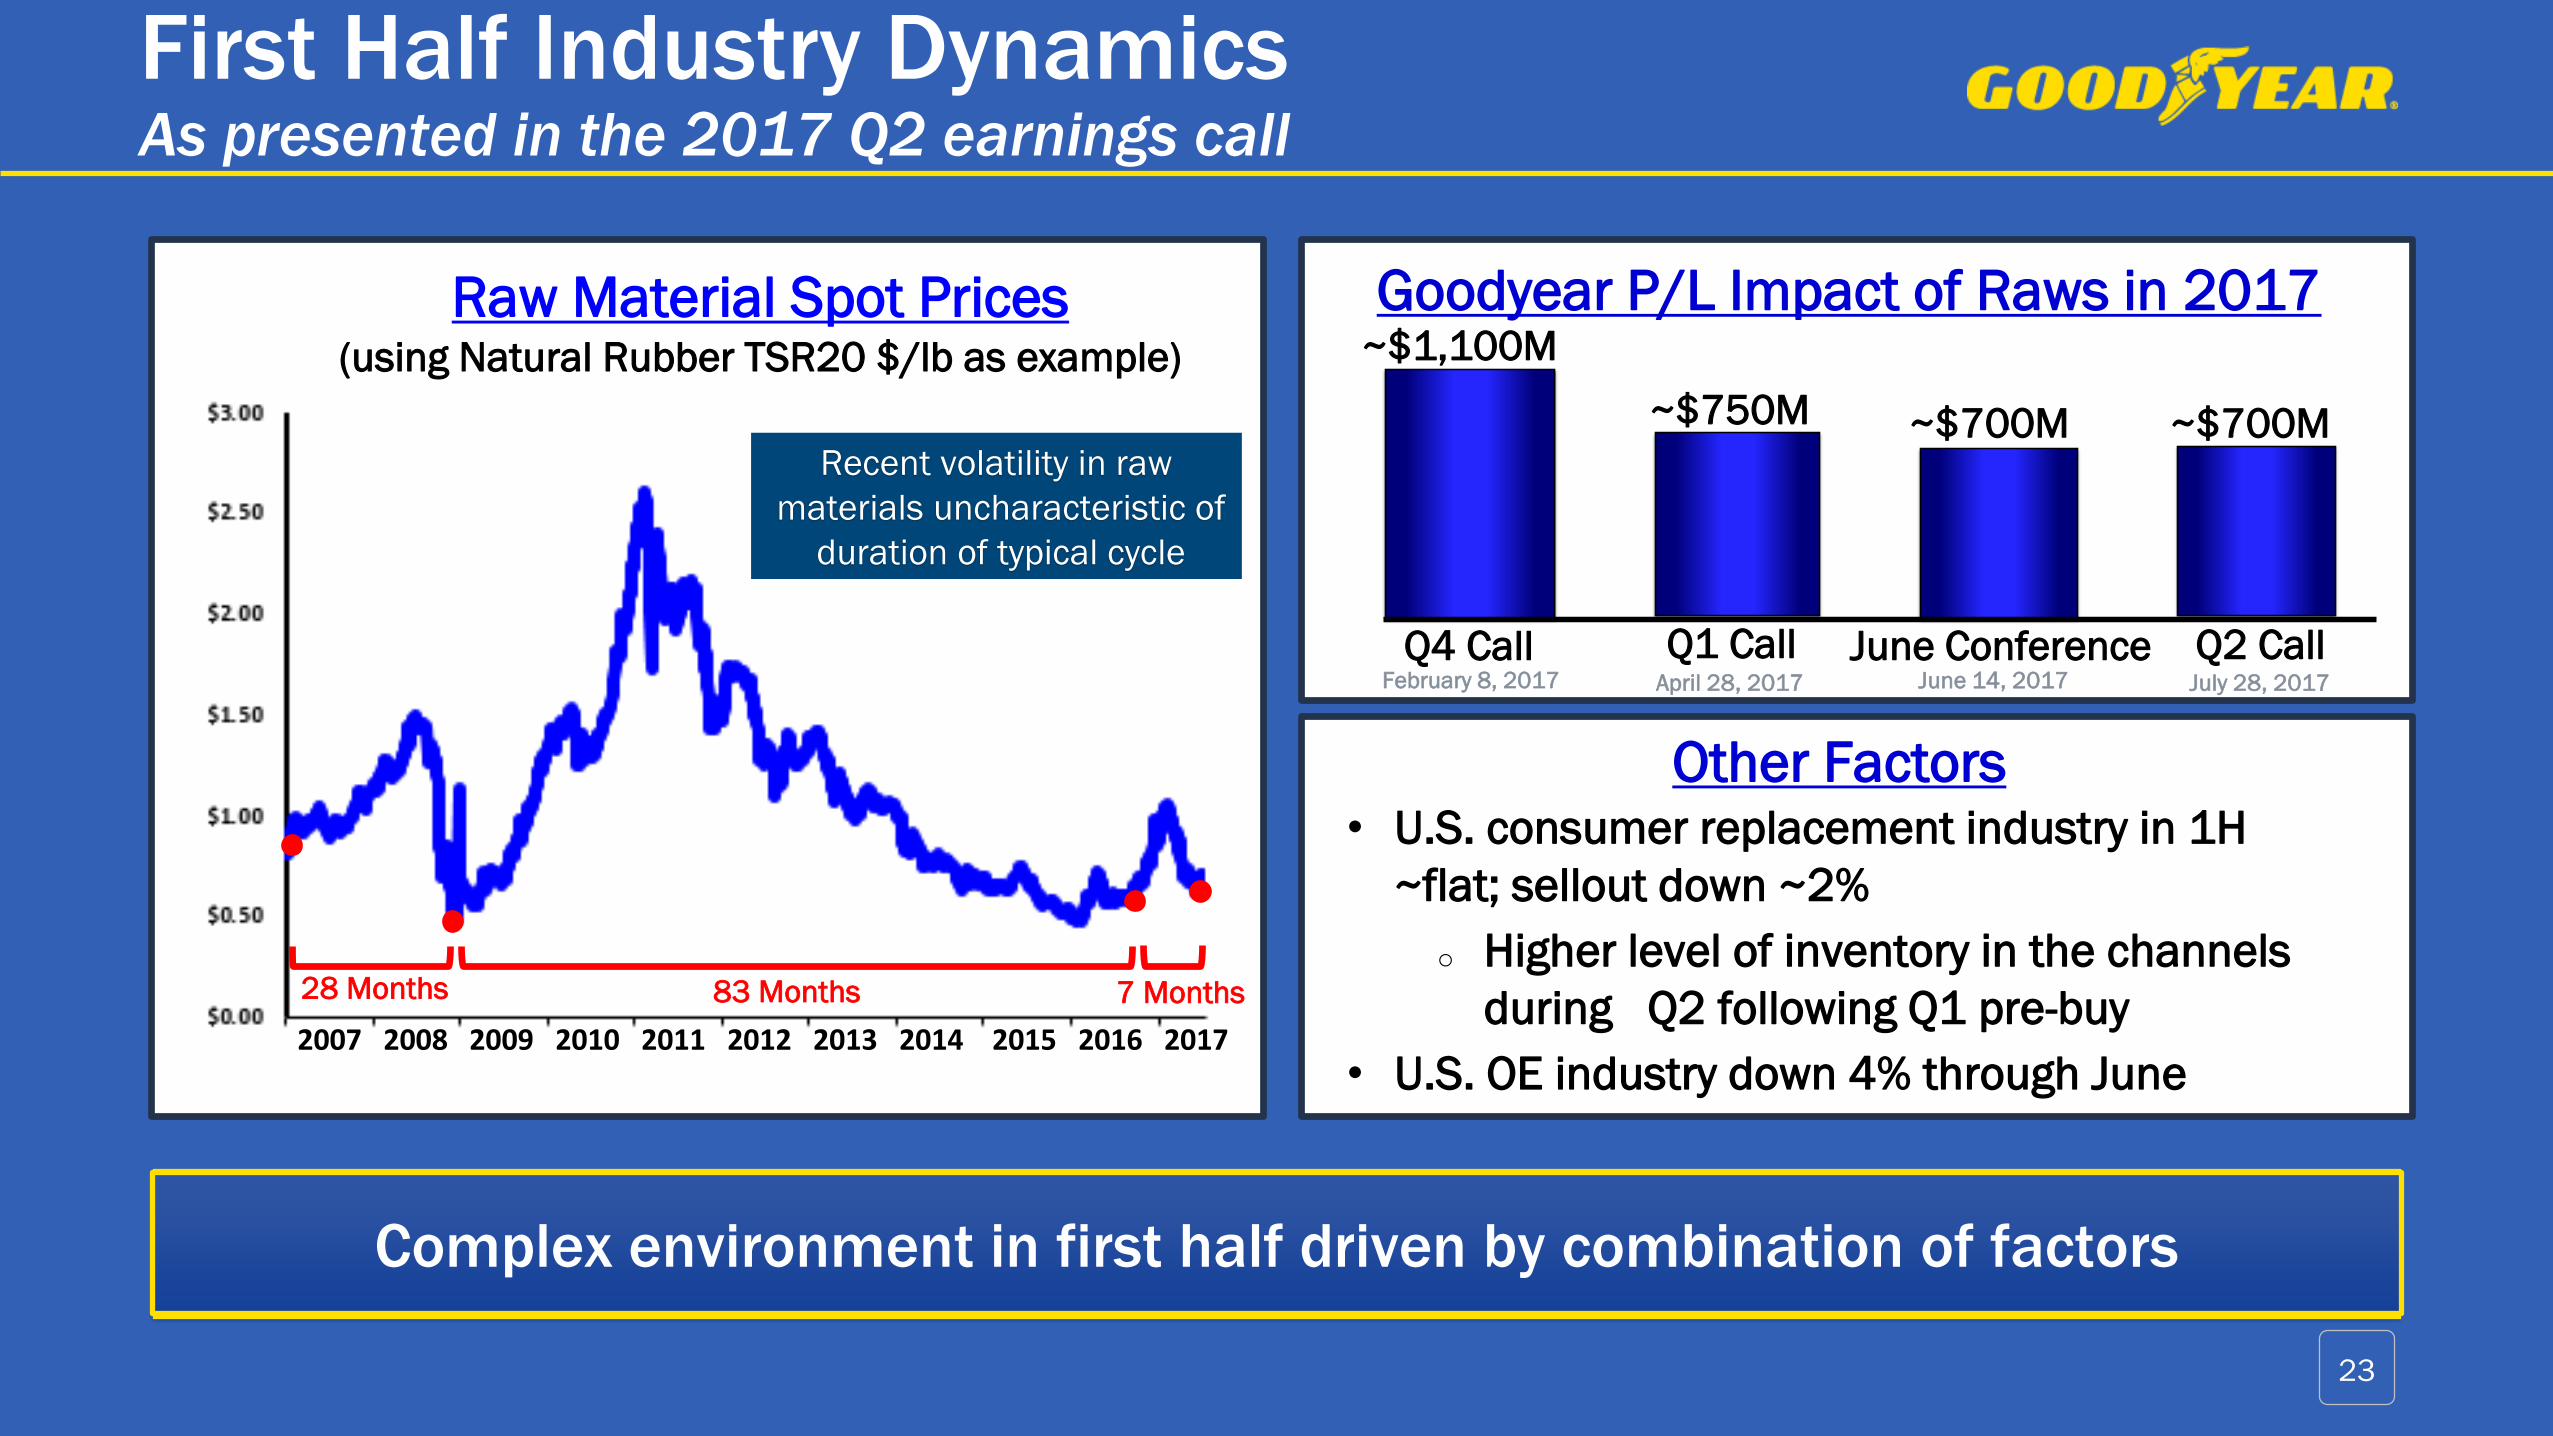
First Half Industry DynamicsAs presented in the 2017 Q2 earnings call
23
Complex environment in first half driven by combination of factors
• U.S. consumer replacement industry in 1H
~flat; sellout down ~2%
o Higher level of inventory in the channels
during Q2 following Q1 pre-buy
• U.S. OE industry down 4% through June
Other Factors
Recent volatility in raw
materials uncharacteristic of
duration of typical cycle
Goodyear P/L Impact of Raws in 2017
Q4 Call Q1 Call Q2 CallJune ConferenceFebruary 8, 2017 April 28, 2017 June 14, 2017 July 28, 2017
~$750M ~$700M ~$700M
~$1,100MRaw Material Spot Prices
(using Natural Rubber TSR20 $/lb as example)
28 Months 83 Months 7 Months
2007 2008 2009 2010 2011 2012 2013 2014 2015 2016 2017
Raw Materials and Price/MixAs presented in the 2017 Q2 earnings call
24
~2%
~4%
~5% ~5%
~4%
Q1 Q2 Q3E Q4E Year
Price/Mix per Tire Change (b)
2017 vs 2016
(a) Impact to cost of goods sold before raw material cost saving measures
(b) Full year 2016 tire revenue was ~87% of total revenue. Revenue was adjusted to 2017 volumes and to exclude the impact of currency.
$189
~$300
~$170
Q2 Q3E Q4E Year
Raw Material Cost(a)
2017 vs 2016
Q1
$42
~$700
~20%
~18%
~32%
21%
4%
Note: $700M is
~5.5% of 2016
tire revenue
Note: $300M is
~9% of 2016
tire revenue
Note: $170M is
~5% of 2016
tire revenue
Terms: US$ millions
Continue to improve Price/Mix to address higher raw material costs

2017 Full-Year Industry OutlookAs presented in the 2017 Q2 earnings call
(a) For replacement, Western Europe is Europool and Turkey. For OE, Western Europe is total EMEA. 25
Full-Year 2017 Guidance
United States Western Europe (a)
Consumer Replacement ~(1) – 1% ~Flat – 1%
Consumer OE ~(4) – (5)% ~Flat
Commercial Replacement ~Flat – 1% ~2%
Commercial OE ~3 – 4% ~2%
26
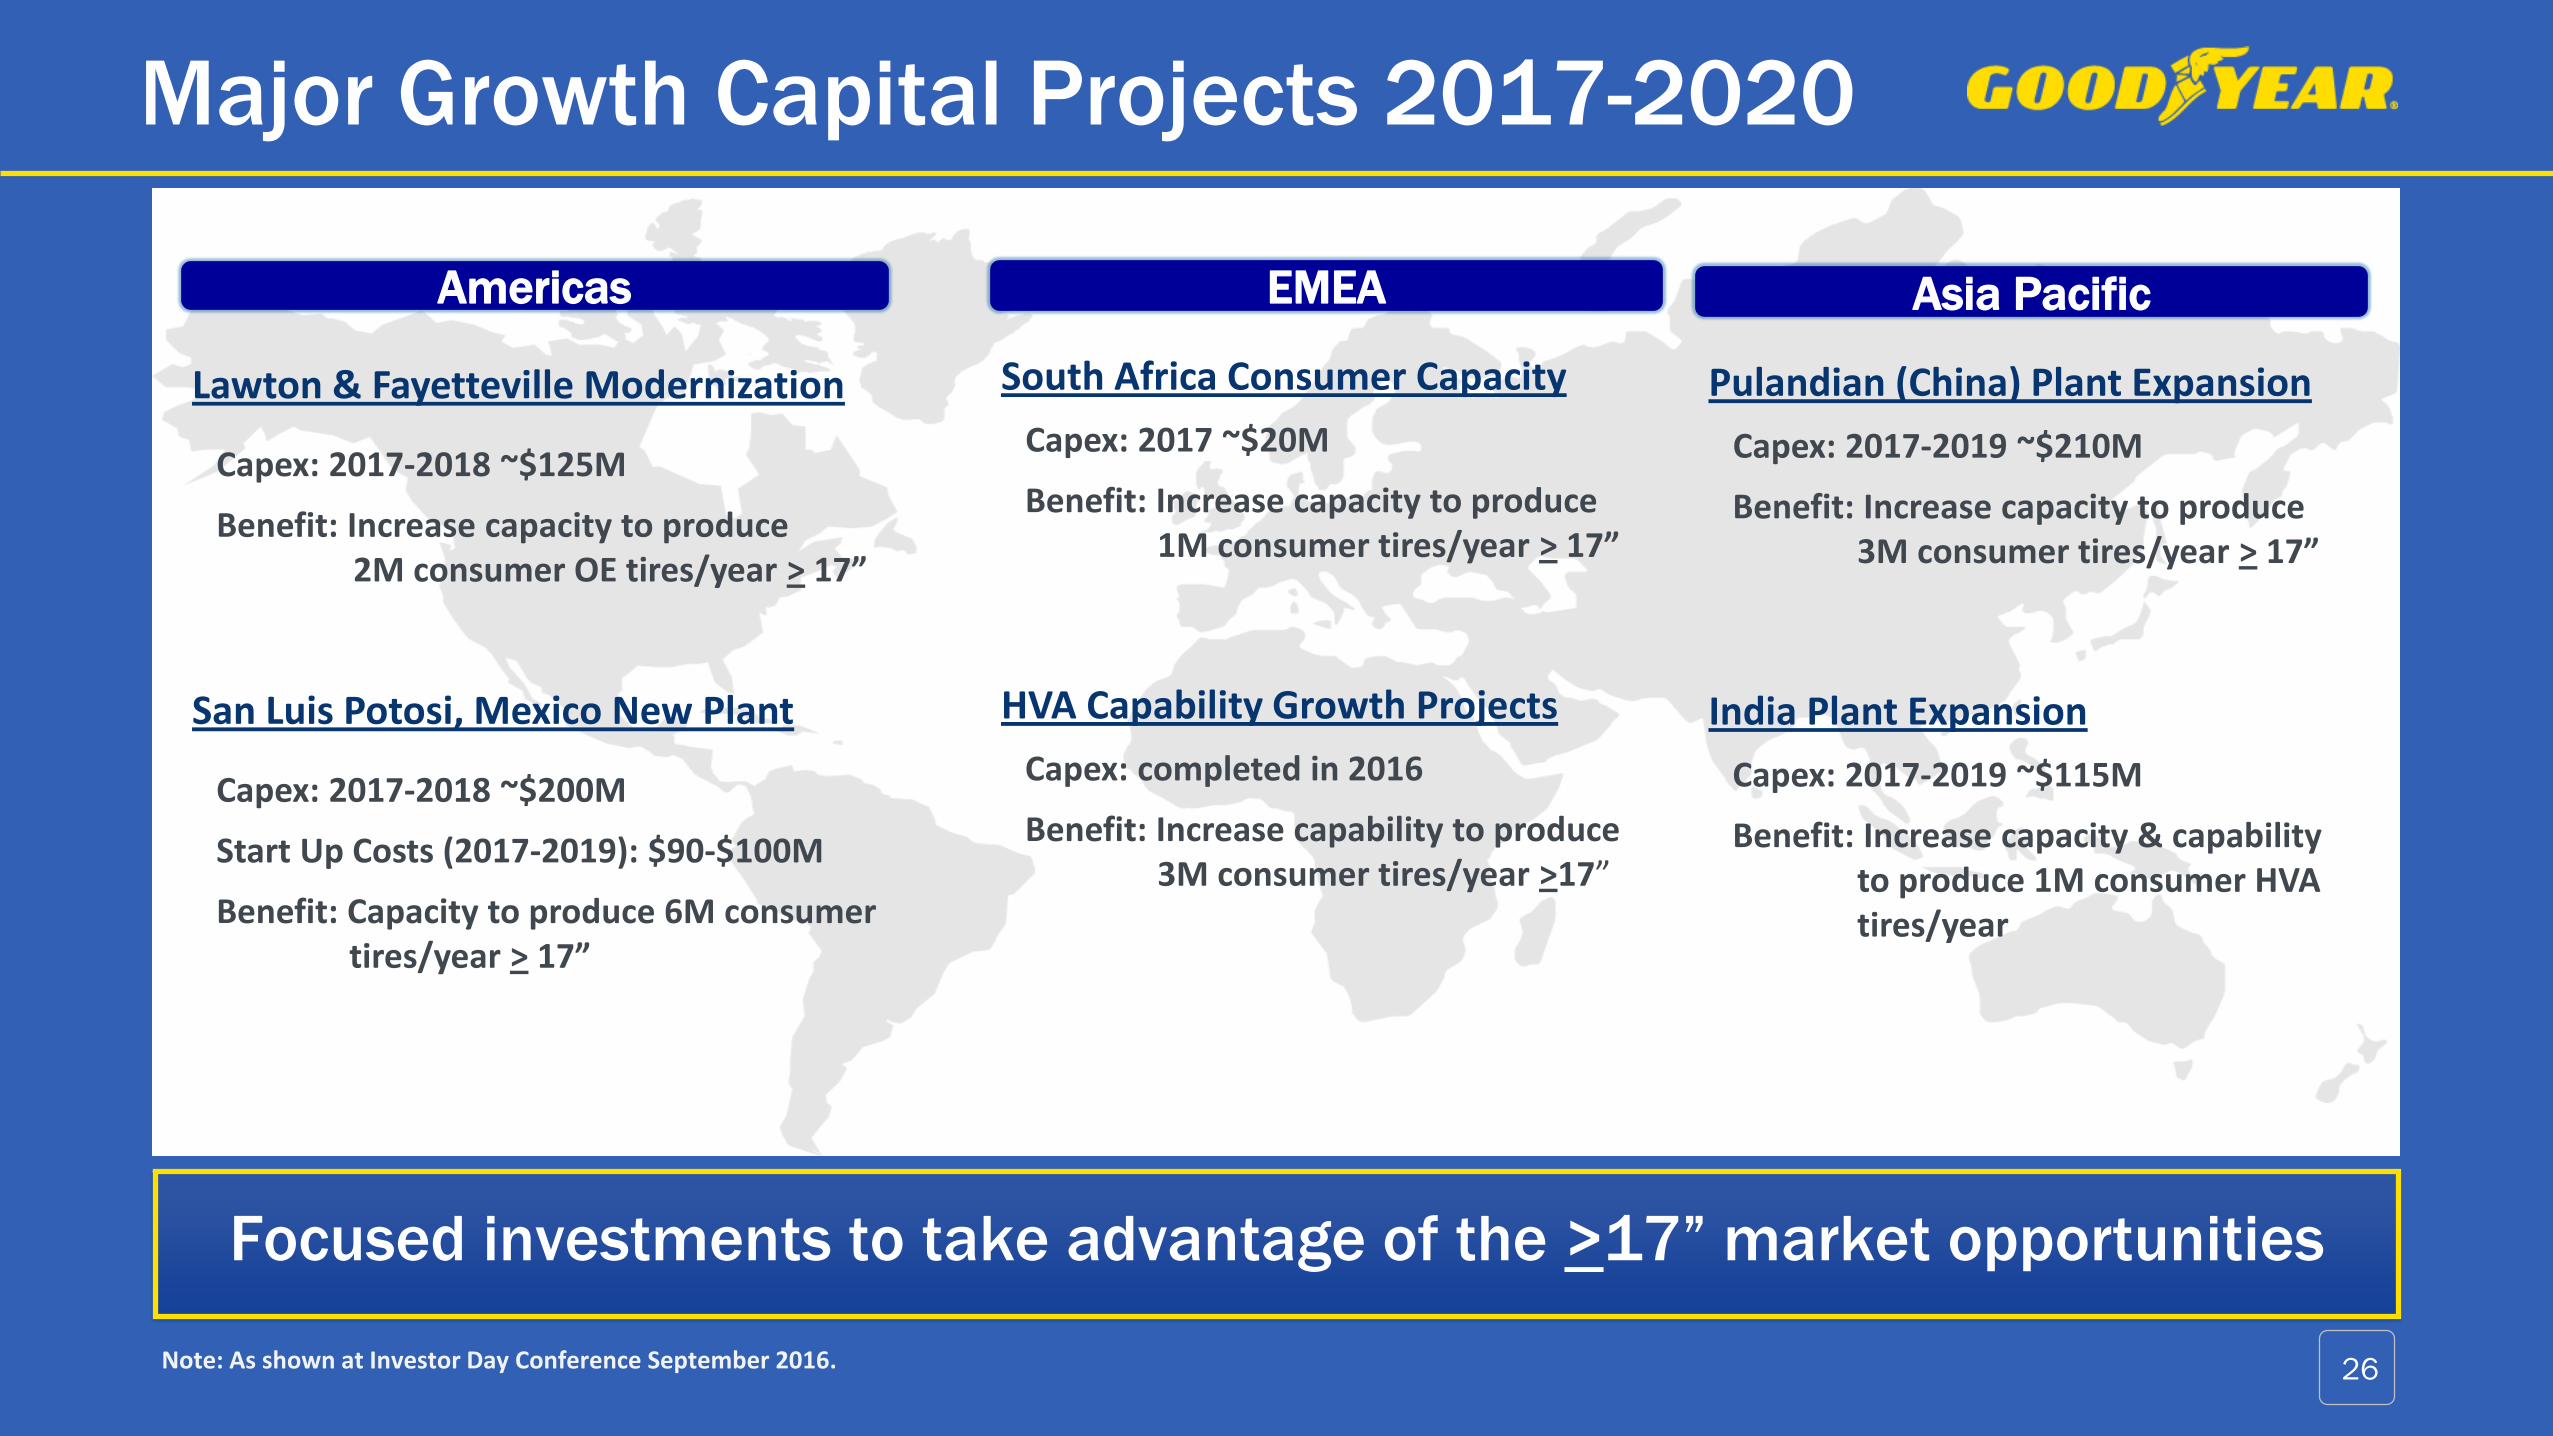
Focused investments to take advantage of the >17” market opportunities
Major Growth Capital Projects 2017-2020
Americas
Lawton & Fayetteville Modernization
Capex: 2017-2018 ~$125M
Benefit: Increase capacity to produce2M consumer OE tires/year > 17”
San Luis Potosi, Mexico New Plant
Capex: 2017-2018 ~$200M
Start Up Costs (2017-2019): $90-$100M
Benefit: Capacity to produce 6M consumer tires/year > 17”
EMEA
South Africa Consumer Capacity
Capex: 2017 ~$20M
Benefit: Increase capacity to produce 1M consumer tires/year > 17”
HVA Capability Growth Projects
Capex: completed in 2016
Benefit: Increase capability to produce 3M consumer tires/year >17”
Asia Pacific
Pulandian (China) Plant Expansion
Capex: 2017-2019 ~$210M
Benefit: Increase capacity to produce 3M consumer tires/year > 17”
India Plant Expansion
Capex: 2017-2019 ~$115M
Benefit: Increase capacity & capability to produce 1M consumer HVA tires/year
Note: As shown at Investor Day Conference September 2016.

Full Year 2016
Tire Unit & Sales Summary
(a) Excludes Venezuela which was deconsolidated on December 31, 2015. 27
Other
9%
Commercial
18%
Consumer
62%
Retail
8%Chemical
3%
Consumer62%
Commercial18%
Other9%
Retail8%
Chemical3%
2016 2015 (a) % Change
Consumer
Units 153.0 151.3 1.1%
Sales $9,414 $9,591 (1.8%)
Commercial
Units 11.6 12.1 (4.2%)
Sales $2,806 $3,128 (10.3%)
2016 Sales = $15,158
Terms: millions
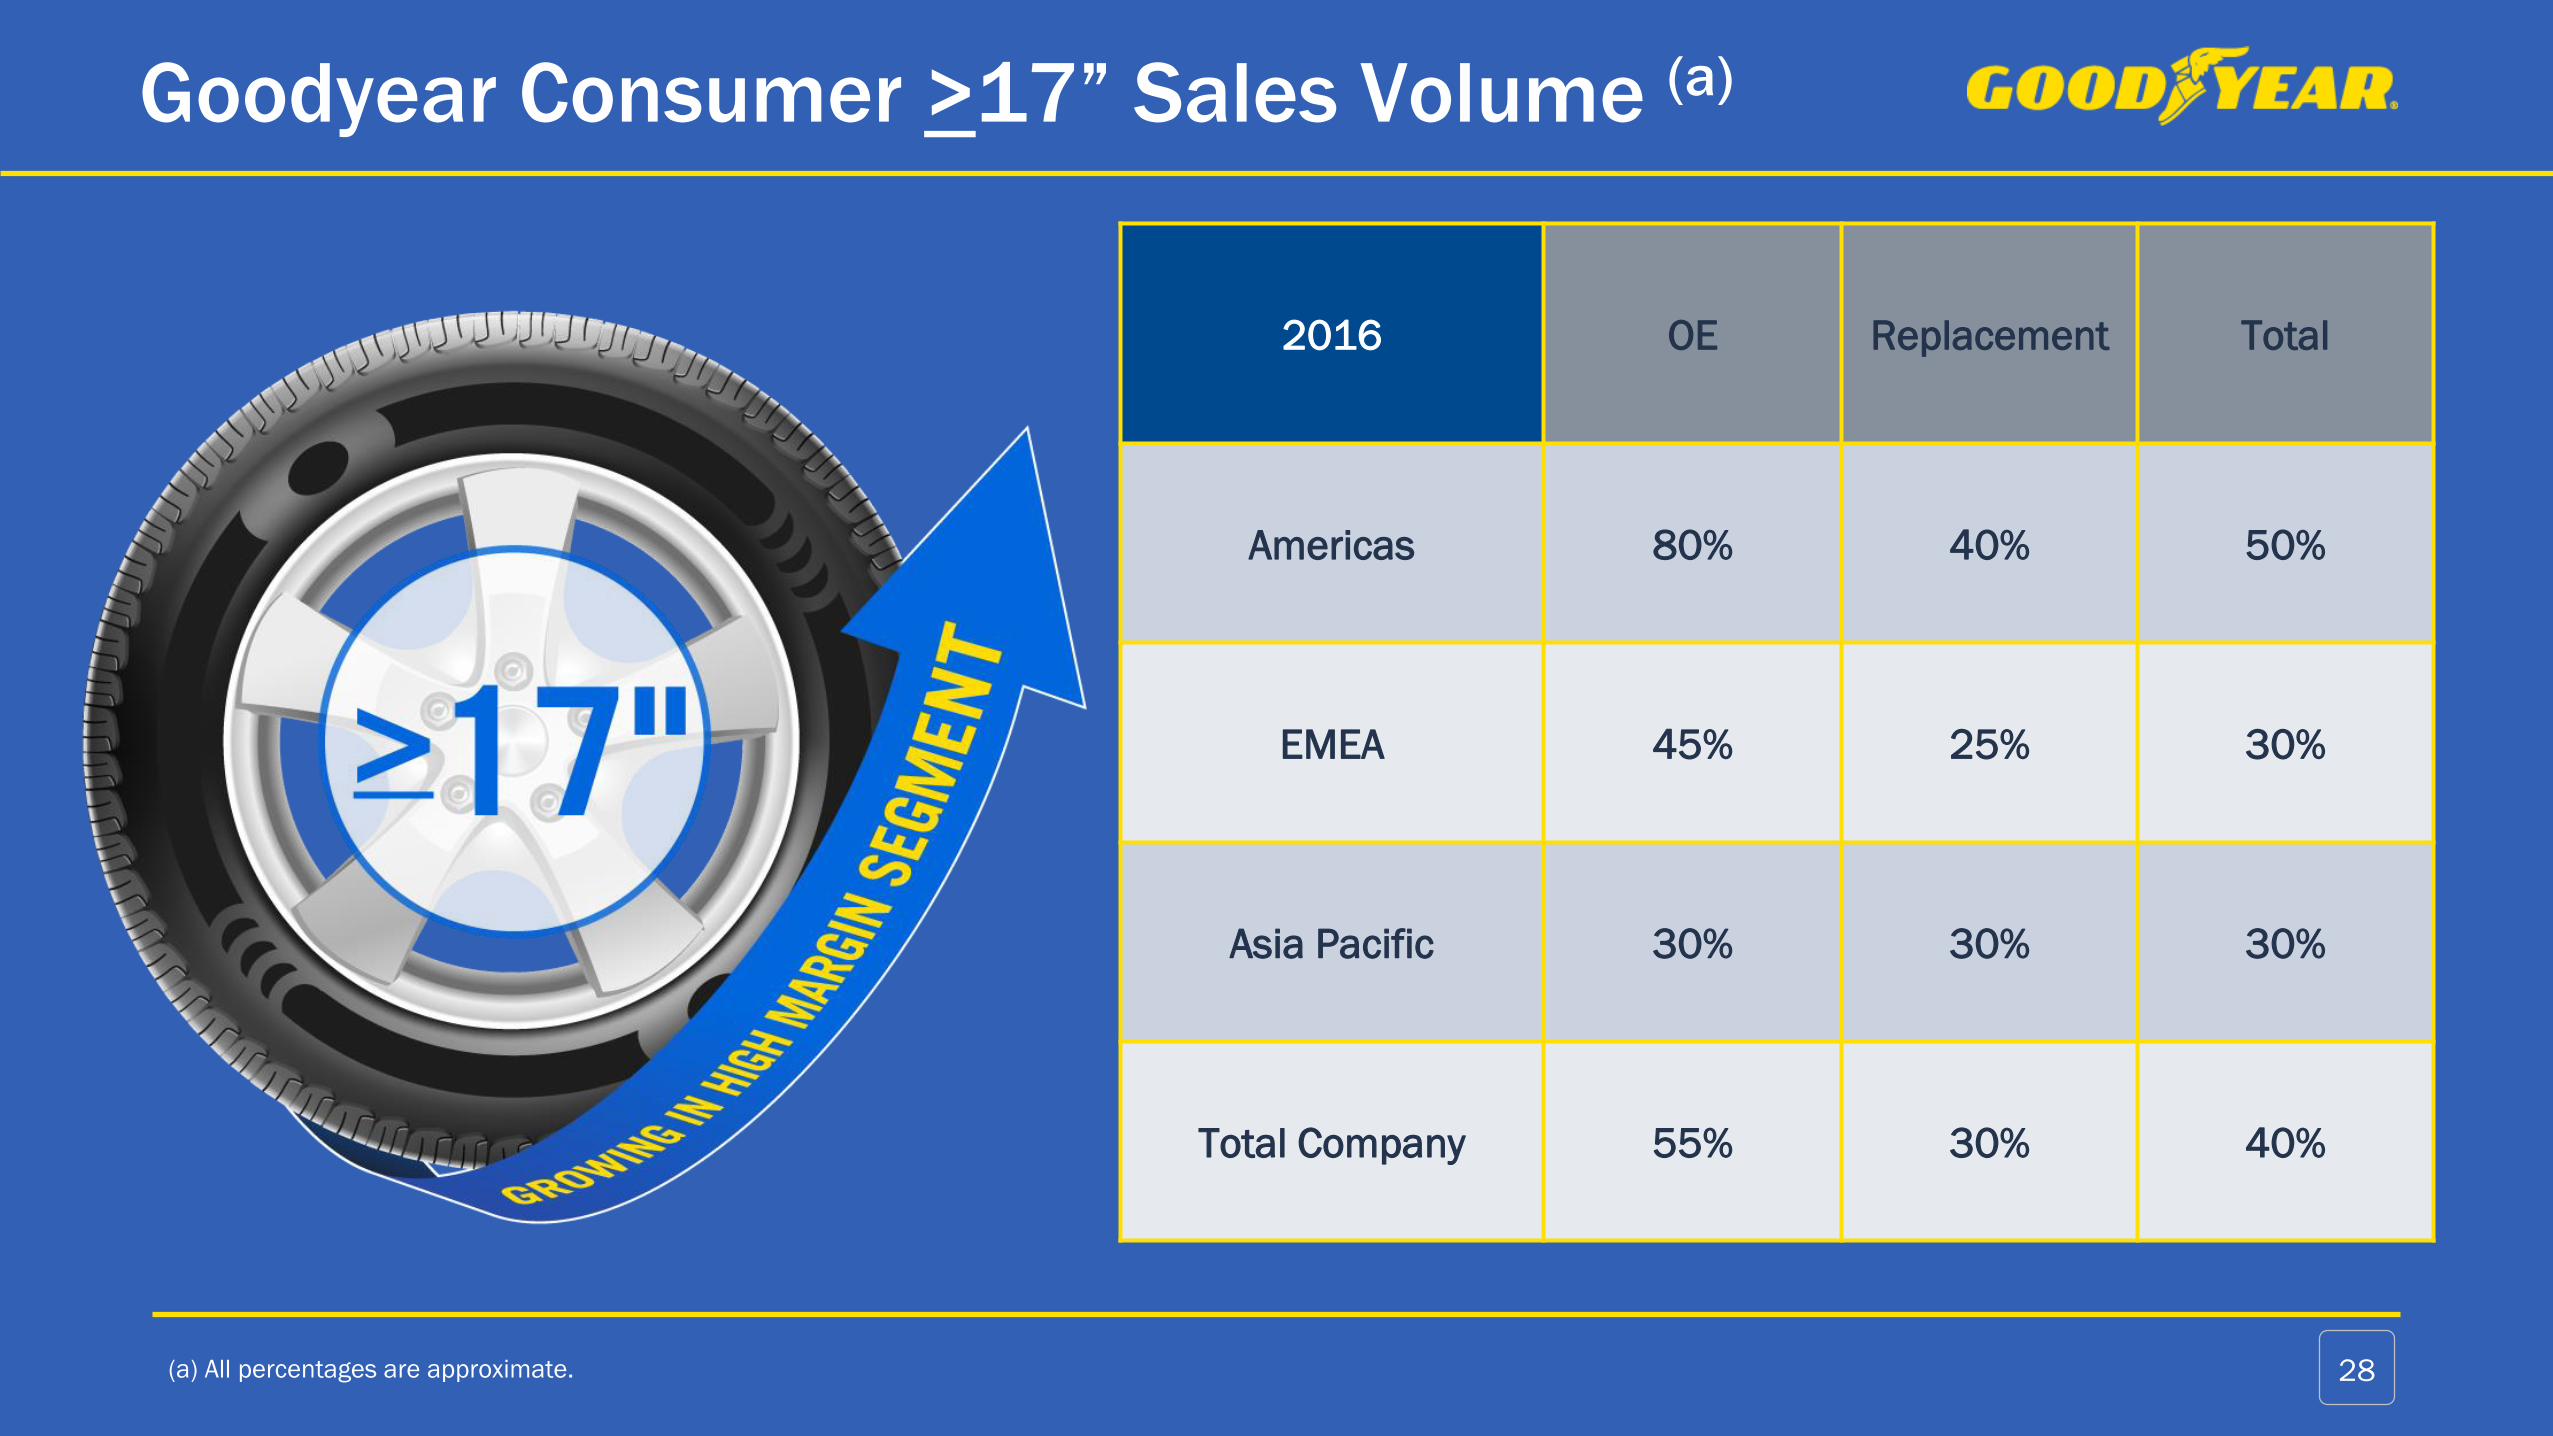
Goodyear Consumer >17” Sales Volume (a)
(a) All percentages are approximate. 28
2016 OE Replacement Total
Americas 80% 40% 50%
EMEA 45% 25% 30%
Asia Pacific 30% 30% 30%
Total Company 55% 30% 40%
29
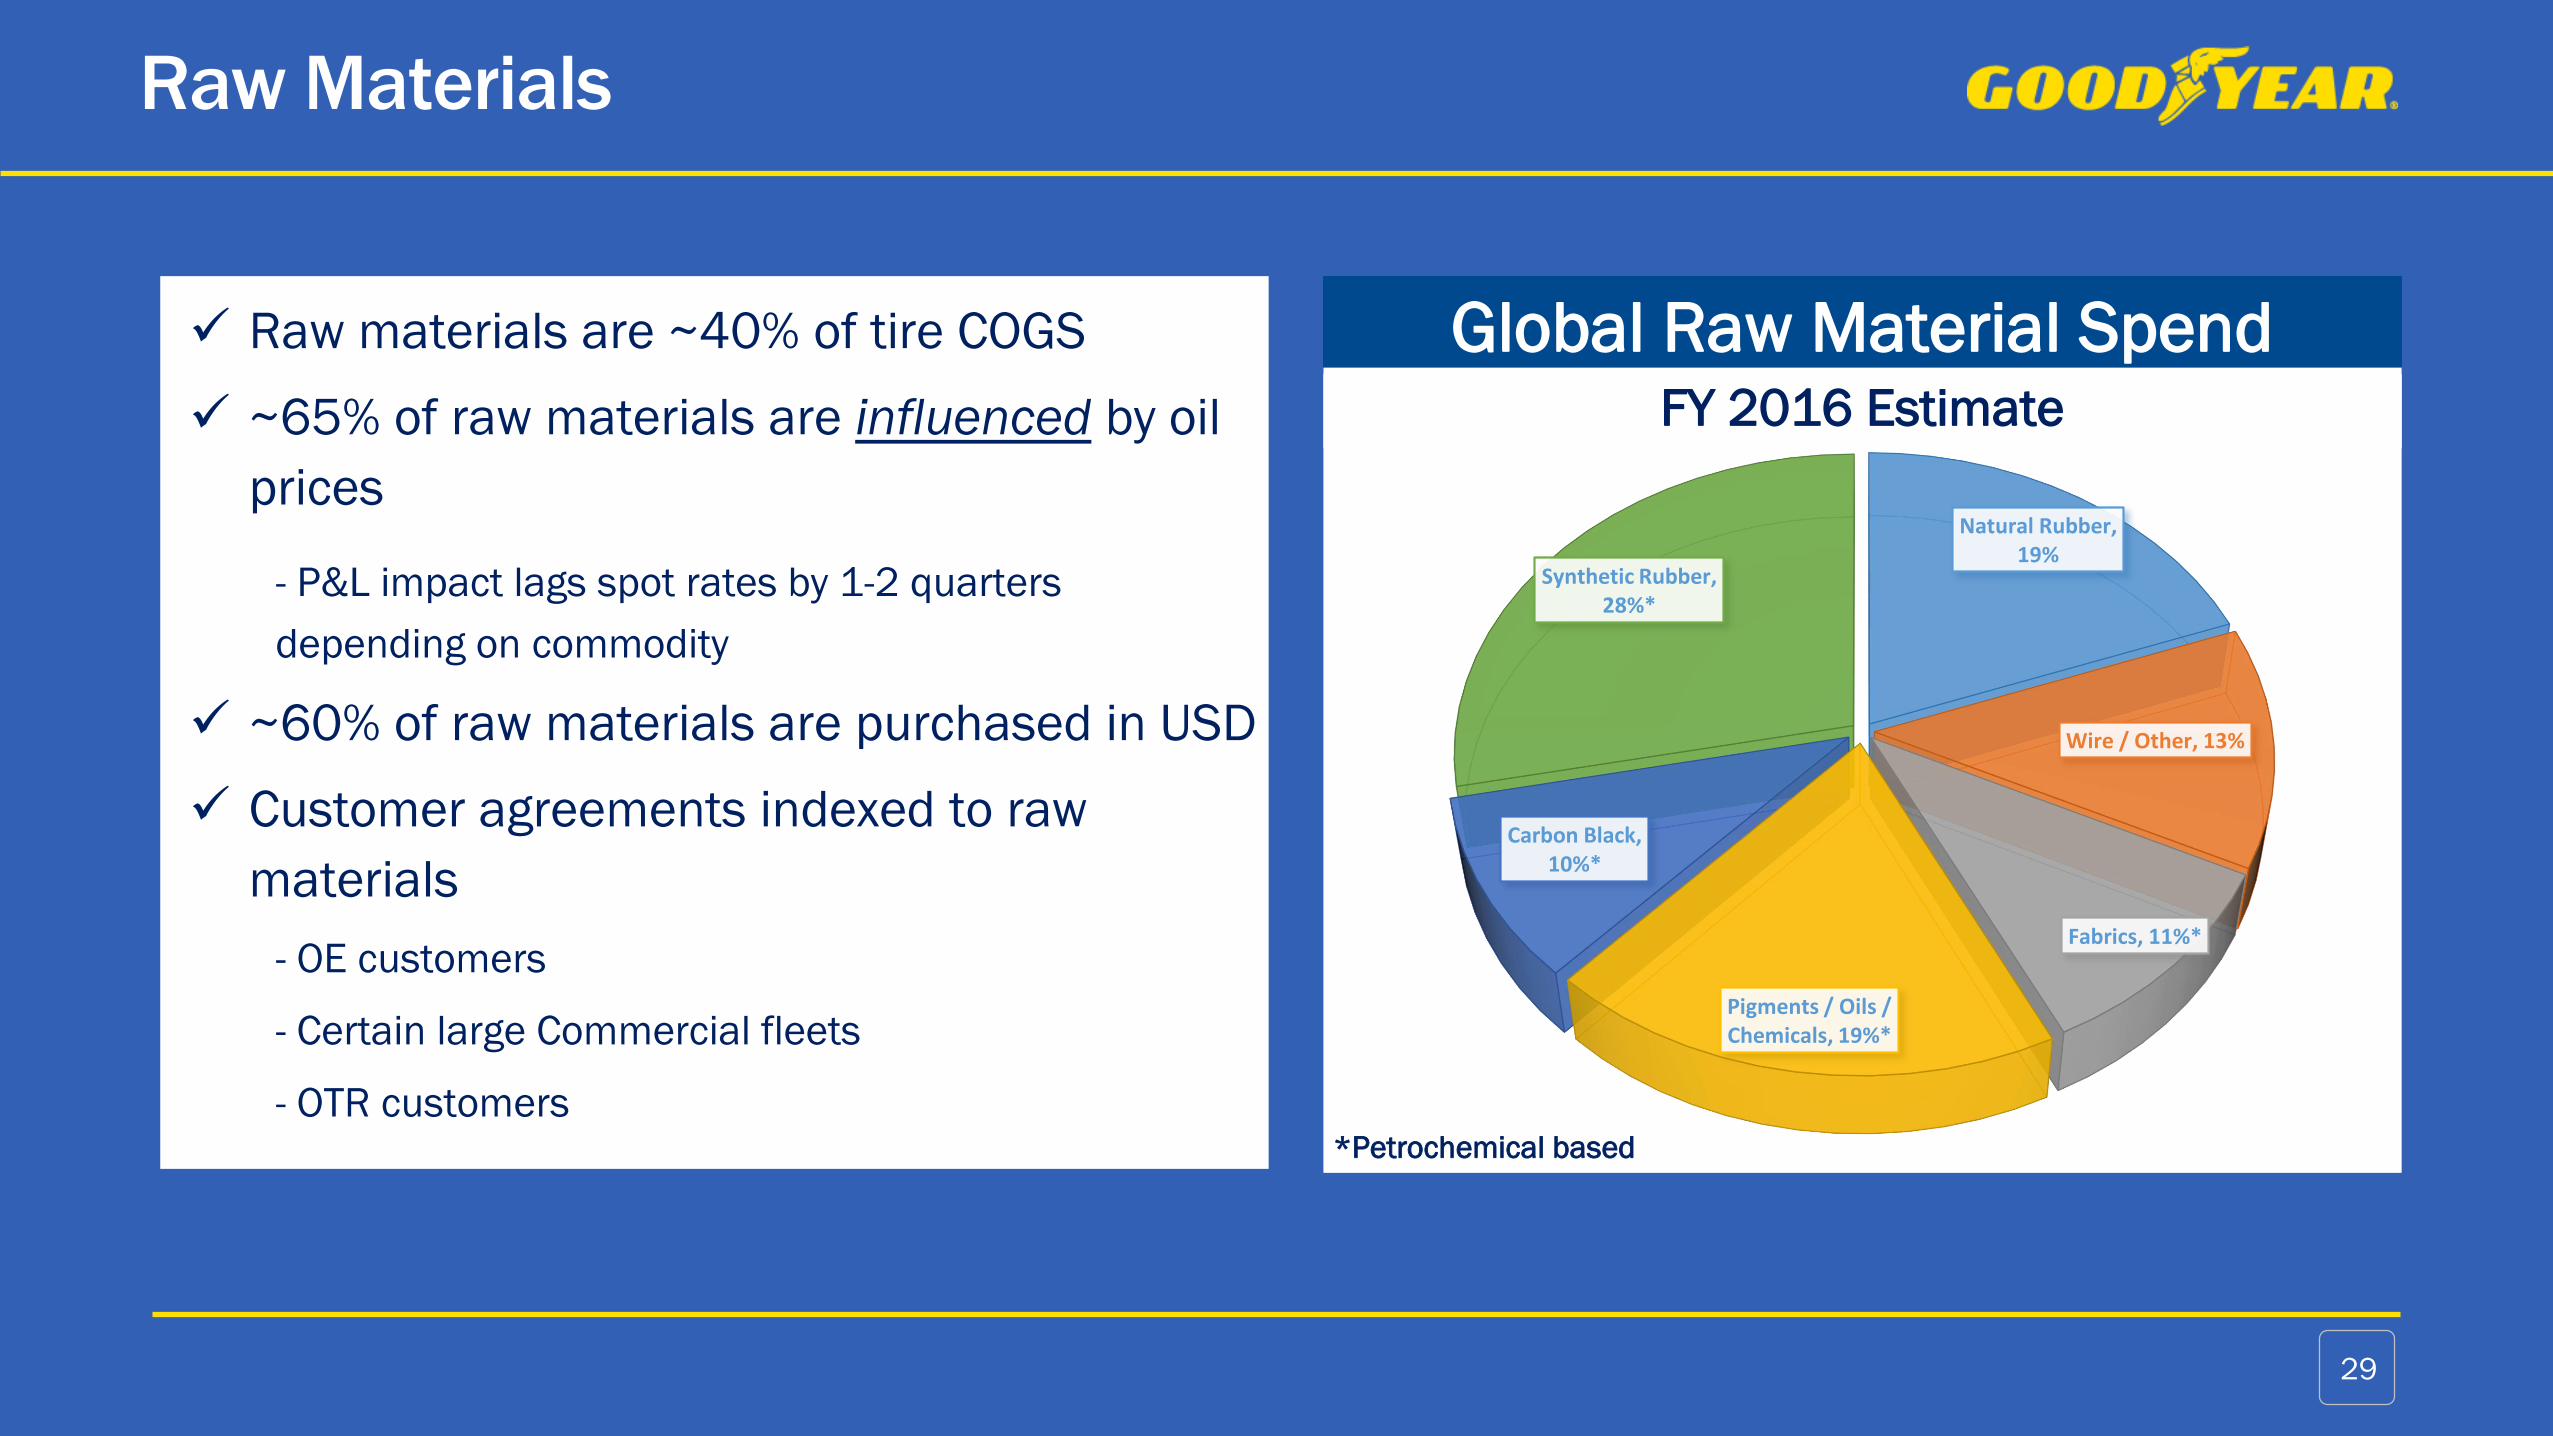
✓ Raw materials are ~40% of tire COGS
✓ ~65% of raw materials are influenced by oil
prices
- P&L impact lags spot rates by 1-2 quarters
depending on commodity
✓ ~60% of raw materials are purchased in USD
✓ Customer agreements indexed to raw
materials
- OE customers
- Certain large Commercial fleets
- OTR customers
Raw Materials
Global Raw Material SpendFY 2016 Estimate
Natural Rubber, 19%
Wire / Other, 13%
Fabrics, 11%*
Pigments / Oils / Chemicals, 19%*
Carbon Black, 10%*
Synthetic Rubber, 28%*
*Petrochemical based

✓ Moderate global industry growth, including:
• Above market growth in > 17”
• Emerging markets growth
✓ Goodyear volume growth of 20 million
units, primarily in > 17”
✓ Price/mix supported by innovation
✓ Achieve cost savings and unabsorbed fixed
cost recovery
✓ Deliver on high-return investments
Segment Operating Income Target (a)
(a) For information on our use of non-GAAP financial measures, including forward-looking non-GAAP financial measures, see Appendix on page 31.
Risk Factors
✓Economic environment
• Significant weakness in key markets
✓Raw materials
• Timing of cost increases
• Availability of select materials
✓Higher wages and general inflation
• Further cost savings may be required
Key drivers
30
Execution required, risks need to be managed
Use of Historical and Forward-Looking Non-GAAP Financial MeasuresThis presentation contains historical and forward-looking non-GAAP financial measures, including Total Segment Operating Income and Margin, Core Segment Operating Income and
Margin, Adjusted Net Income and Adjusted Diluted Earnings Per Share (EPS), which are important financial measures for the company but are not financial measures defined by U.S.
GAAP, and should not be construed as alternatives to corresponding financial measures presented in accordance with U.S. GAAP.
Total Segment Operating Income is the sum of the individual strategic business units’ (SBUs’) Segment Operating Income as determined in accordance with U.S. GAAP. Total Segment
Operating Margin is Total Segment Operating Income divided by Net Sales as determined in accordance with U.S. GAAP. Management believes that Total Segment Operating Income
and Margin are useful because they represent the aggregate value of income created by the company’s SBUs and exclude items not directly related to the SBUs for performance
evaluation purposes.
Core Segment Operating Income is Total Segment Operating Income excluding the operating income from our Venezuelan subsidiary, which we deconsolidated on December 31,
2015. Core Segment Operating Margin is Core Segment Operating Income divided by Net Sales excluding the net sales of our Venezuelan subsidiary. Management believes that Core
Segment Operating Income and Margin are useful because they represent Total Segment Operating Income and Margin from the company’s ongoing reported operations.
The most directly comparable U.S. GAAP financial measures to Total and Core Segment Operating Income and Margin are Goodyear Net Income and Return on Sales (which is
calculated by dividing Goodyear Net Income by Net Sales).
Adjusted Net Income is Goodyear Net Income as determined in accordance with U.S. GAAP adjusted for certain significant items. Adjusted Diluted EPS is the company’s Adjusted Net
Income divided by Weighted Average Shares Outstanding-Diluted as determined in accordance with U.S. GAAP. Management believes that Adjusted Net Income and Adjusted Diluted
EPS are useful because they represent how management reviews the operating results of the company excluding the impacts of rationalizations, asset write-offs, accelerated
depreciation, asset sales and certain other significant items.
It should be noted that other companies may calculate similarly-titled non-GAAP financial measures differently and, as a result, the measures presented herein may not be comparable
to such similarly-titled measures reported by other companies.
We are unable to present a quantitative reconciliation of our forward-looking non-GAAP financial measures, other than Free Cash Flow, to the most directly comparable U.S. GAAP
financial measures because management cannot reliably predict all of the necessary components of those U.S. GAAP financial measures without unreasonable effort. Those forward-
looking non-GAAP financial measures, or components thereof, would be reconciled to Goodyear Net Income, which includes several significant items that are not included in the
comparable non-GAAP financial measures, such as rationalization charges, other (income) expense, pension curtailments and settlements, and income taxes. The decisions and events
that typically lead to the recognition of these and other similar non-GAAP adjustments, such as a decision to exit part of our business, acquisitions and dispositions, foreign currency
exchange gains and losses, financing fees, actions taken to manage our pension liabilities, and the recording or release of tax valuation allowances, are inherently unpredictable as to
if or when they may occur. The inability to provide a reconciliation is due to that unpredictability and the related difficulty in assessing the potential financial impact of the non-GAAP
adjustments. For the same reasons, we are unable to address the probable significance of the unavailable information, which could be material to our future financial results.
31
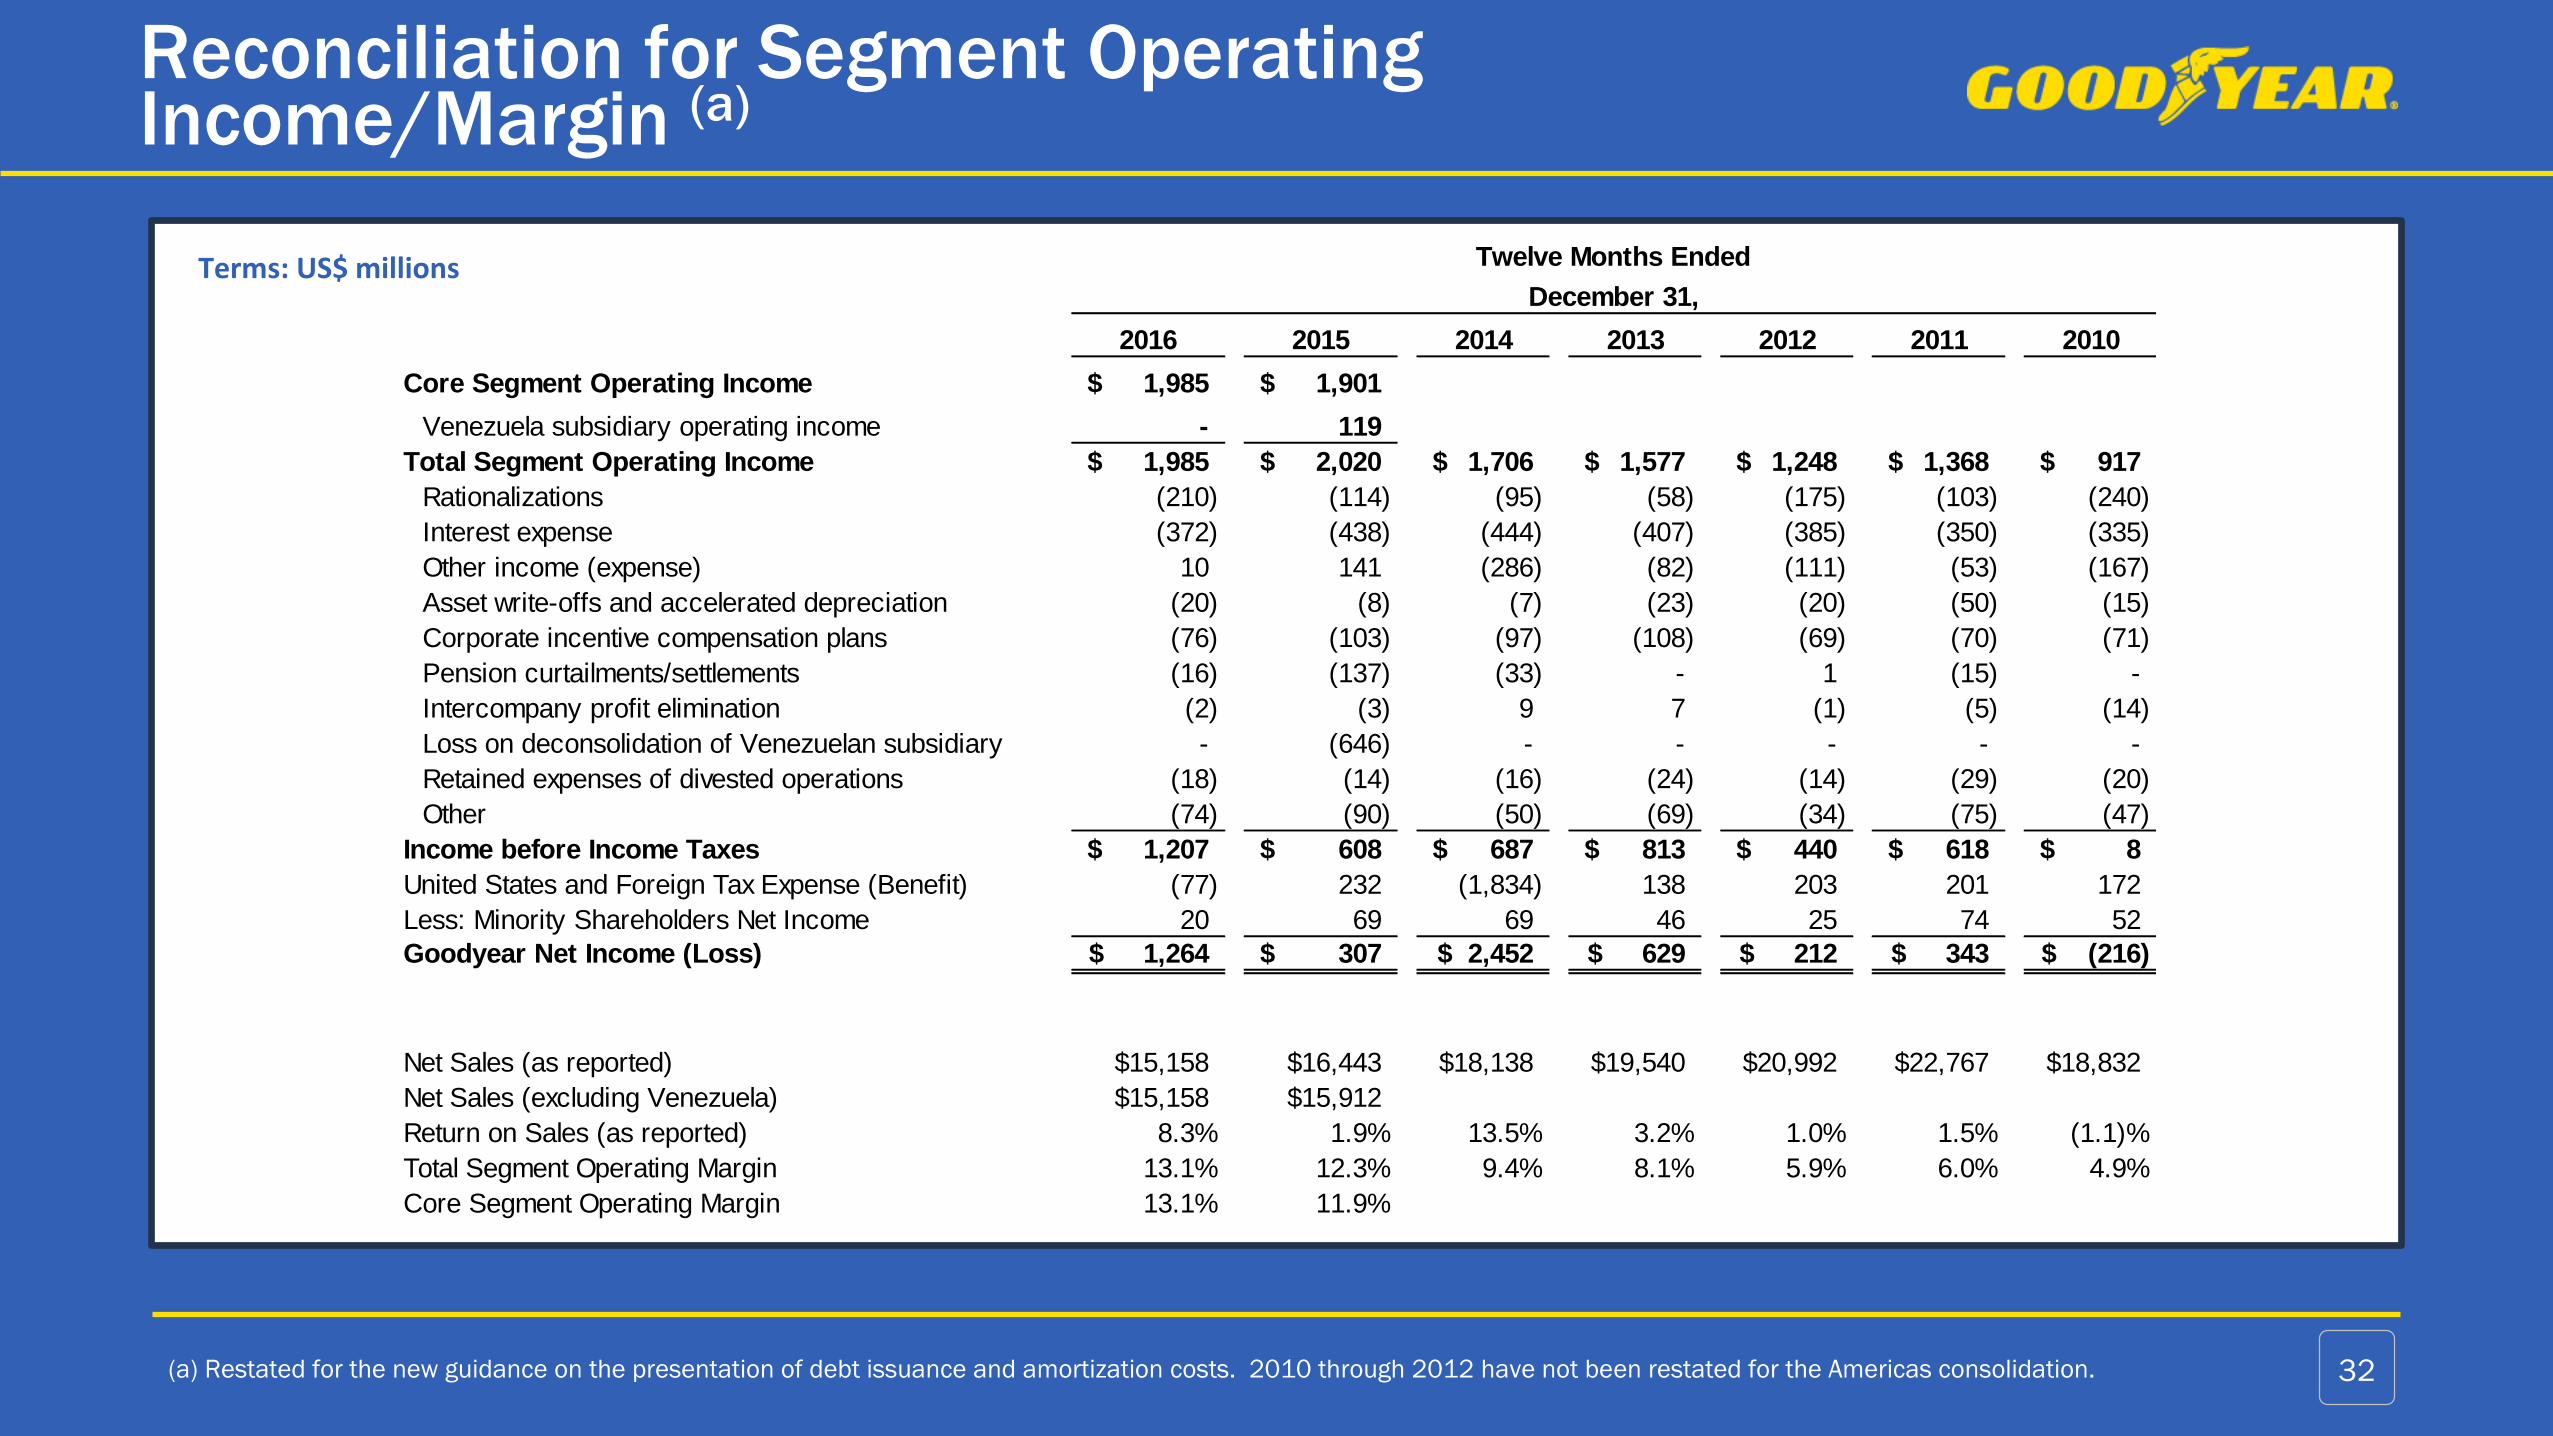
Reconciliation for Segment Operating Income/Margin (a)
32(a) Restated for the new guidance on the presentation of debt issuance and amortization costs. 2010 through 2012 have not been restated for the Americas consolidation.
Terms: US$ millions
2016 2015 2014 2013 2012 2011 2010
Core Segment Operating Income 1,985$ 1,901$
Venezuela subsidiary operating income - 119
Total Segment Operating Income 1,985$ 2,020$ 1,706$ 1,577$ 1,248$ 1,368$ 917$
Rationalizations (210) (114) (95) (58) (175) (103) (240)
Interest expense (372) (438) (444) (407) (385) (350) (335)
Other income (expense) 10 141 (286) (82) (111) (53) (167)
Asset write-offs and accelerated depreciation (20) (8) (7) (23) (20) (50) (15)
Corporate incentive compensation plans (76) (103) (97) (108) (69) (70) (71)
Pension curtailments/settlements (16) (137) (33) - 1 (15) -
Intercompany profit elimination (2) (3) 9 7 (1) (5) (14)
Loss on deconsolidation of Venezuelan subsidiary - (646) - - - - -
Retained expenses of divested operations (18) (14) (16) (24) (14) (29) (20)
Other (74) (90) (50) (69) (34) (75) (47)
Income before Income Taxes 1,207$ 608$ 687$ 813$ 440$ 618$ 8$
United States and Foreign Tax Expense (Benefit) (77) 232 (1,834) 138 203 201 172
Less: Minority Shareholders Net Income 20 69 69 46 25 74 52
Goodyear Net Income (Loss) 1,264$ 307$ 2,452$ 629$ 212$ 343$ (216)$
Net Sales (as reported) $15,158 $16,443 $18,138 $19,540 $20,992 $22,767 $18,832
Net Sales (excluding Venezuela) $15,158 $15,912
Return on Sales (as reported) 8.3% 1.9% 13.5% 3.2% 1.0% 1.5% (1.1)%
Total Segment Operating Margin 13.1% 12.3% 9.4% 8.1% 5.9% 6.0% 4.9%
Core Segment Operating Margin 13.1% 11.9%
December 31,
Twelve Months Ended
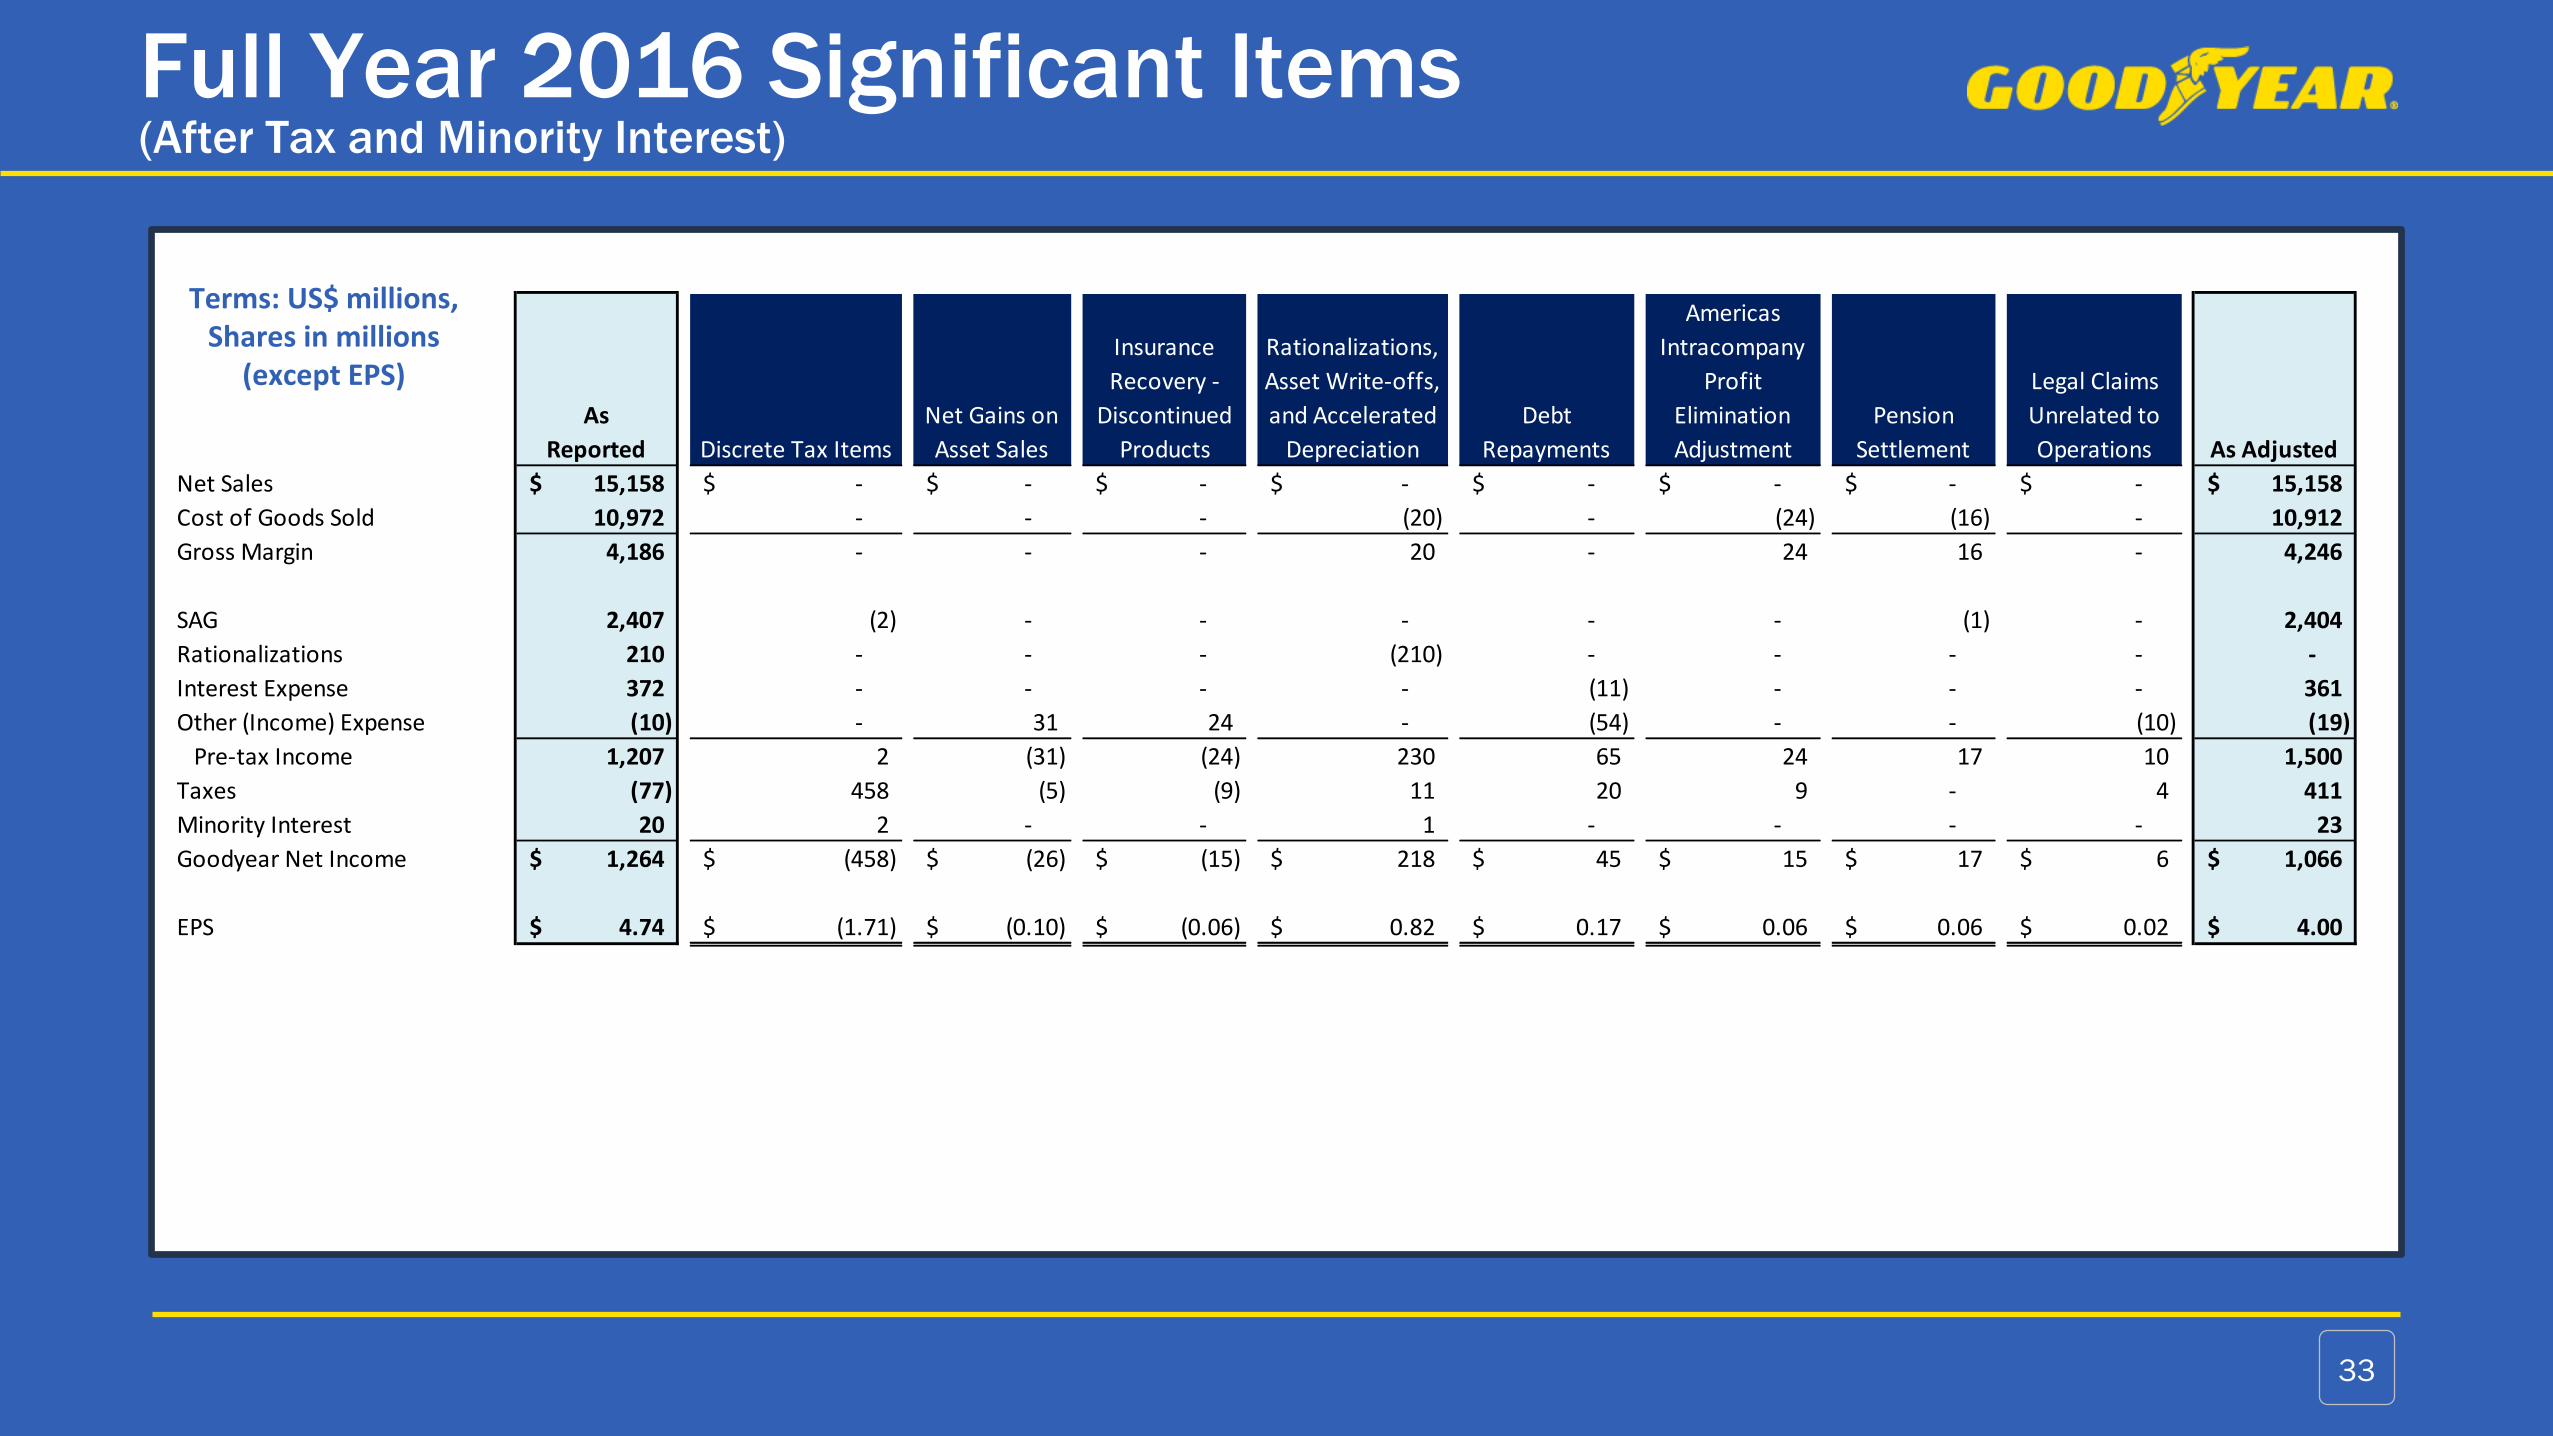
Full Year 2016 Significant Items(After Tax and Minority Interest)
33
Terms: US$ millions, Shares in millions
(except EPS)As
Reported Discrete Tax Items
Net Gains on
Asset Sales
Insurance
Recovery -
Discontinued
Products
Rationalizations,
Asset Write-offs,
and Accelerated
Depreciation
Debt
Repayments
Americas
Intracompany
Profit
Elimination
Adjustment
Pension
Settlement
Legal Claims
Unrelated to
Operations As Adjusted
Net Sales 15,158$ -$ -$ -$ -$ -$ -$ -$ -$ 15,158$
Cost of Goods Sold 10,972 - - - (20) - (24) (16) - 10,912
Gross Margin 4,186 - - - 20 - 24 16 - 4,246
SAG 2,407 (2) - - - - - (1) - 2,404
Rationalizations 210 - - - (210) - - - - -
Interest Expense 372 - - - - (11) - - - 361
Other (Income) Expense (10) - 31 24 - (54) - - (10) (19)
Pre-tax Income 1,207 2 (31) (24) 230 65 24 17 10 1,500
Taxes (77) 458 (5) (9) 11 20 9 - 4 411
Minority Interest 20 2 - - 1 - - - - 23
Goodyear Net Income 1,264$ (458)$ (26)$ (15)$ 218$ 45$ 15$ 17$ 6$ 1,066$
EPS 4.74$ (1.71)$ (0.10)$ (0.06)$ 0.82$ 0.17$ 0.06$ 0.06$ 0.02$ 4.00$
Full Year 2015 Significant Items (a)
(After Tax and Minority Interest)
(a) Restated for the new guidance on the presentation of debt issuance and amortization costs. 34
Terms: US$ millions, Shares in millions
(except EPS)
As
Reported
Loss on
Deconsolidation of
Venezuelan
Subsidiary
Rationalizations,
Asset Write-offs,
and Accelerated
Depreciation
Pension
Settlement
Debt
Redemption
Charges for
Labor Claims
Related to a
Closed Facility
in Greece
Gain on
Recognition of
Deferred
Royalty Income SRI Share Sale
Net Income
and Other
Discrete Tax
Benefits
Transaction
Costs and Net
Gains on Asset
Sales
Insurance
Recovery -
Discontinued
Products As Adjusted
Net Sales 16,443$ -$ -$ -$ -$ -$ -$ -$ -$ -$ -$ 16,443$
Cost of Goods Sold 12,164 - (9) (88) - - - - 1 - - 12,068
Gross Margin 4,279 - 9 88 - - - - (1) - - 4,375
SAG 2,614 - - (49) - - - - 2 (6) - 2,561
Rationalizations 114 - (114) - - - - - - - - -
Interest Expense 438 - - - (16) - - - - - - 422
Loss on Deconsolidation of
Venezuelan Subsidiary646 (646) - - - - - - - - - -
Other (Income) Expense (141) - - - (41) (4) 155 30 1 41 25 66
Pre-tax Income 608 646 123 137 57 4 (155) (30) (4) (35) (25) 1,326
Taxes 232 69 14 51 22 - (56) 2 19 (11) (9) 333
Minority Interest 69 - 17 - - - - - 2 (1) - 87
Goodyear Net Income 307$ 577$ 92$ 86$ 35$ 4$ (99)$ (32)$ (25)$ (23)$ (16)$ 906$
EPS 1.12$ 2.11$ 0.34$ 0.31$ 0.13$ 0.02$ (0.36)$ (0.12)$ (0.09)$ (0.08)$ (0.06)$ 3.32$
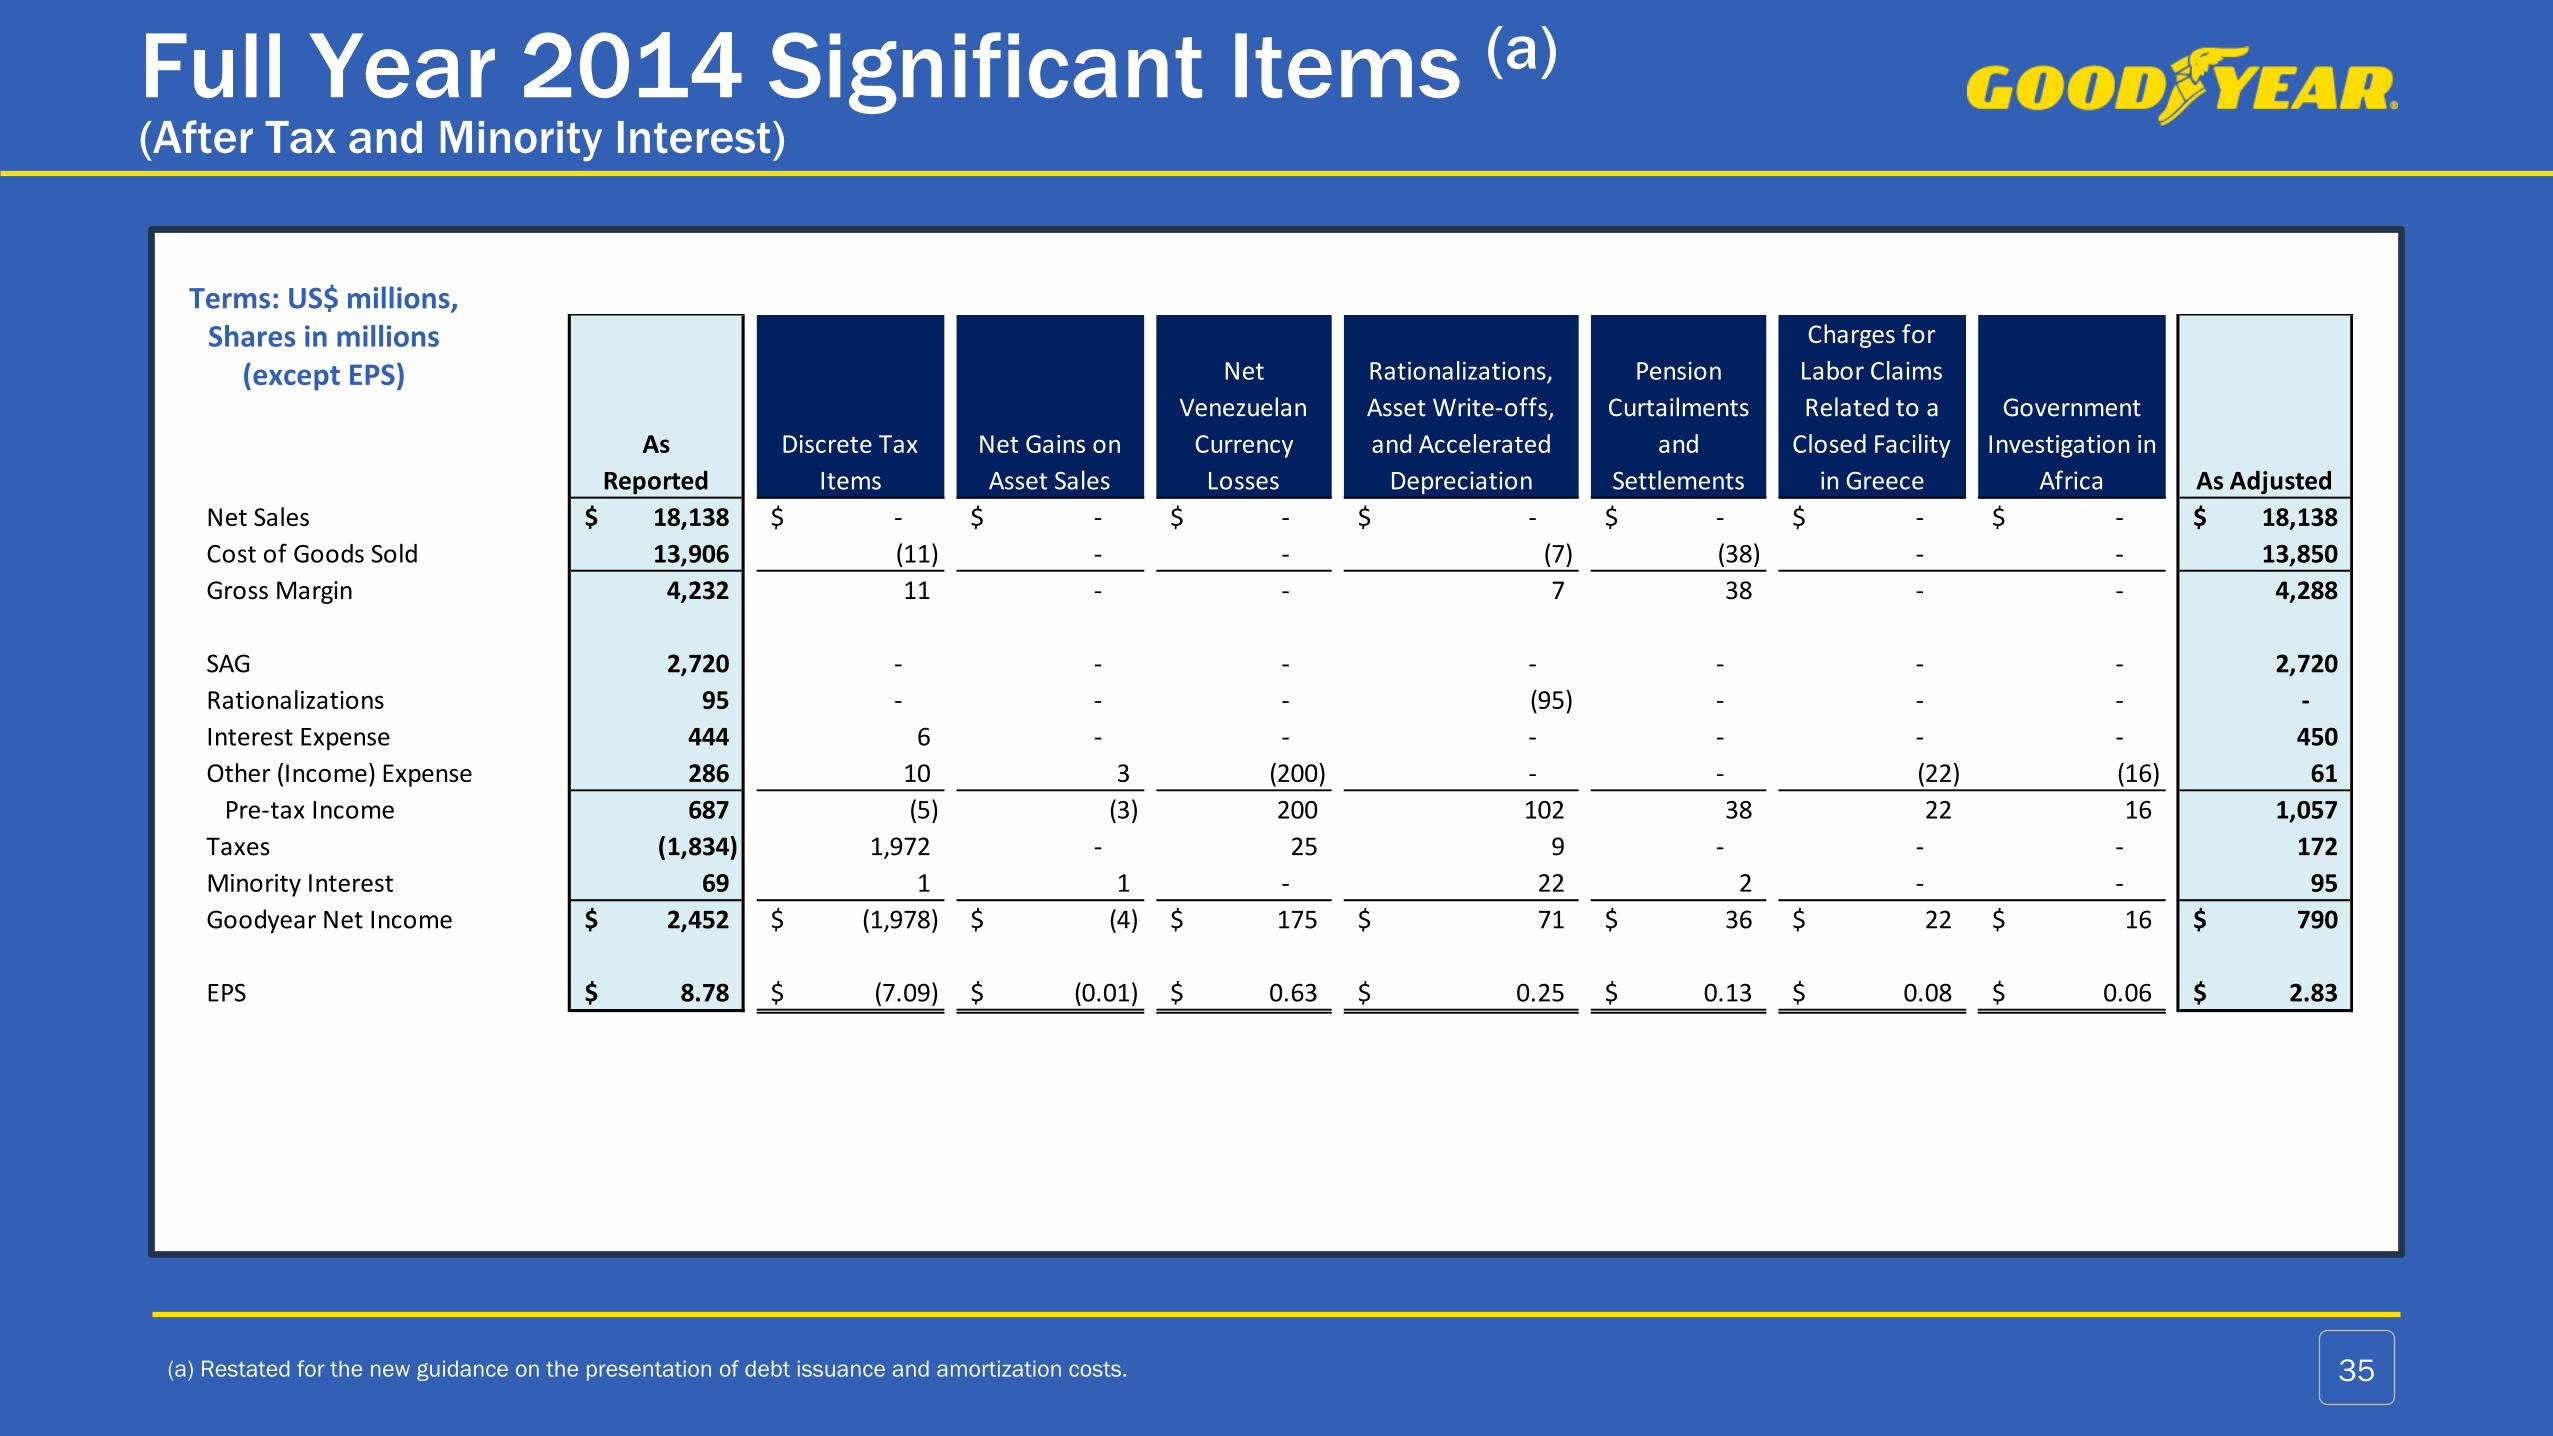
Full Year 2014 Significant Items (a)
(After Tax and Minority Interest)
(a) Restated for the new guidance on the presentation of debt issuance and amortization costs. 35
Terms: US$ millions, Shares in millions
(except EPS)
As
Reported
Discrete Tax
Items
Net Gains on
Asset Sales
Net
Venezuelan
Currency
Losses
Rationalizations,
Asset Write-offs,
and Accelerated
Depreciation
Pension
Curtailments
and
Settlements
Charges for
Labor Claims
Related to a
Closed Facility
in Greece
Government
Investigation in
Africa As Adjusted
Net Sales 18,138$ -$ -$ -$ -$ -$ -$ -$ 18,138$
Cost of Goods Sold 13,906 (11) - - (7) (38) - - 13,850
Gross Margin 4,232 11 - - 7 38 - - 4,288
SAG 2,720 - - - - - - - 2,720
Rationalizations 95 - - - (95) - - - -
Interest Expense 444 6 - - - - - - 450
Other (Income) Expense 286 10 3 (200) - - (22) (16) 61
Pre-tax Income 687 (5) (3) 200 102 38 22 16 1,057
Taxes (1,834) 1,972 - 25 9 - - - 172
Minority Interest 69 1 1 - 22 2 - - 95
Goodyear Net Income 2,452$ (1,978)$ (4)$ 175$ 71$ 36$ 22$ 16$ 790$
EPS 8.78$ (7.09)$ (0.01)$ 0.63$ 0.25$ 0.13$ 0.08$ 0.06$ 2.83$
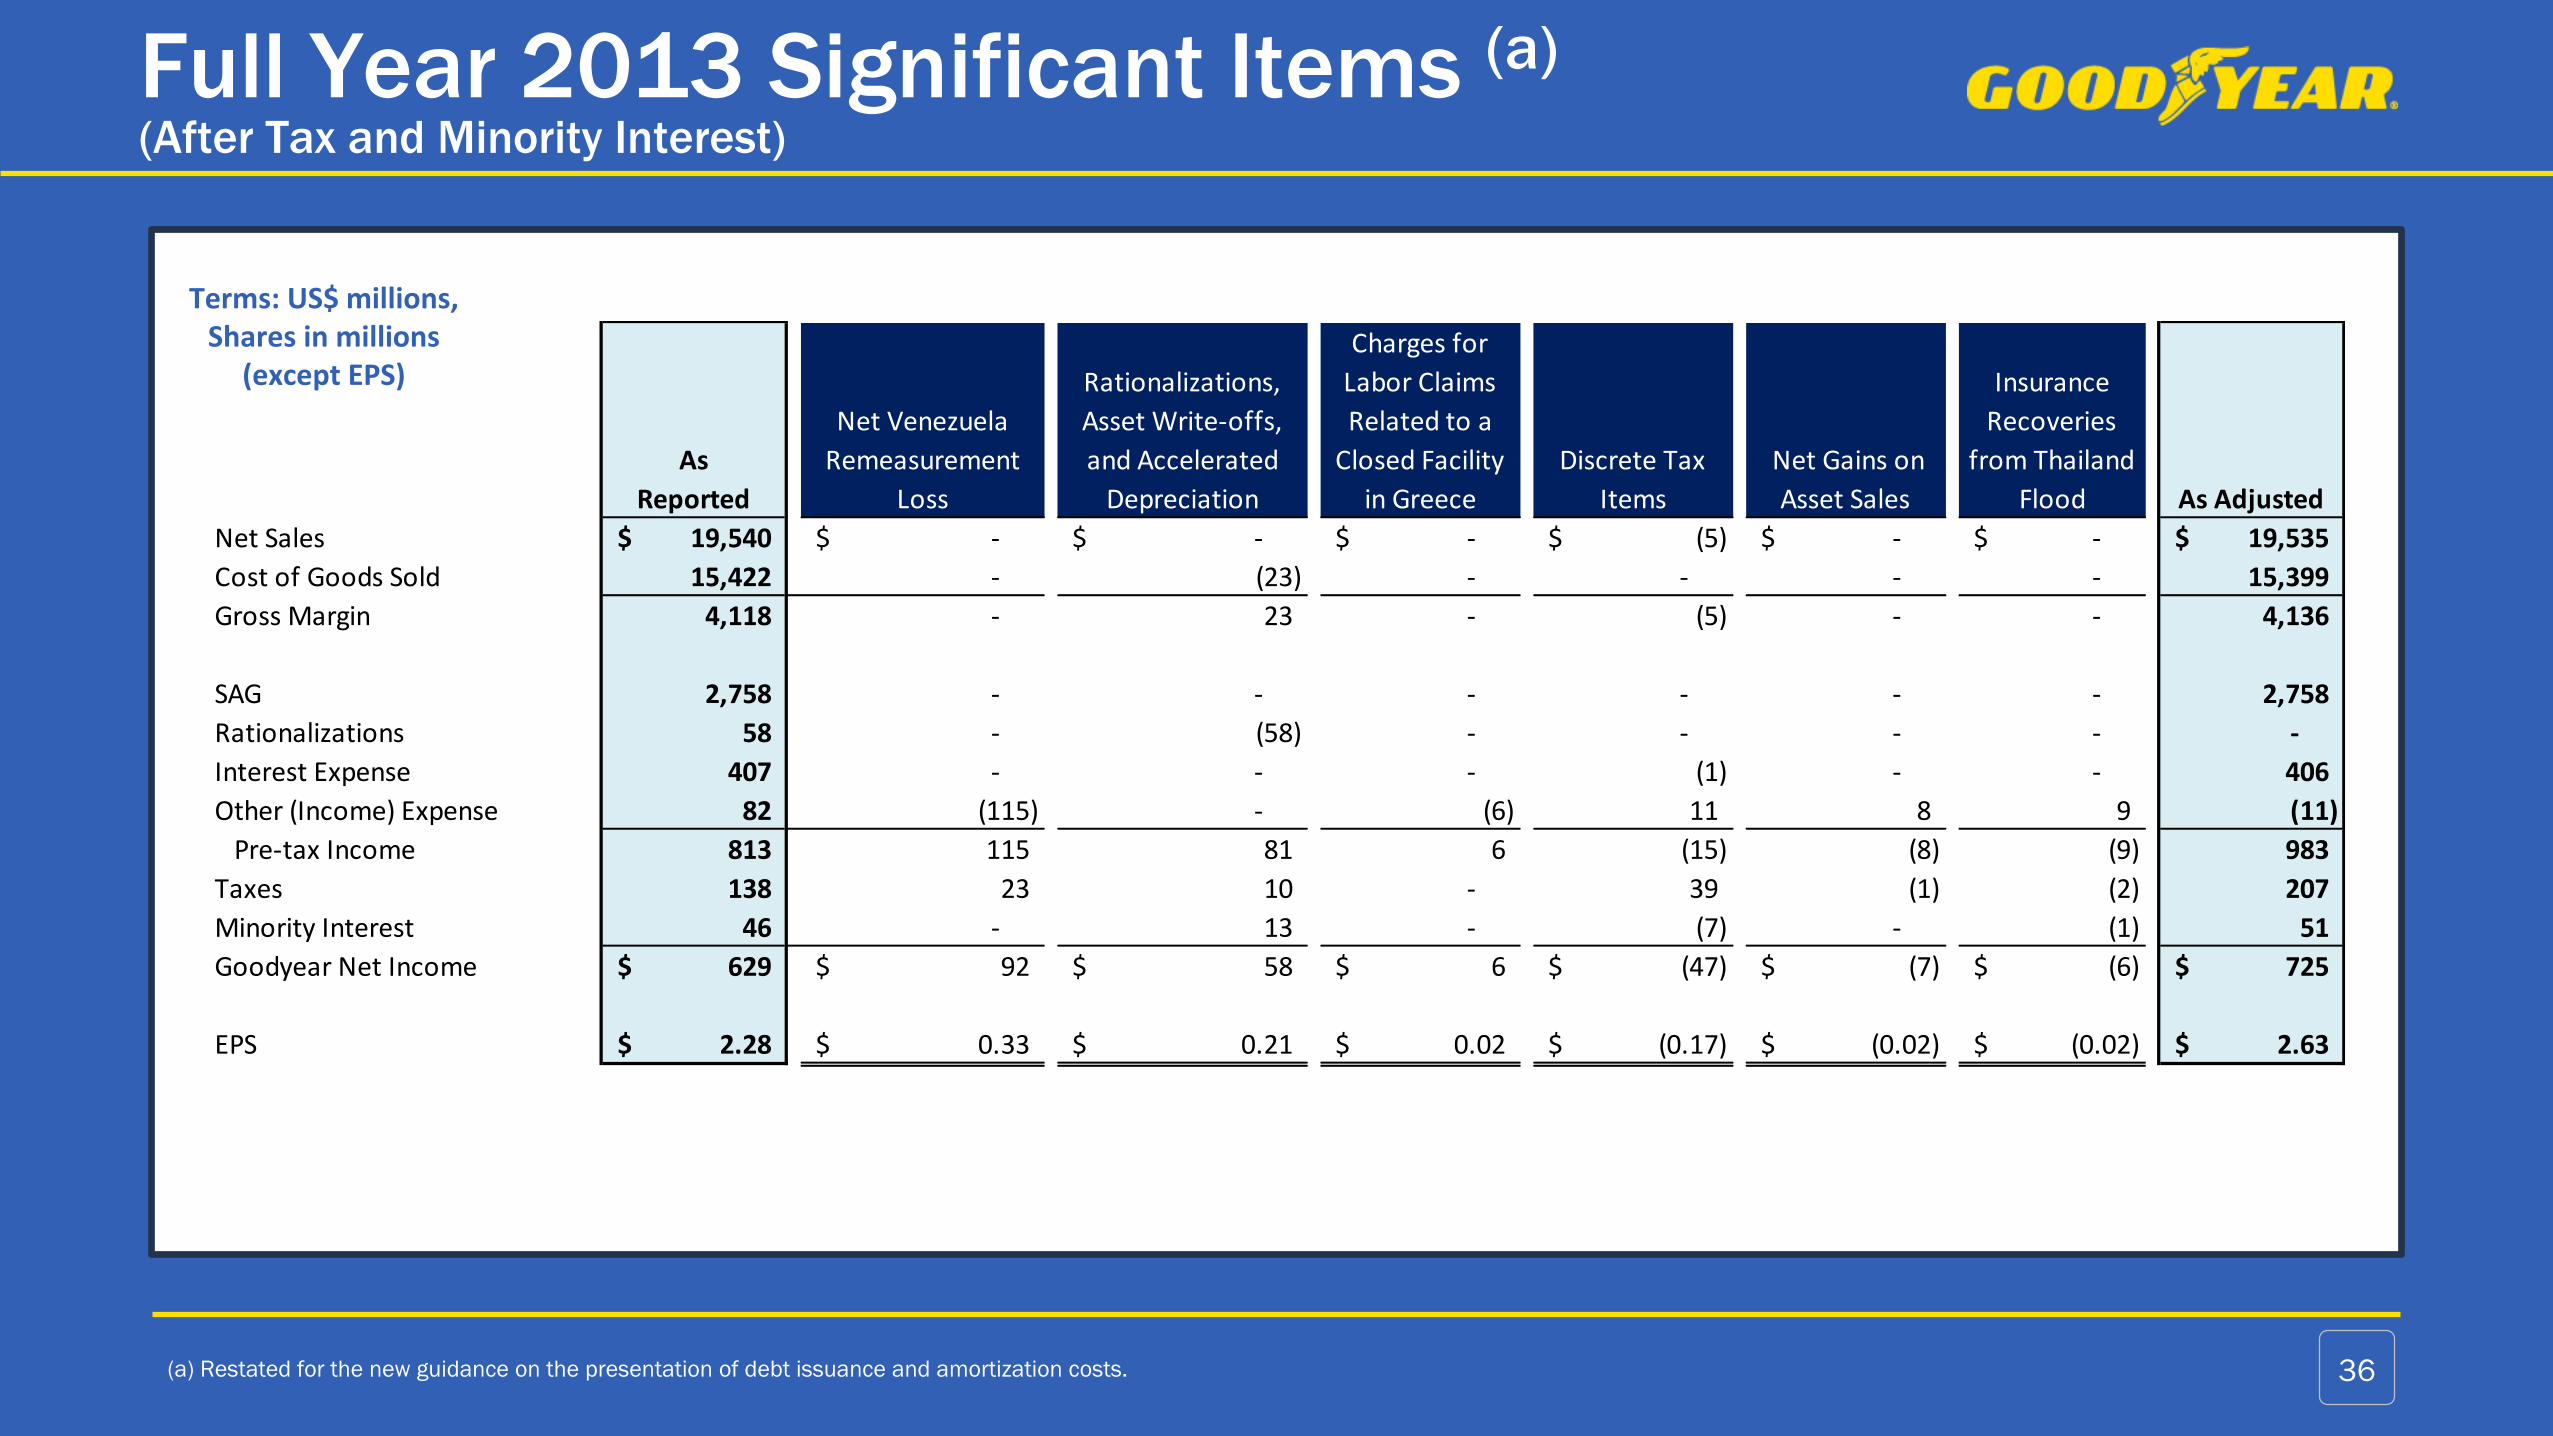
Full Year 2013 Significant Items (a)
(After Tax and Minority Interest)
(a) Restated for the new guidance on the presentation of debt issuance and amortization costs. 36
Terms: US$ millions, Shares in millions
(except EPS)
As
Reported
Net Venezuela
Remeasurement
Loss
Rationalizations,
Asset Write-offs,
and Accelerated
Depreciation
Charges for
Labor Claims
Related to a
Closed Facility
in Greece
Discrete Tax
Items
Net Gains on
Asset Sales
Insurance
Recoveries
from Thailand
Flood As Adjusted
Net Sales 19,540$ -$ -$ -$ (5)$ -$ -$ 19,535$
Cost of Goods Sold 15,422 - (23) - - - - 15,399
Gross Margin 4,118 - 23 - (5) - - 4,136
SAG 2,758 - - - - - - 2,758
Rationalizations 58 - (58) - - - - -
Interest Expense 407 - - - (1) - - 406
Other (Income) Expense 82 (115) - (6) 11 8 9 (11)
Pre-tax Income 813 115 81 6 (15) (8) (9) 983
Taxes 138 23 10 - 39 (1) (2) 207
Minority Interest 46 - 13 - (7) - (1) 51
Goodyear Net Income 629$ 92$ 58$ 6$ (47)$ (7)$ (6)$ 725$
EPS 2.28$ 0.33$ 0.21$ 0.02$ (0.17)$ (0.02)$ (0.02)$ 2.63$
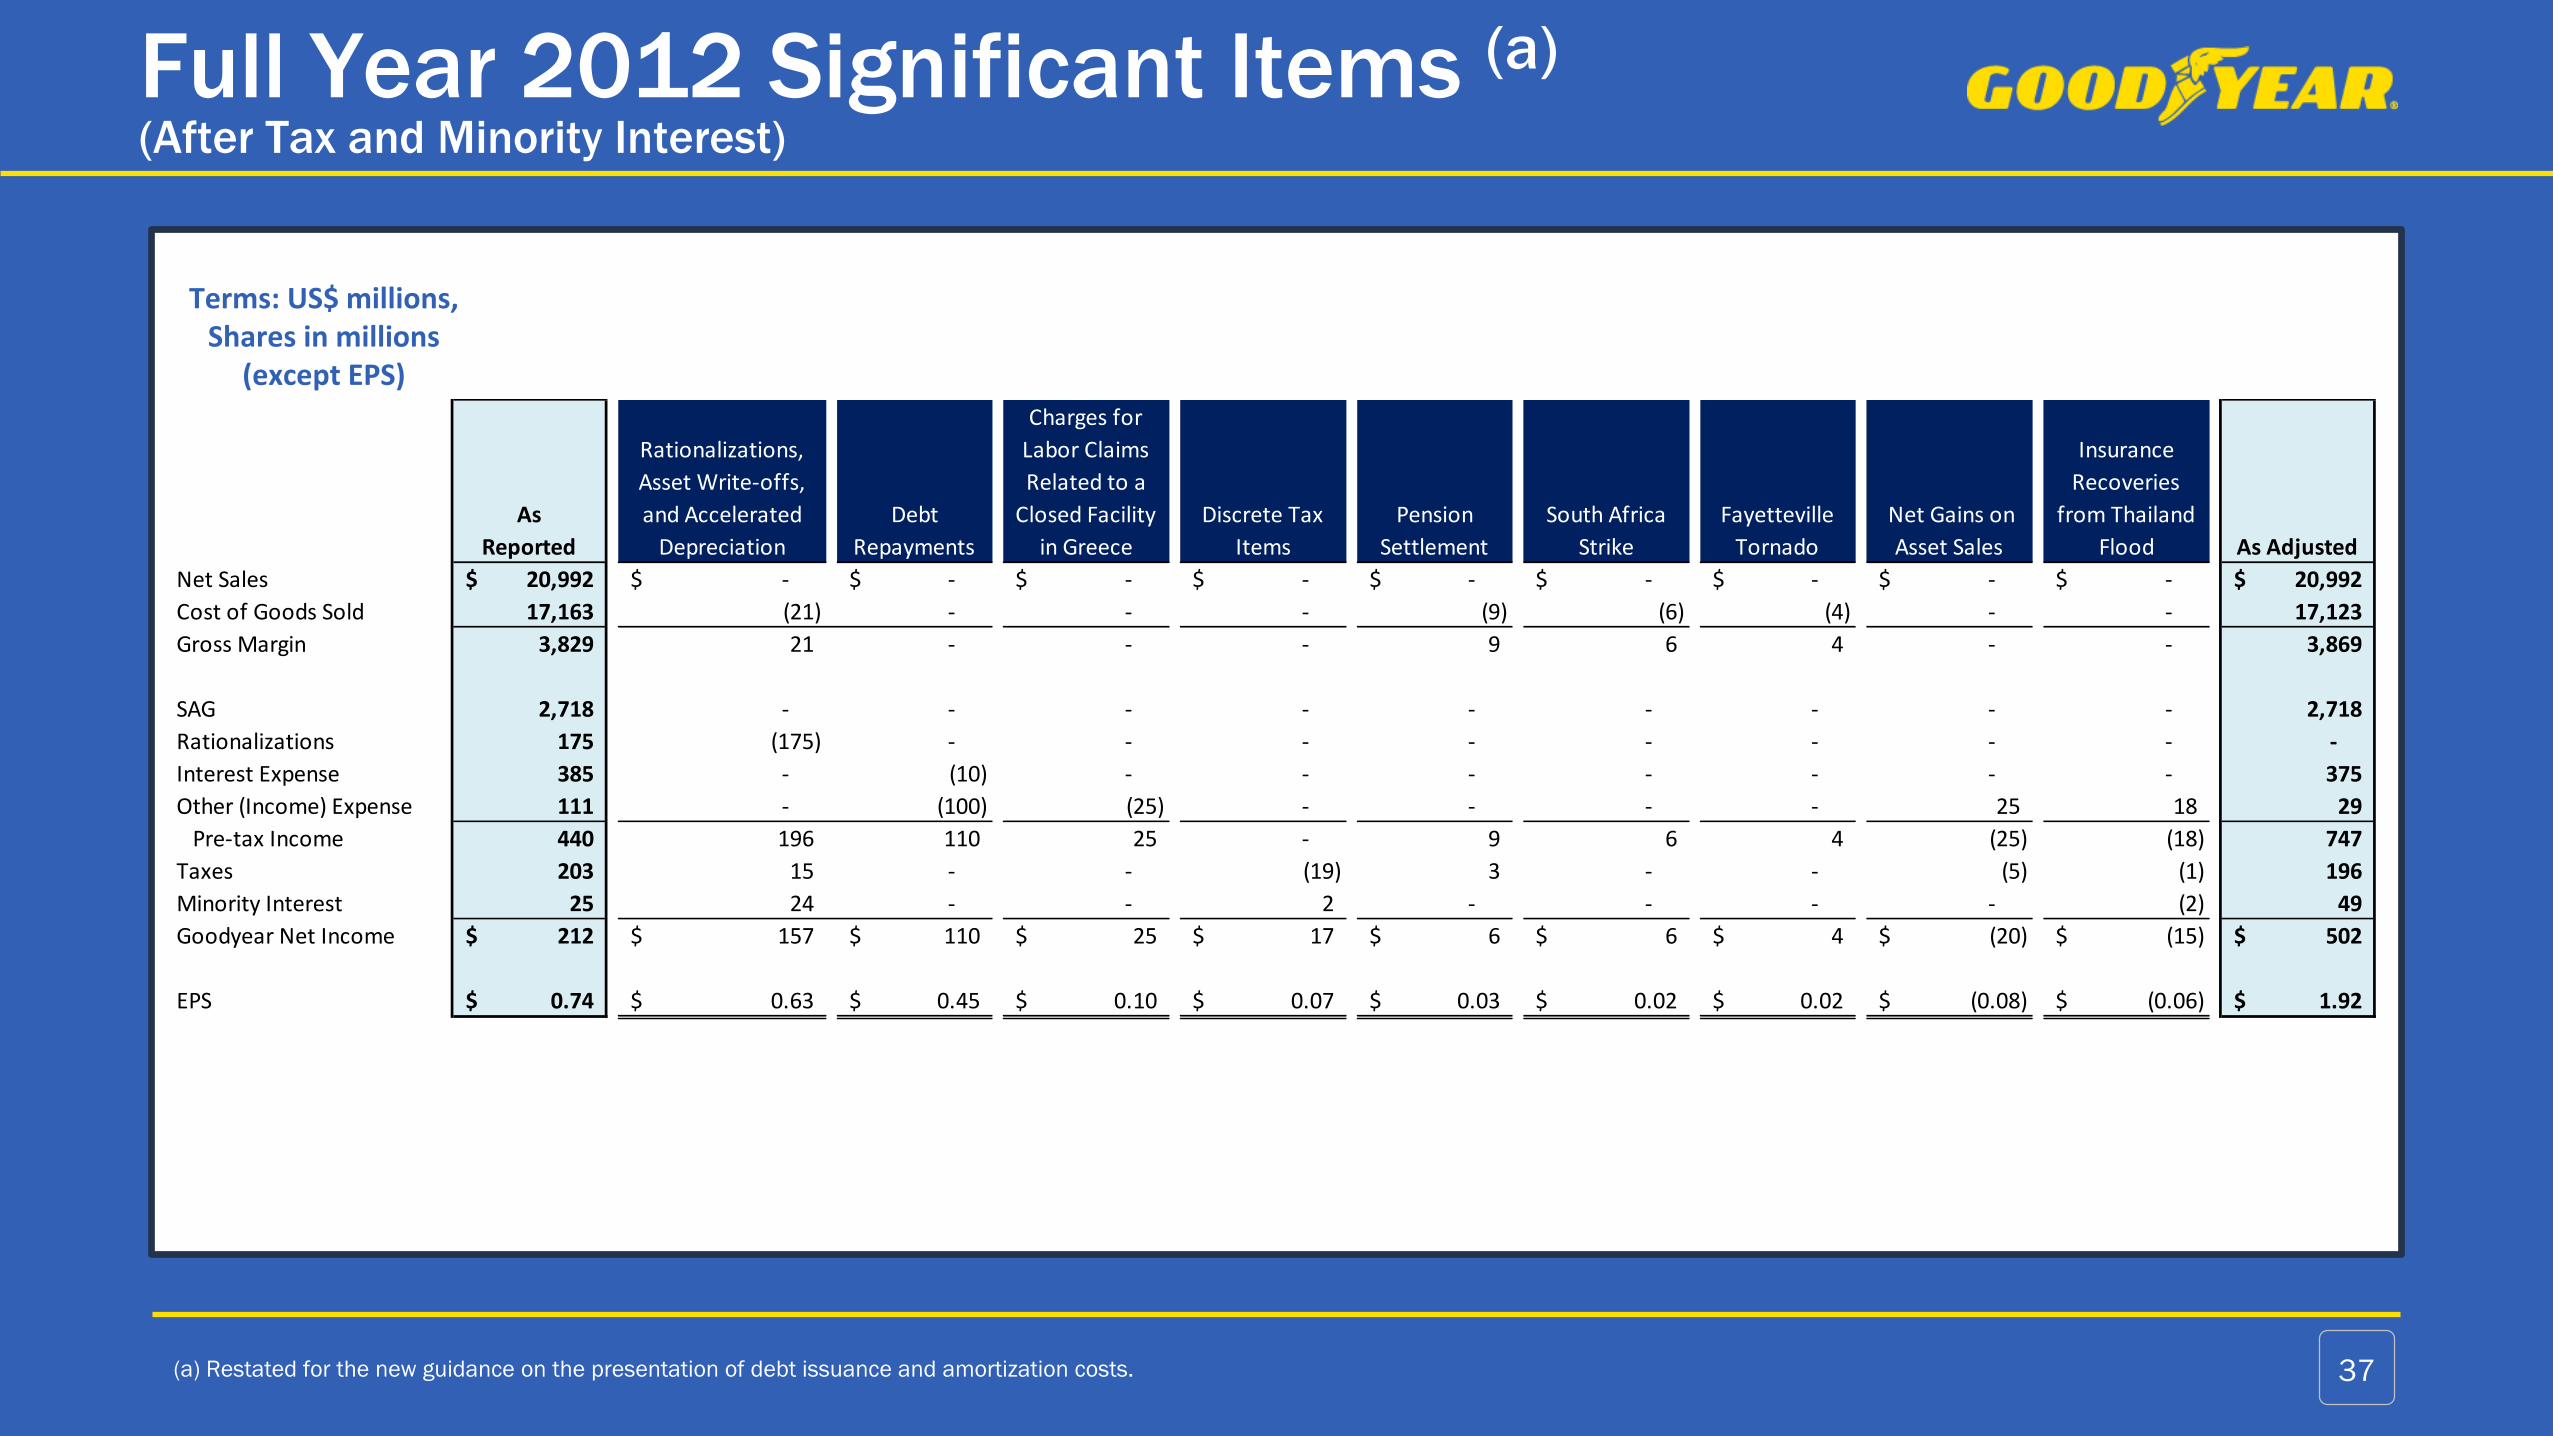
Full Year 2012 Significant Items (a)
(After Tax and Minority Interest)
(a) Restated for the new guidance on the presentation of debt issuance and amortization costs. 37
Terms: US$ millions, Shares in millions
(except EPS)
As
Reported
Rationalizations,
Asset Write-offs,
and Accelerated
Depreciation
Debt
Repayments
Charges for
Labor Claims
Related to a
Closed Facility
in Greece
Discrete Tax
Items
Pension
Settlement
South Africa
Strike
Fayetteville
Tornado
Net Gains on
Asset Sales
Insurance
Recoveries
from Thailand
Flood As Adjusted
Net Sales 20,992$ -$ -$ -$ -$ -$ -$ -$ -$ -$ 20,992$
Cost of Goods Sold 17,163 (21) - - - (9) (6) (4) - - 17,123
Gross Margin 3,829 21 - - - 9 6 4 - - 3,869
SAG 2,718 - - - - - - - - - 2,718
Rationalizations 175 (175) - - - - - - - - -
Interest Expense 385 - (10) - - - - - - - 375
Other (Income) Expense 111 - (100) (25) - - - - 25 18 29
Pre-tax Income 440 196 110 25 - 9 6 4 (25) (18) 747
Taxes 203 15 - - (19) 3 - - (5) (1) 196
Minority Interest 25 24 - - 2 - - - - (2) 49
Goodyear Net Income 212$ 157$ 110$ 25$ 17$ 6$ 6$ 4$ (20)$ (15)$ 502$
EPS 0.74$ 0.63$ 0.45$ 0.10$ 0.07$ 0.03$ 0.02$ 0.02$ (0.08)$ (0.06)$ 1.92$
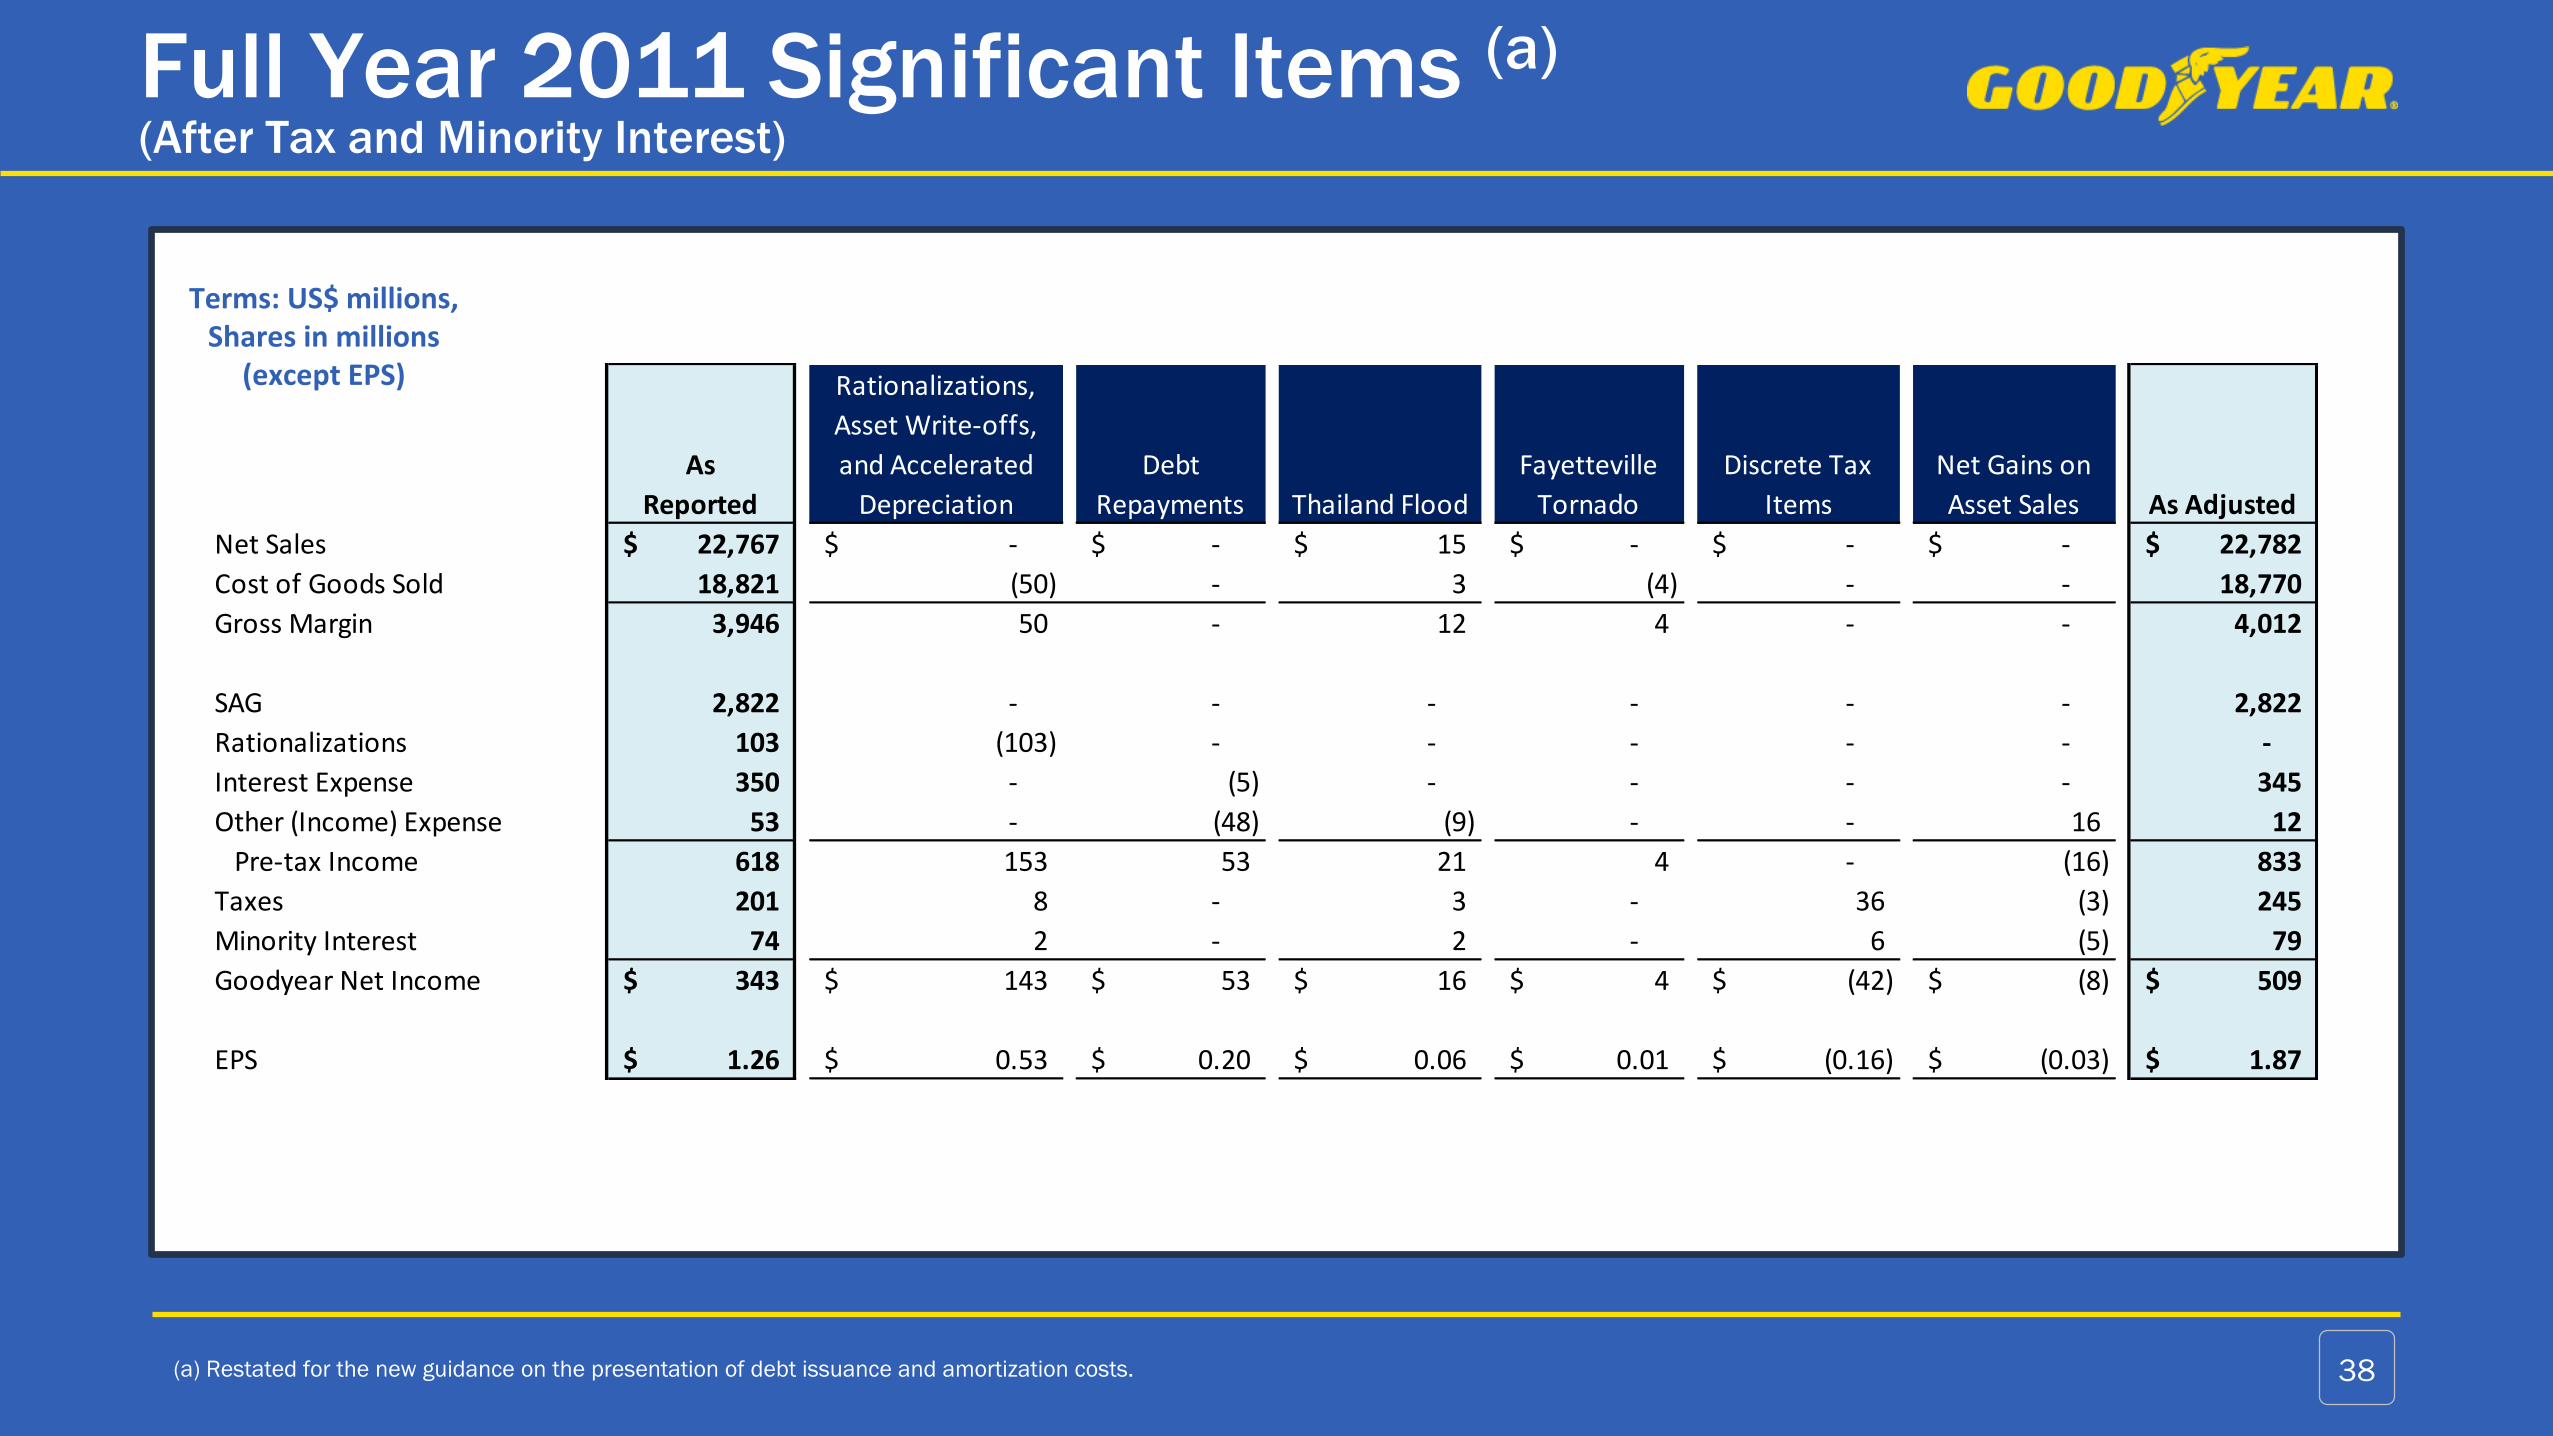
Full Year 2011 Significant Items (a)
(After Tax and Minority Interest)
(a) Restated for the new guidance on the presentation of debt issuance and amortization costs. 38
Terms: US$ millions, Shares in millions
(except EPS)
As
Reported
Rationalizations,
Asset Write-offs,
and Accelerated
Depreciation
Debt
Repayments Thailand Flood
Fayetteville
Tornado
Discrete Tax
Items
Net Gains on
Asset Sales As Adjusted
Net Sales 22,767$ -$ -$ 15$ -$ -$ -$ 22,782$
Cost of Goods Sold 18,821 (50) - 3 (4) - - 18,770
Gross Margin 3,946 50 - 12 4 - - 4,012
SAG 2,822 - - - - - - 2,822
Rationalizations 103 (103) - - - - - -
Interest Expense 350 - (5) - - - - 345
Other (Income) Expense 53 - (48) (9) - - 16 12
Pre-tax Income 618 153 53 21 4 - (16) 833
Taxes 201 8 - 3 - 36 (3) 245
Minority Interest 74 2 - 2 - 6 (5) 79
Goodyear Net Income 343$ 143$ 53$ 16$ 4$ (42)$ (8)$ 509$
EPS 1.26$ 0.53$ 0.20$ 0.06$ 0.01$ (0.16)$ (0.03)$ 1.87$
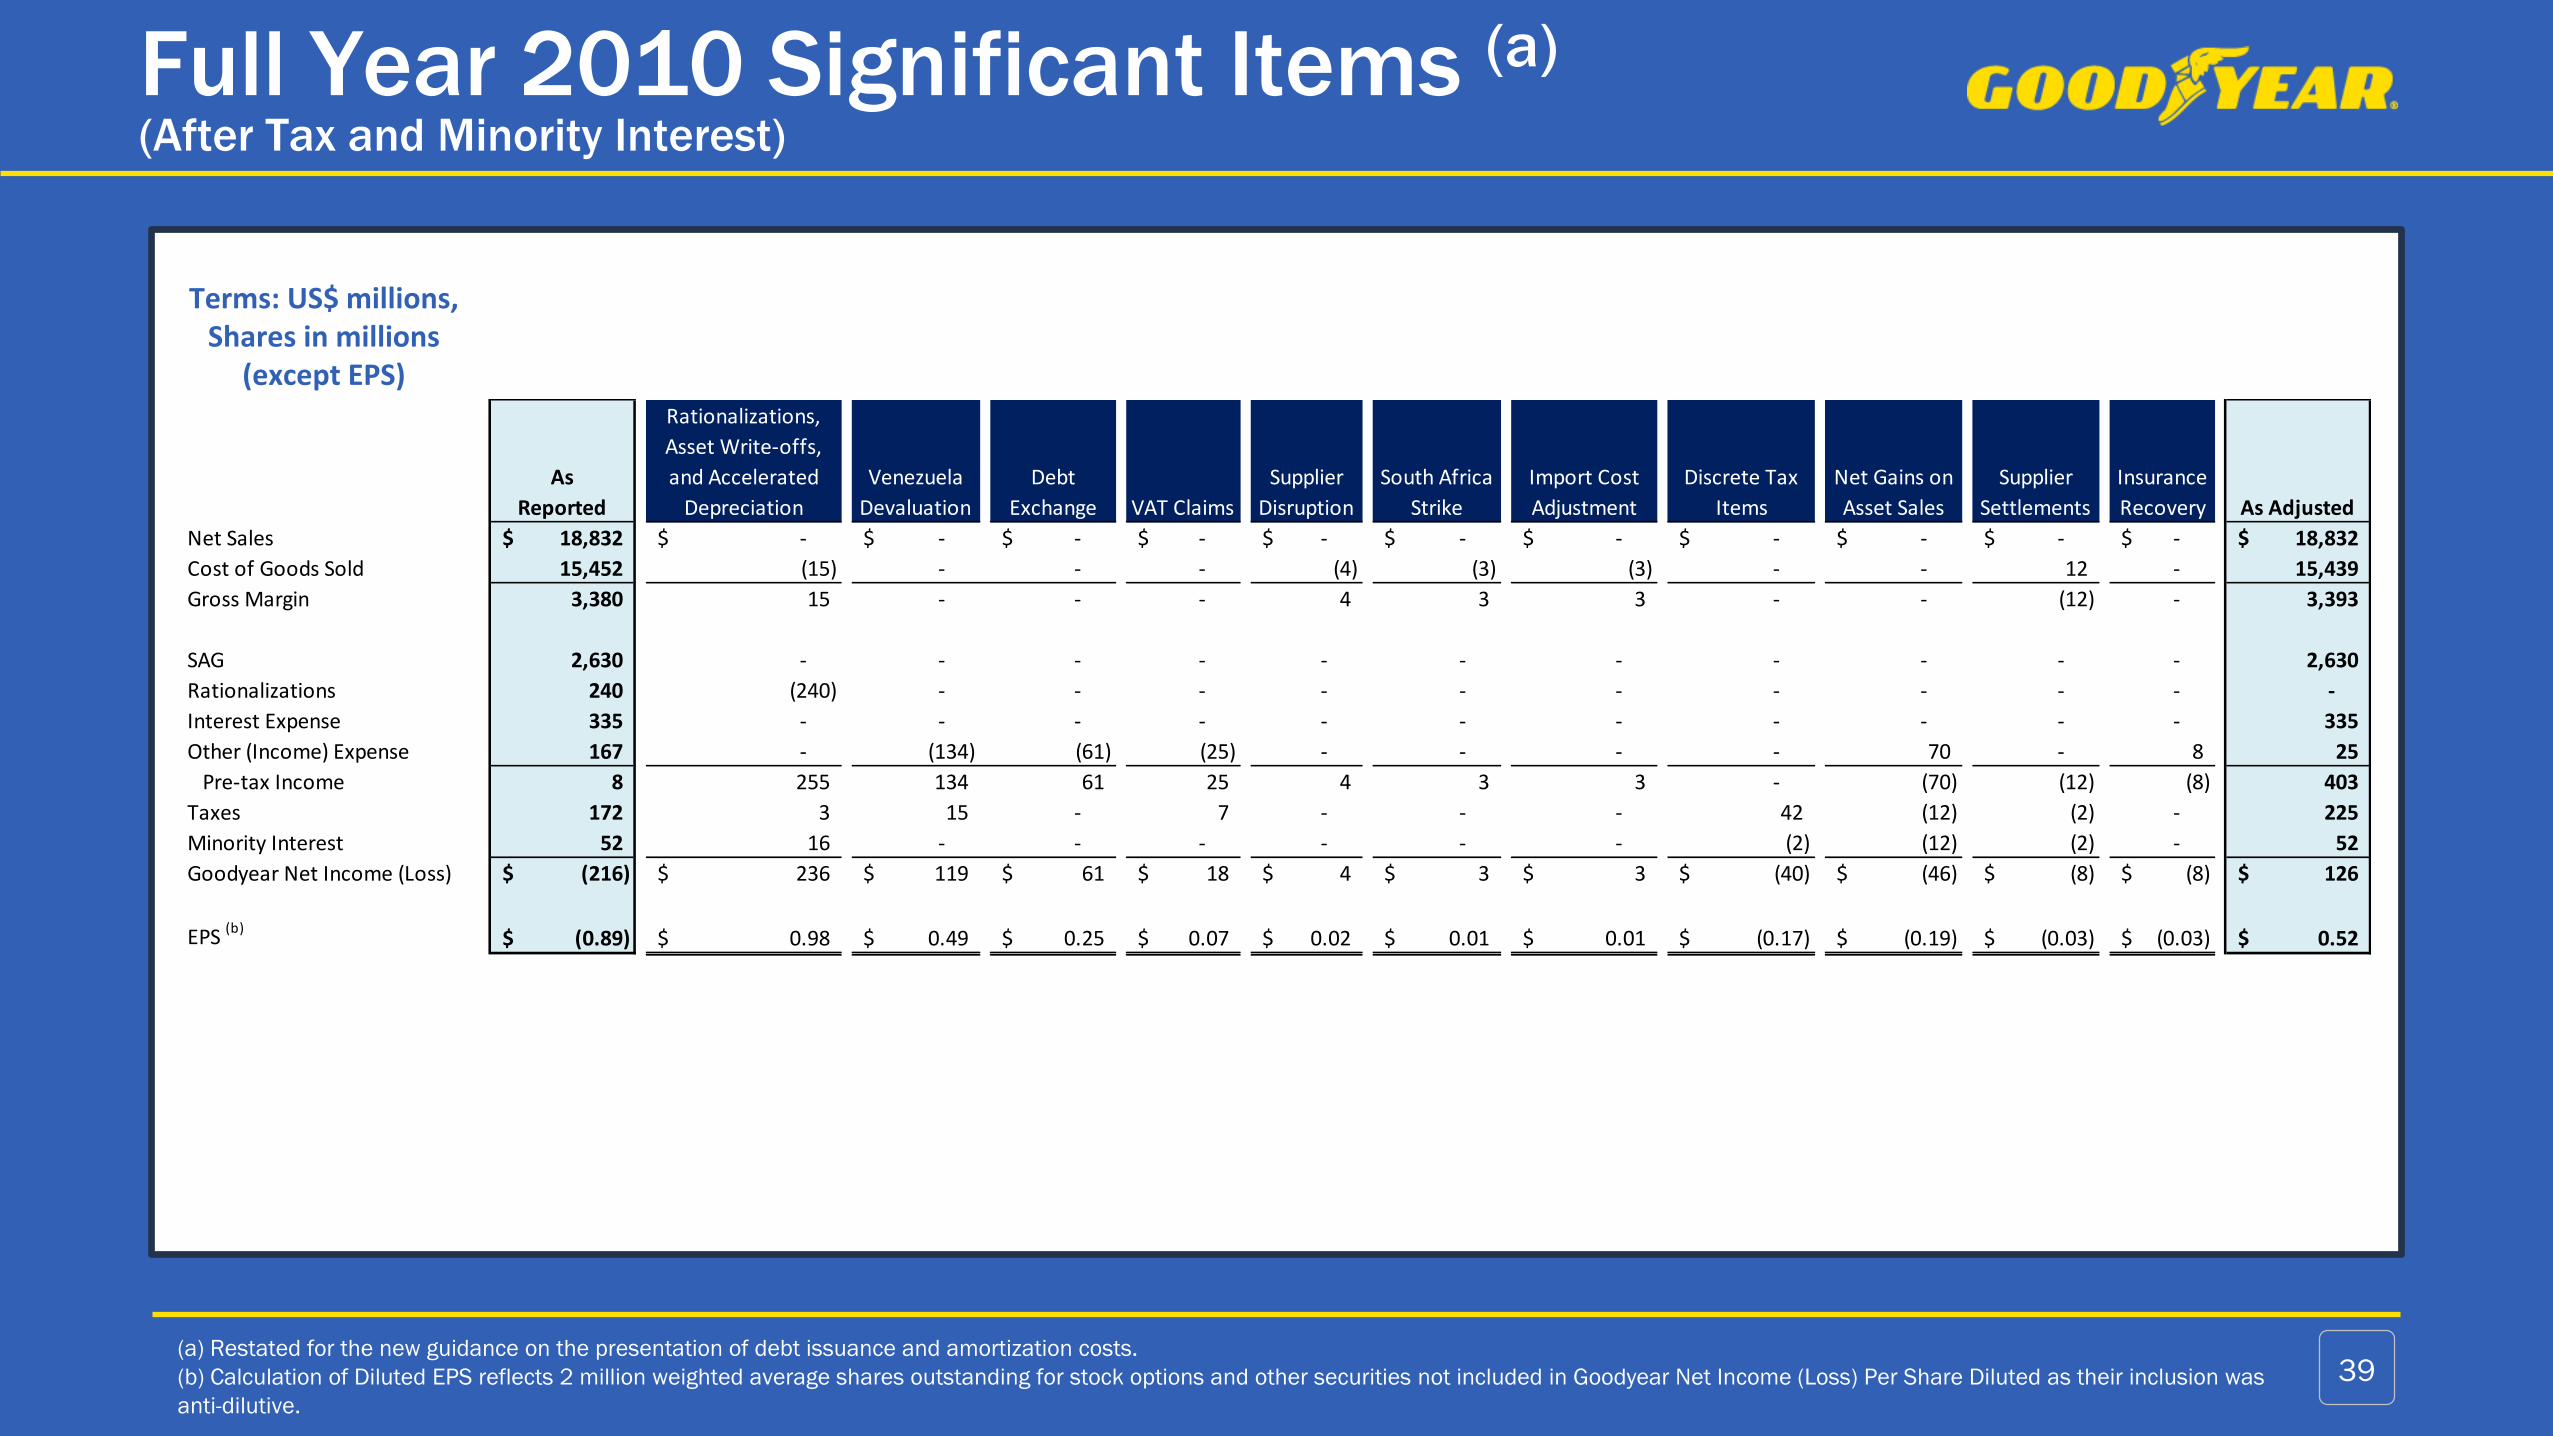
Full Year 2010 Significant Items (a)
(After Tax and Minority Interest)
39
Terms: US$ millions, Shares in millions
(except EPS)
(a) Restated for the new guidance on the presentation of debt issuance and amortization costs.
(b) Calculation of Diluted EPS reflects 2 million weighted average shares outstanding for stock options and other securities not included in Goodyear Net Income (Loss) Per Share Diluted as their inclusion was
anti-dilutive.
As
Reported
Rationalizations,
Asset Write-offs,
and Accelerated
Depreciation
Venezuela
Devaluation
Debt
Exchange VAT Claims
Supplier
Disruption
South Africa
Strike
Import Cost
Adjustment
Discrete Tax
Items
Net Gains on
Asset Sales
Supplier
Settlements
Insurance
Recovery As Adjusted
Net Sales 18,832$ -$ -$ -$ -$ -$ -$ -$ -$ -$ -$ -$ 18,832$
Cost of Goods Sold 15,452 (15) - - - (4) (3) (3) - - 12 - 15,439
Gross Margin 3,380 15 - - - 4 3 3 - - (12) - 3,393
SAG 2,630 - - - - - - - - - - - 2,630
Rationalizations 240 (240) - - - - - - - - - - -
Interest Expense 335 - - - - - - - - - - - 335
Other (Income) Expense 167 - (134) (61) (25) - - - - 70 - 8 25
Pre-tax Income 8 255 134 61 25 4 3 3 - (70) (12) (8) 403
Taxes 172 3 15 - 7 - - - 42 (12) (2) - 225
Minority Interest 52 16 - - - - - - (2) (12) (2) - 52
Goodyear Net Income (Loss) (216)$ 236$ 119$ 61$ 18$ 4$ 3$ 3$ (40)$ (46)$ (8)$ (8)$ 126$
EPS (b)(0.89)$ 0.98$ 0.49$ 0.25$ 0.07$ 0.02$ 0.01$ 0.01$ (0.17)$ (0.19)$ (0.03)$ (0.03)$ 0.52$