conformational flexibility of a ubiquitin conjugation enzyme (e2) †
TRANSCRIPT
Conformational Flexibility of a Ubiquitin Conjugation Enzyme (E2)†
Qin Liu,‡,§ Yate-Ching Yuan,§ Binghui Shen,| David J. Chen,*,‡ and Yuan Chen*,§
DNA Damage and Repair Group, Life Science DiVision, Los Alamos National Laboratories, Los Alamos, New Mexico 87545,and DiVision of Immunology and Department of Cell and Tumor Biology, Beckman Research Institute of the City of Hope,
1450 East Duarte Road, Duarte, California 91010
ReceiVed July 31, 1998; ReVised Manuscript ReceiVed NoVember 30, 1998
ABSTRACT: Ubiquitination plays important roles in a variety of biological processes, such as DNA repair,cell cycle regulation, and p53-dependent processes. Despite intensive studies in ubiquitination, themechanism of substrate recognition is still not well understood. Each E2 has its own substrate specificity,yet substrate proteins recognized by each E2 are highly diverse. To better understand how E2 proteinsconfer both substrate specificity and diversity, we have studied conformational flexibility of an E2, UBC9,using nuclear magnetic resonance15N relaxation and hydrogen-deuterium exchange measurements. Tworegions in human UBC9 show higher mobility over a wide range of time scales. Combined with previousbiochemical studies, both regions are likely to be important for protein-protein recognition in the ubiquitinpathway. The region near the N-terminus may be important for interactions with the E1-UBL1 conjugate.The region near the C-terminus, which undergoes conformational exchange may be important for substratebinding and catalytic activity. Since E2 enzymes share high homology in primary sequences and three-dimensional structures, the conformational flexibility of UBC9 may represent a general feature of E2enzymes. This studyproVides a new perspective for further studies of protein-protein recognition inubiquitination.
Extensive studies have been conducted on ubiquitination(for reviews, see refs1-3). Ubiquitin, a protein with 76amino acids, is highly conserved throughout many species.Its C-terminal Gly residue is involved in a covalent conjuga-tion to a Lys residue of other proteins. The C-terminal Glyresidue of one ubiquitin molecule may also conjugate to theLys48 of another ubiquitin molecule in multi-ubiquitination.In the ubiquitination pathway, the ubiquitin activationenzyme E1 activates ubiquitin by hydrolyzing ATP to forma high-energy bond with ubiquitin. Ubiquitin is then trans-ferred to a ubiquitin conjugation enzyme (UBC)1, also knownas E2. In this step, the C-terminal Gly is conjugated to theSH group of the active site Cys residue. Interactions betweenE2 and substrate proteins result in transferring ubiquitin tothe substrate proteins. In some cases, this process requiresthe participation of ubiquitin-protein ligase (E3).
Ubiquitination plays important roles in a variety ofbiological processes. Ubiquitination mainly participates inprotein degradation. Many crucial proteins are degraded bythe ubiquitination pathway. These include some cyclins,cyclin-dependent kinase inhibitors, histones, oncogenes, and
short-lived transcription factors (4-6). Ubiquitination hasbeen shown to play key roles in cell cycle control andapoptosis (7). Some processes that do not appear to beinvolved in protein degradation also require ubiquitin.Ubiquitin may serve as a chaperone that targets proteins forcell structure formation, such as biogenesis of peroxisomes(8) and ribosomes (9), and for protein translocation (10).Ubiquitination is highly specific in two aspects. The choiceof proteins to be ubiquitinated is highly selective, and thetiming of when to ubiquitinate a selected protein, especiallyin cell cycle control, is highly selective.
Proteins with high sequence homology to ubiquitin, E1,and E2 enzymes have been found. The ubiquitin homologousproteins include the yeast protein SMT3, human proteinUBL-1 (also known as SUMO-1, GMP1, PIC1, or sentrin)(for a review, see ref11), ISG15 (12), and NEDD-8 identifiedin mice and plants (13, 14). A unique feature of ubiquitinand ubiquitin-like protein is that they all contain a diglycinesequence at the C-terminus which is capable of conjugatingto other proteins in the ubiquitin pathway. In addition toubiquitin homologues, an E1 homologue has also been found(15). Many E2 proteins have been found with differentsubstrate specificities. UBC1, UBC4, and UBC5 appear tobe involved in general ubiquitination pathways that lead tothe degradation of abnormal proteins (16, 17). UBC2 (RAD6)is involved in DNA damage repair and sporulation (9). UBC3(cdc34) participates in the stability control of cyclins (9).UBC6 is required for protein translocation through themembrane (10). UBC10 is involved in peroxisome biogenesis(8). Among the conserved residues in the UBC family ofproteins, the fragment containing the ubiquitin accepting Cysresidue is highly conserved.
* To whom correspondence should be addressed.† This work is supported in part by NIH GM54190 (Y.C.). Y.C. is
a recipient of the American Cancer Society Junior Faculty ResearchAward (JFRA-646).
‡ Los Alamos National Laboratories.§ Division of Immunology, Beckman Research Institute of the City
of Hope.| Department of Cell and Tumor Biology, Beckman Research
Institute of the City of Hope.1 Abbreviations: NMR, nuclear magnetic resonance; NOE, nuclear
Overhauser effect; UBC, ubiquitin conjugation enzyme, also knownas E2.
1415Biochemistry1999,38, 1415-1425
10.1021/bi981840h CCC: $18.00 © 1999 American Chemical SocietyPublished on Web 01/15/1999
UBC9 is a member of the E2 protein family. Instead ofubiquitin, it conjugates with the ubiquitin homologue, UBL1,in humans. The interaction between UBC9 and UBL1 isspecific, since UBC9 does not interact well with ubiquitinand UBL1 does not interact with UBC2 (18). UBC9 in yeast,mouse, and human has been identified (4, 19, 18). It playscritical roles in DNA repair, cell cycle regulation, and p53-dependent processes (4). Many proteins which interact withUBC9 have been identified. The human UBC9 has beenshown to interact with several important proteins, such asRAD51, RAD52, P53, c-jun, glucocorticoid receptor, thenegative regulatory domain of the Wilms’ tumor geneproduct, and human papillomavirus type 16 E1 replicationprotein (20-22). Seufert and his colleagues have shown thatyeast UBC9 may interact with CLB2, an M-phase cyclin,and CLB5, an S-phase cyclin. Hateboer et al. (23) showedthat murine UBC9, which has an amino acid sequenceidentical to that of the human UBC9, binds to the CR2 ofadenovirus E1A protein.
The three-dimensional structures of several UBC proteinsincluding the plantArabidopsis thalianaUBC1, yeast UBC4,yeast UBC7, and human/murine UBC9 have been determinedby X-ray crystallography (24-27). These UBC proteins havehighly conserved tertiary structures with an RMSD of CR
atoms less than 2 Å, excluding two surface loops. The twosurface loops occur around amino acid residues 35 and 100and vary significantly in primary sequences and three-dimensional structures among the four different UBCproteins. The largest variation in sequence and length amongdifferent E2 proteins occurs at the loop around residue 100.
Despite the intensive studies in ubiquitination, the mech-anism of protein-protein recognition in ubiquitination is stillnot well understood. Substrate binding sites on E2 are stillcontroversial. The sequence and structural variations of thetwo surface loops around residues 35 and 100 have beenproposed to be responsible for substrate-specific recognitionsof different UBC proteins. However, biochemical studiesshow that the N-terminus, which is close to the two loops inthe three-dimensional structure of E2, is important in bindingthe ubiquitin-E1 conjugate (28). In addition, although eachE2 protein has specificity for substrate proteins, the proteinsrecognized by each E2 are highly diverse. An apparentparadox is how E2 proteins confer both substrate specificityand diversity.The substrate diVersity may correlate with theconformational flexibility of E2 molecules.Thus, a flexibleregion on an E2 enzyme may possibly be the substratebinding site. In addition, conformational flexibility may beimportant to the catalytic activity of transferring ubiquitinto substrate proteins. To date, the internal mobility of E2proteins has not been characterized.
NMR methods have played important roles in character-izing the internal mobilities of proteins. Such methods canprovide quantitative information on the dynamic processesof proteins over a wide range of time scales. Heteronuclearrelaxation measurements provide information related toprotein internal motions on the picosecond to nanosecondtime scales (for a review, see ref29). Chemical exchangedata gives insight into protein dynamics in the microsecondto second time scales. Amide1H-2H exchange experimentsprovide information on the stability of hydrogen-bondedsecondary structures, and allow characterization of dynamicprocesses on the time scale of minutes to hundreds of hours
(30). This paper describes the characterization of conforma-tional flexibility of human UBC9 using heteronuclearrelaxation and amide1H/2H exchange studies. The residuesthat show higher conformational flexibility are not randomlydistributed, but localized in two regions. Combined withprevious biochemical studies, these two regions may con-stitute the binding sites for substrates and the E1-UBL1conjugates.
MATERIALS AND METHODS
Sample Preparation.Human UBC9 was subcloned intovector PET28 (from Novagen, Inc.). The modified plasmidhas an open reading frame that encodes the sequence Met-Gly-(His)6, followed by the sequence of UBC9.Escherichiacoli containing the expression plasmid were grown at 37°Cin M-9 minimal media supplemented with trace minerals andBasal Medium Eagle vitamins (Gibco). (15NH4)2SO4 (1.5 g/L)was used as the nitrogen source. Bacterial cultures werefermented in shaking flasks at 37°C. Expression of theprotein was induced by addition of isopropylâ-D-thiogalac-topyranoside (IPTG) to a concentration of 1.0 mM when theculture reached OD595 nm ) 0.6-0.8. Then shaking wascontinued for 3-4 h. The culture was centrifuged, and thebacterial pellets were resuspended in Buffer A (5 mMimidazole, 500 mM NaCl, 20 mM TrisHCl, pH 7.9, and 10mM DTT). The protein was extracted by sonication andcentrifugation at 5000g for 15 min. The UBC9 protein wasrecovered in the supernatant.
The protein was purified on a Ni-NTA column (Qiagen).The supernatant was applied to a Ni-NTA column equili-brated with buffer A. The column was washed with 10volumes of buffer A, followed by 10 volumes of buffer B(20 mM imidazole, 500 mM NaCl, 20 mM TrisHCl, pH 7.9,and 10 mM DTT), then 6 volumes of buffer C (600 mMimidazole, 500 mM NaCl, 20 mM TrisHCl, pH 7.9, and 10mM DTT). Approximately 30 mg of protein was purifiedfrom one liter of the M-9 culture. NMR experiments wereconducted using samples containing 0.3 mM and 0.7 mMUBC9 in 100 mM sodium phosphate, at pH 6.0, and 20 mMDTT in 90%H2O/10%D2O.
15N Relaxation Experiments. All 15N relaxation experi-ments were carried out at 30°C on a Varian Unity-plus 500NMR spectrometer equipped with four channels, pulse-shaping and pulse-field-gradient capabilities. Backboneresonances of UBC9 were assigned as described (31).15Nrelaxation measurements were carried out using the publishedmethods (32).15N T1
-1 relaxation rates were measured with6 relaxation delays: 6, 355, 710, 1066, 1421, 1665 ms. Theserelaxation delays should provide sufficient sampling pointsas has been shown previously (33).15N T2
-1 experimentswere performed with 10 relaxation delays: 17, 33, 50, 67,84, 100, 134, 150, 167, 184 ms. The delay between pulsesin the CPMG sequence was 0.9 ms. A recycle delay of 1.5s was used for measurement ofT1
-1 andT2-1 relaxation rates.
The spectra measuring1H-15N NOE were acquired with a 2s relaxation delay followed by a 3 s period of protonsaturation. The spectra recorded in the absence of protonsaturation employed a relaxation delay of 5 s. Each 2D dataset consists of 2048 complex points in t2 and 320 points int1 with a spectral width of 11250 Hz in the 1H dimensionand 1241 Hz in the indirectly detected15N dimension. For
1416 Biochemistry, Vol. 38, No. 5, 1999 Liu et al.
error estimation, duplicated spectra were recorded for NOE,at 355 ms relaxation delay forT1, and at relaxation delaysof 50 and 100 ms forT2 measurements.
All spectra were processed using FELIX 97.0 softwarefrom Molecular Simulations Inc. on a SGI Indigo IIworkstation. A 90° phase-shifted sine-bell window functionfollowed by a Lorentzian-to-Gaussian transformation wasapplied to the FID before the Fourier transform. The valuesof T1
-1, T2-1, and NOE and the uncertainties were calculated
using the relaxation module of FELIX 97.0. Briefly, intensi-ties of resonance peaks in two-dimensional spectra weremeasured as peak heights. Uncertainties in peak heightmeasurements were determined from duplicated spectra.T1
and T2 data were fitted to three- and two-parameter expo-nential equations using a nonlinear least-squares fittingalgorithm. The{1H}-15N heteronuclear NOE values werecalculated as ratios of peak heights in the spectra recordedwith and without1H saturation. The average values of NOEsand standard errors were determined from the two data sets.
Analysis of Relaxation Data and Reduced Spectral DensityMapping.The15N T1
-1 andT2-1 relaxation rates and the1H-
15N NOE are dominated by the dipolar interaction of an15Nnucleus with its attached proton and by chemical shiftanisotropy, and are related to spectral density functions asfollows (34):
in which
whereγN andγH are the gyromagnetic ratios of the1H and15N nuclei, respectively;ωH and ωN are the1H and 15NLarmor frequencies;rNH is the internuclear1H-15N distance(1.02 Å); Ho is the magnetic field strength; and∆σ is thedifference of the parallel and the perpendicular componentsof the assumed axially symmetrical15N chemical shift tensorand is set to-160 ppm. A spectral density function,J(ω),is the Fourier transform of the autocorrelation function ofan NH vector. TheRex is the sum of the effective rateconstants for other pseudo-first-order processes that contrib-ute to transverse relaxation. Reduced spectral density func-tions J(0), J(ωN), and J(ωH) were calculated as described(29).
Model-Free Calculation.The spectral density functionswere represented using the extended model-free formalism(35, 36)
in which S2 ) Sf2Ss
2 is the generalized order parameter,
where Sf2 is the order parameter for motions on the
picosecond time scale andSs2 is the order parameter for
motions on the nanosecond time scale;τ-1 ) τm-1 + τe
-1,where τm is the overall rotational correlation time of themolecule andτe is the effective internal correlation time ofinternal motions. Model-free parameters were determinedfrom theT1
-1, T2-1, and NOE using the Modelfree program
(version 3.1) kindly provided by Professor Arthur G. Palmer,III. For each N-H bond vector, five motional models wereconsidered in the analysis and one model was selected bysystematically evaluating each model using F-statisticaltesting as described (37). The procedure is summarized asfollows. An initial estimation of the overall tumblingcorrelation time (τm) was obtained from the averageT1/T2
ratio of NH bond vectors which does not appear to haveinternal motions on the nanosecond time scales or confor-mational exchange (Rex). Residues were selected on the basisof two criterias, NOE> 0.6 and satisfying the followingconditions (39):
where, ⟨T1⟩ and ⟨T2⟩ are the averages ofT1 and T2,respectively;T1,n and T2,n are theT1 and T2 for residuen,respectively;σ is the standard deviation of (⟨T2⟩ - T2,n)/⟨T2⟩- (⟨T1⟩ - T1,n)/⟨T1⟩. A grid search was used to obtain aninitial guess of the other model-free parameters withτm heldconstant. Then the model-free parameters were optimizedby minimizing ø2 given by
in which R1ie, R2i
e, and NOEie are the corresponding
experimental values of the relaxation parameters; andσ1i,σ2i, andσNOEi are the corresponding experimental uncertain-ties in the relaxation parameters.R1i
c, R2ic, and NOEi
c arethe calculated values. The quality of the fit between theexperimental data and theoretical models was assessed bycomparing the optimal values ofø2 with theR ) 0.05 criticalvalue of the distribution ofø2 determined from Monte Carlosimulations. During this step, five motional models wereevaluated and one was selected. Following the determinationof the appropriate model for each amide, the overallcorrelation time was optimized for all of the residuessimultaneously. Once the global optimalτm value wasdetermined, the relaxation parameters were fitted again usingthe selected model.
Calculation of the Rotational Diffusion Tensor.The degreeof anisotropy was determined using two methods, from directfitting of T1/T2 ratios and from the local diffusion constantsas described previously (38-40) using the programs kindlyprovided by Professor Arthur G. Palmer, III. Residues withno conformational exchange and nanosecond internal motionswere used for calculation of the diffusion tensor of UBC9.Direct fitting of T1/T2 ratios assumed that the molecule hasan axially symmetrical top. Local diffusion constants werealso used to calculate the rotational diffusion tensor. These
(⟨T2⟩ - T2,n)/⟨T2⟩ - (⟨T1⟩ - T1,n)/⟨T1⟩ e 1.5σ
ø2 ) ∑i
(R1ie - R1i
c)2
σ1i2
+(R2i
e - R2ic)2
σ2i2
+
(NOEie - NOEi
c)2
σNOEi2
R1 ) d2[J(ωH - ωN) + 3J(ωN) + 6J(ωH + ωN)] +
c2J(ωN)
R2 ) 0.5d2[4J(0) + J(ωH - ωN) + 3J(ωN) + 6J(ωH) +
6J(ωH + ωN)] + (1/6)c2[3J(ωN) + 4J(0)] + Rex
NOE ) 1 + (γH/γN)d2[6J(ωH + ωN) - J(ωH - ωN)]
d2 ) 0.1γH2γN
2h2/(4π2)⟨1/rNH3⟩2
c2 ) (2/15) γN2Ho
2∆σ2
J(ω) ) 2/5{S2τm/[1 + (ωτm)2] + (Sf2 - S2)τ/[1 + (ωτ)2]}
Conformational Flexibility of E2 Biochemistry, Vol. 38, No. 5, 19991417
data were fit to three diffusion models: isotropic, axiallysymmetric, and fully anisotropic. F-statistical testing wasused to select the model which best represented the rotationaldiffusion of UBC9. Coordinates of the crystal structure ofUBC9 (24) were used for the analysis.
RESULTS
15N Relaxation Measurements.15N T1-1, T2
-1, and1H-15NNOE relaxation rates were measured at 0.7 mM proteinconcentration.15N T1
-1 andT2-1 rates were also measured
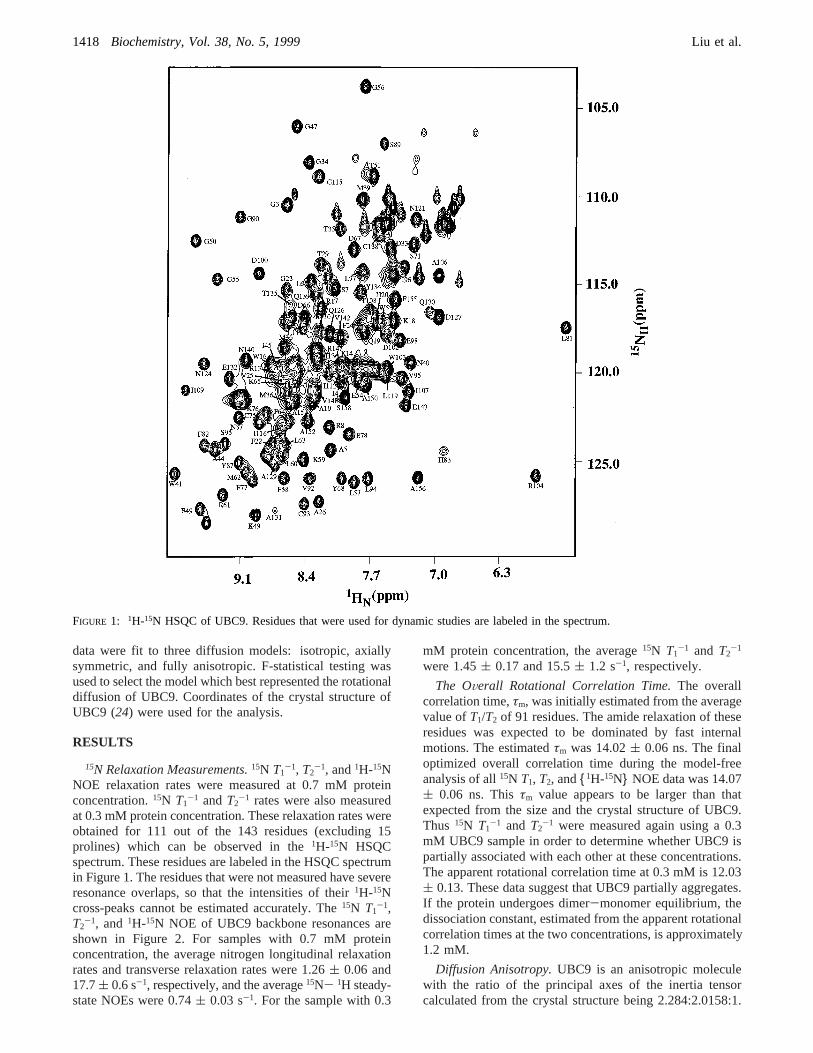
at 0.3 mM protein concentration. These relaxation rates wereobtained for 111 out of the 143 residues (excluding 15prolines) which can be observed in the1H-15N HSQCspectrum. These residues are labeled in the HSQC spectrumin Figure 1. The residues that were not measured have severeresonance overlaps, so that the intensities of their1H-15Ncross-peaks cannot be estimated accurately. The15N T1
-1,T2
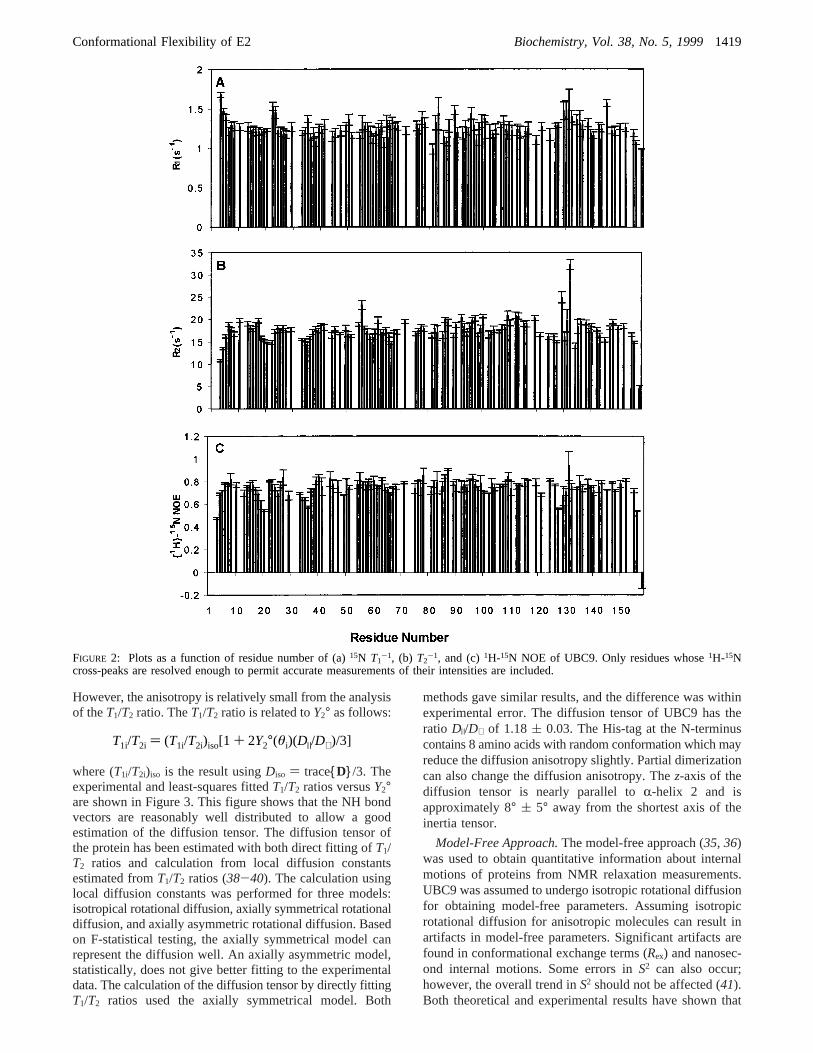
-1, and 1H-15N NOE of UBC9 backbone resonances areshown in Figure 2. For samples with 0.7 mM proteinconcentration, the average nitrogen longitudinal relaxationrates and transverse relaxation rates were 1.26( 0.06 and17.7( 0.6 s-1, respectively, and the average15N- 1H steady-state NOEs were 0.74( 0.03 s-1. For the sample with 0.3
mM protein concentration, the average15N T1-1 and T2
-1
were 1.45( 0.17 and 15.5( 1.2 s-1, respectively.
The OVerall Rotational Correlation Time.The overallcorrelation time,τm, was initially estimated from the averagevalue ofT1/T2 of 91 residues. The amide relaxation of theseresidues was expected to be dominated by fast internalmotions. The estimatedτm was 14.02( 0.06 ns. The finaloptimized overall correlation time during the model-freeanalysis of all15N T1, T2, and{1H-15N} NOE data was 14.07( 0.06 ns. Thisτm value appears to be larger than thatexpected from the size and the crystal structure of UBC9.Thus 15N T1
-1 and T2-1 were measured again using a 0.3
mM UBC9 sample in order to determine whether UBC9 ispartially associated with each other at these concentrations.The apparent rotational correlation time at 0.3 mM is 12.03( 0.13. These data suggest that UBC9 partially aggregates.If the protein undergoes dimer-monomer equilibrium, thedissociation constant, estimated from the apparent rotationalcorrelation times at the two concentrations, is approximately1.2 mM.
Diffusion Anisotropy.UBC9 is an anisotropic moleculewith the ratio of the principal axes of the inertia tensorcalculated from the crystal structure being 2.284:2.0158:1.
FIGURE 1: 1H-15N HSQC of UBC9. Residues that were used for dynamic studies are labeled in the spectrum.
1418 Biochemistry, Vol. 38, No. 5, 1999 Liu et al.
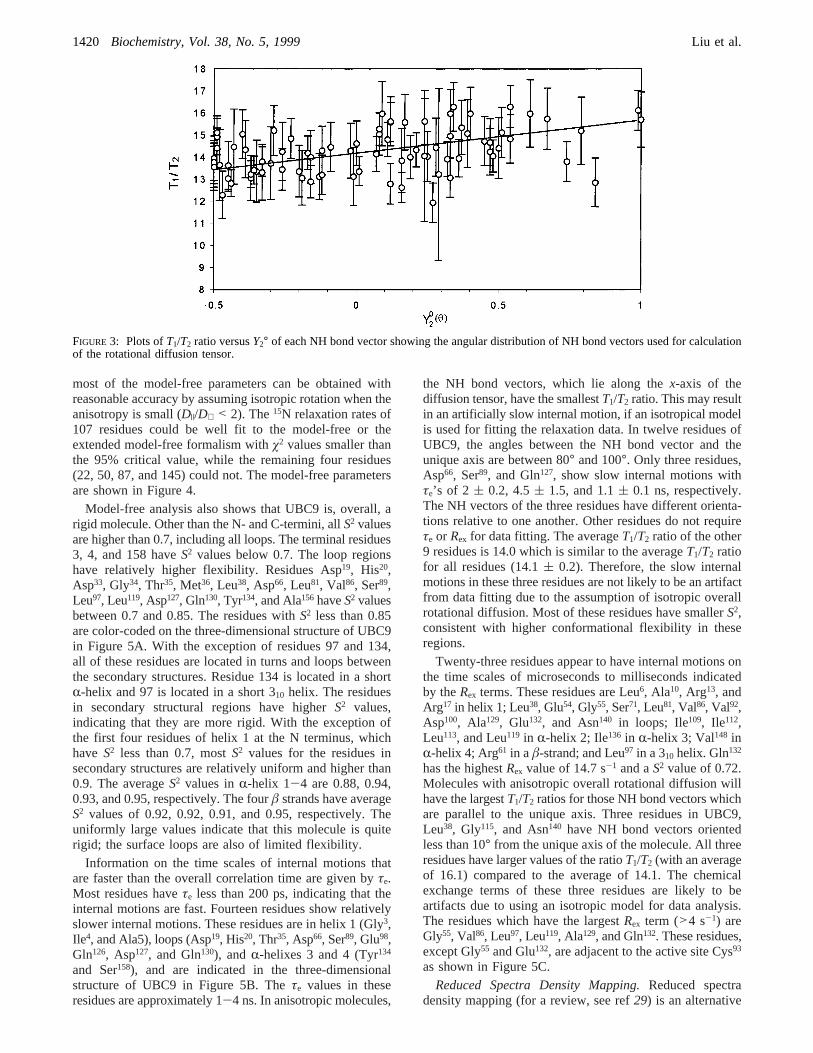
However, the anisotropy is relatively small from the analysisof theT1/T2 ratio. TheT1/T2 ratio is related toY2° as follows:
where (T1i/T2i)iso is the result usingDiso ) trace{D}/3. Theexperimental and least-squares fittedT1/T2 ratios versusY2°are shown in Figure 3. This figure shows that the NH bondvectors are reasonably well distributed to allow a goodestimation of the diffusion tensor. The diffusion tensor ofthe protein has been estimated with both direct fitting ofT1/T2 ratios and calculation from local diffusion constantsestimated fromT1/T2 ratios (38-40). The calculation usinglocal diffusion constants was performed for three models:isotropical rotational diffusion, axially symmetrical rotationaldiffusion, and axially asymmetric rotational diffusion. Basedon F-statistical testing, the axially symmetrical model canrepresent the diffusion well. An axially asymmetric model,statistically, does not give better fitting to the experimentaldata. The calculation of the diffusion tensor by directly fittingT1/T2 ratios used the axially symmetrical model. Both
methods gave similar results, and the difference was withinexperimental error. The diffusion tensor of UBC9 has theratio D|/D⊥ of 1.18 ( 0.03. The His-tag at the N-terminuscontains 8 amino acids with random conformation which mayreduce the diffusion anisotropy slightly. Partial dimerizationcan also change the diffusion anisotropy. Thez-axis of thediffusion tensor is nearly parallel toR-helix 2 and isapproximately 8° ( 5° away from the shortest axis of theinertia tensor.
Model-Free Approach.The model-free approach (35, 36)was used to obtain quantitative information about internalmotions of proteins from NMR relaxation measurements.UBC9 was assumed to undergo isotropic rotational diffusionfor obtaining model-free parameters. Assuming isotropicrotational diffusion for anisotropic molecules can result inartifacts in model-free parameters. Significant artifacts arefound in conformational exchange terms (Rex) and nanosec-ond internal motions. Some errors inS2 can also occur;however, the overall trend inS2 should not be affected (41).Both theoretical and experimental results have shown that
FIGURE 2: Plots as a function of residue number of (a)15N T1-1, (b) T2
-1, and (c)1H-15N NOE of UBC9. Only residues whose1H-15Ncross-peaks are resolved enough to permit accurate measurements of their intensities are included.
T1i/T2i ) (T1i/T2i)iso[1 + 2Y2°(θi)(D|/D⊥)/3]
Conformational Flexibility of E2 Biochemistry, Vol. 38, No. 5, 19991419
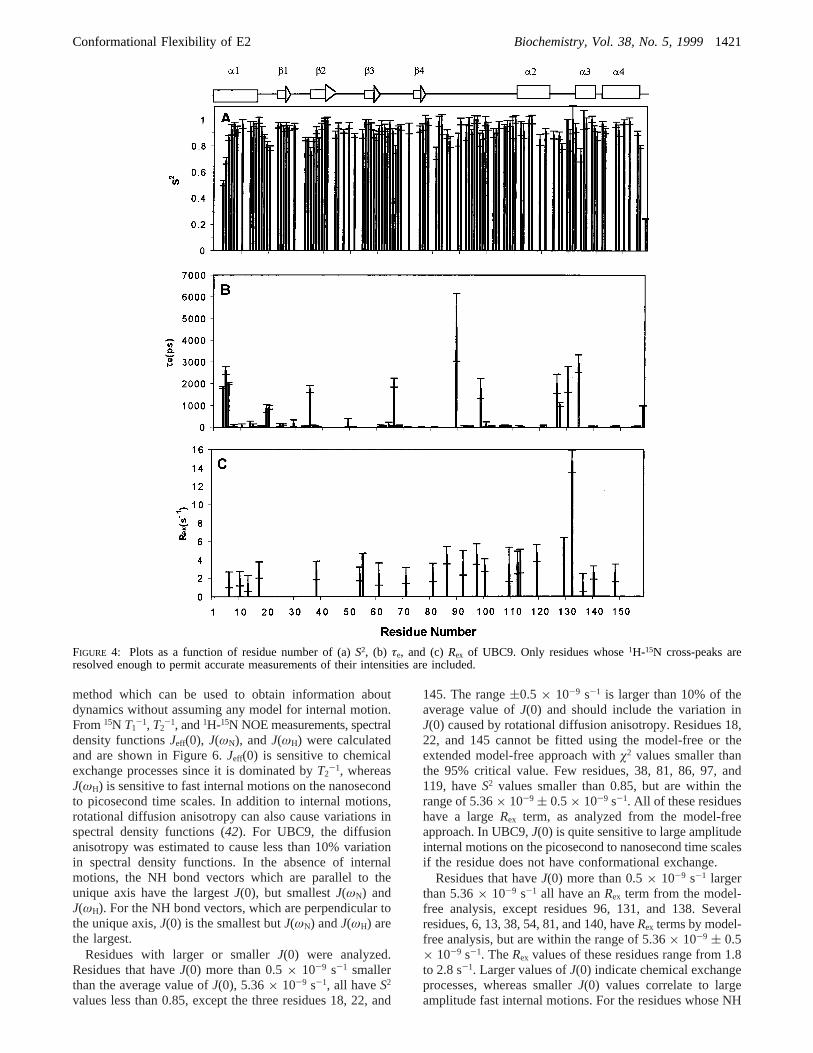
most of the model-free parameters can be obtained withreasonable accuracy by assuming isotropic rotation when theanisotropy is small (D|/D⊥ < 2). The15N relaxation rates of107 residues could be well fit to the model-free or theextended model-free formalism withø2 values smaller thanthe 95% critical value, while the remaining four residues(22, 50, 87, and 145) could not. The model-free parametersare shown in Figure 4.
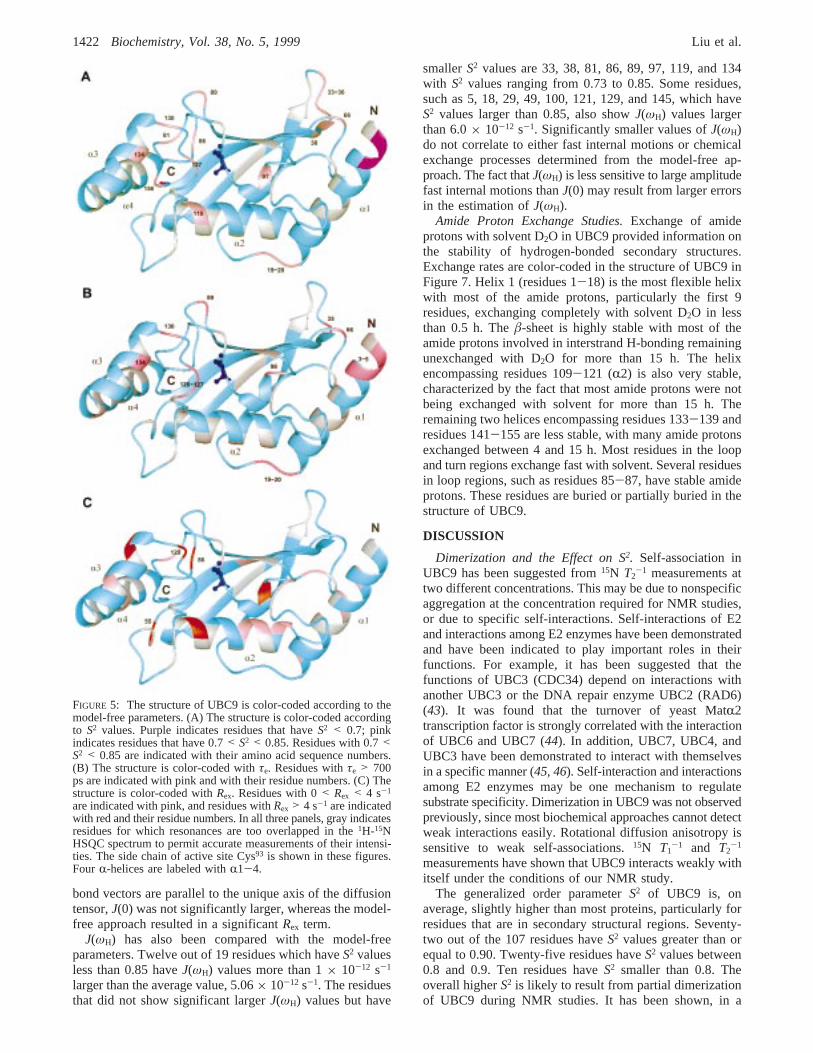
Model-free analysis also shows that UBC9 is, overall, arigid molecule. Other than the N- and C-termini, allS2 valuesare higher than 0.7, including all loops. The terminal residues3, 4, and 158 haveS2 values below 0.7. The loop regionshave relatively higher flexibility. Residues Asp19, His20,Asp33, Gly34, Thr35, Met36, Leu38, Asp66, Leu81, Val86, Ser89,Leu97, Leu119, Asp127, Gln130, Tyr134, and Ala156haveS2 valuesbetween 0.7 and 0.85. The residues withS2 less than 0.85are color-coded on the three-dimensional structure of UBC9in Figure 5A. With the exception of residues 97 and 134,all of these residues are located in turns and loops betweenthe secondary structures. Residue 134 is located in a shortR-helix and 97 is located in a short 310 helix. The residuesin secondary structural regions have higherS2 values,indicating that they are more rigid. With the exception ofthe first four residues of helix 1 at the N terminus, whichhave S2 less than 0.7, mostS2 values for the residues insecondary structures are relatively uniform and higher than0.9. The averageS2 values inR-helix 1-4 are 0.88, 0.94,0.93, and 0.95, respectively. The fourâ strands have averageS2 values of 0.92, 0.92, 0.91, and 0.95, respectively. Theuniformly large values indicate that this molecule is quiterigid; the surface loops are also of limited flexibility.
Information on the time scales of internal motions thatare faster than the overall correlation time are given byτe.Most residues haveτe less than 200 ps, indicating that theinternal motions are fast. Fourteen residues show relativelyslower internal motions. These residues are in helix 1 (Gly3,Ile4, and Ala5), loops (Asp19, His20, Thr35, Asp66, Ser89, Glu98,Gln126, Asp127, and Gln130), and R-helixes 3 and 4 (Tyr134
and Ser158), and are indicated in the three-dimensionalstructure of UBC9 in Figure 5B. Theτe values in theseresidues are approximately 1-4 ns. In anisotropic molecules,
the NH bond vectors, which lie along thex-axis of thediffusion tensor, have the smallestT1/T2 ratio. This may resultin an artificially slow internal motion, if an isotropical modelis used for fitting the relaxation data. In twelve residues ofUBC9, the angles between the NH bond vector and theunique axis are between 80° and 100°. Only three residues,Asp66, Ser89, and Gln127, show slow internal motions withτe’s of 2 ( 0.2, 4.5( 1.5, and 1.1( 0.1 ns, respectively.The NH vectors of the three residues have different orienta-tions relative to one another. Other residues do not requireτe or Rex for data fitting. The averageT1/T2 ratio of the other9 residues is 14.0 which is similar to the averageT1/T2 ratiofor all residues (14.1( 0.2). Therefore, the slow internalmotions in these three residues are not likely to be an artifactfrom data fitting due to the assumption of isotropic overallrotational diffusion. Most of these residues have smallerS2,consistent with higher conformational flexibility in theseregions.
Twenty-three residues appear to have internal motions onthe time scales of microseconds to milliseconds indicatedby theRex terms. These residues are Leu6, Ala10, Arg13, andArg17 in helix 1; Leu38, Glu54, Gly55, Ser71, Leu81, Val86, Val92,Asp100, Ala129, Glu132, and Asn140 in loops; Ile109, Ile112,Leu113, and Leu119 in R-helix 2; Ile136 in R-helix 3; Val148 inR-helix 4; Arg61 in aâ-strand; and Leu97 in a 310 helix. Gln132
has the highestRex value of 14.7 s-1 and aS2 value of 0.72.Molecules with anisotropic overall rotational diffusion willhave the largestT1/T2 ratios for those NH bond vectors whichare parallel to the unique axis. Three residues in UBC9,Leu38, Gly115, and Asn140 have NH bond vectors orientedless than 10° from the unique axis of the molecule. All threeresidues have larger values of the ratioT1/T2 (with an averageof 16.1) compared to the average of 14.1. The chemicalexchange terms of these three residues are likely to beartifacts due to using an isotropic model for data analysis.The residues which have the largestRex term (>4 s-1) areGly55, Val86, Leu97, Leu119, Ala129, and Gln132. These residues,except Gly55 and Glu132, are adjacent to the active site Cys93
as shown in Figure 5C.Reduced Spectra Density Mapping.Reduced spectra
density mapping (for a review, see ref29) is an alternative
FIGURE 3: Plots ofT1/T2 ratio versusY2° of each NH bond vector showing the angular distribution of NH bond vectors used for calculationof the rotational diffusion tensor.
1420 Biochemistry, Vol. 38, No. 5, 1999 Liu et al.
method which can be used to obtain information aboutdynamics without assuming any model for internal motion.From15N T1
-1, T2-1, and1H-15N NOE measurements, spectral
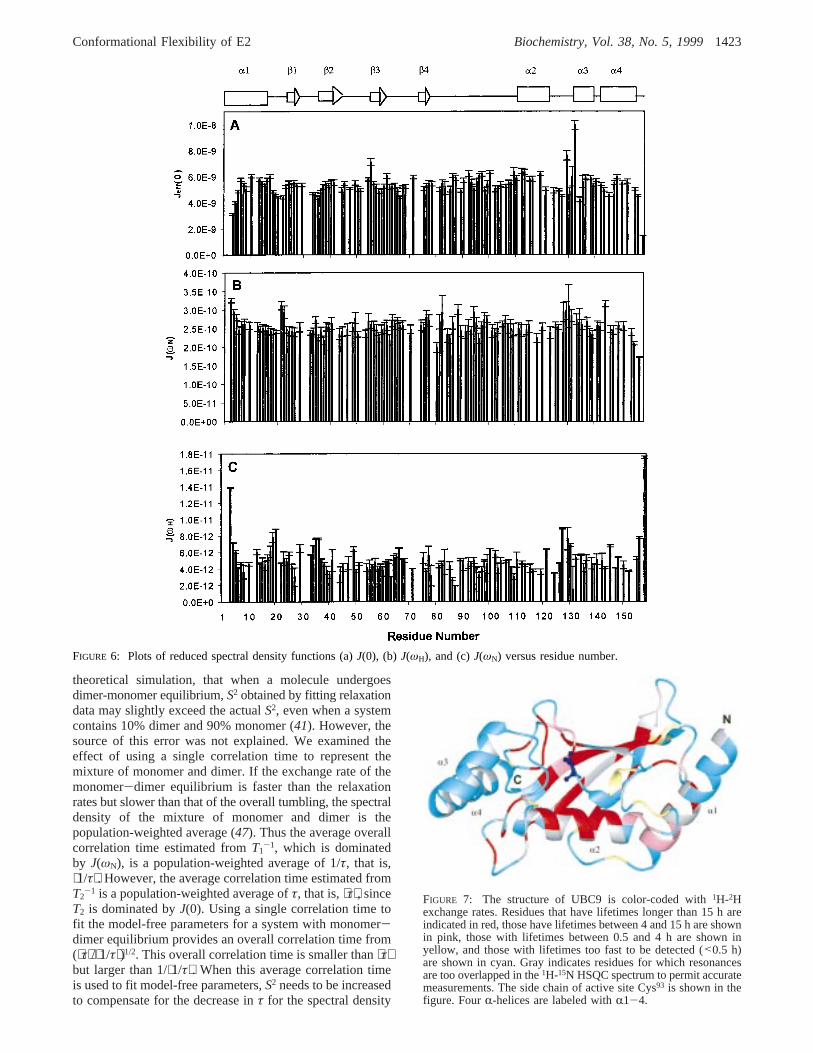
density functionsJeff(0), J(ωN), andJ(ωH) were calculatedand are shown in Figure 6.Jeff(0) is sensitive to chemicalexchange processes since it is dominated byT2
-1, whereasJ(ωH) is sensitive to fast internal motions on the nanosecondto picosecond time scales. In addition to internal motions,rotational diffusion anisotropy can also cause variations inspectral density functions (42). For UBC9, the diffusionanisotropy was estimated to cause less than 10% variationin spectral density functions. In the absence of internalmotions, the NH bond vectors which are parallel to theunique axis have the largestJ(0), but smallestJ(ωN) andJ(ωH). For the NH bond vectors, which are perpendicular tothe unique axis,J(0) is the smallest butJ(ωN) andJ(ωH) arethe largest.
Residues with larger or smallerJ(0) were analyzed.Residues that haveJ(0) more than 0.5× 10⁻⁹ s-1 smallerthan the average value ofJ(0), 5.36× 10⁻⁹ s-1, all haveS2
values less than 0.85, except the three residues 18, 22, and
145. The range(0.5 × 10⁻⁹ s-1 is larger than 10% of theaverage value ofJ(0) and should include the variation inJ(0) caused by rotational diffusion anisotropy. Residues 18,22, and 145 cannot be fitted using the model-free or theextended model-free approach withø2 values smaller thanthe 95% critical value. Few residues, 38, 81, 86, 97, and119, haveS2 values smaller than 0.85, but are within therange of 5.36× 10⁻⁹ ( 0.5× 10⁻⁹ s-1. All of these residueshave a largeRex term, as analyzed from the model-freeapproach. In UBC9,J(0) is quite sensitive to large amplitudeinternal motions on the picosecond to nanosecond time scalesif the residue does not have conformational exchange.
Residues that haveJ(0) more than 0.5× 10⁻⁹ s-1 largerthan 5.36× 10⁻⁹ s-1 all have anRex term from the model-free analysis, except residues 96, 131, and 138. Severalresidues, 6, 13, 38, 54, 81, and 140, haveRex terms by model-free analysis, but are within the range of 5.36× 10⁻⁹ ( 0.5× 10⁻⁹ s-1. TheRex values of these residues range from 1.8to 2.8 s-1. Larger values ofJ(0) indicate chemical exchangeprocesses, whereas smallerJ(0) values correlate to largeamplitude fast internal motions. For the residues whose NH
FIGURE 4: Plots as a function of residue number of (a)S2, (b) τe, and (c)Rex of UBC9. Only residues whose1H-15N cross-peaks areresolved enough to permit accurate measurements of their intensities are included.
Conformational Flexibility of E2 Biochemistry, Vol. 38, No. 5, 19991421
bond vectors are parallel to the unique axis of the diffusiontensor,J(0) was not significantly larger, whereas the model-free approach resulted in a significantRex term.
J(ωH) has also been compared with the model-freeparameters. Twelve out of 19 residues which haveS2 valuesless than 0.85 haveJ(ωH) values more than 1× 10-12 s-1
larger than the average value, 5.06× 10⁻¹² s-1. The residuesthat did not show significant largerJ(ωH) values but have
smallerS2 values are 33, 38, 81, 86, 89, 97, 119, and 134with S2 values ranging from 0.73 to 0.85. Some residues,such as 5, 18, 29, 49, 100, 121, 129, and 145, which haveS2 values larger than 0.85, also showJ(ωH) values largerthan 6.0× 10⁻¹² s-1. Significantly smaller values ofJ(ωH)do not correlate to either fast internal motions or chemicalexchange processes determined from the model-free ap-proach. The fact thatJ(ωH) is less sensitive to large amplitudefast internal motions thanJ(0) may result from larger errorsin the estimation ofJ(ωH).
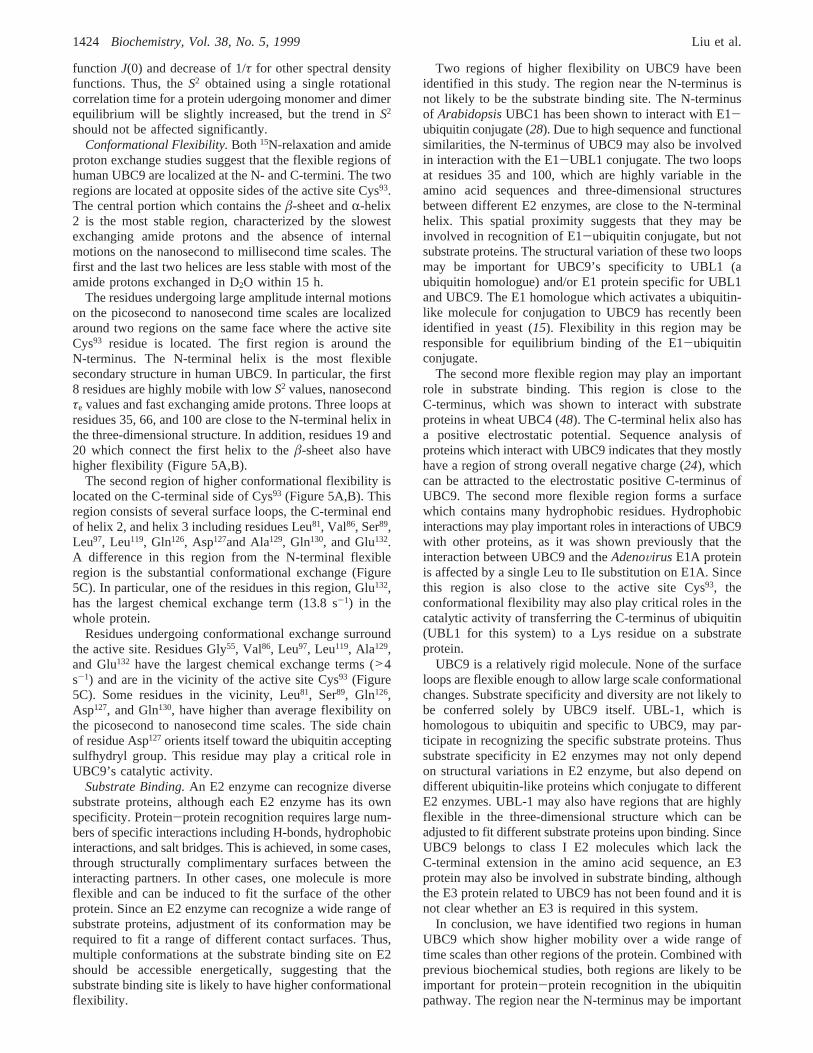
Amide Proton Exchange Studies.Exchange of amideprotons with solvent D2O in UBC9 provided information onthe stability of hydrogen-bonded secondary structures.Exchange rates are color-coded in the structure of UBC9 inFigure 7. Helix 1 (residues 1-18) is the most flexible helixwith most of the amide protons, particularly the first 9residues, exchanging completely with solvent D2O in lessthan 0.5 h. Theâ-sheet is highly stable with most of theamide protons involved in interstrand H-bonding remainingunexchanged with D2O for more than 15 h. The helixencompassing residues 109-121 (R2) is also very stable,characterized by the fact that most amide protons were notbeing exchanged with solvent for more than 15 h. Theremaining two helices encompassing residues 133-139 andresidues 141-155 are less stable, with many amide protonsexchanged between 4 and 15 h. Most residues in the loopand turn regions exchange fast with solvent. Several residuesin loop regions, such as residues 85-87, have stable amideprotons. These residues are buried or partially buried in thestructure of UBC9.
DISCUSSION
Dimerization and the Effect on S2. Self-association inUBC9 has been suggested from15N T2
-1 measurements attwo different concentrations. This may be due to nonspecificaggregation at the concentration required for NMR studies,or due to specific self-interactions. Self-interactions of E2and interactions among E2 enzymes have been demonstratedand have been indicated to play important roles in theirfunctions. For example, it has been suggested that thefunctions of UBC3 (CDC34) depend on interactions withanother UBC3 or the DNA repair enzyme UBC2 (RAD6)(43). It was found that the turnover of yeast MatR2transcription factor is strongly correlated with the interactionof UBC6 and UBC7 (44). In addition, UBC7, UBC4, andUBC3 have been demonstrated to interact with themselvesin a specific manner (45, 46). Self-interaction and interactionsamong E2 enzymes may be one mechanism to regulatesubstrate specificity. Dimerization in UBC9 was not observedpreviously, since most biochemical approaches cannot detectweak interactions easily. Rotational diffusion anisotropy issensitive to weak self-associations.15N T1
-1 and T2-1
measurements have shown that UBC9 interacts weakly withitself under the conditions of our NMR study.
The generalized order parameterS2 of UBC9 is, onaverage, slightly higher than most proteins, particularly forresidues that are in secondary structural regions. Seventy-two out of the 107 residues haveS2 values greater than orequal to 0.90. Twenty-five residues haveS2 values between0.8 and 0.9. Ten residues haveS2 smaller than 0.8. Theoverall higherS2 is likely to result from partial dimerizationof UBC9 during NMR studies. It has been shown, in a
FIGURE 5: The structure of UBC9 is color-coded according to themodel-free parameters. (A) The structure is color-coded accordingto S2 values. Purple indicates residues that haveS2 < 0.7; pinkindicates residues that have 0.7< S2 < 0.85. Residues with 0.7<S2 < 0.85 are indicated with their amino acid sequence numbers.(B) The structure is color-coded withτe. Residues withτe > 700ps are indicated with pink and with their residue numbers. (C) Thestructure is color-coded withRex. Residues with 0< Rex < 4 s-1
are indicated with pink, and residues withRex > 4 s-1 are indicatedwith red and their residue numbers. In all three panels, gray indicatesresidues for which resonances are too overlapped in the1H-15NHSQC spectrum to permit accurate measurements of their intensi-ties. The side chain of active site Cys93 is shown in these figures.Four R-helices are labeled withR1-4.
1422 Biochemistry, Vol. 38, No. 5, 1999 Liu et al.
theoretical simulation, that when a molecule undergoesdimer-monomer equilibrium,S2 obtained by fitting relaxationdata may slightly exceed the actualS2, even when a systemcontains 10% dimer and 90% monomer (41). However, thesource of this error was not explained. We examined theeffect of using a single correlation time to represent themixture of monomer and dimer. If the exchange rate of themonomer-dimer equilibrium is faster than the relaxationrates but slower than that of the overall tumbling, the spectraldensity of the mixture of monomer and dimer is thepopulation-weighted average (47). Thus the average overallcorrelation time estimated fromT1
-1, which is dominatedby J(ωN), is a population-weighted average of 1/τ, that is,⟨1/τ⟩. However, the average correlation time estimated fromT2
-1 is a population-weighted average ofτ, that is,⟨τ⟩, sinceT2 is dominated byJ(0). Using a single correlation time tofit the model-free parameters for a system with monomer-dimer equilibrium provides an overall correlation time from(⟨τ⟩/⟨1/τ⟩)1/2. This overall correlation time is smaller than⟨τ⟩but larger than 1/⟨1/τ⟩. When this average correlation timeis used to fit model-free parameters,S2 needs to be increasedto compensate for the decrease inτ for the spectral density
FIGURE 6: Plots of reduced spectral density functions (a)J(0), (b) J(ωH), and (c)J(ωN) versus residue number.
FIGURE 7: The structure of UBC9 is color-coded with1H-2Hexchange rates. Residues that have lifetimes longer than 15 h areindicated in red, those have lifetimes between 4 and 15 h are shownin pink, those with lifetimes between 0.5 and 4 h are shown inyellow, and those with lifetimes too fast to be detected (<0.5 h)are shown in cyan. Gray indicates residues for which resonancesare too overlapped in the1H-15N HSQC spectrum to permit accuratemeasurements. The side chain of active site Cys93 is shown in thefigure. FourR-helices are labeled withR1-4.
Conformational Flexibility of E2 Biochemistry, Vol. 38, No. 5, 19991423
function J(0) and decrease of 1/τ for other spectral densityfunctions. Thus, theS2 obtained using a single rotationalcorrelation time for a protein udergoing monomer and dimerequilibrium will be slightly increased, but the trend inS2
should not be affected significantly.Conformational Flexibility.Both 15N-relaxation and amide
proton exchange studies suggest that the flexible regions ofhuman UBC9 are localized at the N- and C-termini. The tworegions are located at opposite sides of the active site Cys93.The central portion which contains theâ-sheet andR-helix2 is the most stable region, characterized by the slowestexchanging amide protons and the absence of internalmotions on the nanosecond to millisecond time scales. Thefirst and the last two helices are less stable with most of theamide protons exchanged in D2O within 15 h.
The residues undergoing large amplitude internal motionson the picosecond to nanosecond time scales are localizedaround two regions on the same face where the active siteCys93 residue is located. The first region is around theN-terminus. The N-terminal helix is the most flexiblesecondary structure in human UBC9. In particular, the first8 residues are highly mobile with lowS2 values, nanosecondτe values and fast exchanging amide protons. Three loops atresidues 35, 66, and 100 are close to the N-terminal helix inthe three-dimensional structure. In addition, residues 19 and20 which connect the first helix to theâ-sheet also havehigher flexibility (Figure 5A,B).
The second region of higher conformational flexibility islocated on the C-terminal side of Cys93 (Figure 5A,B). Thisregion consists of several surface loops, the C-terminal endof helix 2, and helix 3 including residues Leu81, Val86, Ser89,Leu97, Leu119, Gln126, Asp127and Ala129, Gln130, and Glu132.A difference in this region from the N-terminal flexibleregion is the substantial conformational exchange (Figure5C). In particular, one of the residues in this region, Glu132,has the largest chemical exchange term (13.8 s-1) in thewhole protein.
Residues undergoing conformational exchange surroundthe active site. Residues Gly55, Val86, Leu97, Leu119, Ala129,and Glu132 have the largest chemical exchange terms (>4s-1) and are in the vicinity of the active site Cys93 (Figure5C). Some residues in the vicinity, Leu81, Ser89, Gln126,Asp127, and Gln130, have higher than average flexibility onthe picosecond to nanosecond time scales. The side chainof residue Asp127 orients itself toward the ubiquitin acceptingsulfhydryl group. This residue may play a critical role inUBC9’s catalytic activity.
Substrate Binding.An E2 enzyme can recognize diversesubstrate proteins, although each E2 enzyme has its ownspecificity. Protein-protein recognition requires large num-bers of specific interactions including H-bonds, hydrophobicinteractions, and salt bridges. This is achieved, in some cases,through structurally complimentary surfaces between theinteracting partners. In other cases, one molecule is moreflexible and can be induced to fit the surface of the otherprotein. Since an E2 enzyme can recognize a wide range ofsubstrate proteins, adjustment of its conformation may berequired to fit a range of different contact surfaces. Thus,multiple conformations at the substrate binding site on E2should be accessible energetically, suggesting that thesubstrate binding site is likely to have higher conformationalflexibility.
Two regions of higher flexibility on UBC9 have beenidentified in this study. The region near the N-terminus isnot likely to be the substrate binding site. The N-terminusof ArabidopsisUBC1 has been shown to interact with E1-ubiquitin conjugate (28). Due to high sequence and functionalsimilarities, the N-terminus of UBC9 may also be involvedin interaction with the E1-UBL1 conjugate. The two loopsat residues 35 and 100, which are highly variable in theamino acid sequences and three-dimensional structuresbetween different E2 enzymes, are close to the N-terminalhelix. This spatial proximity suggests that they may beinvolved in recognition of E1-ubiquitin conjugate, but notsubstrate proteins. The structural variation of these two loopsmay be important for UBC9’s specificity to UBL1 (aubiquitin homologue) and/or E1 protein specific for UBL1and UBC9. The E1 homologue which activates a ubiquitin-like molecule for conjugation to UBC9 has recently beenidentified in yeast (15). Flexibility in this region may beresponsible for equilibrium binding of the E1-ubiquitinconjugate.
The second more flexible region may play an importantrole in substrate binding. This region is close to theC-terminus, which was shown to interact with substrateproteins in wheat UBC4 (48). The C-terminal helix also hasa positive electrostatic potential. Sequence analysis ofproteins which interact with UBC9 indicates that they mostlyhave a region of strong overall negative charge (24), whichcan be attracted to the electrostatic positive C-terminus ofUBC9. The second more flexible region forms a surfacewhich contains many hydrophobic residues. Hydrophobicinteractions may play important roles in interactions of UBC9with other proteins, as it was shown previously that theinteraction between UBC9 and theAdenoVirus E1A proteinis affected by a single Leu to Ile substitution on E1A. Sincethis region is also close to the active site Cys93, theconformational flexibility may also play critical roles in thecatalytic activity of transferring the C-terminus of ubiquitin(UBL1 for this system) to a Lys residue on a substrateprotein.
UBC9 is a relatively rigid molecule. None of the surfaceloops are flexible enough to allow large scale conformationalchanges. Substrate specificity and diversity are not likely tobe conferred solely by UBC9 itself. UBL-1, which ishomologous to ubiquitin and specific to UBC9, may par-ticipate in recognizing the specific substrate proteins. Thussubstrate specificity in E2 enzymes may not only dependon structural variations in E2 enzyme, but also depend ondifferent ubiquitin-like proteins which conjugate to differentE2 enzymes. UBL-1 may also have regions that are highlyflexible in the three-dimensional structure which can beadjusted to fit different substrate proteins upon binding. SinceUBC9 belongs to class I E2 molecules which lack theC-terminal extension in the amino acid sequence, an E3protein may also be involved in substrate binding, althoughthe E3 protein related to UBC9 has not been found and it isnot clear whether an E3 is required in this system.
In conclusion, we have identified two regions in humanUBC9 which show higher mobility over a wide range oftime scales than other regions of the protein. Combined withprevious biochemical studies, both regions are likely to beimportant for protein-protein recognition in the ubiquitinpathway. The region near the N-terminus may be important
1424 Biochemistry, Vol. 38, No. 5, 1999 Liu et al.
for interactions with E1-ubiquitin conjugate. The region nearthe C-terminus, which is the most flexible on microsecondto millisecond time scales, may be important for substratebinding and catalytic activity. It is likely that the substratebinding site on E2 is close to the catalytic active site, sincethe C-terminus of a ubiquitin or ubiquitin-like protein needsto be transferred from E2 to substrate proteins. Since E2enzymes share high homology in primary sequences andthree-dimensional structures, the conformational flexibilityof UBC9 may represent a general feature of E2 enzymes.This study should provide a new perspective for furtherstudies of protein-protein recognition in ubiquitination.
ACKNOWLEDGMENT
We thank Dr. Arthur G. Palmer, III for the computerprograms used to analyze the relaxation data and for helpfuldiscussions. We also thank Drs. Benoit Boulat, DavidFushman, Xiubei Liao, Zhiyuan Shen, and Martin J. Stonefor helpful discussions.
REFERENCES
1. Jentsch, S. (1992)Annu. ReV. Genet. 26, 179-207.2. Hass, A. L., and Siepmann (1997)FASEB J. 11, 1257-1268.3. Varshavsky, A. (1997)Trends Biochem. Sci. 22, 383-387.4. Seufert, W., Futcher, B., and Jentsch, S. (1995)Nature 373,
78-81.5. Barinaga, M. (1995)Science 269, 631-632.6. Pagano, M., Tam, S. W., Theodoras, A. M., Beer-Romero,
P., Del Sal, G., Chau, V., Yew, P. R., Graetta, G. F., and Rolfe,M. (1995)Science 269, 682-685.
7. Haas, A. L., Baboshina, O., Williams, B., and Schwartz, L.M. (1995)J. Biol. Chem. 270, 9407-9412.
8. Wiebel, F. F., and Kunau, W. H. (1992)Nature 359, 73-76.9. Finley, D. and Chau, V. (1991)Annu. ReV. Cell Biol. 7, 25-
69.10. Sommer, T., and Jentsch, S. (1993)Nature 365, 176-179.11. Saitoh, H., Pu, R. T., and Dasso, M. (1997)Trends Biochem.
Sci. 22, 374-376.12. Haas, A. L., Ahrens, P., Bright, P. M., and Ankel, H. (1987)
J. Biol. Chem. 262, 11315-11323.13. Kumar, S., Yoshida, Y., and Noda, M. (1993)Biochem.
Biophys. Res. Commun. 195, 393-399.14. Caliis, J., Carpenter, T., Sun, C. W., and Viestra, R. D. (1995)
Genetics 139,921-939.15. Johnson, E. S., Schwienhorst, I., Dohmen, R. J., and Blobel,
G. (1997)EMBO J. 16, 5509-5519.16. Seufert, W., and Jentsch, S. (1990)EMBO J. 9, 543-550.17. Seufert, W., McGrath, J. P., and Jentsch, S. (1990)EMBO J.
9, 4535-4541.18. Shen, Z., Pardington-Purtymun, P. E., Comeaux, J. C., Moyzis,
R. K., and Chen, D. J. (1996)Genomics 37, 183-186.19. Al-Khodairy, F., Enoch, T., Hagan, I. M., and Carr, A. (1995)
Am. J. Cell Sci. 108, 475-486.20. Gottlicher, M., Heck, S., Doucas, B., Wade, E., Kullmann,
M., Cato, A. C. B., Evans, R. M., and Herrlich, P. (1996)Steroids 61, 257-262.
21. Wang, Z. Y., Qui, Q. Q., Seufert, W., Taguchi, T., Testa, J.R., Whitmore, S. A., Callen, D. F., Welsh, W., Shenk, T., and
Deuel, T. G. (1996)J. Biol. Chem. 271, 24811-24816.22. Yasugi, T., and Howley, P. (1996)Nucleic Acids Res. 24,
2005-2010.23. Hateboer, G., Hijmans, E. M., Nooij, J. B. D., Schlenker, S.,
Jentsch, S., and Bernards, R. (1996)J. Biol. Chem. 271,25906-25911.
24. Tong, H., Hateboer, G., Perrakis, A., Bernards, R., and Sixma,T. K. (1997)J. Biol. Chem. 272, 21381-21387.
25. Cook, W. J., Jeffrey, L. C., Sullivan, M. L., and Vierstra, R.D. (1992)J. Biol. Chem. 267, 15116-15121.
26. Cook, W. J., Jeffrey, L. C., Xu, Y., and Chau, V. (1993)Biochemistry 32, 13809-13817.
27. Cook, W. J., Martin, P. D., Edwards, B. F. P., Yamazaki, R.K., and Chau, V. (1997)Biochemistry 36, 1621-1627.
28. Sullivan, M. L., and Vierstra, R. D. (1991)J. Biol. Chem. 266,23878-23885.
29. Dayie, K. T., Wagner, G., and Lefe`vre, J. F. (1996)Annu.ReV. Phys. Chem. 47, 243-282.
30. Englander, J. J., Englander, S. W., Louie, G., Roder, H., Tran,T., and Wand, A. J. (1988)Protein hydrogen exchange,dynamics, and energetics. in Structure & Expression, Volume1: From Proteins to Ribosomes(Sarma, R. H., and Sarma,M. H., Eds.), pp 107-117.
31. Liu, Q., Shen, B. H., Chen, D. J., and Chen, Y. (1998)J.Biomol. NMR(in press).
32. Farrow, N. A., Muhandiram, R., Singer, A. U., Pascal, S. M.,Kay, C. M., Gish, G., Shoelson, S. E., Pawson, T., Forman-Kay, J. D., and Kay, L. E. (1994)Biochemistry 33, 5984-6003.
33. Jones, J. A. (1997)J. Magn. Reson. 126, 282-286.34. Abragam, A. (1961)Principles of Nuclear Magnetism, Clar-
endon Press, Oxford, U.K.35. Clore, G. M., Szabo, A., Bax, A., Kay, L. E., Driscoll, P. C.,
and Gronenborn, A. M. (1990)J. Am. Chem. Soc. 112, 4989.36. Lipari, G., and Szabo, A. (1992)J. Am. Chem. Soc. 114, 4546-
4559; 4559-4570.37. Mandel, A. M., Akke, M., and Palmer, A. G. (1994)J. Mol.
Biol. 246, 144-163.38. Bruschweiler, R., Liao, X., and Wright, P. E. (1995)Science
268, 886-889.39. Tjandra, N., Feller, S. E., Pastor, R. W., and Bax, A. (1995)
J. Am. Chem. Soc. 117, 12562-12566.40. Zheng, Z., Czaplicki, J., and Jardetzky, O. (1995)Biochemistry
34, 5212-5223.41. Schurr, J. M., Babcock, H. P., and Fujimoto, B. S. (1994)J.
Magn. Reson., Ser. B 105, 211-224.42. Woessner, D. E. (1962)J. Chem. Phys. 37, 647-654.43. Silver, E. T., Gwozd, T. J., Ptak, C., Goebl, M., and Ellison,
M. I. (1992) EMBO J. 11, 3091-3098.44. Chen, P., Johnson, P., Sommer, T., Jentsch, S., and Hoch-
strasser, M. (1993)Cell 74, 357-369.45. Ptak, C., Prendergast, J. A., Hodgins, R., Kay, C. M., Chau,
V., and Ellison, M. J. (1994)J. Biol. Chem. 269, 26539-26545.
46. Gwozd, C. S., Arnason, T. G., Cook, W. J., Chau, V., andEllison, M. J. (1995)Biochemistry 34, 6296-6302.
47. Wennerstro¨m, H. (1972)Mol. Phys. 24, 69-80.48. Prendergast, J. A., Ptak, C., Arnason, T. G., and Ellison, M.
J. (1993)J. Biol. Chem. 270, 9347-9352.
BI981840H
Conformational Flexibility of E2 Biochemistry, Vol. 38, No. 5, 19991425