conference on green tech for smes in palm oil & palm ... trunks ffb plantation oil palm mill...
TRANSCRIPT
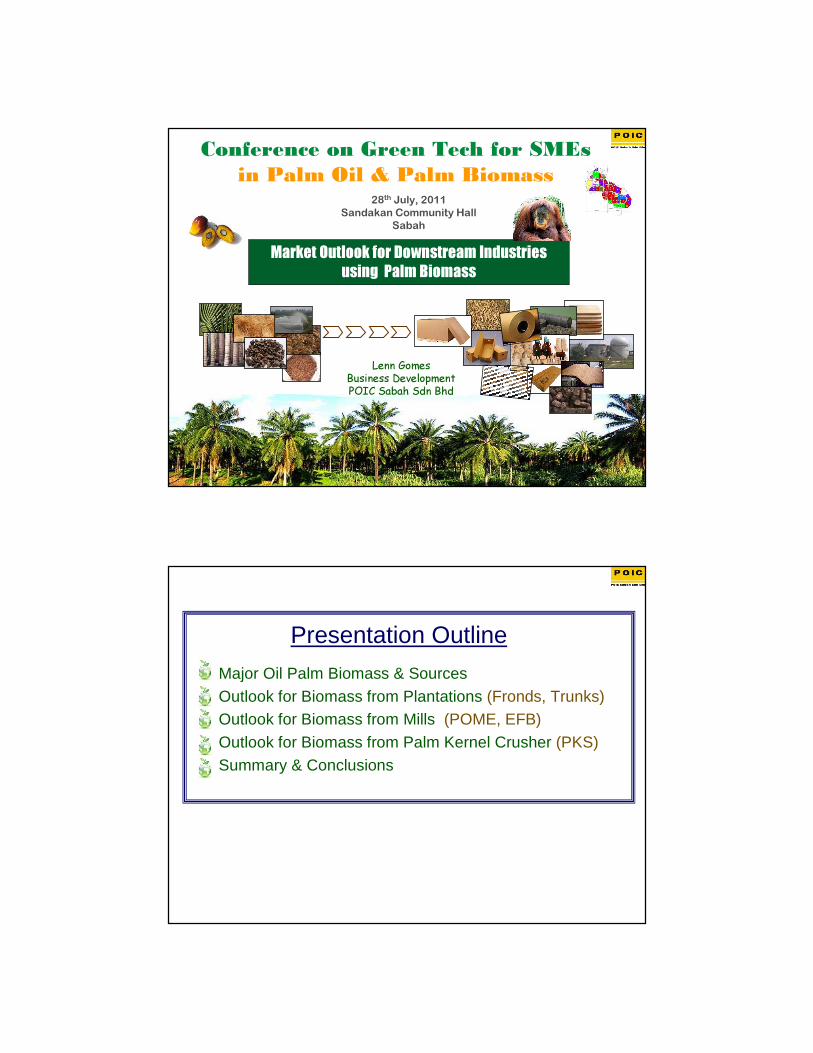
Conference on Green Tech for SMEs
in Palm Oil & Palm Biomass
Lenn Gomes Business Development POIC Sabah Sdn Bhd
Market Outlook for Downstream Industries
using Palm Biomass
28th July, 2011
Sandakan Community Hall
Sabah
Presentation Outline
• Major Oil Palm Biomass & Sources• Outlook for Biomass from Plantations (Fronds, Trunks)• Outlook for Biomass from Mills (POME, EFB)• Outlook for Biomass from Palm Kernel Crusher (PKS)• Summary & Conclusions
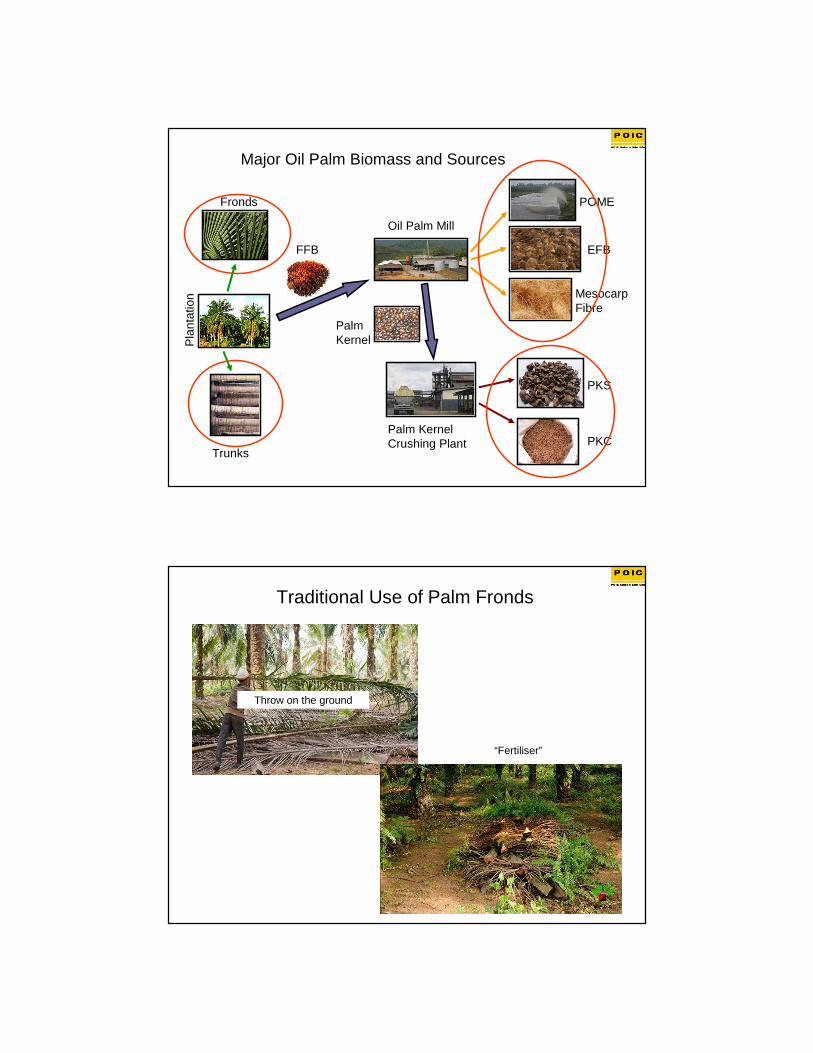
Fronds
Trunks
FFB
Pla
ntat
ion
Oil Palm Mill
Palm Kernel
Palm Kernel Crushing Plant
POME
EFB
PKS
PKC
Mesocarp Fibre
Major Oil Palm Biomass and Sources
Traditional Use of Palm Fronds
Throw on the ground
“Fertiliser”
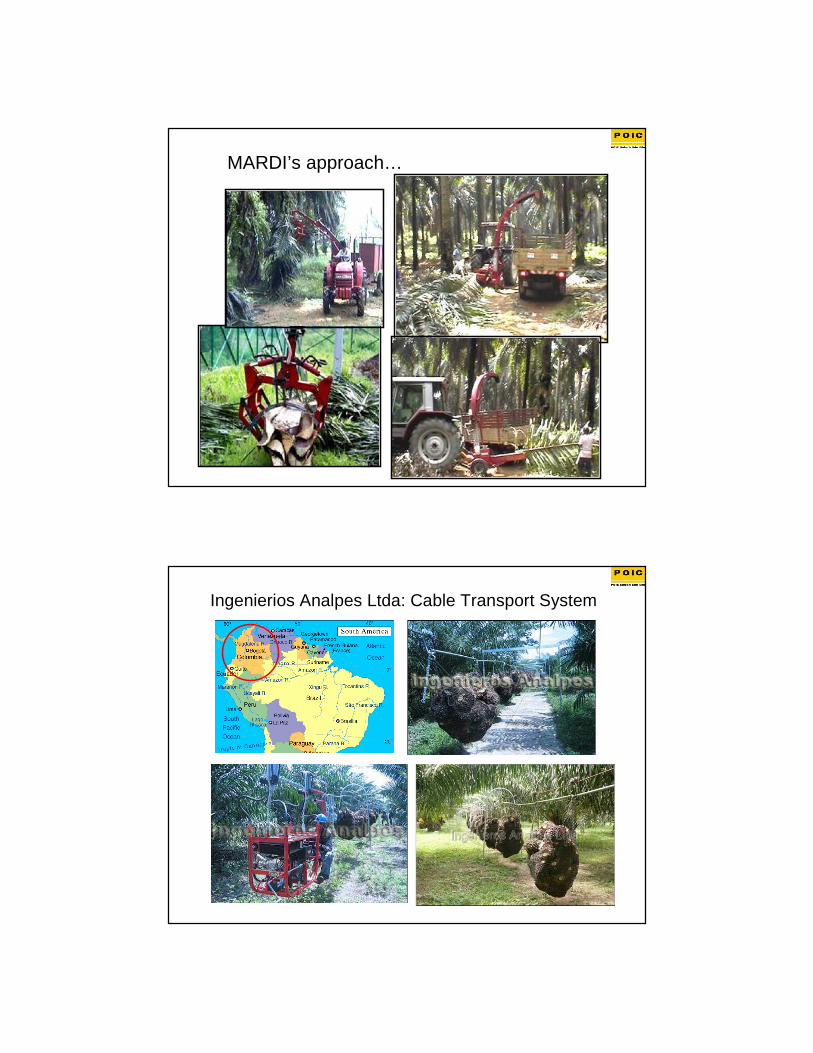
MARDI’s approach…
Ingenierios Analpes Ltda: Cable Transport System
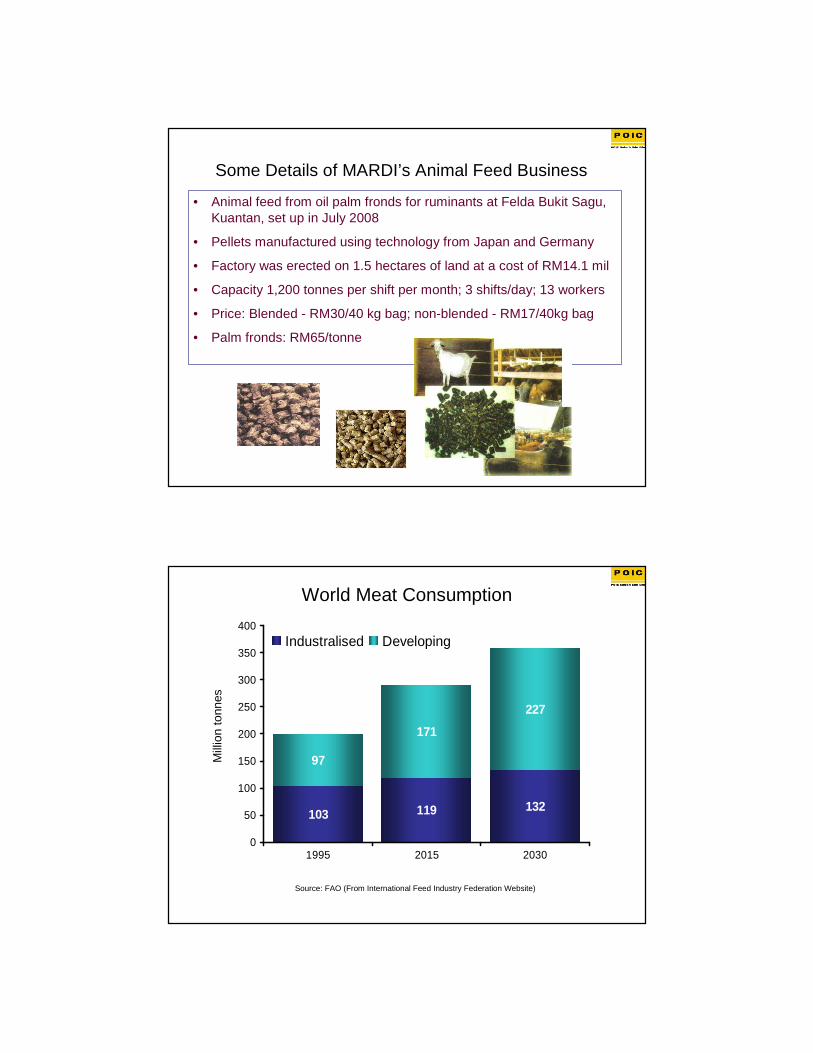
Some Details of MARDI’s Animal Feed Business
• Animal feed from oil palm fronds for ruminants at Felda Bukit Sagu, Kuantan, set up in July 2008
• Pellets manufactured using technology from Japan and Germany
• Factory was erected on 1.5 hectares of land at a cost of RM14.1 mil
• Capacity 1,200 tonnes per shift per month; 3 shifts/day; 13 workers
• Price: Blended - RM30/40 kg bag; non-blended - RM17/40kg bag
• Palm fronds: RM65/tonne
World Meat Consumption
103 119 132
97
171
227
0
50
100
150
200
250
300
350
400
1995 2015 2030
Industralised Developing
Mill
ion
tonn
es
Source: FAO (From International Feed Industry Federation Website)

Global Meat Market Demand Growth
450
400
350
300
250
200
150
100
50
1980 1990 2000 2010 2020 2030
+ 32%
+ 33%
+ 24%
+ 19%
+ 16%
Source: Kennes (Rabobank), 2010
World Grain Consumption
0.0
0.3
0.6
0.9
1.2
1.5
Food Animal Feed & Other Uses
B il l io n T o n n e s
60 %45 %
Billion TonnesBillion Tonnes 1965 1996 2030F
Source: FAO
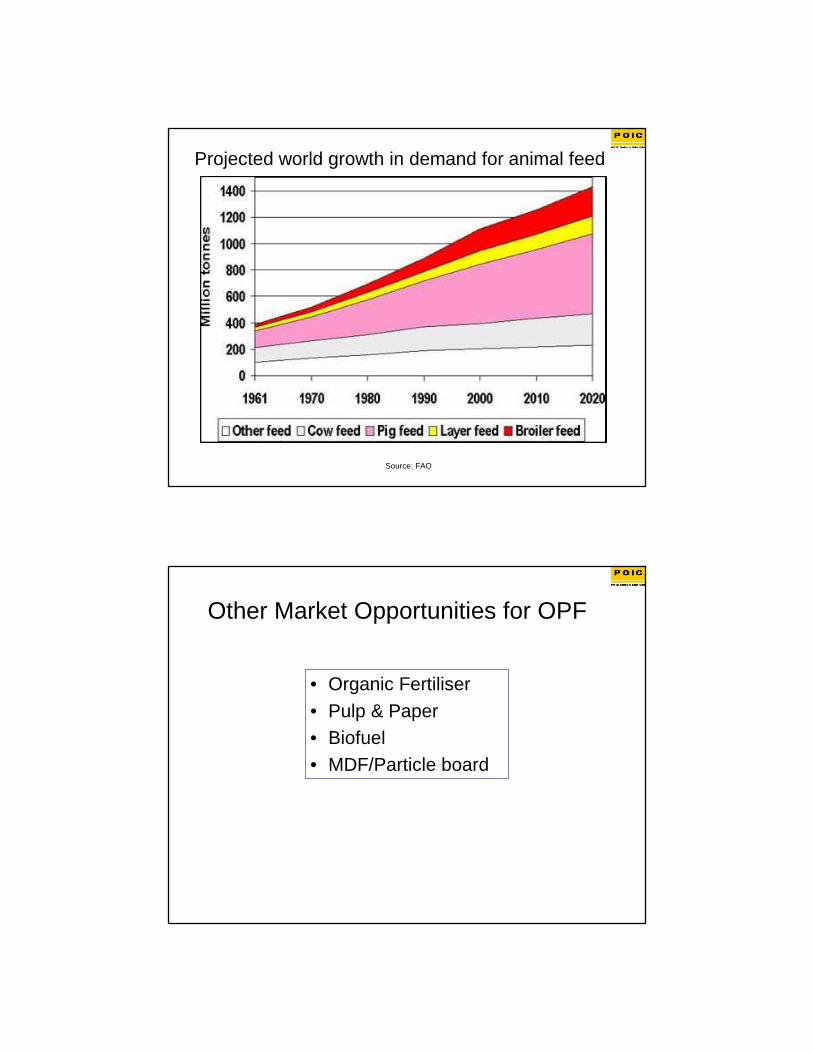
Projected world growth in demand for animal feed
Source: FAO
Other Market Opportunities for OPF
• Organic Fertiliser• Pulp & Paper• Biofuel• MDF/Particle board
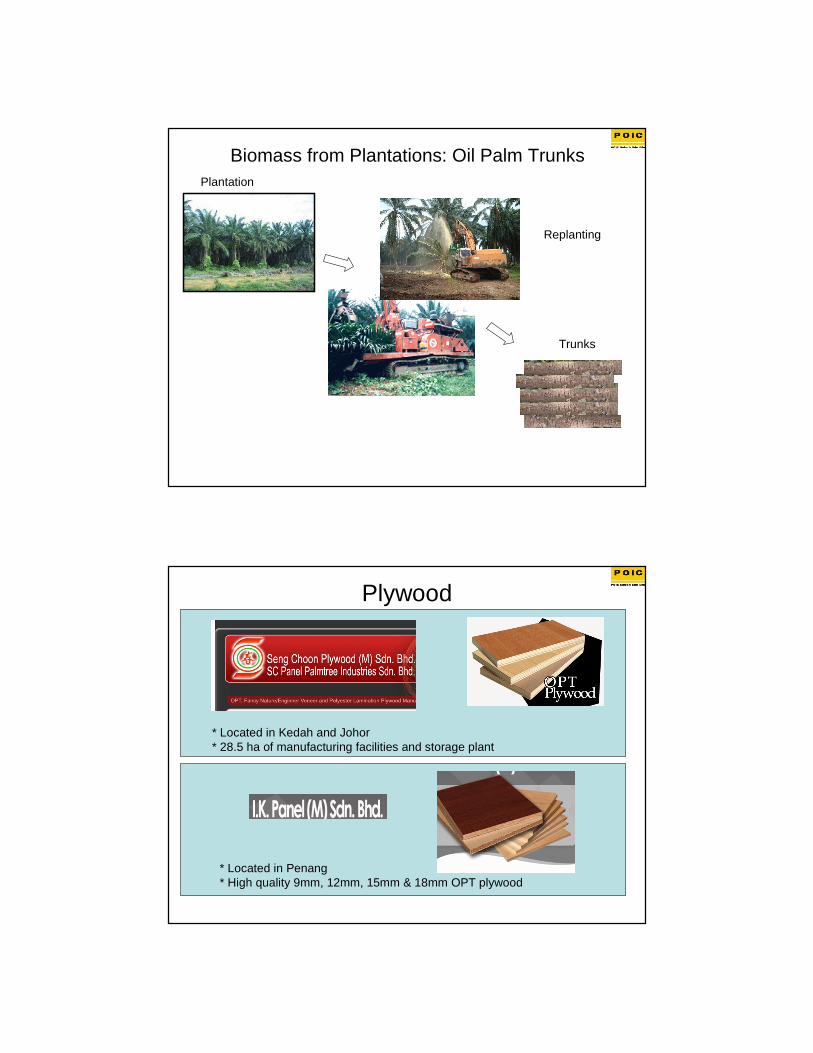
Biomass from Plantations: Oil Palm TrunksPlantation
Trunks
Replanting
Plywood
* Located in Kedah and Johor* 28.5 ha of manufacturing facilities and storage plant
* Located in Penang* High quality 9mm, 12mm, 15mm & 18mm OPT plywood

Engineered Lumber
Engineered Lumber Applications
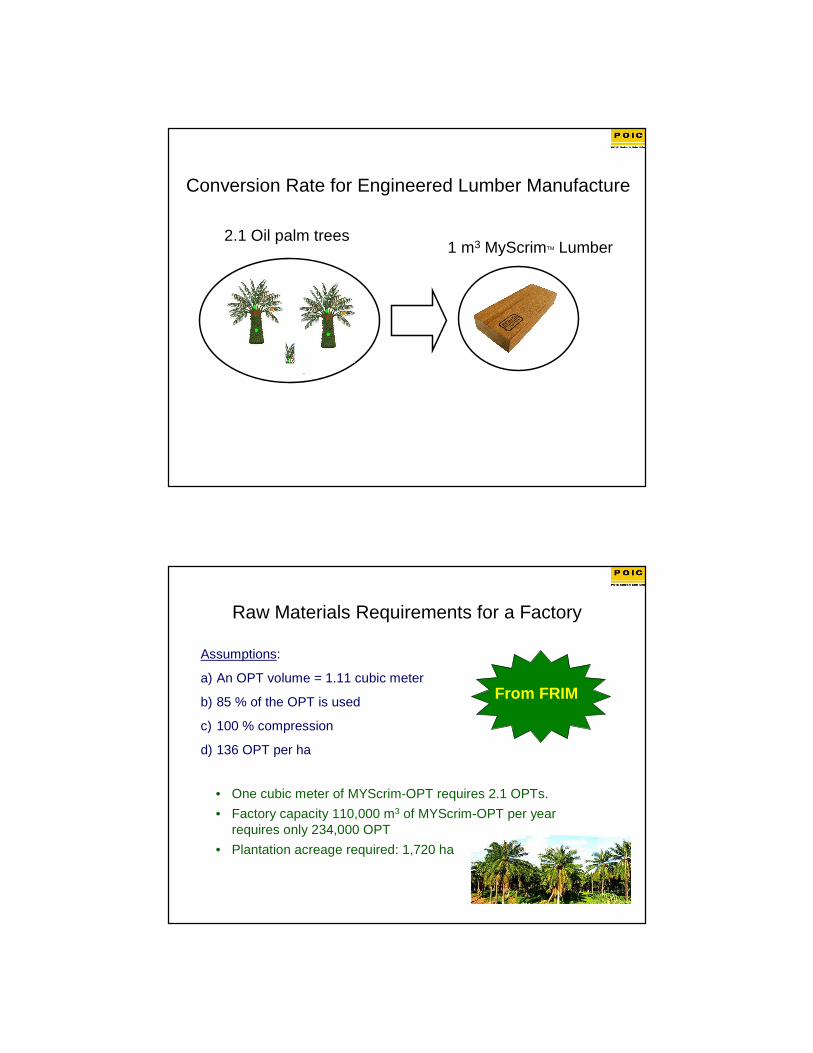
Conversion Rate for Engineered Lumber Manufacture
2.1 Oil palm trees1 m3 MyScrimTM Lumber
Raw Materials Requirements for a Factory
Assumptions:
a) An OPT volume = 1.11 cubic meter
b) 85 % of the OPT is used
c) 100 % compression
d) 136 OPT per ha
From FRIM
• One cubic meter of MYScrim-OPT requires 2.1 OPTs.
• Factory capacity 110,000 m3 of MYScrim-OPT per year requires only 234,000 OPT
• Plantation acreage required: 1,720 ha
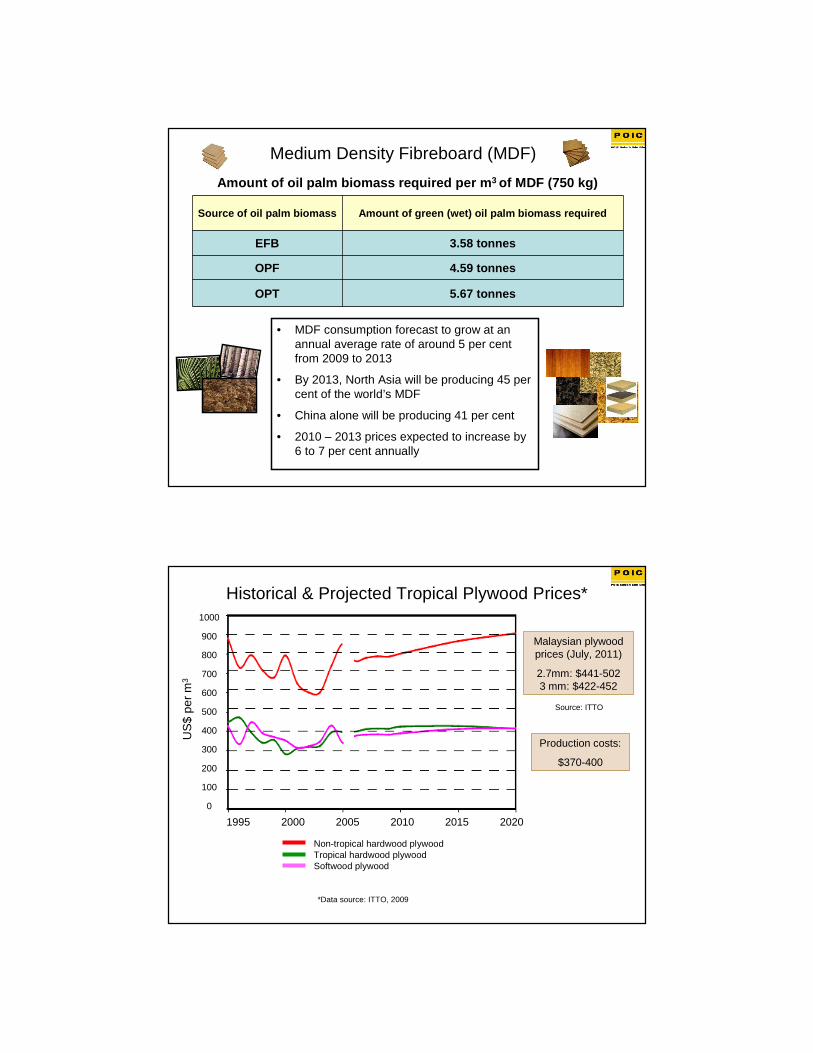
Medium Density Fibreboard (MDF)
Amount of oil palm biomass required per m 3 of MDF (750 kg)
Source of oil palm biomass Amount of green (wet) oil palm biomass required
EFB 3.58 tonnes
OPF 4.59 tonnes
OPT 5.67 tonnes
• MDF consumption forecast to grow at an annual average rate of around 5 per cent from 2009 to 2013
• By 2013, North Asia will be producing 45 per cent of the world’s MDF
• China alone will be producing 41 per cent
• 2010 – 2013 prices expected to increase by 6 to 7 per cent annually
Historical & Projected Tropical Plywood Prices*1000
900
800
700
600
500
400
300
200
100
0
1995 2000 2005 2010 2015 2020
*Data source: ITTO, 2009
Non-tropical hardwood plywoodTropical hardwood plywoodSoftwood plywood
US
$ pe
r m
3
Malaysian plywood prices (July, 2011)
2.7mm: $441-5023 mm: $422-452
Production costs:
$370-400
Source: ITTO
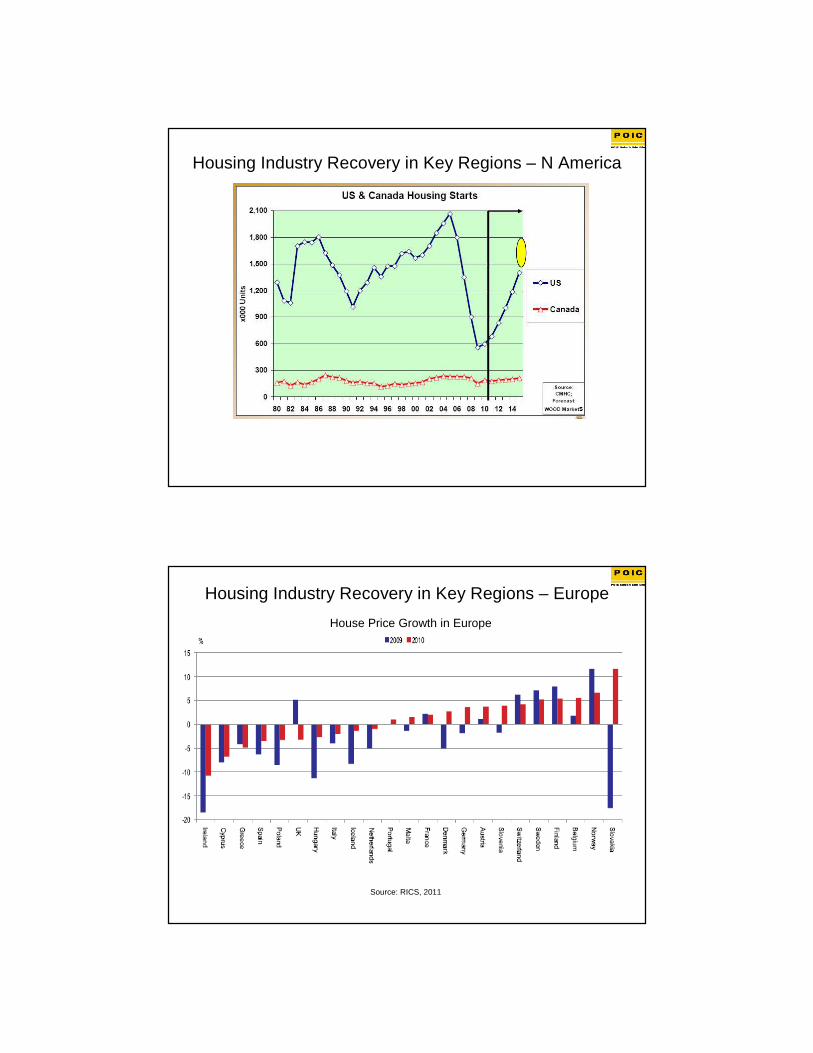
Housing Industry Recovery in Key Regions – N America
House Price Growth in Europe
Source: RICS, 2011
Housing Industry Recovery in Key Regions – Europe

Asia-Pacific Demand Trends
1980 1985 1990 1995 2000 2005 2010 2015 2020 2025 2030
2000
1800
1600
1400
1200
1000
800
600
400
200
0
Paper & paperboardWood pulpParticleboard & fibreboardSawnwood & plywoodOther industrial roundwood
Mill
ion
m3
Source: FAO, 2009
Biomass From Mills: POME, EFB, Mesocarp Fibre
POME
EFB
Mesocarp Fibre
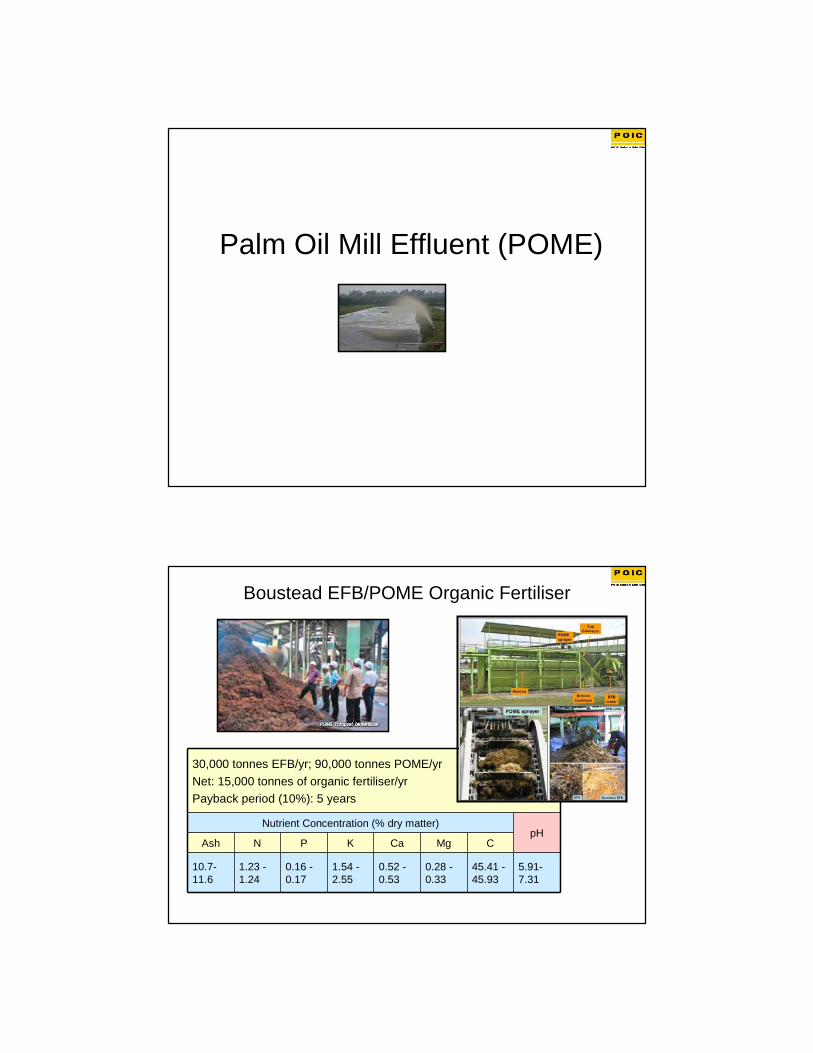
Palm Oil Mill Effluent (POME)
Boustead EFB/POME Organic Fertiliser
30,000 tonnes EFB/yr; 90,000 tonnes POME/yr
Net: 15,000 tonnes of organic fertiliser/yrPayback period (10%): 5 years
Nutrient Concentration (% dry matter)pH
Ash N P K Ca Mg C
10.7-11.6
1.23 -1.24
0.16 -0.17
1.54 -2.55
0.52 -0.53
0.28 -0.33
45.41 -45.93
5.91-7.31
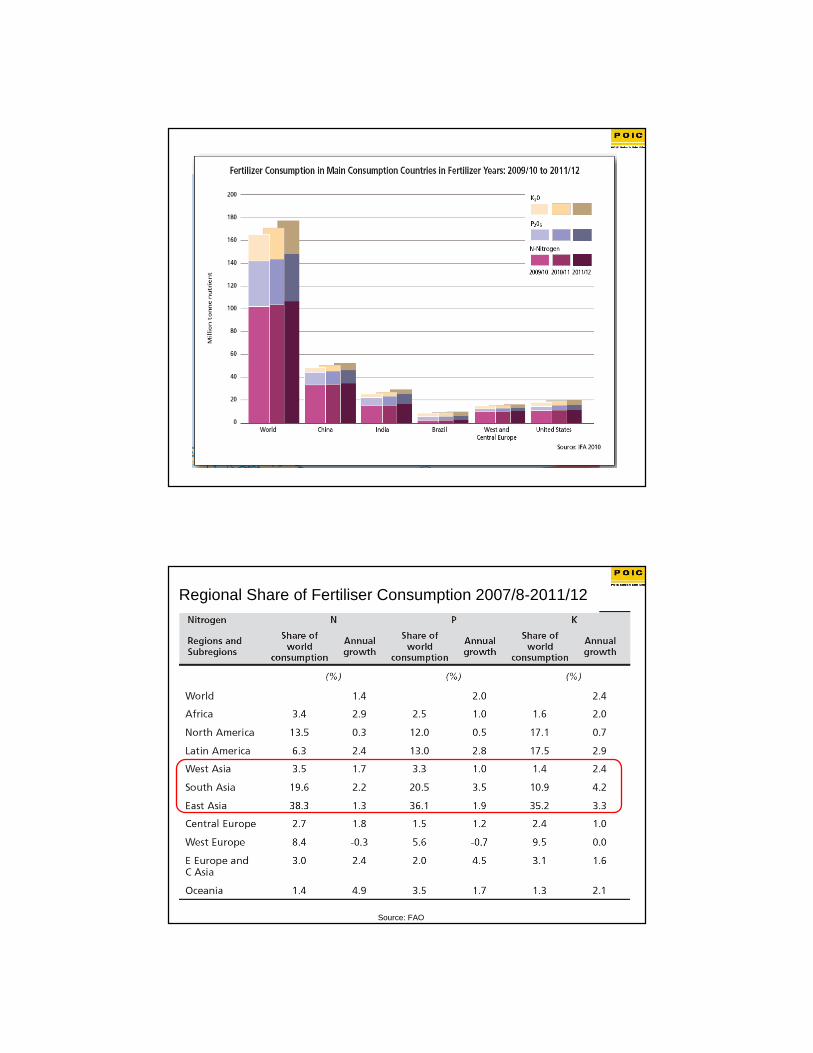
Regional Share of Fertiliser Consumption 2007/8-2011/12
Source: FAO
Region N,P,K 2007/08 2008/09 2009/10 2010/11 2011/12
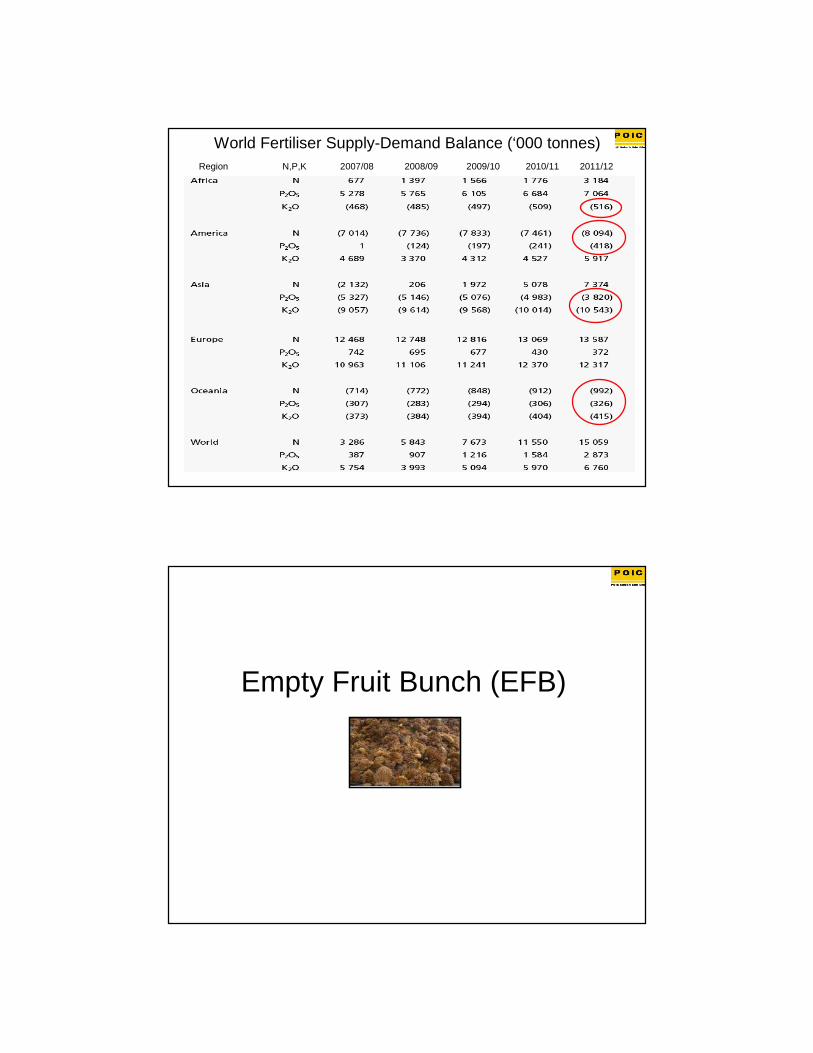
World Fertiliser Supply-Demand Balance (‘000 tonnes)
Empty Fruit Bunch (EFB)
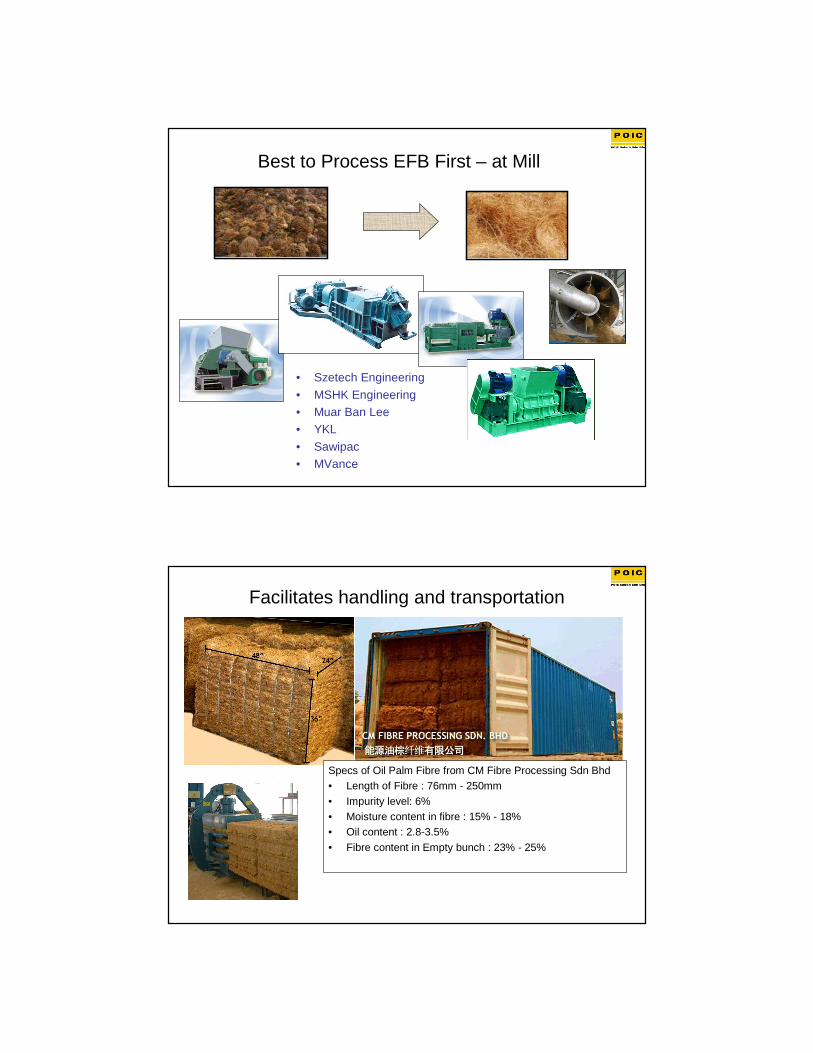
Best to Process EFB First – at Mill
• Szetech Engineering
• MSHK Engineering• Muar Ban Lee• YKL
• Sawipac• MVance
Facilitates handling and transportation
Specs of Oil Palm Fibre from CM Fibre Processing Sdn Bhd• Length of Fibre : 76mm - 250mm
• Impurity level: 6% • Moisture content in fibre : 15% - 18%• Oil content : 2.8-3.5%
• Fibre content in Empty bunch : 23% - 25%
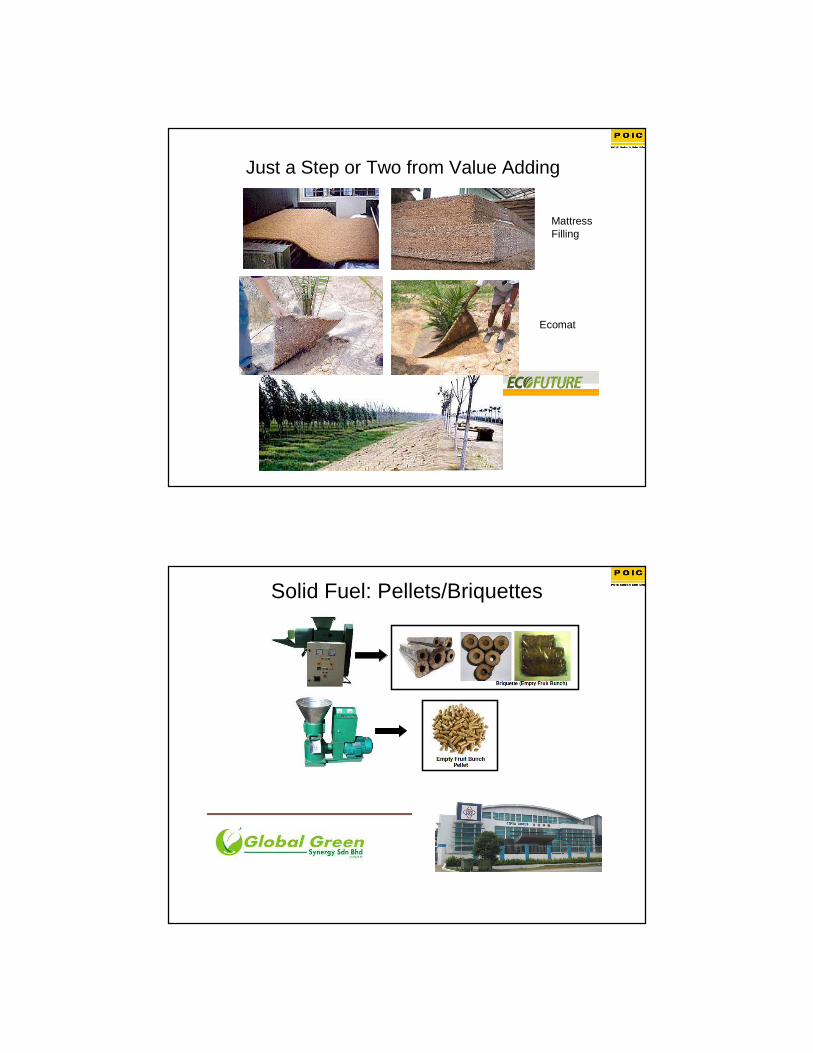
Just a Step or Two from Value Adding
Mattress Filling
Ecomat
Solid Fuel: Pellets/Briquettes
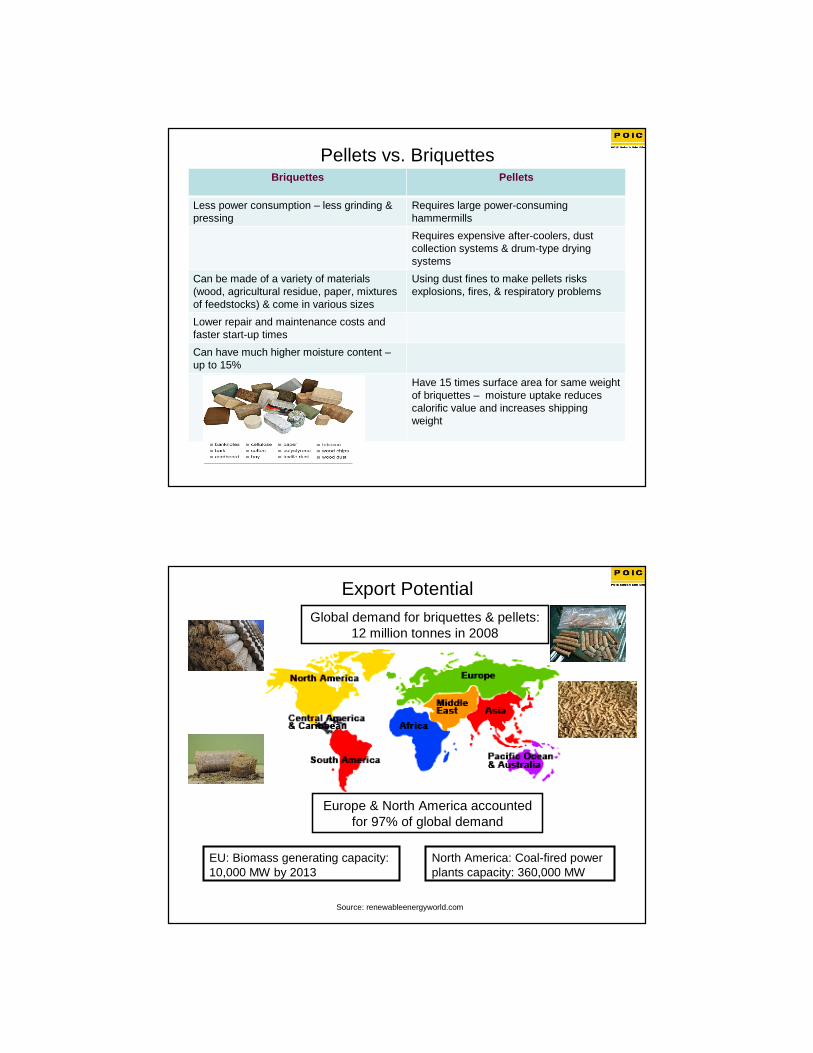
Pellets vs. BriquettesBriquettes Pellets
Less power consumption – less grinding & pressing
Requires large power-consuming hammermills
Requires expensive after-coolers, dust collection systems & drum-type drying systems
Can be made of a variety of materials (wood, agricultural residue, paper, mixtures of feedstocks) & come in various sizes
Using dust fines to make pellets risks explosions, fires, & respiratory problems
Lower repair and maintenance costs and faster start-up times
Can have much higher moisture content –up to 15%
Have 15 times surface area for same weight of briquettes – moisture uptake reduces calorific value and increases shipping weight
Export Potential
Source: renewableenergyworld.com
Europe & North America accounted for 97% of global demand
Global demand for briquettes & pellets: 12 million tonnes in 2008
EU: Biomass generating capacity: 10,000 MW by 2013
North America: Coal-fired power plants capacity: 360,000 MW
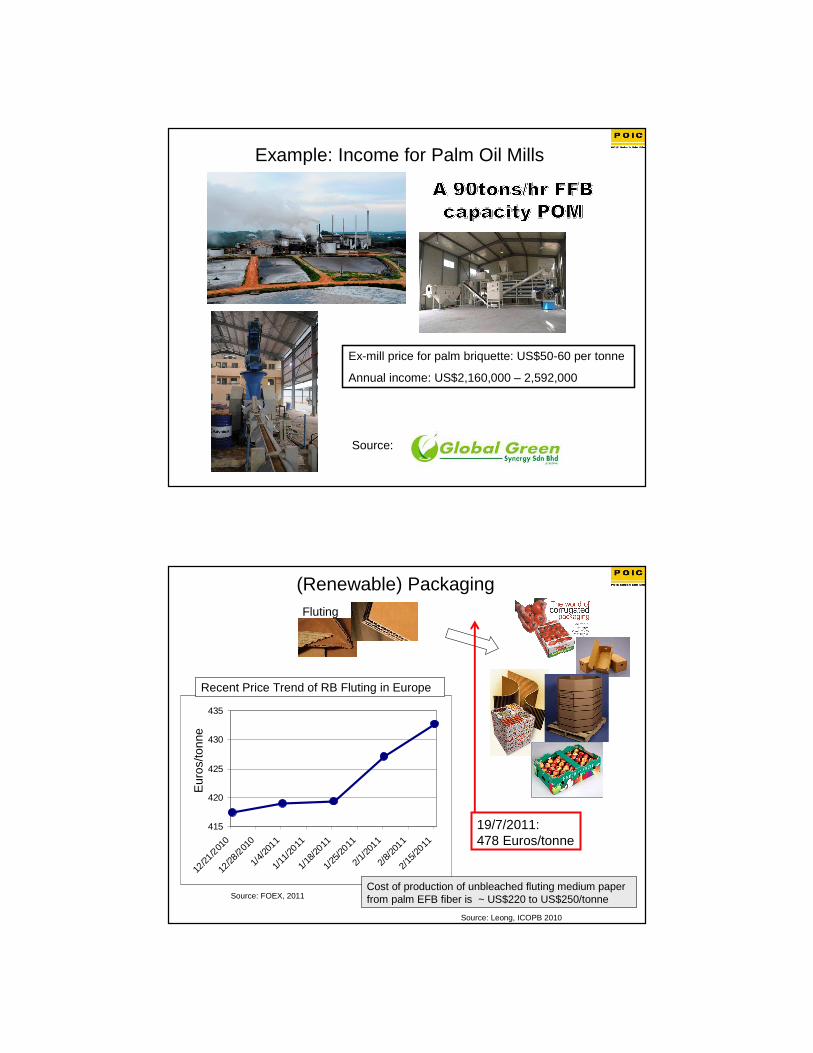
Example: Income for Palm Oil Mills
Ex-mill price for palm briquette: US$50-60 per tonne
Annual income: US$2,160,000 – 2,592,000
Source:
(Renewable) PackagingFluting
415
420
425
430
435
12/21
/201
0
12/28
/201
0
1/4/
2011
1/11
/2011
1/18
/2011
1/25
/2011
2/1/
2011
2/8/
2011
2/15
/2011
Recent Price Trend of RB Fluting in Europe
Eur
os/to
nne
Source: FOEX, 2011Cost of production of unbleached fluting medium paper from palm EFB fiber is ~ US$220 to US$250/tonne
Source: Leong, ICOPB 2010
19/7/2011: 478 Euros/tonne
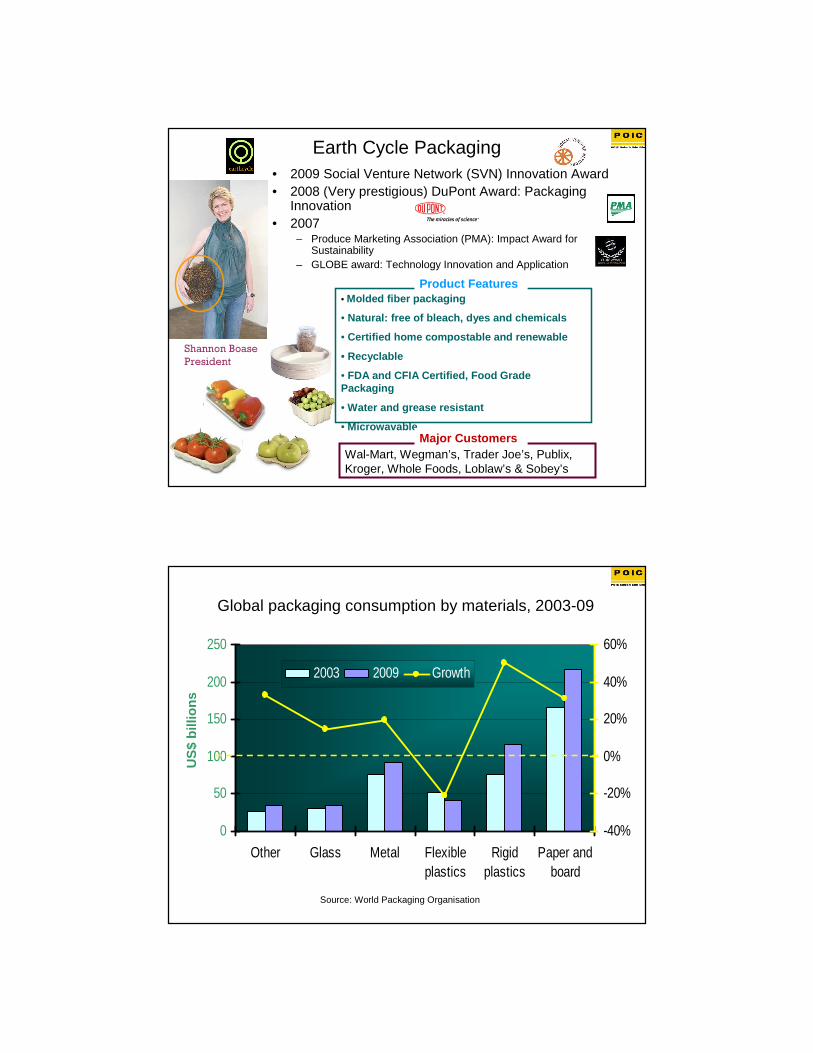
• 2009 Social Venture Network (SVN) Innovation Award• 2008 (Very prestigious) DuPont Award: Packaging
Innovation• 2007
– Produce Marketing Association (PMA): Impact Award for Sustainability
– GLOBE award: Technology Innovation and Application
Earth Cycle Packaging
Shannon Boase
President
• Molded fiber packaging
• Natural: free of bleach, dyes and chemicals
• Certified home compostable and renewable
• Recyclable
• FDA and CFIA Certified, Food Grade Packaging
• Water and grease resistant
• Microwavable
Wal-Mart, Wegman’s, Trader Joe’s, Publix, Kroger, Whole Foods, Loblaw’s & Sobey’s
Product Features
Major Customers
Global packaging consumption by materials, 2003-09
0
50
100
150
200
250
Other Glass Metal Flexibleplastics
Rigidplastics
Paper andboard
-40%
-20%
0%
20%
40%
60%
2003 2009 Growth
US
$ bi
llion
s
Source: World Packaging Organisation
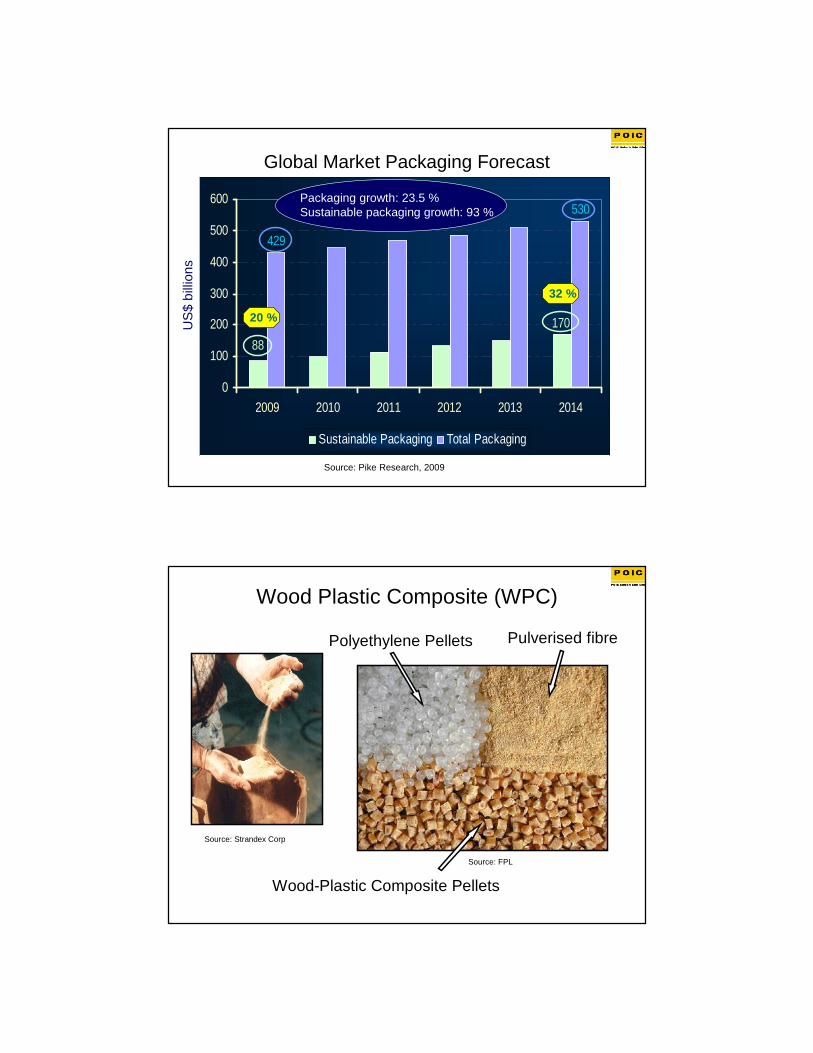
Global Market Packaging Forecast
88
170
429
530
0
100
200
300
400
500
600
2009 2010 2011 2012 2013 2014
Sustainable Packaging Total Packaging
US
$ bi
llion
s
Source: Pike Research, 2009
Packaging growth: 23.5 % Sustainable packaging growth: 93 %
20 %
32 %
Wood Plastic Composite (WPC)
Polyethylene Pellets Pulverised fibre
Wood-Plastic Composite Pellets
Source: FPL
Source: Strandex Corp

Examples of WPC Products
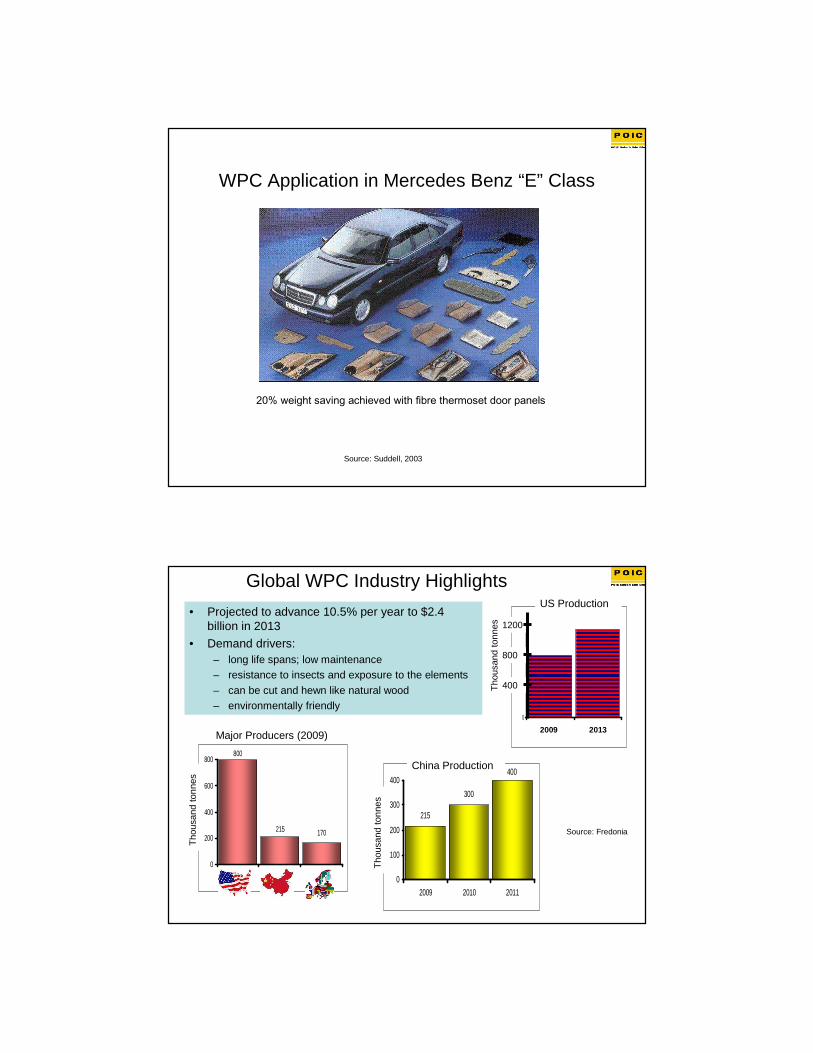
WPC Application in Mercedes Benz “E” Class
20% weight saving achieved with fibre thermoset door panels
Source: Suddell, 2003
Global WPC Industry Highlights
• Projected to advance 10.5% per year to $2.4 billion in 2013
• Demand drivers:– long life spans; low maintenance– resistance to insects and exposure to the elements
– can be cut and hewn like natural wood– environmentally friendly
170215
800
0
200
400
600
800
USA China Europe
215
300
400
0
100
200
300
400
2009 2010 2011
Major Producers (2009)
Tho
usan
d to
nnes
China Production
Tho
usan
d to
nnes
0
400
800
1200
2009 2013
1200
800
400
2009 2013
US Production
Tho
usan
d to
nnes
Source: Fredonia

* SPF (Spruce-Pine-Fir)
US W-SPF* & Composite Lumber Price Forecast
1 Mbf (thousand board feet) ~ 2.4 m3
Biomass From Palm Kernel Shell (PKS)
Oil Palm Mill
Palm Kernel
Palm Kernel Crushing Plant
PKS
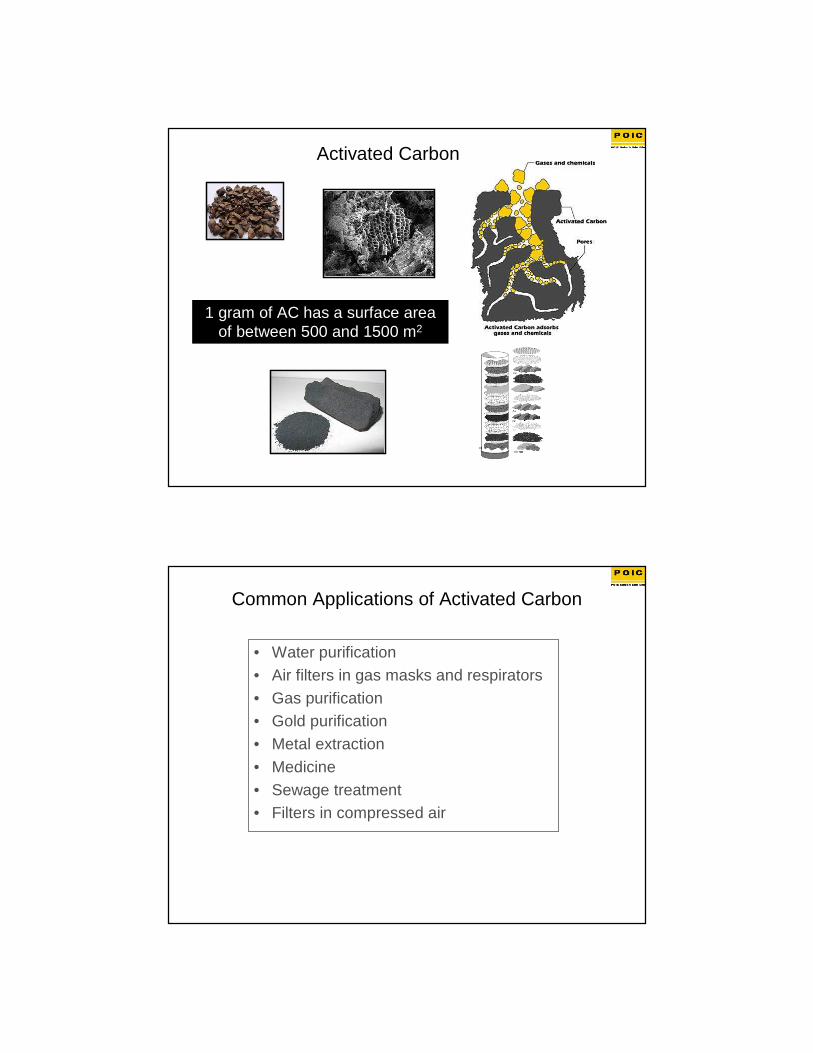
1 gram of AC has a surface area of between 500 and 1500 m2
Activated Carbon
Common Applications of Activated Carbon
• Water purification• Air filters in gas masks and respirators• Gas purification• Gold purification• Metal extraction• Medicine• Sewage treatment• Filters in compressed air
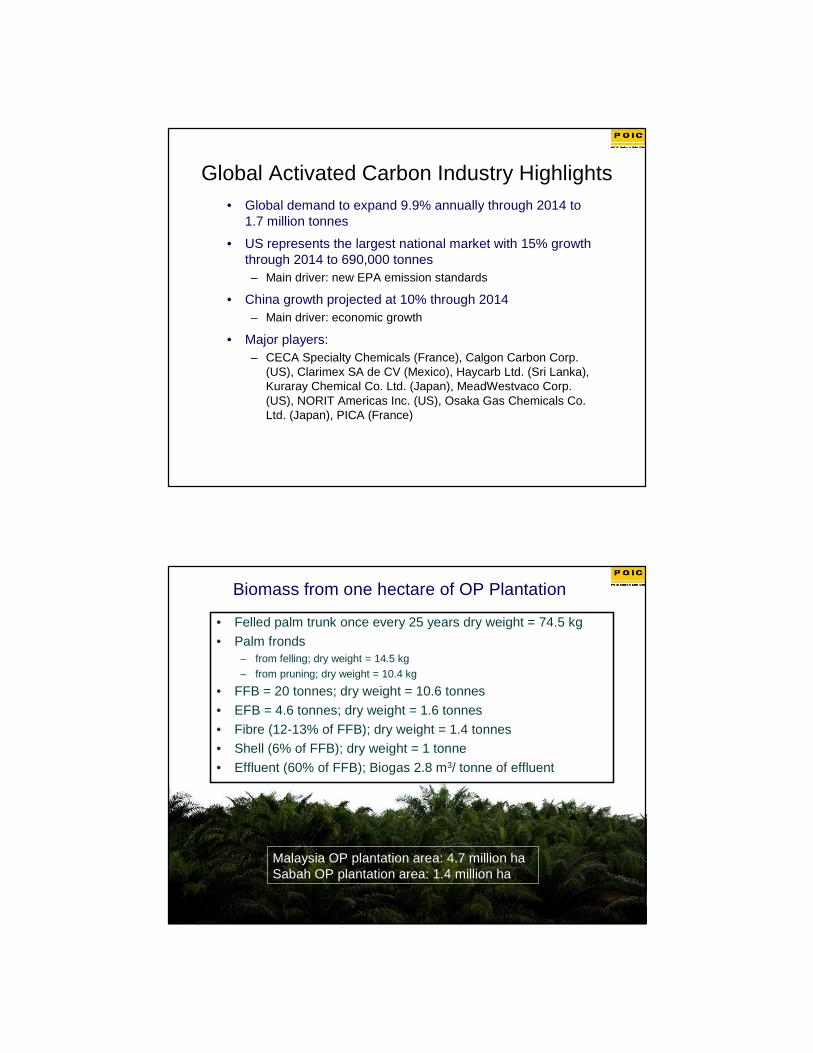
Global Activated Carbon Industry Highlights• Global demand to expand 9.9% annually through 2014 to
1.7 million tonnes
• US represents the largest national market with 15% growth through 2014 to 690,000 tonnes– Main driver: new EPA emission standards
• China growth projected at 10% through 2014– Main driver: economic growth
• Major players:– CECA Specialty Chemicals (France), Calgon Carbon Corp.
(US), Clarimex SA de CV (Mexico), Haycarb Ltd. (Sri Lanka), Kuraray Chemical Co. Ltd. (Japan), MeadWestvaco Corp. (US), NORIT Americas Inc. (US), Osaka Gas Chemicals Co. Ltd. (Japan), PICA (France)
Biomass from one hectare of OP Plantation
• Felled palm trunk once every 25 years dry weight = 74.5 kg
• Palm fronds– from felling; dry weight = 14.5 kg– from pruning; dry weight = 10.4 kg
• FFB = 20 tonnes; dry weight = 10.6 tonnes
• EFB = 4.6 tonnes; dry weight = 1.6 tonnes
• Fibre (12-13% of FFB); dry weight = 1.4 tonnes• Shell (6% of FFB); dry weight = 1 tonne
• Effluent (60% of FFB); Biogas 2.8 m3/ tonne of effluent
Malaysia OP plantation area: 4.7 million ha Sabah OP plantation area: 1.4 million ha

Fuel
Pulp & Paper Activated
Carbon
Fertiliser
Wood Panel Products
Wood Plastic Composites
Food
Animal Feed
Summary of Commercial Opportunities for Oil Palm Biomass
Many thanksLenn Gomes
Business Development POIC Sabah Sdn Bhd