condensed consolidated financial statements june · pdf filecondensed consolidated financial...
TRANSCRIPT

.
Oil Refineries Ltd.
Condensed Consolidated
Financial Statements
June 30, 2011
(Unaudited)
This translation of the financial statement is for convenience purposes only.
The only binding version of the financial statement is the Hebrew version.

.
Condensed Consolidated
Financial Statements
June 30, 2011
(Unaudited)
Contents
Page
Chapter A: Directors' Report on the State of the Company's Affairs A-1
Description of the Business of the Company - Update A-25
Chapter B: Condensed Consolidated Interim Financial Statements as of June 30, 2011
Auditors’ Report B-1
Condensed Consolidated Interim Statement of Financial Position B-2
Condensed Consolidated Interim Statement of Comprehensive Income B-4
Condensed Consolidated Interim Statement of Changes in Equity B-5
Condensed Consolidated Interim Statement of Cash Flows B-10
Notes to the Consolidated Interim Financial Statements B-12
Chapter C: Separate Condensed Interim Financial Information as of June 30, 2011
Special Auditors’ Report C-1
Separate Condensed Interim Information on Financial Position C-2
Separate Condensed Interim Information on Comprehensive Income C-4
Separate Condensed Interim Information on Cash Flows C-5
Separate Additional Financial Information C-7
Chapter D: Quarterly Board and Management Report on the Effectiveness of
Internal Control
D-1
Oil Refineries Ltd.
A-1
Directors' Report on the State of the Company's Affairs
For the Period Ended June 30, 2011
The Board of Directors is pleased to present the Directors' Report on the State of the Company’s Affairs for
the period ended June 30, 2011 (“the Reporting Period”). The report is presented under the assumption that
the Company's Periodic Report for 2010 ("the Periodic Report”) is available to the reader.
1. Description of the Company and its Business Environment
1.1 General
Oil Refineries Ltd. (“the Company” or “ORL”) and its subsidiaries (“the Group”) are industrial
companies involved in three synergetic fields of operations, reported as segments: refinery,
petrochemicals and trade. The Groups’ core operations are the production of oil products, raw
materials for the petrochemical industry and raw materials for the chemicals and plastics
industry. The Company also engages in trade in crude oil and oil products and distillates other
than for operational purposes, logistics and infrastructure services, and the supply of electricity
and steam to neighboring plants. The Group’s petrochemicals segment is made up of three
operations: polymers, through Carmel Olefins Ltd. Carmel Olefins); aromatics, through Gadiv
Petrochemical Industries Ltd. "Gadiv"); and basic oils and waxes, through Haifa Basic Oils
Ltd. ("Haifa Basic Oils"). The plants of these companies are downstream facilities of the
Company and they receive most or all of the required feedstock from the Company on an
ongoing basis through pipelines, and return all or part of the products of their facilities to the
Company, as well as the feedstock not used in their operations.
1.2 Implementation of the strategic plan
According to strategic plan approved by the Company’s Board of Directors in November 2007,
the Company is establishing the project for clean fuel production (hydrocracker) at a
total investment of USD 500 million. The hydrocracker is expected to start running by
the end of the second quarter of 2012. Up to the end of the Reporting Period, the
Company had invested USD 200 million in this plant and the project is progressing
according to the planned timetable.
In 2010, the Company signed an agreement with a syndicate of financers led by Bank
Hapoalim Ltd. Under the agreement, the syndicate provided up to USD 600 million
(without collateral) for partial funding of the project for establishment of the
hydrocracker, the Company’s other investments and the Company’s long-term debt
due between 2009 and 2012. As of the reporting date, the Company has withdrawn
USD 400 million on account of funding in this agreement.
Additionally, in 2010, the Company finalized and signed a financing agreement with a
foreign bank and the Export-Import Bank of the United States, together with another
export credit agency in Germany, for an additional USD 300 million credit and
collateral for acquisition of equipment for the hydrocracker project. As of the
reporting date, the Company has withdrawn USD 53 million on account of
funding in this agreement.

Oil Refineries Ltd.
A-2
Following the acquisition of the shares of Carmel Olefins, the Company merged the
headquarters operations and is taking steps for immediate realization of the advantages
of the merger of the companies and optimization of the operational synergy arising
from the merger. In the opinion of the Company, the integration and synergy between
the various operations contribute to an increase in aggregate margins flowing to the
Company from all operating segments and decrease the volatility of Group profits in
the long term, since business turnover in the areas of the Company’s operations and
those of its subsidiaries do not necessarily overlap. In addition, the joint management
streamlines operations of the companies and reduces expenses.
In the Reporting Period, the plants of the Company were connected to the national natural gas
pipeline and the Group started to consume natural gas in its plants. In addition to the
agreement for supply of natural gas from Egypt and in view of repetitive sabotage of
Egypt's natural gas pipeline that supplies gas to EMG, which disrupts gas supply by
EMG, in the Reporting Period, the Company entered into an agreement with Yam
Tethys Group to acquire a total quantity of BCM 1.2 for the Company and its
subsidiaries. For further information see Notes 7A and 7B to the condensed financial
statements. The Company believes that gas supply agreements with two suppliers
allow rapid conversion to ongoing use of natural gas for all its needs.
After conversion of the Group's plants to natural gas, natural gas will be used as
combustion material, instead of fuel oil. Following the conversion to natural gas, the
Company is able and its subsidiaries will be able to comply with requirements to
reduce air emissions at their plants according to the personal orders. The Company
also believes that conversion to natural gas will result in improved operational
efficiency.
In addition, as part of the potential synergy, the Group is investing USD 45 million to
optimize the existing flows at the refinery as raw material for polymer production. The
annual return on investment is estimated at USD 30 million. The expected annual
return on the USD 60 million investment to increase propylene production capacity is
estimated at USD 50 million.
The expected date of conversion of the plants of the subsidiaries to natural gas, the
expected reduction of expenses from use of natural gas as well as the costs of the
aforesaid projects and their return on investment are forward-looking information
based, inter alia, on the Company's estimates regarding the costs for completing the
project, prices of fuel oil and polymer products, the volume of natural gas
consumption and other factors. Therefore, there is no certainty as to when the Group's
conversion to natural gas will be completed, the extent of cost reductions following
conversion to natural gas, the aforesaid project costs and the return on the investment.
As part of the strategic plan, which includes increasing the investment in environmental quality,
safety and security and in enhancing operational reliability, up to the end of the
Reporting Period, the Company invested USD 126 million in these areas.
The investments include infrastructure and preparations for receiving natural gas in
the Company’s plants, systems to control air emissions and upgrading of the
protection systems in the production plants.
The Company also routinely implements the instructions and requirements applicable
under environmental quality laws.
Oil Refineries Ltd.
A-3
1.3 Business environment and Group profitability
Refining
At the beginning of 2011, a wave of political instability and riots erupted in Middle Eastern
countries, including Libya, which is one largest oil producers in the world. These riots led to
instability in global markets and crude oil prices soared to a record USD 125 per barrel in April
2011. In May 2011, prices started to drop following publication of weak macro-economic
information in the United States and Europe, lower demand in OECD countries and the
strengthening of the dollar. Prices continued to drop in June 2011 following the decision in the
United States to release 60 million barrels of crude oil and oil products from strategic
stockpiles. Subsequent to the Reporting Period, in July 2011, crude oil prices started to rise
again, returning to the level prior to the decision in the United States to release crude oil from
strategic stockpiles, while the prices remained high due to the shortage of supply from Libya.
Throughout this period, instability continued in Arab countries and consequently, the decreases
were contained to a certain extent. In Egypt, the riots resulted in a change in regime, alongside
opposition to the gas supply agreement with Israel. The earthquake and tsunami in Japan also
affected global markets, with the paralysis of refining capacity (over 1 million barrels per day)
and significantly impaired production capacity of petrochemical products.
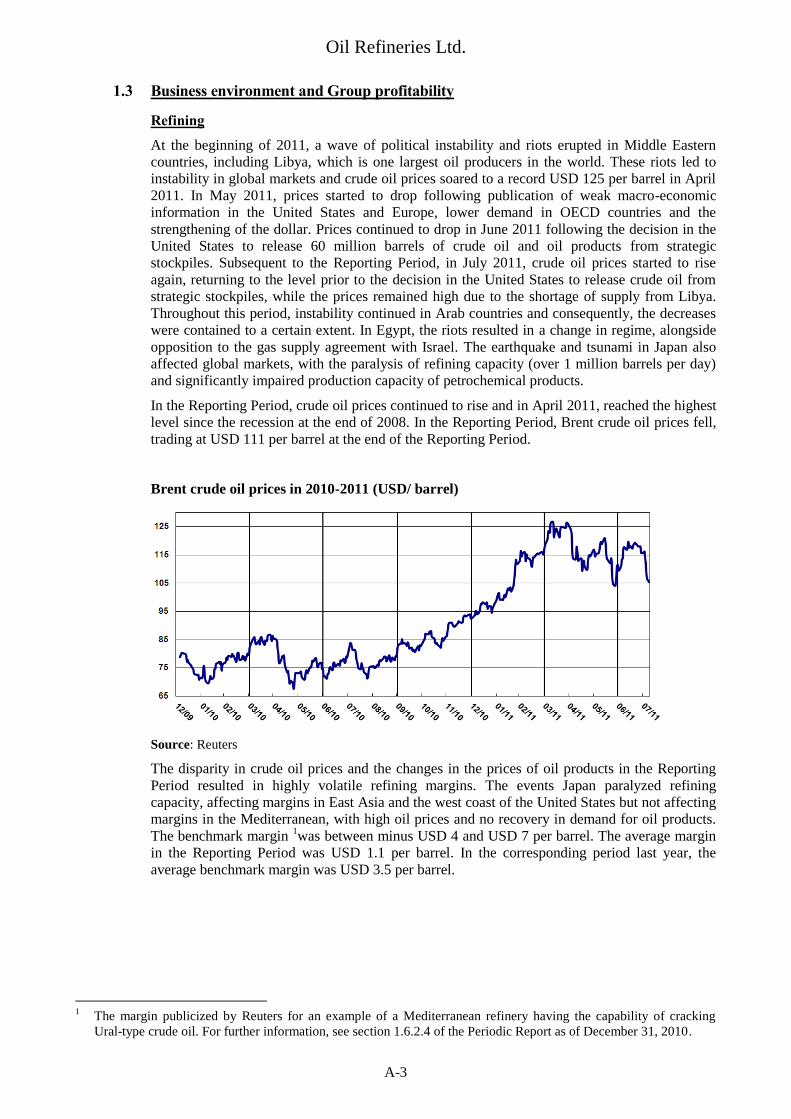
In the Reporting Period, crude oil prices continued to rise and in April 2011, reached the highest
level since the recession at the end of 2008. In the Reporting Period, Brent crude oil prices fell,
trading at USD 111 per barrel at the end of the Reporting Period.
Brent crude oil prices in 2010-2011 (USD/ barrel)
Source: Reuters
The disparity in crude oil prices and the changes in the prices of oil products in the Reporting
Period resulted in highly volatile refining margins. The events Japan paralyzed refining
capacity, affecting margins in East Asia and the west coast of the United States but not affecting
margins in the Mediterranean, with high oil prices and no recovery in demand for oil products.
The benchmark margin 1was between minus USD 4 and USD 7 per barrel. The average margin
in the Reporting Period was USD 1.1 per barrel. In the corresponding period last year, the
average benchmark margin was USD 3.5 per barrel.
1
The margin publicized by Reuters for an example of a Mediterranean refinery having the capability of cracking
Ural-type crude oil. For further information, see section 1.6.2.4 of the Periodic Report as of December 31, 2010.

Oil Refineries Ltd.
A-4
Refining margin publicized by Reuters for an example of a Mediterranean refinery having
the capability of cracking Ural-type crude oil in 2010-2011 (USD/barrel)
Refining operations decreased by 353,000 tons in the Reporting Period compared to the
corresponding period last year. In the fourth quarter of 2010, the Company shut down its plants
for periodic maintenance, resuming full production in the first quarter of 2011.
Refining volume and utilization of production plants in the refining segment (thousands of
tons)
1-6.2011 1-6.2010
Refining volume 4,136 4,489
Utilization of production plants 85.8% 93.2%
Utilization of the plants in the refining segment depends on many factors, including mechanical
availability, availability of raw materials, optimization of production and economic feasibility.
In the second quarter of 2010, based on availability and feasibility, utilization reached a record
98% compared with 93% in the corresponding period last year. In the Reporting Period, these
factors led to utilization of 86%, representing a lower refining quantity compared to the
corresponding period last year.
Breakdown of the Company’s output by the main product groups in the refining segment
(thousands of tons)
1-6.2011 1-6.2010
Diesel fuel 1,207 1,367
Gasoline 762 858
Kerosene 409 460
Fuel oil 690 546
HVGO 193 301
Other 562 607
Total 3,823 4,139

Oil Refineries Ltd.
A-5
Petrochemicals
Polymer prices (polyethylene and polypropylene) increased during the Reporting Period.
Polypropylene prices rose from USD 1,700 per ton at the beginning of the period to over USD
2,300 per ton at the end of April and fell to USD 1,780 at the end of the period. There was a
similar trend regarding polyethylene prices. The change in trend following the price hike in the
first quarter is mainly due to a decrease in raw material prices and pressure from customers
following the sharp increase in prices. The difference between polymer prices and naphtha
prices remained stable in the Reporting Period and were higher than in the corresponding period
last year.
Polymer and naphtha prices in 2010-2011 (USD/ton)
Source: ICIS
Aromatics margins increased significantly in the Reporting Period. The considerable increase
in demand for polyester, mainly in Asia following the cotton shortage, resulted in demand in the
entire xylene chain, therefore there was a sharp increase in prices of xylene, specifically
paraxylene, alongside an increase in the margins of these products. Paraxylene prices increased
from USD 1,400 per ton at the beginning of the period to USD 1,800 per ton in February 2011,
mainly due to high demand and disruption of production in some countries, followed by a
decrease in prices alongside a decrease in raw material prices and demand that was lower than
expected. In continuation of the trend, aromatics margins increased (paraxylene prices
compared to xylene prices) to a record level of USD 700 per ton in February 2011, but fell
subsequently to USD 280 per ton.
Paraxylene and xylene prices in 2010-2011 (USD/ton)
Source: PLATTS
Oil Refineries Ltd.
A-6
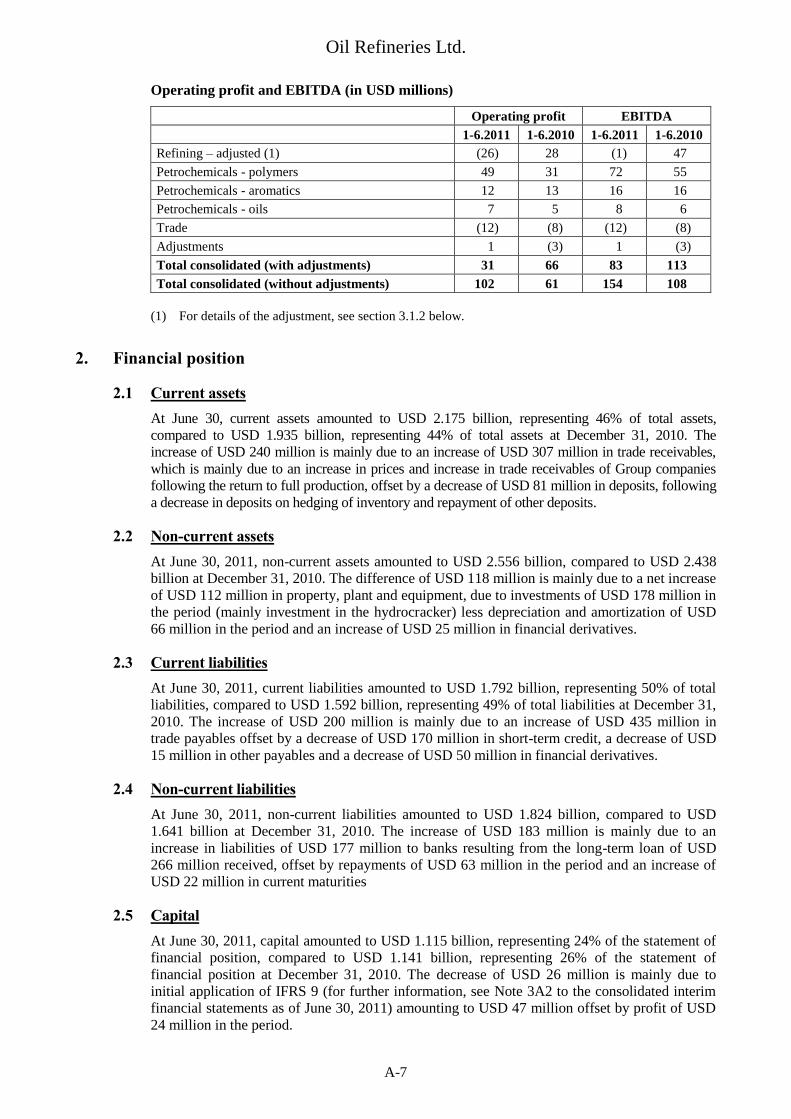
Prices of oils reported by ICIS2 for export cargo from Europe increased during the period from
USD 1,090 per ton to USD 1,450 per ton for export. Wax prices remained stable in the first
six months of 2001, although towards the end of the period, prices started to drop.
The period was characterized by growing customer demand, in both the oils market and the
waxes market, including growing demand from Turkey and renewed demand from China. On
the other hand, there was reduction in supply due to maintenance works at the plants in CIS
countries, breakdowns in European oils production plants and a further decrease in supply of
waxes due to the conversion of plants to production of advanced oils (without production
capacity for waxes). In addition, prices were affected by volatile raw material prices.
Product and raw material prices in 2010-2011 (USD/ton)
Output in the petrochemicals segment (in thousands of tons):
1-6.2011 1-6.2010
Aromatics (Gadiv) 266 266
Polymers (Carmel Olefins) 360 363
Oils (Haifa Basic Oils) 33 34
Total 659 663
Consolidated profit in the Reporting Period amounted to USD 24 million, compared to a USD
29 million in the corresponding period last year. The following table summarizes the
consolidated financial results for the Reporting Period and the corresponding period last year (in
USD millions.
1-6.2011 1-6.2010
Operating profit (not including other expenses) 102 61
Other expenses (1) (14) (22)
Financing expenses, net (48) (8)
Company’s share in losses of investees (3) --
Income tax (13) (2)
Profit for the period 24 29
(1) Amortization of excess cost of acquisition of Carmel Olefins and Haifa Basic Oils
2 Chemical Industry News and Intelligence
Oil Refineries Ltd.
A-7
Operating profit and EBITDA (in USD millions)
Operating profit EBITDA
1-6.2011 1-6.2010 1-6.2011 1-6.2010
Refining – adjusted (1) (26) 28 (1) 47
Petrochemicals - polymers 49 31 72 55
Petrochemicals - aromatics 12 13 16 16
Petrochemicals - oils 7 5 8 6
Trade (12) (8) (12) (8)
Adjustments 1 (3) 1 (3)
Total consolidated (with adjustments) 31 66 83 113
Total consolidated (without adjustments) 102 61 154 108
(1) For details of the adjustment, see section 3.1.2 below.
2. Financial position
2.1 Current assets
At June 30, current assets amounted to USD 2.175 billion, representing 46% of total assets,
compared to USD 1.935 billion, representing 44% of total assets at December 31, 2010. The
increase of USD 240 million is mainly due to an increase of USD 307 million in trade receivables,
which is mainly due to an increase in prices and increase in trade receivables of Group companies
following the return to full production, offset by a decrease of USD 81 million in deposits, following
a decrease in deposits on hedging of inventory and repayment of other deposits.
2.2 Non-current assets
At June 30, 2011, non-current assets amounted to USD 2.556 billion, compared to USD 2.438
billion at December 31, 2010. The difference of USD 118 million is mainly due to a net increase
of USD 112 million in property, plant and equipment, due to investments of USD 178 million in
the period (mainly investment in the hydrocracker) less depreciation and amortization of USD
66 million in the period and an increase of USD 25 million in financial derivatives.
2.3 Current liabilities
At June 30, 2011, current liabilities amounted to USD 1.792 billion, representing 50% of total
liabilities, compared to USD 1.592 billion, representing 49% of total liabilities at December 31,
2010. The increase of USD 200 million is mainly due to an increase of USD 435 million in
trade payables offset by a decrease of USD 170 million in short-term credit, a decrease of USD
15 million in other payables and a decrease of USD 50 million in financial derivatives.
2.4 Non-current liabilities
At June 30, 2011, non-current liabilities amounted to USD 1.824 billion, compared to USD
1.641 billion at December 31, 2010. The increase of USD 183 million is mainly due to an
increase in liabilities of USD 177 million to banks resulting from the long-term loan of USD
266 million received, offset by repayments of USD 63 million in the period and an increase of
USD 22 million in current maturities
2.5 Capital
At June 30, 2011, capital amounted to USD 1.115 billion, representing 24% of the statement of
financial position, compared to USD 1.141 billion, representing 26% of the statement of
financial position at December 31, 2010. The decrease of USD 26 million is mainly due to
initial application of IFRS 9 (for further information, see Note 3A2 to the consolidated interim
financial statements as of June 30, 2011) amounting to USD 47 million offset by profit of USD
24 million in the period.

Oil Refineries Ltd.
A-9
3. Results of the Group’s operations
3.1 The following table presents selected information of the Group for the six months period (USD millions)
Petrochemicals
Refining Trade Polymers Aromatics Oils Adjustments to
consolidated Consolidated
Six months ended June 30
2011 2010 2011 2010 2011 2010 2011 2010 2011 2010 2011 2010 2011 2010
Revenue 3,586 2,645 129 96 615 535 328 268 53 39 -- -- 4,711 3,583
Inter-company operations 663 488 -- -- -- -- 22 22 -- -- (685) (510) -- --
Total sales 4,249 3,133 129 96 615 535 350 290 53 39 (685) (510) 4,711 3,583
Cost of sales 4,151 3,053 138 101 214 250 7 23 24 11 -- -- 4,534 3,438
Inter-company operations 22 22 -- -- 326 224 317 237 20 22 (685) (505) -- --
Total cost of sales 4,173 3,075 138 101 540 474 324 260 44 33 (685) (505) 4,534 3,438
Gross profit (loss) 76 58 (9) (5) 75 61 26 30 9 6 -- (5) 177 145
Selling, general and administrative expenses 31 35 3 3 26 29 14 16 2 1 (1) -- 75 84
Inter-company operations -- -- -- -- -- 1 -- 1 -- -- -- (2) -- --
31 35 3 3 26 30 14 17 2 1 (1) (2) 75 84
Operating profit (loss) for segments 45 23 (12) (8) 49 31 12 13 7 5 1 (3) 102 61
Amortization of excess cost arising from acquisition of investees (14) (22)
Operating profit 88 39
Financing expenses, net (48) (8)
Company’s share in losses of equity accounted investees, net of tax (3) --
Profit before income tax 37 31
Income tax (13) (2)
Profit for the period 24 29

Oil Refineries Ltd.
A-10
The following table presents a description of the main reasons for the increase of USD 41
million in segment consolidated operating profit in the period (in USD million):
1-6.2011
compared to
1-6.2010
Decrease in the adjusted refining margin in the refining segment (42)
Increase in margins in the petrochemicals segment 31
Changes in adjustments – see details in the table in section 3.1.2 below 76
Decrease in sales (25)
Increase in other revenue 14
Increase in gross profit from the trade segment (4)
Increase in production expenses (18)
Increase in selling and administrative expenses 9
41
3.1.1 Revenue
Revenue in the refining segment amounted to USD 4.249 billion in the Reporting
Period, compared to USD 3.133 billion in the corresponding period last year. The
increase in revenue was mainly due to the increase in the average price of oil products.
The average price per ton of the product index in the Mediterranean area, similar to
the Company’s product index, amounted to USD 915 in the Reporting Period,
compared to USD 665 in the corresponding period last year.
In the Reporting Period, consumption of distillates remained stable, specifically
gasoline for transportation in the local market (fuel oil, diesel and kerosene),
compared to the corresponding period last year.
Revenue in the trade segment amounted to USD 129 billion in the Reporting Period,
compared to USD 96 billion in the corresponding period last year.
Revenue in the petrochemicals segment
Revenue of polymers operations increased by USD 80 million in the Reporting Period
compared to the corresponding period last year. The increase is mainly due to an
increase of USD 131 million in selling prices offset by a decrease of USD 51 million
in sales (mainly due to the return to the standard level of inventory after the periodic
maintenance).
Revenue of aromatics operations increased by USD 60 million in the Reporting
Period compared to the corresponding period last year. The increase is mainly due to
an increase of USD 74 million in prices offset by a decrease of USD 14 million in
sales.
Revenue of oils operations increased by USD 14 million in the Reporting Period
mainly due to an increase in selling prices.

Oil Refineries Ltd.
A-11
3.1.2 Operating profit
Operating profit in the refining segment amounted to USD 45 million in the Reporting
Period, compared to USD 23 million in the corresponding period last year.
To present the results of the Company’s operations on an economic basis and for
comparison with the benchmark margin, the accounting effects are adjusted in the
refining segment as follows: (in USD millions)
1-6.2011 1-6.2010
Profit from buying and selling timing differences, for inventory
that is not hedged by derivatives (*) (29) 1
Elimination of the provision for impairment of inventory, net 10 6
Loss due to the effect of changes in fair value of derivatives on
prices of goods, mainly due to accounting under IFRS (52) (2)
Total effect (71) 5
(*) Inventory of 355,000 tons. Changes in the value of this inventory do not generate cash
flow exposure for the Company.
The following table summarizes the comparison of the Company’s refining margins
with the benchmark margin.
1-6.2011 1-6.2010
Benchmark margin (dollar/barrel) 1.1 3.5
Adjusted margin (dollar/barrel) 2.6 3.9
Adjusted margin (dollar/ton) 18.9 28.9
Net of the effect – buying and selling timing differences 7.1 (0.3)
Elimination of the provision for
impairment of inventory (2.4)
(1.4)
Accounting method for derivatives
according to IFRS 12.7 0.6
Accounting margin (dollar/ton) 36.3 27.8
In the Reporting Period, adjusted refining margins decreased to USD 18.9 per ton
(USD 2.6 per barrel), compared to USD 28.9 per ton (USD 3.9 per barrel) in the
corresponding period last year. In the Reporting Period, the benchmark margin was
USD 8.0 per ton (USD 1.1 per barrel), compared to USD 25.6 per ton (USD 3.5 per
barrel) in the corresponding period last year.
It is noted that there are differences in a number of parameters between the
Company’s refining margin and the benchmark margin. These include composition of
crude oil (the Company also refines crude oil types that are not Ural), composition and
quality of the products produced by the refineries and the difference generated due to
the fact that the quote takes into account purchase and sale on the same day, while in
practice, there is a gap between the purchase date of the crude and the selling date of
distillates produced from the crude oil. Accordingly, comparison to the benchmark
margin could provide insight in relation to development trends of the Company's
refining margin, and does not constitute an exact criterion for estimating the
Company's refining margin in the short term.

Oil Refineries Ltd.
A-12
The following table presents a description of the main reasons for the increase in
operating profit in the refining segment in the Reporting Period, compared to the
corresponding period last year (in USD millions):
1-6.2011
compared to
1-6.2010
Decrease in adjusted refining margin (42)
Increase in sales (10)
Increase in other revenue 13
Increase in production expenses (19)
Increase in selling and administrative expenses 4
Changes in adjustments – as described above 76
22
The operating loss in the trade segment amounted to USD 12 million compared to
operating loss of USD 8 million in the corresponding period last year.
Operating profit in polymers operations amounted to USD 49 million in the
Reporting Period, compared to USD 31 million in the corresponding period last year.
The following table presents a description of the main reasons for the increase in
operating profit (in USD millions):
1-6.2011
compared to
1-6.2010
Increase in margin from the product index 29
Decrease in sales quantities (13)
Increase in production expenses (3)
Decrease in selling, administrative and general expenses 5
18
The operating profit in aromatics operations amounted to USD 12 million in the
Reporting Period, compared to USD 13 million in the corresponding period last year.
The following table presents a description of the main reasons for the decrease in
operating profit (in USD millions):
1-6.2011
compared to
1-6.2010
Decrease in sales quantities (1)
Decrease in margin from the product index (3)
Increase in other revenue 1
Decrease in selling, administrative and general expenses 2
(1)

Oil Refineries Ltd.
A-13
Operating profit of oils operations amounted to USD 7 million in the Reporting
Period, compared to USD 5 million in the corresponding period last year.
The following table presents a description of the main reasons for the increase in
operating profit (in USD millions):
1-6.2011
compared to
1-6.2010
Decrease in sales quantities (1)
Increase in margin from the product index 5
Increase in production expenses (1)
Increase in selling, administrative and general expenses (1)
2
3.1.3 Other expenses
In the Reporting Period, other expenses amounted to USD 14 million, representing
amortization of excess acquisition costs of the balance of shares in Carmel Olefins and
Haifa Basic Oils compared to USD 22 million in the corresponding period last year.
3.1.4 Financing expenses
Net consolidated financing expenses amounted to USD 48 million in the Reporting
Period compared to USD 8 million in the corresponding period last year.
The following table presents details of the principal changes in financing expenses (in
USD millions):
1-6.2011
compared to
1-6.2010
Increase in short-term interest mainly due to an increase in the scope of
credit 3
Decrease in profits from securities and loan provided 6
Effect of exchange differences on financial items, net 8
Increase in interest on loan and debentures 8
Changes in fair value of hedge transactions 42
Changes in fair value of public debentures (27)
40
* See Note 3(A)(2) to the condensed consolidated interim financial statements as of June 30, 2011.
3.1.5 Income tax
Tax expenses amounted to USD 13 million in the Reporting Period, compared to USD
2 million in the corresponding period last year. The change is mainly due to the
change in pre-tax profit compared to the corresponding period last year.
3.1.6 Company’s share in losses of investees
The Company's share in losses of investees amounted to USD 3 million in the
Reporting Period and was mainly due to losses of investees.
Oil Refineries Ltd.
A-14
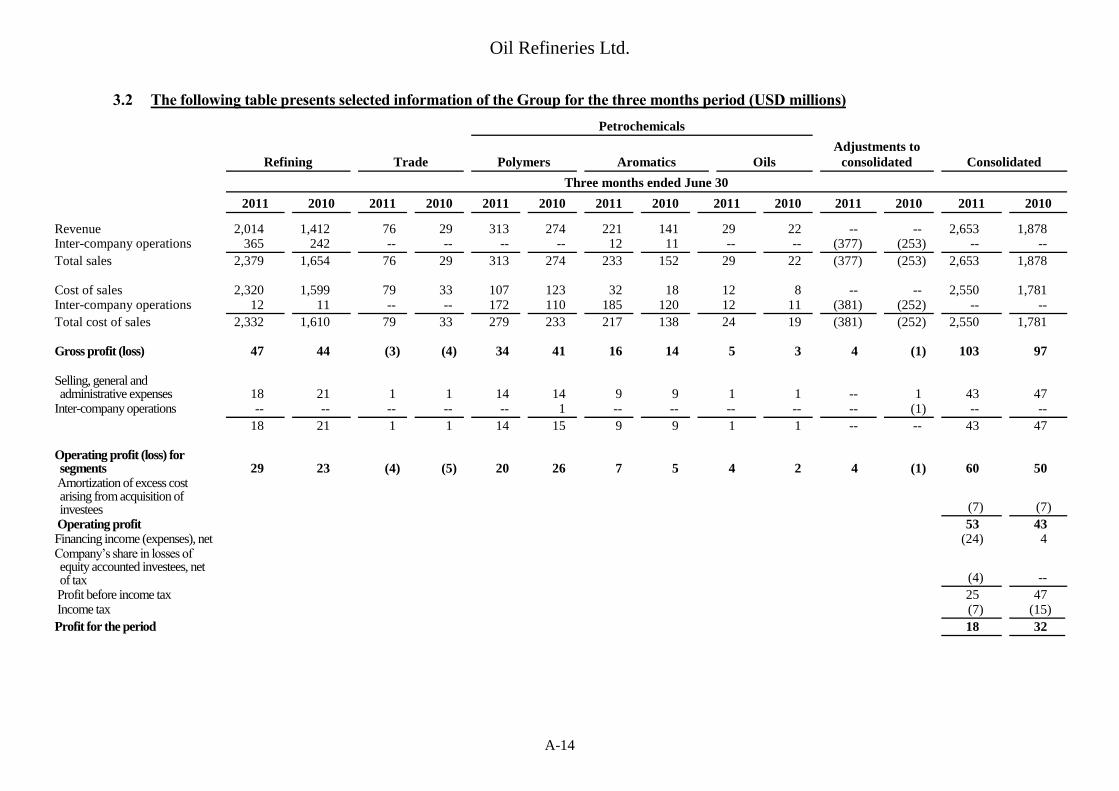
3.2 The following table presents selected information of the Group for the three months period (USD millions)
Petrochemicals
Refining Trade Polymers Aromatics Oils
Adjustments to
consolidated Consolidated
Three months ended June 30
2011 2010 2011 2010 2011 2010 2011 2010 2011 2010 2011 2010 2011 2010
Revenue 2,014 1,412 76 29 313 274 221 141 29 22 -- -- 2,653 1,878 Inter-company operations 365 242 -- -- -- -- 12 11 -- -- (377) (253) -- --
Total sales 2,379 1,654 76 29 313 274 233 152 29 22 (377) (253) 2,653 1,878 Cost of sales 2,320 1,599 79 33 107 123 32 18 12 8 -- -- 2,550 1,781 Inter-company operations 12 11 -- -- 172 110 185 120 12 11 (381) (252) -- --
Total cost of sales 2,332 1,610 79 33 279 233 217 138 24 19 (381) (252) 2,550 1,781 Gross profit (loss) 47 44 (3) (4) 34 41 16 14 5 3 4 (1) 103 97 Selling, general and administrative expenses 18 21 1 1 14 14 9 9 1 1 -- 1 43 47
Inter-company operations -- -- -- -- -- 1 -- -- -- -- -- (1) -- --
18 21 1 1 14 15 9 9 1 1 -- -- 43 47 Operating profit (loss) for segments 29 23 (4) (5) 20 26 7 5 4 2 4 (1) 60 50
Amortization of excess cost arising from acquisition of investees (7) (7)
Operating profit 53 43 Financing income (expenses), net (24) 4 Company’s share in losses of equity accounted investees, net of tax (4) --
Profit before income tax 25 47 Income tax (7) (15)
Profit for the period 18 32
Oil Refineries Ltd.
A-15
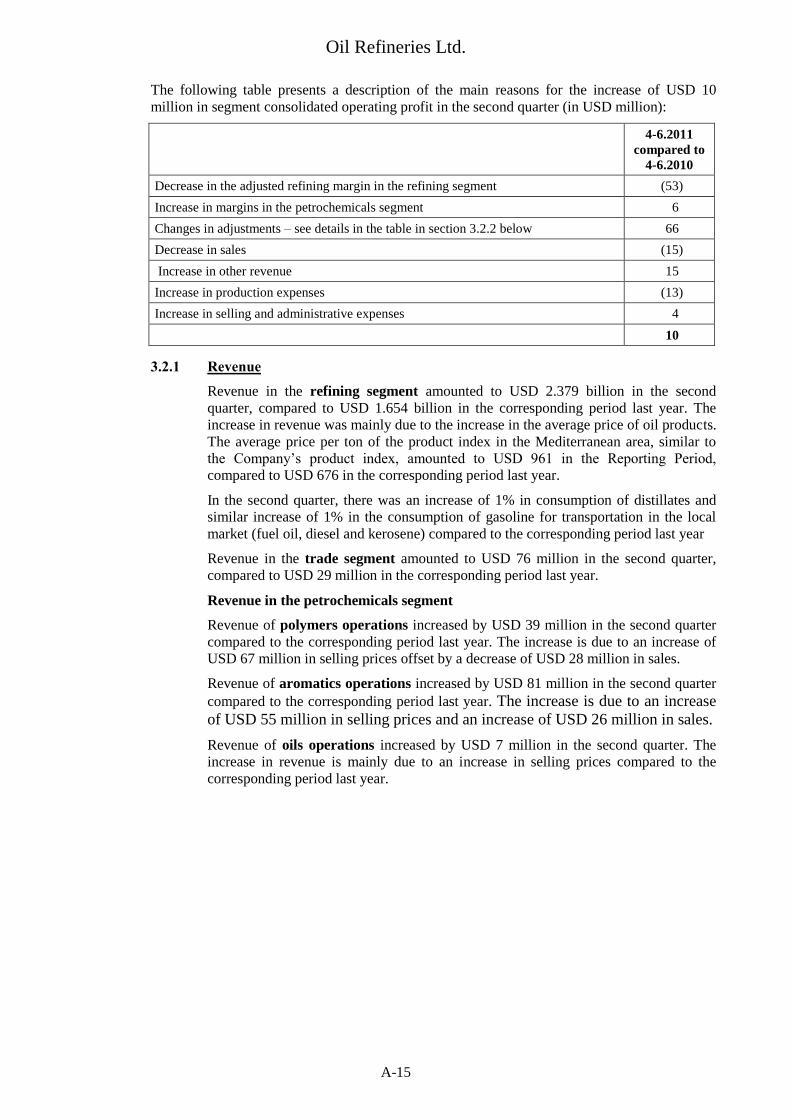
The following table presents a description of the main reasons for the increase of USD 10
million in segment consolidated operating profit in the second quarter (in USD million):
4-6.2011
compared to
4-6.2010
Decrease in the adjusted refining margin in the refining segment (53)
Increase in margins in the petrochemicals segment 6
Changes in adjustments – see details in the table in section 3.2.2 below 66
Decrease in sales (15)
Increase in other revenue 15
Increase in production expenses (13)
Increase in selling and administrative expenses 4
10
3.2.1 Revenue
Revenue in the refining segment amounted to USD 2.379 billion in the second
quarter, compared to USD 1.654 billion in the corresponding period last year. The
increase in revenue was mainly due to the increase in the average price of oil products.
The average price per ton of the product index in the Mediterranean area, similar to
the Company’s product index, amounted to USD 961 in the Reporting Period,
compared to USD 676 in the corresponding period last year.
In the second quarter, there was an increase of 1% in consumption of distillates and
similar increase of 1% in the consumption of gasoline for transportation in the local
market (fuel oil, diesel and kerosene) compared to the corresponding period last year
Revenue in the trade segment amounted to USD 76 million in the second quarter,
compared to USD 29 million in the corresponding period last year.
Revenue in the petrochemicals segment
Revenue of polymers operations increased by USD 39 million in the second quarter
compared to the corresponding period last year. The increase is due to an increase of
USD 67 million in selling prices offset by a decrease of USD 28 million in sales.
Revenue of aromatics operations increased by USD 81 million in the second quarter
compared to the corresponding period last year. The increase is due to an increase
of USD 55 million in selling prices and an increase of USD 26 million in sales.
Revenue of oils operations increased by USD 7 million in the second quarter. The
increase in revenue is mainly due to an increase in selling prices compared to the
corresponding period last year.
Oil Refineries Ltd.
A-16
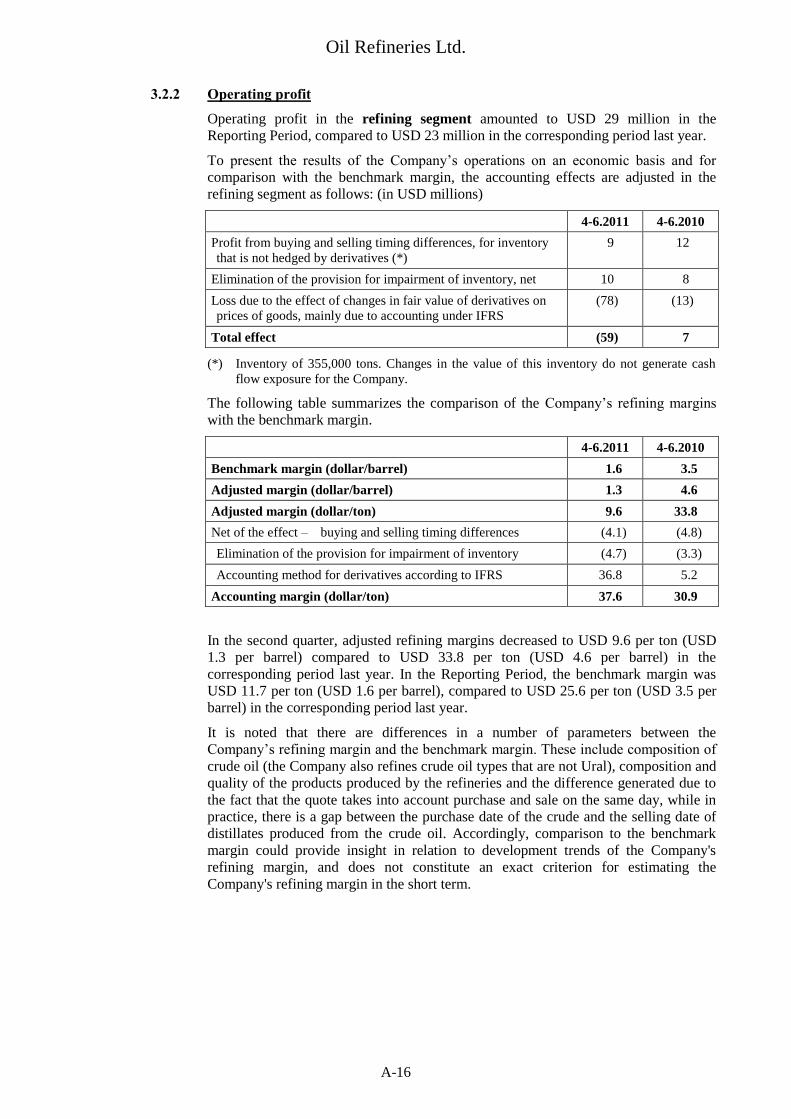
3.2.2 Operating profit
Operating profit in the refining segment amounted to USD 29 million in the
Reporting Period, compared to USD 23 million in the corresponding period last year.
To present the results of the Company’s operations on an economic basis and for
comparison with the benchmark margin, the accounting effects are adjusted in the
refining segment as follows: (in USD millions)
4-6.2011 4-6.2010
Profit from buying and selling timing differences, for inventory
that is not hedged by derivatives (*)
9 12
Elimination of the provision for impairment of inventory, net 10 8
Loss due to the effect of changes in fair value of derivatives on
prices of goods, mainly due to accounting under IFRS
(78) (13)
Total effect (59) 7
(*) Inventory of 355,000 tons. Changes in the value of this inventory do not generate cash
flow exposure for the Company.
The following table summarizes the comparison of the Company’s refining margins
with the benchmark margin.
4-6.2011 4-6.2010
Benchmark margin (dollar/barrel) 1.6 3.5
Adjusted margin (dollar/barrel) 1.3 4.6
Adjusted margin (dollar/ton) 9.6 33.8
Net of the effect – buying and selling timing differences (4.1) (4.8)
Elimination of the provision for impairment of inventory (4.7) (3.3)
Accounting method for derivatives according to IFRS 36.8 5.2
Accounting margin (dollar/ton) 37.6 30.9
In the second quarter, adjusted refining margins decreased to USD 9.6 per ton (USD
1.3 per barrel) compared to USD 33.8 per ton (USD 4.6 per barrel) in the
corresponding period last year. In the Reporting Period, the benchmark margin was
USD 11.7 per ton (USD 1.6 per barrel), compared to USD 25.6 per ton (USD 3.5 per
barrel) in the corresponding period last year.
It is noted that there are differences in a number of parameters between the
Company’s refining margin and the benchmark margin. These include composition of
crude oil (the Company also refines crude oil types that are not Ural), composition and
quality of the products produced by the refineries and the difference generated due to
the fact that the quote takes into account purchase and sale on the same day, while in
practice, there is a gap between the purchase date of the crude and the selling date of
distillates produced from the crude oil. Accordingly, comparison to the benchmark
margin could provide insight in relation to development trends of the Company's
refining margin, and does not constitute an exact criterion for estimating the
Company's refining margin in the short term.

Oil Refineries Ltd.
A-17
The following table presents a description of the main reasons for the increase in
operating profit in the refining segment in the second quarter compared to the
corresponding period last year (in USD millions):
4-6.2011
compared to
4-6.2010
Decrease in adjusted refining margin (53)
Increase in sales (8)
Increase in production expenses (15)
Increase in other revenue 13
Changes in adjustments – as described above 66
Increase in selling and administrative expenses 3
6
The operating loss in the trade segment amounted to USD 4 million in the second
quarter compared to a loss of USD 5 million in the corresponding period last year.
Operating profit in polymers operations amounted to USD 20 million in the second
quarter compared to USD 26 million in the corresponding period last year.
The following table presents a description of the main reasons for the decrease in
operating profit (in USD millions):
4-6.2011
compared to
4-6.2010
Increase in margin from the product index 1
Decrease in sales quantities (9)
Decrease in selling, administrative and general expenses 2
(6)
Operating profit in aromatics operations amounted to USD 7 million in the second
quarter compared to USD 5 million in the corresponding period last year
The following table presents a description of the main reasons for the increase in
operating profit (in USD millions):
4-6.2011
compared to
4-6.2010
Increase in sales 2
Decrease in margin from the product index (1)
Increase in other revenue 1
2
Oil Refineries Ltd.
A-18
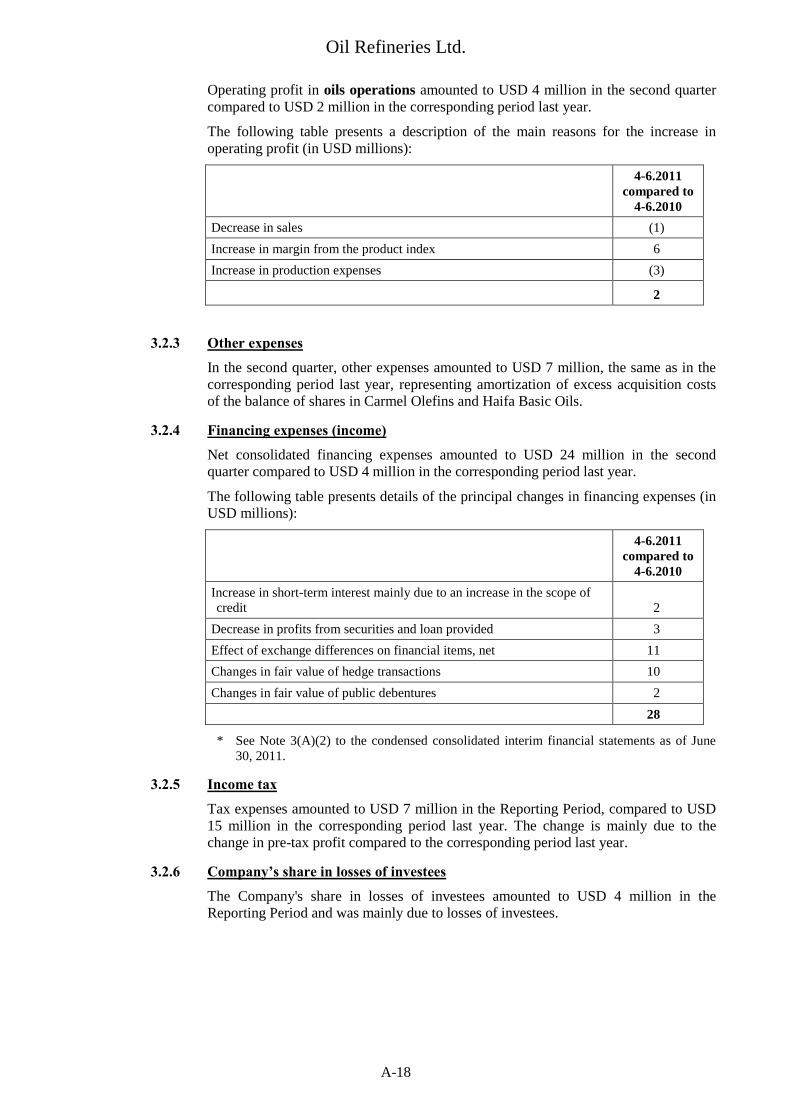
Operating profit in oils operations amounted to USD 4 million in the second quarter
compared to USD 2 million in the corresponding period last year.
The following table presents a description of the main reasons for the increase in
operating profit (in USD millions):
4-6.2011
compared to
4-6.2010
Decrease in sales (1)
Increase in margin from the product index 6
Increase in production expenses (3)
2
3.2.3 Other expenses
In the second quarter, other expenses amounted to USD 7 million, the same as in the
corresponding period last year, representing amortization of excess acquisition costs
of the balance of shares in Carmel Olefins and Haifa Basic Oils.
3.2.4 Financing expenses (income)
Net consolidated financing expenses amounted to USD 24 million in the second
quarter compared to USD 4 million in the corresponding period last year.
The following table presents details of the principal changes in financing expenses (in
USD millions):
4-6.2011
compared to
4-6.2010
Increase in short-term interest mainly due to an increase in the scope of
credit 2
Decrease in profits from securities and loan provided 3
Effect of exchange differences on financial items, net 11
Changes in fair value of hedge transactions 10
Changes in fair value of public debentures 2
28
* See Note 3(A)(2) to the condensed consolidated interim financial statements as of June
30, 2011.
3.2.5 Income tax
Tax expenses amounted to USD 7 million in the Reporting Period, compared to USD
15 million in the corresponding period last year. The change is mainly due to the
change in pre-tax profit compared to the corresponding period last year.
3.2.6 Company’s share in losses of investees
The Company's share in losses of investees amounted to USD 4 million in the
Reporting Period and was mainly due to losses of investees.

Oil Refineries Ltd.
A-19
4. Liquidity
Total current assets less current liabilities at June 30, 2011 amounted to USD 383 million compared to
USD 343 million at December 31, 2010. The current ratio at June 30, 2011 is 1.21 compared to 1.22 at
December 31, 2010.
Consolidated cash flows from the Company’s operating activities amounted to USD 227 million in the
Reporting Period, mainly due to profit in the period less adjustment of non-cash revenue and expenses
amounting to USD 71 million plus a change of USD 156 million in property items and current
liabilities.
Cash used for investment activity in the Reporting Period amounted to USD 90 million, used mainly
to finance investments of USD 179 million in property, plant and equipment and other assets, offset by
a decrease of USD 81 million in deposit.
Net cash flows used for financing activity amounted to USD 130 million in the Reporting Period. The
cash was used mainly to repay the short-term loan of USD 263 million, for periodic repayment of
debentures and long-term loans of USD 79 million and payment of interest of USD 46 million, offset
by a long-term loan of USD 266 million.
5. Sources of financing
Composition of Group financing sources and uses:
Six months
ended
June 30, 2011
Year ended
December 31,
2010
USD millions
Sources
Decrease in cash in the period -- 29
Decrease in working capital 156 --
Decrease in deposits and marketable securities 81 12
Repayment of the loan from Haifa Early Pensions 6 13
Income tax refund -- 28
Cash from operating activities (prior to changes in working capital) 71 181
Receipt of short-term credit and deposits from customers -- 171
Long-term credit 266 397
580 831
Uses
Increase in cash 7 --
Increase in working capital -- 202
Payment of dividend -- 80
Investments in property, plant and equipment and other assets 179 230
Investment in associates 1 33
Investment in deposits -- 66
Interest paid, net 26 53
Receipt of short-term credit and deposits from customers 284 --
Costs of raising capital and repayment of long-term loans and debentures 83 167
580 831

Oil Refineries Ltd.
A-20
6. Long-term loans and debentures
The long term loans and debentures at June 30, 2011 (after deduction of current maturities) amounted
to USD 1.674 billion, representing 35% of the statement of financial position, compared to USD 1.497
billion, representing 34% at December 31, 2010. The proceeds of the loans are used to finance
investments in property, plant and equipment and to repay long-term liabilities. In the first six months
of 2011, long-term loans of USD 266 million were received.
Financial leverage at June 30, 2011 (long term loans and debentures, to equity plus long term loans
and debentures) is 60% and 57% at December 31, 2010.
7. Total financial liabilities
Current financial liabilities plus long-term loans and debentures amounted to USD 2.278 billion at
June 30, 2011, representing 48% of the statement of financial position, compared to USD 2.27 billion,
representing 52% of the statement of financial position at December 31, 2010. Financial leverage of
total financial liabilities to banks and other credit providers is 67% similar to December 31, 2010.
The table below presents details of the Group’s net financial debt at June 30, 2010 (in USD millions):
ORL Subsidiaries Total
Short-term loan 150 183 333
Loans from banks (*) 698 266 964
Debentures (*) (**) 691 302 993
Liquid financial assets (142) (30) (172)
Total net financial debt 1,397 721 2,118
(*) Including current maturities
(**) See Note 3(A)(2) to the condensed consolidated interim financial statements as of June 30, 2011.
8. Average volume of sources of finance in the Reporting Period
Long term loans and debentures (including current maturities) – USD 1.787 billion; short term credit –
USD 487 million; trade payables – USD 836 million; trade receivables – USD 520 million.
Oil Refineries Ltd.
A-21
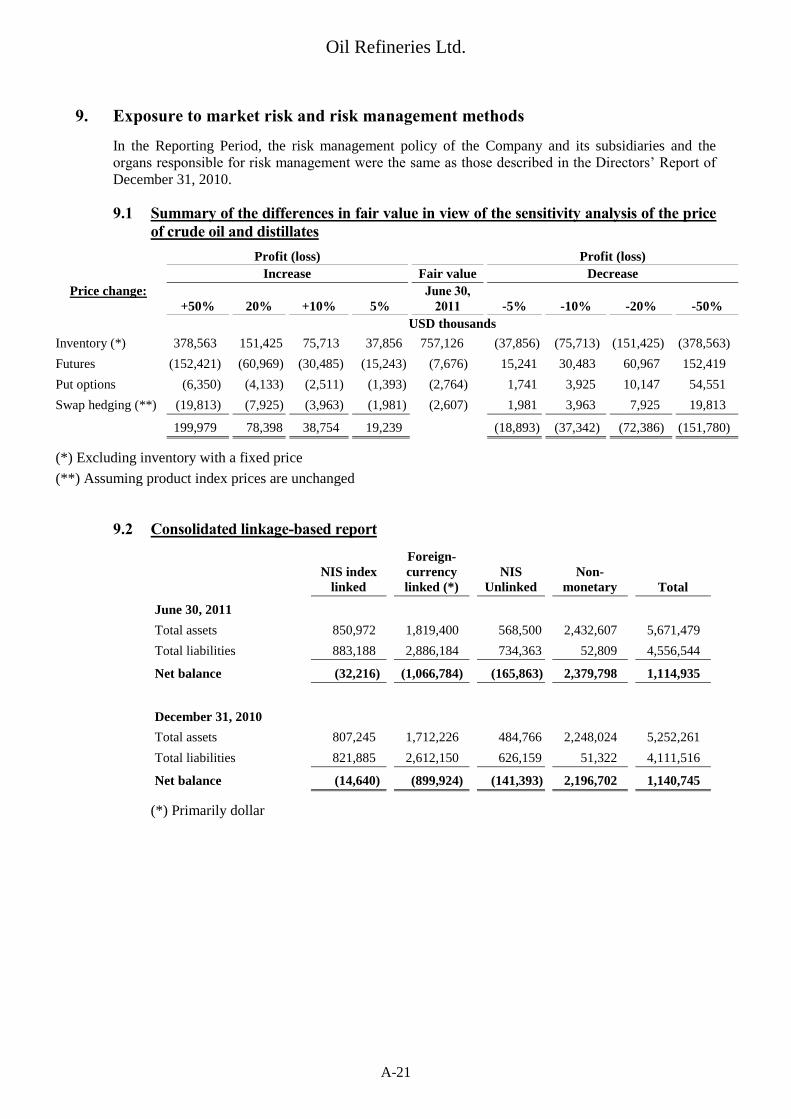
9. Exposure to market risk and risk management methods
In the Reporting Period, the risk management policy of the Company and its subsidiaries and the
organs responsible for risk management were the same as those described in the Directors’ Report of
December 31, 2010.
9.1 Summary of the differences in fair value in view of the sensitivity analysis of the price
of crude oil and distillates
Profit (loss) Profit (loss)
Increase Fair value Decrease
Price change:
+50% 20% +10% 5%
June 30,
2011 -5% -10% -20% -50%
USD thousands
Inventory (*) 378,563 151,425 75,713 37,856 757,126 (37,856) (75,713) (151,425) (378,563)
Futures (152,421) (60,969) (30,485) (15,243) (7,676) 15,241 30,483 60,967 152,419
Put options (6,350) (4,133) (2,511) (1,393) (2,764) 1,741 3,925 10,147 54,551
Swap hedging (**) (19,813) (7,925) (3,963) (1,981) (2,607) 1,981 3,963 7,925 19,813
199,979 78,398 38,754 19,239 (18,893) (37,342) (72,386) (151,780)
(*) Excluding inventory with a fixed price
(**) Assuming product index prices are unchanged
9.2 Consolidated linkage-based report
NIS index
linked
Foreign-
currency
linked (*)
NIS
Unlinked
Non-
monetary Total
June 30, 2011
Total assets 850,972 1,819,400 568,500 2,432,607 5,671,479
Total liabilities 883,188 2,886,184 734,363 52,809 4,556,544
Net balance (32,216) (1,066,784) (165,863) 2,379,798 1,114,935
December 31, 2010
Total assets 807,245 1,712,226 484,766 2,248,024 5,252,261
Total liabilities 821,885 2,612,150 626,159 51,322 4,111,516
Net balance (14,640) (899,924) (141,393) 2,196,702 1,140,745
(*) Primarily dollar

Oil Refineries Ltd.
A-22
10. Corporate governance
The Company’s Board of Directors adopted a procedure based on the recommendations of the Goshen
Committee and the recommendations regarding their implementation as submitted to the Company by Adv.
Dr. Yoram Danziger. The Board of Directors periodically updates its work procedures, as required by the
law and as required. In the Reporting Period, the Board of Directors received a review of the most recent
amendments to corporate laws regarding corporate governance. Following a comprehensive discussion of
the subject, the Board of Directors instructed the Company's management to adapt the Company's
documents and internal enforcement plan to the amendments of the legislation.
10.1 Contribution to the community and community activities
There was no change in the disclosure given in this matter in the Directors’ Report on the State
of the Company’s Affairs for the year ended December 31, 2010.
10.2 Directors with accounting and financial expertise
There was no change in the requirements for the minimum number of directors having
accounting and financial expertise and there was no change in the disclosure in the Directors’
Report on the State of the Company’s Affairs for the year ended December 31, 2010.
10.3 Independent directors
According to the Company’s Articles of Association, as long as the Company has a controlling
shareholder or a holder of a control block, at least one third of the members of the Board of
Directors will be independent directors, as defined in section 219(E) of the Companies Law. At
the publication date of the report, the Company has four independent directors.
10.4 Salaries of officers and considerations on which the Board of Directors base such
salaries
In the Reporting Period, the Board of Directors approved a long- and medium-term
compensation plan. For further information see section 1.17.4 of Part A in the Periodic Report
for 2010. Subsequent to the Reporting Period, the general meeting approved the items in the
compensation plan that required the approval of the general meeting.
In the Reporting Period, the Board of Directors approved the salary terms for the Company's new
CEO. For further information, see the immediate report of April 4, 2011, ref. no. 2011-01-108246.
There was no change to the Board of Directors' considerations underlying the salaries of
officers, in respect of the disclosure in the Directors' Report on the State of the Company's
Affairs for the year ended December 31, 2010.
10.5 Approval of the financial statements
There were no changes in the identity of the Company’s organs that oversee the audit regarding
the procedure for approving the financial statements compared to the disclosure in the
Directors’ Report on the State of the Company’s Affairs for the year ended December 31, 2009.
On August 7, 2011, the Audit and Balance Sheet Committee discussed the financial statements
as of June 30, 2011 and formulated recommendations for the Company's Board of Directors.
The committee meeting was divided into two parts. In the first part of the meeting, the
Company's management reviewed the information in the financial statements and the
accounting policy used when preparing the statements. The second part of the meeting was held
in the presence of those members of the Board of Directors serving as committee members only,
and they discussed and formulated the committee's recommendations to the Board of Directors.
The following committee members attended the meeting: Dafna Schwartz (chair), Yachin
Cohen and Nehama Ronen. On August 14, 2011, the Company's Board of Directors approved
the financial statements in the presence of all members of the Board of Directors with the
exception of David Federman, Yachin Cohen and Ory Slonim.

Oil Refineries Ltd.
A-23
10.6 Disclosure regarding the internal auditor in a reporting corporation
In the Reporting Period, there was no change in the disclosure given in this matter in the
Directors’ Report on the State of the Company’s Affairs for the year ended December 31, 2010.
10.7 Peer review
In the Reporting Period, there was no change in the disclosure given in this matter in the
Directors’ Report on the State of the Company’s Affairs for the year ended December 31, 2010.
11. Disclosure of financial reporting
11.1 Additional information contained in the auditors’ report to shareholders
Without qualifying their opinion, the auditors of the Company drew attention to:
The contents of Note 6(A) to the financial statements regarding the suits filed against the
Company and its subsidiaries for legal proceedings, supervision by government
authorities, other contingencies, laws and bills relating to the fuel and gas industry and
infrastructure facilities. Based on the opinion of the legal counsel of the Company and
its subsidiaries, the Company estimates that, at this stage, it is not possible to assess
the aforementioned impact on the financial statements, if any exists, and therefore, no
provisions regarding this matter were included in the financial statements.
The contents of Note 6(B) and Note 7 to the financial statements regarding the Company's
dependency on services from infrastructure companies and from a natural gas supplier.
11.2 Use of estimates and judgments
In the Reporting Period, there was no change in the critical accounting estimates in the
Company’s statements compared to the description in the Directors’ Report on the State of the
Company’s Affairs for the year ended December 31, 2010 and in the Notes to the financial
statements of that year.
11.3 Definition of insignificant transactions in the Company’s financial statements
In the Reporting Period, there was no change in the definition of an insignificant transaction
compared to the description in the Directors’ Report on the State of the Company’s Affairs for
the year ended December 31, 2010.
12. Debentures of the corporation held by the public
In the Reporting Period, there were no material changes in the details of the three series of debentures
issued by the Company and offered to the public under a prospectus, in the details of the debenture
trustees, in the conditions for call for immediate redemption of the debentures and in the Company's
compliance with these conditions as well as in the collateral for the debentures as described in the
Directors' Report as of December 31, 2010.

Oil Refineries Ltd.
A-24
13. Significant events in and subsequent to the Reporting Period
A. For information about significant events in and subsequent to the Reporting Period, see Note 7 to
the condensed consolidated interim financial statements as of June 30, 2010.
B. Impact of changes in exchange rates and prices of crude oil and oil products
(1) Changes in exchange rates: From the end of the Reporting Period and up to the approval
date of the financial statements, there was a depreciation of 4% in the shekel-dollar
exchange rate. The Company uses hedging transactions to partially offset this exposure, as
part of its risk management policy. The effect of the depreciation on the Company's
business results, after the results of the hedging transactions, is an income of USD 4
million.
(2) Changes in prices of crude oil and oil products: Subsequent to the reporting date, the
price of oil, which was USD 111 per barrel at the reporting date, fell to USD 108 per barrel
shortly before the publication date of the financial statements.
C. Change in positions
On March 20, 2011, CEO of the Company Yashar Ben Mordechai announced his resignation as
CEO of the Company. On April 3, 2011, the Board of Directors appointed Pinhas Buchris as the
new CEO of the Company. On May 1, 2011, Yashar Ben Mordechai ended his position as CEO
of the Company and Pinhas Buchris was appointed CEO. The Board of Directors of the Company
thanks Yashar Ben Mordechai for his years of service as CEO of the Company and for the
achievements to which he directed the Company in this period, and wishes Pinhas Buchris
success in his position.
The Board of Directors and Audit Committee approved the consultancy agreement between the
Company and a consultancy company wholly owned by Yashar Ben Mordechai, to manage the
hydrocracker project.
In the Reporting Period, Hanan Klachouck, General Manager of the Company's industrial sector,
announced his resignation. On April 21, 2011, the Board of Directors appointed Ido Rosolio as
General Manager of the Company's industrial sector. Mr. Rosolio took office at the beginning of
July 2011.
The Board of Directors of the Company thanks Hanan Klachouck, the outgoing General Manager
of the industrial sector, for his contribution to the Company over the years and wishes Ido
Rosolio success in his position.
Subsequent to the Reporting Period, on July 31, 2011, Niva Hassid, VP Human Resources,
announced her resignation.
D. Natural gas
For details see Note 7 to the interim condensed consolidated financial statements as of June 30,
2011.
14. The Board of Directors wishes to thank the management of the Company and the subsidiaries and their
employees for their efforts and achievements during the Reporting Period. The Board of Directors
expresses its appreciation of the activities and achievements in environmental protection, promotion of
investments in the companies and implementation of efficiency measures.
Yossi Rosen
Chairman of the Board
of Directors
Pinhas Buchris
CEO
August 14, 2011

Oil Refineries Ltd.
A-25
Update to the State of the Company’s Affairs in the Periodic
Report as of December 31, 2010
In accordance with Regulation 39A of the Securities Regulations (Periodic and Immediate Reports), 1970
In the Reporting Period, there were no significant changes or new events in the Company's affairs, with the
exception of the following:
A. Update to section 1.17.4.4 regarding natural gas. For details see Notes 7A and 7B to the condensed
consolidated interim financial statements as of June 30, 2011.
B. Update to section 1.6.16.4 regarding the dependency on the Eilat-Ashkelon oil pipeline ("EAPC").
Further to the aforesaid, EAPC's business license was extended to March 13, 2012.

Somekh Chaikin Tel: 04 861 4800
18 Neviim Street, P.O. Box 4484 Fax: 04 861 4844
Haifa 33104 website: www.kpmg.co.il
B-1
Auditors Report to the Shareholders of
Oil Refineries Limited Introduction We have reviewed the accompanying financial information of Oil Refineries Limited and its subsidiaries (“the Group"), including the condensed consolidated interim statement of financial position as of June 30, 2011 and the condensed consolidated interim statements of income, comprehensive income, changes in equity and cash flows for the six and three months then ended. The Board of Directors and the management are responsible for preparation and presentation of the financial information for these interim periods in accordance with IAS 34, Interim Financial Reporting, and are also responsible for preparation of the interim financial information for these periods in accordance with Chapter D of the Securities Regulations (Periodic and Immediate Reports), 1970. Our responsibility is to express an opinion on the financial information for these interim periods based on our review. We did not review the condensed interim financial statements of consolidated companies, the consolidated assets of which represent approximately 29% of the total consolidated assets as of June 30, 2011, and the consolidated revenue of which represents approximately 14% and 13% of the total consolidated revenue for the six and three months then ended, respectively. In addition, we did not review the condensed interim financial statements of equity-accounted investees, the investment in which amounts to USD 14.054 million as of June 30, 2011, and the share of the Group in their losses is USD 3.538 million and USD 3.808 million for the six and three months then ended, respectively. The condensed interim financial information of those companies were reviewed by other accountants, whose reports have been furnished to us, and our opinion, insofar as it relates to amounts included for those companies, is based on the reviews of the other accountants. Review scope We conducted our review in accordance with Accounting Standard No. 1 – Review of Interim Financial Information Performed by the Independent Auditor of the Entity, established by the Institute of Certified Public Accountants in Israel. A review of interim financial information consists of making enquiries, primarily of persons responsible for financial and accounting matters, and applying analytical and other review procedures. A review is substantially less in scope than an audit conducted in accordance with accepted accounting principles in Israel and consequently does not enable us to obtain assurance that we would become aware of all significant matters that might be identified in an audit. Accordingly, we do not express an audit opinion. Conclusion Based on our review and the review of other accountants, nothing has come to our attention that causes us to believe that this financial information was not prepared, in all material respects, in accordance with IAS 34.
Additionally, based on our review and the review of other accountants, nothing has come to our attention that causes us to believe that this financial information is not prepared, in all material respects, in accordance with the disclosure provisions in Chapter D of the Securities Regulations (Periodic and Immediate Reports), 1970.
Without qualifying our above opinion, we draw attention to the following: 1. The contents of Note 6(A) to the financial statements regarding the suits filed against the Company
and its subsidiaries for legal proceedings, supervision by government authorities, other contingencies, laws and bills relating to the fuel and gas industry and infrastructure facilities. Based on the opinion of the legal counsel of the Company and its subsidiaries, the Company estimates that, at this stage, it is not possible to assess the aforementioned impact on the financial statements, if any exists, and therefore, no provisions regarding this matter were included in the financial statements.
2. The contents of Note 6(B) and Note 7 to the financial statements regarding the dependency of the
Group on services from infrastructure companies and from a natural gas supplier. Sincerely, Somekh Chaikin Certified Public Accountants Haifa, August 14, 2011

Oil Refineries Ltd.
B-2
Condensed Consolidated Interim Statement of Financial Position
USD thousands
June 30,
2011
June 30,
2010
December 31,
2010
(Unaudited) (Audited)
Current assets
Cash and cash equivalents 14,419 19,272 6,704
Deposits 45,746 65,060 126,991
Trade receivables 673,541 471,971 366,227
Other receivables 106,664 68,863 98,241
Financial derivatives 36,716 34,862(*) 27,577
Investments in financial assets at fair value through
comprehensive income 111,851 96,532 106,895
Inventory 1,184,532 1,004,515 1,200,922
Current tax assets 1,714 8,006 1,819
Total current assets 2,175,183 1,769,081 1,935,376
Non-current assets
Investments in equity-accounted investees 14,054 16,322 16,455
Financial assets at fair value through other comprehensive
income (**) 12,289 9,130 17,701
Loan to Haifa Early Pensions Ltd. 74,672 70,133 77,014
Long term loans and debit balances 1,739 3,479 3,501
Financial derivatives 217,659 118,176(*) 192,990
Employee benefit plan assets 7,488 9,682 7,922
Deferred tax assets 338 -- 307
Property, plant and equipment 2,142,504 1,900,585 2,030,414
Deferred costs 11,943 8,434 12,535
Intangible assets 73,624 86,782 78,950
Total non-current assets 2,556,310 2,222,723 2,437,789
Total assets 4,731,493 3,991,804 4,373,165
(*) Reclassified, see Note 2(D)(1)
(**) See Note 3(A)(2)(c)
Yossi Rosen
Chairman, Board of Directors
Pinhas Buchris
CEO
Igal Salhov
CFO
Date of approval of the financial statements: August 14, 2011
The accompanying notes are an integral part of the condensed consolidated interim financial statements.

Oil Refineries Ltd.
B-3
Condensed Consolidated Interim Statement of Financial Position
USD thousands
June 30,
2011
June 30,
2010
December 31,
2010
(Unaudited) (Audited)
Current liabilities
Loans and borrowings 603,408 866,475 773,792
Trade payables 1,053,631 553,725 619,037
Other payables 87,491 122,267 102,099
Current tax liabilities 24,990 -- 24,278
Financial derivatives 13,718 6,826 (*) 63,292
Other liabilities -- 13,350 --
Provisions 8,905 13,427 9,231
Total current liabilities 1,792,143 1,576,070 1,591,729
Non-current liabilities
Bank loans 801,866 290,039 624,468
Debentures (**) 872,333 820,791 872,421
Liabilities for finance lease 10,053 8,591 9,491
Financial derivatives 4,871 6,700 (*) 5,195
Employee benefits 71,613 61,822 70,537
Deferred tax liabilities 63,679 141,402 58,579
Total non-current liabilities 1,824,415 1,329,345 1,640,691
Total liabilities 3,616,558 2,905,415 3,232,420
Capital
Share capital 586,390 586,390 586,390
Share premium 100,242 100,242 100,242
Reserves (**) 62,697 33,636 45,516
Retained earnings (**) 365,606 366,121 408,597
Total capital 1,114,935 1,086,389 1,140,745
Total liabilities and capital 4,731,493 3,991,804 4,373,165
(*) Reclassified, see Note 2(D)(1)
(**) See Note 3(A)(2)(c)
The accompanying notes are an integral part of the condensed consolidated interim financial statements.

Oil Refineries Ltd.
B-4
Condensed Consolidated Interim Statement of Comprehensive Income USD thousands
Six months ended Three months ended Year ended
June 30,
2011
June 30,
2010
June 30,
2011
June 30,
2010
December
31, 2010
(Unaudited) (Unaudited) (Audited) Revenue 4,710,677 3,582,810 2,653,171 1,878,039 6,791,809 Cost of sales, refining and services
4,600,687
3,492,699(*) 2,618,718
1,829,162(*) 6,561,599 Revaluation of open positions in derivatives on prices of goods and margins, net (59,300) (38,032) (64,121) (42,676) 27,179
Total cost of sales 4,541,387 3,454,667 2,554,597 1,786,486 6,588,778 Gross profit 169,290 128,143 98,574 91,553 203,031 Selling and marketing expenses 50,286 55,995(*) 28,774 29,868(*) 99,282 General and administrative expenses 30,895 33,283(*) 16,247 18,615(*) 57,955 Operating profit 88,109 38,865 53,553 43,070 45,794 Financing income 35,304 59,277 28,140 29,694 89,330 Financing expenses (82,955) (67,716) (52,571) (26,026) (140,439) Financing income (expenses), net (47,651) (8,439) (24,431) 3,668 (51,109) Company’s share in profits (losses) of equity accounted investees, net of tax (3,538) 342 (3,808) 163 476
Profit (loss) before taxes on income 36,920 30,768 25,314 46,901 (4,839) Tax benefits (income tax) (12,540) (2,084) (7,063) (14,630) 81,619 Profit for the period 24,380 28,684 18,251 32,271 76,780 Items of other comprehensive income (loss)
Actuarial gains (losses) from a defined benefit plan, net of tax 82 (104) (192) (232) (5,724)
Foreign currency translation differences for foreign operations 819 (818) 93 (494) (309)
Effective share of the change in fair value of cash flow hedging, net of tax (981) -- (1,908) -- 3,529
Change in fair value of financial assets at fair value through other comprehensive income, net of tax (**) (4,763) (1,459) (5,095) (6,892) 6,143
Net change in fair value of debentures designated at fair value through other comprehensive income, attributable to change in credit risk, net of tax 1,976 -- 23,250 -- --
Other comprehensive income (loss) for the period, net of tax (2,867) (2,381) 16,148 (7,618) 3,639
Comprehensive income for the period 21,513 26,303 34,399 24,653 80,419 Earnings per share (USD) Basic and diluted earnings per ordinary share 0.010 0.012 0.008 0.013 0.032
(*) Reclassified, see Note 2(D)(2)
(**) See Note 3(A)(2)(c)
The accompanying notes are an integral part of the condensed consolidated interim financial statements.

Oil Refineries Ltd.
B-5
Condensed Consolidated Interim Statement of Changes in Equity
USD thousands
Share capital
Share
premium
Capital
reserve for
share-based
payment
Capital
reserve from
translation
differences
Capital
reserve for
financial
instruments at
fair value
through other
comprehensive
income (*)
Capital
reserve
Hedge
fund
Capital
reserve for
financial
liabilities at
fair value
Retained
earnings Total capital
Six months ended June 30, 2011
Balance at January 1, 2011 (audited) 586,390 100,242 6,406 (1,310) 8,413 28,478 3,529 -- 408,597 1,140,745
Cumulative effect of initial application of IFRS 9 at
January 1, 2011 -- -- -- -- -- -- -- 20,130 (67,453) (47,323)
Balance at January 1, 2011 subsequent to initial
application of IFRS 9 586,390 100,242 6,406 (1,310) 8,413 28,478 3,529 20,130 341,144 1,093,422 Profit for the period -- -- -- -- -- -- -- -- 24,380 24,380 Other comprehensive income (loss): Actuarial gains from a defined benefit plan, net of tax -- -- -- -- -- -- -- -- 82 82 Foreign currency translation differences for foreign
operations -- -- -- 819 -- -- -- -- -- 819 Effective share of the change in fair value of cash
flow hedging, net of tax -- -- -- -- -- -- (981) -- -- (981) Change in fair value of financial assets at fair value
through other comprehensive income, net of tax
(*) -- -- -- -- (4,763) -- -- -- -- (4,763) Net change in fair value of debentures designated at
fair value through other comprehensive income,
attributable to change in credit risk, net of tax -- -- -- -- -- -- - 1,976 -- 1,976
Total other comprehensive income (loss) for the
period, net of tax (*) -- -- -- 819 (4,763) -- (981) 1,976 82 (2,867) Total other comprehensive income (loss) for the
period -- -- -- 819 (4,763) -- (981) 1,976 24,462 21,513 Balance at June 30, 2011 (unaudited) 586,390 100,242 6,406 (491) 3,650 28,478 2,548 22,106 365,606 1,114,935
(*) See Note 3(A)(2)
The accompanying notes are an integral part of the condensed consolidated interim financial statements.

Oil Refineries Ltd.
B-6
Condensed Consolidated Interim Statement of Changes in Equity (Contd.)
USD thousands
Share capital
Share
premium
Capital
reserve for
share-based
payment
Capital
reserve from
translation
differences
Capital
reserve for
financial
instruments at
fair value
through other
comprehensive
income (*)
Capital
reserve
Hedge
fund
Capital
reserve for
financial
liabilities at
fair value
Retained
earnings Total capital
Six months ended June 30, 2010
Balance at January 1, 2010 (audited) 586,390 100,242 5,824 (1,001) 2,270 28,478 412,541 1,134,744 17,183 1,151,927 Comprehensive income for the period:
Profit for the period -- -- -- -- -- -- 28,684 28,684 -- 28,684 Other comprehensive loss: Actuarial losses from a defined benefit plan, net of
tax -- -- -- -- -- -- (104) (104) -- (104) Foreign currency translation differences for foreign
operations -- -- -- (818) -- -- -- (818) -- (818) Change in fair value of assets classified as available
for sale, net of tax -- -- -- -- (1,459) -- -- (1,459) -- (1,459) Other comprehensive loss for the period, net of tax -- -- -- (818) (1,459) -- (104) (2,381) -- (2,381) Total other comprehensive income (loss) for the
period -- -- -- (818) (1,459) -- 28,580 26,303 -- 26,303 Dividend paid -- -- -- -- -- -- (75,000) (75,000) -- (75,000) Share-based payment -- -- 342 -- -- -- -- 342 -- 342 Acquisition of non-controlling interests in a
subsidiary -- -- -- -- -- -- -- -- (17,183) (17,183) Balance at June 30, 2010 (unaudited) 586,390 100,242 6,166 (1,819) 811 28,478 366,121 1,086,389 -- 1,086,389
The accompanying notes are an integral part of the condensed consolidated interim financial statements.

Oil Refineries Ltd.
B-7
Condensed Consolidated Interim Statement of Changes in Equity (Contd.)
USD thousands
Share capital
Share
premium
Capital reserve for
share-based
payment
Capital reserve from
translation
differences
Capital reserve for financial
instruments at fair value
through other
comprehensive
income (*)
Capital
reserve
Hedge
fund
Capital reserve for financial
liabilities at
fair value
Retained
earnings Total capital
Three months ended June 30, 2011
(Unaudited) Balance at April 1, 2011 586,390 100,242 6,406 (584) 8,745 28,478 4,456 (1,144) 347,547 1,080,536 Comprehensive income for the period: Profit for the period -- -- -- -- -- -- -- -- 18,251 18,251 Other comprehensive income (loss): Actuarial losses from a defined benefit plan, net of tax -- -- -- -- -- -- -- -- (192) (192) Foreign currency translation differences for foreign
operations -- -- -- 93 -- -- -- -- -- 93 Effective share of the change in fair value of cash flow
hedging, net of tax -- -- -- -- -- -- (1,908) -- -- (1,908) Change in fair value of financial assets at fair value
through other comprehensive income, net of tax (*) -- -- -- -- (5,095) -- -- -- -- (5,095) Net change in fair value of debentures designated at
fair value through profit or loss, attributable to change
in credit risk, net of tax (*) -- -- -- -- -- -- -- 23,250 -- 23,250 Total other comprehensive income (loss) for the period,
net of tax -- -- -- 93 (5,095) -- (1,908) 23,250 (192) 16,148 Total other comprehensive income (loss) for the
period -- -- -- 93 (5,095) -- (1,908) 23,250 18,059 34,399 Balance at June 30, 2011 586,390 100,242 6,406 (491) 3,650 28,478 2,548 22,106 365,606 1,114,935
(*) See Note 3(A)(2).
The accompanying notes are an integral part of the condensed consolidated interim financial statements.
Oil Refineries Ltd.
B-8
Condensed Consolidated Interim Statement of Changes in Equity (Contd.)
USD thousands
Share
capital
Share
premium
Capital
reserve for share-based
payment
Capital
reserve from translation
differences
Capital
reserve for
available-for-
sale financial
assets Capital
reserve
Retained
earnings
Total
capital
Three months ended June 30, 2010
(Unaudited) Balance at April 1, 2010 586,390 100,242 5,995 (1,325) 7,703 28,478 334,082 1,061,565 Comprehensive income for the period:
Profit for the period -- -- -- -- -- -- 32,271 32,271 Other comprehensive loss: Actuarial losses from a defined benefit plan, net of tax -- -- -- -- - -- (232) (232) Foreign currency translation differences for foreign operations -- -- -- (494) -- -- -- (494) Change in fair value of assets classified as available for sale, net of tax -- -- -- -- (6,892) -- -- (6,892) Total other comprehensive loss for the period, net of tax -- -- -- (494) (6,892) -- (232) (7,618) Total other comprehensive income (loss) for the period -- -- -- (494) (6,892) -- 32,039 24,653 Share-based payment -- -- 171 -- -- -- -- 171 Balance at June 30, 2010 586,390 100,242 6,166 (1,819) 811 28,478 366,121 1,086,389
The accompanying notes are an integral part of the condensed consolidated interim financial statements.
Oil Refineries Ltd.
B-9
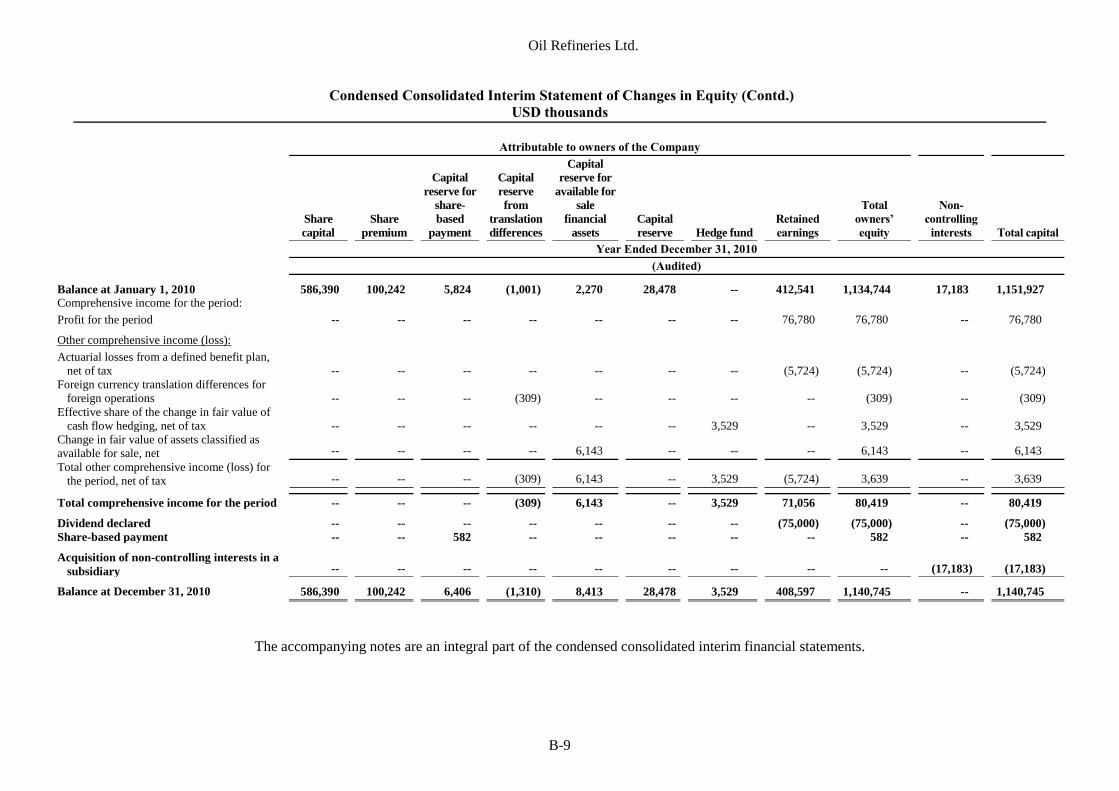
Condensed Consolidated Interim Statement of Changes in Equity (Contd.)
USD thousands
Attributable to owners of the Company
Share
capital
Share
premium
Capital
reserve for
share-
based
payment
Capital
reserve
from
translation
differences
Capital
reserve for
available for
sale
financial
assets
Capital
reserve Hedge fund
Retained
earnings
Total
owners’
equity
Non-
controlling
interests Total capital
Year Ended December 31, 2010
(Audited) Balance at January 1, 2010 586,390 100,242 5,824 (1,001) 2,270 28,478 -- 412,541 1,134,744 17,183 1,151,927 Comprehensive income for the period:
Profit for the period -- -- -- -- -- -- -- 76,780 76,780 -- 76,780 Other comprehensive income (loss): Actuarial losses from a defined benefit plan,
net of tax -- -- -- -- -- -- -- (5,724) (5,724) -- (5,724) Foreign currency translation differences for
foreign operations -- -- -- (309) -- -- -- -- (309) -- (309) Effective share of the change in fair value of
cash flow hedging, net of tax -- -- -- -- -- -- 3,529 -- 3,529 -- 3,529 Change in fair value of assets classified as
available for sale, net -- -- -- -- 6,143 -- -- -- 6,143 -- 6,143 Total other comprehensive income (loss) for
the period, net of tax -- -- -- (309) 6,143 -- 3,529 (5,724) 3,639 -- 3,639 Total comprehensive income for the period -- -- -- (309) 6,143 -- 3,529 71,056 80,419 -- 80,419 Dividend declared -- -- -- -- -- -- -- (75,000) (75,000) -- (75,000) Share-based payment -- -- 582 -- -- -- -- -- 582 -- 582 Acquisition of non-controlling interests in a
subsidiary -- -- -- -- -- -- -- -- -- (17,183) (17,183) Balance at December 31, 2010 586,390 100,242 6,406 (1,310) 8,413 28,478 3,529 408,597 1,140,745 -- 1,140,745
The accompanying notes are an integral part of the condensed consolidated interim financial statements.
Oil Refineries Ltd.
B-10
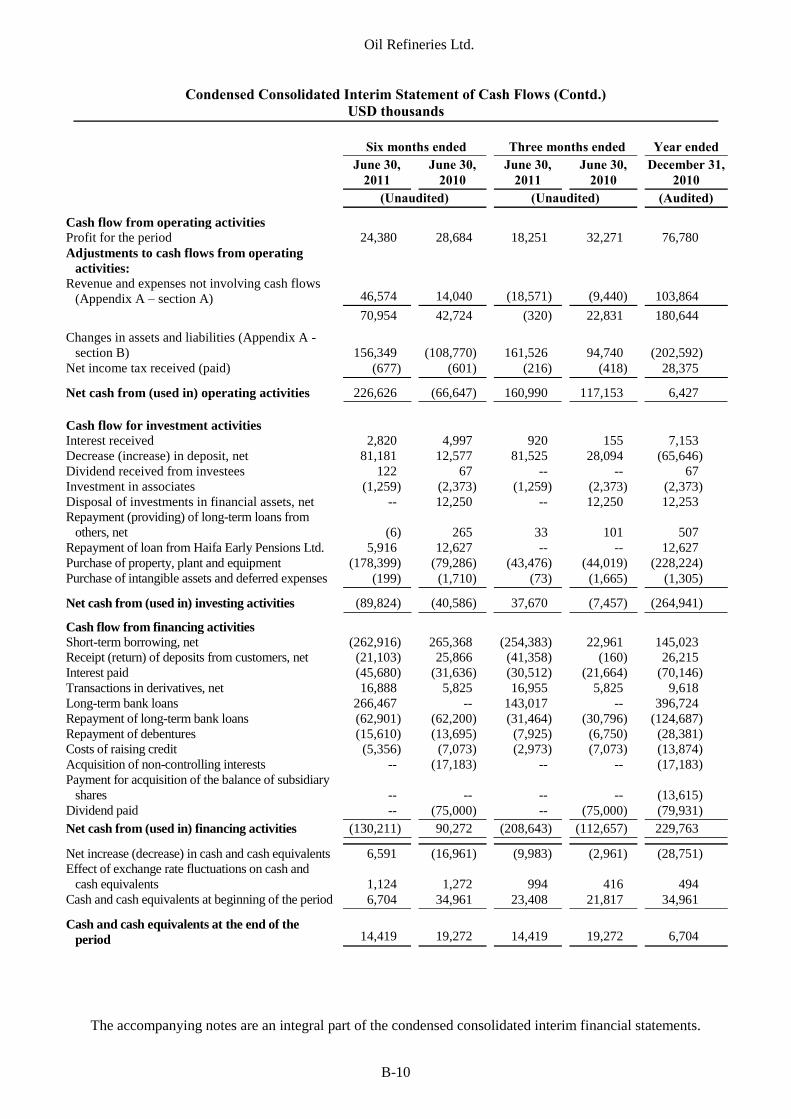
Condensed Consolidated Interim Statement of Cash Flows (Contd.)
USD thousands
Six months ended Three months ended Year ended
June 30,
2011
June 30,
2010
June 30,
2011
June 30,
2010
December 31,
2010
(Unaudited) (Unaudited) (Audited) Cash flow from operating activities
Profit for the period 24,380 28,684 18,251 32,271 76,780 Adjustments to cash flows from operating
activities:
Revenue and expenses not involving cash flows
(Appendix A – section A) 46,574 14,040 (18,571) (9,440) 103,864
70,954 42,724 (320) 22,831 180,644 Changes in assets and liabilities (Appendix A -
section B) 156,349 (108,770) 161,526 94,740 (202,592)
Net income tax received (paid) (677) (601) (216) (418) 28,375 Net cash from (used in) operating activities 226,626 (66,647) 160,990 117,153 6,427
Cash flow for investment activities
Interest received 2,820 4,997 920 155 7,153
Decrease (increase) in deposit, net 81,181 12,577 81,525 28,094 (65,646)
Dividend received from investees 122 67 -- -- 67 Investment in associates (1,259) (2,373) (1,259) (2,373) (2,373) Disposal of investments in financial assets, net -- 12,250 -- 12,250 12,253 Repayment (providing) of long-term loans from
others, net (6) 265 33 101 507
Repayment of loan from Haifa Early Pensions Ltd. 5,916 12,627 -- -- 12,627 Purchase of property, plant and equipment (178,399) (79,286) (43,476) (44,019) (228,224)
Purchase of intangible assets and deferred expenses (199) (1,710) (73) (1,665) (1,305) Net cash from (used in) investing activities (89,824) (40,586) 37,670 (7,457) (264,941) Cash flow from financing activities
Short-term borrowing, net (262,916) 265,368 (254,383) 22,961 145,023
Receipt (return) of deposits from customers, net (21,103) 25,866 (41,358) (160) 26,215
Interest paid (45,680) (31,636) (30,512) (21,664) (70,146)
Transactions in derivatives, net 16,888 5,825 16,955 5,825 9,618
Long-term bank loans 266,467 -- 143,017 -- 396,724 Repayment of long-term bank loans (62,901) (62,200) (31,464) (30,796) (124,687) Repayment of debentures (15,610) (13,695) (7,925) (6,750) (28,381) Costs of raising credit (5,356) (7,073) (2,973) (7,073) (13,874) Acquisition of non-controlling interests -- (17,183) -- -- (17,183) Payment for acquisition of the balance of subsidiary
shares -- -- -- -- (13,615) Dividend paid -- (75,000) -- (75,000) (79,931)
Net cash from (used in) financing activities (130,211) 90,272 (208,643) (112,657) 229,763 Net increase (decrease) in cash and cash equivalents 6,591 (16,961) (9,983) (2,961) (28,751)
Effect of exchange rate fluctuations on cash and
cash equivalents 1,124 1,272 994 416 494 Cash and cash equivalents at beginning of the period 6,704 34,961 23,408 21,817 34,961 Cash and cash equivalents at the end of the
period 14,419 19,272 14,419 19,272 6,704
The accompanying notes are an integral part of the condensed consolidated interim financial statements.

Oil Refineries Ltd.
B-11
Condensed Consolidated Interim Statement of Cash Flows (Contd.)
USD thousands
Appendix A: Adjustments required to present cash flows from operating activities
Six months ended Three months ended Year ended
June 30,
2011
June 30,
2010
June 30,
2011
June 30,
2010
December 31,
2010
(Unaudited) (Unaudited) (Audited) A. Income and expenses not included in the
cash flow:
Depreciation and amortization 65,600 68,768 33,027 29,792 119,271
Financing expenses (income), net 29,524 (16,303) 4,734 (13,315) 40,039
Net changes in fair value of derivatives (56,765) (38,037) (61,177) (43,723) 30,401
Changes in fair value of the loan to Haifa
Early Pensions Ltd. (2,971) (724) (2,671) 1,506 (8,512)
Share in the losses (profits) of equity-
accounted investees 3,538 (342) 3,808 (163) (476)
Loss (profit) from deposits and investments in
financial assets, net (4,892) (1,748) (3,355) 1,662 4,178
Share-based payments -- 342 -- 171 582
Income tax (tax benefit) 12,540 2,084 7,063 14,630 (81,619)
46,574 14,040 (18,571) (9,440) 103,864
B. Changes in assets and liabilities
Increase in trade receivables (313,463) (113,015) (112,642) (36,021) (5,716)
Decrease (increase) in other receivables (8,015) (14,468) (22,922) 36,292 (46,913)
Decrease (increase) in inventory 18,188 1,554 41,012 197,085 (185,552)
Increase (decrease) in trade payables 440,481 26,251 256,283 (84,157) 58,326
Increase (decrease) in other payables and
provisions 17,530 (7,826) (1,396) (16,886) (25,132)
Increase (decrease) in employee benefits, net 1,628 (1,266) 1,191 (1,573) 2,395
156,349 (108,770) 161,526 94,740 (202,592)
The accompanying notes are an integral part of the condensed consolidated interim financial statements.

Oil Refineries Ltd.
Notes to the Consolidated Condensed Interim Financial Statements
USD thousands
B-12
NOTE 1 – GENERAL
Reporting entity A.
1) Oil Refineries Ltd. (“the Company” or “ORL”) is a company domiciled and incorporated in
Israel. The Company is located in Haifa Bay and its official address is POB 4, Haifa 31000. The
Company’s shares are traded on the Tel Aviv Stock Exchange (“TASE”). The Company and its
subsidiaries are industrial companies which operate in Israel and are engaged primarily in the
production of oil products, feedstock for the petrochemical industry, materials for the plastics
industry, oils, waxes and byproducts. The facilities of the subsidiaries are integrated with those
of the Company. The Company also provides water treatment and power generation services
(primarily electricity and steam) to a number of industries adjacent to the Haifa refinery.
2) The Group’s condensed consolidated interim financial statements as of June 30, 2011 include
the statements of the Company and its subsidiaries (together: “the Group”) and the Group’s
interests in associates.
NOTE 2 - BASIS OF PREPARATION
Statement of compliance A.
The condensed consolidated interim financial statements have been prepared in accordance with IAS
34, Interim Financial Reporting, and do not include all of the information required for full annual
financial statements. They should be read together with the financial statements for the year ended
December 31, 2010 (“the Annual Statements”). Additionally, these statements were prepared in
accordance with Chapter D of the Securities Regulations (Periodic and Immediate Reports), 1970.
The condensed consolidated interim financial statements were approved by the Company’s Board of
Directors on August 14, 2011.
Use of estimates and judgments B.
The preparation of the condensed consolidated interim financial statements in conformity with IFRS
requires management to make judgments, estimates and assumptions that affect the application of
accounting policies and the reported amounts of assets, liabilities, income and expenses. Actual
results may differ from these estimates. The judgment of management, when applying the Group’s
accounting policy and the principal assumptions used in assessments that involve uncertainty, are
consistent with those used in the annual financial statements.
Estimates and their underlying assumptions are reviewed on an ongoing basis. Revisions to
accounting estimates are recognized in the period in which the estimates are revised and in any
future periods affected.
Capital and debt management – objectives, procedures and processes C.
The policy of the Board of Directors and management is consistent with the policy applied in the
Annual Statements. The Company and its subsidiaries are subject to compliance with financial
covenants (see Note 14(C) to the Annual Statements).
At June 30, 2011, all the companies are in compliance with all the financial covenants that apply to
them.
Financial covenants of Carmel Olefins: Further to Note 14(C) to the Annual Statements, at the end of
the reporting period, Carmel Olefins has complied, for four consecutive quarters, with the financial
covenants undertaken prior to the series of agreements. Accordingly, Carmel Olefins intends to take
steps to terminate the series of agreements.

Oil Refineries Ltd.
Notes to the Consolidated Condensed Interim Financial Statements
USD thousands
B-13
NOTE 2 - BASIS OF PREPARATION (CONTD.)
Reclassification D.
1) Current maturities of financial derivatives at June 30, 2010, presented in the past as non-current
assets and non-current liabilities were classified as current assets and current liabilities to reflect
their contractual repayment date.
June 30, 2010
As previously
reported
Effect of
reclassification
As reported in
these financial
statements
Financial derivatives presented:
In current assets 13,958 20,904 34,862
In non-current assets 139,080 (20,904) 118,176
In current liabilities 249 6,577 6,826
In non-current liabilities 13,277 (6,577) 6,700
2) Some of the comparative figures in the statement of comprehensive income for the six and three
months ended June 30, 2010 were reclassified in order to adjust their presentation method to the
presentation in the statement of comprehensive income for the six and three months ended June
30, 2011.
Six months ended June 30, 2010
As previously
reported
Effect of
reclassification
As reported in
these financial
statements
Cost of sales, refining and services (3,491,686) (1,013) (3,492,699)
Selling and marketing expenses (55,874) (121) (55,995)
General and administrative expenses (34,417) 1,134 (33,283)
Three months ended June 30, 2010
As previously
reported
Effect of
reclassification
As reported in
these financial
statements
Cost of sales, refining and services (1,828,033) (1,129) (1,829,162)
Selling and marketing expenses (29,785) (83) (29,868)
General and administrative expenses (19,827) 1,212 (18,615)

Oil Refineries Ltd.
Notes to the Consolidated Condensed Interim Financial Statements
USD thousands
B-14
NOTE 3 - SIGNIFICANT ACCOUNTING POLICIES
The Group’s accounting policy in these condensed consolidated interim statements is the same policy
applied in the Annual Statements, other than those set out in section A below.
Initial application of new standards A.
1) Interim financial reporting
As from January 1, 2011, the Group applies the amendment to IAS 34, Interim Financial
Reporting: Significant Events and Transactions ("the Amendment"), published as part of the
Annual Improvements to IFRSs, 2010. The Amendment expands the list of events and
transactions requiring disclosure in interim financial statements. In addition, the minimum
requirement for disclosure in the current standard, prior to the Amendment, was eliminated. The
disclosures required according to the Amendment are reflected, as relevant, in these condensed
interim financial statements.
2) Early application of IFRS 9 (2010), Financial Instruments
As from January 1, 2011, the Group applies, through early adoption, IFRS 9 (2010), Financial
Instruments ("the Standard") with a date of initial application of January 1, 2011. According to
the Standard, there are two principal categories for measuring financial assets: amortized cost
and fair value. Debt instruments are classified on the basis of the entity’s business model for
managing financial assets and the contractual cash flow characteristics of the financial asset. In
addition, the investment in equity instruments is measured at fair value with fair value changes
recognized in profit or loss or other comprehensive income, as the Company elects at the date of
initial application. The Standard also includes an option, in certain cases, to designate financial
liabilities at fair value through profit or loss, when fair value changes from changes in the
Company's credit risk are, in general, recognized in other comprehensive income.
These changes in accounting policy are applied retrospectively for all financial assets and
liabilities which have not been derecognized at the date of initial application. According to the
exemption in the Standard, the Group elected not to restate comparative figures. Accordingly, at
January 1, 2011, the Group recognized the cumulative effect of application of the Standard in
retained earnings and in other items of equity as specified in section (C) below.
The accounting policies for assets and liabilities stated in comparative figures are the same as
those policies described in the note on significant accounting policies in the Annual Statements.
Policies applied as from January 1, 2011 for financial instruments not derecognized at the date
of initial application of IFRS 9 (2010):
A) Non-derivative financial instruments
Initial recognition of financial assets
The Group initially recognizes loans and receivables and deposits as they are incurred. All
other financial assets acquired in a regular way purchase are initially recognized on the
trade date, which is the date on which the Group becomes a party to the contractual
provisions of the instrument, meaning on the date the Group has undertaken to buy or sell
the asset.
Financial assets are initially measured at fair value. When a financial asset is not
subsequently measured at fair value through profit and loss, initial measurement includes
transaction costs directly attributable to the acquisition or issue of the asset. Subsequent to
initial recognition, the Group measures financial assets at fair value or amortized cost.

Oil Refineries Ltd.
Notes to the Consolidated Condensed Interim Financial Statements
USD thousands
B-15
NOTE 3 - SIGNIFICANT ACCOUNTING POLICIES
A. Initial application of new Accounting Standards (contd.)
2) Early application of IFRS 9 (2010), Financial Instruments (contd.)
A) Non-derivative financial instruments (contd.)
Financial assets measured at amortized cost
Subsequent to initial recognition, a financial asset is measured at amortized cost using the
effective interest method, less impairment loss, if the objective of the business model is to
hold assets to collect contractual cash flows, and the contractual terms give rise, on specific
dates, to cash flows that are solely payments of principal and interest. Group policy
regarding impairment is the same as the policy applied in the financial statements for the
year ended December 31, 2010 for loans and receivables.
Financial assets measured at fair value
All financial assets that are not measured at amortized cost are measured subsequent to
initial recognition at fair value and all fair value changes are generally recognized in profit
or loss.
Nevertheless, the Standard allows an entity, on the initial recognition of an equity
instrument not held for trading, to elect irrevocably to present fair value changes in the
equity instrument in other comprehensive income. The Group elected to present profits or
losses for equity instruments previously classified as available for sale financial assets in
other comprehensive income as described below. For instruments measured at fair value
through other comprehensive income, the amount presented in profit or loss is never
reclassified to profit or loss and impairment is not recognized in profit and loss. Fair value
changes of these instruments are recognized in capital reserve for financial assets through
other comprehensive income. Dividends on equity instruments are recognized in profit or
loss, unless they clearly constitute a return on an initial investment.
B) Non-derivative financial liabilities
The Group initially recognizes debt instruments as they are incurred. All other financial
liabilities are initially recognized at the trade date when the Company becomes party to the
contractual provisions of the instrument.
Financial liabilities are derecognized when the obligation of the Group, as specified in the
agreement, expires or when it is settled or annulled.
Financial liabilities (other than financial liabilities designated at fair value through profit or
loss as detailed below) are initially recognized at fair value plus all attributable transaction
costs. Subsequent to initial recognition, these financial liabilities are measured at amortized
cost using the effective interest method.
Upon initial application of IFRS 9 (2010), the Group elected to designate certain financial
liabilities, which had not been derecognized at that date, at fair value through profit or loss
to reduce accounting mismatch, as described in section C below. For these financial
liabilities, as from January 1, 2011, fair value changes, attributable to credit risk, are
recognized in other comprehensive income.
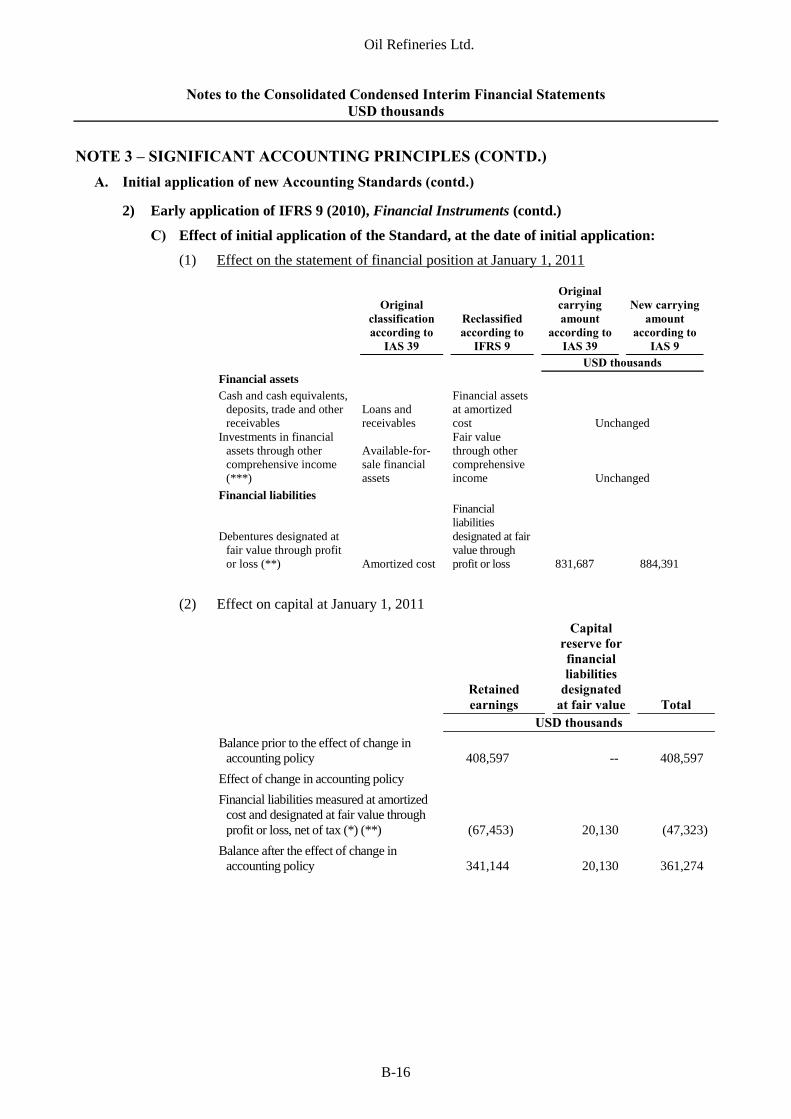
Oil Refineries Ltd.
Notes to the Consolidated Condensed Interim Financial Statements
USD thousands
B-16
NOTE 3 – SIGNIFICANT ACCOUNTING PRINCIPLES (CONTD.)
A. Initial application of new Accounting Standards (contd.)
2) Early application of IFRS 9 (2010), Financial Instruments (contd.)
C) Effect of initial application of the Standard, at the date of initial application:
(1) Effect on the statement of financial position at January 1, 2011
Original
classification
according to
IAS 39
Reclassified
according to
IFRS 9
Original
carrying
amount
according to
IAS 39
New carrying
amount
according to
IAS 9
USD thousands
Financial assets Cash and cash equivalents,
deposits, trade and other
receivables Loans and
receivables
Financial assets
at amortized
cost Unchanged Investments in financial
assets through other
comprehensive income
(***)
Available-for-
sale financial
assets
Fair value
through other
comprehensive
income Unchanged
Financial liabilities
Debentures designated at
fair value through profit
or loss (**) Amortized cost
Financial
liabilities
designated at fair
value through
profit or loss 831,687 884,391
(2) Effect on capital at January 1, 2011
Retained
earnings
Capital
reserve for
financial
liabilities
designated
at fair value Total
USD thousands
Balance prior to the effect of change in
accounting policy 408,597 -- 408,597
Effect of change in accounting policy
Financial liabilities measured at amortized
cost and designated at fair value through
profit or loss, net of tax (*) (**) (67,453) 20,130 (47,323)
Balance after the effect of change in
accounting policy 341,144 20,130 361,274

Oil Refineries Ltd.
Notes to the Consolidated Condensed Interim Financial Statements
USD thousands
B-17
NOTE 3 – SIGNIFICANT ACCOUNTING PRINCIPLES (CONTD.)
A. Initial application of new Accounting Standards (contd.)
2) Early application of IFRS 9 (2010), Financial Instruments (contd.)
C) Effect of initial application of the Standard, at the date of initial application -
(contd.):
(2) Effect on capital at January 1, 2011 (contd.)
(*) The effect of initial application of IFRS 9 (2010) on the opening balance of deferred
taxes as of January 1, 2011 is reflected in a tax asset of USD 7.642 million. Of this
amount, a tax asset of USD 10.833 million was attributed to retained earnings and a
tax reserve of USD 3.241 million was attributed to capital reserve for financial
liabilities designated at fair value.
(**) Upon initial application, the Group elected to designate some of its marketable CPI-
linked NIS-based debentures, against which the Group holds futures contracts for
converting the contractual cash flows from the debentures to USD-based cash flows at
variable interest, at fair value through profit or loss. The objective of this designation
is to significantly reduce accounting mismatch from measurement of related currency
and interest swap contracts at fair value through profit or loss, while up to December
31, 2010, these debentures were measured at amortized cost.
Upon initial application, the Group assessed whether recognizing the change in
fair value attributable to the Company's credit risk in other comprehensive
income, according to the default model prescribed by the Standard, would create
or aggravate accounting mismatch in profit or loss. The Group found that the
change in fair value should be recognized in other comprehensive income, since a
change in fair value of the futures contracts, which was determined using the
applicable projected risk-free interest rate ("the Benchmark Interest Rate"),
significantly offset changes to the fair value of debentures arising from changes
in the Benchmark Interest Rate. Other changes to the fair value of debentures
arising mainly from changes in the Group's credit risk do not have the same
effect on the fair value of the futures contracts. Accordingly, recognizing changes
to fair value attributable to credit risk changes in other comprehensive income
does not create or aggravate accounting mismatch in profit or loss. Therefore,
changes in the fair value of the debentures, attributable to changes in credit risk,
are recognized in other comprehensive income as from January 1, 2011.
The Group has elected to measure changes in the fair value of these debentures,
attributable to changes in credit risk, as the amount of the change in fair value
that is not attributable to changes in market conditions arising from identifiable
market risks (attributable mainly to the Benchmark Interest Rate, the CPI and the
exchange rate), as follows:
(1) The Group calculated the internal rate of return of the debentures at the issue
date, at their fair value (based on the quoted price of the debentures on the
TASE), and their cash flows at that date. The Group deducted the Benchmark
Interest Rate at the issue date from this internal rate of return, to achieve the
specific component attributable to the credit risk of the debentures at that
date.
(2) Upon initial application and in each subsequent reporting period, the Group
calculates the present value of the debentures by discounting their cash flows
at the relevant date, using the Benchmark Interest Rate for that date plus the
component attributable to the credit risk as calculated in section (1) above.

Oil Refineries Ltd.
Notes to the Consolidated Condensed Interim Financial Statements
USD thousands
B-18
NOTE 3 – SIGNIFICANT ACCOUNTING PRINCIPLES (CONTD.)
A. Initial application of new Accounting Standards (contd.)
2) Early application of IFRS 9 (2010), Financial Instruments (contd.)
C) Effect of initial application of the Standard, at the date of initial application:
(2) Effect on capital at January 1, 2011 (contd.)
(3) The difference between the fair value of the liabilities at the date of initial
application and in each subsequent reporting period, based as aforesaid on the
quoted price of the debentures on the TASE, and the amount calculated in
section (2) above, is the amount attributable to credit risk and recognized in
other comprehensive income, as aforesaid. The Group believes that this
method for determining the change in fair value attributable to the credit risk
is appropriate, since the only significant change in market conditions
attributable to the debentures is due to changes in the Benchmark Interest
Rate.
(***) The Group intends to maintain this equity investment in the long term, accordingly,
upon initial application of the Standard, the Group elected to designate this investment
at fair value through other comprehensive income.
D) Difference between the carrying amount of the financial liabilities designated at fair
value and the amount to be paid upon maturity
Carrying
amount
Amount to be
paid at the
maturity date Difference
USD thousands
Balance at January 1, 2011 884,391 828,443 55,948
Balance at June 30, 2011 903,208 876,353 26,855

Oil Refineries Ltd.
Notes to the Consolidated Condensed Interim Financial Statements
USD thousands
B-19
NOTE 3 – SIGNIFICANT ACCOUNTING PRINCIPLES (CONTD.)
New standards and interpretations not yet adopted B.
1) IFRS 10, Consolidated Financial Statements ("the Standard")
The Standard supersedes the guidelines of IAS 27, Consolidated and Separate Financial
Statements and the guidelines of SIC 12, Consolidation - Special Purpose Entities for
consolidation of financial statements, so that IAS 27 will continue to apply only to separate
financial statements.
The Standard presents a new control model for determining whether an investor controls the
investee and consequently, whether that investee should be consolidated. This model will be
applied for all investees. According to the model, an investor controls an investee when the
investor is exposed, or has rights, to variable returns from its involvement with the investee, has
the ability to affect these returns through its power over the investee and there is a correlation
between power and returns.
Main changes:
The Standard presents a model requiring judgment and analysis of all relevant facts and
circumstances when assessing control and the need to determine who controls an investee.
The Standard presents a single model of control that will be applied for all investees, whether in
the scope of IAS 27 or SIC 12.
De facto circumstances will be taken into account in assessing control, meaning consolidation of
statements is required if there is effective control.
When assessing control, all the substantive potential voting rights are taken into account.
Reference should be made to the structure, reasons for the rights and terms of the potential voting
rights.
The Standard provides guidance for application and a list of indicators for assessing whether a
decision maker is acting as a principal or as an agent when determining whether an investor
controls the investee.
The Standard provides guidance for those cases where an investor will assess control through
silos so that the assessment will be for specific assets.
The Standard defines protective rights, which is not defined in existing standards.
Exposure to risks and benefits through an investee does not in itself determine that an investor
controls an investee, but is one of the factors to be examined when assessing control
The Standard is effective retrospectively for annual periods commencing on or after January 1,
2013 (other than for certain exemptions). Early application is permitted, subject to disclosure
and early adoption of the entire set of new standards, including the two other standards that
were published at the same time: IFRS 11, Joint Arrangements and IFRS 12, Disclosure of
Involvement with Other Entities. The Group has yet to assess the expected implications of
adoption of the Standard on the Group's financial statements.

Oil Refineries Ltd.
Notes to the Consolidated Condensed Interim Financial Statements
USD thousands
B-20
NOTE 3 – SIGNIFICANT ACCOUNTING PRINCIPLES (CONTD.)
B. New standards and interpretations not yet adopted (contd.)
2) IFRS 13, Fair Value Measurement ("the Standard")
The Standard supersedes the guidelines for fair value measurement in other IFRSs and will
serve as a single source for fair value measurement under IFRS. For this purpose, the Standard
defines fair value, provides guidelines for fair value measurement and determines disclosure
requirements for fair value measurement. The Standard does not prescribe new requirements for
fair value measurement of assets or liabilities.
The Standard applies to assets, liabilities and equity instruments of an entity which are required
or permitted to be measured at fair value or for which fair value disclosure has been made
according to relevant IFRSs. However, the Standard does not apply to share-based payments
within the scope of IFRS 2, Share-based Payment or to leasing transactions within the scope of
IAS 17, Leases. Furthermore, the Standard does not apply to measurements that are similar to
fair value but are not fair value (such as net realizable value of inventory).
The Standard is effective for annual periods beginning on January 1, 2013. Early adoption is
permitted, with disclosure. The Standard will be applied prospectively and disclosure
requirements will not apply to comparative information for periods prior to initial application of
the Standards.
The Group has yet to assess the expected implications of adoption of the Standard on the
Group's financial statements.
3) Amendment to IAS 1, Presentation of Financial Statements regarding presentation of items
of other comprehensive income ("the Amendment")
The Standard changes the presentation of items of other comprehensive in financial statements,
so that items of other comprehensive income which after initial recognition as comprehensive
income are to be transferred to profit or loss, will be presented separately from items of other
comprehensive income which are never transferred to profit or loss. The Amendment also
renames the statement from "statement of comprehensive income" to "statement of income and
other comprehensive income". However, companies may use other names. The Amendment is
effective retrospectively for annual periods commencing on or after July 1, 2012. Early adoption
is permitted, with disclosure.
The Group has yet to assess the implications of adoption of the Amendment on the Group's
financial statements.
4) Amendment to IAS 19, Employee Benefits ("the Standard")
The Amendment includes a number of revisions to accounting guidelines for employee benefits.
Main points of the amendments:
The Amendment eliminates the option to defer recognition of actuarial gains or losses (the
corridor method), and eliminates the option to recognize actuarial gains or losses directly in profit
or loss. Consequently, all actuarial gains or losses are recognized immediately in equity through
other comprehensive income.
The amendment requires immediate recognition of past service costs regardless of whether or not
the benefits have vested
Net financing income (expenses) are calculated by multiplying the net defined benefit liability
(asset) by the discount rate used to measure the defined benefit liability Accordingly, the
calculation of actuarial gains or losses has also changed.
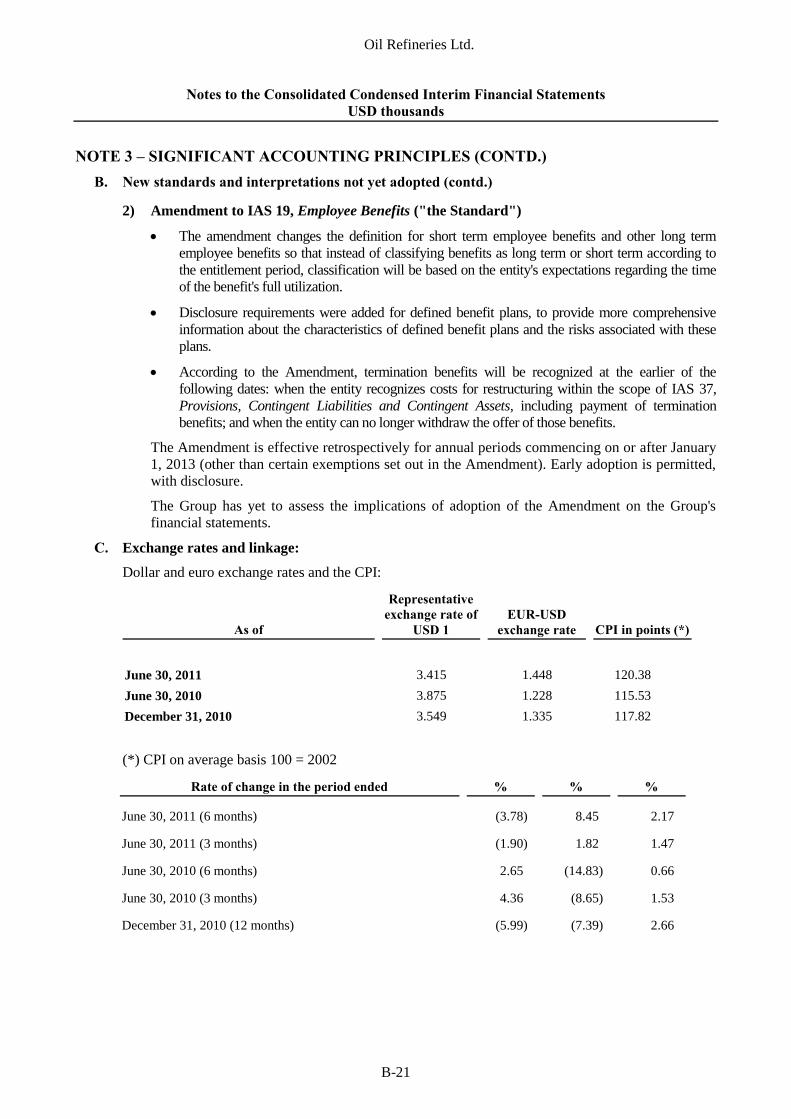
Oil Refineries Ltd.
Notes to the Consolidated Condensed Interim Financial Statements
USD thousands
B-21
NOTE 3 – SIGNIFICANT ACCOUNTING PRINCIPLES (CONTD.)
B. New standards and interpretations not yet adopted (contd.)
2) Amendment to IAS 19, Employee Benefits ("the Standard")
The amendment changes the definition for short term employee benefits and other long term
employee benefits so that instead of classifying benefits as long term or short term according to
the entitlement period, classification will be based on the entity's expectations regarding the time
of the benefit's full utilization.
Disclosure requirements were added for defined benefit plans, to provide more comprehensive
information about the characteristics of defined benefit plans and the risks associated with these
plans.
According to the Amendment, termination benefits will be recognized at the earlier of the
following dates: when the entity recognizes costs for restructuring within the scope of IAS 37,
Provisions, Contingent Liabilities and Contingent Assets, including payment of termination
benefits; and when the entity can no longer withdraw the offer of those benefits.
The Amendment is effective retrospectively for annual periods commencing on or after January
1, 2013 (other than certain exemptions set out in the Amendment). Early adoption is permitted,
with disclosure.
The Group has yet to assess the implications of adoption of the Amendment on the Group's
financial statements.
Exchange rates and linkage: C.
Dollar and euro exchange rates and the CPI:
As of
Representative
exchange rate of
USD 1
EUR-USD
exchange rate CPI in points (*)
June 30, 2011 3.415 1.448 120.38
June 30, 2010 3.875 1.228 115.53
December 31, 2010 3.549 1.335 117.82
(*) CPI on average basis 100 = 2002
Rate of change in the period ended % % % June 30, 2011 (6 months) (3.78) 8.45 2.17 June 30, 2011 (3 months) (1.90) 1.82 1.47 June 30, 2010 (6 months) 2.65 (14.83) 0.66 June 30, 2010 (3 months) 4.36 (8.65) 1.53 December 31, 2010 (12 months) (5.99) (7.39) 2.66
Oil Refineries Ltd.
Notes to the Consolidated Condensed Interim Financial Statements
USD thousands
B-22
NOTE 4 – SEGMENT REPORTING
The Group has three areas of operations, which are reported as business segments in the Group’s financial
statements and which are strategic business units. Further to Note 30 to the annual financial statements,
there were no changes in the Group’s operating segments.
Segment results are reported to the chief operating decision maker on the basis of operating profit with
amortization adjustments of surplus cost arising on acquisition of a subsidiary.

Oil Refineries Ltd.
Notes to the Consolidated Condensed Interim Financial Statements
USD thousands
B-23
NOTE 4 – SEGMENT REPORTING (Contd.)
Petrochemicals
Refining Trade Polymers Aromatics Oils
Adjustments to
consolidated Consolidated
Six months ended June 30, (unaudited)
2011 2010 2011 2010 2011 2010 2011 2010 2011 2010 2011 2010 2011 2010 Revenue from external sources 3,586,739 2,645,133 128,732 95,799 615,010 534,995 327,358 267,793 52,838 39,090 -- - 4,710,677 3,582,810
Revenue from inter-segment sales 662,837 487,435 -- -- -- -- 22,400 22,279 -- -- (685,237) (509,714) -- --
Segment revenue 4,249,576 3,132,568 128,732 95,799 615,010 534,995 349,758 290,072 52,838 39,090 (685,237) (509,714) 4,710,677 3,582,810 EBITDA 69,522 42,817 (11,514) (8,408) 71,790 54,350 15,293 16,186 7,800 5,402 818 (2,714) 153,709 107,633
Operating profit (loss) for segments 44,940 23,545 (11,514) (8,408) 48,713 30,205 11,568 13,307 7,185 4,804 818 (2,714) 101,710 60,739
Amortization of excess cost arising on
acquisition of subsidiaries (13,601) (21,874)
Operating profit 88,109 38,865
Financing expenses, net (47,651) (8,439)
Company’s share in earnings (losses) of
equity-accounted investees, net of tax (3,538) 342
Profit before income tax 36,920 30,768

Oil Refineries Ltd.
Notes to the Consolidated Condensed Interim Financial Statements
USD thousands
B-24
NOTE 4 – SEGMENT REPORTING (CONTD.)
Petrochemicals
Refining Trade Polymers Aromatics Oils
Adjustments to
consolidated Consolidated
Three months ended June 30, (unaudited)
2011 2010 2011 2010 2011 2010 2011 2010 2011 2010 2011 2010 2011 2010 Revenue from external sources 2,014,004 1,412,437 76,209 28,446 312,916 273,966 220,683 141,112 29,359 22,078 -- -- 2,653,171 1,878,039
Revenue from inter-segment sales 365,385 241,685 -- -- -- -- 11,919 10,989 -- -- (377,304) (252,674) -- --
Segment revenue 2,379,389 1,654,122 76,209 28,446 312,916 273,966 232,602 152,101 29,359 22,078 (377,304) (252,674) 2,653,171 1,878,039 EBITDA 41,200 32,307 (4,374) (5,631) 31,772 37,196 9,161 6,316 4,828 2,729 3,993 (55) 86,580 72,862 Operating profit (loss) for segments 28,877 22,853 (4,374) (5,631) 20,201 25,549 7,136 4,882 4,520 2,429 3,993 (55) 60,353 50,027
Amortization of excess cost arising on
acquisition of subsidiaries (6,800) (6,957)
Operating profit 53,553 43,070
Financing income (expenses), net (24,431) 3,668
Company’s share in earnings (losses) of
equity-accounted investees, net of tax (3,808) 163
Profit before income tax 25,314 46,901

Oil Refineries Ltd.
Notes to the Consolidated Condensed Interim Financial Statements
USD thousands
B-25
NOTE 4 – SEGMENT REPORTING (Contd.)
Petrochemicals
Refining Trade Polymers Aromatics Oils
Adjustments to
consolidated Consolidated
Year ended December 31, 2010
(Audited)
Revenue from external sources 5,032,975 214,642 1,012,478 451,351 80,363 -- 6,791,809
Revenue from inter-segment sales 836,334 -- -- 33,146 -- (869,480) --
Segment revenue 5,869,309 214,642 1,012,478 484,497 80,363 (869,480) 6,791,809
Depreciation and amortization 41,213 -- 44,303 4,831 1,212 -- 91,559
EBITDA 48,842 (17,833) 109,125 27,335 8,817 (3,273) 173,013
Operating profit (loss) for segments 7,629 (17,833) 64,822 22,504 7,605 (3,273) 81,454 Amortization of excess cost arising on acquisition of
subsidiaries (35,660)
Operating profit 45,794
Financing expenses, net (51,109)
Group’s share in earnings of equity-accounted investees,
net of tax 476
Loss before income tax (4,839)

Oil Refineries Ltd.
Notes to the Consolidated Condensed Interim Financial Statements
USD thousands
B-26
NOTE 5 – PROPERTY, PLANT AND EQUIPMENT
At the reporting date, the balance of agreements for approved establishment works amounts to USD 214
million. For additional details of the establishment works, see Note 12(E) and (H) to the financial
statements as of December 31, 2010.
At June 30, 2011, property, plant and equipment include advance payments made by the Group on
account of the acquisition of property, plant and equipment in the amount of USD 68 million.
NOTE 6 – CONTINGENT LIABILITIES, GUARANTEES AND AGREEMENTS
Lawsuits A.
1) Further to Note 21(B) (subsections 1(a), 1(b), 4(a), 4(b), 4(c), 4(e), 4(g), 4(h) and 4(j) to the
financial statements as of December 31, 2010, suits have been filed against the Group for
physical injury and damage to property allegedly caused to the plaintiffs as a result of pollution
of the Kishon River. There are legal proceedings against the Group, laws have been enacted and
orders have been issued regarding the fuel and gas sector and the infrastructure facilities
pertaining to the Group. Based on the opinion of the legal counsel of the Company and its
subsidiaries, the Company estimates that, at this stage, it is not possible to assess the
aforementioned impact on the financial statements as of June 30, 2011, if any, therefore, no
provision regarding this matter was included in the financial statements.
2) Further to Note 21(B) to the financial statements as at December 31, 2010, there were no
significant changes in the lawsuits and contingent liabilities of the Group during the reporting
period.
Agreements B.
To carry out its operations, the Company is dependent upon services from the infrastructure
companies Petroleum & Energy Infrastructures Ltd. (“PEI”) and Eilat Ashkelon Pipeline Company
Ltd. (“EAPC), which own crucial infrastructure pertaining to the unloading, shipping, storage, and
production of crude oil and oil products. According to information furnished by PEI to the Company,
PEI is expected to replace part of its offshore pipeline used for unloading crude oil in Haifa Bay and
delivery to the Company's refinery. At this stage, there is no assessment as to when PEI will replace
the pipeline section. To the best of the Company’s knowledge, the replacement process is expected
to continue for one month, and the Company will make preparations to reduce the effect of the
shutdown to a minimum, but in any event, some reduction in the scope of refining during this period
is to be expected.
Guarantees C.
Further to Note 21(A)(8) to the financial statements as at December 31, 2010, in the reporting period,
the Company acquired additional rights in Gadot, amounting to USD 1.2 million. This acquisition is
part of the funding sources that the Company provided to Gadot on November 19, 2009. After
acquisition of the rights, the Company's share in Gadot amounts to 23.5%.
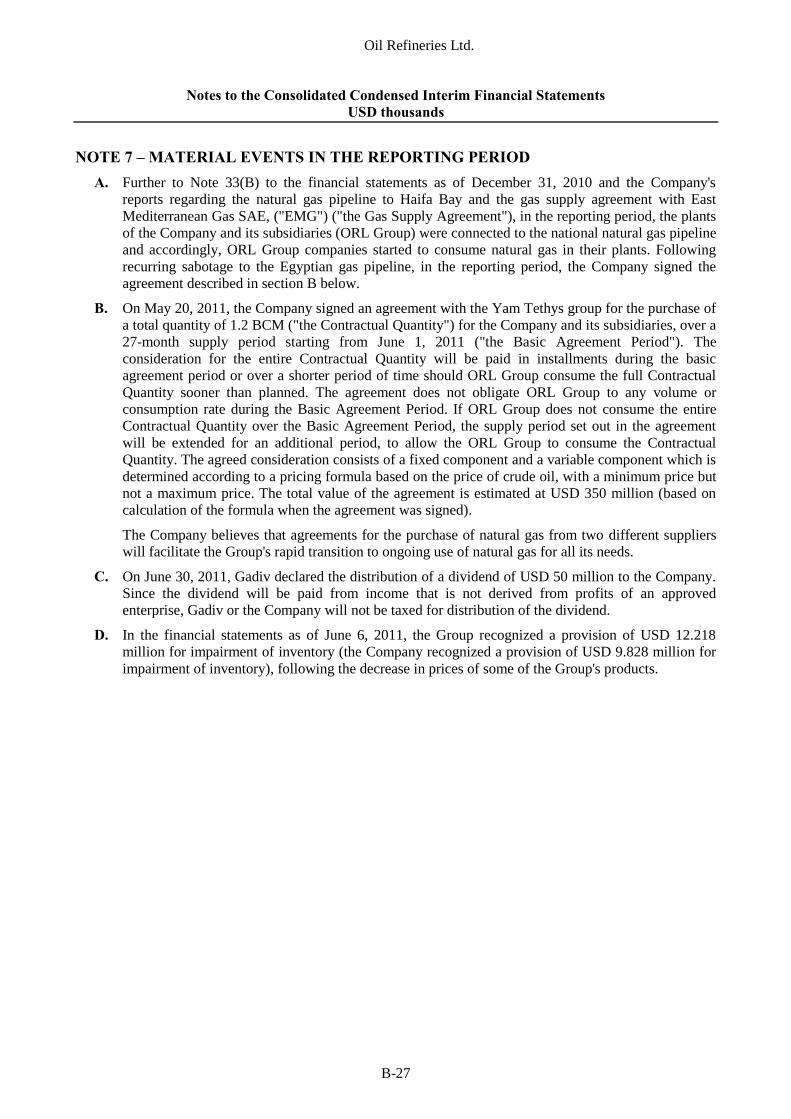
Oil Refineries Ltd.
Notes to the Consolidated Condensed Interim Financial Statements
USD thousands
B-27
NOTE 7 – MATERIAL EVENTS IN THE REPORTING PERIOD
Further to Note 33(B) to the financial statements as of December 31, 2010 and the Company's A.
reports regarding the natural gas pipeline to Haifa Bay and the gas supply agreement with East
Mediterranean Gas SAE, ("EMG") ("the Gas Supply Agreement"), in the reporting period, the plants
of the Company and its subsidiaries (ORL Group) were connected to the national natural gas pipeline
and accordingly, ORL Group companies started to consume natural gas in their plants. Following
recurring sabotage to the Egyptian gas pipeline, in the reporting period, the Company signed the
agreement described in section B below.
On May 20, 2011, the Company signed an agreement with the Yam Tethys group for the purchase of B.
a total quantity of 1.2 BCM ("the Contractual Quantity") for the Company and its subsidiaries, over a
27-month supply period starting from June 1, 2011 ("the Basic Agreement Period"). The
consideration for the entire Contractual Quantity will be paid in installments during the basic
agreement period or over a shorter period of time should ORL Group consume the full Contractual
Quantity sooner than planned. The agreement does not obligate ORL Group to any volume or
consumption rate during the Basic Agreement Period. If ORL Group does not consume the entire
Contractual Quantity over the Basic Agreement Period, the supply period set out in the agreement
will be extended for an additional period, to allow the ORL Group to consume the Contractual
Quantity. The agreed consideration consists of a fixed component and a variable component which is
determined according to a pricing formula based on the price of crude oil, with a minimum price but
not a maximum price. The total value of the agreement is estimated at USD 350 million (based on
calculation of the formula when the agreement was signed).
The Company believes that agreements for the purchase of natural gas from two different suppliers
will facilitate the Group's rapid transition to ongoing use of natural gas for all its needs.
On June 30, 2011, Gadiv declared the distribution of a dividend of USD 50 million to the Company. C.
Since the dividend will be paid from income that is not derived from profits of an approved
enterprise, Gadiv or the Company will not be taxed for distribution of the dividend.
In the financial statements as of June 6, 2011, the Group recognized a provision of USD 12.218 D.
million for impairment of inventory (the Company recognized a provision of USD 9.828 million for
impairment of inventory), following the decrease in prices of some of the Group's products.
.
Oil Refineries Ltd.
Condensed Separate Interim Financial
Information
At June 30, 2011
(Unaudited)

Somekh Chaikin Tel 4800 861 04 18 Neviim Street, P.O. Box 4484 Fax 4844 861 04
Haifa 33104 website: www.kpmg.co.il
C - 1
Att:
To the Shareholders of Oil Refineries Limited.
Dear Sirs,
Re: Special auditors’ report on the separate financial information pursuant to Article 38(D) of the
Securities Regulations (Periodic and Immediate Reports), 1970
Introduction
We have audited the separate financial statements presented in accordance with Article 38(D) of the
Securities Regulations (Periodic and Immediate Reports), 1970 of Oil Refineries Ltd. (“the Company”) as of
June 30, 2011 and for the six and three month periods then ended. The separate financial information is the
responsibility of the Company’s management and board of directors. Our responsibility is to express an
opinion on the separate interim financial information based on our review.
We did not review the separate interim financial statements of investees in which the amount of USD 459.674
million was invested as of June 30, 2011, and whose profits amounted to USD 35.011 million and USD 10.978
million, respectively for the six and three month periods then ended, respectively. The financial statements of
those companies were reviewed by other auditors, whose reports have been furnished to us, and our opinion,
insofar as it relates to the financial statements for those companies, is based on the reports of the other auditors.
Review scope
We conducted our review in accordance with Accounting Standard No. 1 – Review of Interim Financial
Information Performed by the Independent Auditor of the Entity established by the Institute of Certified Public
Accountants in Israel. A review of separate interim financial information consists of making inquiries, primarily
of persons responsible for financial and accounting matters, and applying analytical and other review procedures.
A review is substantially less in scope than an audit conducted in accordance with generally accepted accounting
principles in Israel and consequently does not enable us to obtain assurance that we would become aware of all
significant matters that might be identified in an audit. Accordingly, we do not express an audit opinion.
Conclusion
Based on our review and the review of other accountants, nothing has come to our attention that causes us to
believe that this separate interim financial information is not prepared, in all material respects, in accordance
with the provisions of Article 38(D) of the Securities Regulations (Periodic and Immediate Reports), 1970.
Without qualifying our above opinion, we draw attention to the following:
The contents of Notes 4, 5 and 6 to the separate interim financial statements, regarding suits filed against the
Company for legal proceedings, supervision by government authorities, other contingencies, laws and bills
relating to the fuel and gas industry and infrastructure facilities. Based on the opinion of the Company's legal
counsel, the Company estimates that, at this stage, it is not possible to assess the impact, if any, of the
aforementioned on the separate interim financial statements, and therefore no provision was included in the
financial statements in this respect and with regard to the Company's dependence on services received from
infrastructure companies and the supply of natural gas.
Somekh Chaikin
Certified Public Accountants
Haifa, August 14, 2011

Oil Refineries Ltd.
C - 2
Condensed Separate Interim Financial Information
USD thousands
As of
June 30,
2011 June 30,
2010
December
31, 2010
(Unaudited) (Audited)
Current assets
Cash and cash equivalents 3,974 3,020 461
Deposits 26,006 46,203 107,698
Trade receivables 522,005 368,214 183,743
Other receivables 135,987 133,943 87,693
Financial derivatives 26,612 29,187 (*) 19,962
Investments in financial assets at fair value through comprehensive
income 111,851 96,532 106,895
Inventories 967,546 865,396 1,086,864
Current tax assets -- 8,601 --
Total current assets 1,793,981 1,551,096 1,593,316
Non-current assets
Investment in investees 848,125 804,830 877,717
Financial assets at fair value through comprehensive income 12,289 9,130 17,701
Loan to Haifa Early Pensions Ltd. 74,672 70,133 77,014
Long term loans and debit balances 1,488 1,334 1,443
Financial derivatives 136,807 72,152 (*) 120,333
Employee benefit plan assets 3,886 3,357 3,739
Deferred tax assets 3,088 -- 1,136
Property, plant and equipment 970,284 752,196 859,734
Deferred costs 11,249 8,338 11,829
Intangible assets 3,237 4,473 3,163 Total non-current assets 2,065,125 1,725,943 1,973,809
Total assets 3,859,106 3,277,039 3,567,125
(*) Reclassified (see Note 2A)
(**) See Note 3.
Yossi Rosen
Chairman, Board of Directors
Pinhas Buchris
CEO
Igal Salhov
CFO
Date of approval of the separate financial information: August 14, 2011
The additional information attached to the separate interim financial information is an integral part thereof

Oil Refineries Ltd.
C - 3
Condensed Separate Interim Financial Information USD thousands
As of
June 30,
2011 June 30,
2010
December
31, 2010
(Unaudited) (Audited)
Current liabilities
Loans and borrowings 410,300 814,190 623,713
Trade payables 999,225 511,444 562,379
Other payables and credit balances 67,169 85,365 82,391
Current tax liability 24,732 -- 22,761
Financial derivatives 10,708 6,577 (*) 62,508
Provisions 8,032 10,034 8,131
Total current liabilities 1,520,166 1,427,610 1,361,883
Non-current liabilities
Bank loans 576,014 94,640 402,281
Debentures (**) 584,089 574,542 598,393
Liabilities for finance leasing 10,053 8,591 9,491
Financial derivatives 4,871 6,700 (*) 5,195
Employee benefits 48,978 40,208 49,137
Deferred tax liabilities -- 38,359 --
Total non-current liabilities 1,224,005 763,040 1,064,497
Total liabilities 2,744,171 2,190,650 2,426,380
Equity
Share capital 586,390 586,390 586,390
Share premium 100,242 100,242 100,242
Reserves 62,697 33,636 45,516
Retained earnings 365,606 366,121 408,597
Total capital 1,114,935 1,086,389 1,140,745
Total liabilities and capital 3,859,106 3,277,039 3,567,125
(*) Reclassified (see Note 2A)
(**) See Note 3.
The additional information attached to the separate interim financial information is an integral part thereof
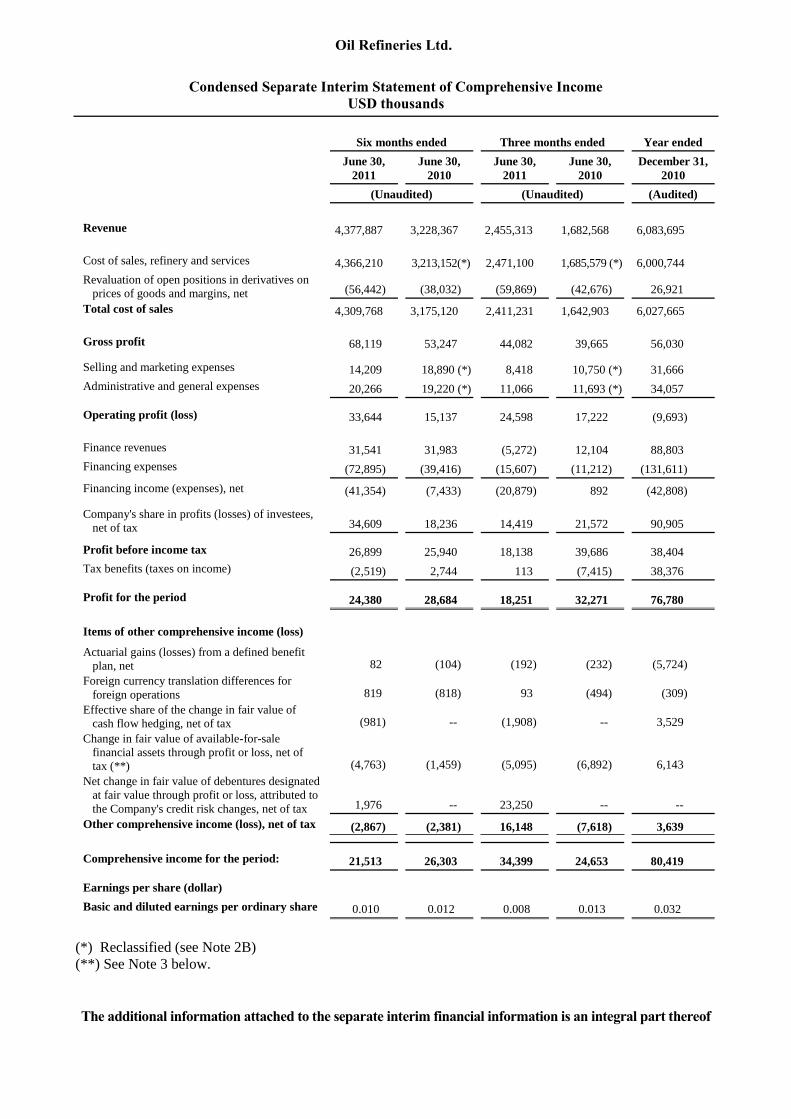
Oil Refineries Ltd.
C - 4
Condensed Separate Interim Statement of Comprehensive Income USD thousands
Six months ended Three months ended Year ended
June 30,
2011 June 30,
2010 June 30,
2011 June 30,
2010 December 31,
2010
(Unaudited) (Unaudited) (Audited)
Revenue 4,377,887 3,228,367 2,455,313 1,682,568 6,083,695
Cost of sales, refinery and services 4,366,210 3,213,152(*) 2,471,100 1,685,579 (*) 6,000,744
Revaluation of open positions in derivatives on
prices of goods and margins, net (56,442) (38,032) (59,869) (42,676) 26,921
Total cost of sales 4,309,768 3,175,120 2,411,231 1,642,903 6,027,665
Gross profit 68,119 53,247 44,082 39,665 56,030 Selling and marketing expenses 14,209 18,890 (*) 8,418 10,750 (*) 31,666
Administrative and general expenses 20,266 19,220 (*) 11,066 11,693 (*) 34,057 Operating profit (loss) 33,644 15,137 24,598 17,222 (9,693)
Finance revenues 31,541 31,983 (5,272) 12,104 88,803
Financing expenses (72,895) (39,416) (15,607) (11,212) (131,611)
Financing income (expenses), net (41,354) (7,433) (20,879) 892 (42,808) Company's share in profits (losses) of investees,
net of tax 34,609 18,236 14,419 21,572 90,905 Profit before income tax 26,899 25,940 18,138 39,686 38,404
Tax benefits (taxes on income) (2,519) 2,744 113 (7,415) 38,376 Profit for the period 24,380 28,684 18,251 32,271 76,780
Items of other comprehensive income (loss)
Actuarial gains (losses) from a defined benefit
plan, net 82 (104) (192) (232) (5,724)
Foreign currency translation differences for
foreign operations 819 (818) 93 (494) (309)
Effective share of the change in fair value of
cash flow hedging, net of tax (981) -- (1,908) -- 3,529
Change in fair value of available-for-sale
financial assets through profit or loss, net of
tax (**) (4,763) (1,459) (5,095) (6,892) 6,143
Net change in fair value of debentures designated
at fair value through profit or loss, attributed to
the Company's credit risk changes, net of tax 1,976 -- 23,250 -- --
Other comprehensive income (loss), net of tax (2,867) (2,381) 16,148 (7,618) 3,639
Comprehensive income for the period: 21,513 26,303 34,399 24,653 80,419 Earnings per share (dollar)
Basic and diluted earnings per ordinary share 0.010 0.012 0.008 0.013 0.032
(*) Reclassified (see Note 2B)
(**) See Note 3 below.
The additional information attached to the separate interim financial information is an integral part thereof
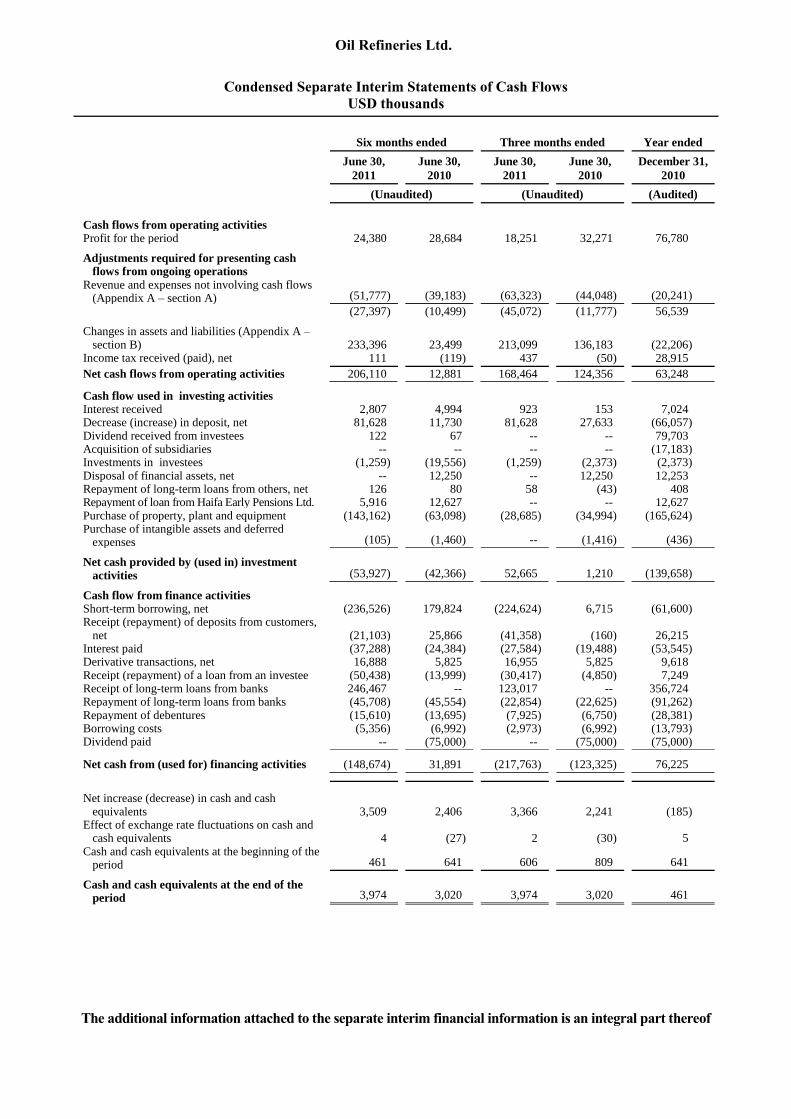
Oil Refineries Ltd.
C - 5
Condensed Separate Interim Statements of Cash Flows USD thousands
Six months ended Three months ended Year ended
June 30,
2011 June 30,
2010 June 30,
2011 June 30,
2010 December 31,
2010
(Unaudited) (Unaudited) (Audited)
Cash flows from operating activities Profit for the period 24,380 28,684 18,251 32,271 76,780 Adjustments required for presenting cash
flows from ongoing operations Revenue and expenses not involving cash flows
(Appendix A – section A) (51,777) (39,183) (63,323) (44,048) (20,241)
(27,397) (10,499) (45,072) (11,777) 56,539 Changes in assets and liabilities (Appendix A –
section B) 233,396 23,499 213,099 136,183 (22,206) Income tax received (paid), net 111 (119) 437 (50) 28,915
Net cash flows from operating activities 206,110 12,881 168,464 124,356 63,248 Cash flow used in investing activities Interest received 2,807 4,994 923 153 7,024 Decrease (increase) in deposit, net 81,628 11,730 81,628 27,633 (66,057) Dividend received from investees 122 67 -- -- 79,703 Acquisition of subsidiaries -- -- -- -- (17,183) Investments in investees (1,259) (19,556) (1,259) (2,373) (2,373) Disposal of financial assets, net -- 12,250 -- 12,250 12,253 Repayment of long-term loans from others, net 126 80 58 (43) 408 Repayment of loan from Haifa Early Pensions Ltd. 5,916 12,627 -- -- 12,627 Purchase of property, plant and equipment (143,162) (63,098) (28,685) (34,994) (165,624) Purchase of intangible assets and deferred
expenses (105) (1,460) -- (1,416) (436) Net cash provided by (used in) investment
activities (53,927) (42,366) 52,665 1,210 (139,658) Cash flow from finance activities Short-term borrowing, net (236,526) 179,824 (224,624) 6,715 (61,600) Receipt (repayment) of deposits from customers,
net (21,103) 25,866 (41,358) (160) 26,215 Interest paid (37,288) (24,384) (27,584) (19,488) (53,545) Derivative transactions, net 16,888 5,825 16,955 5,825 9,618 Receipt (repayment) of a loan from an investee (50,438) (13,999) (30,417) (4,850) 7,249 Receipt of long-term loans from banks 246,467 -- 123,017 -- 356,724 Repayment of long-term loans from banks (45,708) (45,554) (22,854) (22,625) (91,262) Repayment of debentures (15,610) (13,695) (7,925) (6,750) (28,381) Borrowing costs (5,356) (6,992) (2,973) (6,992) (13,793) Dividend paid -- (75,000) -- (75,000) (75,000) Net cash from (used for) financing activities (148,674) 31,891 (217,763) (123,325) 76,225 Net increase (decrease) in cash and cash
equivalents 3,509 2,406 3,366 2,241 (185) Effect of exchange rate fluctuations on cash and
cash equivalents 4 (27) 2 (30) 5 Cash and cash equivalents at the beginning of the
period 461 641 606 809 641 Cash and cash equivalents at the end of the
period 3,974 3,020 3,974 3,020 461
The additional information attached to the separate interim financial information is an integral part thereof

Oil Refineries Ltd.
C - 6
Condensed Separate Interim Statements of Cash Flows (cont.) USD thousands
Appendix A: Adjustments required to present cash flows from operating activities
Six months ended Three months ended Year ended
June 30,
2011 June 30,
2010 June 30,
2011 June 30,
2010 December 31,
2010
(Unaudited) (Unaudited) (Audited)
A. Income and expenses not included in cash
flow: Depreciation and amortization 24,582 19,272 12,323 9,454 41,213 Finance expenses, net 20,366 2,711 6,079 1,049 41,185 Net changes in fair value of derivatives (56,772) (38,037) (61,167) (43,723) 30,426 Net changes in the fair value of the loan to
Haifa Early Pensions Ltd. (2,971) (724) (2,671) 1,506 (8,512) Share in profits of investees (34,609) (18,236) (14,419) (21,572) (90,905) Loss (profit) from deposits and investments
in financial assets, net (4,892) (1,748) (3,355) 1,662 4,178 Share-based payment transactions -- 323 -- 161 550 Taxes on income (tax benefit) 2,519 (2,744) (113) 7,415 (38,376)
(51,777) (39,183) (63,323) (44,048) (20,241)
B. Changes in assets and liabilities
Decrease (increase) in trade receivables, net (338,262) 24,944 (112,019) 21,205 209,415 Decrease (increase) in other receivables and
debt balances, net 1,872 (19,395) (16,464) 33,046 (49,857) Decrease (increase) in inventory, net 119,318 2,608 65,096 187,569 (218,860) Increase (decrease) in trade payables, net 444,993 33,144 277,511 (83,532) 57,616 Increase (decrease) in other payables and
provisions, net 5,685 (16,291) 1,258 (20,300) (21,164) Increase (decrease) in employee benefits, net (210) (1,511) 233 (1,805) 644
233,396 23,499 213,099 136,183 (22,206)
The additional information attached to the separate interim financial information is an integral part thereof

Oil Refineries Ltd.
Additional Information to the Separate Interim Financial Statements USD thousands
C - 7
NOTE 1 – GENERAL
A. The separate interim financial information is presented pursuant to the provisions of Article 38(D) of
the Securities Regulations (Periodic and Immediate Reports), 1970. They should be read in
conjunction with the separate financial statements for the year ended December 31, 2010 and in
conjunction with the condensed consolidated interim financial statements as of June 30, 2011 ("the
Consolidated Financial Statements").
B. Definitions:
The Company: Oil Refineries Ltd.
Subsidiaries: Companies whose financial statements are fully consolidated with the financial
statements of the Company
Investees: Subsidiaries and companies in which the Company's investment is stated in the financial
statements on the equity basis
NOTE 2 – BASIS OF PREPARATION
Reclassification:
A. Financial derivatives at June 30, 2010, previously presented in non-current assets and non-current
liabilities were classified as current assets and current liabilities, and split into intangible assets and
deferred expenses presented in an item for each of the forgoing items, separately.
As of June 30, 2010
As previously
reported
Effect of
reclassification
As reported in
these financial
statements
Hedged financial derivatives: Current assets 13,958 15,229 29,187
Non-current assets 87,381 (15,229) 72,152
Current liabilities -- 6,577 6,577
Non-current liabilities 13,277 (6,577) 6,700
B. The following figures pertain to the effect of reclassification on the relevant items:
Certain comparative figures in the statement of comprehensive income for the six and three month
periods ended June 30, 2010 were reclassified to adjust them to the manner of representation in the
statement of comprehensive income for the six and three month periods ended June 30, 2011.
Six months ended June 30, 2010
As previously
reported
Effect of
reclassification
As reported in
these financial
statements
Cost of sales, refinery and services (3,214,638) 1,486 (3,213,152)
Selling expenses (18,807) (83) (18,890)
Administrative and general expenses (17,817) (1,403) (19,220)

Oil Refineries Ltd.
Additional Information to the Separate Interim Financial Statements USD thousands
C - 8
NOTE 2 – BASIS OF PREPARATION (CONTD.)
Reclassification: (contd.)
B. The following figures pertain to the effect of reclassification on the relevant items: (contd.)
Three months ended June 30, 2010
As previously
reported
Effect of
reclassification
As reported in
these financial
statements
Cost of sales, refinery and services (1,686,936) 1,357 (1,685,579)
Selling expenses (10,700) (50) (10,750)
Administrative and general expenses (10,386) (1,307) (11,693)
NOTE 3 - SIGNIFICANT ACCOUNTING POLICIES
For information pertaining to the Company's accounting policies, see Note 3 to the condensed
consolidated interim financial statements as of June 30, 2011.
Below is a breakdown of the effect of first time application of the IFRS 9 (2010) on the Company, as of
the date of the first time application:
A. The effect on the Statement of Financial Position as of January 1, 2011:
Original
classification
according to
IAS 39
Reclassification
according to
IFRS 9
Original carrying
amount
according to IAS
39
New carrying
amount
according to
IFRS 9
USD thousands
Financial assets Cash and cash equivalents,
deposits, trade payables and
accounts receivable
Loans and
receivables Financial assets
at amortized
cost: Unchanged Investments in financial assets
through profit or loss (***) Available-for-
sale financial
assets
Fair value
through other
comprehensive
income Unchanged Financial liabilities
Debentures designated at fair
value through profit or loss (**) Amortized costs Financial
liabilities
measured at fair
value through
profit or loss 554,026 586,641
(*) The effect of first time application of IFRS 9 (2010) on the balance of deferred taxes as of January 1,
2011 is a tax asset in the amount of USD 5.524 million, of which a tax asset in the amount of USD
7.798 million was charged to retained earnings and a tax reserve in the amount of USD 2.274 million
was charged to a capital reserve for financial liabilities designated at fair value.
(**) See Note 3A (2)(c)(2) to the condensed consolidated interim financial statements of June 30, 2011.

Oil Refineries Ltd.
Additional Information to the Separate Interim Financial Statements USD thousands
C - 9
NOTE 3 - SIGNIFICANT ACCOUNTING POLICIES (CONTD.)
B. For the effect of the change in accounting policy on capital at January 1, 2011, see Note
3(A)(2)(c)(2) to the condensed consolidated interim financial statements as of June 6, 2011.
C. Below is a breakdown of the difference between the carrying amount of the financial liabilities
designated at fair value and the amount payable on maturity:
Carrying
amount
Amount payable
on maturity Difference
in USD thousands
Balance as of January 1, 1111 146,681 118,116 51,611
Balance as of June 51 , 1111 611,861 141,111 16,888
NOTE 4 – GUARANTEES AND AGREEMENTS WITH INVESTEES
For further information see Notes 6(B) and 6(C) to the condensed consolidated interim financial
statements as of June 30, 2011.
NOTE 5 – CONTINGENT LIABILITIES
For further information see Note 6(A) to the condensed consolidated interim financial statements as of
March 31, 2011.
NOTE 6 – MATERIAL EVENTS IN THE REPORTING PERIOD
For further information, see Note 7 to the condensed consolidated interim financial statements as of June
30, 2011.