condensed consolidated financial …file,29_epp-results-presentation-2016.pdf · corporate...
TRANSCRIPT

Echo Polska Properties N.V.(Incorporated in The Netherlands)
(Company number 64965945) | JSE share code: EPP | ISIN: NL0011983374 | (“EPP” or “the Company” or “the Group”)
www.echo-pp.com
for the period 4 January to 31 December 2016
CONDENSED CONSOLIDATED
FINANCIAL STATEMENTS
This document has been prepared and issued by and is the sole responsibility of the management of Echo Polska Properties N.V. (the “Company” or “EPP”) and its subsidiaries.
This document does not constitute or form part of any offer or invitation to sell or issue, or any solicitation of any offer to purchase or subscribe for, any securities of the Company nor shall it or any part of it nor the fact of its distribution formthe basis of, or be relied on in connection with, any contract commitment or investment decision in relation thereto nor does it constitute a recommendation regarding the securities of the Company. Investors and prospective investors insecurities of the Company are required to make their own independent investigation and appraisal of the business and financial condition of the Company and the nature of the securities.
This presentation and any materials distributed in connection with this presentation may include certain forward-looking statements, beliefs or opinions, including statements with respect to the Company’s business, financial condition andresults of operations. These statements, which contain the words “anticipate”, “believe”, “intend”, “estimate”, “expect”, “forecast” and words of similar meaning, reflect the Directors’ beliefs and expectations and involve risk and uncertaintybecause they relate to events and depend on circumstances that will occur in the future. No representation is made that any of these statements or forecasts will come to pass or that any forecast results will be achieved. There are anumber of factors that could cause actual results and developments to differ materially from those expressed or implied by these statements and forecasts. Past performance of the Company cannot be relied on as a guide to futureperformance. Forward-looking statements speak only as at the date of this presentation and the Company expressly disclaims any obligations or undertaking to release any update of, or revisions to, any forward-looking statements in thispresentation. No statement in this presentation is intended to be a profit forecast. As a result, you are cautioned not to place any undue reliance on such forward-looking statements. The information on which these statements has beenbased has not been reviewed or reported by EPP’s auditors.
This document speaks as of the date hereof. No reliance may be placed for any purposes whatsoever on the information contained in this document or on its completeness, accuracy or fairness. The Company, its advisers and each of theirrespective members, directors, officers and employees are under no obligation to update or keep current the information contained in this presentation, to correct any inaccuracies which may become apparent, or to publicly announce theresult of any revision to the statements made herein except where they would be required to do so under applicable law, and any opinions expressed in them are subject to change without notice. No representation or warranty, express orimplied, is given by the Company, or any of its subsidiary undertakings or affiliates or directors, officers, Java Capital or any of its directors or employees or any other person as to the fairness, accuracy or completeness of the information oropinions contained in this presentation and no liability whatsoever for any loss howsoever arising from any use of this presentation or its contents otherwise arising in connection therewith is accepted by any such person in relation to suchinformation.
Disclaimer
2

Contents
3
1. Strategy & Investment case2. Financial review 20163. Polish macroeconomics4. Portfolio overview
4.1 Retail 4.2 Office4.3 Developments
5. Prospects

www.echo-pp.com1. Strategy & Investment Case
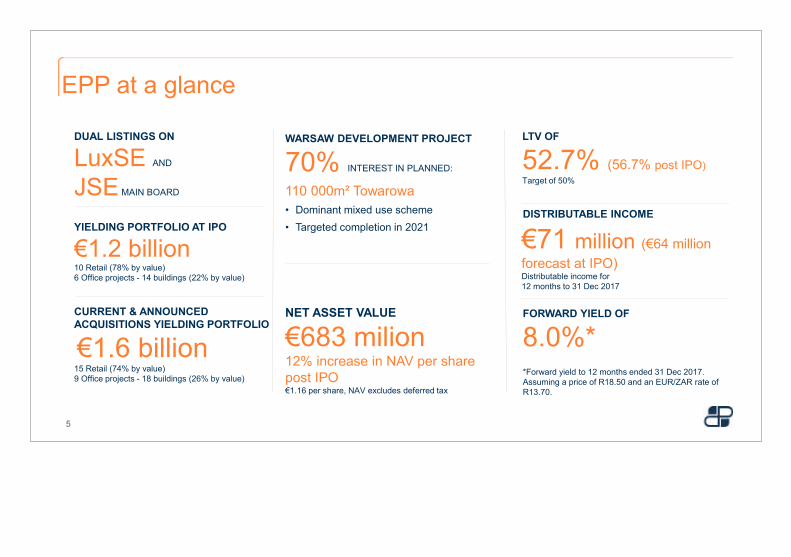
DUAL LISTINGS ON
LuxSE AND
JSE MAIN BOARD
WARSAW DEVELOPMENT PROJECT
70% INTEREST IN PLANNED:
110 000m² Towarowa• Dominant mixed use scheme• Targeted completion in 2021
LTV OF
52.7% (56.7% post IPO)Target of 50%
€71 million (€64 million forecast at IPO)Distributable income for 12 months to 31 Dec 2017
FORWARD YIELD OF
8.0%*
EPP at a glance
5
YIELDING PORTFOLIO AT IPO
€1.2 billion 10 Retail (78% by value)6 Office projects - 14 buildings (22% by value)
CURRENT & ANNOUNCED ACQUISITIONS YIELDING PORTFOLIO
€1.6 billion15 Retail (74% by value)9 Office projects - 18 buildings (26% by value)
*Forward yield to 12 months ended 31 Dec 2017. Assuming a price of R18.50 and an EUR/ZAR rate of R13.70.
NET ASSET VALUE
€683 milion12% increase in NAV per sharepost IPO€1.16 per share, NAV excludes deferred tax
DISTRIBUTABLE INCOME
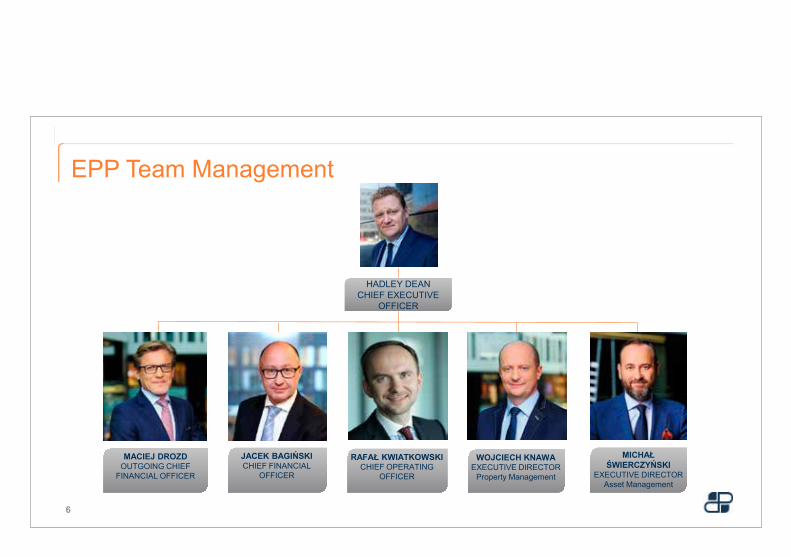
EPP Team Management
RAFAŁ KWIATKOWSKI CHIEF OPERATING
OFFICER
JACEK BAGIŃSKI CHIEF FINANCIAL
OFFICER
WOJCIECH KNAWA EXECUTIVE DIRECTOR
Property Management
MICHAŁ ŚWIERCZYŃSKI
EXECUTIVE DIRECTOR Asset Management
HADLEY DEAN CHIEF EXECUTIVE
OFFICER
MACIEJ DROZDOUTGOING CHIEF
FINANCIAL OFFICER
6
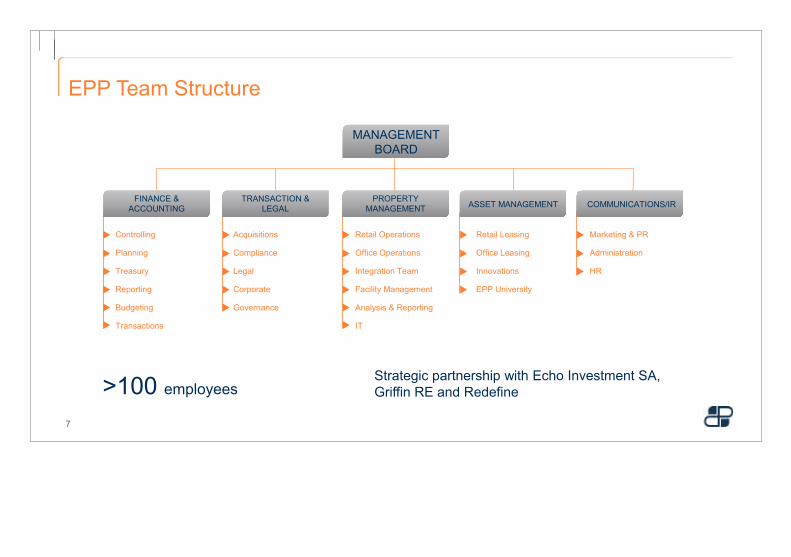
MANAGEMENT BOARD
TRANSACTION & LEGAL
Acquisitions
Compliance
Legal
Corporate
Governance
COMMUNICATIONS/IR
Marketing & PR
Administration
HR
Controlling
Planning
Treasury
Reporting
Budgeting
Transactions
FINANCE & ACCOUNTING
PROPERTY MANAGEMENT
Retail Operations
Office Operations
Integration Team
Facility Management
Analysis & Reporting
IT
ASSET MANAGEMENT
EPP Team Structure
>100 employees
Retail Leasing
Office Leasing
Innovations
EPP University
7
Strategic partnership with Echo Investment SA, Griffin RE and Redefine
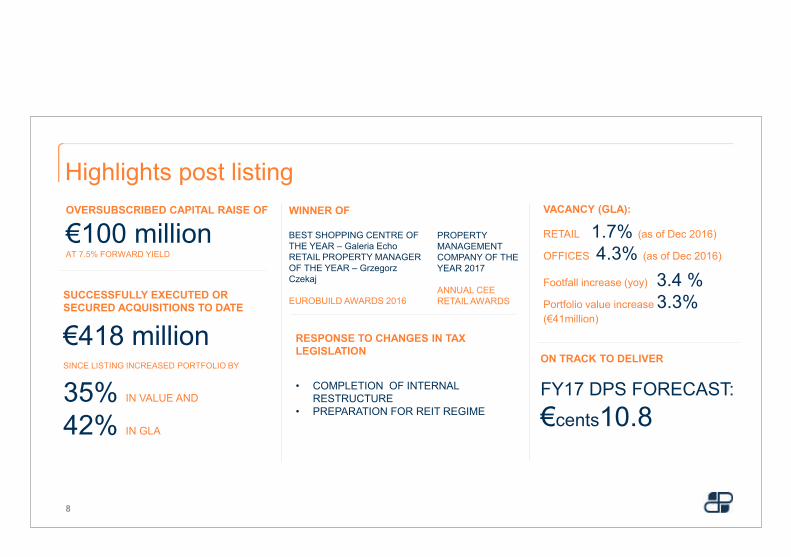
SUCCESSFULLY EXECUTED OR SECURED ACQUISITIONS TO DATE
€418 million SINCE LISTING INCREASED PORTFOLIO BY
35% IN VALUE AND
42% IN GLA
PROPERTY MANAGEMENT COMPANY OF THE YEAR 2017
ANNUAL CEE RETAIL AWARDS
OVERSUBSCRIBED CAPITAL RAISE OF
€100 million AT 7.5% FORWARD YIELD
RESPONSE TO CHANGES IN TAX LEGISLATION
• COMPLETION OF INTERNAL RESTRUCTURE
• PREPARATION FOR REIT REGIME
WINNER OF
BEST SHOPPING CENTRE OF THE YEAR – Galeria Echo RETAIL PROPERTY MANAGER OF THE YEAR – Grzegorz Czekaj
EUROBUILD AWARDS 2016
Highlights post listing
8
VACANCY (GLA):
RETAIL 1.7% (as of Dec 2016)
OFFICES 4.3% (as of Dec 2016)
Footfall increase (yoy) 3.4 %Portfolio value increase 3.3% (€41million)
ON TRACK TO DELIVER
FY17 DPS FORECAST:
€cents10.8
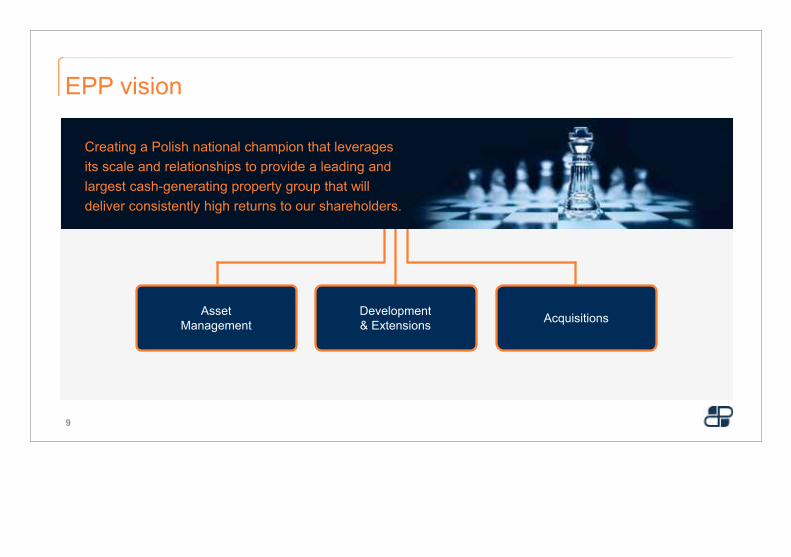
EPP vision
9
AssetManagement
Development & Extensions Acquisitions
Creating a Polish national champion that leveragesits scale and relationships to provide a leading and largest cash-generating property group that will deliver consistently high returns to our shareholders.
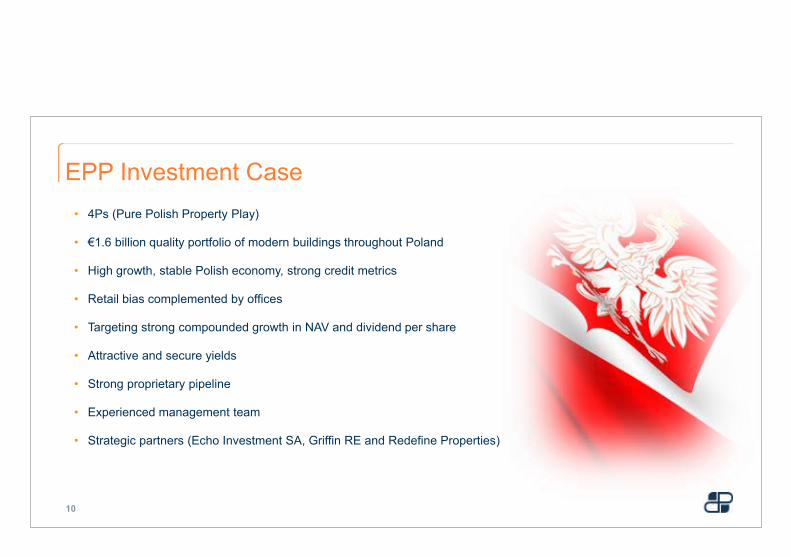
• 4Ps (Pure Polish Property Play)
• €1.6 billion quality portfolio of modern buildings throughout Poland
• High growth, stable Polish economy, strong credit metrics
• Retail bias complemented by offices
• Targeting strong compounded growth in NAV and dividend per share
• Attractive and secure yields
• Strong proprietary pipeline
• Experienced management team
• Strategic partners (Echo Investment SA, Griffin RE and Redefine Properties)
EPP Investment Case
10

www.echo-pp.com2. Financial review 2016
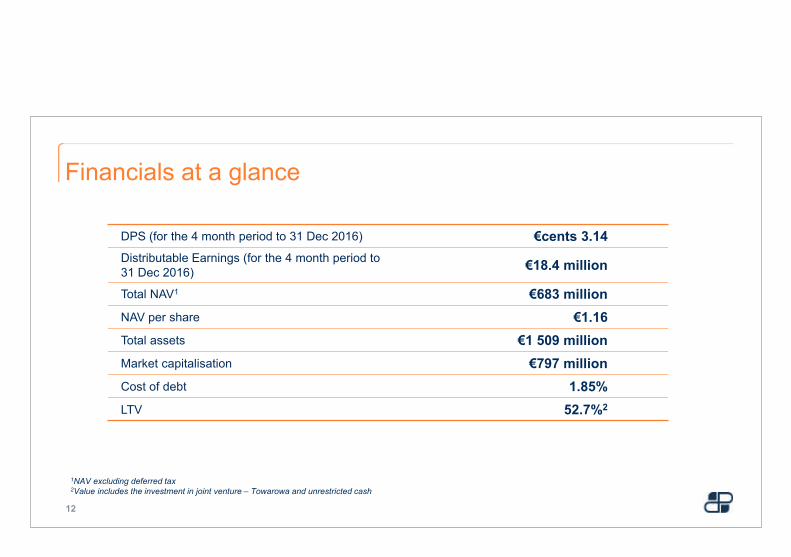
Financials at a glance
12
DPS (for the 4 month period to 31 Dec 2016) €cents 3.14Distributable Earnings (for the 4 month period to 31 Dec 2016) €18.4 million
Total NAV1 €683 millionNAV per share €1.16Total assets €1 509 millionMarket capitalisation €797 millionCost of debt 1.85%LTV 52.7%2
1NAV excluding deferred tax2Value includes the investment in joint venture – Towarowa and unrestricted cash
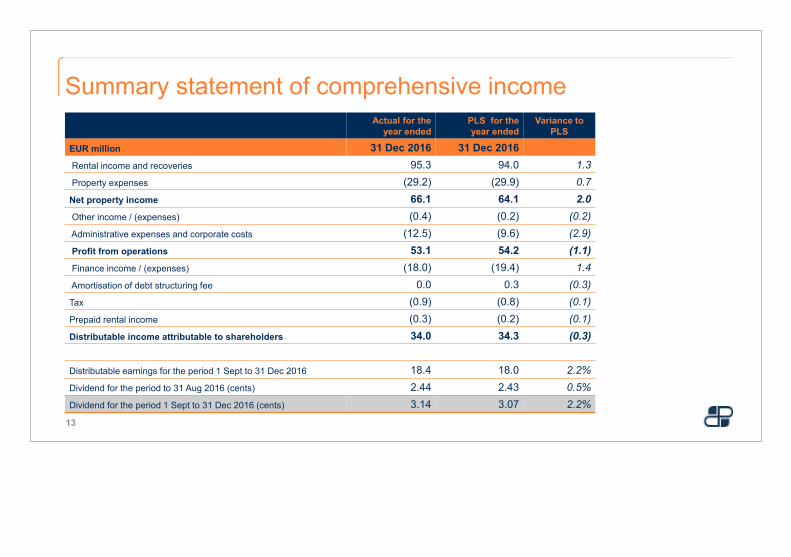
Summary statement of comprehensive income
13
Actual for the year ended
PLS for the year ended
Variance to PLS
EUR million 31 Dec 2016 31 Dec 2016Rental income and recoveries 95.3 94.0 1.3Property expenses (29.2) (29.9) 0.7
Net property income 66.1 64.1 2.0Other income / (expenses) (0.4) (0.2) (0.2)Administrative expenses and corporate costs (12.5) (9.6) (2.9)Profit from operations 53.1 54.2 (1.1)Finance income / (expenses) (18.0) (19.4) 1.4Amortisation of debt structuring fee 0.0 0.3 (0.3)Tax (0.9) (0.8) (0.1)Prepaid rental income (0.3) (0.2) (0.1)Distributable income attributable to shareholders 34.0 34.3 (0.3)
Distributable earnings for the period 1 Sept to 31 Dec 2016 18.4 18.0 2.2%Dividend for the period to 31 Aug 2016 (cents) 2.44 2.43 0.5%Dividend for the period 1 Sept to 31 Dec 2016 (cents) 3.14 3.07 2.2%
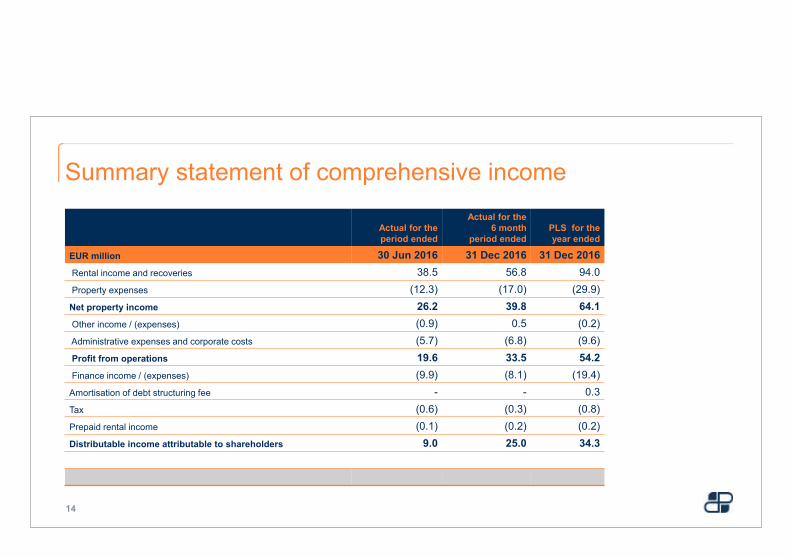
Summary statement of comprehensive income
14
Actual for the period ended
Actual for the 6 month
period ended PLS for the year ended
EUR million 30 Jun 2016 31 Dec 2016 31 Dec 2016Rental income and recoveries 38.5 56.8 94.0Property expenses (12.3) (17.0) (29.9)
Net property income 26.2 39.8 64.1Other income / (expenses) (0.9) 0.5 (0.2)Administrative expenses and corporate costs (5.7) (6.8) (9.6)Profit from operations 19.6 33.5 54.2Finance income / (expenses) (9.9) (8.1) (19.4)
Amortisation of debt structuring fee - - 0.3Tax (0.6) (0.3) (0.8)Prepaid rental income (0.1) (0.2) (0.2)Distributable income attributable to shareholders 9.0 25.0 34.3
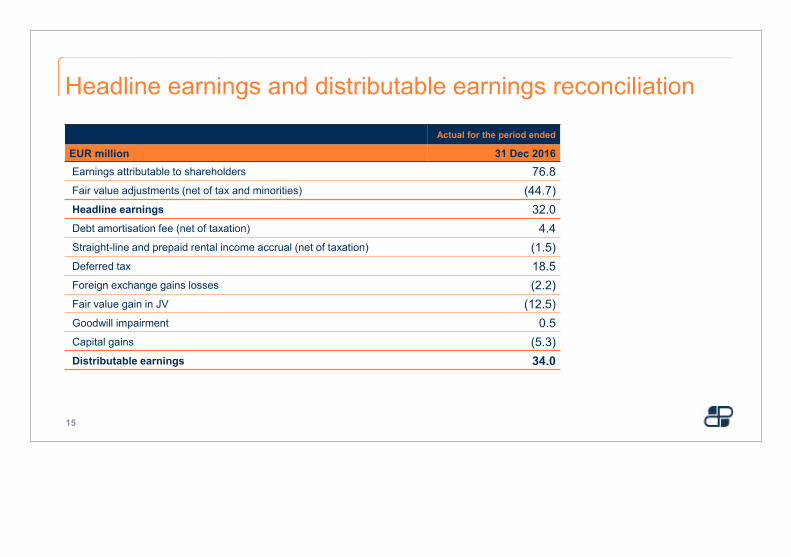
Headline earnings and distributable earnings reconciliation
15
Actual for the period ended
EUR million 31 Dec 2016Earnings attributable to shareholders 76.8 Fair value adjustments (net of tax and minorities) (44.7) Headline earnings 32.0 Debt amortisation fee (net of taxation) 4.4 Straight-line and prepaid rental income accrual (net of taxation) (1.5) Deferred tax 18.5 Foreign exchange gains losses (2.2) Fair value gain in JV (12.5) Goodwill impairment 0.5 Capital gains (5.3) Distributable earnings 34.0
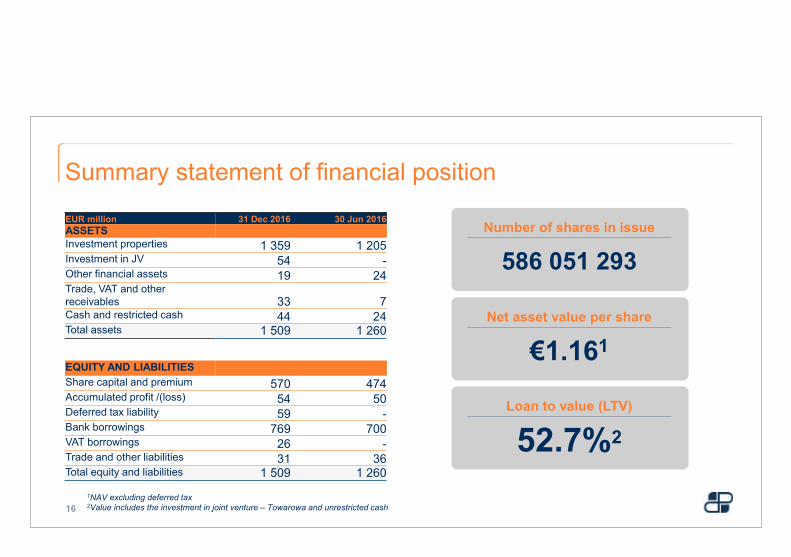
Summary statement of financial position
16
Number of shares in issue
586 051 293
Net asset value per share
€1.161
Loan to value (LTV)
52.7%2
1NAV excluding deferred tax2Value includes the investment in joint venture – Towarowa and unrestricted cash
EUR million 31 Dec 2016 30 Jun 2016ASSETSInvestment properties 1 359 1 205Investment in JV 54 -Other financial assets 19 24Trade, VAT and otherreceivables 33 7Cash and restricted cash 44 24Total assets 1 509 1 260
EQUITY AND LIABILITIESShare capital and premium 570 474Accumulated profit /(loss) 54 50Deferred tax liability 59 -Bank borrowings 769 700VAT borrowings 26 -Trade and other liabilities 31 36Total equity and liabilities 1 509 1 260
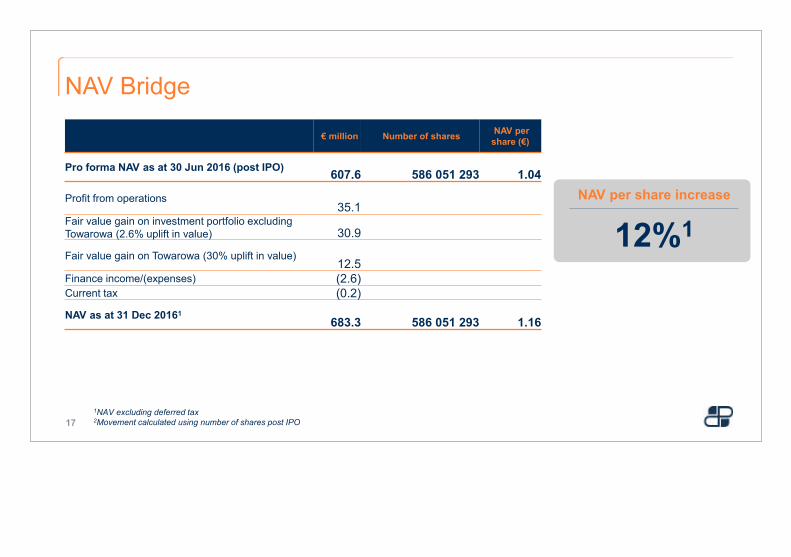
NAV Bridge
17
NAV per share increase
12%1
€ million Number of shares NAV per share (€)
Pro forma NAV as at 30 Jun 2016 (post IPO) 607.6 586 051 293 1.04
Profit from operations35.1
Fair value gain on investment portfolio excludingTowarowa (2.6% uplift in value) 30.9
Fair value gain on Towarowa (30% uplift in value)12.5
Finance income/(expenses) (2.6) Current tax (0.2)
NAV as at 31 Dec 20161683.3 586 051 293 1.16
1NAV excluding deferred tax2Movement calculated using number of shares post IPO
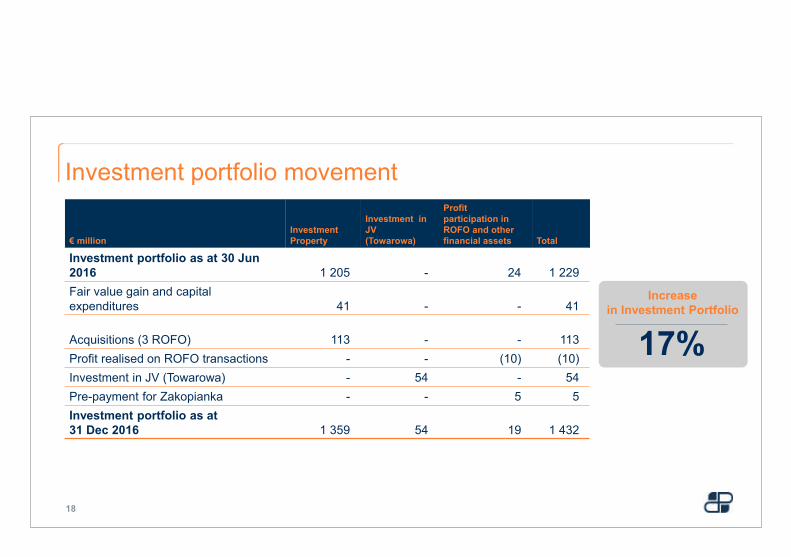
Investment portfolio movement
18
Increasein Investment Portfolio
17%
€ millionInvestment Property
Investment in JV (Towarowa)
Profitparticipation in ROFO and otherfinancial assets Total
Investment portfolio as at 30 Jun 2016 1 205 - 24 1 229Fair value gain and capitalexpenditures 41 - - 41
Acquisitions (3 ROFO) 113 - - 113Profit realised on ROFO transactions - - (10) (10)Investment in JV (Towarowa) - 54 - 54Pre-payment for Zakopianka - - 5 5Investment portfolio as at 31 Dec 2016 1 359 54 19 1 432
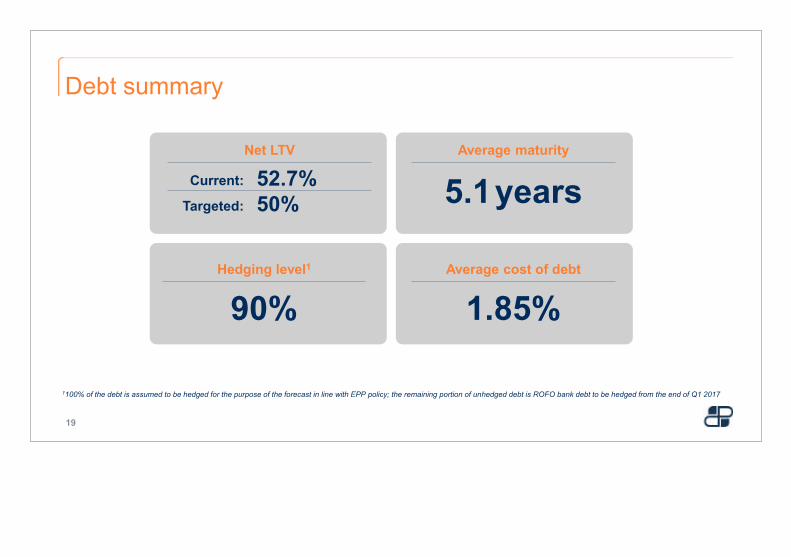
Debt summary
19
Average maturity
5.1years
Average cost of debt
1.85%Hedging level1
90%
Net LTV
52.7%Current:
50%Targeted:
1100% of the debt is assumed to be hedged for the purpose of the forecast in line with EPP policy; the remaining portion of unhedged debt is ROFO bank debt to be hedged from the end of Q1 2017
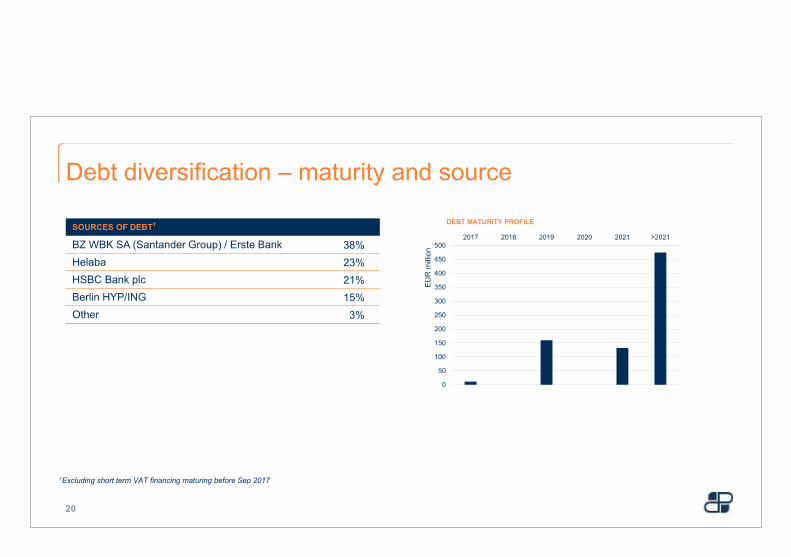
Debt diversification – maturity and source
20
SOURCES OF DEBT1
BZ WBK SA (Santander Group) / Erste Bank 38%Helaba 23%HSBC Bank plc 21%Berlin HYP/ING 15%Other 3%
0
50
100
150
200
250
300
350
400
450
5002017 2018 2019 2020 2021 >2021
EUR
milli
on
DEBT MATURITY PROFILE
1Excluding short term VAT financing maturing before Sep 2017
www.echo-pp.com3. Polish macroeconomics
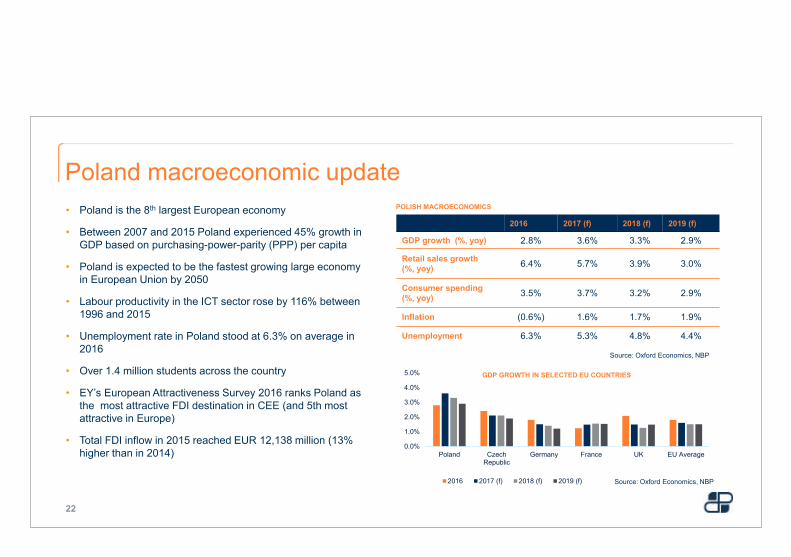
• Poland is the 8th largest European economy
• Between 2007 and 2015 Poland experienced 45% growth in GDP based on purchasing-power-parity (PPP) per capita
• Poland is expected to be the fastest growing large economy in European Union by 2050
• Labour productivity in the ICT sector rose by 116% between 1996 and 2015
• Unemployment rate in Poland stood at 6.3% on average in 2016
• Over 1.4 million students across the country
• EY’s European Attractiveness Survey 2016 ranks Poland as the most attractive FDI destination in CEE (and 5th most attractive in Europe)
• Total FDI inflow in 2015 reached EUR 12,138 million (13% higher than in 2014)
POLISH MACROECONOMICS
2016 2017 (f) 2018 (f) 2019 (f)
GDP growth (%, yoy) 2.8% 3.6% 3.3% 2.9%
Retail sales growth(%, yoy) 6.4% 5.7% 3.9% 3.0%
Consumer spending(%, yoy) 3.5% 3.7% 3.2% 2.9%
Inflation (0.6%) 1.6% 1.7% 1.9%
Unemployment 6.3% 5.3% 4.8% 4.4%
Source: Oxford Economics, NBP
Source: Oxford Economics, NBP
Poland macroeconomic update
22
0.0%
1.0%
2.0%
3.0%
4.0%
5.0%
Poland CzechRepublic
Germany France UK EU Average
GDP GROWTH IN SELECTED EU COUNTRIES
2016 2017 (f) 2018 (f) 2019 (f)
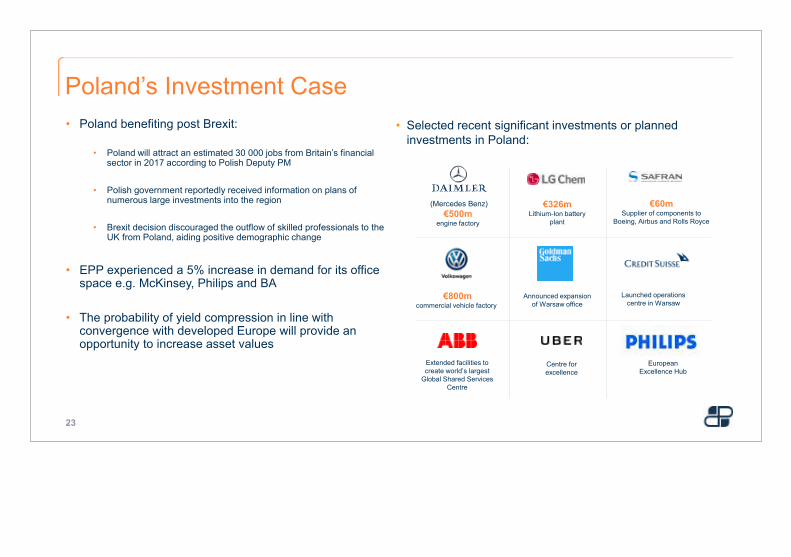
• Poland benefiting post Brexit:
• Poland will attract an estimated 30 000 jobs from Britain’s financial sector in 2017 according to Polish Deputy PM
• Polish government reportedly received information on plans of numerous large investments into the region
• Brexit decision discouraged the outflow of skilled professionals to the UK from Poland, aiding positive demographic change
• EPP experienced a 5% increase in demand for its office space e.g. McKinsey, Philips and BA
• The probability of yield compression in line with convergence with developed Europe will provide an opportunity to increase asset values
• Selected recent significant investments or planned investments in Poland:
(Mercedes Benz)€500m
engine factory
€326mLithium-Ion battery
plant
€60mSupplier of components to
Boeing, Airbus and Rolls Royce
€800mcommercial vehicle factory
Announced expansion of Warsaw office
Launched operations centre in Warsaw
Extended facilities to create world’s largest
Global Shared Services Centre
Centre for excellence
Poland’s Investment Case
23
EuropeanExcellence Hub
Top 50 Polish Cities
24
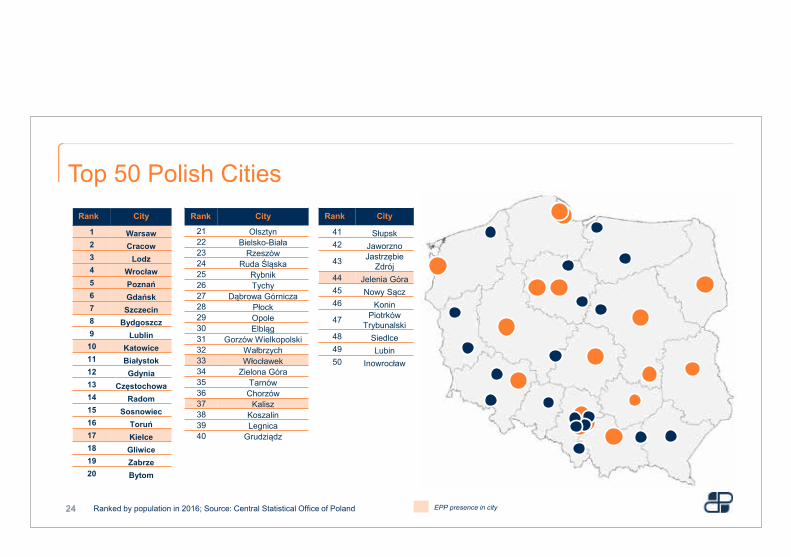
Rank City
1 Warsaw2 Cracow3 Lodz4 Wrocław5 Poznań6 Gdańsk7 Szczecin8 Bydgoszcz9 Lublin
10 Katowice11 Białystok12 Gdynia13 Częstochowa14 Radom15 Sosnowiec 16 Toruń17 Kielce18 Gliwice 19 Zabrze 20 Bytom
Rank City
21 Olsztyn22 Bielsko-Biała23 Rzeszów24 Ruda Śląska25 Rybnik26 Tychy 27 Dąbrowa Górnicza28 Płock29 Opole30 Elbląg31 Gorzów Wielkopolski32 Wałbrzych33 Włocławek34 Zielona Góra35 Tarnów36 Chorzów37 Kalisz38 Koszalin39 Legnica40 Grudziądz
Rank City
41 Słupsk42 Jaworzno
43 Jastrzębie Zdrój
44 Jelenia Góra45 Nowy Sącz46 Konin
47 Piotrków Trybunalski
48 Siedlce49 Lubin50 Inowrocław
Ranked by population in 2016; Source: Central Statistical Office of Poland EPP presence in city
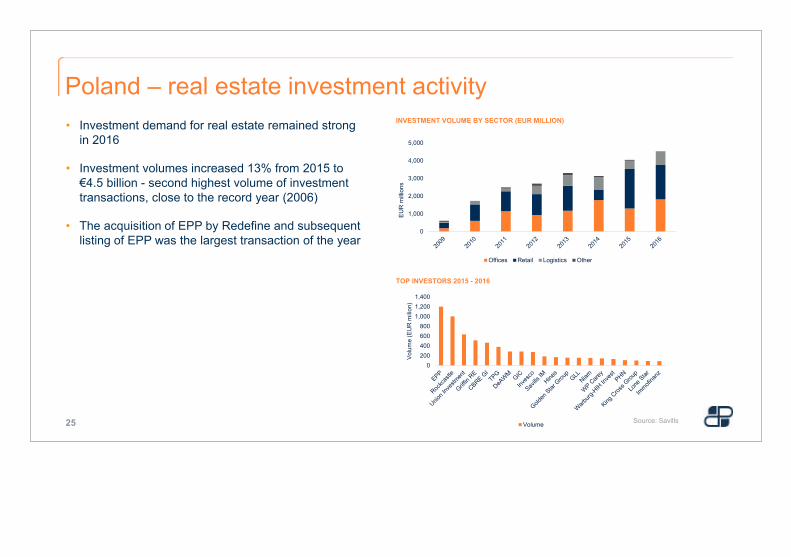
• Investment demand for real estate remained strong in 2016
• Investment volumes increased 13% from 2015 to €4.5 billion - second highest volume of investment transactions, close to the record year (2006)
• The acquisition of EPP by Redefine and subsequent listing of EPP was the largest transaction of the year
TOP INVESTORS 2015 - 2016
0
1,000
2,000
3,000
4,000
5,000
EU
R m
illio
ns
Offices Retail Logistics Other
Source: Savills
Poland – real estate investment activity
25
0200400600800
1,0001,2001,400
Vol
ume
(EU
R m
ilion
)
Volume
INVESTMENT VOLUME BY SECTOR (EUR MILLION)
26
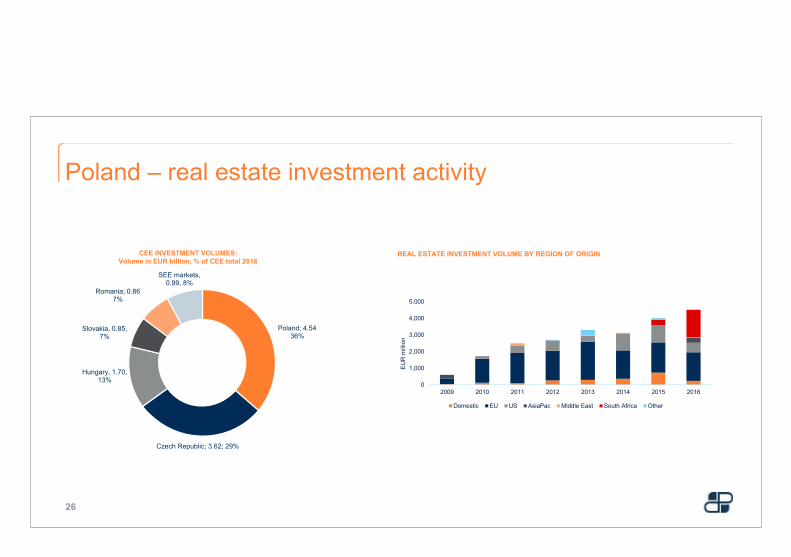
Poland; 4.5436%
Czech Republic; 3.62; 29%
Hungary, 1.70, 13%
Slovakia, 0.85, 7%
Romania; 0.867%
SEE markets, 0.99, 8%
Poland – real estate investment activity
0
1,000
2,000
3,000
4,000
5,000
2009 2010 2011 2012 2013 2014 2015 2016
EU
R m
illio
nDomestic EU US AsiaPac Middle East South Africa Other
CEE INVESTMENT VOLUMES:Volume in EUR billion, % of CEE total 2016
REAL ESTATE INVESTMENT VOLUME BY REGION OF ORIGIN
• In late December 2016, the Polish Government amended tax legislation effective 1 January 2017 which removed the corporate income tax exemptions applicable to Polish investment funds of the nature utilised within the EPP Group structure
• It is anticipated that the adverse fiscal effects of the tax changes will be substantially reversed once Polish REIT legislation comes into effect
• The EPP Group has reorganised its holdings to allow for the transfer of its assets in anticipation of the proposed REIT regime.
• The corporate reorganisation implemented within the EPP Group will result in a reduction in effective tax cost
• The group reorganisation together with various asset management initiatives and taking into account the accretive benefits of recently announced acquisitions (concluded post the September 2016 listing) result in EPP remaining on track to achieve its forecast distributable earnings and DPS for the financial period ended 31 December 2017 (as published in the 31 August 2016 Pre-Listing Statement) 1
Regulatory update – tax and REIT regime
271This forecast is the responsibility of the board and has not been reported on by the company’s auditors

www.echo-pp.com4. Portfolio overview
Portfolio overview
29
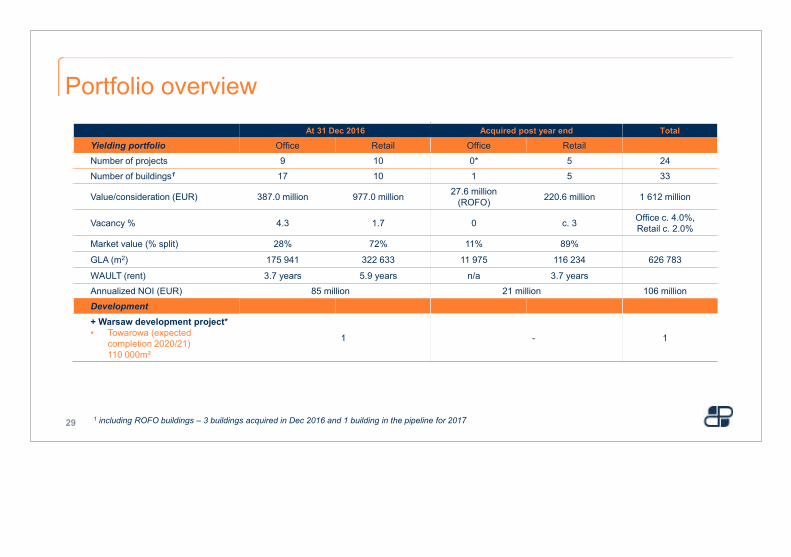
At 31 Dec 2016 Acquired post year end Total
Yielding portfolio Office Retail Office Retail
Number of projects 9 10 0* 5 24
Number of buildings1 17 10 1 5 33
Value/consideration (EUR) 387.0 million 977.0 million 27.6 million(ROFO) 220.6 million 1 612 million
Vacancy % 4.3 1.7 0 c. 3 Office c. 4.0%, Retail c. 2.0%
Market value (% split) 28% 72% 11% 89%
GLA (m2) 175 941 322 633 11 975 116 234 626 783
WAULT (rent) 3.7 years 5.9 years n/a 3.7 years
Annualized NOI (EUR) 85 million 21 million 106 million
Development+ Warsaw development project*• Towarowa (expected
completion 2020/21)110 000m²
1 - 1
1 including ROFO buildings – 3 buildings acquired in Dec 2016 and 1 building in the pipeline for 2017
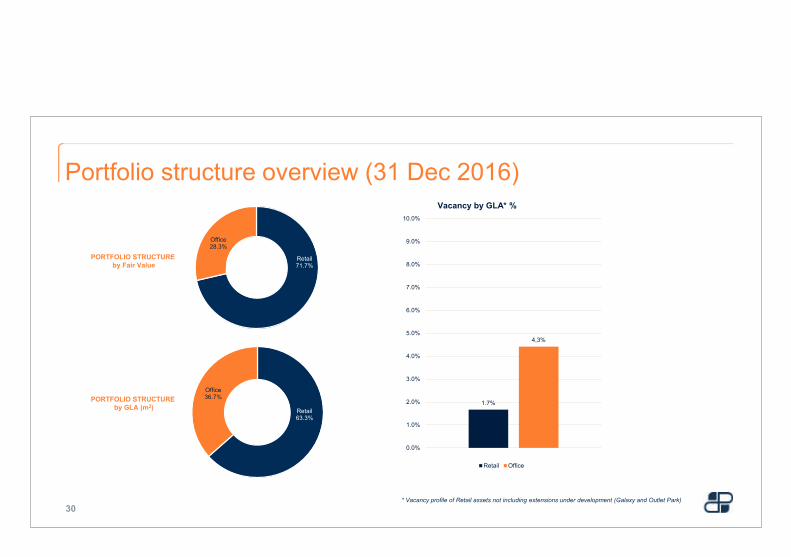
Portfolio structure overview (31 Dec 2016)
Retail71.7%
Office28.3%
Retail63.3%
Office36.7%
1.7%
4,3%
0.0%
1.0%
2.0%
3.0%
4.0%
5.0%
6.0%
7.0%
8.0%
9.0%
10.0%
Vacancy by GLA* %
Retail Office
* Vacancy profile of Retail assets not including extensions under development (Galaxy and Outlet Park)30
PORTFOLIO STRUCTURE by GLA (m2)
PORTFOLIO STRUCTURE by Fair Value
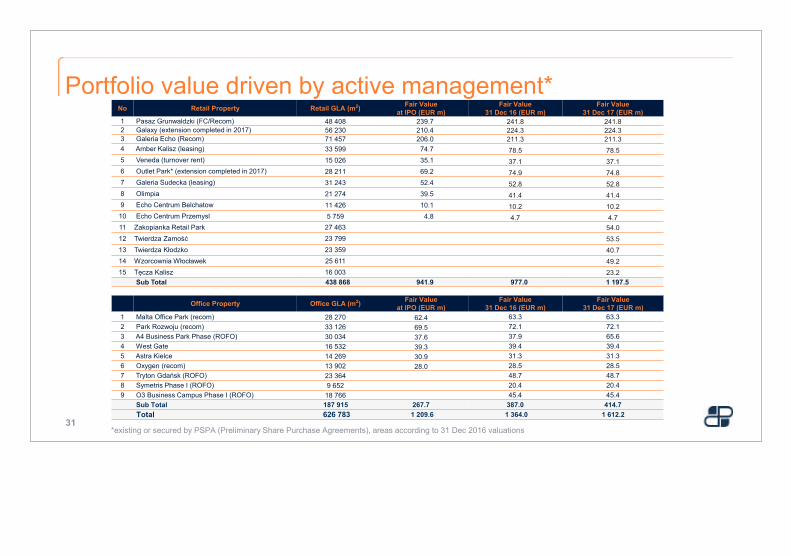
Portfolio value driven by active management*
31
No Retail Property Retail GLA (m2) Fair Valueat IPO (EUR m)
Fair Value31 Dec 16 (EUR m)
Fair Value31 Dec 17 (EUR m)
1 Pasaz Grunwaldzki (FC/Recom) 48 408 239.7 241.8 241.82 Galaxy (extension completed in 2017) 56 230 210.4 224.3 224.33 Galeria Echo (Recom) 71 457 206.0 211.3 211.34 Amber Kalisz (leasing) 33 599 74.7 78.5 78.55 Veneda (turnover rent) 15 026 35.1 37.1 37.16 Outlet Park* (extension completed in 2017) 28 211 69.2 74.9 74.87 Galeria Sudecka (leasing) 31 243 52.4 52.8 52.88 Olimpia 21 274 39.5 41.4 41.49 Echo Centrum Belchatow 11 426 10.1 10.2 10.2
10 Echo Centrum Przemysl 5 759 4.8 4.7 4.711 Zakopianka Retail Park 27 463 54.012 Twierdza Zamość 23 799 53.513 Twierdza Kłodzko 23 359 40.714 Wzorcownia Włocławek 25 611 49.215 Tęcza Kalisz 16 003 23.2
Sub Total 438 868 941.9 977.0 1 197.5
Office Property Office GLA (m2) Fair Valueat IPO (EUR m)
Fair Value31 Dec 16 (EUR m)
Fair Value31 Dec 17 (EUR m)
1 Malta Office Park (recom) 28 270 62.4 63.3 63.3 2 Park Rozwoju (recom) 33 126 69.5 72.1 72.1 3 A4 Business Park Phase (ROFO) 30 034 37.6 37.9 65.64 West Gate 16 532 39.3 39.4 39.45 Astra Kielce 14 269 30.9 31.3 31.36 Oxygen (recom) 13 902 28.0 28.5 28.57 Tryton Gdańsk (ROFO) 23 364 48.7 48.78 Symetris Phase I (ROFO) 9 652 20.4 20.49 O3 Business Campus Phase I (ROFO) 18 766 45.4 45.4
Sub Total 187 915 267.7 387.0 414.7Total 626 783 1 209.6 1 364.0 1 612.2
*existing or secured by PSPA (Preliminary Share Purchase Agreements), areas according to 31 Dec 2016 valuations
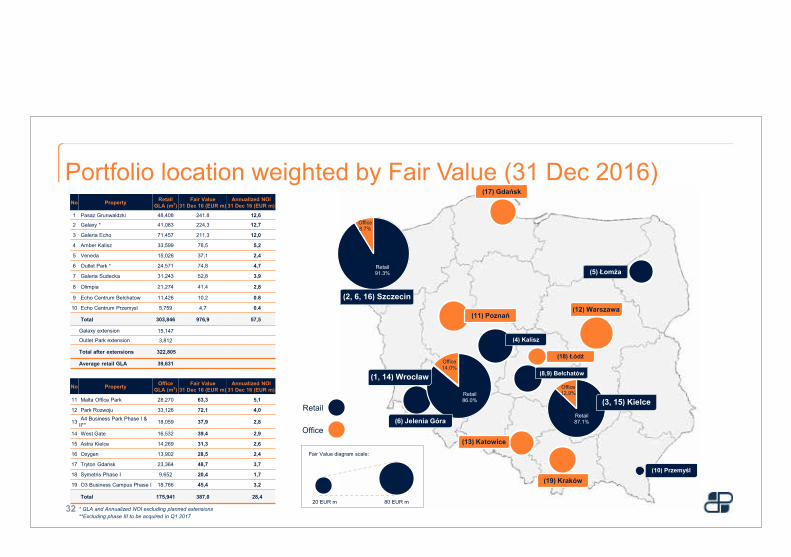
Portfolio location weighted by Fair Value (31 Dec 2016)
Retail86.0%
Office14.0%
Retail91.3%
Office8.7%
Retail87.1%
Office12.9%
(2, 6, 16) Szczecin
(1, 14) Wrocław
(3, 15) Kielce
(5) Łomża
(10) Przemyśl
(6) Jelenia Góra
(4) Kalisz
(8,9) Bełchatów
(12) Warszawa(11) Poznań
(13) Katowice
(19) Kraków
(17) Gdańsk
(18) Łódź
Retail
Office
No Property Retail GLA (m2)
Fair Value31 Dec 16 (EUR m)
Annualized NOI31 Dec 16 (EUR m)
1 Pasaz Grunwaldzki 48,408 241.8 12,6
2 Galaxy * 41,083 224,3 12,7
3 Galeria Echo 71,457 211,3 12,0
4 Amber Kalisz 33,599 78,5 5,2
5 Veneda 15,026 37,1 2,4
6 Outlet Park * 24,571 74,8 4,7
7 Galeria Sudecka 31,243 52,8 3,9
8 Olimpia 21,274 41,4 2,8
9 Echo Centrum Belchatow 11,426 10,2 0.8
10 Echo Centrum Przemysl 5,759 4,7 0.4
Total 303,846 976,9 57,5
Galaxy extension 15,147
Outlet Park extension 3,812
Total after extensions 322,805
Average retail GLA 39,631
No Property Office GLA (m2)
Fair Value31 Dec 16 (EUR m)
Annualized NOI31 Dec 16 (EUR m)
11 Malta Office Park 28,270 63,3 5,1
12 Park Rozwoju 33,126 72,1 4,0
13 A4 Business Park Phase I & II** 18,059 37,9 2,8
14 West Gate 16,532 39,4 2,9
15 Astra Kielce 14,269 31,3 2,6
16 Oxygen 13,902 28,5 2,4
17 Tryton Gdańsk 23,364 48,7 3,7
18 Symetris Phase I 9,652 20,4 1,7
19 O3 Business Campus Phase I 18,766 45,4 3,2
Total 175,941 387,0 28,420 EUR m 80 EUR m
Fair Value diagram scale:
* GLA and Annualized NOI excluding planned extensions32**Excluding phase III to be acquired in Q1 2017
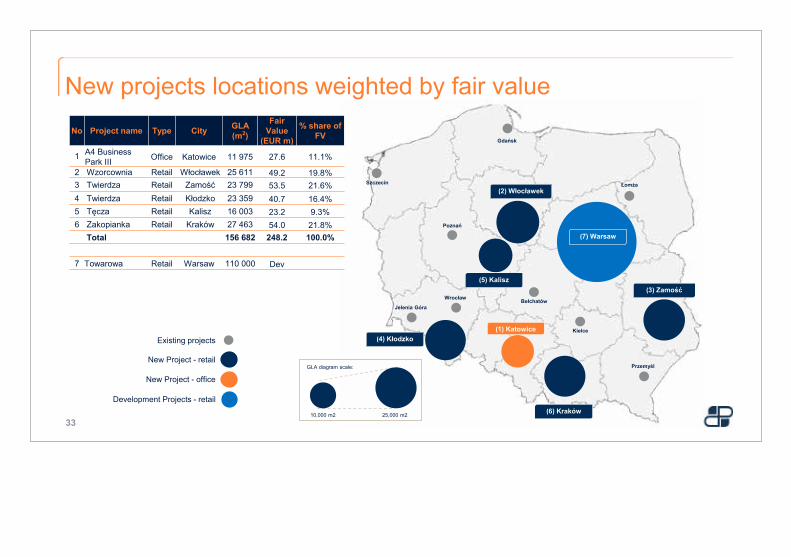
New projects locations weighted by fair value
New Project - retail
10,000 m2 25,000 m2
GLA diagram scale:
(6) Kraków
(2) Włocławek
(3) Zamość
(4) Kłodzko
(5) Kalisz
No Project name Type City GLA (m2)
Fair Value
(EUR m)
% share of FV
1 A4 Business Park III Office Katowice 11 975 27.6 11.1%
2 Wzorcownia Retail Włocławek 25 611 49.2 19.8%3 Twierdza Retail Zamość 23 799 53.5 21.6%4 Twierdza Retail Kłodzko 23 359 40.7 16.4%5 Tęcza Retail Kalisz 16 003 23.2 9.3%6 Zakopianka Retail Kraków 27 463 54.0 21.8%
Total 156 682 248.2 100.0%
7 Towarowa Retail Warsaw 110 000 Dev
(1) Katowice
New Project - office
Szczecin
Gdańsk
Łomża
Warszawa
Jelenia Góra
Wrocław
Przemyśl
Poznań
Bełchatów
Kielce
Existing projects
33
Development Projects - retail
(7) Warsaw
www.echo-pp.com4.1 Retail
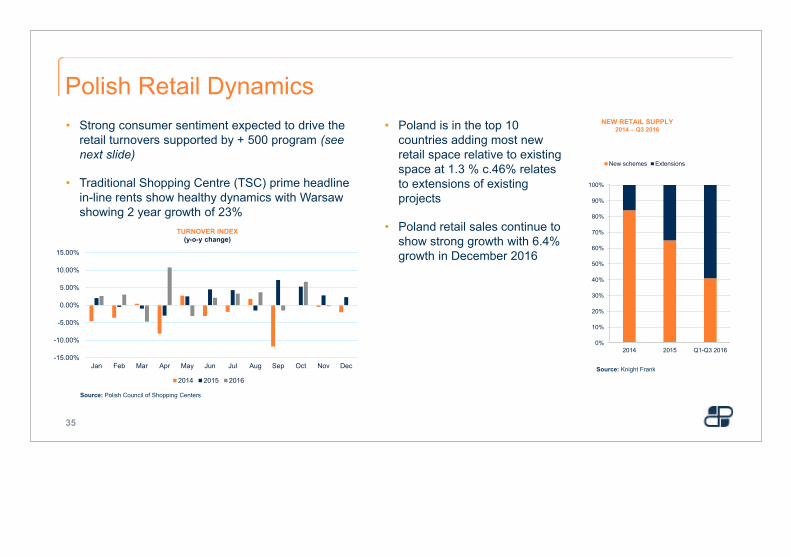
• Strong consumer sentiment expected to drive the retail turnovers supported by + 500 program (see next slide)
• Traditional Shopping Centre (TSC) prime headline in-line rents show healthy dynamics with Warsaw showing 2 year growth of 23%
• Poland is in the top 10 countries adding most new retail space relative to existing space at 1.3 % c.46% relates to extensions of existing projects
• Poland retail sales continue to show strong growth with 6.4% growth in December 2016
Polish Retail Dynamics
35
Source: Polish Council of Shopping Centers
0%
10%
20%
30%
40%
50%
60%
70%
80%
90%
100%
2014 2015 Q1-Q3 2016
New schemes Extensions
NEW RETAIL SUPPLY2014 – Q3 2016
Source: Knight Frank
-15.00%
-10.00%
-5.00%
0.00%
5.00%
10.00%
15.00%
Jan Feb Mar Apr May Jun Jul Aug Sep Oct Nov Dec
TURNOVER INDEX (y-o-y change)
2014 2015 2016
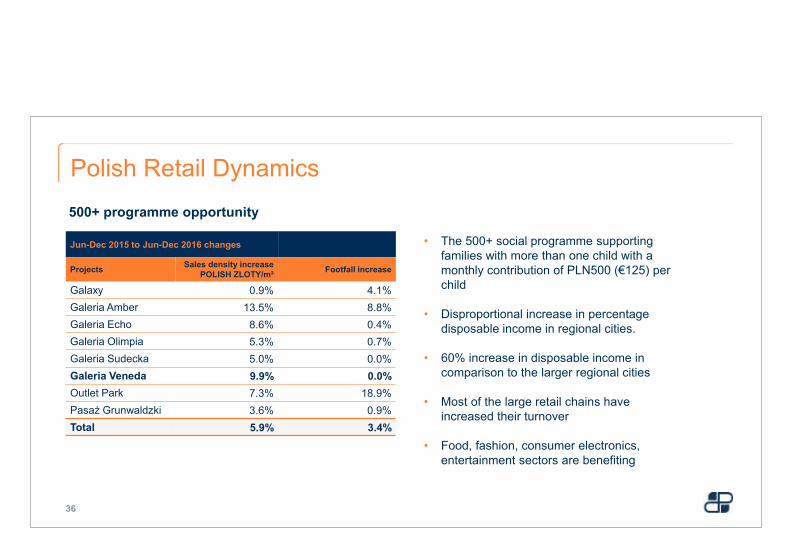
Polish Retail Dynamics500+ programme opportunity
Jun-Dec 2015 to Jun-Dec 2016 changes
Projects Sales density increase POLISH ZLOTY/m² Footfall increase
Galaxy 0.9% 4.1%Galeria Amber 13.5% 8.8%Galeria Echo 8.6% 0.4%Galeria Olimpia 5.3% 0.7%Galeria Sudecka 5.0% 0.0%Galeria Veneda 9.9% 0.0%Outlet Park 7.3% 18.9%Pasaż Grunwaldzki 3.6% 0.9%Total 5.9% 3.4%
• The 500+ social programme supportingfamilies with more than one child with a monthly contribution of PLN500 (€125) per child
• Disproportional increase in percentage disposable income in regional cities.
• 60% increase in disposable income in comparison to the larger regional cities
• Most of the large retail chains haveincreased their turnover
• Food, fashion, consumer electronics, entertainment sectors are benefiting
36
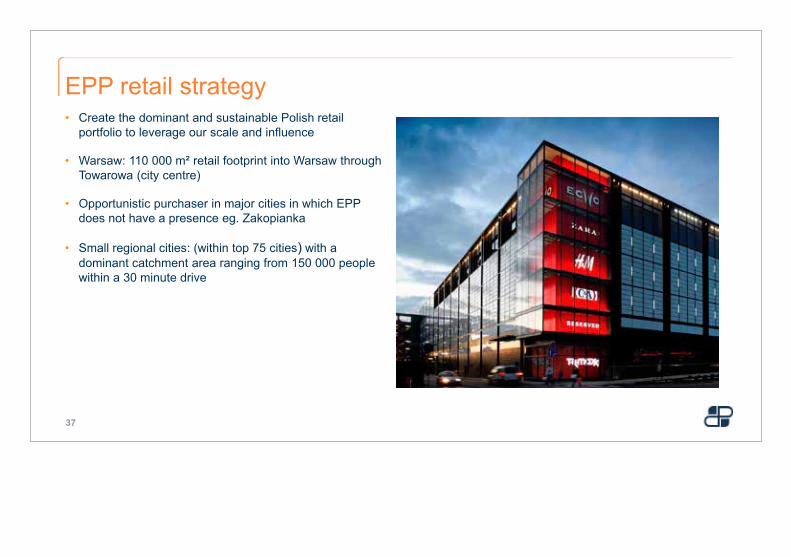
• Create the dominant and sustainable Polish retail portfolio to leverage our scale and influence
• Warsaw: 110 000 m² retail footprint into Warsaw through Towarowa (city centre)
• Opportunistic purchaser in major cities in which EPP does not have a presence eg. Zakopianka
• Small regional cities: (within top 75 cities) with adominant catchment area ranging from 150 000 peoplewithin a 30 minute drive
EPP retail strategy
37
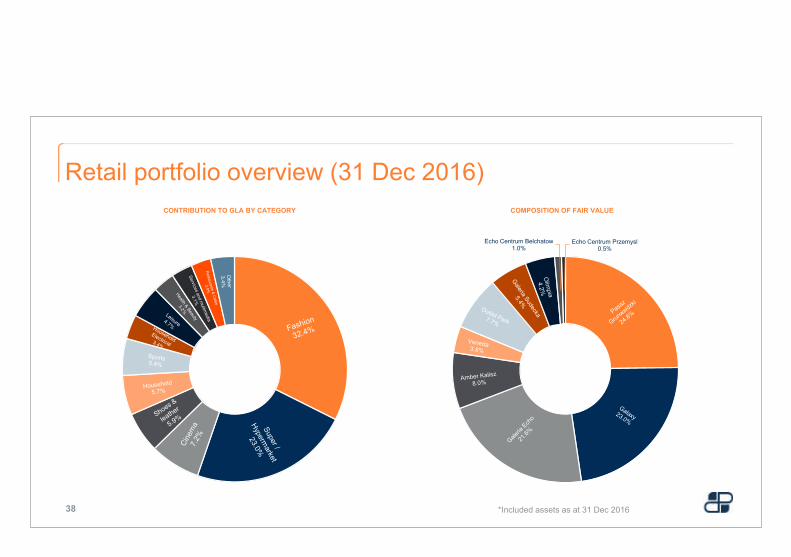
Retail portfolio overview (31 Dec 2016)
Echo Centrum Belchatow1.0%
Echo Centrum Przemysl0.5%
38
CONTRIBUTION TO GLA BY CATEGORY COMPOSITION OF FAIR VALUE
*Included assets as at 31 Dec 2016
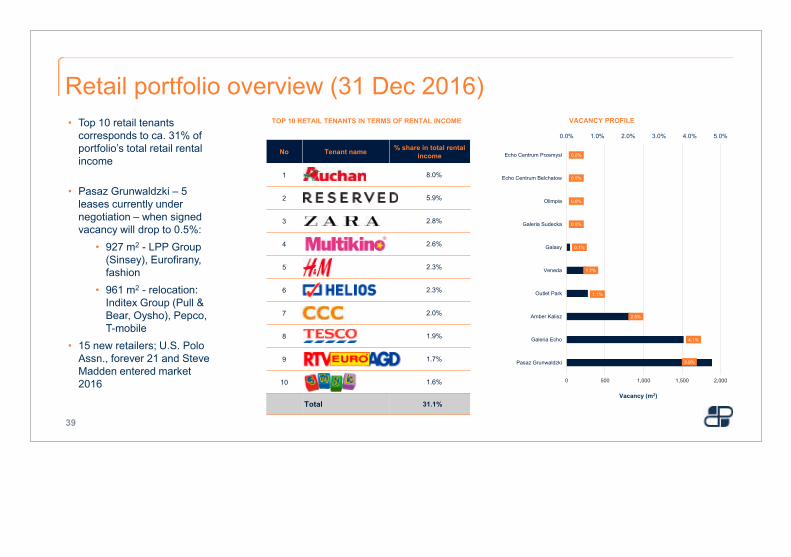
Retail portfolio overview (31 Dec 2016)• Top 10 retail tenants
corresponds to ca. 31% of portfolio’s total retail rentalincome
• Pasaz Grunwaldzki – 5 leases currently under negotiation – when signed vacancy will drop to 0.5%:
• 927 m2 - LPP Group (Sinsey), Eurofirany, fashion
• 961 m2 - relocation: Inditex Group (Pull & Bear, Oysho), Pepco, T-mobile
• 15 new retailers; U.S. Polo Assn., forever 21 and Steve Madden entered market 2016
3.9%
4,1%
2.5%
1.1%
1.7%
0.1%
0.0%
0.0%
0.0%
0.0%
0.0% 1.0% 2.0% 3.0% 4.0% 5.0%
0 500 1,000 1,500 2,000
Pasaz Grunwaldzki
Galeria Echo
Amber Kalisz
Outlet Park
Veneda
Galaxy
Galeria Sudecka
Olimpia
Echo Centrum Belchatow
Echo Centrum Przemysl
Vacancy (m2)
VACANCY PROFILE
39
TOP 10 RETAIL TENANTS IN TERMS OF RENTAL INCOME
No Tenant name % share in total rentalincome
1 8.0%
2 5.9%
3 2.8%
4 2.6%
5 2.3%
6 2.3%
7 2.0%
8 1.9%
9 1.7%
10 1.6%
Total 31.1%
8.41
5.79 5.61 5.38 5.17 5.12 5.11 4.97 4.79 4.41
-
1.00
2.00
3.00
4.00
5.00
6.00
7.00
8.00
9.00
Galaxy Echo CentrumPrzemysl
Outlet Park Amber Kalisz Galeria Sudecka Galeria Echo Pasaz Grunwaldzki Echo CentrumBelchatow
Veneda Olimpia
WAU
LT (y
ears
)
WAULT
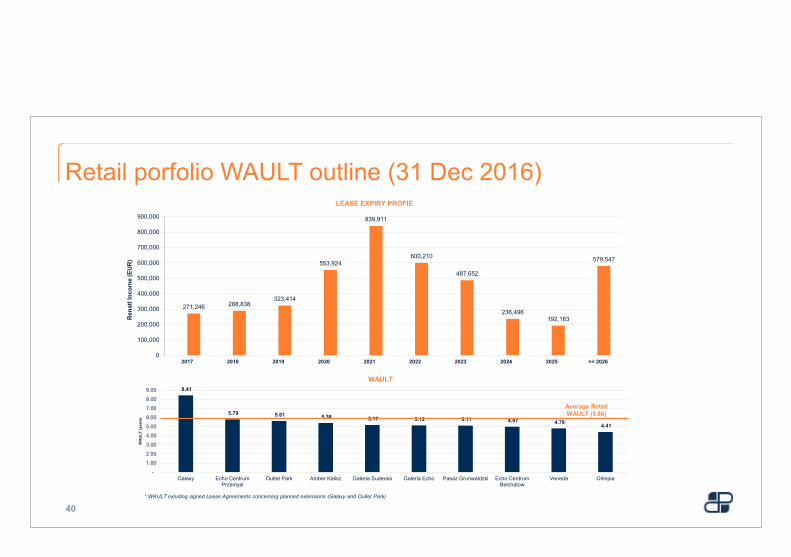
Retail porfolio WAULT outline (31 Dec 2016)
Average Retail WAULT (5.86)
* WAULT exluding signed Lease Agreements concerning planned extensions (Galaxy and Outlet Park)
40
271,246 288,838323,414
553,924
839,911
600,210
487,652
236,496192,183
579,547
0
100,000
200,000
300,000
400,000
500,000
600,000
700,000
800,000
900,000
2017 2018 2019 2020 2021 2022 2023 2024 2025 =< 2026
Ren
atl I
ncom
e (E
UR
)
LEASE EXPIRY PROFIE

www.echo-pp.com4.2 Office
0%
25%
50%
75%
100%
0
3
6
9
12
Mill
ions
m²
SUPPLY: WARSAW VS. REGIONAL CITIES
Warsaw Regional cities Regional cities vs. Warsaw
0%
25%
50%
75%
100%
0
500,000
1,000,000
1,500,000
2,000,000
m²
TAKE-UP: WARSAW VS. REGIONAL CITIES
Warsaw Regional cities Regional cities vs. Warsaw
0.0%
5.0%
10.0%
15.0%
20.0%
25.0%
VACANCY RATE: WARSAW VS. REGIONAL CITIES
Warsaw Kraków Wrocław
Poznań Łódź Tricity
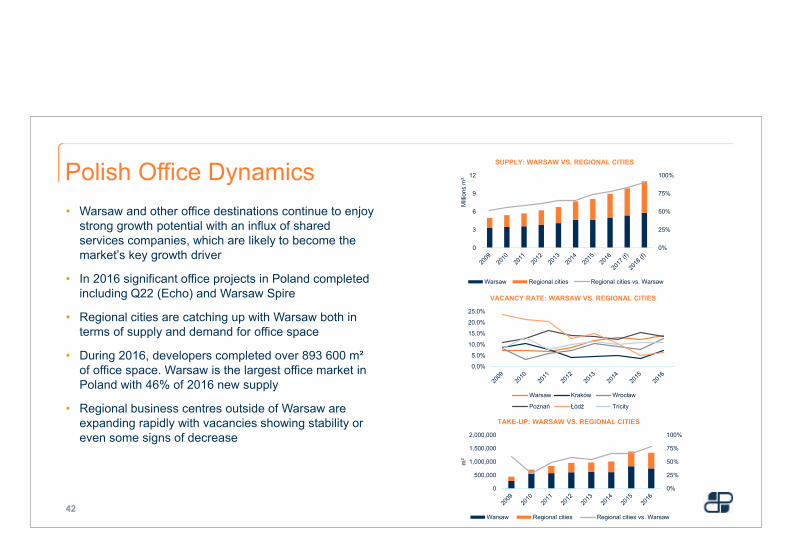
Polish Office Dynamics
42
• Warsaw and other office destinations continue to enjoy strong growth potential with an influx of shared services companies, which are likely to become the market’s key growth driver
• In 2016 significant office projects in Poland completed including Q22 (Echo) and Warsaw Spire
• Regional cities are catching up with Warsaw both in terms of supply and demand for office space
• During 2016, developers completed over 893 600 m² of office space. Warsaw is the largest office market in Poland with 46% of 2016 new supply
• Regional business centres outside of Warsaw are expanding rapidly with vacancies showing stability or even some signs of decrease
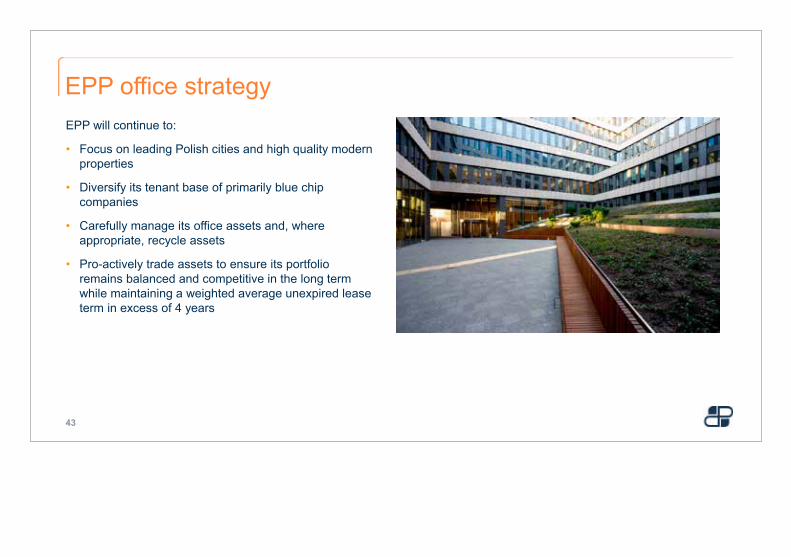
EPP will continue to:
• Focus on leading Polish cities and high quality modern properties
• Diversify its tenant base of primarily blue chip companies
• Carefully manage its office assets and, where appropriate, recycle assets
• Pro-actively trade assets to ensure its portfolio remains balanced and competitive in the long term while maintaining a weighted average unexpired lease term in excess of 4 years
EPP office strategy
43
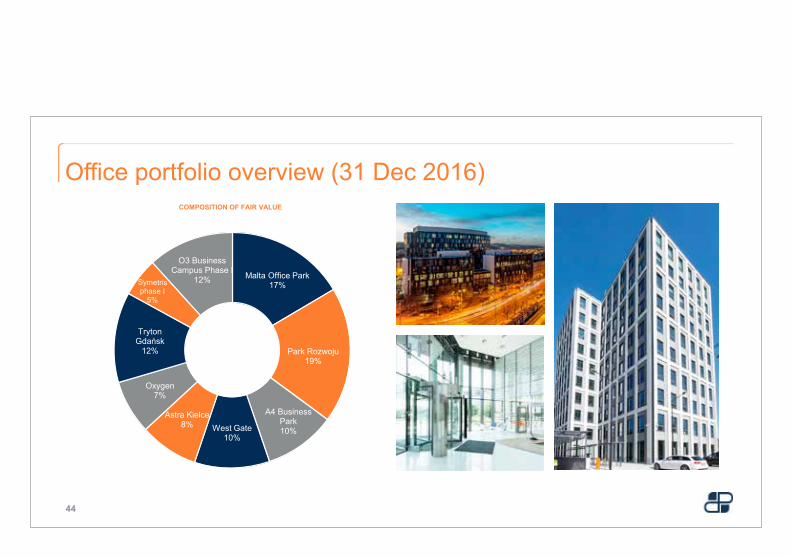
Office portfolio overview (31 Dec 2016)
Malta Office Park17%
Park Rozwoju19%
A4 Business Park10%West Gate
10%
Astra Kielce8%
Oxygen7%
Tryton Gdańsk
12%
O3 Business Campus Phase I
12%
44
COMPOSITION OF FAIR VALUE
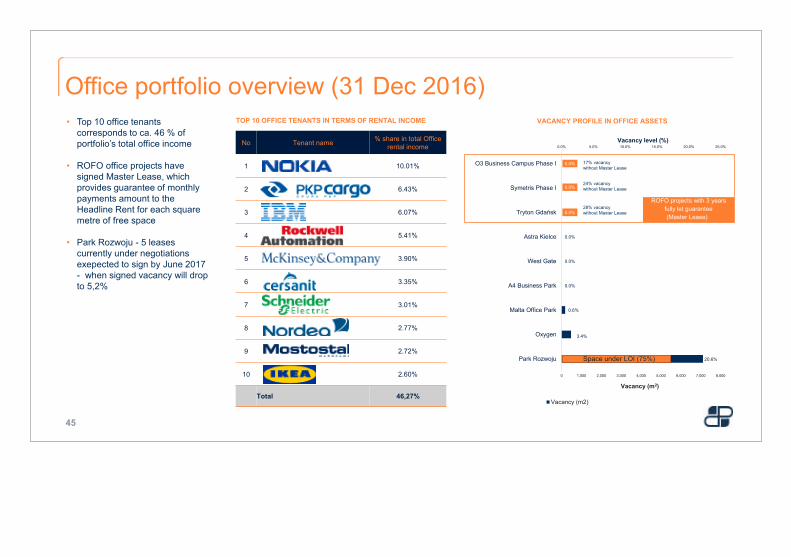
Office portfolio overview (31 Dec 2016)
No Tenant name % share in total Officerental income
1 10.01%
2 6.43%
3 6.07%
4 5.41%
5 3.90%
6 3.35%
7 3.01%
8 2.77%
9 2.72%
10 2.60%
Total 46,27%
TOP 10 OFFICE TENANTS IN TERMS OF RENTAL INCOME
20,6%
3.4%
0.6%
0.0%
0.0%
0.0%
0.0%
0.0%
0.0%
0.0% 5.0% 10.0% 15.0% 20.0% 25.0%
0 1,000 2,000 3,000 4,000 5,000 6,000 7,000 8,000
Park Rozwoju
Oxygen
Malta Office Park
A4 Business Park
West Gate
Astra Kielce
Tryton Gdańsk
Symetris Phase I
O3 Business Campus Phase I
Vacancy level (%)
Vacancy (m2)
VACANCY PROFILE IN OFFICE ASSETS
Vacancy (m2)
Space under LOI (75%) 20.6%
ROFO projects with 3 yearsfully let guarantee(Master Lease)
45
28% vacancy without Master Lease
24% vacancy without Master Lease
17% vacancy without Master Lease
• Top 10 office tenantscorresponds to ca. 46 % of portfolio’s total office income
• ROFO office projects havesigned Master Lease, whichprovides guarantee of monthlypayments amount to the Headline Rent for each squaremetre of free space
• Park Rozwoju - 5 leasescurrently under negotiationsexepected to sign by June 2017 - when signed vacancy will drop to 5,2%
6.36
4.45 4.25 3.88
2.91
1.92
4.22
5.12
5.81
-
1.00
2.00
3.00
4.00
5.00
6.00
7.00
Astra Kielce A4 Business Park West Gate Park Rozwoju Oxygen Malta Office Park Tryton Gdańsk Symetris Phase I O3 Business CampusPhase I
WAU
LT (y
ears
)
WAULT
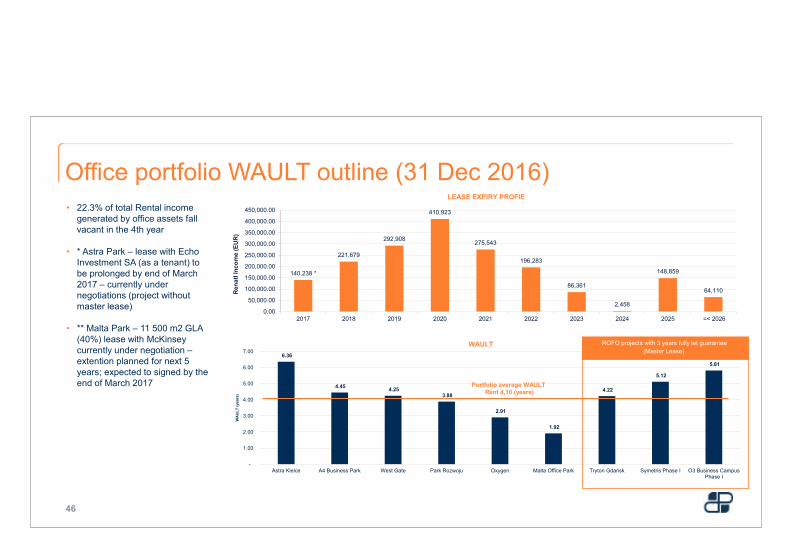
Office portfolio WAULT outline (31 Dec 2016)
Portfolio average WAULT Rent 4,10 (years)
ROFO projects with 3 years fully let guarantee(Master Lease)
• 22.3% of total Rental incomegenerated by office assets fallvacant in the 4th year
• * Astra Park – lease with Echo Investment SA (as a tenant) to be prolonged by end of March 2017 – currently undernegotiations (project withoutmaster lease)
• ** Malta Park – 11 500 m2 GLA (40%) lease with McKinseycurrently under negotiation –extention planned for next 5 years; expected to signed by the end of March 2017
140,238 *
221,679
292,908
410,923
275,543
196,283
86,361
2,458
148,859
64,110
0.00
50,000.00
100,000.00
150,000.00
200,000.00
250,000.00
300,000.00
350,000.00
400,000.00
450,000.00
2017 2018 2019 2020 2021 2022 2023 2024 2025 =< 2026
Ren
atlI
ncom
e(E
UR
)
LEASE EXPIRY PROFIE
46
www.echo-pp.com4.3 Developments
48
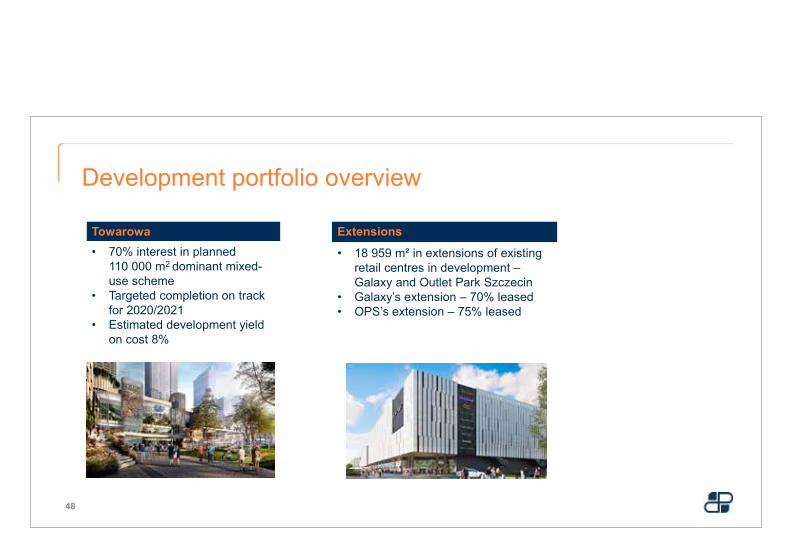
Development portfolio overview
Towarowa• 70% interest in planned
110 000 m2 dominant mixed-use scheme
• Targeted completion on track for 2020/2021
• Estimated development yieldon cost 8%
Extensions
• 18 959 m² in extensions of existing retail centres in development –Galaxy and Outlet Park Szczecin
• Galaxy’s extension – 70% leased• OPS’s extension – 75% leased
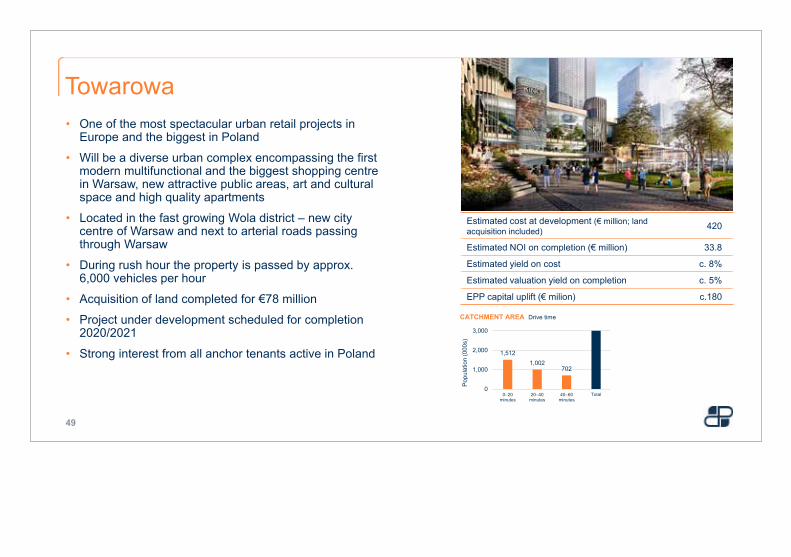
• One of the most spectacular urban retail projects in Europe and the biggest in Poland
• Will be a diverse urban complex encompassing the first modern multifunctional and the biggest shopping centre in Warsaw, new attractive public areas, art and cultural space and high quality apartments
• Located in the fast growing Wola district – new city centre of Warsaw and next to arterial roads passing through Warsaw
• During rush hour the property is passed by approx. 6,000 vehicles per hour
• Acquisition of land completed for €78 million
• Project under development scheduled for completion 2020/2021
• Strong interest from all anchor tenants active in Poland
Towarowa
49
Estimated cost at development (€ million; land acquisition included) 420
Estimated NOI on completion (€ million) 33.8
Estimated yield on cost c. 8%
Estimated valuation yield on completion c. 5%
EPP capital uplift (€ milion) c.180
CATCHMENT AREA Drive time
1,5121,002
702
0
1,000
2,000
3,000
0–20minutes
20–40 minutes
40–60 minutes
Total
Pop
ulat
ion
(000
s)
50
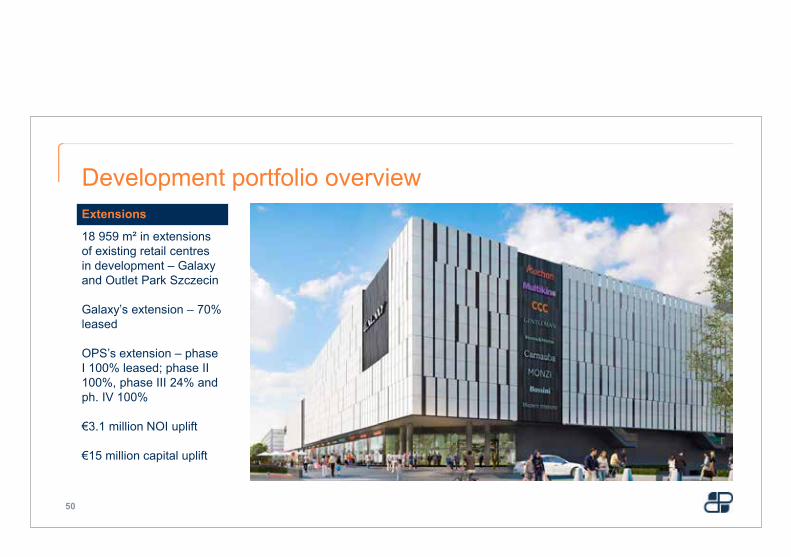
Development portfolio overviewExtensions
18 959 m² in extensions of existing retail centresin development – Galaxyand Outlet Park Szczecin
Galaxy’s extension – 70% leased
OPS’s extension – phaseI 100% leased; phase II 100%, phase III 24% and ph. IV 100%
€3.1 million NOI uplift
€15 million capital uplift
www.echo-pp.com5. Prospects
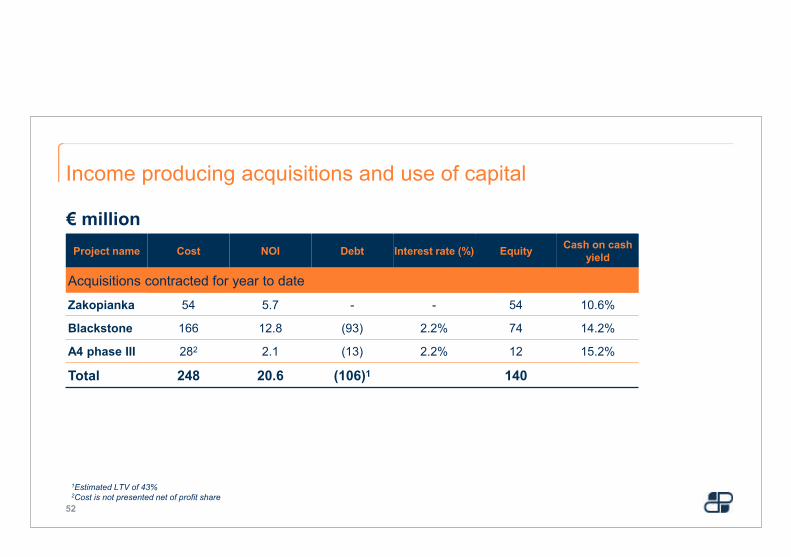
€ millionProject name Cost NOI Debt Interest rate (%) Equity Cash on cash
yield
Acquisitions contracted for year to date
Zakopianka 54 5.7 - - 54 10.6%
Blackstone 166 12.8 (93) 2.2% 74 14.2%
A4 phase III 282 2.1 (13) 2.2% 12 15.2%
Total 248 20.6 (106)1 140
1Estimated LTV of 43%2Cost is not presented net of profit share
Income producing acquisitions and use of capital
52
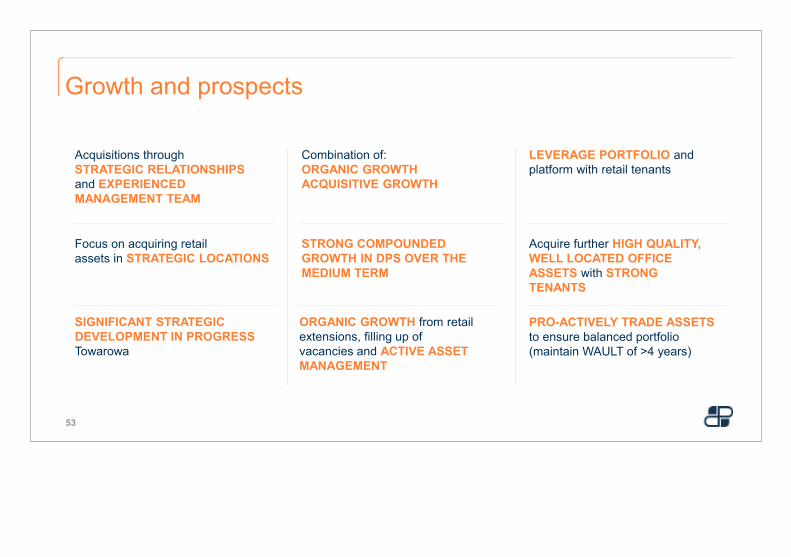
Acquisitions through STRATEGIC RELATIONSHIPS and EXPERIENCED MANAGEMENT TEAM
Combination of:ORGANIC GROWTHACQUISITIVE GROWTH
ORGANIC GROWTH from retail extensions, filling up of vacancies and ACTIVE ASSET MANAGEMENT
Focus on acquiring retail assets in STRATEGIC LOCATIONS
LEVERAGE PORTFOLIO and platform with retail tenants
SIGNIFICANT STRATEGIC DEVELOPMENT IN PROGRESSTowarowa
PRO-ACTIVELY TRADE ASSETSto ensure balanced portfolio (maintain WAULT of >4 years)
Acquire further HIGH QUALITY, WELL LOCATED OFFICE ASSETS with STRONG TENANTS
Growth and prospects
53
STRONG COMPOUNDED GROWTH IN DPS OVER THE MEDIUM TERM

Questions & answers
54

Contacts
CEOHadley Dean
+48 22 43 00 300
MARKETING DIRECTORMagda Cieliczko
+48 22 43 00 300
INVESTOR RELATIONSSingular Systems IR
Jacques de [email protected]
Michèle [email protected]
+27 10 003 0700
CORPORATE ADVISORJava Capital
Kevin [email protected]
+27(0)83 642 0112
Carl [email protected]
+27(0)83 642 0223