concurrent fortran 95...
TRANSCRIPT

Concurrent Fortran 95 Tutorial
0890498-000
February 2002
Copyright 2002 by Concurrent Computer Corporation. All rights reserved. This publication or any part thereof isintended for use with Concurrent Computer Corporation products by Concurrent Computer Corporation personnel,customers, and end–users. It may not be reproduced in any form without the written permission of the publisher.
The information contained in this document is believed to be correct at the time of publication. It is subject to changewithout notice. Concurrent Computer Corporation makes no warranties, expressed or implied, concerning the infor-mation contained in this document.
To report an error or comment on a specific portion of the manual, photocopy the page in question and mark the cor-rection or comment on the copy. Mail the copy (and any additional comments) to Concurrent Computer Corporation,2881 Gateway Drive, Pompano Beach, FL 33069-4324. Mark the envelope “Attention: Publications Department.”This publication may not be reproduced for any other reason in any form without written permission of the publisher.
PowerMAX OS, Power Hawk, NightSim, NightTrace, and NightView are trademarks of Concurrent Computer Corporation.
Motorola is a registered trademark of Motorola, Inc.
UNIX is a registered trademark of The Open Group.
Printed in U. S. A.
Revision History: Level: Effective With:
Original Release -- February 2002 000 PowerMAX OS 4.3
Preface
General Information
Concurrent Fortran 95 utilizes the Numerical Algorithms Group’s F95 compiler and Con-current’s C/C++ compiler to produce highly optimized object code tailored to Concurrentsystems running PowerMAX OSTM.
Scope of Manual
This manual is a tutorial for Concurrent Fortran 95. In this tutorial, we will compile andlink a Fortran program and then document its usage with the NightViewTM symbolicdebugger, the NightSimTM frequency-based scheduler, and the NightTraceTM event ana-lyzer.
Structure of Manual
This manual consists of one chapter which is the tutorial for Concurrent Fortran 95.
Syntax Notation
The following notation is used throughout this guide:
italic Books, reference cards, and items that the user must specifyappear in italic type. Special terms and comments in code mayalso appear in italic.
list bold User input appears in list bold type and must be enteredexactly as shown. Names of directories, files, commands, optionsand man page references also appear in list bold type.
list Operating system and program output such as prompts and mes-sages and listings of files and programs appears in list type.Keywords also appear in list type.
emphasis Words or phrases that require extra emphasis use emphasis type.
window Keyboard sequences and window features such as push buttons,radio buttons, menu items, labels, and titles appear in windowtype.
[ ] Brackets enclose command options and arguments that areoptional. You do not type the brackets if you choose to specifysuch option or arguments.
3
Concurrent Fortran 95 Tutorial
{ } Braces enclose mutually exclusive choices separated by the pipe(|) character, where one choice must be selected. You do not typethe braces or the pipe character with the choice.
... An ellipsis follows an item that can be repeated.
::= This symbol means is defined as in Backus-Naur Form (BNF).
Referenced Publications
The following publications are referenced in this document:
0890395 NightView User’s Guide
0890398 NightTrace Manual
0890458 NightSim User’s Guide
4
Contents
Contents
Chapter 1 Using Concurrent Fortran 95 with NightStar Tools
Overview . . . . . . . . . . . . . . . . . . . . . . . . . . . . . . . . . . . . . . . . . . . . . . . . . . . . . . . . . . 1-1Before you begin . . . . . . . . . . . . . . . . . . . . . . . . . . . . . . . . . . . . . . . . . . . . . . . . 1-1
Getting Started . . . . . . . . . . . . . . . . . . . . . . . . . . . . . . . . . . . . . . . . . . . . . . . . . . . . . . 1-3Using NEdit . . . . . . . . . . . . . . . . . . . . . . . . . . . . . . . . . . . . . . . . . . . . . . . . . . . . . . . . 1-4Using the Concurrent Fortran 95 compiler . . . . . . . . . . . . . . . . . . . . . . . . . . . . . . . . 1-7
Viewing the intermediate C code . . . . . . . . . . . . . . . . . . . . . . . . . . . . . . . . . . . . 1-7Using NightSim . . . . . . . . . . . . . . . . . . . . . . . . . . . . . . . . . . . . . . . . . . . . . . . . . . . . . 1-9
Invoking NightSim . . . . . . . . . . . . . . . . . . . . . . . . . . . . . . . . . . . . . . . . . . . . . . . 1-9Configuring the Scheduler . . . . . . . . . . . . . . . . . . . . . . . . . . . . . . . . . . . . . . . . . 1-9Scheduling a process . . . . . . . . . . . . . . . . . . . . . . . . . . . . . . . . . . . . . . . . . . . . . 1-12Activating user tracing and kernel tracing . . . . . . . . . . . . . . . . . . . . . . . . . . . . . 1-13Setting up the scheduler . . . . . . . . . . . . . . . . . . . . . . . . . . . . . . . . . . . . . . . . . . . 1-15
Using NightView . . . . . . . . . . . . . . . . . . . . . . . . . . . . . . . . . . . . . . . . . . . . . . . . . . . . 1-17Adding a tracepoint in the program . . . . . . . . . . . . . . . . . . . . . . . . . . . . . . . . . . 1-18Inserting a monitorpoint . . . . . . . . . . . . . . . . . . . . . . . . . . . . . . . . . . . . . . . . . . . 1-20Resuming execution . . . . . . . . . . . . . . . . . . . . . . . . . . . . . . . . . . . . . . . . . . . . . . 1-22Starting the simulation . . . . . . . . . . . . . . . . . . . . . . . . . . . . . . . . . . . . . . . . . . . . 1-23Inserting a patchpoint . . . . . . . . . . . . . . . . . . . . . . . . . . . . . . . . . . . . . . . . . . . . . 1-24Halting user tracing and kernel tracing . . . . . . . . . . . . . . . . . . . . . . . . . . . . . . . 1-26Disabling the patchpoint. . . . . . . . . . . . . . . . . . . . . . . . . . . . . . . . . . . . . . . . . . . 1-26Exiting the program . . . . . . . . . . . . . . . . . . . . . . . . . . . . . . . . . . . . . . . . . . . . . . 1-27Removing the scheduler . . . . . . . . . . . . . . . . . . . . . . . . . . . . . . . . . . . . . . . . . . . 1-28
Using NightTrace. . . . . . . . . . . . . . . . . . . . . . . . . . . . . . . . . . . . . . . . . . . . . . . . . . . . 1-30Converting kernel trace event files. . . . . . . . . . . . . . . . . . . . . . . . . . . . . . . . . . . 1-30Invoking NightTrace. . . . . . . . . . . . . . . . . . . . . . . . . . . . . . . . . . . . . . . . . . . . . . 1-31Creating a default page. . . . . . . . . . . . . . . . . . . . . . . . . . . . . . . . . . . . . . . . . . . . 1-32Creating a default kernel page . . . . . . . . . . . . . . . . . . . . . . . . . . . . . . . . . . . . . . 1-32Searching for a kernel trace event . . . . . . . . . . . . . . . . . . . . . . . . . . . . . . . . . . . 1-33Searching for a user trace event . . . . . . . . . . . . . . . . . . . . . . . . . . . . . . . . . . . . . 1-36Zooming in . . . . . . . . . . . . . . . . . . . . . . . . . . . . . . . . . . . . . . . . . . . . . . . . . . . . . 1-38
Conclusion . . . . . . . . . . . . . . . . . . . . . . . . . . . . . . . . . . . . . . . . . . . . . . . . . . . . . . . . . 1-40
Illustrations
Figure 1-1. NEdit Editor . . . . . . . . . . . . . . . . . . . . . . . . . . . . . . . . . . . . . . . . . . . . . 1-4Figure 1-2. NightSim Scheduler . . . . . . . . . . . . . . . . . . . . . . . . . . . . . . . . . . . . . . . 1-10Figure 1-3. NightSim Edit Process . . . . . . . . . . . . . . . . . . . . . . . . . . . . . . . . . . . . . 1-12Figure 1-4. NightView Dialogue . . . . . . . . . . . . . . . . . . . . . . . . . . . . . . . . . . . . . . . 1-17Figure 1-5. NightView Principal Debug Window . . . . . . . . . . . . . . . . . . . . . . . . . . 1-18Figure 1-6. Setting a new tracepoint . . . . . . . . . . . . . . . . . . . . . . . . . . . . . . . . . . . . 1-19Figure 1-7. Setting a new monitorpoint . . . . . . . . . . . . . . . . . . . . . . . . . . . . . . . . . . 1-21Figure 1-8. NightView Monitor Window . . . . . . . . . . . . . . . . . . . . . . . . . . . . . . . . 1-22Figure 1-9. Resuming execution . . . . . . . . . . . . . . . . . . . . . . . . . . . . . . . . . . . . . . . 1-23Figure 1-10. Starting the simulation . . . . . . . . . . . . . . . . . . . . . . . . . . . . . . . . . . . . 1-24
5
PowerWorks Linux Development Environment Tutorial
Figure 1-11. Setting a new patchpoint . . . . . . . . . . . . . . . . . . . . . . . . . . . . . . . . . . . 1-25Figure 1-12. Disabling a patchpoint . . . . . . . . . . . . . . . . . . . . . . . . . . . . . . . . . . . . . 1-27Figure 1-13. Resuming execution . . . . . . . . . . . . . . . . . . . . . . . . . . . . . . . . . . . . . . 1-28Figure 1-14. Removing the scheduler . . . . . . . . . . . . . . . . . . . . . . . . . . . . . . . . . . . 1-28Figure 1-15. Removing the scheduler . . . . . . . . . . . . . . . . . . . . . . . . . . . . . . . . . . . 1-29Figure 1-16. NightTrace Main window . . . . . . . . . . . . . . . . . . . . . . . . . . . . . . . . . . 1-31Figure 1-17. NightTrace default page . . . . . . . . . . . . . . . . . . . . . . . . . . . . . . . . . . . 1-32Figure 1-18. Default Kernel Page . . . . . . . . . . . . . . . . . . . . . . . . . . . . . . . . . . . . . . . 1-33Figure 1-19. Searching for a kernel trace event . . . . . . . . . . . . . . . . . . . . . . . . . . . . 1-34Figure 1-20. First kernel trace event . . . . . . . . . . . . . . . . . . . . . . . . . . . . . . . . . . . . . 1-35Figure 1-21. NightTrace display page repositioned accordingly . . . . . . . . . . . . . . . 1-36Figure 1-22. Searching for a user trace event . . . . . . . . . . . . . . . . . . . . . . . . . . . . . 1-37Figure 1-23. NightTrace display page . . . . . . . . . . . . . . . . . . . . . . . . . . . . . . . . . . . 1-38Figure 1-24. Zoomed in kernel display page . . . . . . . . . . . . . . . . . . . . . . . . . . . . . . 1-39
6
Using Concurrent Fortran 95 with NightStar Tools
1Chapter 1Using Concurrent Fortran 95 with NightStar Tools
111
Concurrent Fortran 95 compiles Fortran source using C as its intermediate language. TheFortran source is first translated to its equivalent in C and that resultant C code is thencompiled using the Concurrent C/C++ compiler.
Because of this, certain considerations must be taken into account. In the generated Ccode, an underscore (“_”) is appended to the names of all variables and function calls.This must be taken into consideration when using any of the NightStar tools which refer-ence the variables or function names in the Fortran source.
This tutorial will demonstrate the interaction of a Fortran program with the various Night-Star tools including the NightViewTM symbolic debugger, NightTraceTM event analyzer,and NightSimTM frequency-based scheduler.
Overview 1
This is a demonstration of the Concurrent Fortran 95 compiler and its interactions withvarious NightStar tools, including:
- NEdit
- NightSim
- NightView
- NightTrace
integrating them together into one cohesive example.
Please see “Before you begin” on page 1-1 for some important recommendations and con-siderations.
Before you begin 1
For the sections of the tutorial that use the NightSim Scheduler and the NightViewSource-Level Debugger, this tutorial requires that the user have the following privileges:
• P_CPUBIAS
• P_PLOCK
• P_RTIME
1-1
Concurrent Fortran 95 Tutorial
A convenient way to associate privileges with users is through the use of roles. A role issimply a named description of a set of privileges that have been registered for certain exe-cutable files, such as the shell. The system administrator creates roles and assigns users tothem. During the login process, users can request that their shell be granted the privilegesassociated with their role. Such a request takes the form of an invocation of the tfad-min(1M) command. Once privileges have been granted to the user’s shell, subsequentlyspawned processes automatically inherit those privileges.
The following commands create a role and register all the privileges required by this tuto-rial to three commonly used shells (sh, ksh, and csh). The PowerMAX OS systemadministrator should issue the following commands once.
/usr/bin/adminrole -n NSTAR_USERS/usr/bin/adminrole -a sh:/usr/bin/sh:cpubias:plock:rtime NSTAR_USERS/usr/bin/adminrole -a ksh:/usr/bin/ksh:cpubias:plock:rtime NSTAR_USERS/usr/bin/adminrole -a csh:/usr/bin/csh:cpubias:plock:rtime NSTAR_USERS
The following command assigns an example user (JoeUser) to the NSTAR_USERS role.The system administrator should issue the following command once.
/usr/bin/adminuser -n -o NSTAR_USERS JoeUser
JoeUser is now allowed to request that the above privileges be granted to his shell (assum-ing JoeUser utilizes either the sh, ksh, or csh shell, as these are the only shell commandsregistered in the NSTAR_USERS role). However, by default, these privileges are notgranted. He must explicitly make the request by initiating a new shell with the tfad-min(1M) command. For convenience, it is recommended that the following commandbe added to the end of his .profile (or .login for csh users) file. (This file is exe-cuted during initialization of the login shell).
exec /sbin/tfadmin NSTAR_USERS: shell
where shell is the shell of your choice (sh, ksh, or csh).
Proceed to “Getting Started” on page 1-3 to begin the tutorial.
1-2
Using Concurrent Fortran 95 with NightStar Tools
Getting Started 1
We will start by creating a directory in which we will do all our work.
To create a working directory
- Use the mkdir(1) command to create a working directory.
We will name our directory tutorial using the following command:
mkdir tutorial
- Position yourself in the newly created directory using the cd(1) com-mand:
cd tutorial
1-3
Concurrent Fortran 95 Tutorial
Using NEdit 1
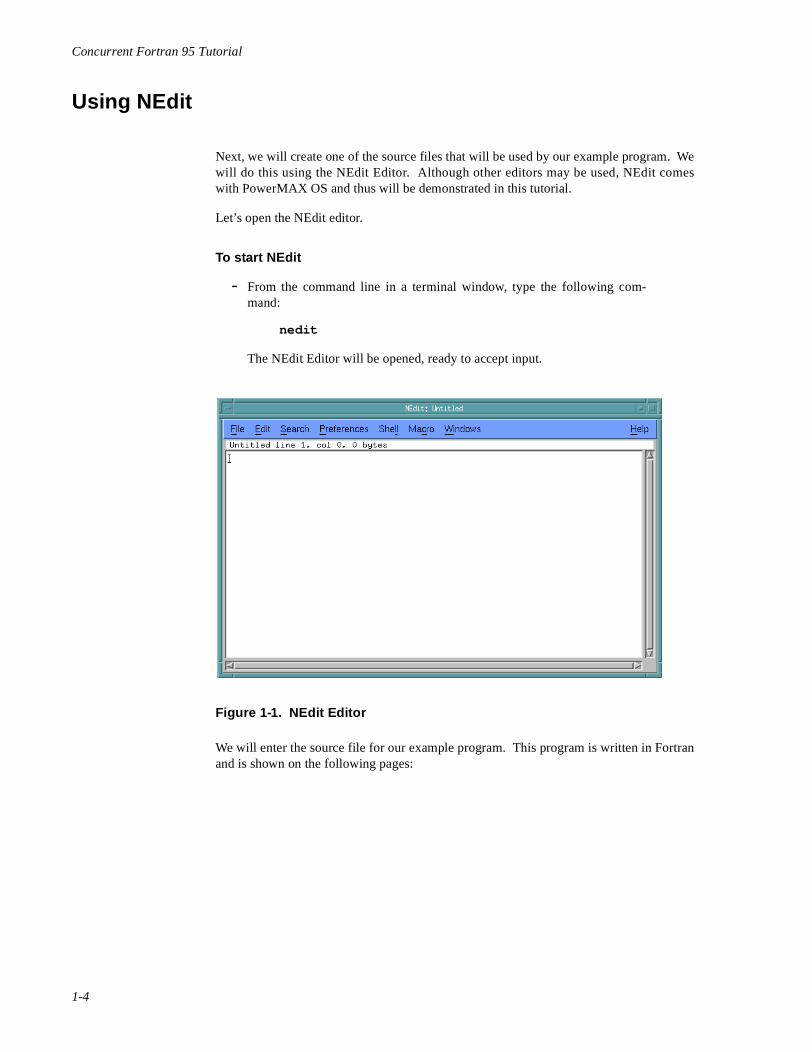
Next, we will create one of the source files that will be used by our example program. Wewill do this using the NEdit Editor. Although other editors may be used, NEdit comeswith PowerMAX OS and thus will be demonstrated in this tutorial.
Let’s open the NEdit editor.
To start NEdit
- From the command line in a terminal window, type the following com-mand:
nedit
The NEdit Editor will be opened, ready to accept input.
Figure 1-1. NEdit Editor
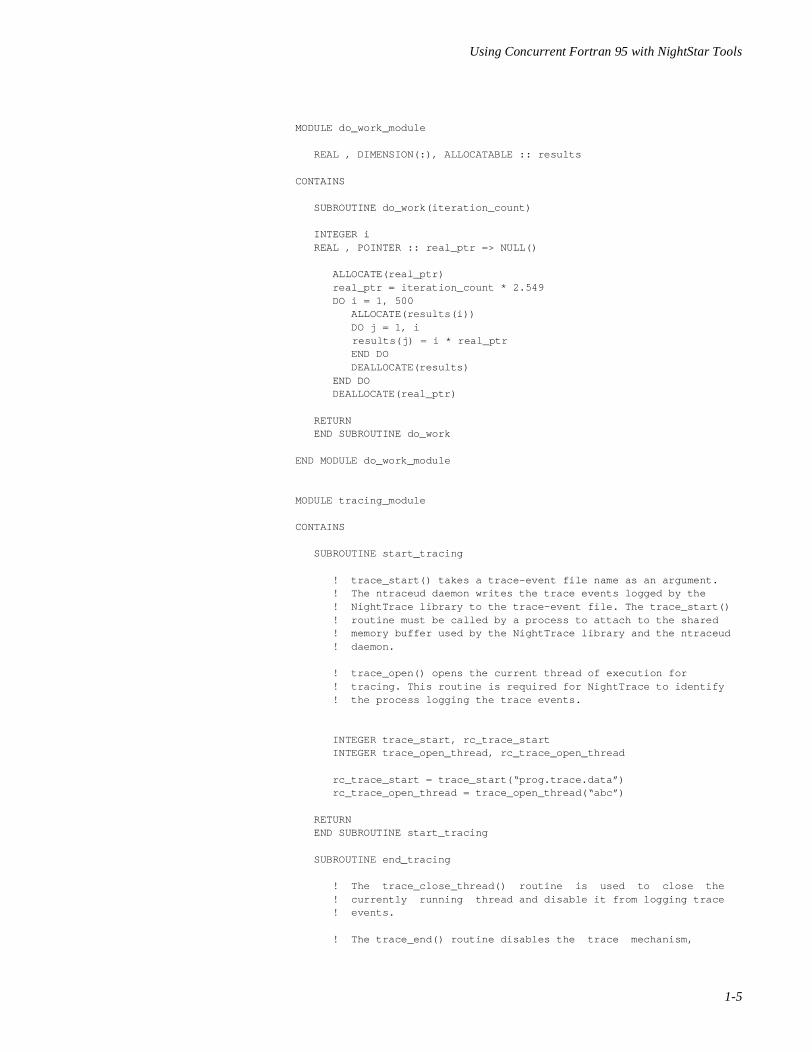
We will enter the source file for our example program. This program is written in Fortranand is shown on the following pages:
1-4
Using Concurrent Fortran 95 with NightStar Tools
MODULE do_work_module
REAL , DIMENSION(:), ALLOCATABLE :: results
CONTAINS
SUBROUTINE do_work(iteration_count)
INTEGER i REAL , POINTER :: real_ptr => NULL()
ALLOCATE(real_ptr) real_ptr = iteration_count * 2.549 DO i = 1, 500 ALLOCATE(results(i)) DO j = 1, i results(j) = i * real_ptr END DO DEALLOCATE(results) END DO DEALLOCATE(real_ptr)
RETURN END SUBROUTINE do_work
END MODULE do_work_module
MODULE tracing_module
CONTAINS
SUBROUTINE start_tracing
! trace_start() takes a trace-event file name as an argument. ! The ntraceud daemon writes the trace events logged by the ! NightTrace library to the trace-event file. The trace_start() ! routine must be called by a process to attach to the shared ! memory buffer used by the NightTrace library and the ntraceud ! daemon.
! trace_open() opens the current thread of execution for ! tracing. This routine is required for NightTrace to identify ! the process logging the trace events.
INTEGER trace_start, rc_trace_start INTEGER trace_open_thread, rc_trace_open_thread
rc_trace_start = trace_start(“prog.trace.data”) rc_trace_open_thread = trace_open_thread(“abc”)
RETURN END SUBROUTINE start_tracing
SUBROUTINE end_tracing
! The trace_close_thread() routine is used to close the ! currently running thread and disable it from logging trace ! events. ! The trace_end() routine disables the trace mechanism,
1-5
Concurrent Fortran 95 Tutorial
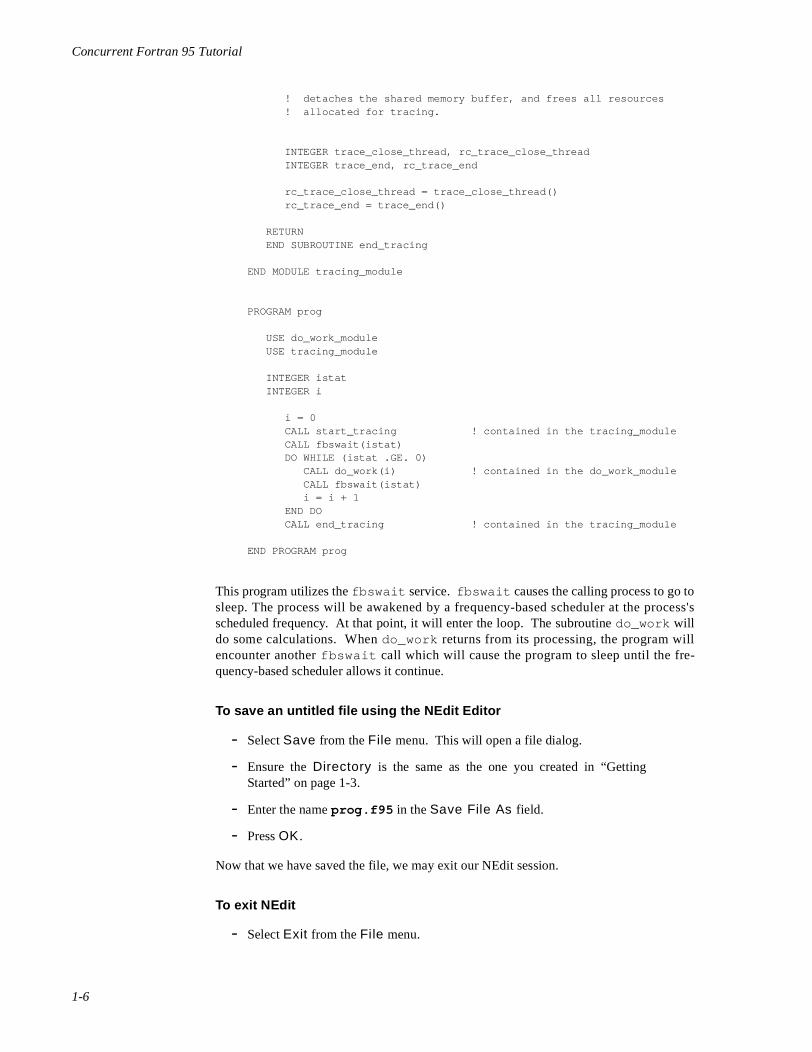
! detaches the shared memory buffer, and frees all resources ! allocated for tracing.
INTEGER trace_close_thread, rc_trace_close_thread INTEGER trace_end, rc_trace_end
rc_trace_close_thread = trace_close_thread() rc_trace_end = trace_end()
RETURN END SUBROUTINE end_tracing
END MODULE tracing_module
PROGRAM prog
USE do_work_module USE tracing_module
INTEGER istat INTEGER i
i = 0 CALL start_tracing ! contained in the tracing_module CALL fbswait(istat) DO WHILE (istat .GE. 0) CALL do_work(i) ! contained in the do_work_module CALL fbswait(istat) i = i + 1 END DO CALL end_tracing ! contained in the tracing_module
END PROGRAM prog
This program utilizes the fbswait service. fbswait causes the calling process to go tosleep. The process will be awakened by a frequency-based scheduler at the process'sscheduled frequency. At that point, it will enter the loop. The subroutine do_work willdo some calculations. When do_work returns from its processing, the program willencounter another fbswait call which will cause the program to sleep until the fre-quency-based scheduler allows it continue.
To save an untitled file using the NEdit Editor
- Select Save from the File menu. This will open a file dialog.
- Ensure the Directory is the same as the one you created in “GettingStarted” on page 1-3.
- Enter the name prog.f95 in the Save File As field.
- Press OK .
Now that we have saved the file, we may exit our NEdit session.
To exit NEdit
- Select Exit from the File menu.
1-6
Using Concurrent Fortran 95 with NightStar Tools
Using the Concurrent Fortran 95 compiler 1
Concurrent Fortran 95 utilizes the Numerical Algorithms Group’s F95 compiler and Con-current’s C/C++ compiler to produce highly optimized object code tailored to Concurrentsystems running PowerMAX OSTM.
To compile the Fortran program
- Open a terminal window and position yourself in the working directoryyou created in “Getting Started” on page 1-3.
- Execute the following command:
f95 -g -o prog prog.f95 -lntrace -lud -lF77rt
In order to debug the program using the NightView Source Level Debugger, weneed to compile the program with debug information so we specify the -g compileoption.
We specify the name of the resultant output file using the -o compile option (in thisexample, our executable will be named prog).
In order to generate trace data when we run the program and then subsequently ana-lyze it using the NightTrace Analyzer, we specify the compile options:
-lntrace -lud -lF77rt
At this point, we have a directory, tutorial, that has within it a Fortran executable,prog, and its corresponding source file, prog.f95. Full debug information will be gen-erated for the program and tracing functionality has been included so that we may gathertracing data for later analysis.
Viewing the intermediate C code 1
Concurrent Fortran 95 compiles Fortran source using C as its intermediate language. TheFortran source is first translated to its equivalent in C and that resultant C code is thencompiled using the Concurrent C/C++ compiler.
This intermediate source can be viewed by using the -S compile option to f95. Forinstance,
f95 -S prog.f95
will generate a file named prog.c which consists of the Fortran source translated to C.(References to the Fortran source appear throughout the C code.)
Because of this, certain considerations must be taken into account. In the generated Ccode, an underscore (“_”) is appended to the names of all variables and function calls.This must be taken into consideration when using any of the NightStar tools which refer-
1-7
Concurrent Fortran 95 Tutorial
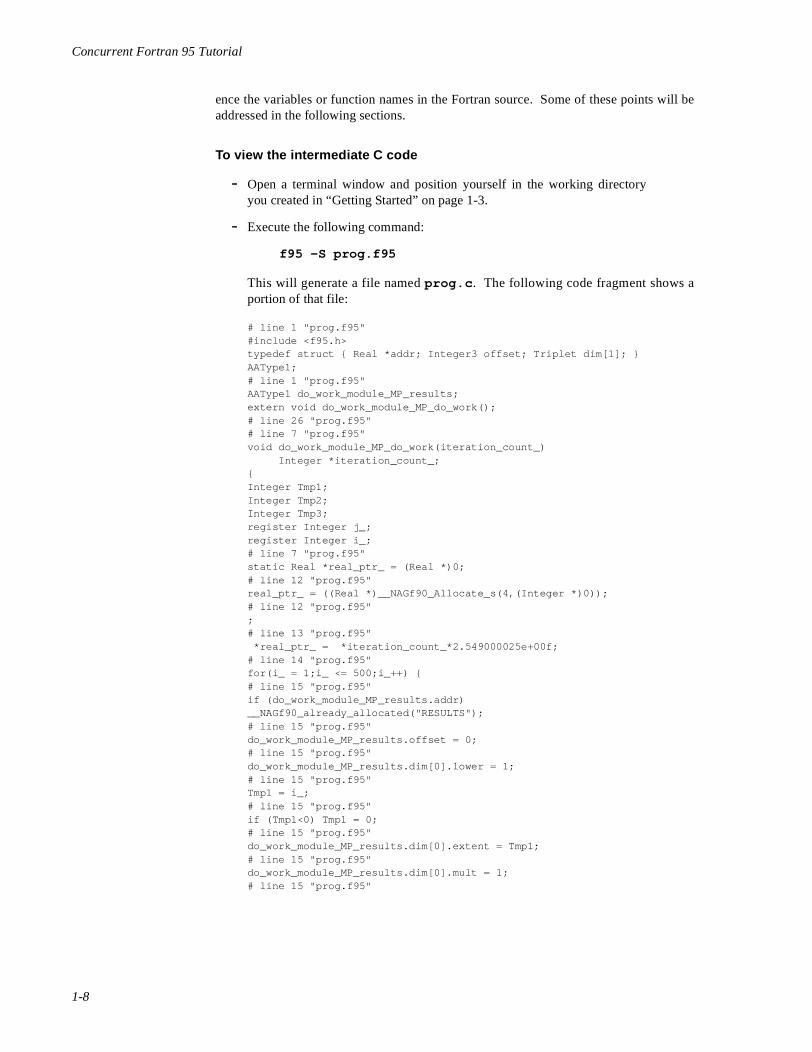
ence the variables or function names in the Fortran source. Some of these points will beaddressed in the following sections.
To view the intermediate C code
- Open a terminal window and position yourself in the working directoryyou created in “Getting Started” on page 1-3.
- Execute the following command:
f95 -S prog.f95
This will generate a file named prog.c. The following code fragment shows aportion of that file:
# line 1 "prog.f95"#include <f95.h>typedef struct { Real *addr; Integer3 offset; Triplet dim[1]; } AAType1;# line 1 "prog.f95"AAType1 do_work_module_MP_results;extern void do_work_module_MP_do_work();# line 26 "prog.f95"# line 7 "prog.f95"void do_work_module_MP_do_work(iteration_count_) Integer *iteration_count_;{Integer Tmp1;Integer Tmp2;Integer Tmp3;register Integer j_;register Integer i_;# line 7 "prog.f95"static Real *real_ptr_ = (Real *)0;# line 12 "prog.f95"real_ptr_ = ((Real *)__NAGf90_Allocate_s(4,(Integer *)0));# line 12 "prog.f95";# line 13 "prog.f95" *real_ptr_ = *iteration_count_*2.549000025e+00f;# line 14 "prog.f95"for(i_ = 1;i_ <= 500;i_++) {# line 15 "prog.f95"if (do_work_module_MP_results.addr) __NAGf90_already_allocated("RESULTS");# line 15 "prog.f95"do_work_module_MP_results.offset = 0;# line 15 "prog.f95"do_work_module_MP_results.dim[0].lower = 1;# line 15 "prog.f95"Tmp1 = i_;# line 15 "prog.f95"if (Tmp1<0) Tmp1 = 0;# line 15 "prog.f95"do_work_module_MP_results.dim[0].extent = Tmp1;# line 15 "prog.f95"do_work_module_MP_results.dim[0].mult = 1;# line 15 "prog.f95"
1-8
Using Concurrent Fortran 95 with NightStar Tools
Using NightSim 1
NightSim is a tool for scheduling and monitoring real-time applications which require pre-dictable, repetitive process execution. NightSim provides a graphical interface to thePowerMAX OS frequency-based scheduler and performance monitor. With NightSim,application builders can control and dynamically adjust the periodic execution of multiplecoordinated processes, their priorities, and their CPU assignments. NightSim’s perfor-mance monitor tracks the CPU utilization of individual processes and provides a customi-zable display of period times, minimums, maximums, and frame overruns. For moreinformation on NightSim, refer to the NightSim User’s Guide (0890480).
Invoking NightSim 1
Because our program uses the frequency-based scheduler, we will use the NightSimScheduler to schedule the process.
To invoke the NightSim Scheduler
- From the command line, type the following command:
nsim &
The NightSim Scheduler will be opened, ready to be configured.
NOTE
We specify the & so that the NightSim session runs in the back-ground.
Configuring the Scheduler 1
The NightSim Scheduler window is opened, ready for us to configure it for our particularsimulation.
1-9

Concurrent Fortran 95 Tutorial
Figure 1-2. NightSim Scheduler
To configure a NightSim Scheduler
- Specify a Scheduler key. The key is a user-chosen numeric identifierwith which the scheduler will be associated. For our example, we will use100 .
- Specify the Cycles per frame. This field allows you to specify the num-ber of cycles that compose a frame on the specified scheduler. We will usethe value 1.
- Specify the Max. tasks per cycle. This field allows you to specify themaximum number of processes that can be scheduled to execute during onecycle. Enter 10 for our example.
- Specify the Max. tasks in scheduler. This field allows you to specifythe maximum number of processes that can be scheduled on the specifiedscheduler at one time. For our example, we will specify the value 10 .
- Enter the name of a PowerMAX OS system which will act as the Timinghost for the simulation. You may use the drop down list associated withthis field for the names of systems previously used as timing hosts. For ourexample, we will enter amber2, a Turbo Hawk system.
NOTE
When NightSim is operating in On-Line mode, an attempt willbe made to communicate with the system specified as the timinghost. The user may experience a slight delay and the messageTalking to Server... will appear in the Configuration FileName Area of the NightSim Scheduler as this occurs. See theNightSim User’s Guide (0890480) for more information.
1-10

Using Concurrent Fortran 95 with NightStar Tools
- Select a Timing source from the list provided. This list contains the setof devices available on the timing host. We will use Real-time clock0c2.
NOTE
Do not use Real-time clock 0c0 for the Timing source as itis typically used by system utilities and could cause unwantedeffects if used. See hrtconfig(1) for more information
Since we are using the real-time clock on the target system, we need to specify the clockperiod. For our simulation, we would like the real-time clock to “fire” every .5 seconds(or 500 milliseconds).
IMPORTANT
The following steps should be performed in the order presentedbelow to ensure the correct value for the clock period.
- Choose the msec from the drop-down list next to the Clock period field.
- Specify Clock period . For our example, we will specify 500 for thenumber of milliseconds.
1-11
Concurrent Fortran 95 Tutorial
Scheduling a process 1
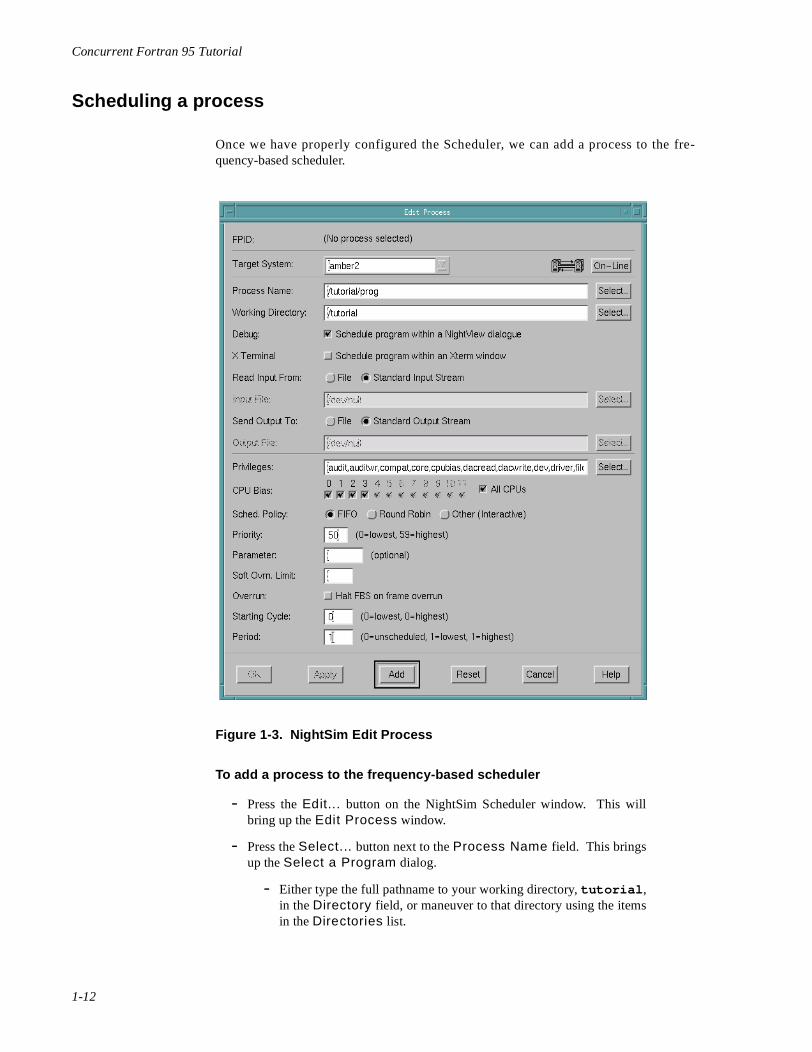
Once we have properly configured the Scheduler, we can add a process to the fre-quency-based scheduler.
Figure 1-3. NightSim Edit Process
To add a process to the frequency-based scheduler
- Press the Edit... button on the NightSim Scheduler window. This willbring up the Edit Process window.
- Press the Select... button next to the Process Name field. This bringsup the Select a Program dialog.
- Either type the full pathname to your working directory, tutorial,in the Directory field, or maneuver to that directory using the itemsin the Directories list.
1-12

Using Concurrent Fortran 95 with NightStar Tools
- Choose the program we wish to schedule from the Files list. For ourexample, we will select prog from the list.
- Press OK to select the program.
- Ensure that the Working Directory is the same directory that containsour program (the directory of the Process Name selected in the previousstep).
- Check the Schedule program within a NightView dialogue check-box. This will bring the program up in the NightView debugger before theprogram executes, allowing us to set tracepoints so that we may generatetrace data when the program executes.
- Specify the Priority for this process. The range of priority values that youcan enter is governed by the scheduling policy specified. NightSim dis-plays the range of priority values that you can enter next to the Priorityfield. Higher numerical values correspond to more favorable schedulingpriorities. For our example, we will give the process a priority of 50.
- Select Starting Cycle. This field allows you to specify the first minorcycle in which the specified program is to be wakened in each major frame.We will choose the lowest value, 0, for our example.
- Select Period. This field allows you to establish the frequency withwhich the specified program is to be wakened in each major frame. Enterthe number of minor cycles representing the frequency with which youwish the program to be wakened. For our example, we will specify aperiod of 1 , indicating that the specified program is to be wakened everyminor cycle.
- Press Add to add the process to the frequency-based scheduler.
- Press the Close button to dismiss the Edit Process window.
Activating user tracing and kernel tracing 1
At this point in the tutorial, we are about to create the scheduler configured according tothe parameters we just specified and allow the program to run. However, we would like togenerate trace data from this program while it is running so we need to start the Night-Trace user daemon to log user trace events as well as KernelTrace which will collect dataabout the execution time of interrupts, exceptions, system calls, context switches, and I/Oto various devices.
To activate the NightTrace user daemon
- Open a terminal window and position yourself in the working directoryyou created in “Getting Started” on page 1-3.
1-13
Concurrent Fortran 95 Tutorial
IMPORTANT
It is essential that you are positioned in the working directory thatis associated with the user program being scheduled withNightSim. The NightTrace user daemon will communicate withthe user program based on the file argument supplied in the nextstep.
- Invoke the NightTrace user daemon. We issue the ntraceud commandwhich takes as an argument the name of a file in which to save the tracedata. This file should be named program_name.trace.data, whereprogram_name is the name of the program generating the trace data.
NOTE
By default, ntraceud requires write access to system SPLdevices, e.g. /dev/spl, /dev/spl1, etc. On most systems,these devices are only writeable by the root user; therefore, youshould run the ntraceud command as root.
However, since the use of SPL devices is not strictly necessary fortracing single-threaded user applications (although, for optimalreal-time performance it is recommended), the -ipldisableoption to ntraceud is acceptable.
Since the application in this tutorial is single-threaded, you mayuse the -ipldisable option as indicated below.
For our example, we will issue the following command:
ntraceud -ipldisable prog.trace.data
Now we can activate kernel tracing.
To activate kernel tracing
- Open a terminal window and position yourself in the working directoryyou created in “Getting Started” on page 1-3.
- Invoke the KernelTrace utility. We issue the ktrace command which cantake a number of arguments.
NOTE
The KernelTrace utility requires root access in order to run.
1-14
Using Concurrent Fortran 95 with NightStar Tools
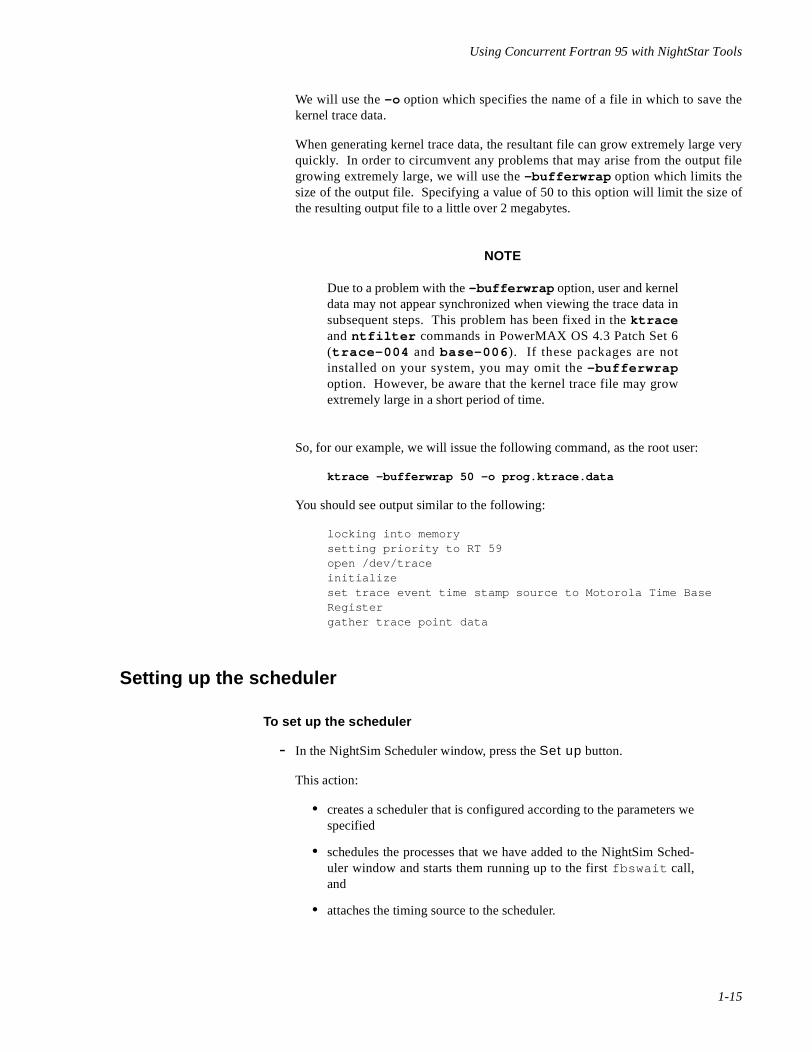
We will use the -o option which specifies the name of a file in which to save thekernel trace data.
When generating kernel trace data, the resultant file can grow extremely large veryquickly. In order to circumvent any problems that may arise from the output filegrowing extremely large, we will use the -bufferwrap option which limits thesize of the output file. Specifying a value of 50 to this option will limit the size ofthe resulting output file to a little over 2 megabytes.
NOTE
Due to a problem with the -bufferwrap option, user and kerneldata may not appear synchronized when viewing the trace data insubsequent steps. This problem has been fixed in the ktraceand ntfilter commands in PowerMAX OS 4.3 Patch Set 6(trace-004 and base-006). If these packages are notinstalled on your system, you may omit the -bufferwrapoption. However, be aware that the kernel trace file may growextremely large in a short period of time.
So, for our example, we will issue the following command, as the root user:
ktrace -bufferwrap 50 -o prog.ktrace.data
You should see output similar to the following:
locking into memorysetting priority to RT 59open /dev/traceinitializeset trace event time stamp source to Motorola Time Base Registergather trace point data
Setting up the scheduler 1
To set up the scheduler
- In the NightSim Scheduler window, press the Set up button.
This action:
• creates a scheduler that is configured according to the parameters wespecified
• schedules the processes that we have added to the NightSim Sched-uler window and starts them running up to the first fbswait call,and
• attaches the timing source to the scheduler.
1-15

Concurrent Fortran 95 Tutorial
Because we have specified the Schedule program within a NightView dialogueoption when we added this process to the frequency-based scheduler (see “To add a pro-cess to the frequency-based scheduler” on page 1-12), the NightView Source LevelDebugger will be started.
1-16

Using Concurrent Fortran 95 with NightStar Tools
Using NightView 1
NightView is a graphical source-level debugging and monitoring tool specificallydesigned for real-time applications. NightView can monitor, debug, and patch multiplereal-time processes running on multiple processors with minimal intrusion. In addition tostandard debugging capabilities, NightView supports application-speed eventpoint condi-tions, hot patches, synchronized data monitoring, exception handling and loadable mod-ules.
Because we have specified the Schedule program within a NightView dialogueoption when we added this process to the frequency-based scheduler (see “To add a pro-cess to the frequency-based scheduler” on page 1-12), we are presented with a NightViewDialogue Window as well as a Principal Debug Window with the execution of the pro-gram stopped.
Figure 1-4. NightView Dialogue
During initialization, you will see a message similar to the following:
Warning: Process local:11749 is no longer debuggable, detaching.[E-SlashProcMethod-012] (errno=13) Permission denied
This is an anomaly caused by an intermediate process which schedules the user program.You may ignore this warning.
1-17
Concurrent Fortran 95 Tutorial
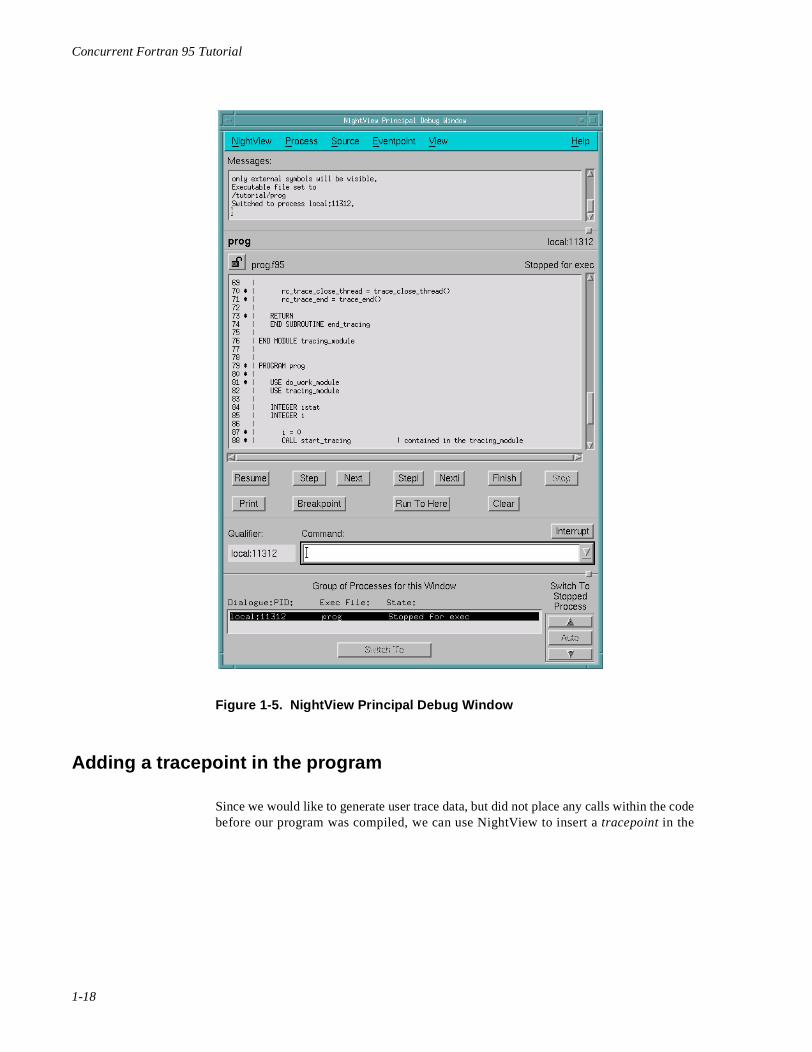
Figure 1-5. NightView Principal Debug Window
Adding a tracepoint in the program 1
Since we would like to generate user trace data, but did not place any calls within the codebefore our program was compiled, we can use NightView to insert a tracepoint in the
1-18
Using Concurrent Fortran 95 with NightStar Tools
code. A tracepoint is a call to one of the ntrace(3X) library routines for recording thetime when execution reached the tracepoint.
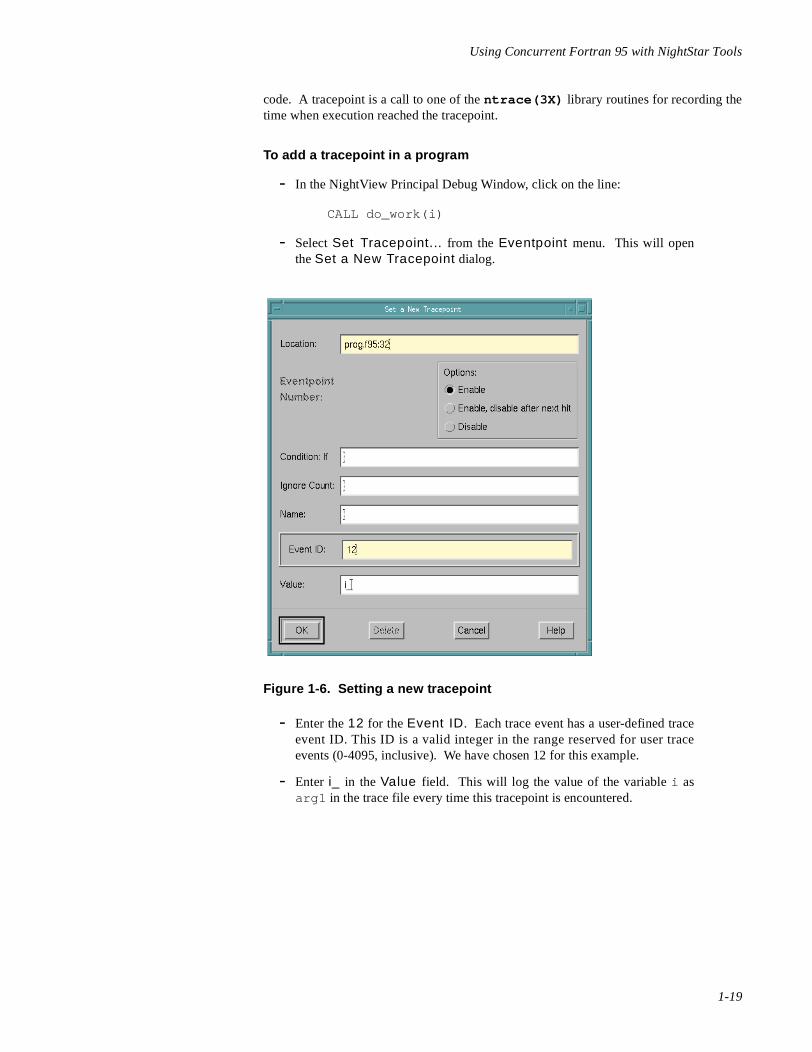
To add a tracepoint in a program
- In the NightView Principal Debug Window, click on the line:
CALL do_work(i)
- Select Set Tracepoint... from the Eventpoint menu. This will openthe Set a New Tracepoint dialog.
Figure 1-6. Setting a new tracepoint
- Enter the 12 for the Event ID. Each trace event has a user-defined traceevent ID. This ID is a valid integer in the range reserved for user traceevents (0-4095, inclusive). We have chosen 12 for this example.
- Enter i_ in the Value field. This will log the value of the variable i asarg1 in the trace file every time this tracepoint is encountered.
1-19

Concurrent Fortran 95 Tutorial
IMPORTANT
Note the underscore appended to the name of the Fortran variablei. When debugging a Concurrent Fortran 95 program, the Fortransource (not the generated C code) will appear in the NightViewSource-Level Debugger. However, NightView uses the generatedC code as its underlying source for debugging. As such, an under-score ("_") must be appended to variables or function names thatare referenced. See “Viewing the intermediate C code” on page1-7 for more information.
- Press OK .
NOTE
You may have also entered the following command in theCommand field of the NightView Principal Debug Window:
tracepoint 12 at line_number value=i_
where line_number coincides with the line:
CALL do_work(i)
See tracepoint for details on the use of this command.
Inserting a monitorpoint 1
NightView allows the use of monitorpoints while debugging a process. Monitorpointsallow you to monitor the value of one or more variables without interrupting the executionof your program.
In our example, we will insert a monitorpoint in the do_work subroutine contained in thedo_work_module.
To insert a monitorpoint in a program
- In the NightView Principal Debug Window, click on the line:
real_ptr = iteration_count * 2.549
which appears in the do_work subroutine in the do_work_module.
- Select Set Monitorpoint... from the Eventpoint menu. This will openthe Set a New Monitorpoint dialog.
1-20
Using Concurrent Fortran 95 with NightStar Tools
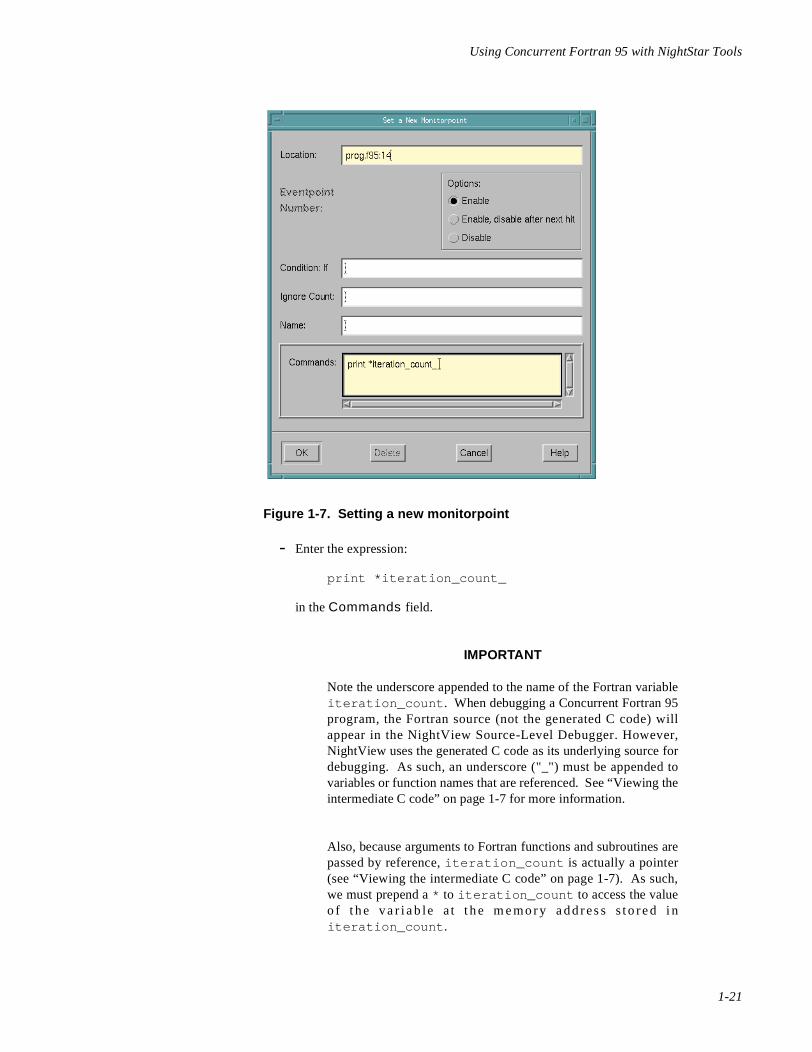
Figure 1-7. Setting a new monitorpoint
- Enter the expression:
print *iteration_count_
in the Commands field.
IMPORTANT
Note the underscore appended to the name of the Fortran variableiteration_count. When debugging a Concurrent Fortran 95program, the Fortran source (not the generated C code) willappear in the NightView Source-Level Debugger. However,NightView uses the generated C code as its underlying source fordebugging. As such, an underscore ("_") must be appended tovariables or function names that are referenced. See “Viewing theintermediate C code” on page 1-7 for more information.
Also, because arguments to Fortran functions and subroutines arepassed by reference, iteration_count is actually a pointer(see “Viewing the intermediate C code” on page 1-7). As such,we must prepend a * to iteration_count to access the valueo f t h e v a r i a b le a t t h e m e mo r y a d d r es s s t o r e d i niteration_count.
1-21
Concurrent Fortran 95 Tutorial
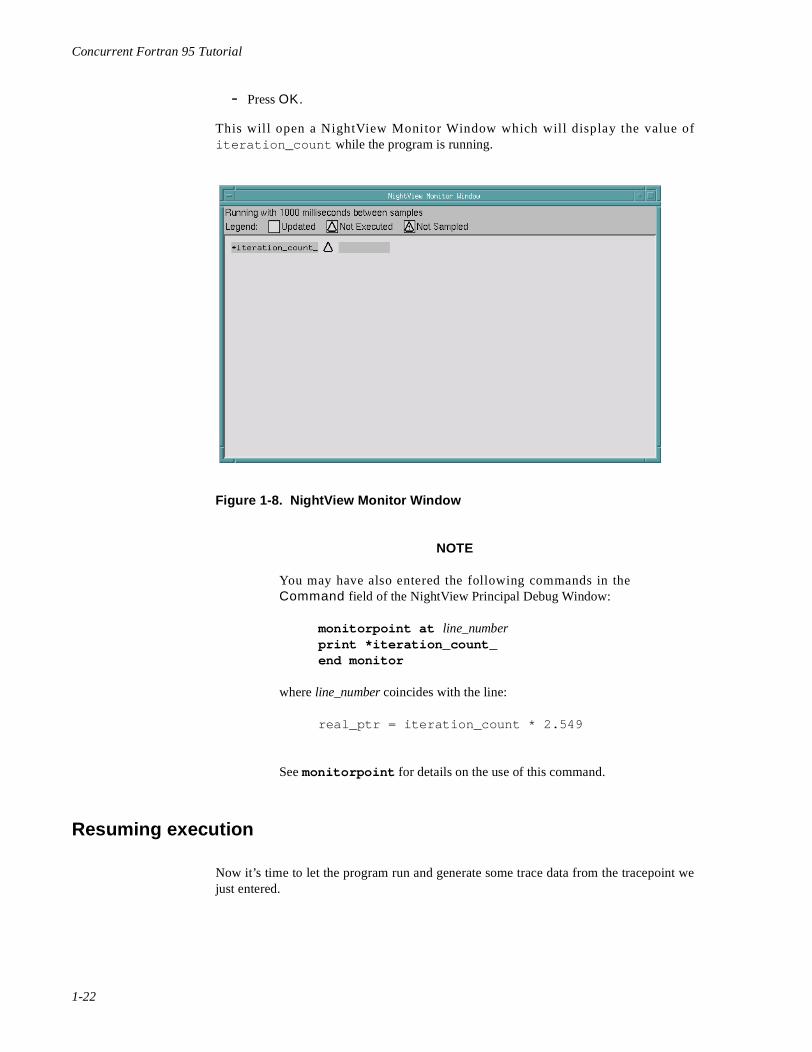
- Press OK .
This will open a NightView Monitor Window which will display the value ofiteration_count while the program is running.
Figure 1-8. NightView Monitor Window
NOTE
You may have also entered the following commands in theCommand field of the NightView Principal Debug Window:
monitorpoint at line_number print *iteration_count_ end monitor
where line_number coincides with the line:
real_ptr = iteration_count * 2.549
See monitorpoint for details on the use of this command.
Resuming execution 1
Now it’s time to let the program run and generate some trace data from the tracepoint wejust entered.
1-22

Using Concurrent Fortran 95 with NightStar Tools
To resume execution in NightView
- Press the Resume button in the NightView Principal Debug Window.
Figure 1-9. Resuming execution
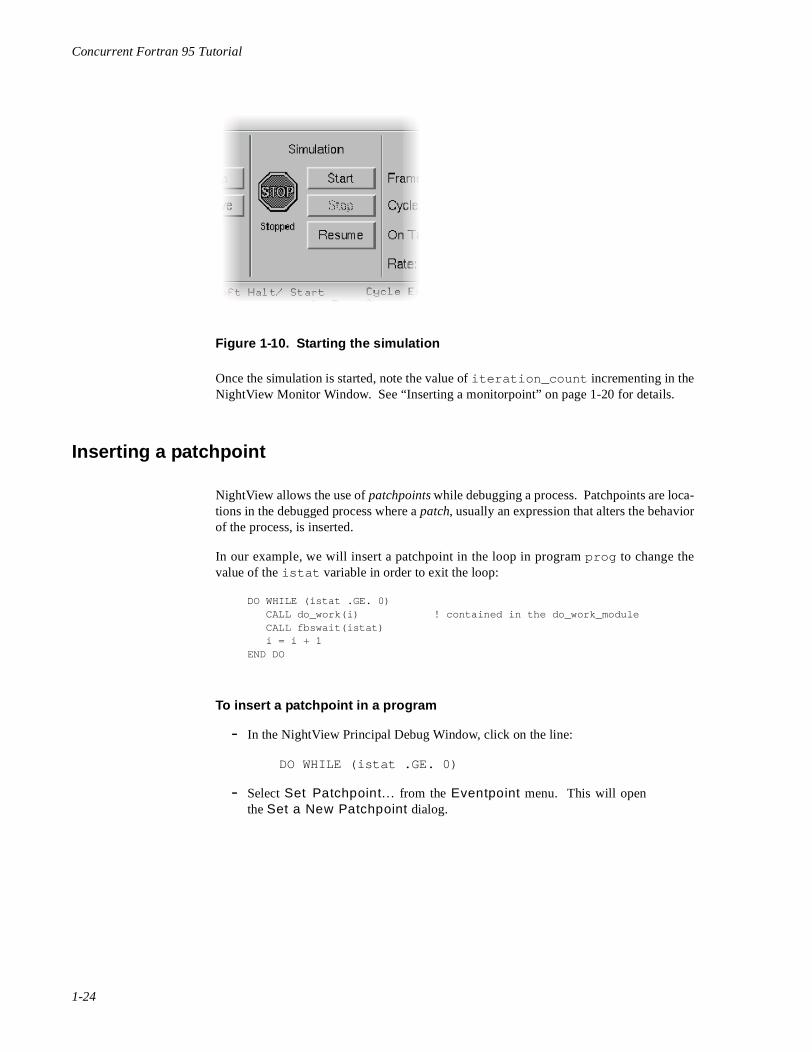
Starting the simulation 1
Now we need to go back to our NightSim Scheduler window and start the simulation.When you click on the Start button, NightSim carries out the following actions:
• Attaches the timing source to the scheduler if not already attached or if thetiming source has been changed
• If a real-time clock is being used as the timing source, sets the clock periodin accordance with the value entered in the Clock period field in theScheduler Configuration Area
• Starts the simulation with the values of the minor cycle, major frame, andoverrun counts set to zero
To start a simulation in NightSim
- Press the Start button on the NightSim Scheduler window.
1-23
Concurrent Fortran 95 Tutorial
Figure 1-10. Starting the simulation
Once the simulation is started, note the value of iteration_count incrementing in theNightView Monitor Window. See “Inserting a monitorpoint” on page 1-20 for details.
Inserting a patchpoint 1
NightView allows the use of patchpoints while debugging a process. Patchpoints are loca-tions in the debugged process where a patch, usually an expression that alters the behaviorof the process, is inserted.
In our example, we will insert a patchpoint in the loop in program prog to change thevalue of the istat variable in order to exit the loop:
DO WHILE (istat .GE. 0) CALL do_work(i) ! contained in the do_work_module CALL fbswait(istat) i = i + 1END DO
To insert a patchpoint in a program
- In the NightView Principal Debug Window, click on the line:
DO WHILE (istat .GE. 0)
- Select Set Patchpoint... from the Eventpoint menu. This will openthe Set a New Patchpoint dialog.
1-24
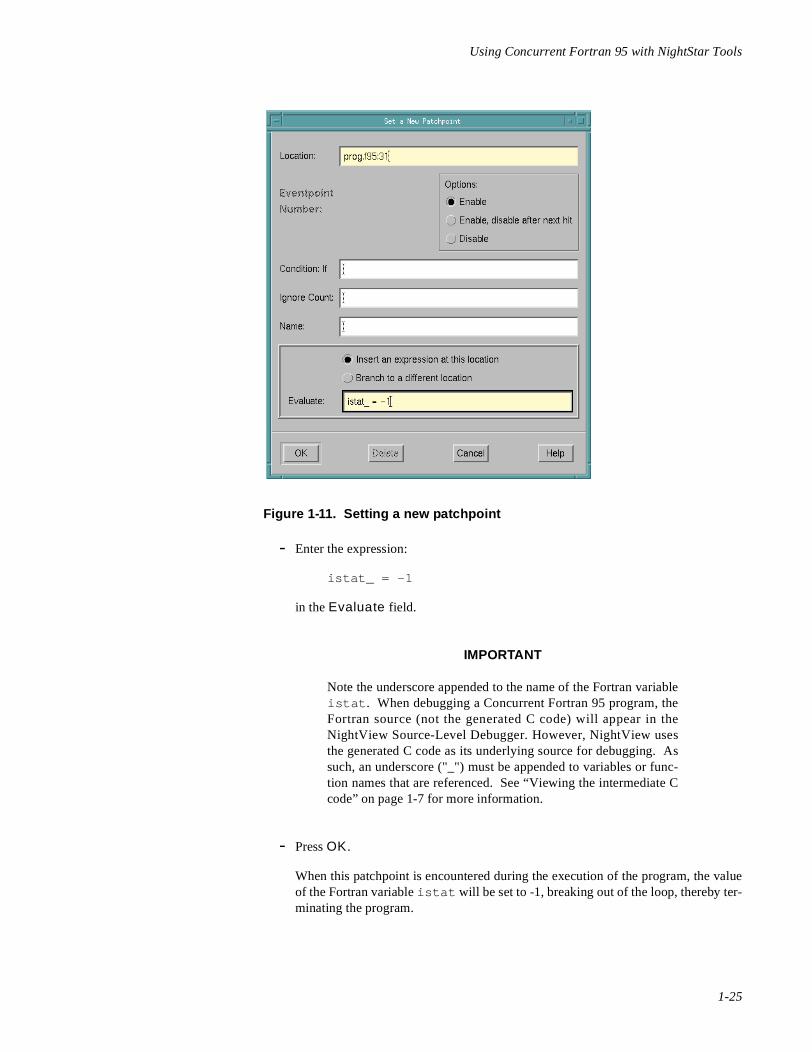
Using Concurrent Fortran 95 with NightStar Tools
Figure 1-11. Setting a new patchpoint
- Enter the expression:
istat_ = -1
in the Evaluate field.
IMPORTANT
Note the underscore appended to the name of the Fortran variableistat. When debugging a Concurrent Fortran 95 program, theFortran source (not the generated C code) will appear in theNightView Source-Level Debugger. However, NightView usesthe generated C code as its underlying source for debugging. Assuch, an underscore ("_") must be appended to variables or func-tion names that are referenced. See “Viewing the intermediate Ccode” on page 1-7 for more information.
- Press OK .
When this patchpoint is encountered during the execution of the program, the valueof the Fortran variable istat will be set to -1, breaking out of the loop, thereby ter-minating the program.
1-25
Concurrent Fortran 95 Tutorial
NOTE
You may have also entered the following command in theCommand field of the NightView Principal Debug Window:
patchpoint at line_number eval istat_ = -1
where line_number coincides with the line:
DO WHILE (istat .GE. 0)
See patchpoint for details on the use of this command.
Halting user tracing and kernel tracing 1
Now that our program has finished, we can exit the KernelTrace utility and stop the Night-Trace user daemon.
To halt kernel tracing
- In the terminal window where you invoked the KernelTrace utility (see “Toactivate kernel tracing” on page 1-14), press Ctrl-C .
You should see the message:
terminating
To halt the NightTrace user daemon
- In the terminal window where you invoked the NightTrace user daemon(see “To activate the NightTrace user daemon” on page 1-13), enter the fol-lowing command:
ntraceud -quit program_name.trace.data
where program_name is the name of the program generating the trace data. So, forour example, we will issue the following command:
ntraceud -quit prog.trace.data
Disabling the patchpoint 1
Before we exit NightView, we should disable the patchpoint that we set in “Inserting apatchpoint” on page 1-24. NightView retains knowledge of all eventpoints for a particularprogram in a current session and will reinitialize them if that program is re-run. If not dis-abled, the patchpoint in our program will be encountered immediately if our program isre-run under the current session of NightView, causing us to exit the loop and terminatethe program.
1-26
Using Concurrent Fortran 95 with NightStar Tools
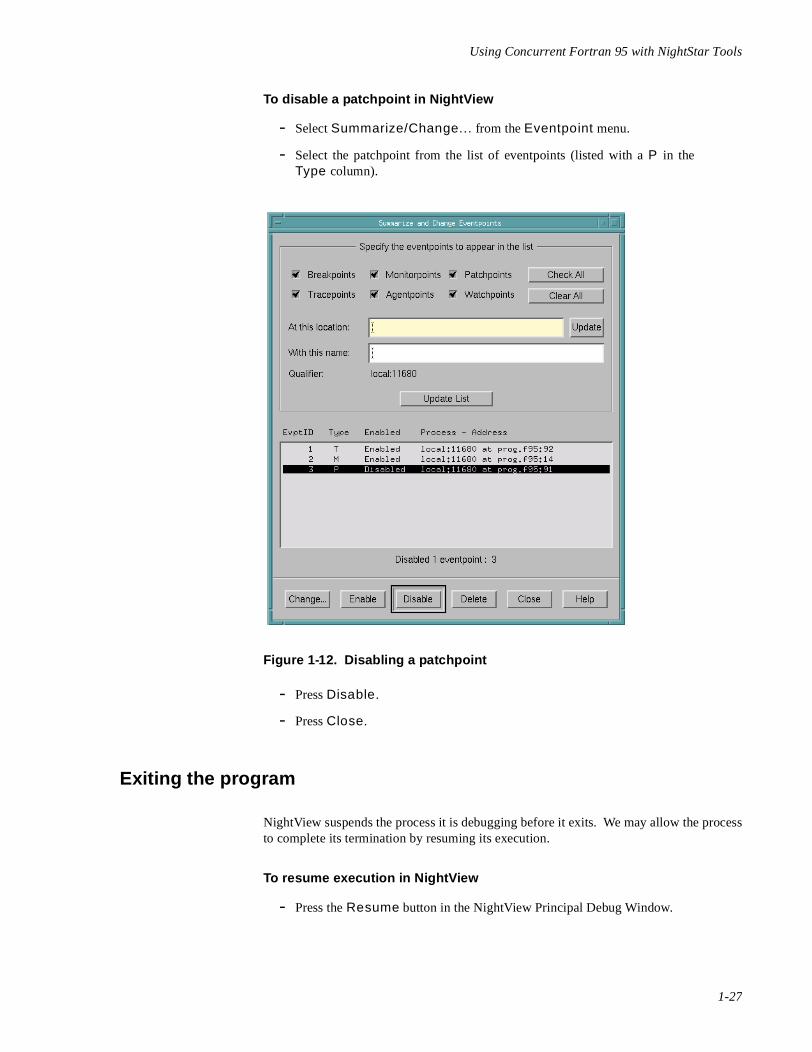
To disable a patchpoint in NightView
- Select Summarize/Change... from the Eventpoint menu.
- Select the patchpoint from the list of eventpoints (listed with a P in theType column).
Figure 1-12. Disabling a patchpoint
- Press Disable .
- Press Close.
Exiting the program 1
NightView suspends the process it is debugging before it exits. We may allow the processto complete its termination by resuming its execution.
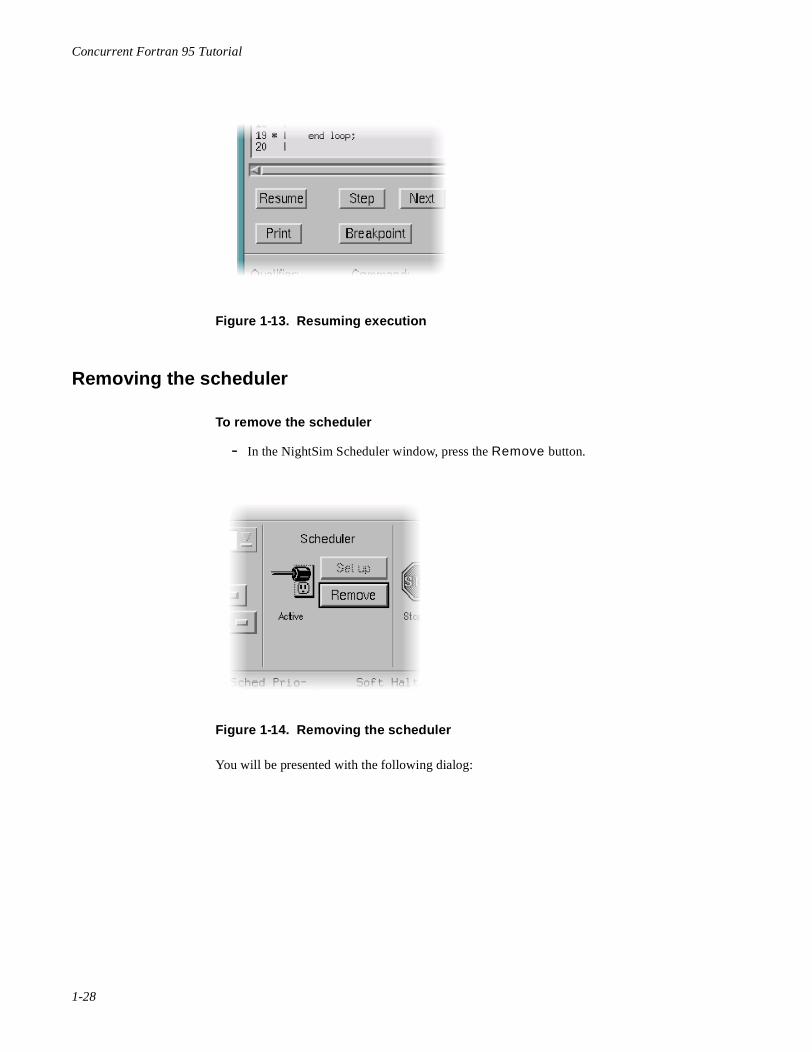
To resume execution in NightView
- Press the Resume button in the NightView Principal Debug Window.
1-27
Concurrent Fortran 95 Tutorial
Figure 1-13. Resuming execution
Removing the scheduler 1
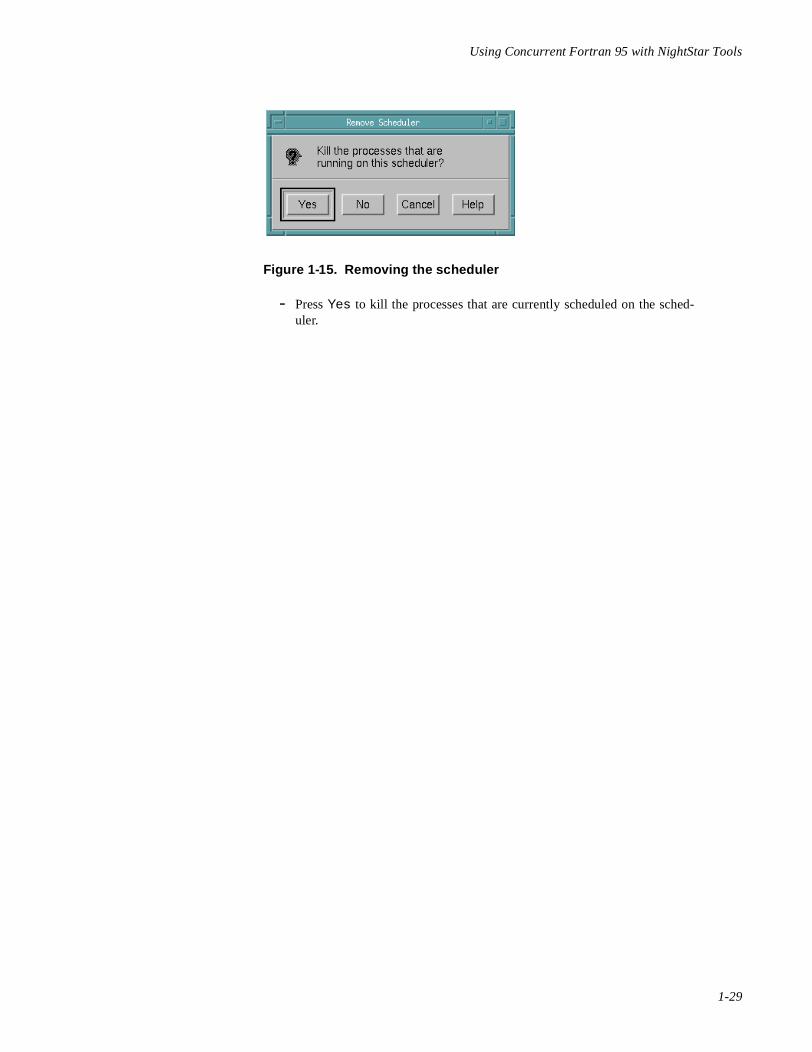
To remove the scheduler
- In the NightSim Scheduler window, press the Remove button.
Figure 1-14. Removing the scheduler
You will be presented with the following dialog:
1-28
Using Concurrent Fortran 95 with NightStar Tools
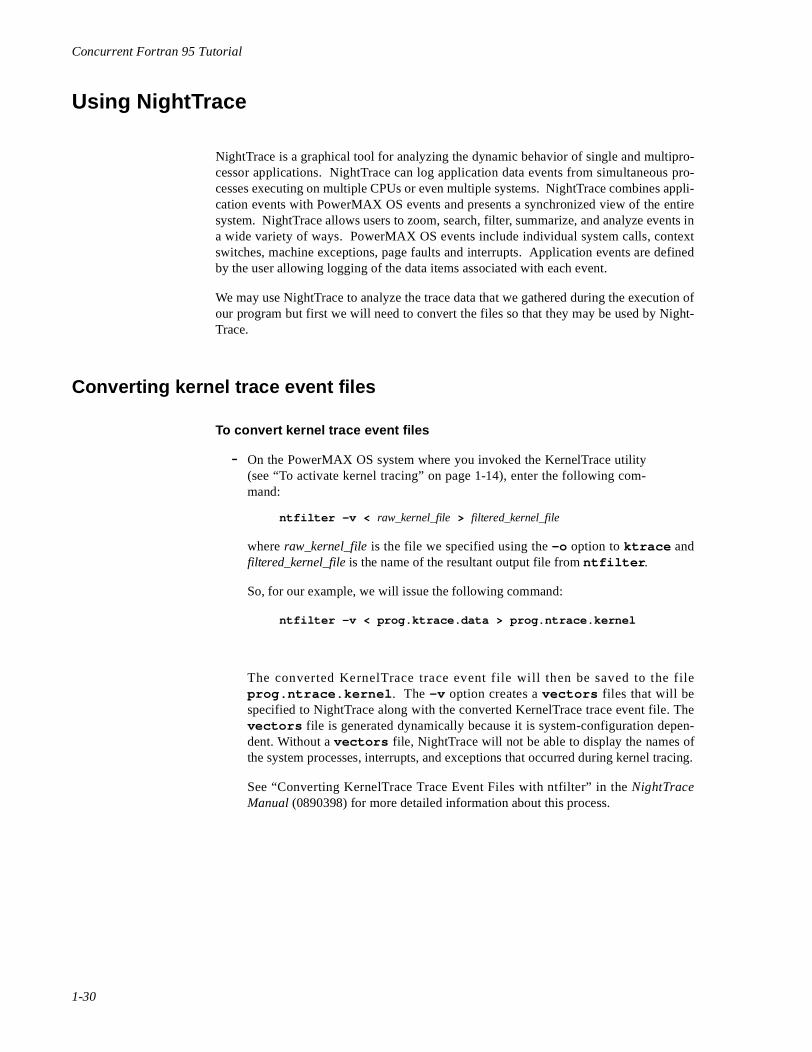
Figure 1-15. Removing the scheduler
- Press Yes to kill the processes that are currently scheduled on the sched-uler.
1-29
Concurrent Fortran 95 Tutorial
Using NightTrace 1
NightTrace is a graphical tool for analyzing the dynamic behavior of single and multipro-cessor applications. NightTrace can log application data events from simultaneous pro-cesses executing on multiple CPUs or even multiple systems. NightTrace combines appli-cation events with PowerMAX OS events and presents a synchronized view of the entiresystem. NightTrace allows users to zoom, search, filter, summarize, and analyze events ina wide variety of ways. PowerMAX OS events include individual system calls, contextswitches, machine exceptions, page faults and interrupts. Application events are definedby the user allowing logging of the data items associated with each event.
We may use NightTrace to analyze the trace data that we gathered during the execution ofour program but first we will need to convert the files so that they may be used by Night-Trace.
Converting kernel trace event files 1
To convert kernel trace event files
- On the PowerMAX OS system where you invoked the KernelTrace utility(see “To activate kernel tracing” on page 1-14), enter the following com-mand:
ntfilter -v < raw_kernel_file > filtered_kernel_file
where raw_kernel_file is the file we specified using the -o option to ktrace andfiltered_kernel_file is the name of the resultant output file from ntfilter.
So, for our example, we will issue the following command:
ntfilter -v < prog.ktrace.data > prog.ntrace.kernel
The converted KernelTrace trace event file will then be saved to the fileprog.ntrace.kernel. The -v option creates a vectors files that will bespecified to NightTrace along with the converted KernelTrace trace event file. Thevectors file is generated dynamically because it is system-configuration depen-dent. Without a vectors file, NightTrace will not be able to display the names ofthe system processes, interrupts, and exceptions that occurred during kernel tracing.
See “Converting KernelTrace Trace Event Files with ntfilter” in the NightTraceManual (0890398) for more detailed information about this process.
1-30
Using Concurrent Fortran 95 with NightStar Tools
Invoking NightTrace 1
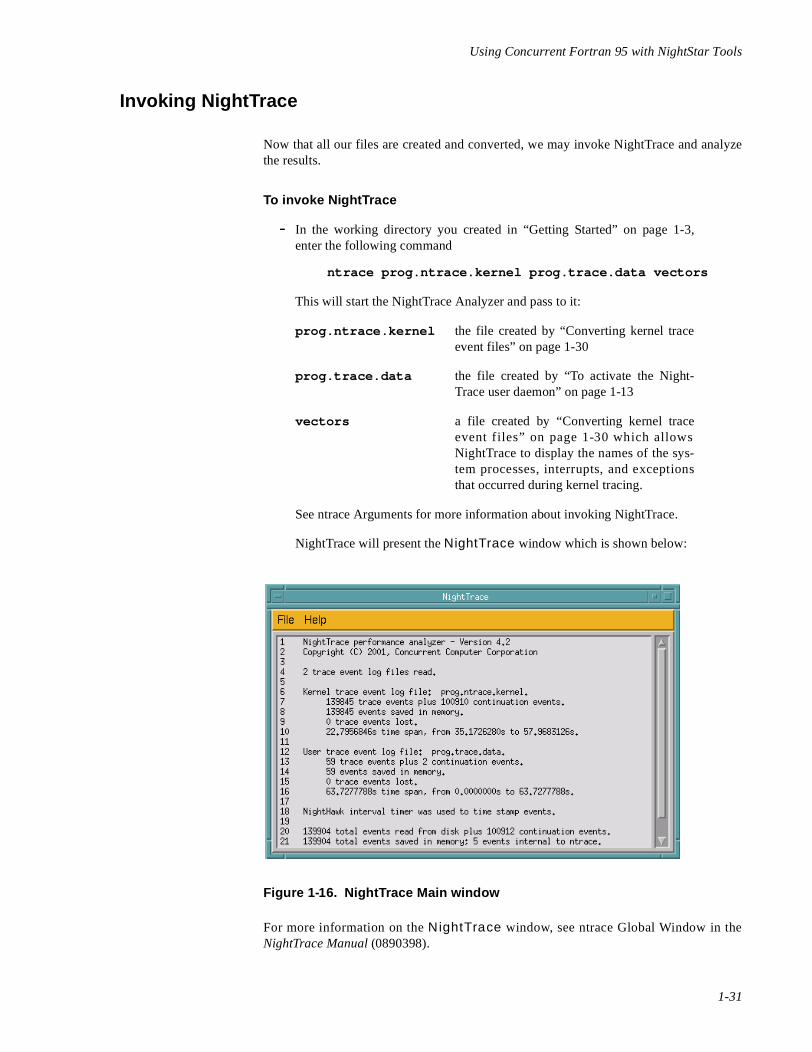
Now that all our files are created and converted, we may invoke NightTrace and analyzethe results.
To invoke NightTrace
- In the working directory you created in “Getting Started” on page 1-3,enter the following command
ntrace prog.ntrace.kernel prog.trace.data vectors
This will start the NightTrace Analyzer and pass to it:
prog.ntrace.kernel the file created by “Converting kernel traceevent files” on page 1-30
prog.trace.data the file created by “To activate the Night-Trace user daemon” on page 1-13
vectors a file created by “Converting kernel traceevent files” on page 1-30 which allowsNightTrace to display the names of the sys-tem processes, interrupts, and exceptionsthat occurred during kernel tracing.
See ntrace Arguments for more information about invoking NightTrace.
NightTrace will present the NightTrace window which is shown below:
Figure 1-16. NightTrace Main window
For more information on the NightTrace window, see ntrace Global Window in theNightTrace Manual (0890398).
1-31
Concurrent Fortran 95 Tutorial
Creating a default page 1
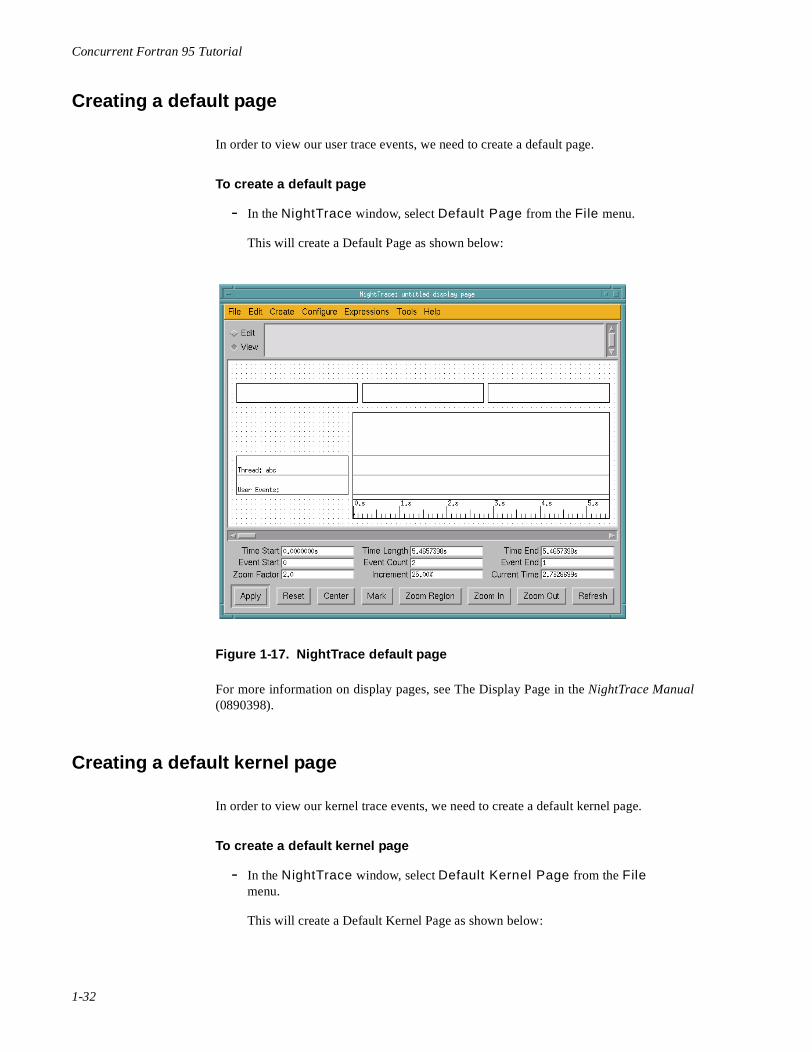
In order to view our user trace events, we need to create a default page.
To create a default page
- In the NightTrace window, select Default Page from the File menu.
This will create a Default Page as shown below:
Figure 1-17. NightTrace default page
For more information on display pages, see The Display Page in the NightTrace Manual(0890398).
Creating a default kernel page 1
In order to view our kernel trace events, we need to create a default kernel page.
To create a default kernel page
- In the NightTrace window, select Default Kernel Page from the Filemenu.
This will create a Default Kernel Page as shown below:
1-32

Using Concurrent Fortran 95 with NightStar Tools
Figure 1-18. Default Kernel Page
For more information on the Default Kernel Page, see Kernel Display Pages in the Night-Trace Manual (0890398).
Searching for a kernel trace event 1
Now that we have loaded our data into NightTrace and created the appropriate displaypages, we can search for the system call that corresponds to the fbswait call made in ourprogram (see “Using NEdit” on page 1-4).
To search for a kernel trace event
- Select Search... from the Tools menu of the kernel display page (see“Creating a default kernel page” on page 1-32).
You will be presented with the following dialog:
1-33
Concurrent Fortran 95 Tutorial
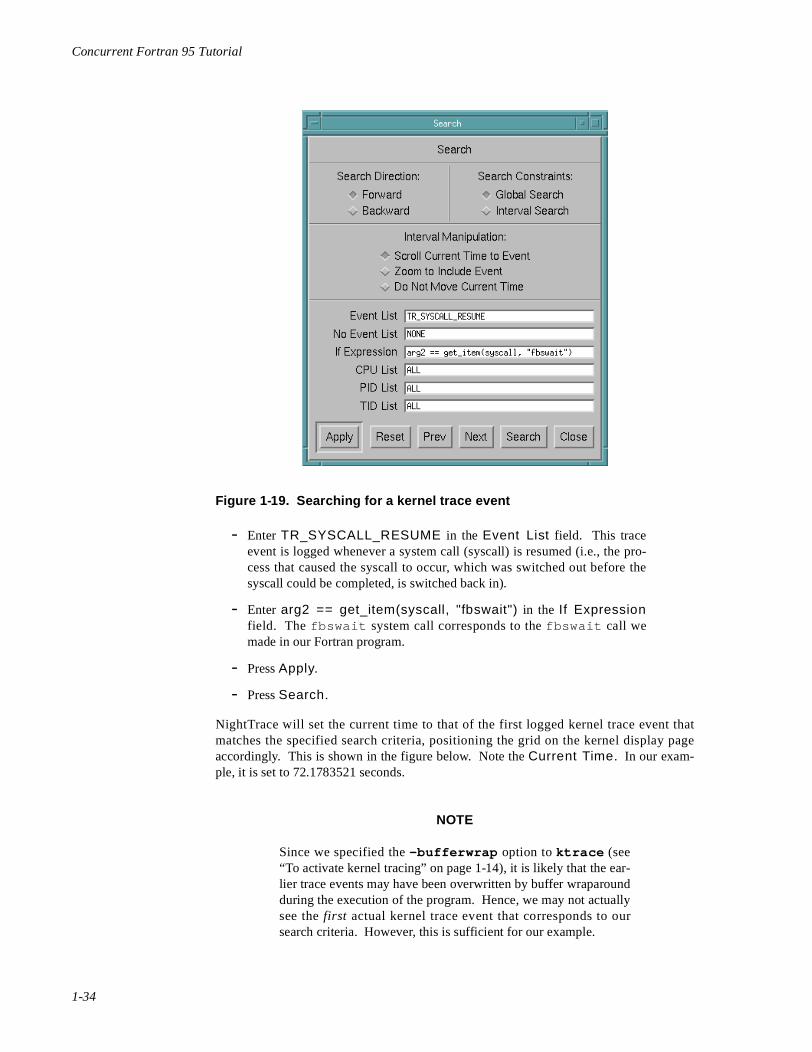
Figure 1-19. Searching for a kernel trace event
- Enter TR_SYSCALL_RESUME in the Event List field. This traceevent is logged whenever a system call (syscall) is resumed (i.e., the pro-cess that caused the syscall to occur, which was switched out before thesyscall could be completed, is switched back in).
- Enter arg2 == get_item(syscall, "fbswait") in the If Expressionfield. The fbswait system call corresponds to the fbswait call wemade in our Fortran program.
- Press Apply.
- Press Search .
NightTrace will set the current time to that of the first logged kernel trace event thatmatches the specified search criteria, positioning the grid on the kernel display pageaccordingly. This is shown in the figure below. Note the Current Time . In our exam-ple, it is set to 72.1783521 seconds.
NOTE
Since we specified the -bufferwrap option to ktrace (see“To activate kernel tracing” on page 1-14), it is likely that the ear-lier trace events may have been overwritten by buffer wraparoundduring the execution of the program. Hence, we may not actuallysee the first actual kernel trace event that corresponds to oursearch criteria. However, this is sufficient for our example.
1-34

Using Concurrent Fortran 95 with NightStar Tools
Figure 1-20. First kernel trace event
In addition to setting the current time and repositioning the grid on the kernel display pagewhen the search for the kernel trace event was performed, NightTrace will automaticallyset the current time and reposition the display page that contains the user trace events aswell. This is shown in the following figure.
1-35

Concurrent Fortran 95 Tutorial
Figure 1-21. NightTrace display page repositioned accordingly
Searching for a user trace event 1
Now that we have found the first logged kernel trace event, we can search for the usertrace events that we logged using NightView (see “Adding a tracepoint in the program” onpage 1-18).
To search for a user trace event
NOTE
You may use the same search dialog that you used in the previousstep, “Searching for a kernel trace event” on page 1-33.
- Select Search... from the Tools menu of the display page containing theuser trace events (see “Creating a default page” on page 1-32).
You will be presented with the following dialog:
1-36
Using Concurrent Fortran 95 with NightStar Tools
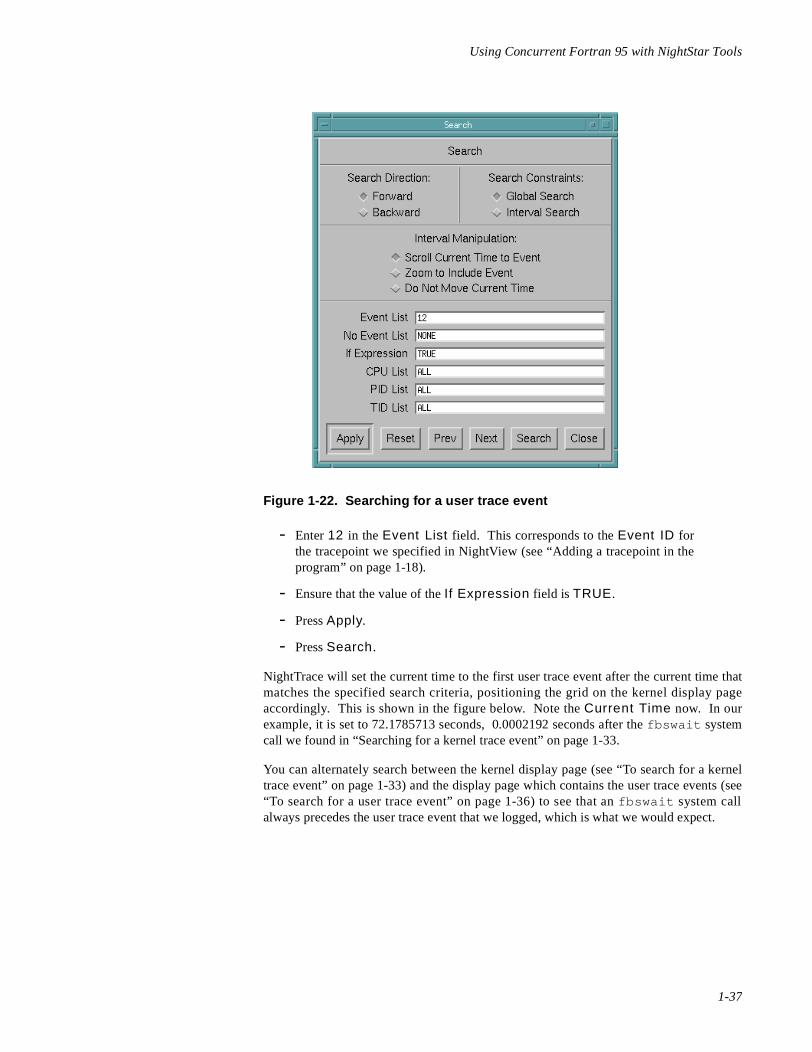
Figure 1-22. Searching for a user trace event
- Enter 12 in the Event List field. This corresponds to the Event ID forthe tracepoint we specified in NightView (see “Adding a tracepoint in theprogram” on page 1-18).
- Ensure that the value of the If Expression field is TRUE.
- Press Apply.
- Press Search .
NightTrace will set the current time to the first user trace event after the current time thatmatches the specified search criteria, positioning the grid on the kernel display pageaccordingly. This is shown in the figure below. Note the Current Time now. In ourexample, it is set to 72.1785713 seconds, 0.0002192 seconds after the fbswait systemcall we found in “Searching for a kernel trace event” on page 1-33.
You can alternately search between the kernel display page (see “To search for a kerneltrace event” on page 1-33) and the display page which contains the user trace events (see“To search for a user trace event” on page 1-36) to see that an fbswait system callalways precedes the user trace event that we logged, which is what we would expect.
1-37
Concurrent Fortran 95 Tutorial
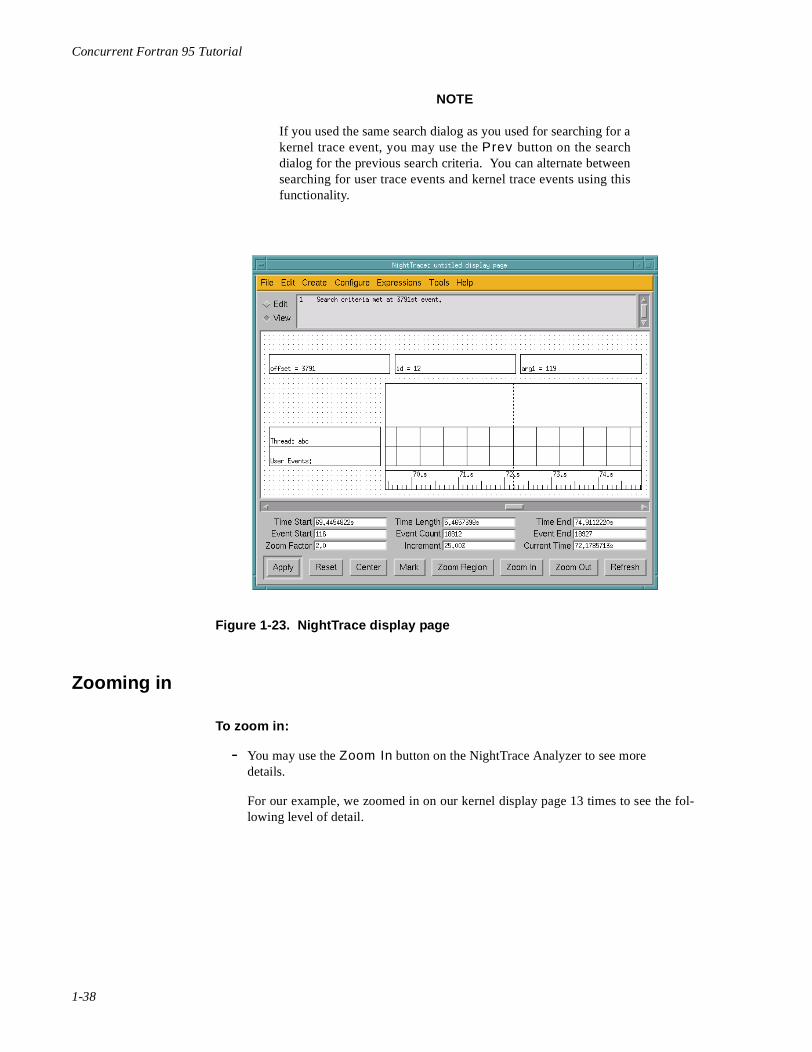
NOTE
If you used the same search dialog as you used for searching for akernel trace event, you may use the Prev button on the searchdialog for the previous search criteria. You can alternate betweensearching for user trace events and kernel trace events using thisfunctionality.
Figure 1-23. NightTrace display page
Zooming in 1
To zoom in:
- You may use the Zoom In button on the NightTrace Analyzer to see moredetails.
For our example, we zoomed in on our kernel display page 13 times to see the fol-lowing level of detail.
1-38

Using Concurrent Fortran 95 with NightStar Tools
Figure 1-24. Zoomed in kernel display page
In the above figure, the first bar (red) listed for CPU 0 indicates the real-time clock inter-rupt for this cycle. The first bar (blue) listed for CPU 3 shows the target process progexiting the fbswait call in the Fortran code. The current time line is positioned at theuser trace event that we previously searched for.
Looking at the other display page (which shows our user trace events), we can see the usertrace event inserted through NightView (see “Adding a tracepoint in the program” on page1-18). Note that both displays are synchronized in time (the current time line representsthe same instant in time on both display pages). You may middle-click on the line repre-senting the user trace event to see more detailed information.
NOTE
Due to a problem with the -bufferwrap option to the ktracecommand, user and kernel data may not appear synchronized.This problem has been fixed in the ktrace and ntfiltercommands in PowerMAX OS 4.3 Patch Set 6 (trace-004 andbase-006). See “To activate kernel tracing” on page 1-14 formore information.
1-39

Concurrent Fortran 95 Tutorial
Conclusion 1
This concludes our tutorial for using the Concurrent Fortran 95 compiler with the Night-Star tools. We hope that we have given you a sufficient overview of the various tools andthe interactions between them.
1-40

