concentrated photovoltaic tracker component stability … tracker component stability and...
TRANSCRIPT
i
SCHOOL OF SCIENCE AND ENGINEERING
CONCENTRATED PHOTOVOLTAIC TRACKER
COMPONENT STABILITY AND ECONOMIC STUDY
Capstone Design
Submitted on:
9 December 2016
ii
Written by:
Hajar Abjeg
Supervised by:
Dr. Khalid Loudiyi
CONCENTRATED PHOTOVOLTAIC TRACKER COMPONENT STABILITY AND
ECONOMIC STUDY
Capstone Report
Approved by the Supervisor
_____________________________________________________
Dr. Khalid Loudiyi

iii
Acknowledgements
I am taking this opportunity to thank my parents for all they have done and sacrificed for me. I
would not be here if it weren’t for their constant support and mentorship. I am also grateful to
my sisters, who taught me that nothing is impossible if I put my mind to it.
I would like to thank Dr. Loudiyi for his constant support and outstanding supervision.
I am also grateful to my friends, who have showered me with help and chocolate in good and
bad times.
I am grateful to Al Akhawayn University, for teaching me to always seek learning, and to
approach life as if it were a complicated class project; with courage, determination and
ambition.
iv
Table of Contents
Acknowledgements ........................................................................................... iii
Table of Contents .............................................................................................. iv
Table of figures .................................................................................................. vi
Abstract ............................................................................................................. vii
Introduction ......................................................................................................... 1
Steeple Analysis ................................................................................................. 3
Socially ................................................................................................................................ 3
Technically .......................................................................................................................... 3 Environmentally .................................................................................................................. 3 Ethically ............................................................................................................................... 3 Politically ............................................................................................................................. 3
Legally ................................................................................................................................. 4 Economically ....................................................................................................................... 4
Background ......................................................................................................... 5
Solar Energy ........................................................................................................................ 5 a) Energy Needs ................................................................................................................ 5 b) Harnessing Solar Energy .............................................................................................. 5
Concentrated Photovoltaic Cells ......................................................................................... 6
Solar Tracking ..................................................................................................................... 8 a) Solar Movement ........................................................................................................... 8
b) Solar Tracking Efficiency .......................................................................................... 10 Photovoltaic Tracker Systems ........................................................................................... 10
a) Axis Structures ........................................................................................................... 11 b) Tracking systems ........................................................................................................ 12
c) Positioning systems .................................................................................................... 14
State of the Art .................................................................................................. 15
Dual Axis Tracker Components ........................................................................................ 15 a) The Support Frame ..................................................................................................... 15 b) The Motion System .................................................................................................... 15 c) The Electrical System ................................................................................................. 16 d) The Electronic Box ..................................................................................................... 16
Existing CPV Trackers: An Overview .............................................................................. 17 a) Mechatron’s C140 Gearless CPV Tracker ................................................................. 17 b) Sunpower’s C7 Tracker .............................................................................................. 17 c) BSQ Solar’s BSQ-D280/53 ........................................................................................ 18 d) Suncore’s CPV System .............................................................................................. 18
Tracker Design Optimization ............................................................................................ 19
v
CPV Tracker Design ......................................................................................... 21
Component Wind Stability Analysis ............................................................... 23
Wind Load Codes .............................................................................................................. 23
Wind Loading Analysis ..................................................................................................... 23 a) Theoretical Setting ...................................................................................................... 24 b) Lift Coefficient ........................................................................................................... 25 c) Lift Force .................................................................................................................... 26 d) Using the NBE-AE88 Spanish Standard for wind loading ........................................ 27
SolidWorks Simulation ..................................................................................................... 30
a) Simulation Process ..................................................................................................... 30
b) Simulation results ....................................................................................................... 32 c) Drag and lift forces ..................................................................................................... 48 Discussion ......................................................................................................................... 50
Cost Analysis .................................................................................................... 52
Support Frame ................................................................................................................... 52 Concrete Base .................................................................................................................... 52 Linear Actuator .................................................................................................................. 53
Rotational Motor ............................................................................................................... 54 12V Battery ....................................................................................................................... 54
Electronic Box ................................................................................................................... 54
Linking elements ............................................................................................................... 55
Assembling Costs .............................................................................................................. 55 Total Cost .......................................................................................................................... 56
NPV Analysis .................................................................................................................... 56
Conclusions ...................................................................................................... 59
Future Work ...................................................................................................... 60
References ........................................................................................................ 61
Appendice A: Initial Specification ................................................................... 63
vi
Table of figures
Figure 1- A depiction of multi-junction photovoltaic cell efficiency [12] .......................... 7 Figure 2- SolarGis’ Direct Normal Irradiation Map of Morocco........................................ 8 Figure 3- Earth's axis orbit, tilt and seasons ........................................................................ 9 Figure 4- Zenith and Azimuth Angles [14] ......................................................................... 9
Figure 5- Horizontal single axis solar tracker
Figure 6- Vertical single axis solar tracker ....................................................................... 11 Figure 7- Performance of different solar trackers [15] ..................................................... 12 Figure 8- Polar dual-axis solar tracker .............................................................................. 13
Figure 9- Azimuthal dual-axis solar tracker ...................................................................... 13 Figure 10 - Ball Lock Pin and Aluminum Bracket ........................................................... 16 Figure 11 - BSQ Solar's BSQ-D280/53 ............................................................................ 18 Figure 12 - Suncore's CPV System ................................................................................... 19
Figure 13 - Thaw, How et al.'s CAD Design of the ST444 Solar Tracker [20] ................ 22 Figure 14 - Thaw, How et al's CAD Design of the ST444 Solar Tracker [20] ................. 22 Figure 15- Forces on the platform for an Azimuthal tracker [20] ..................................... 24 Figure 16- Diagram of pressure coefficient distribution on a tilted platform [18] ........... 27
vii
Abstract
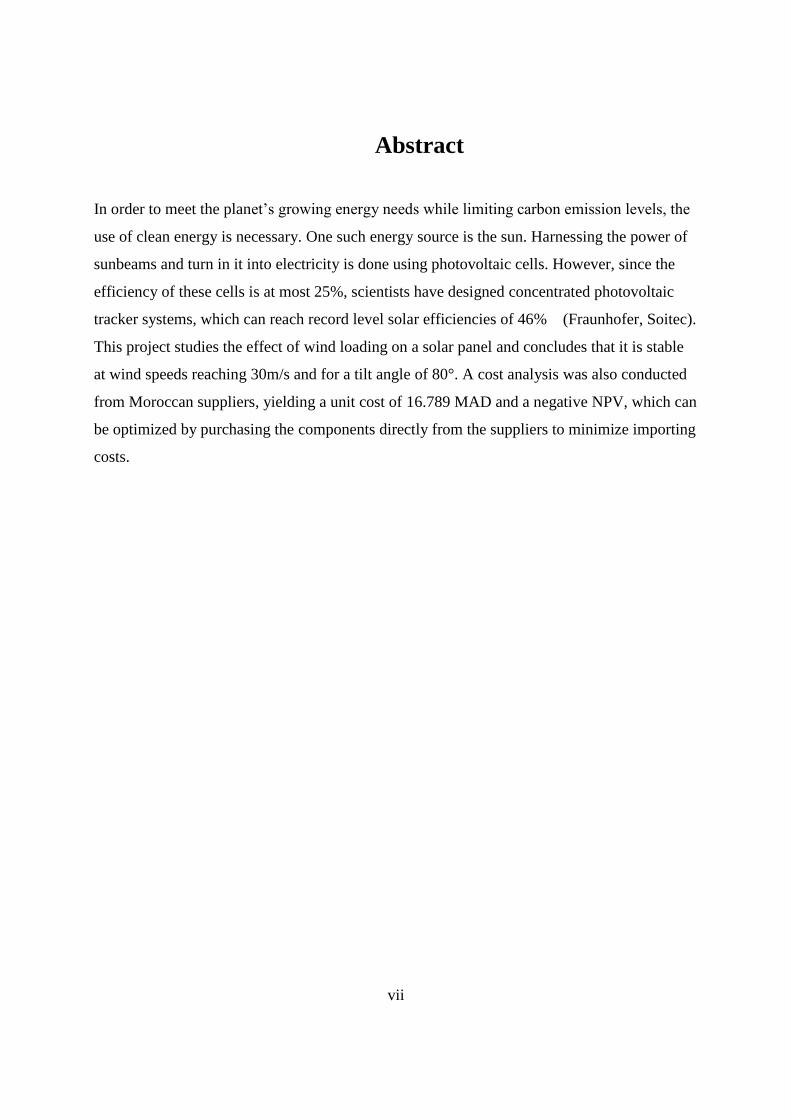
In order to meet the planet’s growing energy needs while limiting carbon emission levels, the
use of clean energy is necessary. One such energy source is the sun. Harnessing the power of
sunbeams and turn in it into electricity is done using photovoltaic cells. However, since the
efficiency of these cells is at most 25%, scientists have designed concentrated photovoltaic
tracker systems, which can reach record level solar efficiencies of 46% (Fraunhofer, Soitec).
This project studies the effect of wind loading on a solar panel and concludes that it is stable
at wind speeds reaching 30m/s and for a tilt angle of 80°. A cost analysis was also conducted
from Moroccan suppliers, yielding a unit cost of 16.789 MAD and a negative NPV, which can
be optimized by purchasing the components directly from the suppliers to minimize importing
costs.
1
Introduction
The 18th century was marked by a great number of events that changed the world, such as the
French Revolution, the United States of America’s declaration of independence from the
English Crown, as well as the invention and patenting of the gas turbine [1] [2] [3]. This
century is also often linked with a phase that would affect the future of not only humans, but
also that of animals, plants, and planet Earth in general: the Industrial Revolution [4]. The
industrialization process induced an increase in the use of fuel, iron, machines, and electricity,
as well as population, leading to the major technological advances that frame today’s
everyday life, but also to the intensive usage of resources, which is directly linked to climate
change.
The roots of climate change can be linked to almost every aspect of human life;
transportation, energy, nutrition, medicine, and many others [5]. This disruption in nature’s
balance is causing the greenhouse effect, the rapid melting of glaciers in the North Pole, the
rising volume of the oceans, as well as the extinction of animal species due to the
depredations of their living environment. It bears consequences on the entire Earth system,
affecting the future of the planet and its inhabitants. The most direct solution to this issue is
sustainable development, which refers to the inclusion of ecological considerations in the
directing of all social, political and economic change [6].
Scholars have been troubled with the idea of sustainable development as early as in the late
18th century, as it is the case for Malthus (1766-1834) and William Stanley Jevons (1835-82),
who were both concerned about resource insufficiency due to population growth and energy
shortage [6]. However, it wasn’t until the 1960’s that more light was shed on industrial
pollution and the deplorable state of the environment [6]. In 1987, the Brundland Commission
Report rendered sustainable development a political issue, especially since the countries
partaking in the Rio de Janeiro Conference for Development and Environment (1992)
included the development of national sustainable development policies in their Program
Agenda 21 [7].
A big part of sustainable development is the reduction of pollutants while matching
humanity’s energy needs. One tactic to achieve this balance is increasing the usage of clean

2
and renewable energy. This includes producing and storing energy from naturally renewable
sources such as the sun, the wind and water. Thus the creation and continuous attempts to
optimize the collection of energy using solar panels, wind mills or turbines, as well as water
dams and tidal energy collection and geothermal processes.
The focus of this paper will be on the collection of solar energy. The project consists of
performing a wind stability and cost analysis for a concentrated photovoltaic tracker’s
components. The first part will consist of an introduction to the field of solar energy
harnessing, concentrated photovoltaics, and solar trackers. Then, a literature review will be
conducted to assess the state of the art in this field. Next, a design will be selected and
adapted to the project needs. Next, a stability study of the components for wind loading will
be conducted through simulation using SolidWorks. The final section contain a cost analysis
of the chosen system assuming that all components are ordered from local Moroccan
providers. It consists of accumulating a database of providers for different components,
including name of the company, price ranges and contact before selecting the most affordable
sturdiest materials.
3
Steeple Analysis
This analysis determines the main purpose of the project and its impact on the seven different
crucial fields: social, technical, environmental, ethical, political, legal and economical.
Socially
Solar energy is a clean, cheap and reliable source of energy. It can provide power efficiently
in low-income or disaster-stricken areas. This means that schools, homes and hospitals may
receive their electricity needs using concentrated photovoltaic trackers. If deemed stable and
cost effective, investment in this type of photovoltaic panel will create more jobs, increasing
social productivity and decreasing unemployment.
Technically
This project is mainly concerned with CPV Solar Trackers, which are currently being used in
many areas around the world. It will provide insight to the applicability of this particular
technology within Morocco. It will also blend the use of analytical calculations with
SolidWorks simulation, giving room to estimate approximation errors.
Environmentally
Solar Energy is very environmentally friendly. Classic solar trackers’ efficiency is limited to
25% in most cases. CPV Trackers maximize this efficiency up to 46 % by optimizing the
panel’s sun-exposure during the day and the amounts of wavelengths absorbed by the
photovoltaic cells.
Ethically
If deemed stable and economically viable in Morocco, this project may encourage investment
in CPV Trackers in Morocco. Therefore, it satisfies the requirements of the NSPE Code of
Ethics for Engineers by helping advance larger ecological projects in an ethical manner.
Politically
The Moroccan constitution of 2011 states that sustainable development is one of every
Moroccan citizen’s fundamental rights (article 31). By investing more in solar energy,

4
Morocco is on its way to become a green energy superpower. The solar station Noor proves
that. The organization of COP22 in Marrakech in November 2016 is proof that it is being
considered an ecology-oriented country. Perhaps this project could be used to encourage the
government to invest in CPV Trackers, further establishing Morocco’s identity as an ecology-
oriented political power.
Legally
The only legal considerations for this project will be patent based. In order to assess the
stability of the components and their cost, all details of the design will be needed. However, a
lot of these designs are patented, making it legally inadmissible to use the design without the
owner’s explicit approval. However, as this is a student-driven project with the only goal of
completing degree requirements, there shouldn’t be any legal ramifications caused by the
usage of a modified design.
Economically
About a third of the project consists of an economical cost analysis of the tracker components
in Morocco. This project will necessitate some research into the Moroccan electronic and
materials’ market. It will also attempt a cost-effectiveness study with the components
purchased within local Moroccan companies. This would eventually built a small database of
companies and prices that work in the mechatronics sector, providing future researchers and
entrepreneurs with a detailed list of suppliers. This could encourage local trade and boost the
economy. In addition, the project will provide detailed information about CPV Trackers,
which are a great investment opportunity as they are economically viable and cost-effective.
5
Background
Solar Energy
a) Energy Needs
Humans consume a lot of power. The world’s population will increase from approximately 7
billion in 2013 to approximately 9.4 billion in 2050 [8]. The GDP per capita will also upsurge
from around $9,000 on average in 2010 to about $23,000 in 2050 [8]. Between domestic
appliances, industrial operations and urban needs, human consumption of energy accumulates
and increases. In fact, it is estimated that by 2050, the average power consumption will reach
28 Terawatts [9]. 28 Terawatts is the equivalent of 28 000 000 000 000 watts. With the rapid
decrease of available fossil fuels and gases, the need for new, clean and readily available
energy is increasing with urgency.
Solar energy is a clean and renewable source of power that can fully satisfy this demand. On a
sunny day, the earth receives around 100.000 terawatts. Since a great percentage of this
energy is absorbed or reflected by the land and ocean, about 600 of these terawatts is usable
by humans and exceed by far our power needs. Therefore, the use of photovoltaic cells to
produce energy is now a growing subject of interest and research all around the world.
b) Harnessing Solar Energy
The classical method of harnessing solar power consists of using fixed solar panels, which are
lined with photovoltaic cells. Inspired by the natural process of photosynthesis, each cell is
made up of two doped semiconductor layers, sandwiched between two metallic conductive
layers. The semiconductor most commonly used is silicon because it is widely available and
cheap. The top layer of silicon is doped with phosphorus, making it electron rich, and the
bottom layer is usually doped with boron, which creates positive charges (holes, or a lack of
electrons). The junction between these two areas creates a constant internal electrical field
within the cell.
When the solar rays hit the panel, photons hit the electron-charged layer, giving the atoms
enough energy to release electrons from their respective atoms. The electrons then travel
through the metallic conductors and into the wires, creating an electrical current.
6
However, the maximum efficiency of regular solar cells is limited to 25% [10]. This is due to
many factors, such as the surface reflecting the sunbeams instead of absorbing them, as well
as weather instability and the sun’s movement across the sky, both of which limit the amount
of sun exposure of the panel. A direct solution to these issues is the usage of solar tracking in
order to maximize panel exposure, and concentrated photovoltaic cells in order to optimize
photon energy absorption.
Concentrated Photovoltaic Cells
Concentrated photovoltaics (CPV) use optical methods in order to focus the sunbeams on
small, highly efficient, multi-junction photovoltaic cells. Originally designed for outer space
applications, multi-junction photovoltaic cells were used for applications on earth starting the
early 2000’s. Paired with less expensive optics made from glass or acrylics, small multi-
junction photovoltaic cells reduce the amount of expensive semiconductor materials while
producing a superior performance. The result is a highly efficient generation of electricity that
lower cost compared to traditional silicon solar panels.
Whereas regular solar panels produce at best 25% efficiency due to light reflection and
composite characteristics, CPV panels can produce efficiencies of more than 39% in practice,
and 46% in laboratories [11].
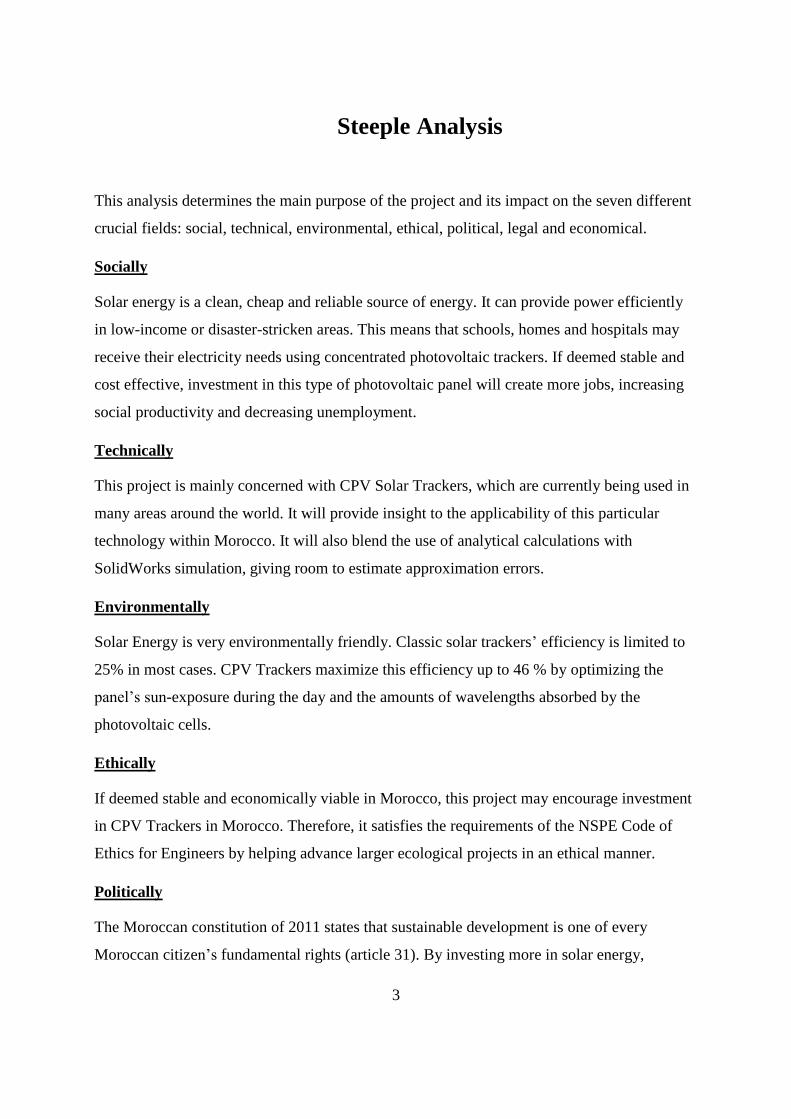
There are multiple methods used to achieve solar concentration. The first is incrementing
Fresnel lens in the cell, which is a flat and very precise magnifying lens that uses a number of
co-centric rings to focus the sun beams onto a single point. The second method is using multi-
junction photovoltaic cells, which are simply multiple photovoltaic cells stacked on top of one
another. These layers are composed of materials that collect photons for specific wavelengths
in order to maximize the conversion power of the system (figure 1). Until today, 3 layers are
being successfully used in the field. Scientists are experimenting with 4 and 5 layers, and it is
predicted that by 2020, these concentrated photovoltaic cells can reach 50% efficiency [11].
7
Figure 1- A depiction of multi-junction photovoltaic cell efficiency [12]
Another concentration method is using two parabolic mirrors of different sizes. The bottom
mirror (the collector) reflects the light into the top mirror (the concentrator), which in turn
reflects the beams directly into the multi-junction solar cells. Although this technique induces
losses, SolFocus, a CPV startup, has achieved a concentration ratio of 500 with mirror-
reflectors dual axis-tracking.
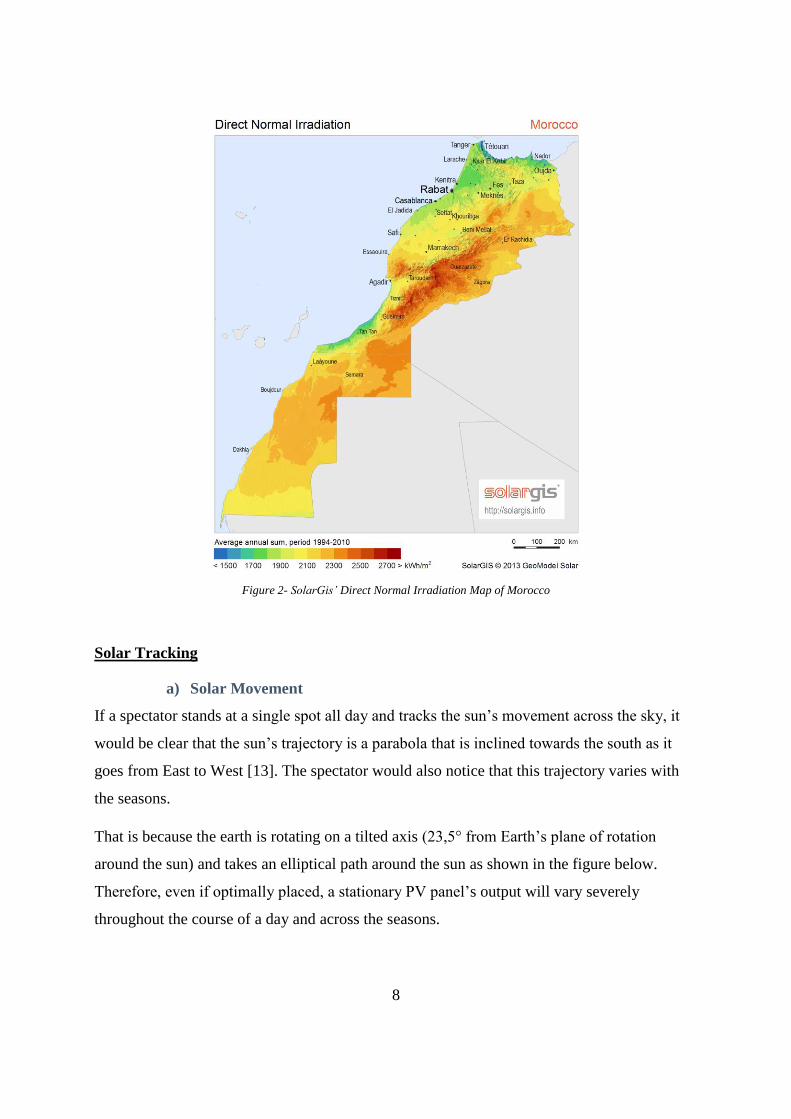
Due to its sensitivity to the availability of sun beams, CPV is of most interest for power
generation in sun-rich regions with Direct Normal Irradiance (DNI) values of more than 2000
kWh/m². This is because in cloudy circumstances, sunlight is scattered, making it difficult to
concentrate it, therefore rendering the investment in CPV technology financially unsound. In
clear skied regions, maximum power is collected if the panels are always tilted towards the
sun, a task easily achieved using Concentrated Photovoltaic Trackers.
SolarGis is a company that provides accurate solar and weather data. As the solarGis map
below shows, Morocco has high Direct Normal Irradiance values, especially across southern
and non-coastal regions, making it a strong candidate for power production using
Concentrated Photovoltaic Trackers.
8
Figure 2- SolarGis’ Direct Normal Irradiation Map of Morocco
Solar Tracking
a) Solar Movement
If a spectator stands at a single spot all day and tracks the sun’s movement across the sky, it
would be clear that the sun’s trajectory is a parabola that is inclined towards the south as it
goes from East to West [13]. The spectator would also notice that this trajectory varies with
the seasons.
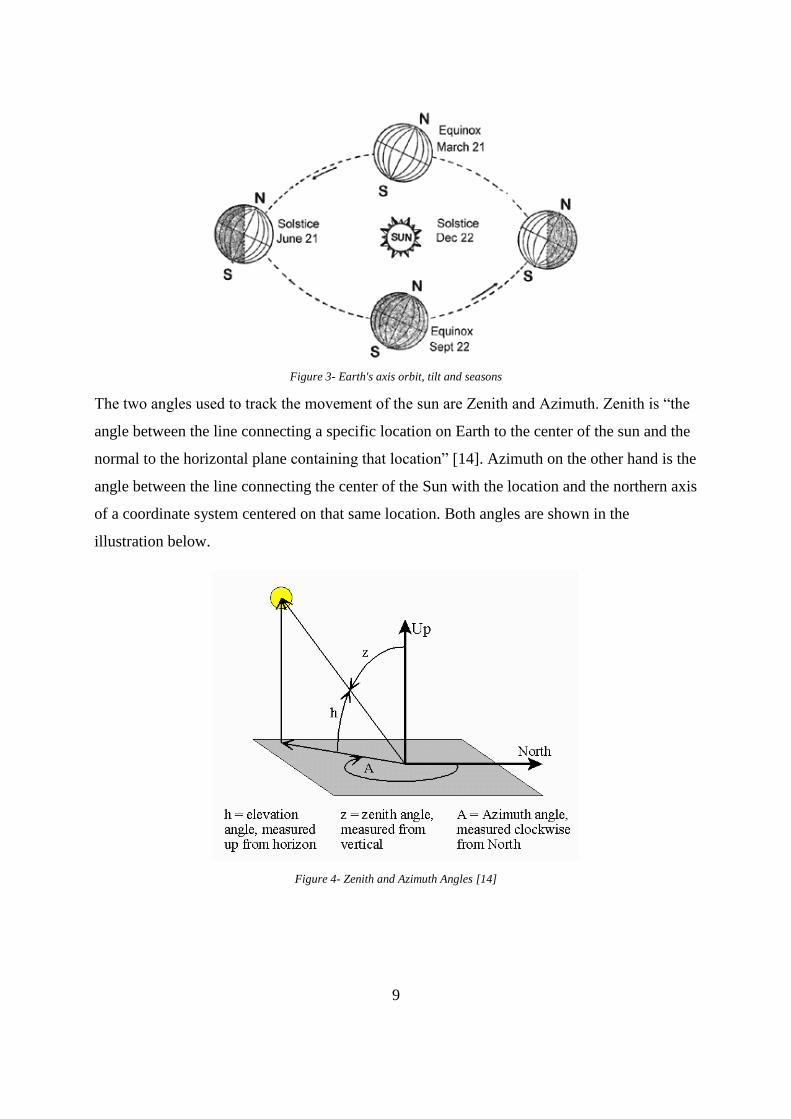
That is because the earth is rotating on a tilted axis (23,5° from Earth’s plane of rotation
around the sun) and takes an elliptical path around the sun as shown in the figure below.
Therefore, even if optimally placed, a stationary PV panel’s output will vary severely
throughout the course of a day and across the seasons.
9
Figure 3- Earth's axis orbit, tilt and seasons
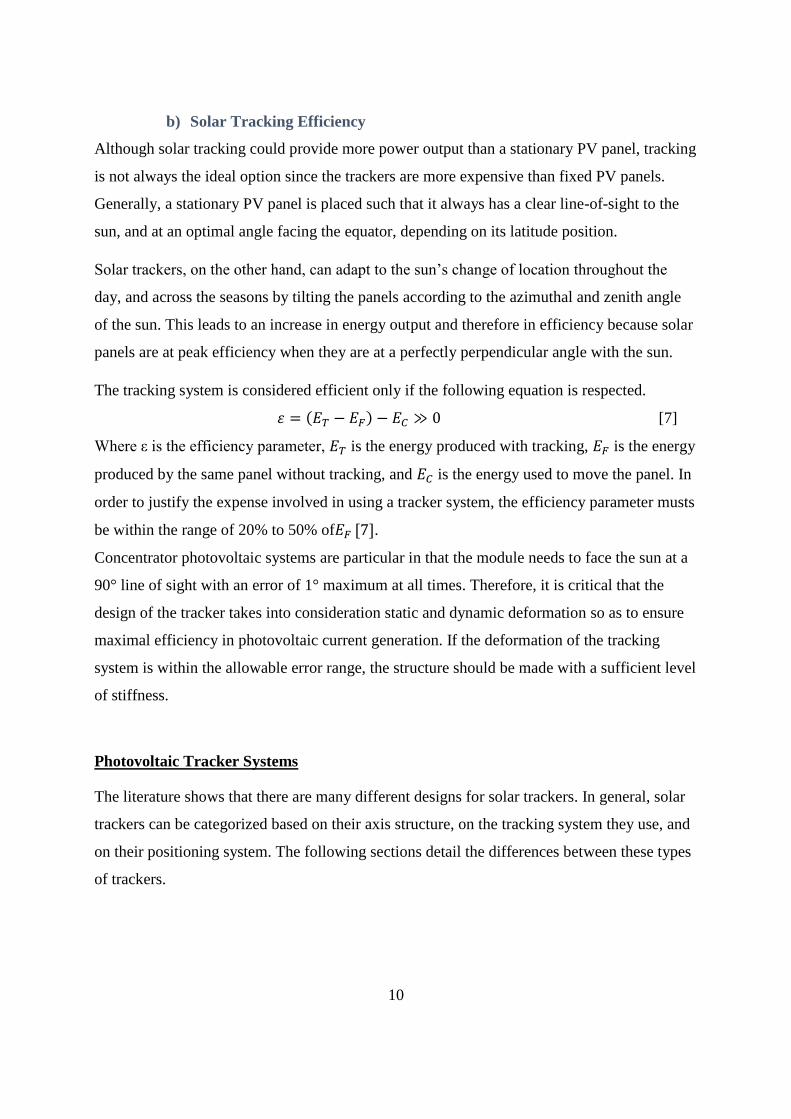
The two angles used to track the movement of the sun are Zenith and Azimuth. Zenith is “the
angle between the line connecting a specific location on Earth to the center of the sun and the
normal to the horizontal plane containing that location” [14]. Azimuth on the other hand is the
angle between the line connecting the center of the Sun with the location and the northern axis
of a coordinate system centered on that same location. Both angles are shown in the
illustration below.
Figure 4- Zenith and Azimuth Angles [14]
10
b) Solar Tracking Efficiency
Although solar tracking could provide more power output than a stationary PV panel, tracking
is not always the ideal option since the trackers are more expensive than fixed PV panels.
Generally, a stationary PV panel is placed such that it always has a clear line-of-sight to the
sun, and at an optimal angle facing the equator, depending on its latitude position.
Solar trackers, on the other hand, can adapt to the sun’s change of location throughout the
day, and across the seasons by tilting the panels according to the azimuthal and zenith angle
of the sun. This leads to an increase in energy output and therefore in efficiency because solar
panels are at peak efficiency when they are at a perfectly perpendicular angle with the sun.
The tracking system is considered efficient only if the following equation is respected.
𝜀 = (𝐸𝑇 − 𝐸𝐹) − 𝐸𝐶 ≫ 0 [7]
Where ε is the efficiency parameter, 𝐸𝑇 is the energy produced with tracking, 𝐸𝐹 is the energy
produced by the same panel without tracking, and 𝐸𝐶 is the energy used to move the panel. In
order to justify the expense involved in using a tracker system, the efficiency parameter musts
be within the range of 20% to 50% of𝐸𝐹 [7].
Concentrator photovoltaic systems are particular in that the module needs to face the sun at a
90° line of sight with an error of 1° maximum at all times. Therefore, it is critical that the
design of the tracker takes into consideration static and dynamic deformation so as to ensure
maximal efficiency in photovoltaic current generation. If the deformation of the tracking
system is within the allowable error range, the structure should be made with a sufficient level
of stiffness.
Photovoltaic Tracker Systems
The literature shows that there are many different designs for solar trackers. In general, solar
trackers can be categorized based on their axis structure, on the tracking system they use, and
on their positioning system. The following sections detail the differences between these types
of trackers.
11
a) Axis Structures
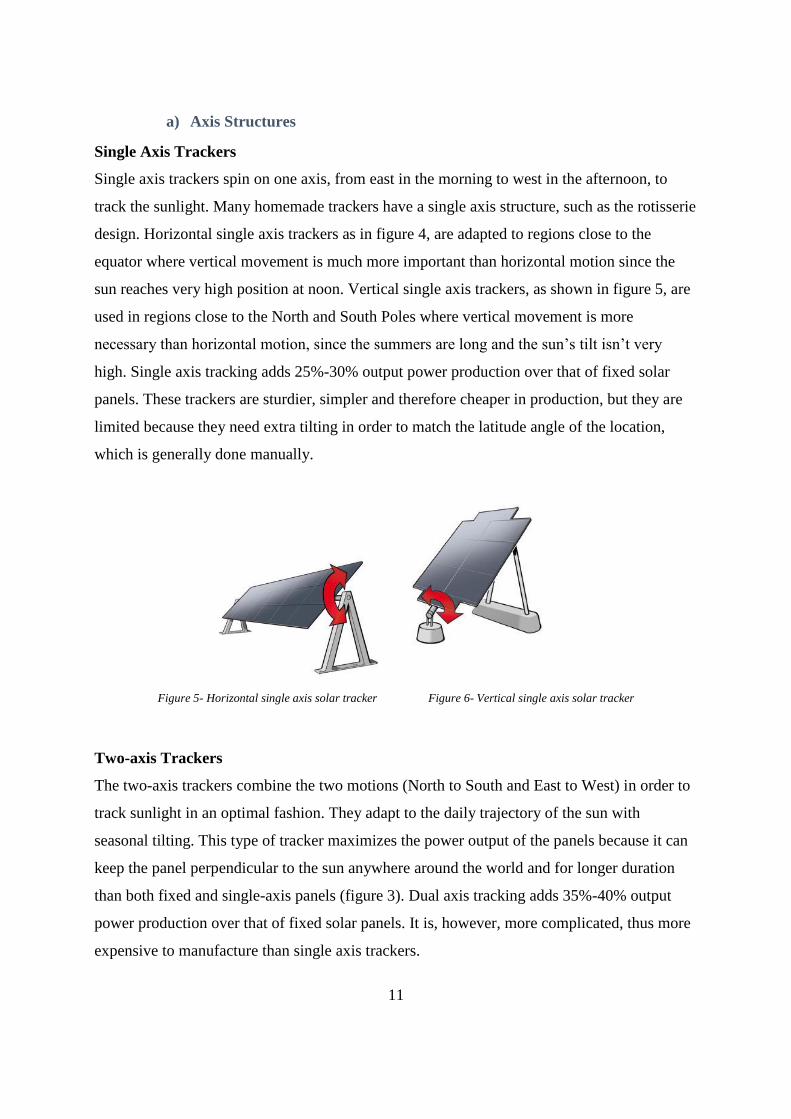
Single Axis Trackers
Single axis trackers spin on one axis, from east in the morning to west in the afternoon, to
track the sunlight. Many homemade trackers have a single axis structure, such as the rotisserie
design. Horizontal single axis trackers as in figure 4, are adapted to regions close to the
equator where vertical movement is much more important than horizontal motion since the
sun reaches very high position at noon. Vertical single axis trackers, as shown in figure 5, are
used in regions close to the North and South Poles where vertical movement is more
necessary than horizontal motion, since the summers are long and the sun’s tilt isn’t very
high. Single axis tracking adds 25%-30% output power production over that of fixed solar
panels. These trackers are sturdier, simpler and therefore cheaper in production, but they are
limited because they need extra tilting in order to match the latitude angle of the location,
which is generally done manually.
Figure 5- Horizontal single axis solar tracker Figure 6- Vertical single axis solar tracker
Two-axis Trackers
The two-axis trackers combine the two motions (North to South and East to West) in order to
track sunlight in an optimal fashion. They adapt to the daily trajectory of the sun with
seasonal tilting. This type of tracker maximizes the power output of the panels because it can
keep the panel perpendicular to the sun anywhere around the world and for longer duration
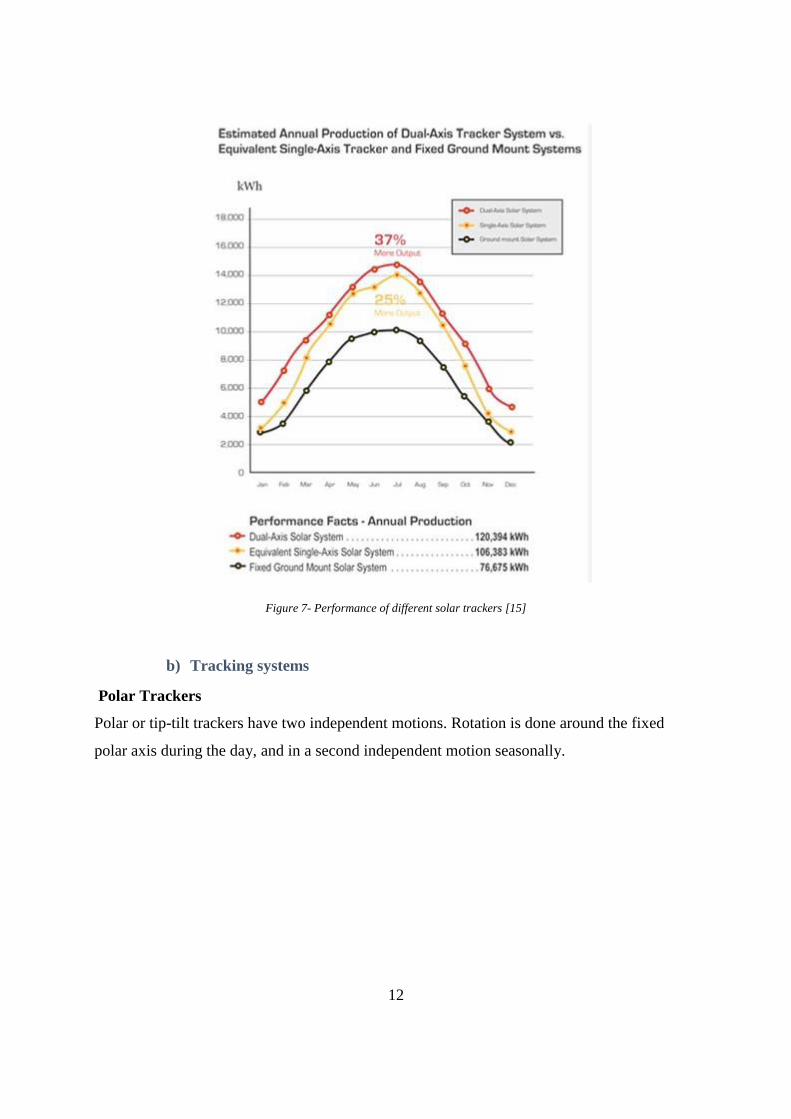
than both fixed and single-axis panels (figure 3). Dual axis tracking adds 35%-40% output
power production over that of fixed solar panels. It is, however, more complicated, thus more
expensive to manufacture than single axis trackers.
12
Figure 7- Performance of different solar trackers [15]
b) Tracking systems
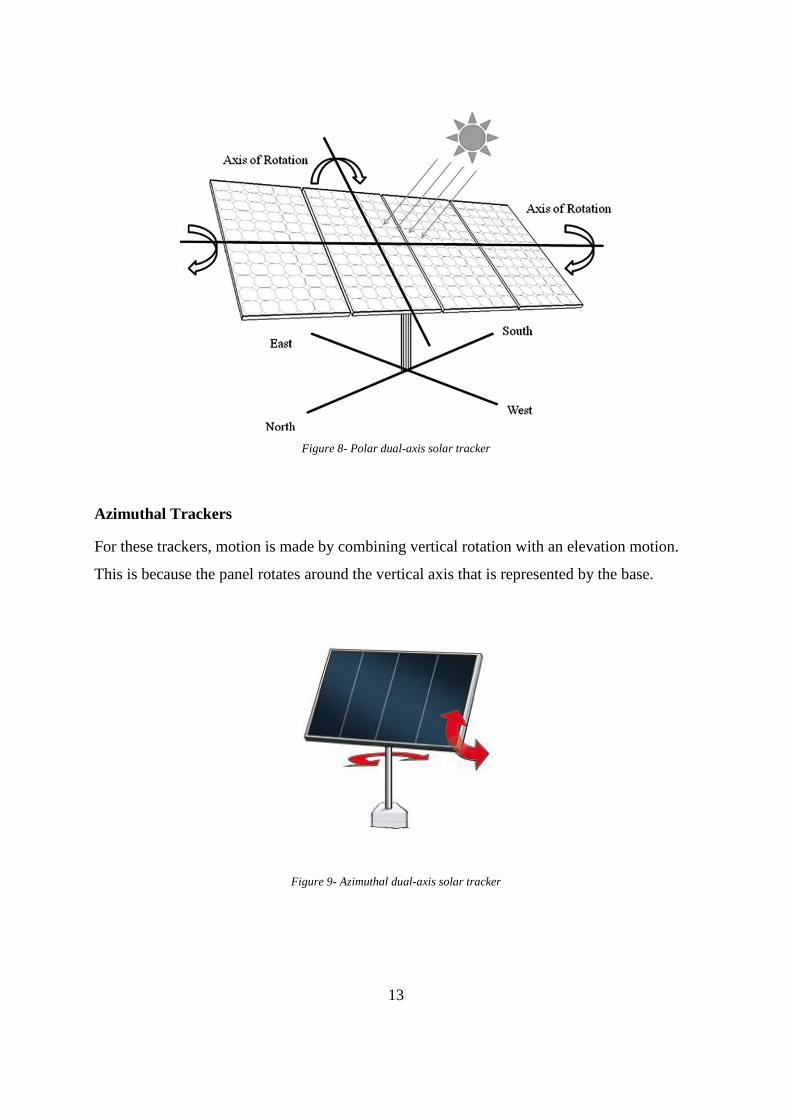
Polar Trackers
Polar or tip-tilt trackers have two independent motions. Rotation is done around the fixed
polar axis during the day, and in a second independent motion seasonally.
13
Figure 8- Polar dual-axis solar tracker
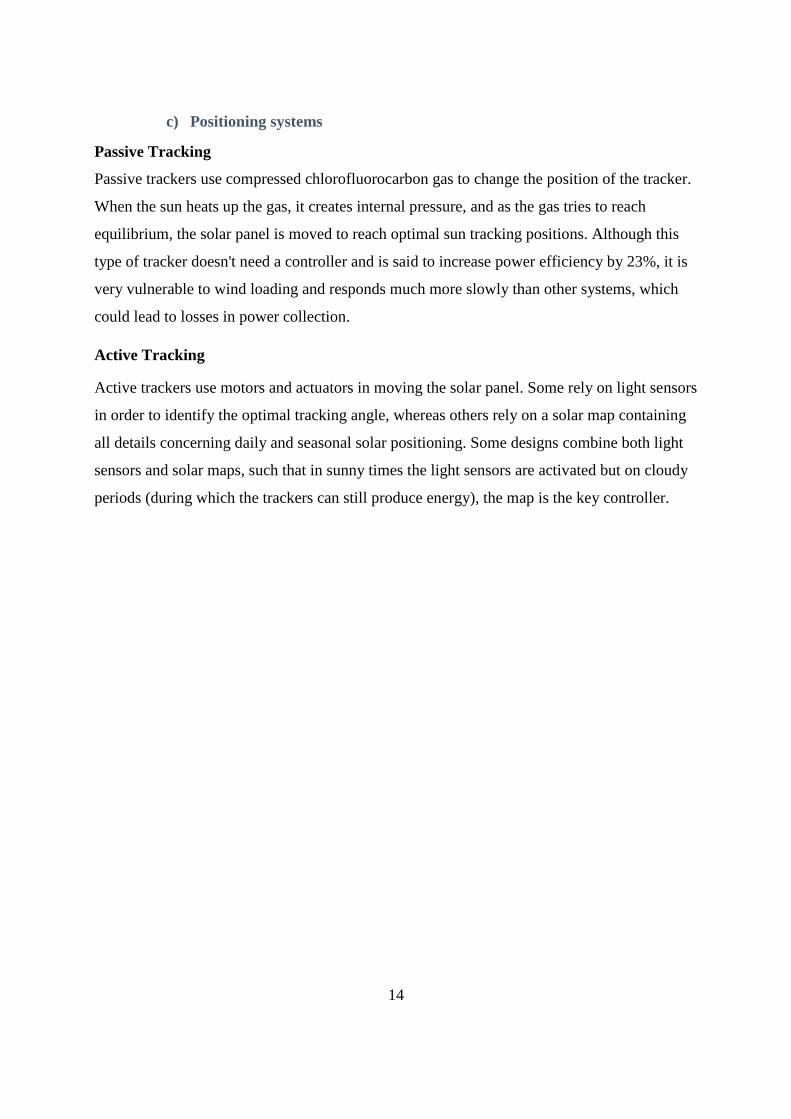
Azimuthal Trackers
For these trackers, motion is made by combining vertical rotation with an elevation motion.
This is because the panel rotates around the vertical axis that is represented by the base.
Figure 9- Azimuthal dual-axis solar tracker
14
c) Positioning systems
Passive Tracking
Passive trackers use compressed chlorofluorocarbon gas to change the position of the tracker.
When the sun heats up the gas, it creates internal pressure, and as the gas tries to reach
equilibrium, the solar panel is moved to reach optimal sun tracking positions. Although this
type of tracker doesn't need a controller and is said to increase power efficiency by 23%, it is
very vulnerable to wind loading and responds much more slowly than other systems, which
could lead to losses in power collection.
Active Tracking
Active trackers use motors and actuators in moving the solar panel. Some rely on light sensors
in order to identify the optimal tracking angle, whereas others rely on a solar map containing
all details concerning daily and seasonal solar positioning. Some designs combine both light
sensors and solar maps, such that in sunny times the light sensors are activated but on cloudy
periods (during which the trackers can still produce energy), the map is the key controller.

15
State of the Art
Dual Axis Tracker Components
A review of the literature shows that there are many different designs of solar trackers on the
market, with different components, actuation systems and dimensions. However, the
components of these trackers could generally be categorized into four interacting segments:
the support frame, the motion system, the electrical system and the electronic box.
a) The Support Frame
The support frame consists generally of a foundation and support base for the solar panel and
other components. This fixed part of the tracker supports most of the system’s weight, and
stabilizes the panel as it moves following the sun’s trajectory. The support frame has to be
very sturdy, because the pressure of the panel’s weight and wind or snow loading could
induce material fatigue.
It can be made of concrete, as in the Exosun’s Exotrack for example, or steel to ensure
robustness, or a mix of metals and alloys. Some manufacturers opt for a large-diameter pole to
act as the main support frame, where others prefer a tower-like formation made of square or
rectangular cylinders.
b) The Motion System
The motion system consists of a motor and mechanical linking elements that allow the panel
to move its position in order to follow the sun. Designs use multiple motion actuators such as
DC motors, stepper motors, linear actuators and servo motors. The dual axis tracker needs to
move the panel in two directions, which is why some designs combine two different motors or
two sets of motors. For instance, the 5-Kw CPV system designed by Lee et al. [16] combines
the use of a BLDC motor and a dual slew driver.
In addition, it is necessary to use mechanical linking elements such as pins and locks. The
panel is commonly linked to the support frame by ball-lock pins and steel or aluminum
brackets. The stiffness and strength of these linking elements is of utmost importance, as they
take on the largest loads and are usually under constant pressure.

16
Figure 10 - Ball Lock Pin and Aluminum Bracket
c) The Electrical System
In addition to the motor gear, an electrical setup is included in the design of each tracker. This
setup has two main purposes:
i. Feed the motors and electronic box when the power output of the solar panel is
limited due to weather conditions.
ii. Adapt the solar panel’s outputted current to be transferred to the grid, or
iii. Collect and store the power produced by the solar panel.
d) The Electronic Box
Every solar panel is in fact a mechatronic system. And as such, it needs to collect information
and process it before actuating. Therefore, the use of sensors and microcontrollers is very
essential to the optimal tracking of the sun’s trajectory. The use of light and wind velocity
sensors is common for many tracker models. The microprocessors are used in order to process
the information received from the sensors, sometimes in combination with pre-existing solar
maps, before executing the solar tracker’s algorithm. The actuators in this case are the motors
and active parts of the motion system.
17
Existing CPV Trackers: An Overview
There are a variety of Concentrated Photovoltaic Trackers available on the market. Below are
descriptions of some of the designs and their characteristics.
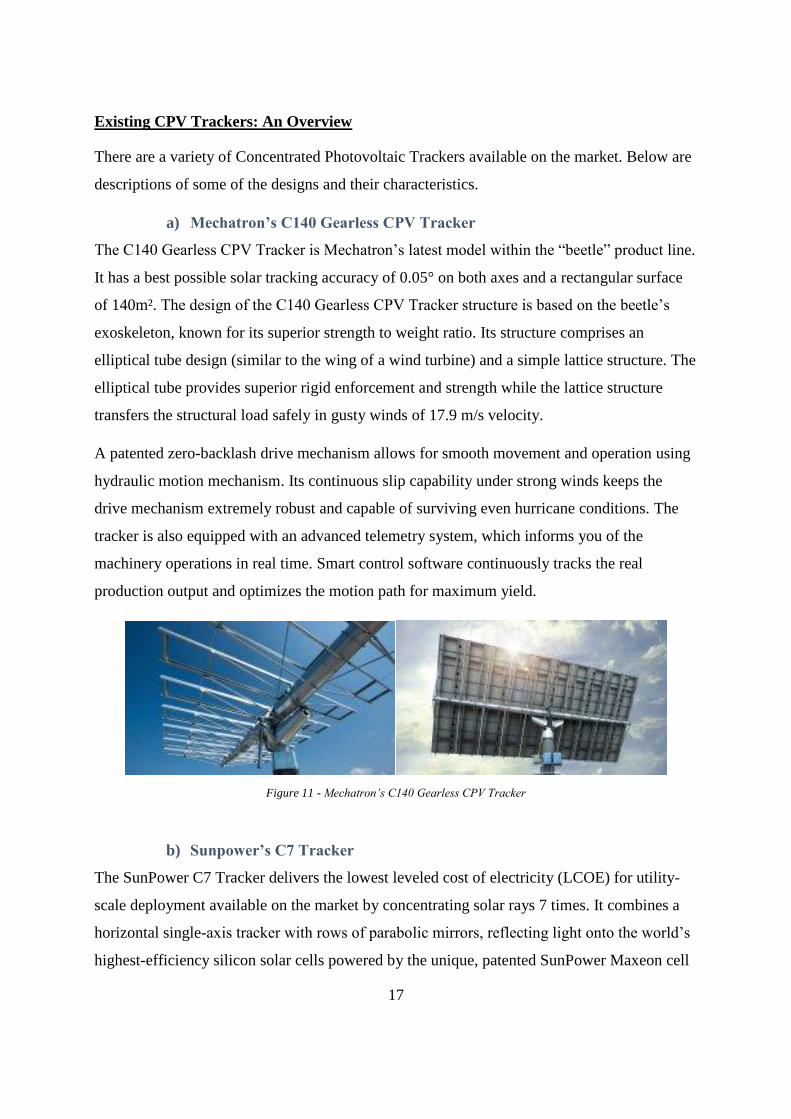
a) Mechatron’s C140 Gearless CPV Tracker
The C140 Gearless CPV Tracker is Mechatron’s latest model within the “beetle” product line.
It has a best possible solar tracking accuracy of 0.05° on both axes and a rectangular surface
of 140m². The design of the C140 Gearless CPV Tracker structure is based on the beetle’s
exoskeleton, known for its superior strength to weight ratio. Its structure comprises an
elliptical tube design (similar to the wing of a wind turbine) and a simple lattice structure. The
elliptical tube provides superior rigid enforcement and strength while the lattice structure
transfers the structural load safely in gusty winds of 17.9 m/s velocity.
A patented zero-backlash drive mechanism allows for smooth movement and operation using
hydraulic motion mechanism. Its continuous slip capability under strong winds keeps the
drive mechanism extremely robust and capable of surviving even hurricane conditions. The
tracker is also equipped with an advanced telemetry system, which informs you of the
machinery operations in real time. Smart control software continuously tracks the real
production output and optimizes the motion path for maximum yield.
Figure 11 - Mechatron’s C140 Gearless CPV Tracker
b) Sunpower’s C7 Tracker
The SunPower C7 Tracker delivers the lowest leveled cost of electricity (LCOE) for utility-
scale deployment available on the market by concentrating solar rays 7 times. It combines a
horizontal single-axis tracker with rows of parabolic mirrors, reflecting light onto the world’s
highest-efficiency silicon solar cells powered by the unique, patented SunPower Maxeon cell
18
technology. With a tracking range of -75° to 75°, it can reach a peak power of 12.4kWp. It
can also withstand wind gusts of 44m/s, and its components are factory preassembled,
enabling rapid installation using standard tools.
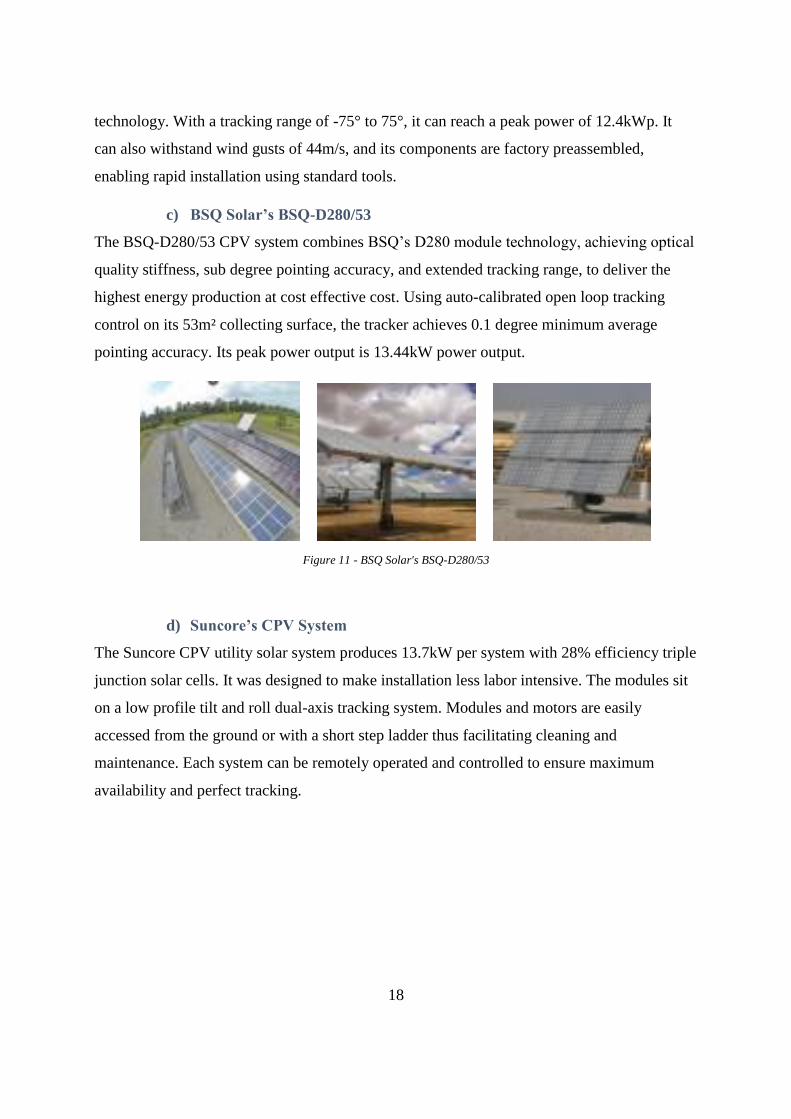
c) BSQ Solar’s BSQ-D280/53
The BSQ-D280/53 CPV system combines BSQ’s D280 module technology, achieving optical
quality stiffness, sub degree pointing accuracy, and extended tracking range, to deliver the
highest energy production at cost effective cost. Using auto-calibrated open loop tracking
control on its 53m² collecting surface, the tracker achieves 0.1 degree minimum average
pointing accuracy. Its peak power output is 13.44kW power output.
Figure 11 - BSQ Solar's BSQ-D280/53
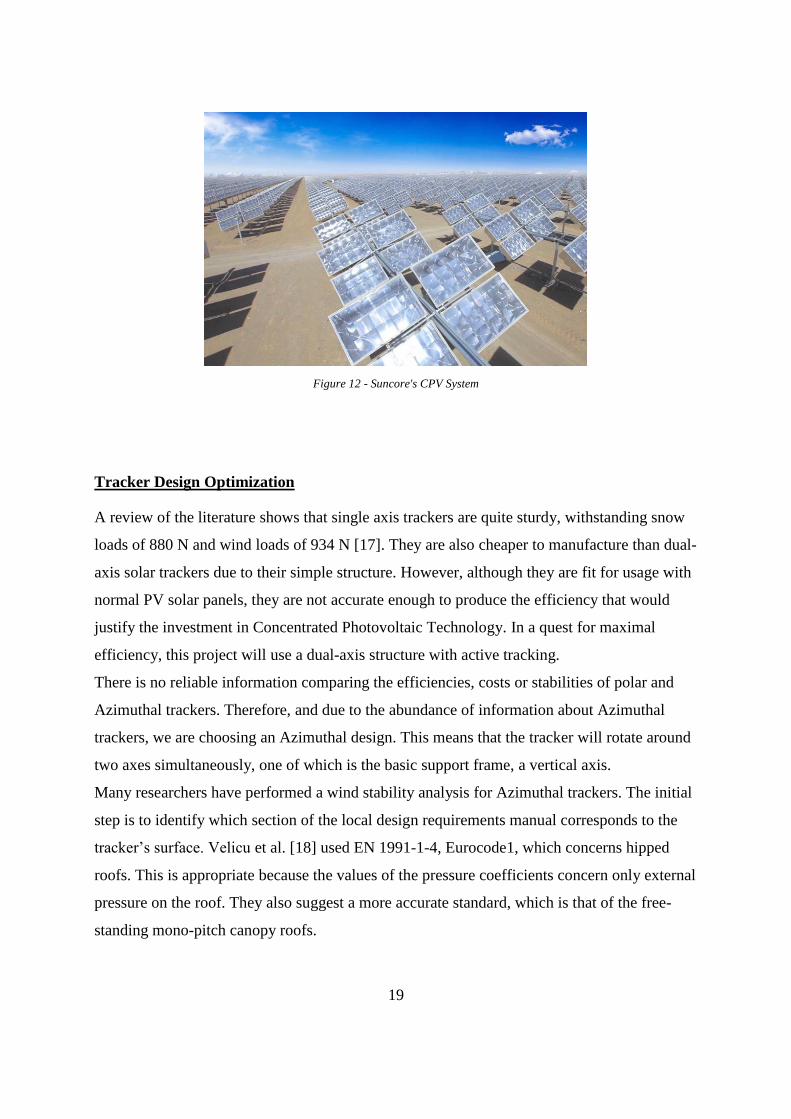
d) Suncore’s CPV System
The Suncore CPV utility solar system produces 13.7kW per system with 28% efficiency triple
junction solar cells. It was designed to make installation less labor intensive. The modules sit
on a low profile tilt and roll dual-axis tracking system. Modules and motors are easily
accessed from the ground or with a short step ladder thus facilitating cleaning and
maintenance. Each system can be remotely operated and controlled to ensure maximum
availability and perfect tracking.
19
Figure 12 - Suncore's CPV System
Tracker Design Optimization
A review of the literature shows that single axis trackers are quite sturdy, withstanding snow
loads of 880 N and wind loads of 934 N [17]. They are also cheaper to manufacture than dual-
axis solar trackers due to their simple structure. However, although they are fit for usage with
normal PV solar panels, they are not accurate enough to produce the efficiency that would
justify the investment in Concentrated Photovoltaic Technology. In a quest for maximal
efficiency, this project will use a dual-axis structure with active tracking.
There is no reliable information comparing the efficiencies, costs or stabilities of polar and
Azimuthal trackers. Therefore, and due to the abundance of information about Azimuthal
trackers, we are choosing an Azimuthal design. This means that the tracker will rotate around
two axes simultaneously, one of which is the basic support frame, a vertical axis.
Many researchers have performed a wind stability analysis for Azimuthal trackers. The initial
step is to identify which section of the local design requirements manual corresponds to the
tracker’s surface. Velicu et al. [18] used EN 1991-1-4, Eurocode1, which concerns hipped
roofs. This is appropriate because the values of the pressure coefficients concern only external
pressure on the roof. They also suggest a more accurate standard, which is that of the free-
standing mono-pitch canopy roofs.
20
Rueda et al. [19] combined computational fluid dynamics with a simulation software in order
to assess the accuracy of their computations. However, this paper took into consideration the
fact that some solar trackers can minimize wind loading by changing their position, which
may lead to losses in output production and add to production cost because wind speed
sensors would need to be added to the system design.
Lee et al. [16] had a similar approach, first designing a 5-kW CPV Azimuthal tracking
structure, then conducting a structural analysis and a finite element analysis for a wind speed
of 65 m/s using CAD software ANSYS. The simulation of the structural design on the same
software showed that the structure of the 5-kW CPV tracking system met the requirements of
the ISO4017/ISO4762 standard.
Hernández et al. [19] took into consideration the Spanish code of practice, and used a CAD
design in order to calculate the wind loads on the tracker. The research yielded that the current
design of the tracker couldn’t withstand the code of practice’s designated stresses and forces,
and recommended a real experimental procedure in order to test the PV tracker design before
implementing it in various Spanish solar farms.
Therefore, before starting the CPV Tracker stability analysis, we will need to first identify the
local design codes, and perform the analysis using a CAD flow analysis process.
21
CPV Tracker Design
Before doing the stability analysis for the components of the tracker’s components, the
design’s specifications should be detailed. There are two main constraints in the design
process:
1. The CPV solar panel musts measure 2 m by 2 m.
2. Design musts yield optimal tracking efficiency, with an 80° rotation around the
horizontal axis and 360° rotation around the Azimuthal axis.
The project needed to respect a timeframe of 8 weeks, which is not enough to come up with
an entire functional and well thought-out design. Therefore, the most efficient approach is to
find an existing design and adapt it to our needs.
As most designs available on the market are either patented or on the way to being so, it was
very difficult to find detailed design charts and measurements. However, a major qualifying
project performed by four students from the Worcester Polytechnic Institute in 2013 was very
relevant to this project. It detailed the structure and performance of French Development
Enterprises’s STS 444 Solar Tracker and performed a wind loading analysis using analytical,
simulation and wind tunnel testing techniques.
Disclaimer: The use of French Development Enterprises’ design in this project has no
purpose other than the completion of my degree requirements. It will be readapted for study
and analysis purposes only. I do not claim any ownership of the intellectual rights of the STS
444 solar tracker.
The design of the solar tracker was based on that of the STS 444 design specifications. The
original design, before adaptation, consisted of a solar panel mounted on dual towers. It is
rotated by a DC motor situated at the base, and the panel’s angle is modified by an installed
linear actuator. The tracker utilizes a 12V battery and light, wind and load sensors. The
dimensions of the solar panel are 1580 mm x 808 m x 50 mm. The panel is connected to the
linear actuator using a ball-lock pin, whereas the brackets are used to hold the linear actuator
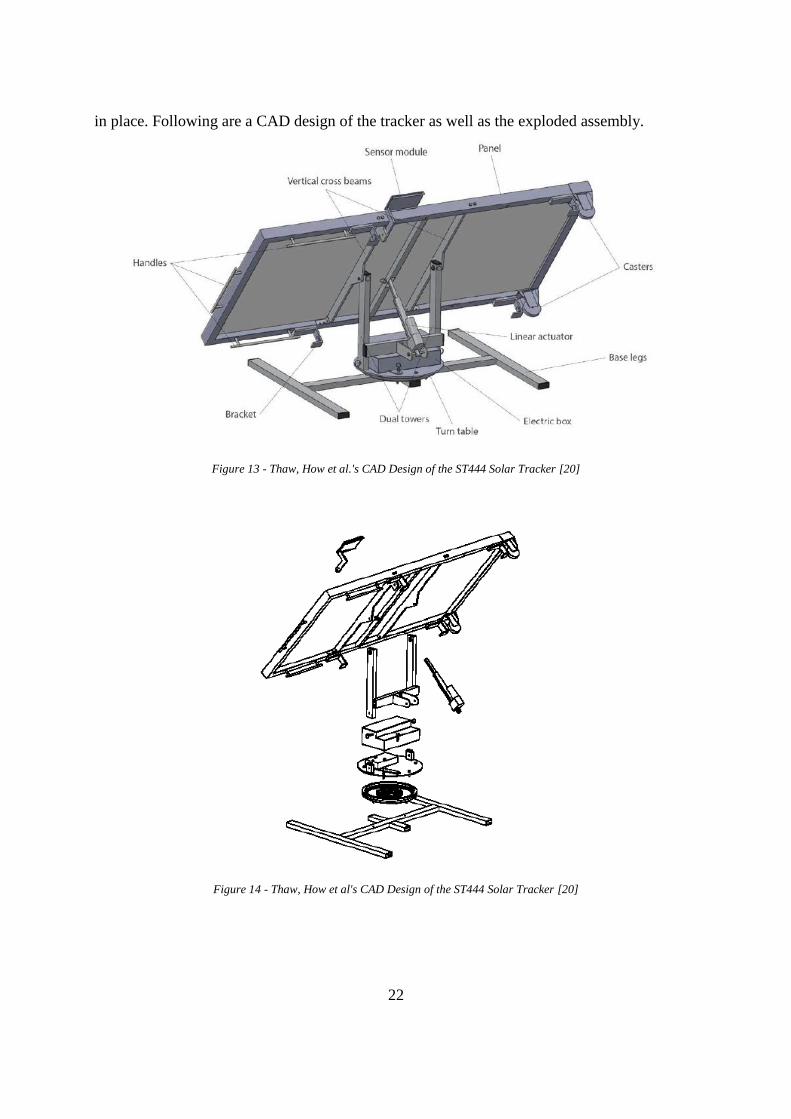
22
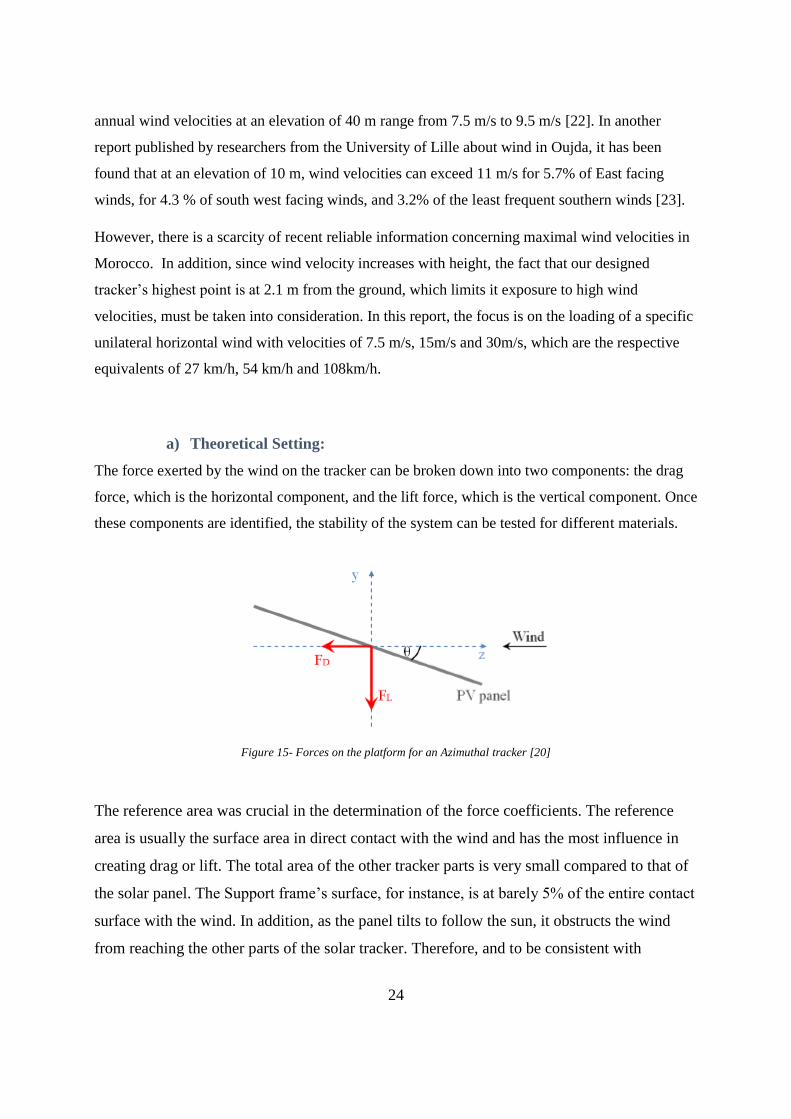
in place. Following are a CAD design of the tracker as well as the exploded assembly.
Figure 13 - Thaw, How et al.'s CAD Design of the ST444 Solar Tracker [20]
Figure 14 - Thaw, How et al's CAD Design of the ST444 Solar Tracker [20]

23
Component Wind Stability Analysis
Wind Load Codes
The first step before beginning the wind loading analysis is determining the wind loading
design codes requirements. EN 1991-1-4 and ASCE 7-10 (from the American Society of Civil
Engineers) are examples of wind load codes relied upon in the United States. Other advanced
wind loading codes can be found all around the world, such as AS/NZS 1170.2 in Australia
and New Zealand, as well as the AIJ Recommendations on Loads for Buildings and the
Building Standard Law of Japan, and the 2015 edition of the International Building Code and
ISO 4354:2009.
In the United States, ASCE 7-05 has been used as the basis building codes for a long time. It
follows the design principles of Allowable Stress Design [21]. However, a new code, ASCE7-
10, was published and has now become the basis for the 2012 series of the International
Codes. ASCE7-10 represents a shift in design principles toward Load Resistance Factor
Design.
All of these codes differ in averaging periods for design wind speeds, pressure coefficients for
various structures and wind dynamic effects. Because the design process is taking place in
Morocco, where wind loading codes are unavailable to the public, the analysis will take the
shape of identifying the stresses acting on the design, then choose a suitable wind loading
code that matches the wind speeds and panel tilts occurring in our problem.
Wind Loading Analysis
Of all the different loads that solar tracker systems are exposed to, wind loading is the most
significant. It causes the largest loading forces that vary in all direction and can cause mechanical
damage as well as destabilize the solar panel, reducing its ability to capture sunlight efficiently.
A study performed by the Center for the Development of Renewable Energies (CDER) states that
in the areas of Essaouira, Tangier and Tétouan, the average annual wind speeds at a height of 40
m range between 9.5 m/s and 11 m/s, and in the Dakhla, Tarfaya and Taza regions, average
24
annual wind velocities at an elevation of 40 m range from 7.5 m/s to 9.5 m/s [22]. In another
report published by researchers from the University of Lille about wind in Oujda, it has been
found that at an elevation of 10 m, wind velocities can exceed 11 m/s for 5.7% of East facing
winds, for 4.3 % of south west facing winds, and 3.2% of the least frequent southern winds [23].
However, there is a scarcity of recent reliable information concerning maximal wind velocities in
Morocco. In addition, since wind velocity increases with height, the fact that our designed
tracker’s highest point is at 2.1 m from the ground, which limits it exposure to high wind
velocities, must be taken into consideration. In this report, the focus is on the loading of a specific
unilateral horizontal wind with velocities of 7.5 m/s, 15m/s and 30m/s, which are the respective
equivalents of 27 km/h, 54 km/h and 108km/h.
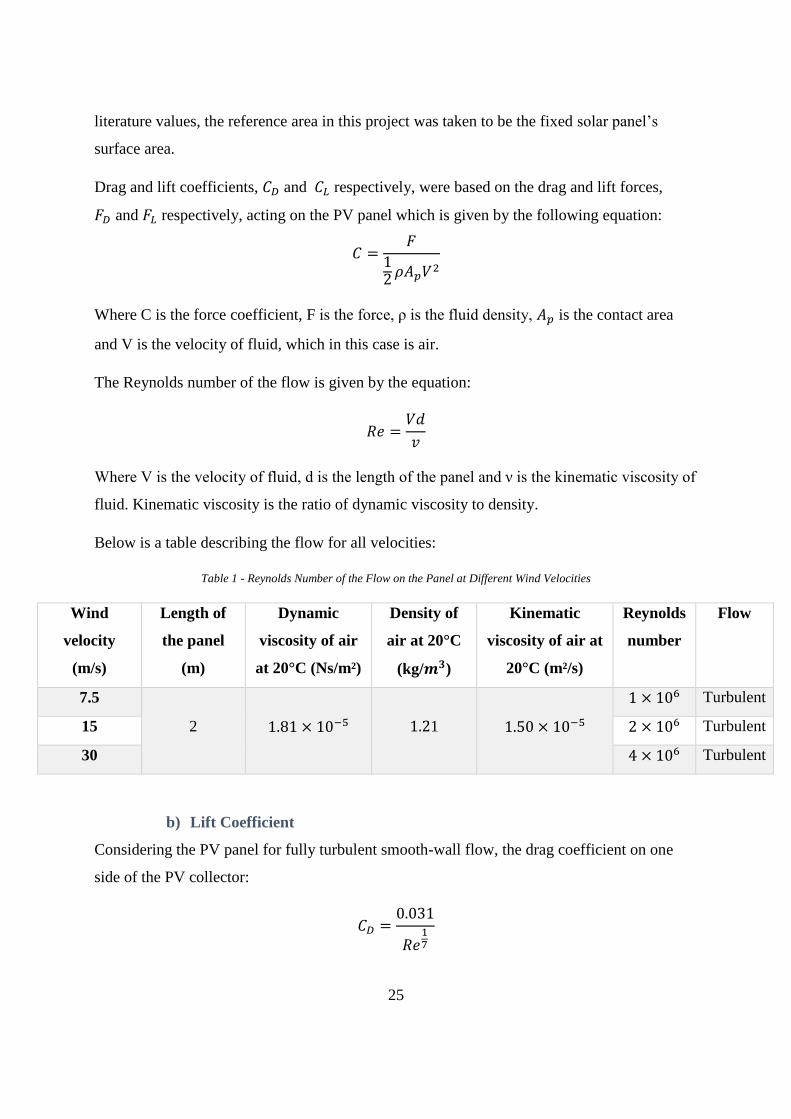
a) Theoretical Setting:
The force exerted by the wind on the tracker can be broken down into two components: the drag
force, which is the horizontal component, and the lift force, which is the vertical component. Once
these components are identified, the stability of the system can be tested for different materials.
Figure 15- Forces on the platform for an Azimuthal tracker [20]
The reference area was crucial in the determination of the force coefficients. The reference
area is usually the surface area in direct contact with the wind and has the most influence in
creating drag or lift. The total area of the other tracker parts is very small compared to that of
the solar panel. The Support frame’s surface, for instance, is at barely 5% of the entire contact
surface with the wind. In addition, as the panel tilts to follow the sun, it obstructs the wind
from reaching the other parts of the solar tracker. Therefore, and to be consistent with
25
literature values, the reference area in this project was taken to be the fixed solar panel’s
surface area.
Drag and lift coefficients, 𝐶𝐷 and 𝐶𝐿 respectively, were based on the drag and lift forces,
𝐹𝐷 and 𝐹𝐿 respectively, acting on the PV panel which is given by the following equation:
𝐶 =𝐹
12 𝜌𝐴𝑝𝑉2
Where C is the force coefficient, F is the force, ρ is the fluid density, 𝐴𝑝 is the contact area
and V is the velocity of fluid, which in this case is air.
The Reynolds number of the flow is given by the equation:
𝑅𝑒 =𝑉𝑑
𝑣
Where V is the velocity of fluid, d is the length of the panel and ν is the kinematic viscosity of
fluid. Kinematic viscosity is the ratio of dynamic viscosity to density.
Below is a table describing the flow for all velocities:
Table 1 - Reynolds Number of the Flow on the Panel at Different Wind Velocities
Wind
velocity
(m/s)
Length of
the panel
(m)
Dynamic
viscosity of air
at 20°C (Ns/m²)
Density of
air at 20°C
(kg/𝒎𝟑)
Kinematic
viscosity of air at
20°C (m²/s)
Reynolds
number
Flow
7.5
2 1.81 × 10⁻⁵ 1.21 1.50 × 10⁻⁵
1 × 10⁶ Turbulent
15 2 × 10⁶ Turbulent
30 4 × 10⁶ Turbulent
b) Lift Coefficient
Considering the PV panel for fully turbulent smooth-wall flow, the drag coefficient on one
side of the PV collector:
𝐶𝐷 =0.031
𝑅𝑒17
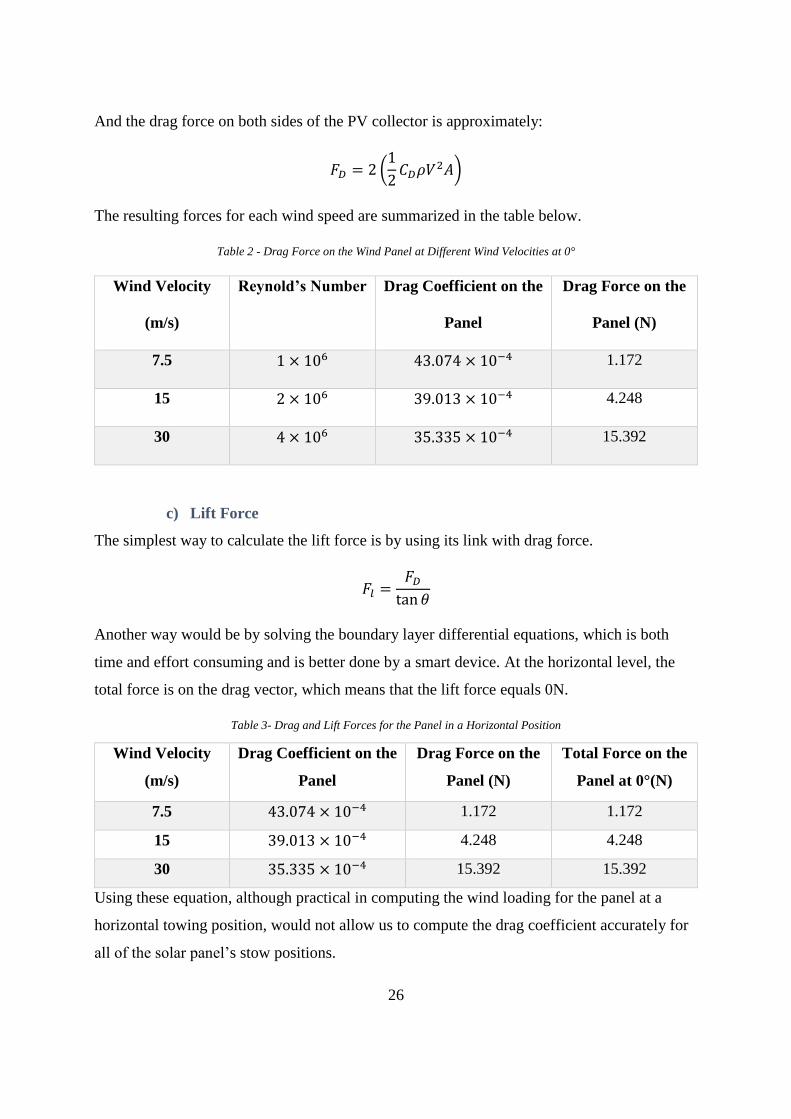
26
And the drag force on both sides of the PV collector is approximately:
𝐹𝐷 = 2 (1
2𝐶𝐷𝜌𝑉2𝐴)
The resulting forces for each wind speed are summarized in the table below.
Table 2 - Drag Force on the Wind Panel at Different Wind Velocities at 0°
Wind Velocity
(m/s)
Reynold’s Number Drag Coefficient on the
Panel
Drag Force on the
Panel (N)
7.5 1 × 10⁶ 43.074 × 10⁻⁴ 1.172
15 2 × 10⁶ 39.013 × 10⁻⁴ 4.248
30 4 × 10⁶ 35.335 × 10⁻⁴ 15.392
c) Lift Force
The simplest way to calculate the lift force is by using its link with drag force.
𝐹𝑙 =𝐹𝐷
tan 𝜃
Another way would be by solving the boundary layer differential equations, which is both
time and effort consuming and is better done by a smart device. At the horizontal level, the
total force is on the drag vector, which means that the lift force equals 0N.
Table 3- Drag and Lift Forces for the Panel in a Horizontal Position
Wind Velocity
(m/s)
Drag Coefficient on the
Panel
Drag Force on the
Panel (N)
Total Force on the
Panel at 0°(N)
7.5 43.074 × 10⁻⁴ 1.172 1.172
15 39.013 × 10⁻⁴ 4.248 4.248
30 35.335 × 10⁻⁴ 15.392 15.392
Using these equation, although practical in computing the wind loading for the panel at a
horizontal towing position, would not allow us to compute the drag coefficient accurately for
all of the solar panel’s stow positions.
27
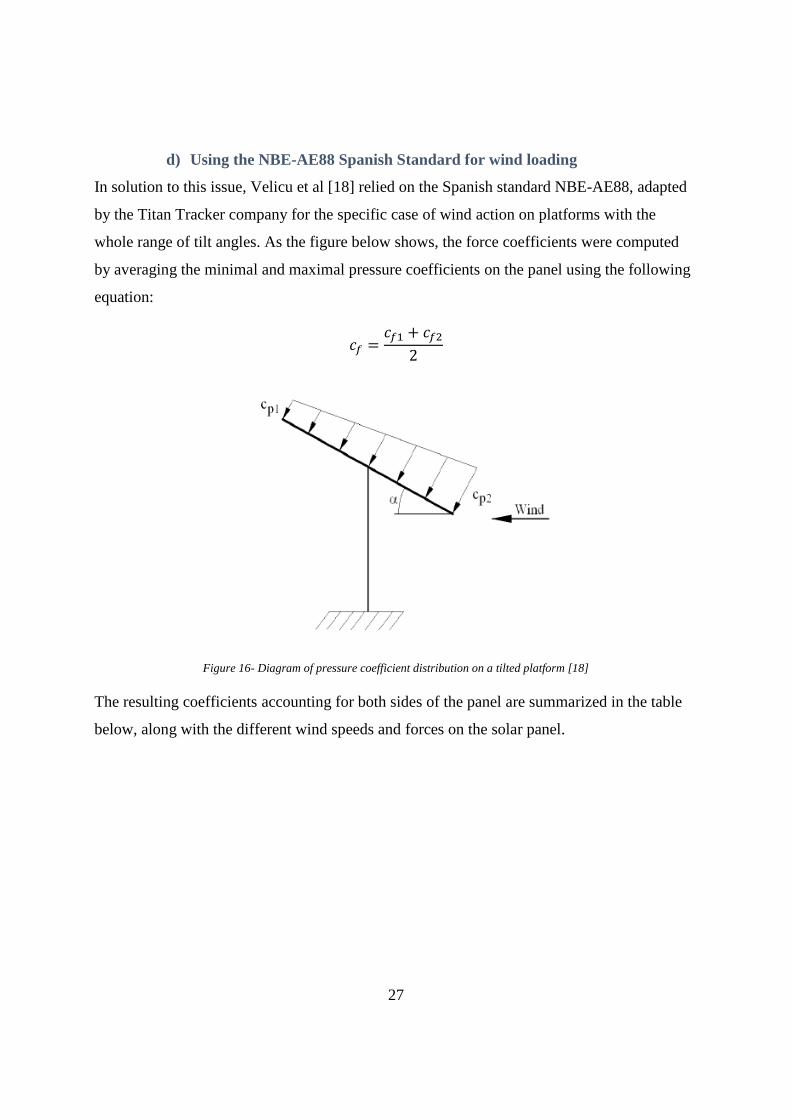
d) Using the NBE-AE88 Spanish Standard for wind loading
In solution to this issue, Velicu et al [18] relied on the Spanish standard NBE-AE88, adapted
by the Titan Tracker company for the specific case of wind action on platforms with the
whole range of tilt angles. As the figure below shows, the force coefficients were computed
by averaging the minimal and maximal pressure coefficients on the panel using the following
equation:
𝑐𝑓 =𝑐𝑓1 + 𝑐𝑓2
2
Figure 16- Diagram of pressure coefficient distribution on a tilted platform [18]
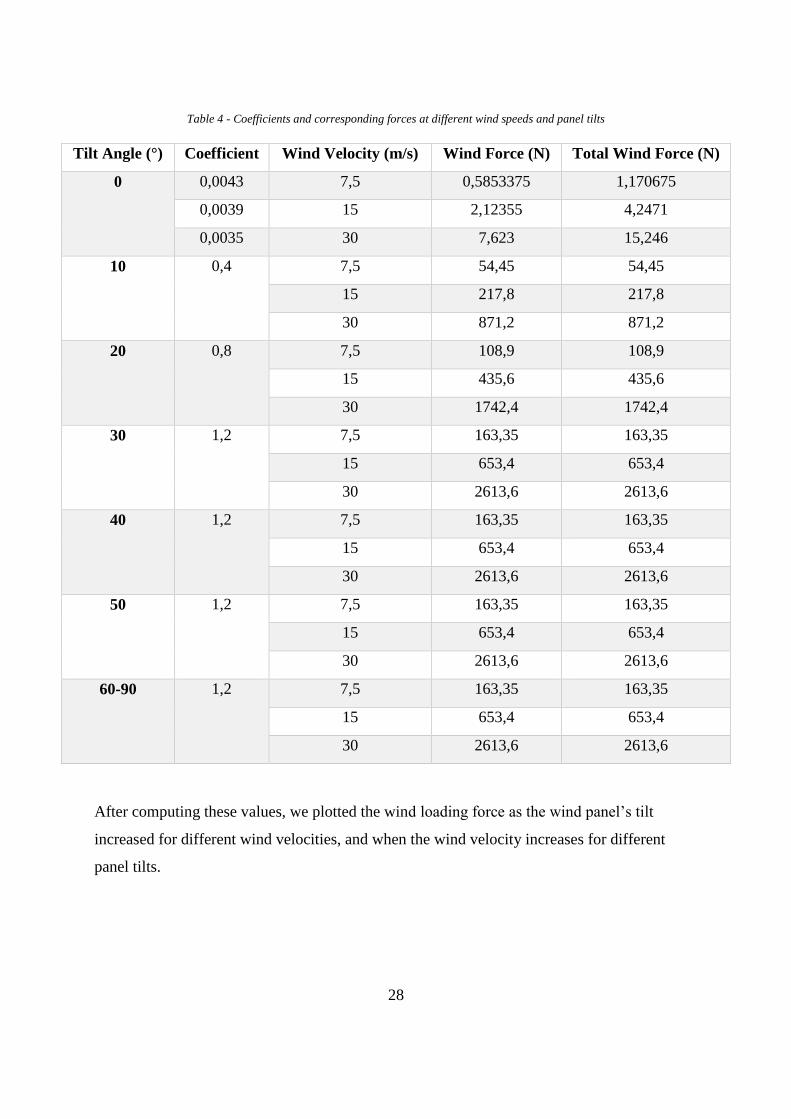
The resulting coefficients accounting for both sides of the panel are summarized in the table
below, along with the different wind speeds and forces on the solar panel.
28
Table 4 - Coefficients and corresponding forces at different wind speeds and panel tilts
Tilt Angle (°) Coefficient Wind Velocity (m/s) Wind Force (N) Total Wind Force (N)
0 0,0043 7,5 0,5853375 1,170675
0,0039 15 2,12355 4,2471
0,0035 30 7,623 15,246
10 0,4 7,5 54,45 54,45
15 217,8 217,8
30 871,2 871,2
20 0,8 7,5 108,9 108,9
15 435,6 435,6
30 1742,4 1742,4
30 1,2 7,5 163,35 163,35
15 653,4 653,4
30 2613,6 2613,6
40 1,2 7,5 163,35 163,35
15 653,4 653,4
30 2613,6 2613,6
50 1,2 7,5 163,35 163,35
15 653,4 653,4
30 2613,6 2613,6
60-90 1,2 7,5 163,35 163,35
15 653,4 653,4
30 2613,6 2613,6
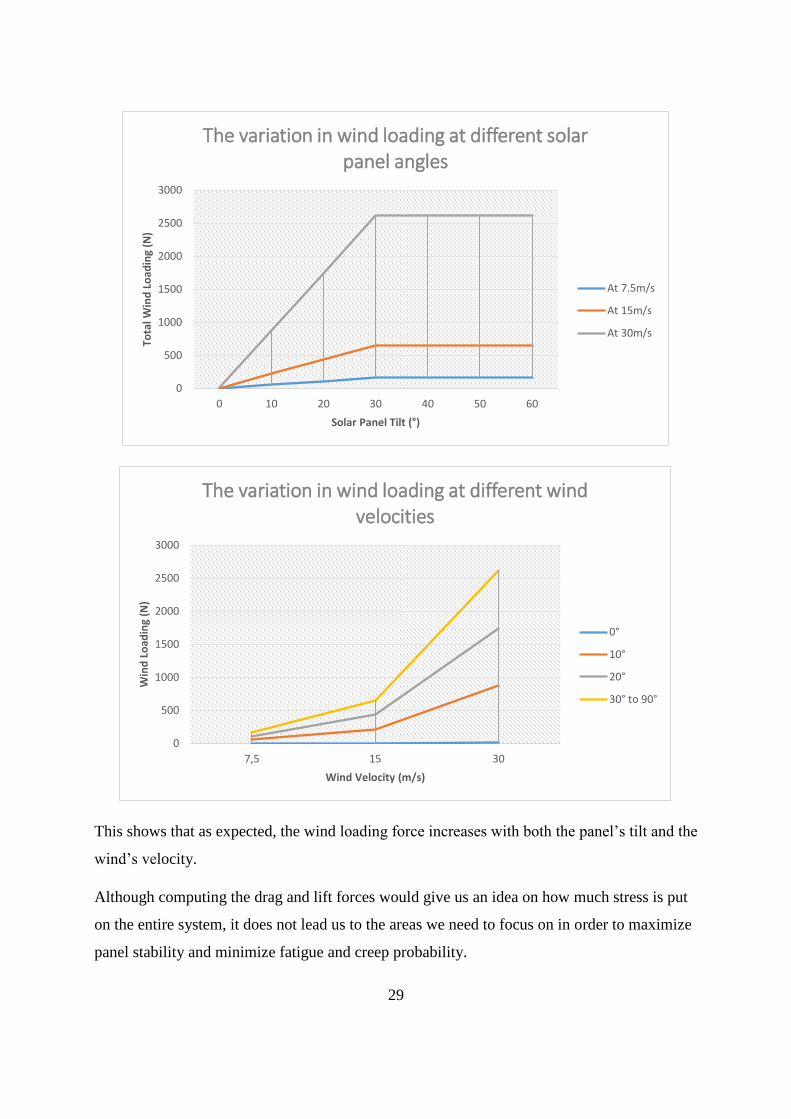
After computing these values, we plotted the wind loading force as the wind panel’s tilt
increased for different wind velocities, and when the wind velocity increases for different
panel tilts.
29
This shows that as expected, the wind loading force increases with both the panel’s tilt and the
wind’s velocity.
Although computing the drag and lift forces would give us an idea on how much stress is put
on the entire system, it does not lead us to the areas we need to focus on in order to maximize
panel stability and minimize fatigue and creep probability.
0
500
1000
1500
2000
2500
3000
0 10 20 30 40 50 60
Tota
l Win
d L
oad
ing
(N)
Solar Panel Tilt (°)
The variation in wind loading at different solar panel angles
At 7.5m/s
At 15m/s
At 30m/s
0
500
1000
1500
2000
2500
3000
7,5 15 30
Win
d L
oad
ing
(N)
Wind Velocity (m/s)
The variation in wind loading at different wind velocities
0°
10°
20°
30° to 90°
30
The most efficient solution to this issue is to use a CAD design tool to simulate the wind on
the panel and
SolidWorks Simulation
a) Simulation Process
The Software used in order to simulate wind flow across the surface of the tracker is
SolidWorks. SolidWorks is a solid modeling Computer-Aided Design and Computer-Aided
Engineering program that runs on Microsoft Windows. SolidWorks is published by Dassault
Systèmes. It allows the user to create parts in 3-d format, assemble the parts, and run different
simulations and calculations on them.
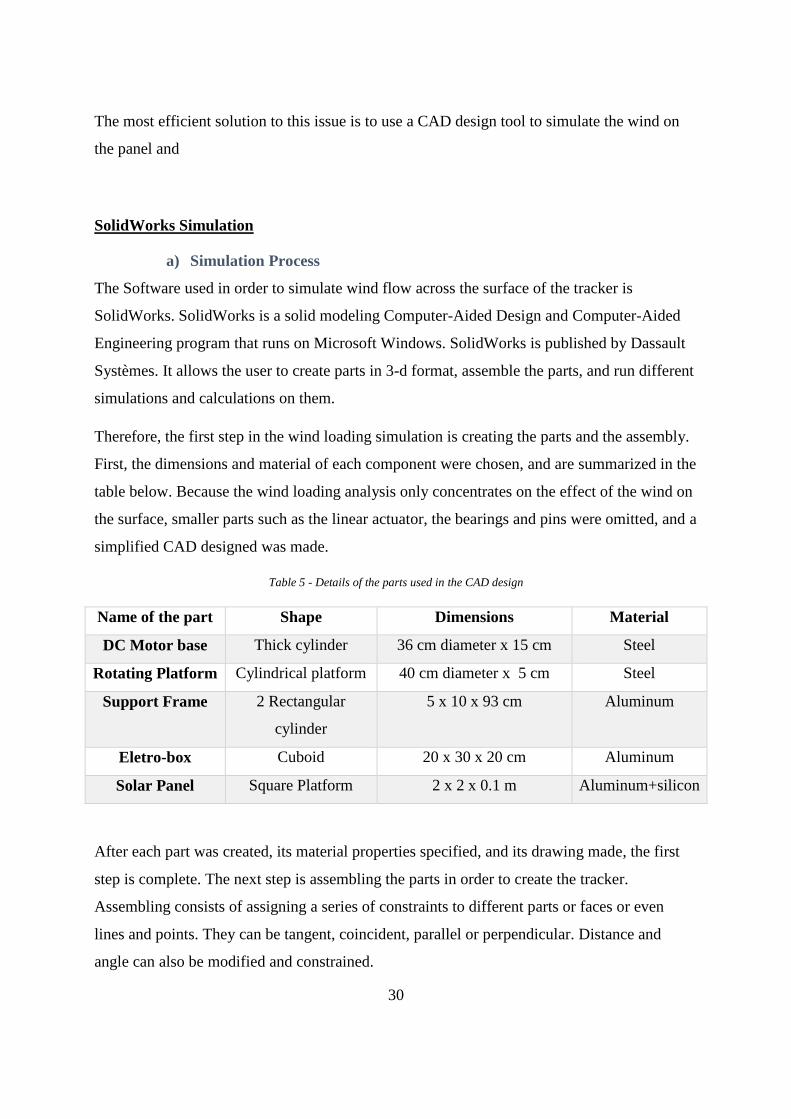
Therefore, the first step in the wind loading simulation is creating the parts and the assembly.
First, the dimensions and material of each component were chosen, and are summarized in the
table below. Because the wind loading analysis only concentrates on the effect of the wind on
the surface, smaller parts such as the linear actuator, the bearings and pins were omitted, and a
simplified CAD designed was made.
Table 5 - Details of the parts used in the CAD design
Name of the part Shape Dimensions Material
DC Motor base Thick cylinder 36 cm diameter x 15 cm Steel
Rotating Platform Cylindrical platform 40 cm diameter x 5 cm Steel
Support Frame 2 Rectangular
cylinder
5 x 10 x 93 cm Aluminum
Eletro-box Cuboid 20 x 30 x 20 cm Aluminum
Solar Panel Square Platform 2 x 2 x 0.1 m Aluminum+silicon
After each part was created, its material properties specified, and its drawing made, the first
step is complete. The next step is assembling the parts in order to create the tracker.
Assembling consists of assigning a series of constraints to different parts or faces or even
lines and points. They can be tangent, coincident, parallel or perpendicular. Distance and
angle can also be modified and constrained.
31
After the assembly is complete, the following phase is the flow simulation. A great facet of
SolidWorks is that it allows the user to make use of many add-ins, such as SolidWorks
Simulation and SolidWorks Motion. For the purposes of this project, we opted for
SolidWorks Flow Simulation to calculate the loading of the wind on the tracker.
SolidWorks Flow Simulation uses Computational Fluid Dynamics (CFD) analysis to enable
quick, efficient simulation of fluid flow and heat transfer. It allows accurate calculations of
fluid forces as well as the impact of a liquid or gas on product performance.
CFD simulates fluid passing through or around an object, and has been used in literature
whose authors were assessing the impact of wind speeds on solar trackers. The analysis can
be very complex—for example, containing in one calculation heat transfer, mixing, and
unsteady and compressible flows. The ability to predict the impact of such flows on the
object’s performance is time consuming and costly without some form of simulation tool.
The next step in the simulation process is the CFD analysis on SolidWorks. First, the user has
to start the Flow Simulation Wizard. Then, the specification of the unit system as well as the
type of analysis is demanded. For this project, external analysis must be chosen. Afterwards,
the fluid in question is to be selected (air for this project). The last step is determining the
initial conditions, at which point the selected velocity should be typed in the velocity in x-
direction box.
The user must also choose the mesh specifications. The fluid volume is meshed into a grid for
the simulation to proceed. This is similar to the mesh used in finite element analysis, where
the geometry of the element is distributed into discrete cells. In order to get accurate results,
the computational mesh for all nine calculations was kept similar, with a computational
domain of 2.5m in the x-direction, 2.5m in the z-direction and 2.5 in the y-direction.
After specifying the goals (forces and stresses to be computed by the software), the flow
simulation is run and iterations begin. Each iteration is the algorithm’s attempt to find more
accurate results. The average of iterations in this project was 112 iterations.
In total, three assemblies were built. The first had the panel fixed at 0° from the horizontal.
The second was at 45° from the horizontal, and the third was at 80° from the horizontal, since
the other components of the tracker prevent the assembly from reaching 90° perfectly. The
32
only changes that were made for each assembly were the velocity of the wind during each
CFD Flow Simulation. The simulations took approximatively 3 hours on average to compute
and solve. Results of the simulation were bunched based on the velocity of wind acting on the
tracker.
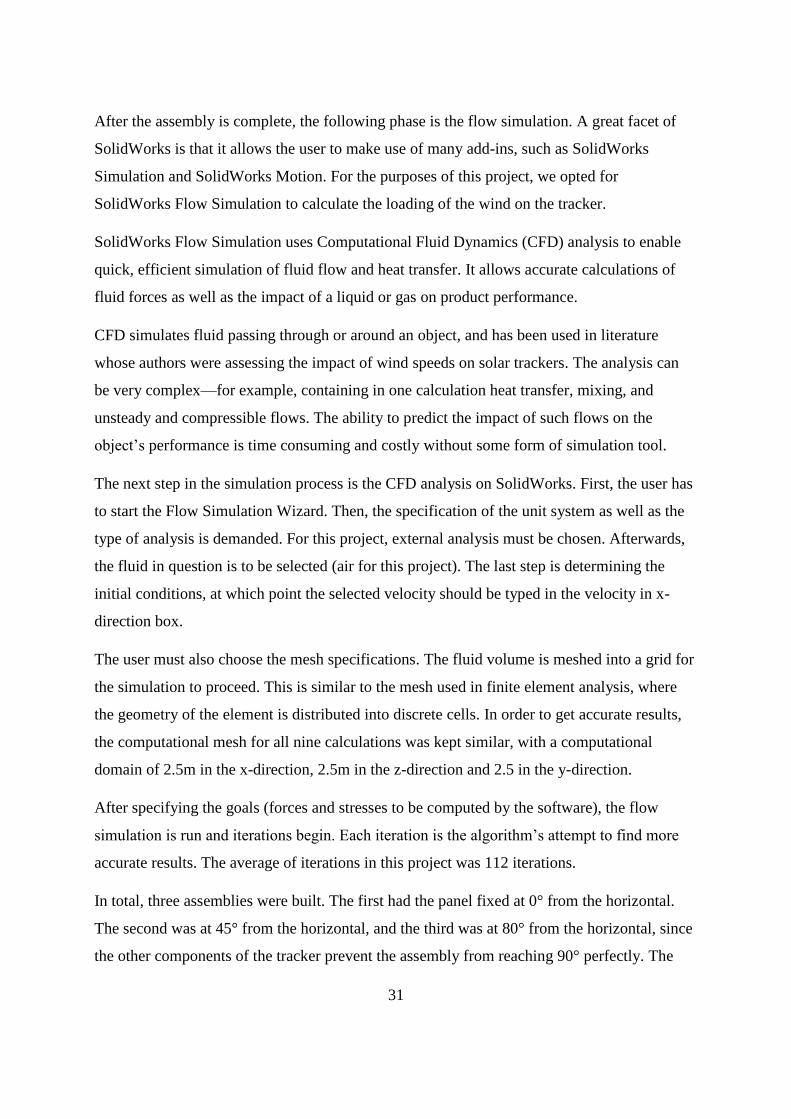
b) Simulation results
1. At 7.5 m/s:
For the panel at a 0° from the horizontal:
Top view
33
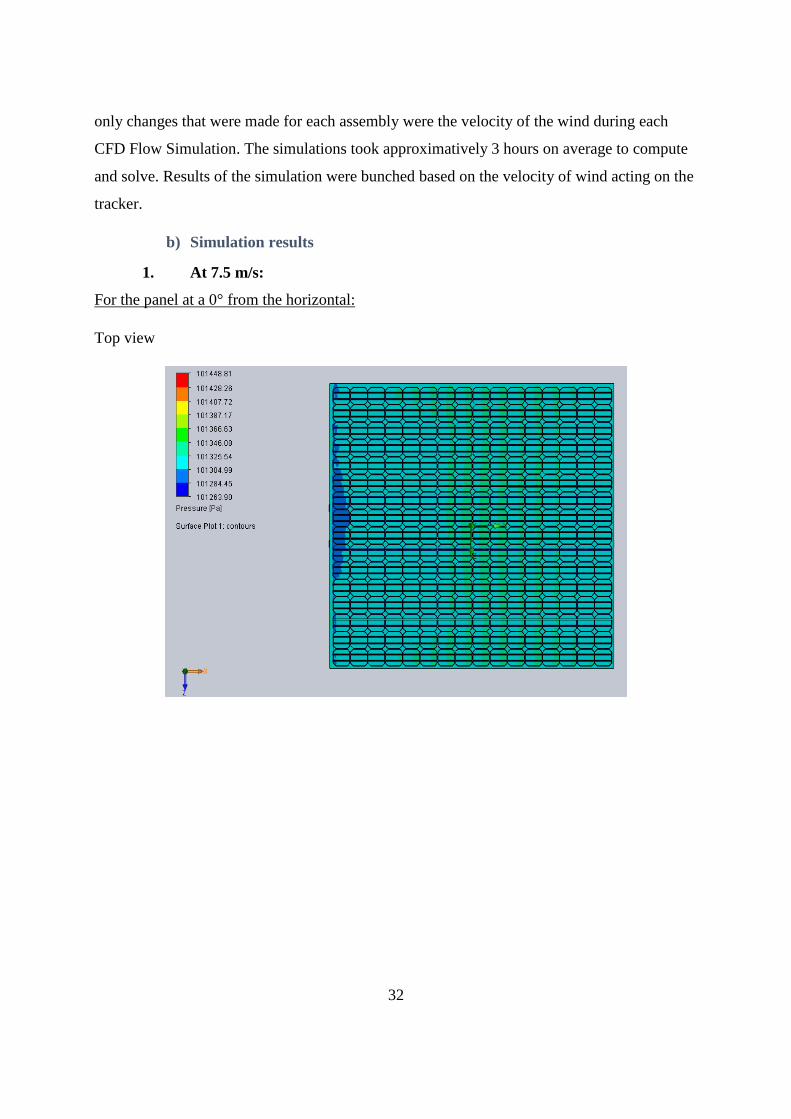
Front View:
For the panel at 45° from the horizontal:
Rear view:
34
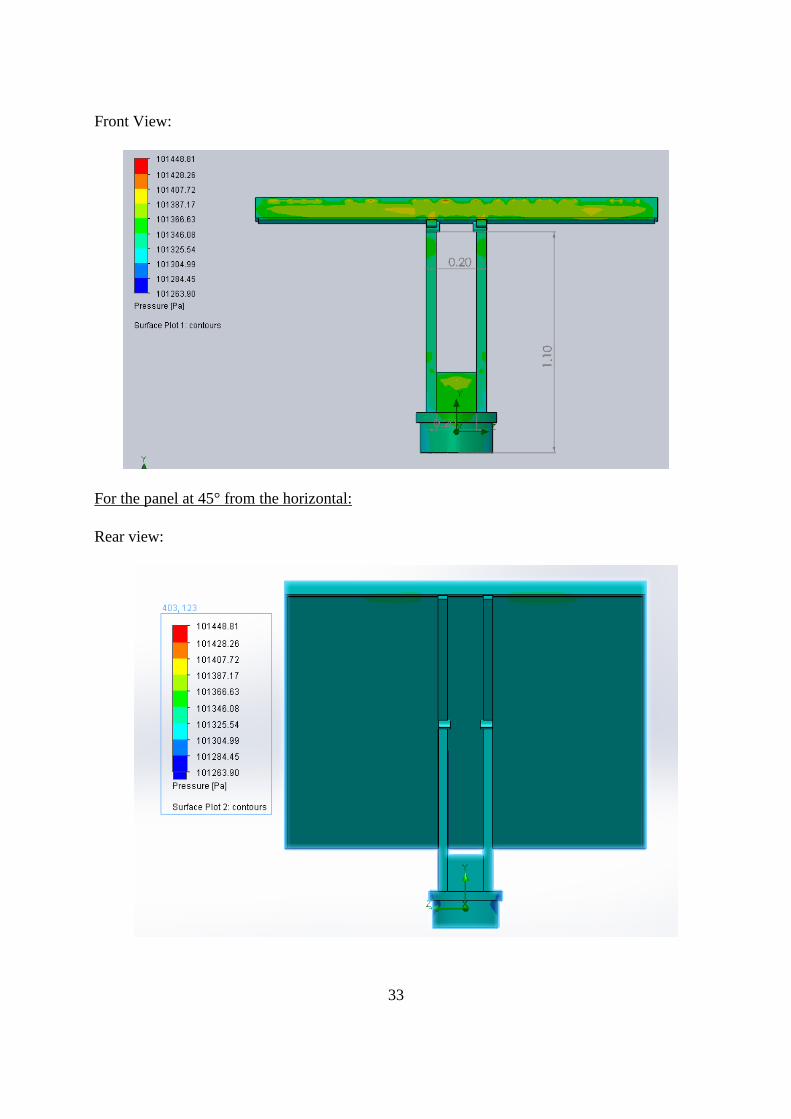
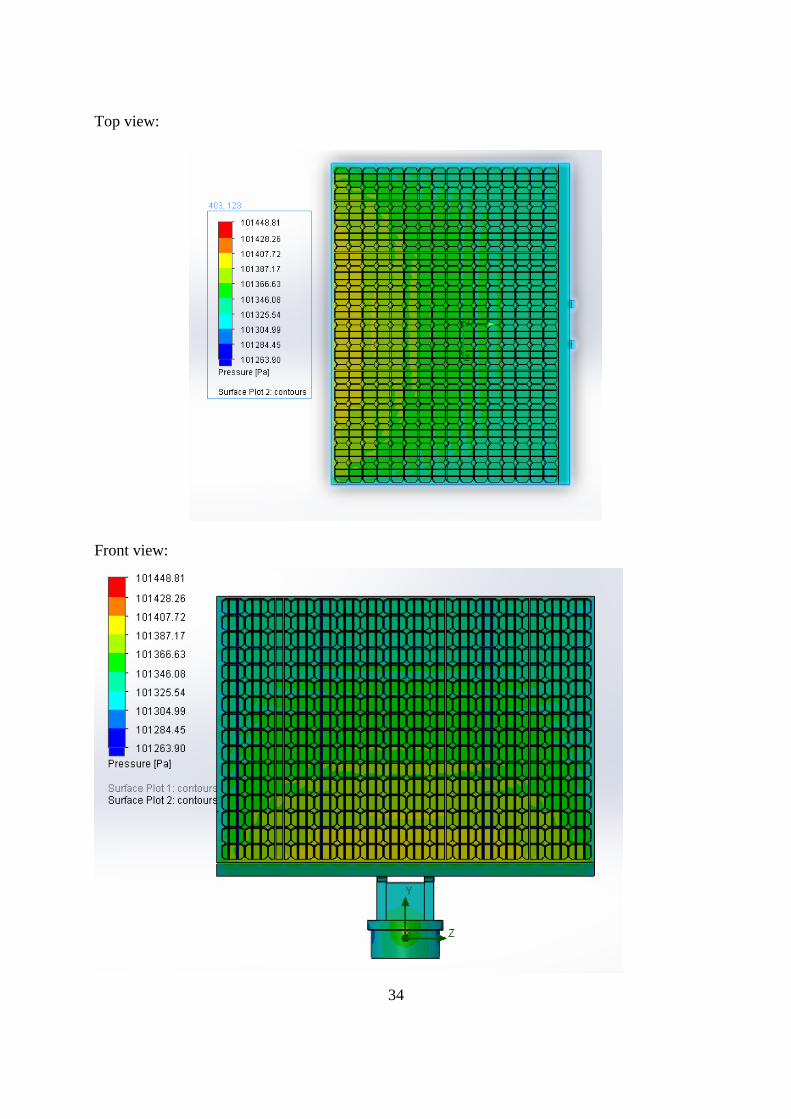
Top view:
Front view:
35
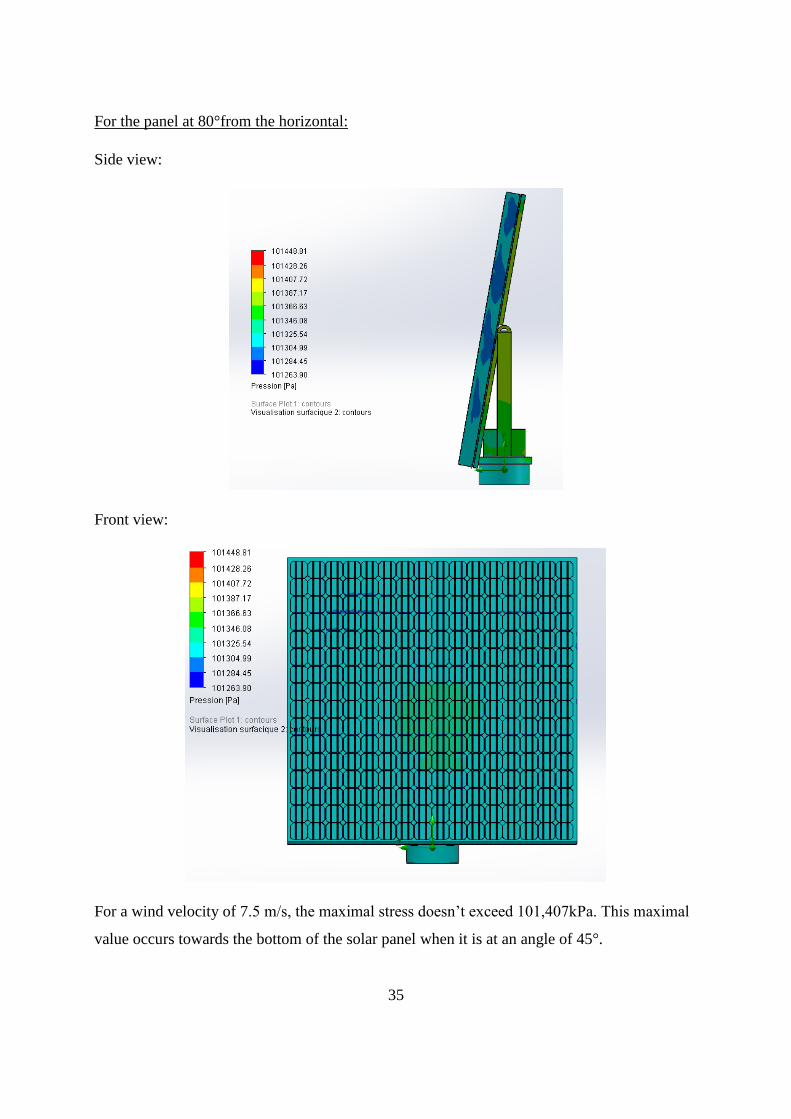
For the panel at 80°from the horizontal:
Side view:
Front view:
For a wind velocity of 7.5 m/s, the maximal stress doesn’t exceed 101,407kPa. This maximal
value occurs towards the bottom of the solar panel when it is at an angle of 45°.
36
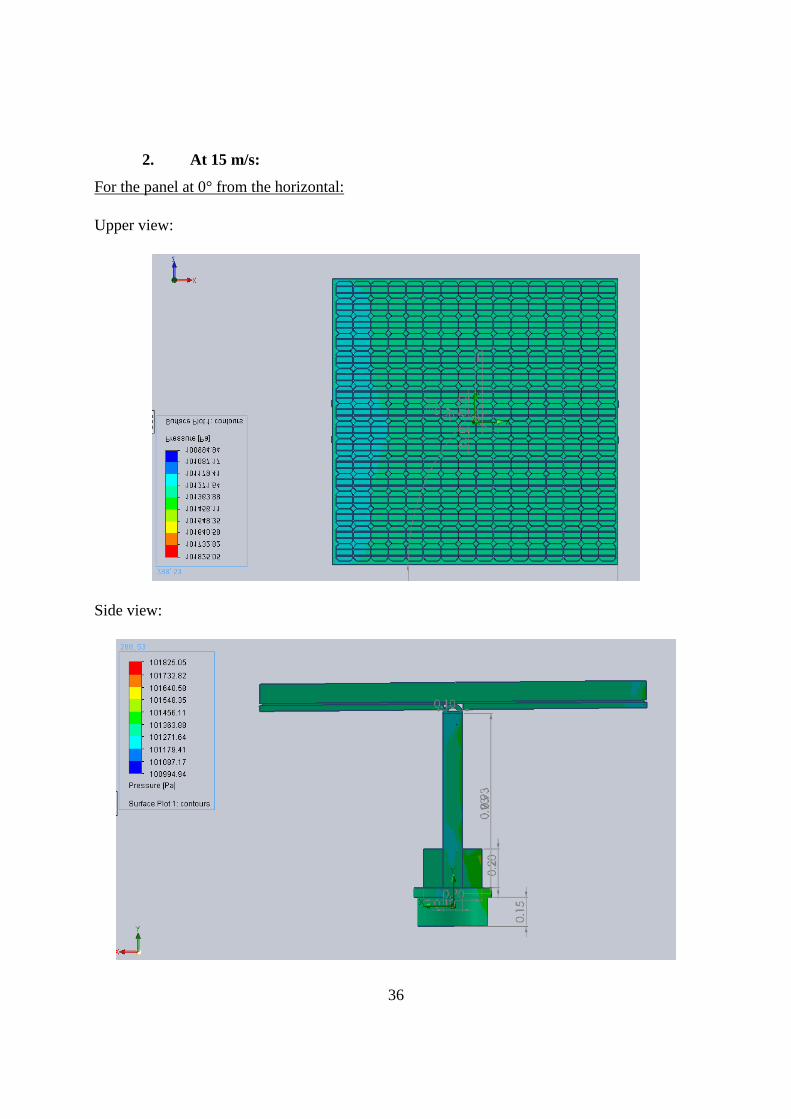
2. At 15 m/s:
For the panel at 0° from the horizontal:
Upper view:
Side view:
37
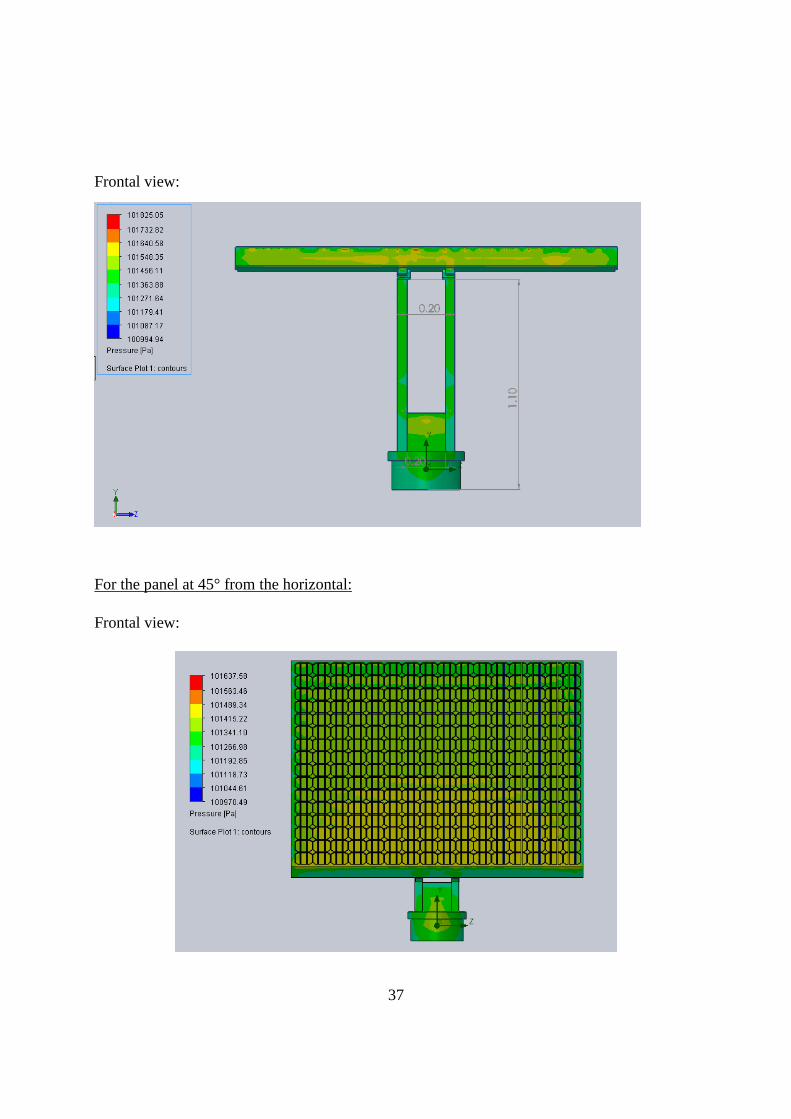
Frontal view:
For the panel at 45° from the horizontal:
Frontal view:
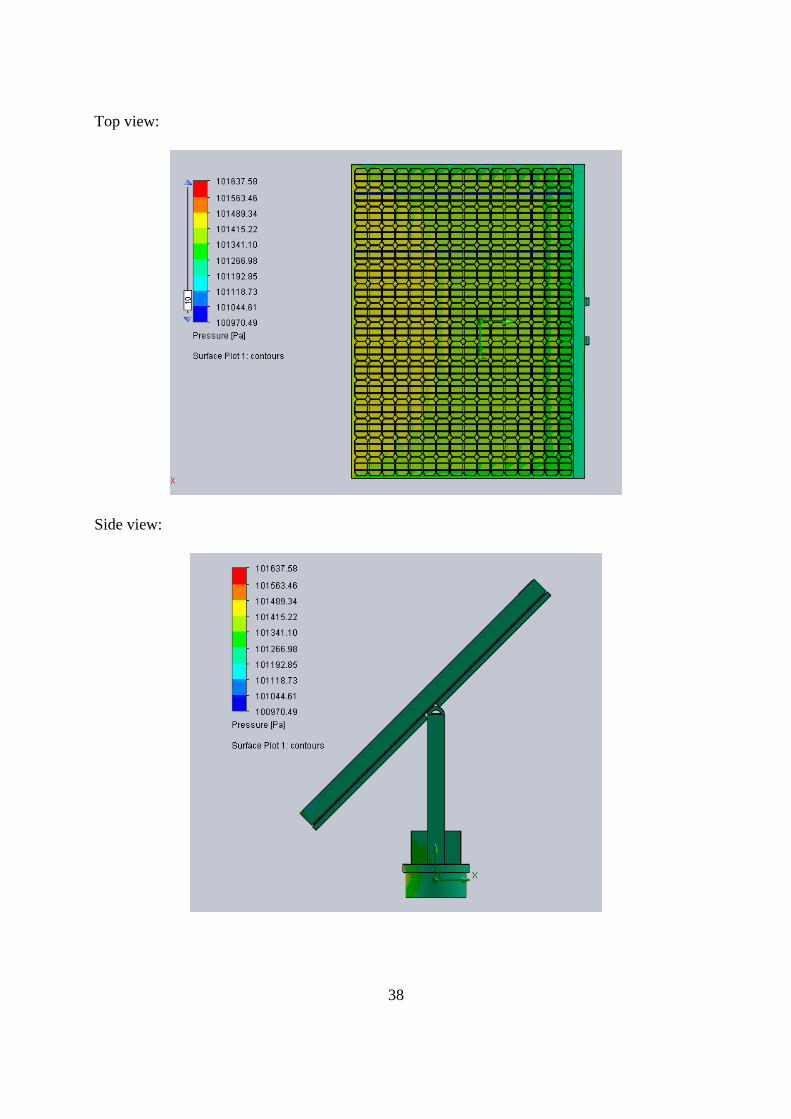
38
Top view:
Side view:
39
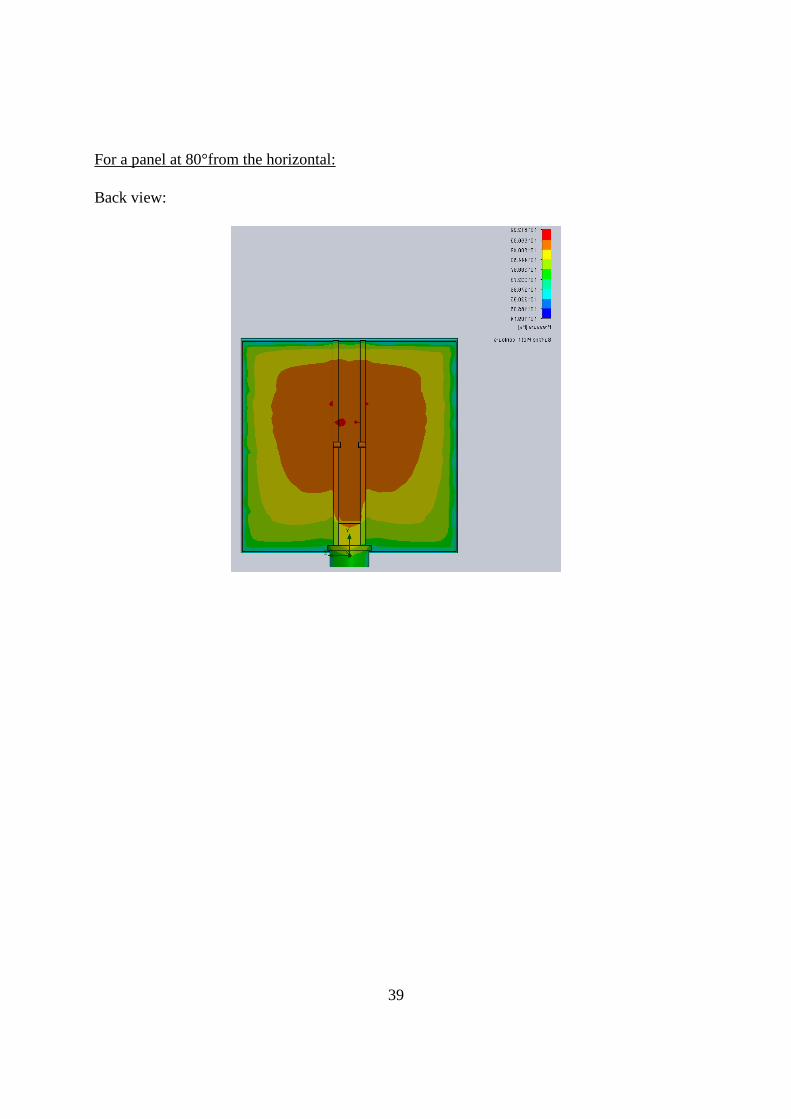
For a panel at 80°from the horizontal:
Back view:
40
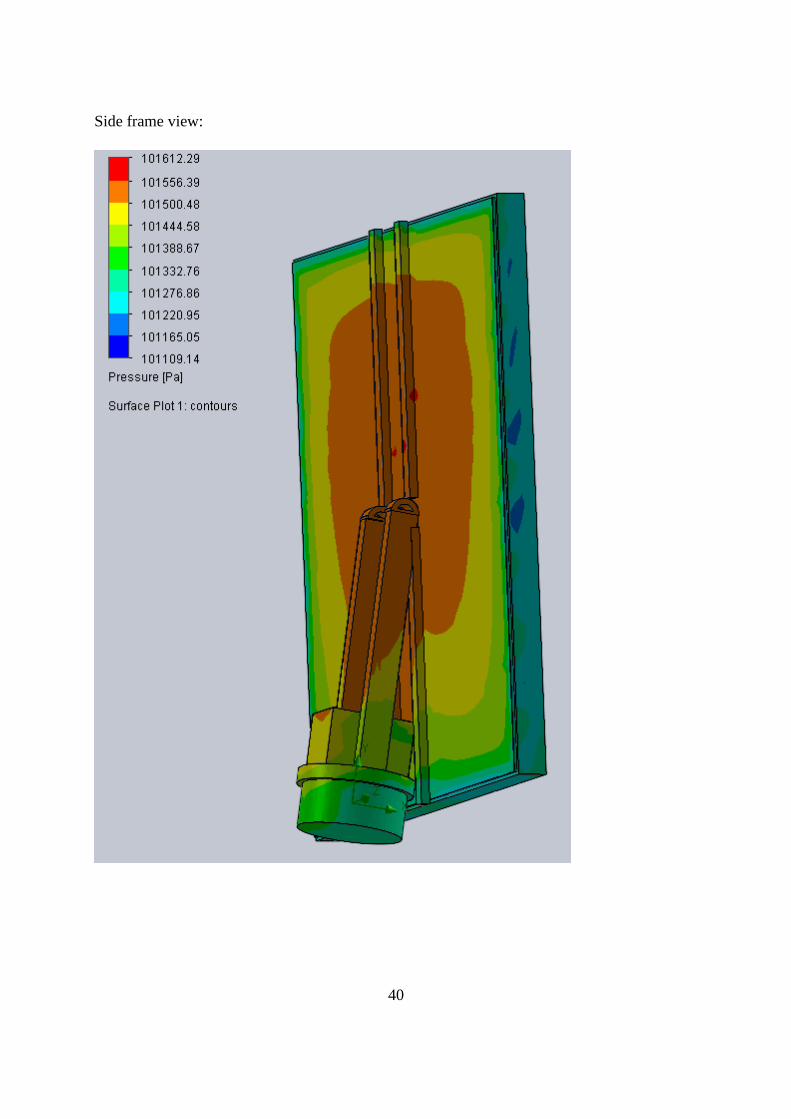
Side frame view:
41
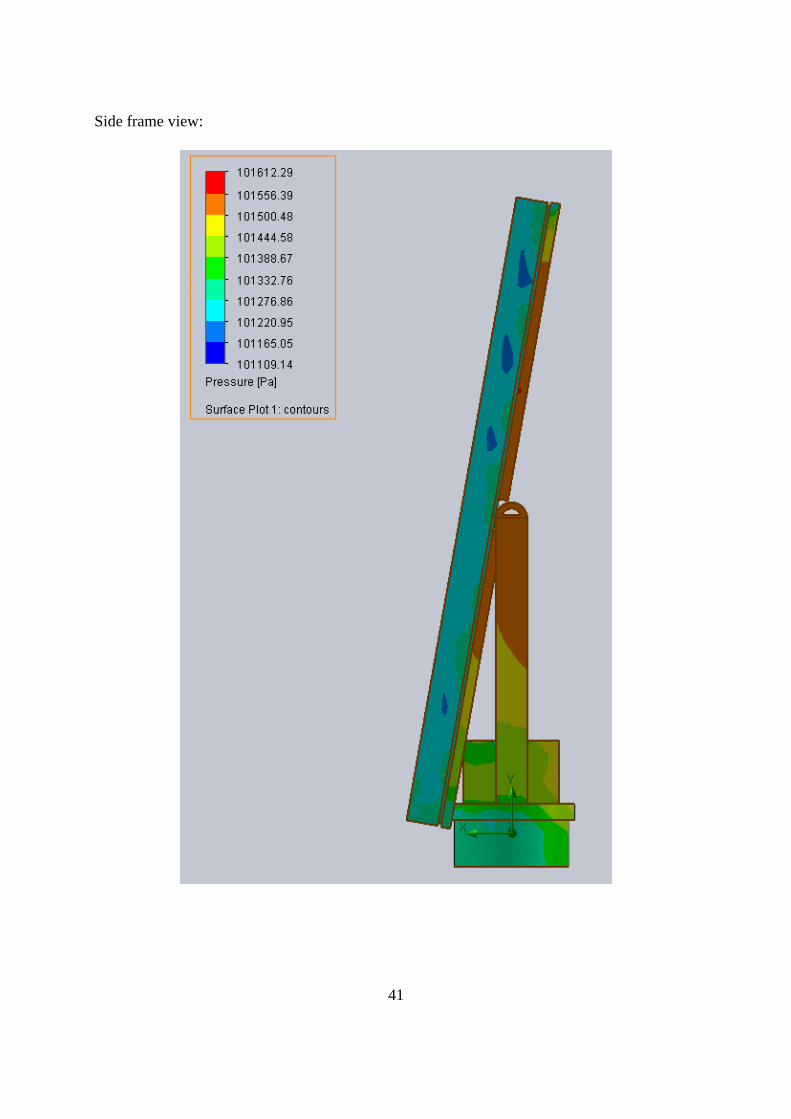
Side frame view:
42
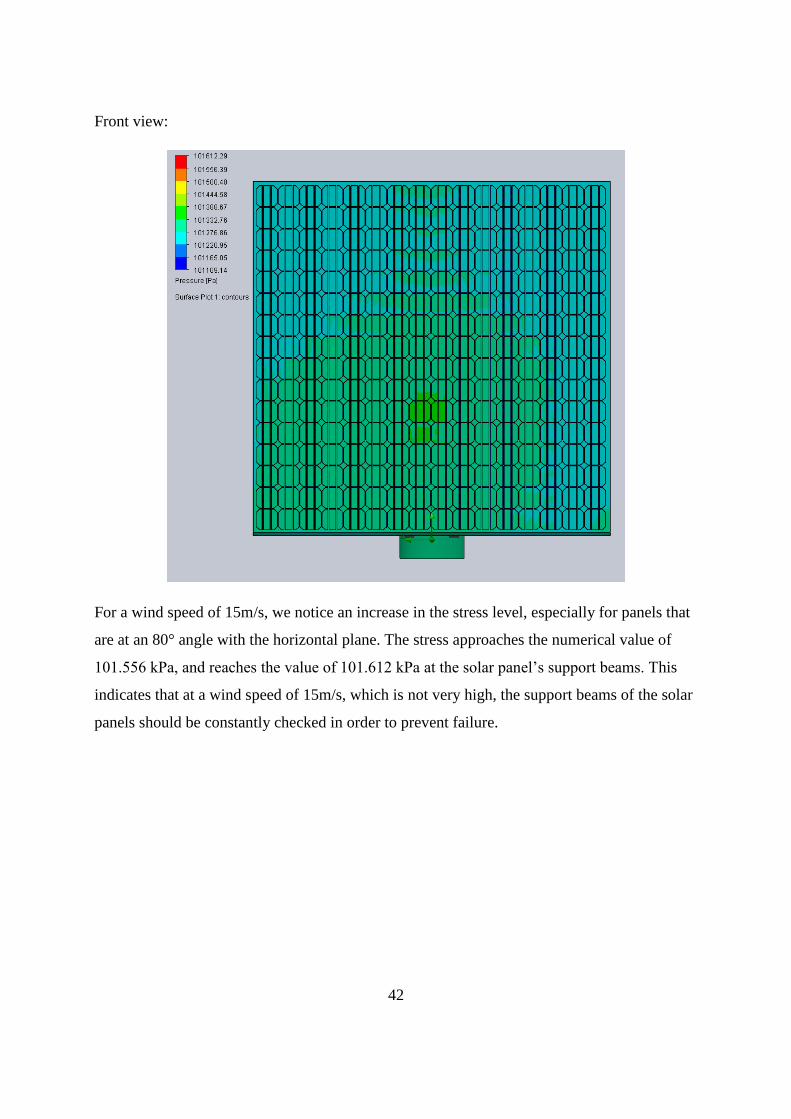
Front view:
For a wind speed of 15m/s, we notice an increase in the stress level, especially for panels that
are at an 80° angle with the horizontal plane. The stress approaches the numerical value of
101.556 kPa, and reaches the value of 101.612 kPa at the solar panel’s support beams. This
indicates that at a wind speed of 15m/s, which is not very high, the support beams of the solar
panels should be constantly checked in order to prevent failure.
43
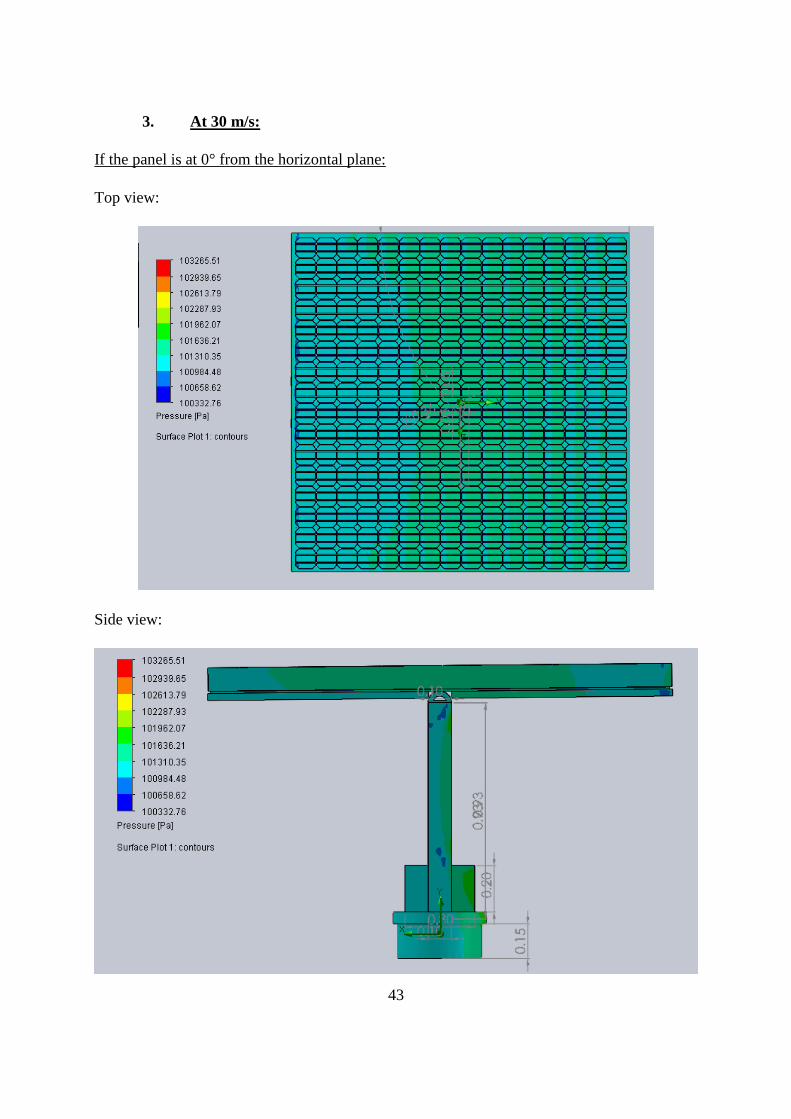
3. At 30 m/s:
If the panel is at 0° from the horizontal plane:
Top view:
Side view:
44
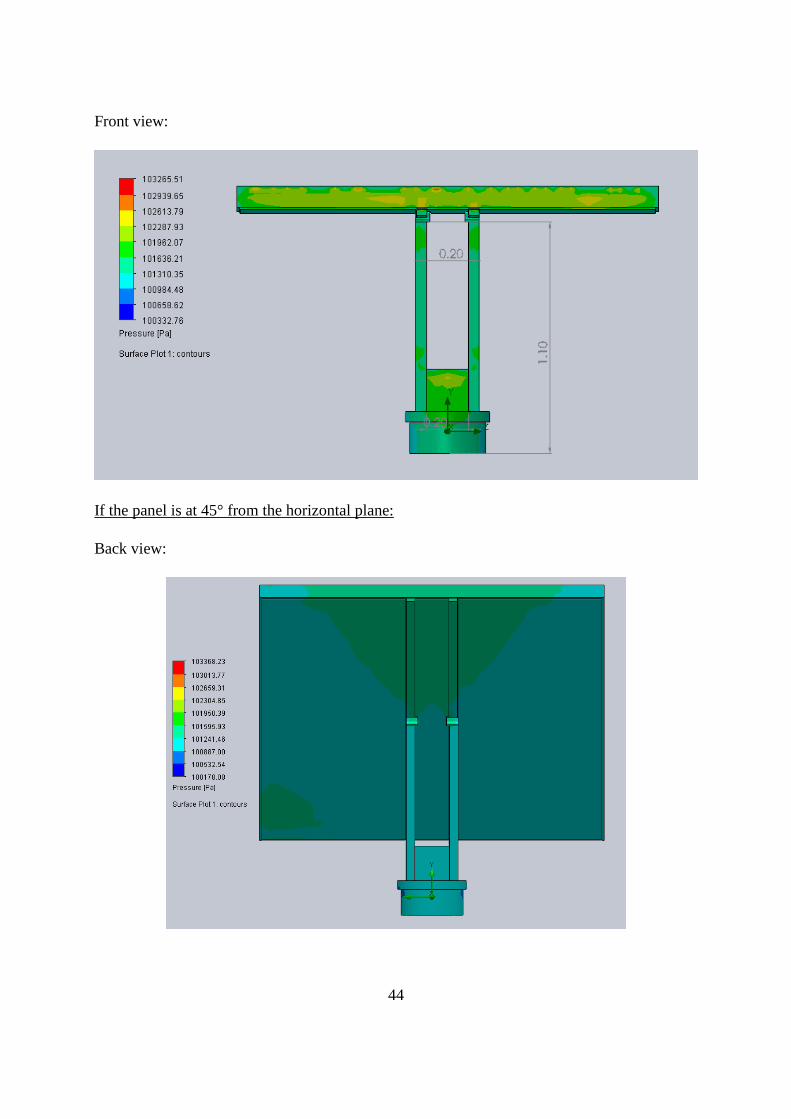
Front view:
If the panel is at 45° from the horizontal plane:
Back view:
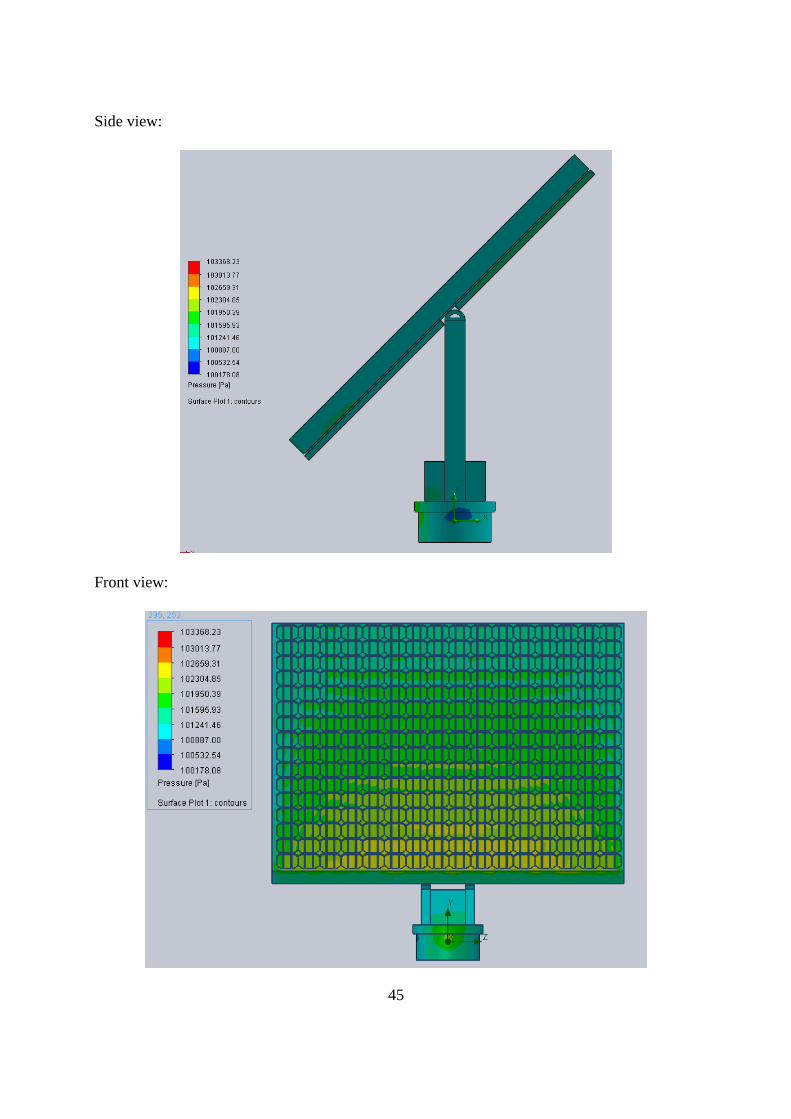
45
Side view:
Front view:
46
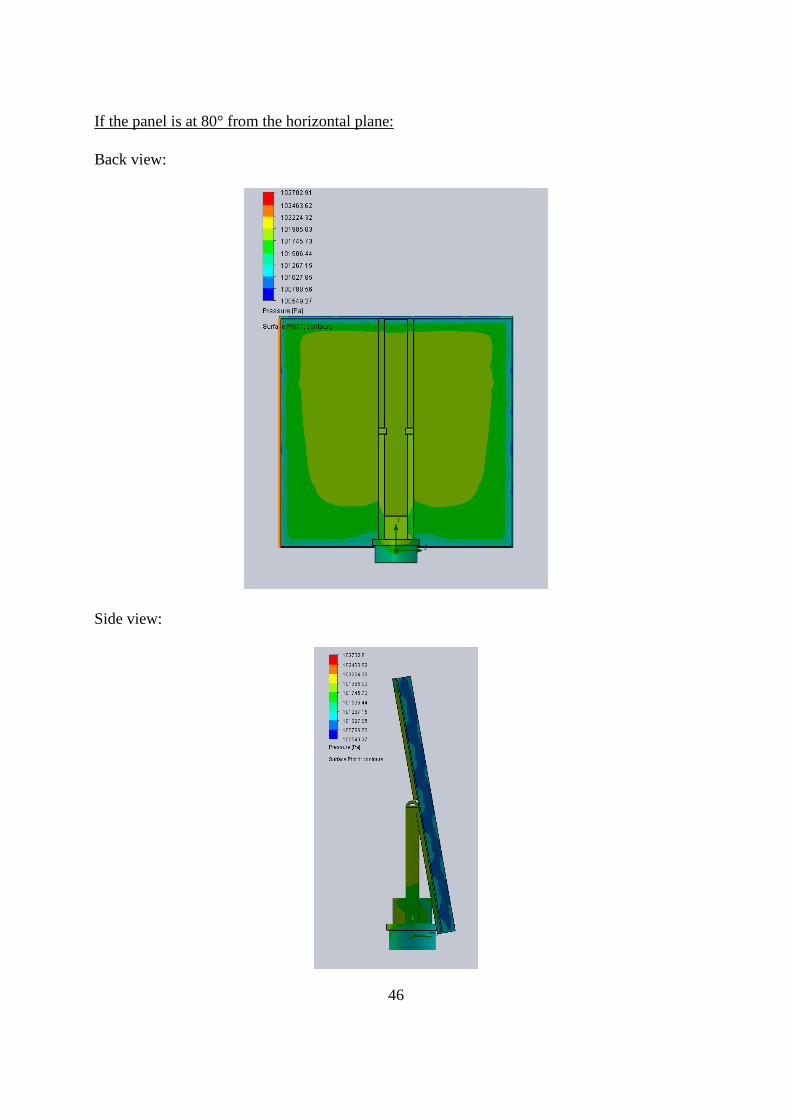
If the panel is at 80° from the horizontal plane:
Back view:
Side view:
47
Front view:
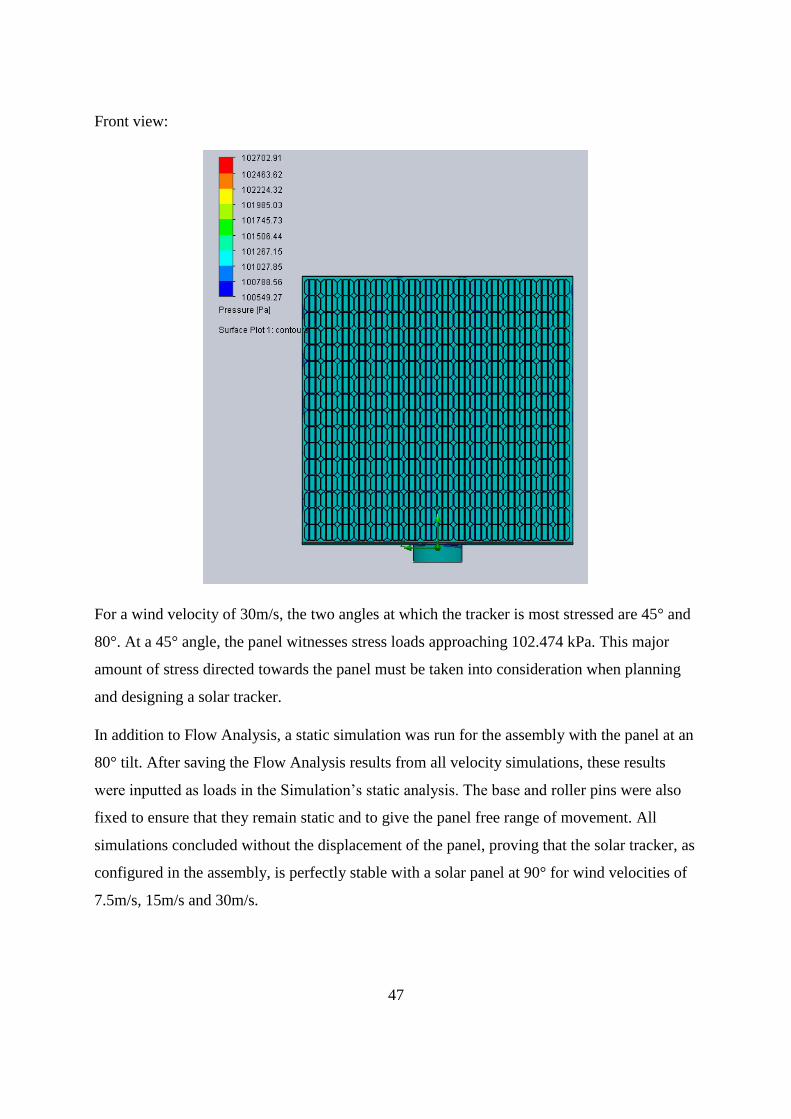
For a wind velocity of 30m/s, the two angles at which the tracker is most stressed are 45° and
80°. At a 45° angle, the panel witnesses stress loads approaching 102.474 kPa. This major
amount of stress directed towards the panel must be taken into consideration when planning
and designing a solar tracker.
In addition to Flow Analysis, a static simulation was run for the assembly with the panel at an
80° tilt. After saving the Flow Analysis results from all velocity simulations, these results
were inputted as loads in the Simulation’s static analysis. The base and roller pins were also
fixed to ensure that they remain static and to give the panel free range of movement. All
simulations concluded without the displacement of the panel, proving that the solar tracker, as
configured in the assembly, is perfectly stable with a solar panel at 90° for wind velocities of
7.5m/s, 15m/s and 30m/s.
48
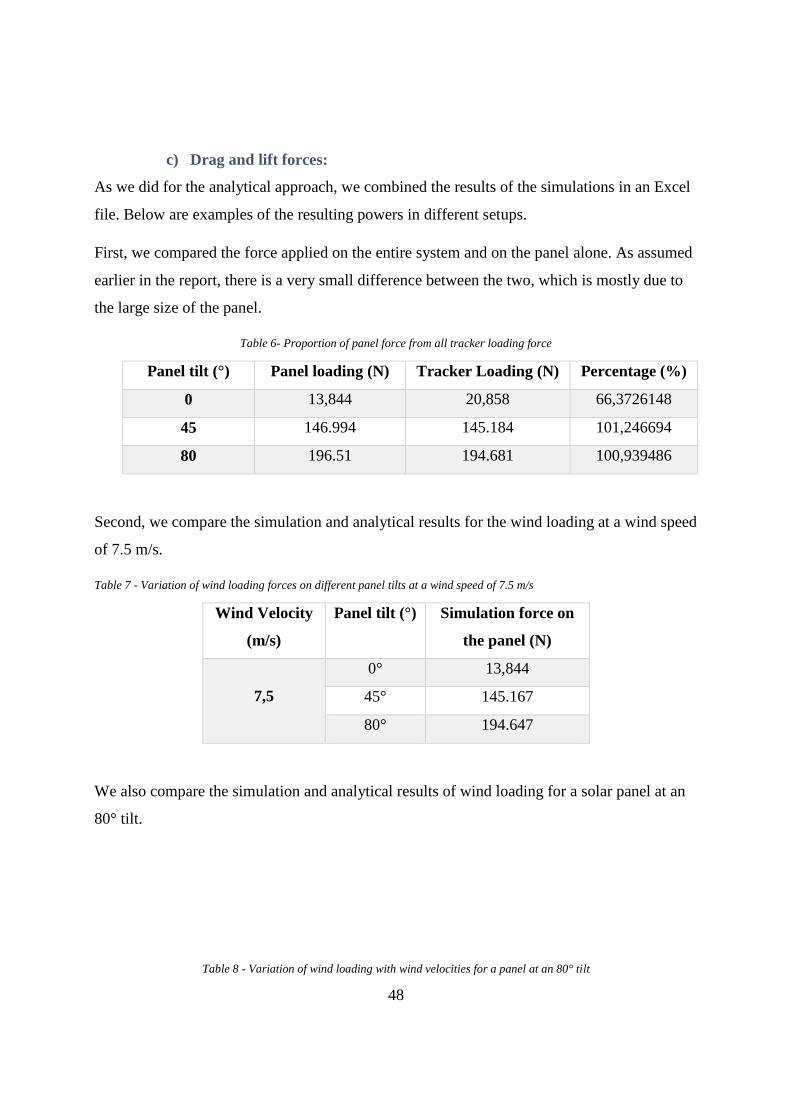
c) Drag and lift forces:
As we did for the analytical approach, we combined the results of the simulations in an Excel
file. Below are examples of the resulting powers in different setups.
First, we compared the force applied on the entire system and on the panel alone. As assumed
earlier in the report, there is a very small difference between the two, which is mostly due to
the large size of the panel.
Table 6- Proportion of panel force from all tracker loading force
Panel tilt (°) Panel loading (N) Tracker Loading (N) Percentage (%)
0 13,844 20,858 66,3726148
45 146.994 145.184 101,246694
80 196.51 194.681 100,939486
Second, we compare the simulation and analytical results for the wind loading at a wind speed
of 7.5 m/s.
Table 7 - Variation of wind loading forces on different panel tilts at a wind speed of 7.5 m/s
Wind Velocity
(m/s)
Panel tilt (°) Simulation force on
the panel (N)
7,5
0° 13,844
45° 145.167
80° 194.647
We also compare the simulation and analytical results of wind loading for a solar panel at an
80° tilt.
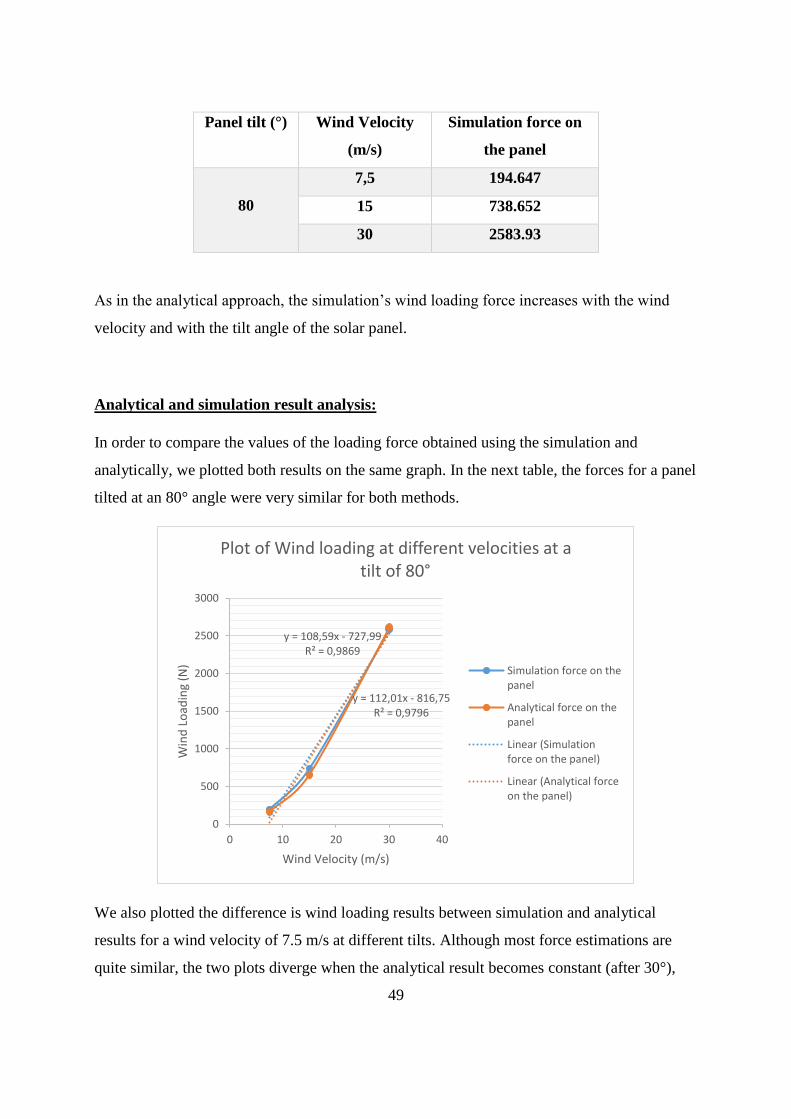
Table 8 - Variation of wind loading with wind velocities for a panel at an 80° tilt
49
Panel tilt (°) Wind Velocity
(m/s)
Simulation force on
the panel
80
7,5 194.647
15 738.652
30 2583.93
As in the analytical approach, the simulation’s wind loading force increases with the wind
velocity and with the tilt angle of the solar panel.
Analytical and simulation result analysis:
In order to compare the values of the loading force obtained using the simulation and
analytically, we plotted both results on the same graph. In the next table, the forces for a panel
tilted at an 80° angle were very similar for both methods.
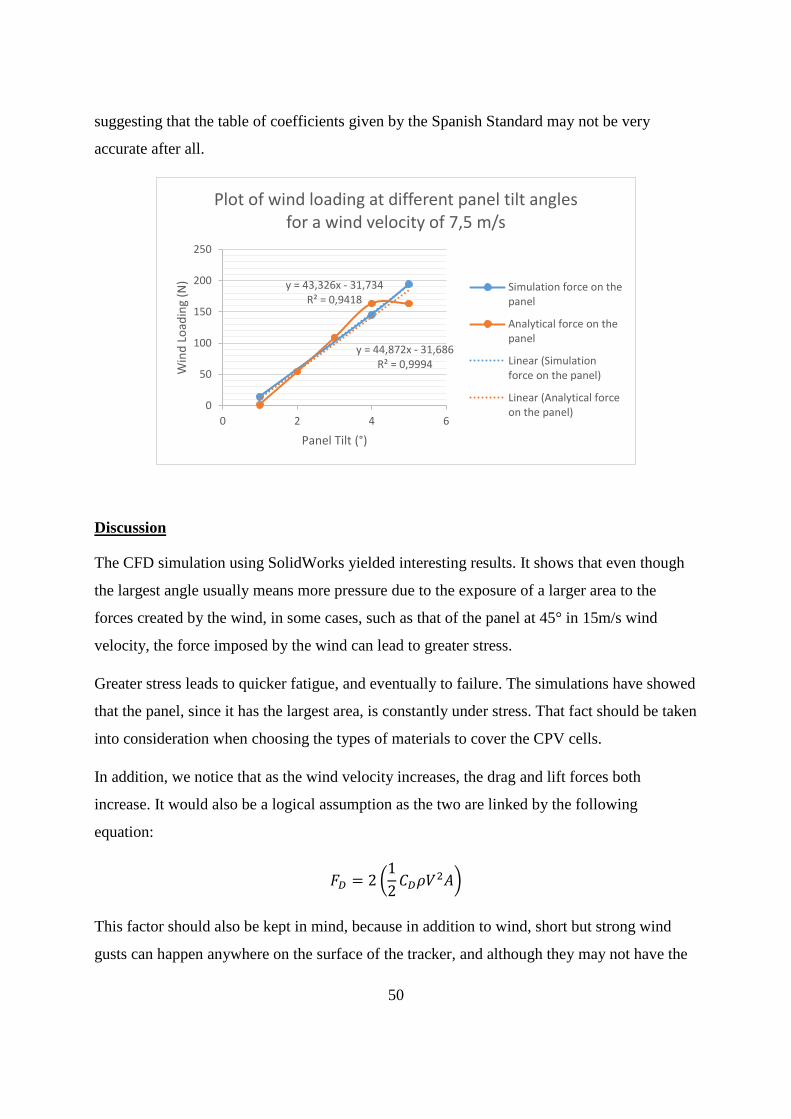
We also plotted the difference is wind loading results between simulation and analytical
results for a wind velocity of 7.5 m/s at different tilts. Although most force estimations are
quite similar, the two plots diverge when the analytical result becomes constant (after 30°),
y = 108,59x - 727,99R² = 0,9869
y = 112,01x - 816,75R² = 0,9796
0
500
1000
1500
2000
2500
3000
0 10 20 30 40
Win
d L
oad
ing
(N)
Wind Velocity (m/s)
Plot of Wind loading at different velocities at a tilt of 80°
Simulation force on thepanel
Analytical force on thepanel
Linear (Simulationforce on the panel)
Linear (Analytical forceon the panel)
50
suggesting that the table of coefficients given by the Spanish Standard may not be very
accurate after all.
Discussion
The CFD simulation using SolidWorks yielded interesting results. It shows that even though
the largest angle usually means more pressure due to the exposure of a larger area to the
forces created by the wind, in some cases, such as that of the panel at 45° in 15m/s wind
velocity, the force imposed by the wind can lead to greater stress.
Greater stress leads to quicker fatigue, and eventually to failure. The simulations have showed
that the panel, since it has the largest area, is constantly under stress. That fact should be taken
into consideration when choosing the types of materials to cover the CPV cells.
In addition, we notice that as the wind velocity increases, the drag and lift forces both
increase. It would also be a logical assumption as the two are linked by the following
equation:
𝐹𝐷 = 2 (1
2𝐶𝐷𝜌𝑉2𝐴)
This factor should also be kept in mind, because in addition to wind, short but strong wind
gusts can happen anywhere on the surface of the tracker, and although they may not have the
y = 44,872x - 31,686R² = 0,9994
y = 43,326x - 31,734R² = 0,9418
0
50
100
150
200
250
0 2 4 6
Win
d L
oad
ing
(N)
Panel Tilt (°)
Plot of wind loading at different panel tilt angles for a wind velocity of 7,5 m/s
Simulation force on thepanel
Analytical force on thepanel
Linear (Simulationforce on the panel)
Linear (Analytical forceon the panel)
51
lasting effect of the wind, their velocities tend to be high, thus the usefulness of the equation
above in estimating the force to be endured by the tracker.
The calculation of the loading forces is essential before finalizing the design of the solar
tracker. Because of this simulation and calculations, the designer would know:
The areas most sensitive to stress caused by wind loading.
The additional force to be taken into consideration during the static design of
the CPV tracker.
The necessity of implementing an algorithm that would identify dangerously
high wind velocities and turn the tracker to a safe position.
The main material used in the design of this CPV Tracker is steel. The minimum yield
strength of steel is 247 MPa, and its smallest ultimate tensile strength is 400 MPa. These
values are both much higher than the stresses experienced by the tracker in all 9 simulations.
Therefore, there is no immediate deformation threat on the assembly, except the linking
elements, which should be selected from the strongest materials.
As shown by SolidWorks Static Simulation, the CPV tracker is very stable under all wind
velocities when the panel is at 80° from the horizontal. And since the highest loading forces
were measured in this position (highest tilt degree), it is safe to assume that the system will
also be stable for all other tilt angles with velocities of up to 30 m/s.
52
Cost Analysis
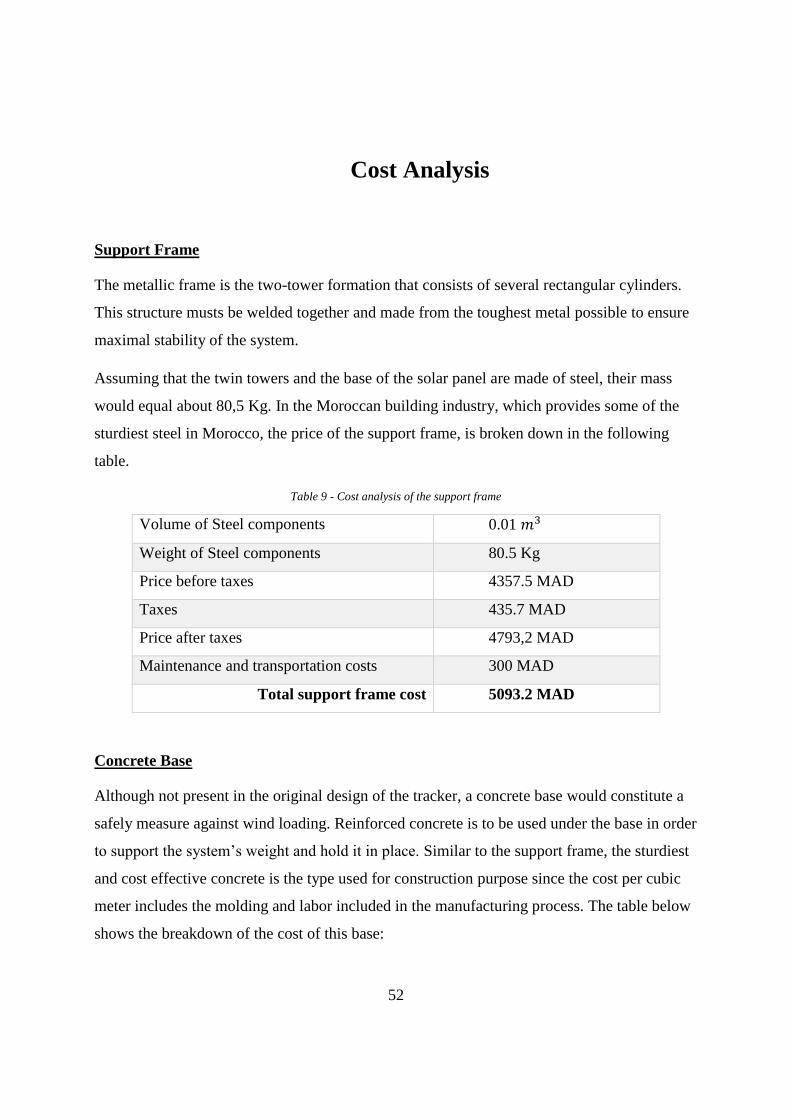
Support Frame
The metallic frame is the two-tower formation that consists of several rectangular cylinders.
This structure musts be welded together and made from the toughest metal possible to ensure
maximal stability of the system.
Assuming that the twin towers and the base of the solar panel are made of steel, their mass
would equal about 80,5 Kg. In the Moroccan building industry, which provides some of the
sturdiest steel in Morocco, the price of the support frame, is broken down in the following
table.
Table 9 - Cost analysis of the support frame
Volume of Steel components 0.01 𝑚3
Weight of Steel components 80.5 Kg
Price before taxes 4357.5 MAD
Taxes 435.7 MAD
Price after taxes 4793,2 MAD
Maintenance and transportation costs 300 MAD
Total support frame cost 5093.2 MAD
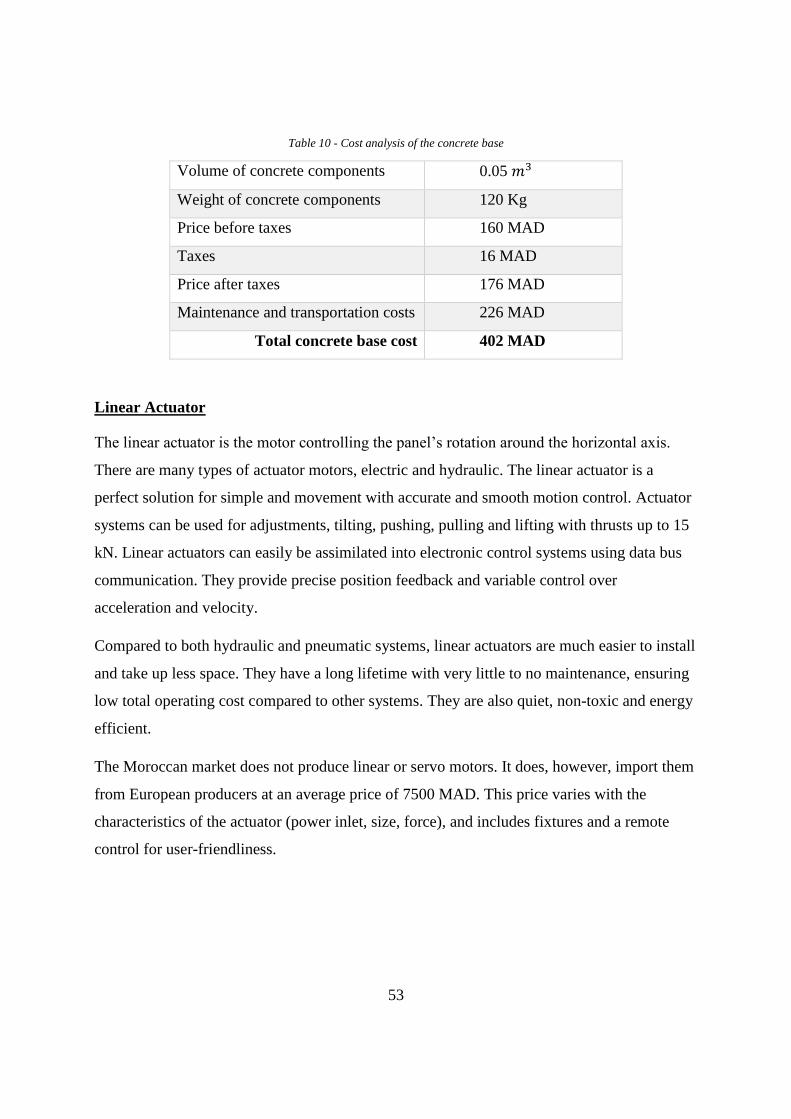
Concrete Base
Although not present in the original design of the tracker, a concrete base would constitute a
safely measure against wind loading. Reinforced concrete is to be used under the base in order
to support the system’s weight and hold it in place. Similar to the support frame, the sturdiest
and cost effective concrete is the type used for construction purpose since the cost per cubic
meter includes the molding and labor included in the manufacturing process. The table below
shows the breakdown of the cost of this base:
53
Table 10 - Cost analysis of the concrete base
Volume of concrete components 0.05 𝑚3
Weight of concrete components 120 Kg
Price before taxes 160 MAD
Taxes 16 MAD
Price after taxes 176 MAD
Maintenance and transportation costs 226 MAD
Total concrete base cost 402 MAD
Linear Actuator
The linear actuator is the motor controlling the panel’s rotation around the horizontal axis.
There are many types of actuator motors, electric and hydraulic. The linear actuator is a
perfect solution for simple and movement with accurate and smooth motion control. Actuator
systems can be used for adjustments, tilting, pushing, pulling and lifting with thrusts up to 15
kN. Linear actuators can easily be assimilated into electronic control systems using data bus
communication. They provide precise position feedback and variable control over
acceleration and velocity.
Compared to both hydraulic and pneumatic systems, linear actuators are much easier to install
and take up less space. They have a long lifetime with very little to no maintenance, ensuring
low total operating cost compared to other systems. They are also quiet, non-toxic and energy
efficient.
The Moroccan market does not produce linear or servo motors. It does, however, import them
from European producers at an average price of 7500 MAD. This price varies with the
characteristics of the actuator (power inlet, size, force), and includes fixtures and a remote
control for user-friendliness.
54
Rotational Motor
At the base of the tracker, a rotational motor is used for the azimuthal angle adaptation. It
rotates the panel around the vertical axis running through the middle of the motor, allowing
the panel to track the sun’s East to West movement.
There are many suppliers of motors in Morocco, most of whom import their merchandise. The
average price for a rotational motor in the Moroccan market is 1200 MAD, with the prices
varying with the motor’s size, durability and torque.
However, in order to optimize the correspondence between the motor and the microprocessor,
it is recommended to order custom made motors, which increases the price of the unit, but
also ensures great accuracy in solar tracking.
12V Battery
The CPV tracker has to stay at 90° with the solar beams. That is why tracker instability due to
power loss is not an option if we would like to justify the additional investment in CPV
technology.
There are many batteries available on the market. For a 12V input voltage and easy
recharging, the average price in the Moroccan market is 1600 MAD.
Electronic Box
The electronic box of a solar tracker is composed on a microprocessor and several sensors.
The microprocessor, which receives and processes information from the sensors and through
an algorithm, controls the movement of the panels. By communicating with the different
motors in charge of tilting the solar panels, the microcontroller plays the most crucial role in
this assembly, that of the brain.
There is a great diversity in the microprocessors that can be used for this project. Pic
Microcontrollers are very commonly used for projects involving solar trackers, as well as the
ATMEGA32 microcontroller. Pic Microcontrollers’ prices are quite low in Morocco, ranging
from 30 to 90 MAD per piece. For the sake of maximal efficiency, this project will use the
PIC 16F84 microcontroller chip, which is very small yet very efficient.
55
In addition to the microcontrollers, two sensors are included in the electronic box. The first is
a light sensor, which would identify the solar exposure of the tilted panel. The TSL2561 is a
photo resistor available for sale in Morocco, although it too is imported. Its set price is at 80
MAD.
The other sensor used in this design is an anemometer. This sensor calculates wind velocity,
sends the information to the microcontroller which in turn, decides whether to tilt the panel to
a position where the wind loading factor would not jeopardize the stability of the tracker. Just
like other elements in the electronic box, wind sensors in Morocco have to be imported. The
average price of a wind sensor and its accompanying transducer is $50, which in the current
economy is the equivalent of 500 MAD.
Linking elements
Pins, locks, bolts and hinges are a necessary part of the solar tracker. They must be sturdy,
well-proportioned and easily replaceable. These linking elements are widely available on the
Moroccan market, as they are used in all industrial applications.
We can safely estimate the maximum price of all the linking elements to be 300 MAD, since
the size of the tracker doesn’t require excessive linking and the bulk price of the pins is very
low.
Assembling Costs
The cost of assembling and of manual labor would vary greatly according to the location of
the plant.
In Morocco, the minimum wage has been increased to 13.46MAD/h.
The assembling of an entire tracker cannot exceed 4 hours, resulting in a labor cost of 54
MAD/unit. Utilities are not taken into consideration as the amount of water and electricity
necessary for the assembling of the tracker would be minimal compared to those necessary to
assemble the solar panel.
56
Machinery involved in the making of all solar trackers would be included in the plant’s initial
investment, and therefore cannot be repeated when measuring the cost of each tracker.
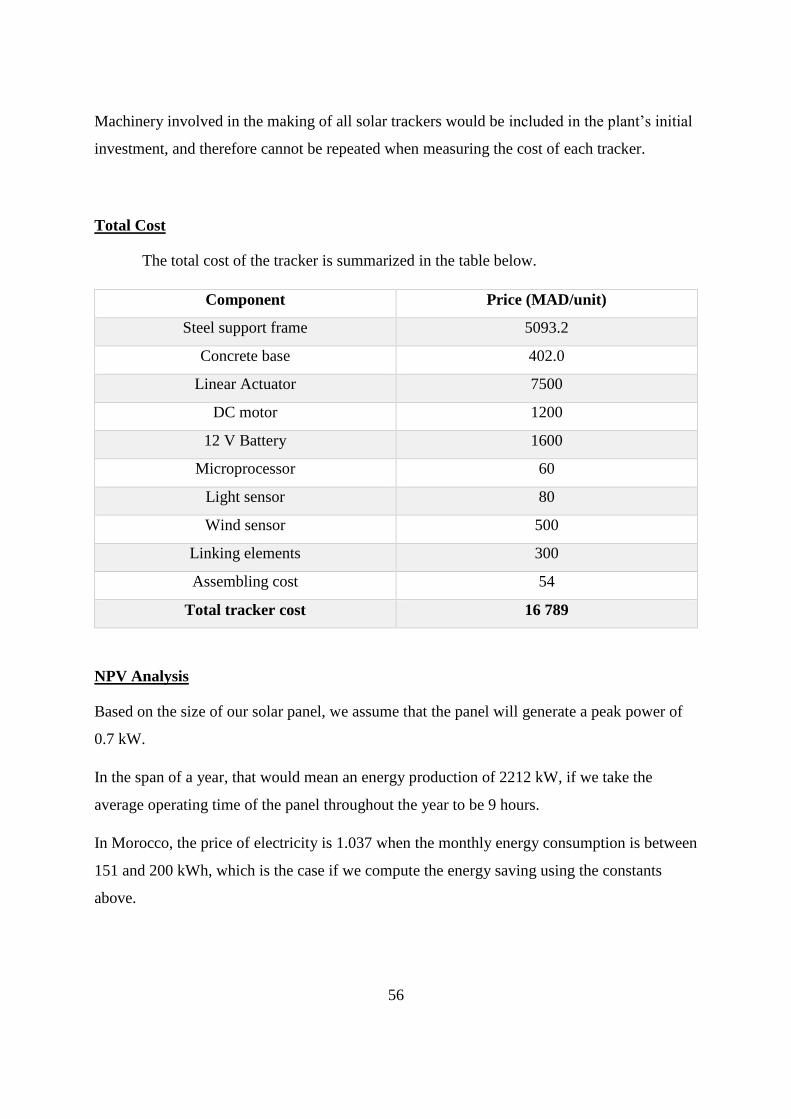
Total Cost
The total cost of the tracker is summarized in the table below.
Component Price (MAD/unit)
Steel support frame 5093.2
Concrete base 402.0
Linear Actuator 7500
DC motor 1200
12 V Battery 1600
Microprocessor 60
Light sensor 80
Wind sensor 500
Linking elements 300
Assembling cost 54
Total tracker cost 16 789
NPV Analysis
Based on the size of our solar panel, we assume that the panel will generate a peak power of
0.7 kW.
In the span of a year, that would mean an energy production of 2212 kW, if we take the
average operating time of the panel throughout the year to be 9 hours.
In Morocco, the price of electricity is 1.037 when the monthly energy consumption is between
151 and 200 kWh, which is the case if we compute the energy saving using the constants
above.
57
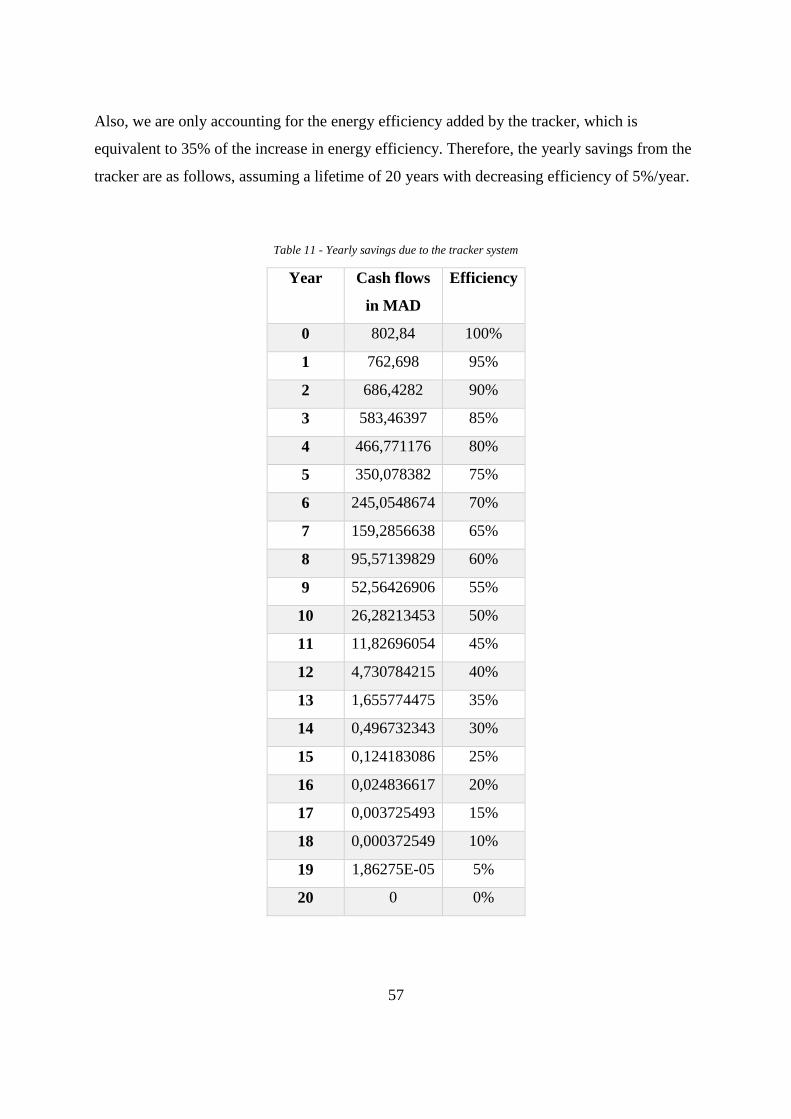
Also, we are only accounting for the energy efficiency added by the tracker, which is
equivalent to 35% of the increase in energy efficiency. Therefore, the yearly savings from the
tracker are as follows, assuming a lifetime of 20 years with decreasing efficiency of 5%/year.
Table 11 - Yearly savings due to the tracker system
Year Cash flows
in MAD
Efficiency
0 802,84 100%
1 762,698 95%
2 686,4282 90%
3 583,46397 85%
4 466,771176 80%
5 350,078382 75%
6 245,0548674 70%
7 159,2856638 65%
8 95,57139829 60%
9 52,56426906 55%
10 26,28213453 50%
11 11,82696054 45%
12 4,730784215 40%
13 1,655774475 35%
14 0,496732343 30%
15 0,124183086 25%
16 0,024836617 20%
17 0,003725493 15%
18 0,000372549 10%
19 1,86275E-05 5%
20 0 0%
58
After plugging in our initial investment (total cost of the solar panel), we find a negative NPV
of -14.000 MAD. Since the NPV is negative, investing in the creation of a solar tracker is
very risky, and further research in component cost minimization is necessary.
A direct contingency plan is to minimize the cost of the trackers by purchasing them directly
from the foreign suppliers. Moroccan retailers needs to account for the transportation and
import taxes along with their profit margin, which is why the price of components inside
Morocco is quite high. Purchasing the components directly from the manufacturers and in
bulk would help nus take advantage of the economy of scale, thus reducing the tracker’s
production cost. In addition, maximization of durability of the solar panel is a key aspect to
rendering these trackers a good investment for buyers.
59
Conclusions
Solar trackers are a must for the efficient functioning of any CPV system. That is why
designing them to the upmost standards is very important. In order to deserve the extra-
investment in a both a tracker and CPV technology, the CPV Tracker system musts be strong
enough to withstand the forces and stresses caused by the wind.
As the wind velocity increases, and the angular position of the solar panel increases, the stress
caused by the wind will increase. However, the simulations show that we mustn’t only focus
on the largest angles, since some moderate angles can cause high stress and eventually,
possible fatigue and failure.
The stability simulation shows that the CAD design isn’t affected by the wind loading force of
wind speeds of 30m/s. Therefore, in the Moroccan context at least, we can rest assured that
the solar tracker will not be moved by the wind.
The cost analysis of the tracker alone shows that the current cost of the unit doesn’t lead to a
positive NPV. Therefore, more research should be put into minimizing the cost of the solar
tracker’s various components, taking into consideration efficiency maximization and
longevity along with direct purchasing of the components from manufacturers.
60
Future Work
- The development of an accurate algorithm that would tilt the solar panel in a
safety position in the case strong wind or gust without causing large losses in sun
exposure.
- Continuous improvement of the motion system. Combining both actions into
one actuator would be very green and very effective.
- A detailed gust analysis must be performed in addition to the wind load
analysis in order to assess the maximal loads on the tracker at any given time.
- More research should be put into the minimization of the cost of the tracker
components in order to render the NPV positive and justify the investment in a solar
tracker.
61
References
[1 Encyclopædia Britannica Online, s. v. "French Revolution", accessed 14 October 2016.
[2] Encyclopædia Britannica Online, s. v. "United States", accessed 14 September 2016.
[3 Encyclopædia Britannica Online, s. v. "gas-turbine engine", accessed 14 September 2016.
[4] Encyclopædia Britannica Online, s. v. "Industrial Revolution", accessed 14 September
2016
[5] Falkner, R., The Handbook of Global Climate and Environment Policy, Wiley-Blackwell,
2013, p. 3.
[6] Baker, S., Sustainable Development, Routledge, 2006, p. 7-18.
[7] Alexandru, C., et al, Simulation of a Dual-Axis Solar Tracker for Improving the
Performance of a Photovoltaic Panel, Sage, 2010.
[8] World Energy Council, World Energy Scenarios: Composing energy futures to 2050,
World Energy Council, 2013.
[9] Tao, C. S., et al, Natural Resource Limitations to Terawatt Solar Cell Deployment, ECS
Transactions, 33 (17), pp. 3-11, 2011, The Electrochemical Society.
[10] Green MA. The path to 25% silicon solar cell efficiency: History of silicon cell evolution.
Progress in Photovoltaics: Research and Applications, 17, pp. 183-189, 2009.
[11] Philipps, s. et al, Current Status of Concentrator Photovoltaic (CPV) Technology,
Fraunhofer Institute of Solar Energy Systems and the US National Renewable Energy
Laboratory, 2016.
[12] Sharp, Sharp Develops Solar Cell with World's Highest Conversion Efficiency of 37.7%,
Press Release, 2012.
[13] Lamm, L. O., A New Analytic Expression for the Equation of Time, 1981.
[14] National Oceanic and Atmospheric Administration, Solar Calculation Links, n.a.
[15] NOVA Corporation, Fixed/Single Axis/Dual Axis Comparison Chart, n.a.
62
[16] Lee, H. G., et al, Optimal Structural Design of a 5-kW CPV Tracking System by
Considering the ISO 4017/4762 Standard Through Structure and Flow Simulations, Journal
of the Korean Physical Society, 67(6), pp. 1071-1077, 2015.
[17] Bukhamsin, H., et al, Solar Tracking Structure Design, Department of Mechanical
Engineering of Northern Arizona University, 2013.
[18] Velicu, R., et al, Wind loads on an azimuthal photovoltaic platform: experimental study,
International Conference on Renewable Energies and Power Quality (ICREPQ’10), 2010.
[19] Hernández, S., et al, Aerodynamic analysis of a photovoltaic solar tracker, EACWE 5
Conference, 2009.
[20] Myo, T., et al, Dual-Axis Solar Tracker: Functional Model Realization and Full-Scale
Simulations, A Major Qualifying Project Report submitted to the Faculty of Worcester
Polytechnic Institute, 2013.
[21] Solar World, Determining wind and snow loads for solar panels, p 3, 2012.
[22] Enzili, M., L’Energie Eolienne au Maroc (Ressources, Potentiel et Projets), 6ème
conférence maroco-allemande sur l'énergie éolienne, 2011.
[23] Sbai, A., et al, Modélisation de la Vitesse du Vent et Calcul du Potentiel Éolien du Maroc
Oriental, La Météorologie, 8(5), 1994.
63
Appendix A: Initial Specification
ABJEG Hajar
GE
CPV TRACKER COMPONENT STABILITY AND ECONOMIC STUDY
LOUDIYI K
FALL 2016
The objectives of this project are to assess the stability characteristics of a CPV Tracker Unit
in various conditions and perform a cost study of the entire tracker system. The first phase
will consist of literature search about the various Tracker Units and their components. This is
a crucial phase as it allows familiarization with the concept and different designs of
Concentrated Photo-Voltaic Tracker panels.
Starting October 1st, the analysis phase will begin. The selected design’s components will be
analyzed based on different characteristics such as weight, dimensions and/or thickness. This
phase will lead to a design that provides optimal stability for the Tracker Unit.
Once this phase is completed, a study of the Moroccan market will be conducted in order to
assess the cost of the Tracker Unit. This will be done in two steps. The first, beginning on
October 16th, will target the mechanical system’s components. The second, starting
November 1st, will aim for a detailed study of the Tracker Unit’s electronic box components;
mainly concerning their availability and costs in Morocco.
As the system is very large, a prototype will be built on a testing software in order to assess
the level of stability of the end-result design.
By the end of the semester, if nothing else, a study of the stability of the chosen design as well
as a cost analysis should be completed.
On a social level, this is a productive project. It does not threaten society in any way. In fact,
it is very environmentally friendly, which means that it will also have a good effect on
society. The project also satisfies the NSPE Code of Ethics for Engineers as it will help
advance larger ecological projects in an ethical manner