computer graphics & image processing lecture 2 digital image fundamentals
TRANSCRIPT
Computer Graphics Computer Graphics & &
Image Processing Image Processing
Lecture 2Lecture 2
Digital Image FundamentalsDigital Image Fundamentals

ALI JAVED Lecturer SOFTWARE ENGINEERING DEPARTMENTU.E.T TAXILAEmail:: [email protected] Room #:: 7
•How images are formed in the eye ?
•Eye’s physical limitation ?
•Human visual interpretation of images ?
Visual PerceptionVisual Perception
Structure of human eyesStructure of human eyes
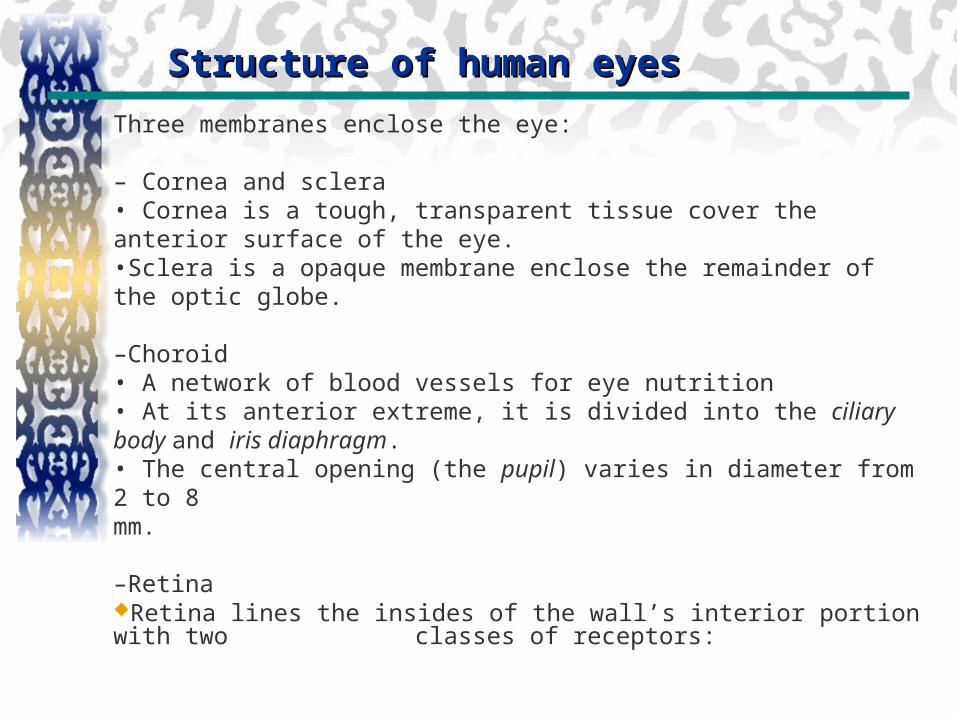
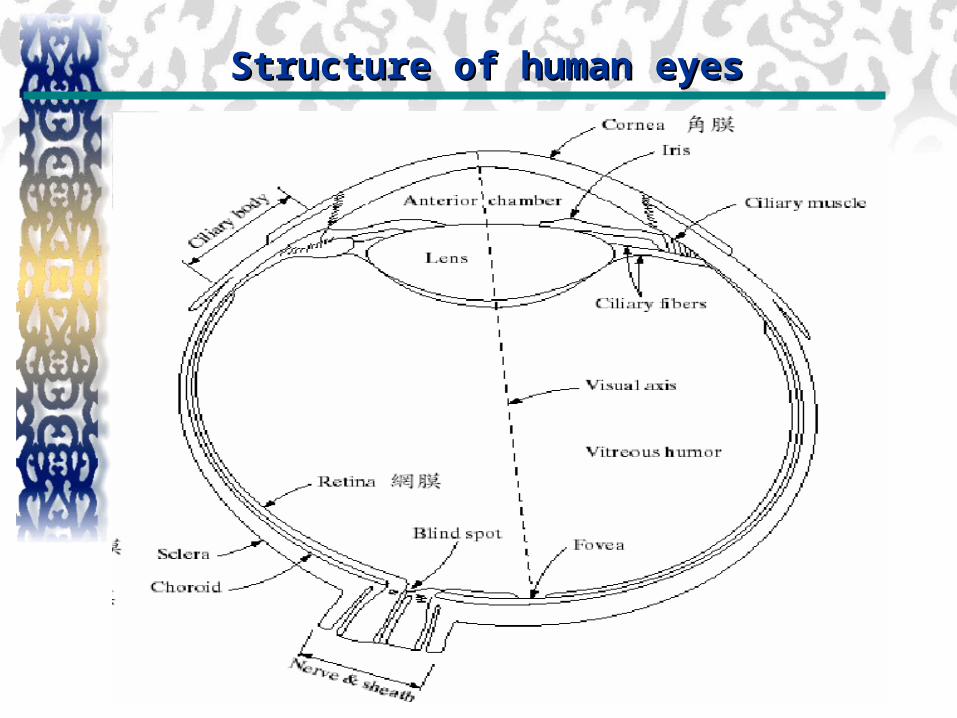
Three membranes enclose the eye:
– Cornea and sclera• Cornea is a tough, transparent tissue cover the anterior surface of the eye.•Sclera is a opaque membrane enclose the remainder of the optic globe.
–Choroid• A network of blood vessels for eye nutrition• At its anterior extreme, it is divided into the ciliary body and iris diaphragm.• The central opening (the pupil) varies in diameter from 2 to 8mm.
–Retina Retina lines the insides of the wall’s interior portion with two classes of receptors:
Structure of human eyesStructure of human eyes
Structure of human eyesStructure of human eyes
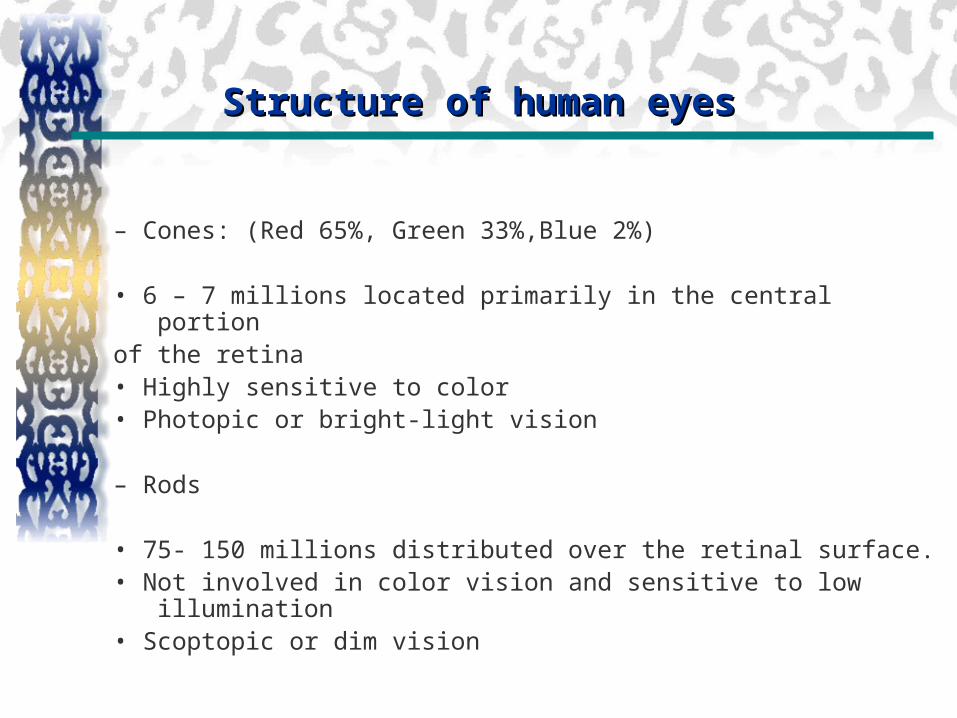
– Cones: (Red 65%, Green 33%,Blue 2%)
• 6 – 7 millions located primarily in the central portionof the retina• Highly sensitive to color• Photopic or bright-light vision
– Rods
• 75- 150 millions distributed over the retinal surface.• Not involved in color vision and sensitive to low illumination• Scoptopic or dim vision
Structure of human eyesStructure of human eyes
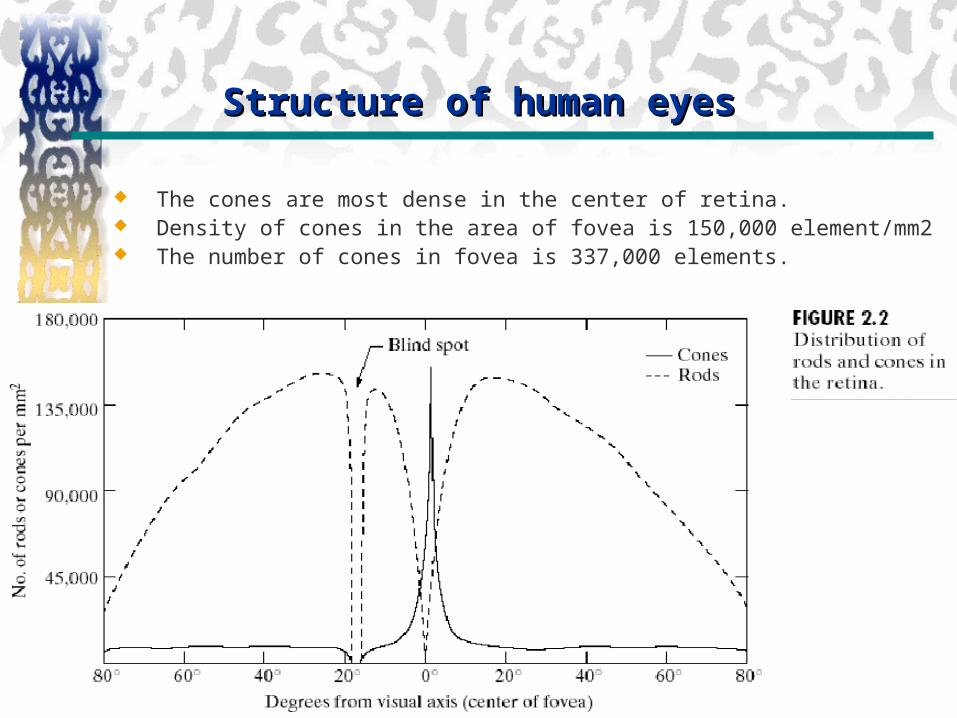
The cones are most dense in the center of retina. Density of cones in the area of fovea is 150,000 element/mm2 The number of cones in fovea is 337,000 elements.
Image Formation in the EyesImage Formation in the Eyes
The distance between the center of the lens and the retina (focal length) varies from 17mm to 14mm.
The shape of lens is controlled by the tension of fibers of the ciliary body.
The retinal image is reflected primarily in the area of fovea.
Perception = excitation of light receptors, which transform radiant energy into impulses that are ultimately decoded by the brain.
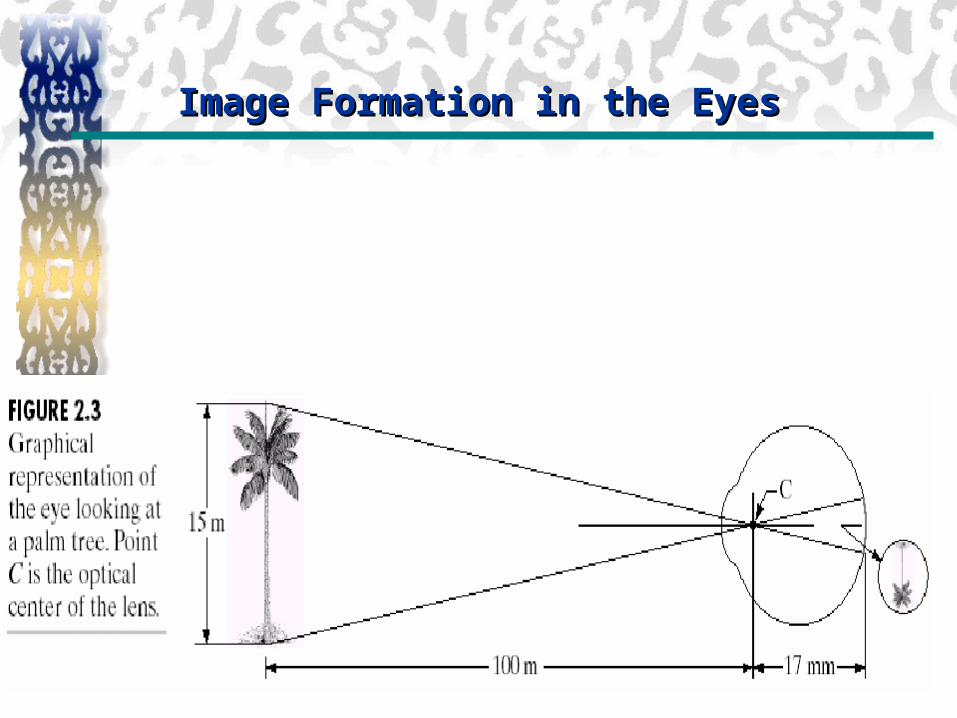
Image Formation in the EyesImage Formation in the Eyes
The range of light intensity levels to which the human visual system can adapt is enormous - on the order of 10^10.
• The subjective brightness is a logarithmic function of light intensity incident on the eye.
• Brightness adaptation.
– The current sensitivity level it can discriminate simultaneously is rather small compared with the total adaptation range
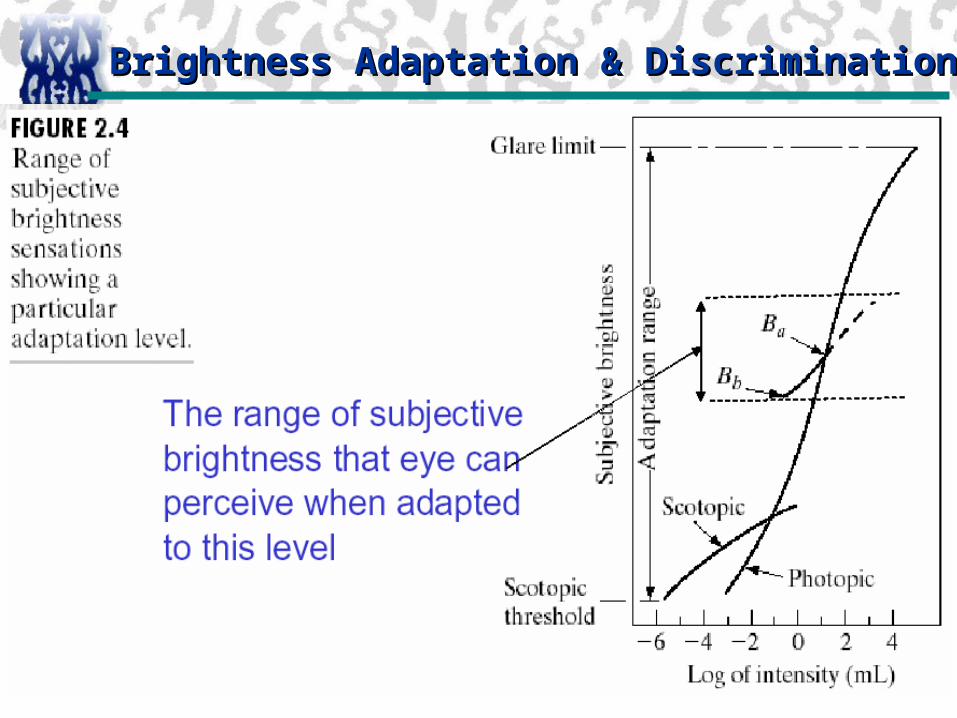
– Brightness adaptation level: the current sensitive level of the visual system.
Brightness Adaptation & DiscriminationBrightness Adaptation & Discrimination
Brightness Adaptation & DiscriminationBrightness Adaptation & Discrimination
Brightness Adaptation & DiscriminationBrightness Adaptation & Discrimination
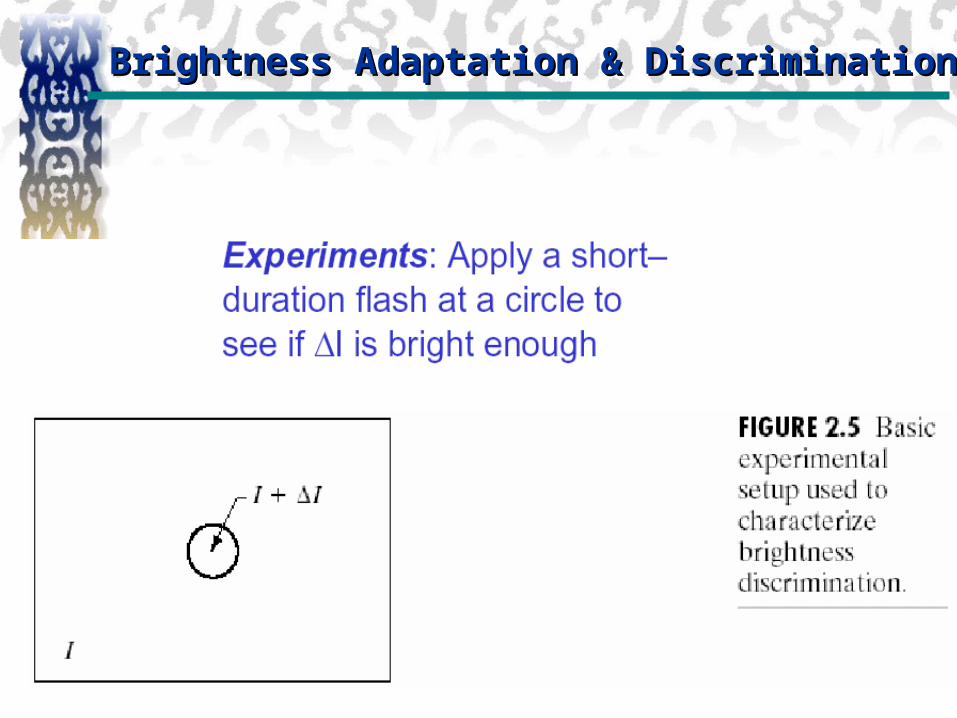
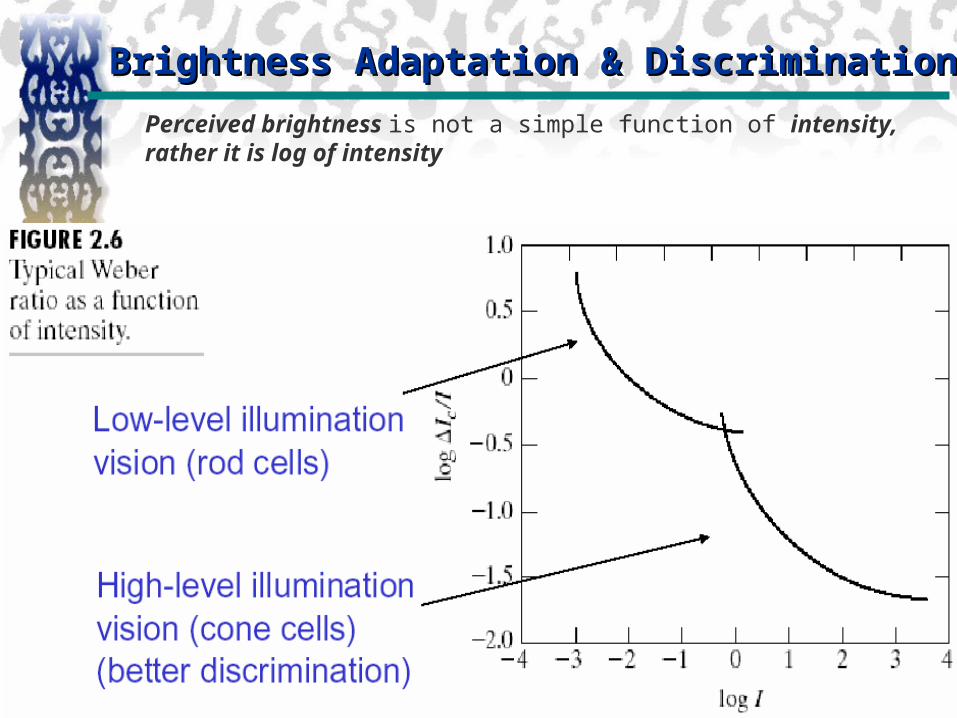
•The dIc is the increment of illumination discriminable 50% of the time with the background illumination I.
• The quantity dIc/I is called the Weber ratio.
• The smaller dIc/I means that a small percentage change in intensity is discriminable – good brightness discrimination
• If the background illumination is constant, the intensity of object is allowed to vary incrementally from never perceived to always being perceived.
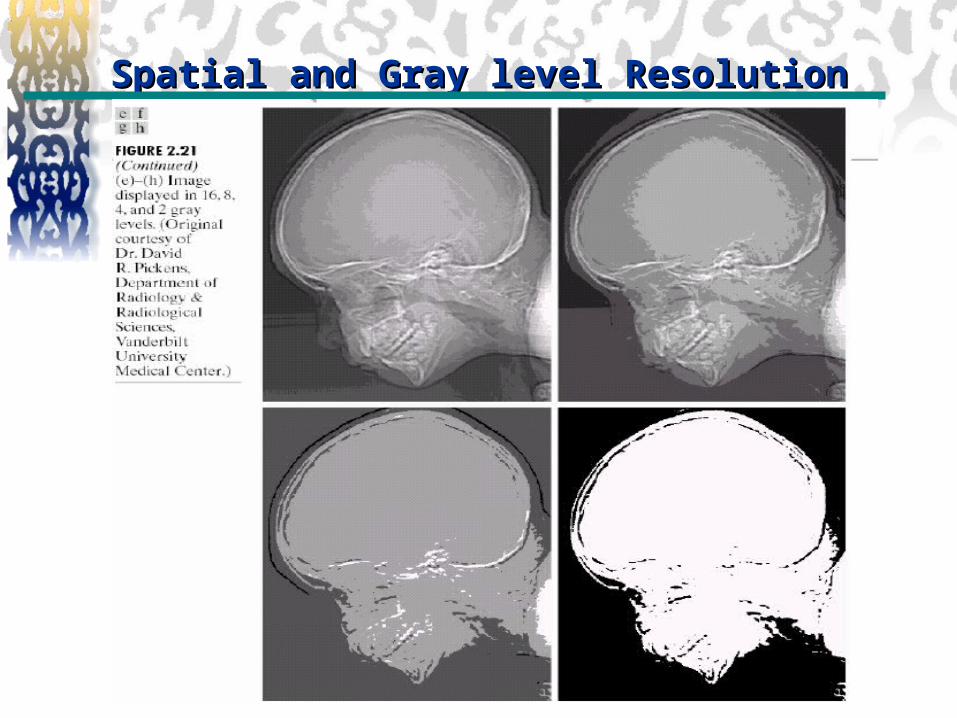
• Typically the observer can discern a totally from one to two dozens different intensity changes.
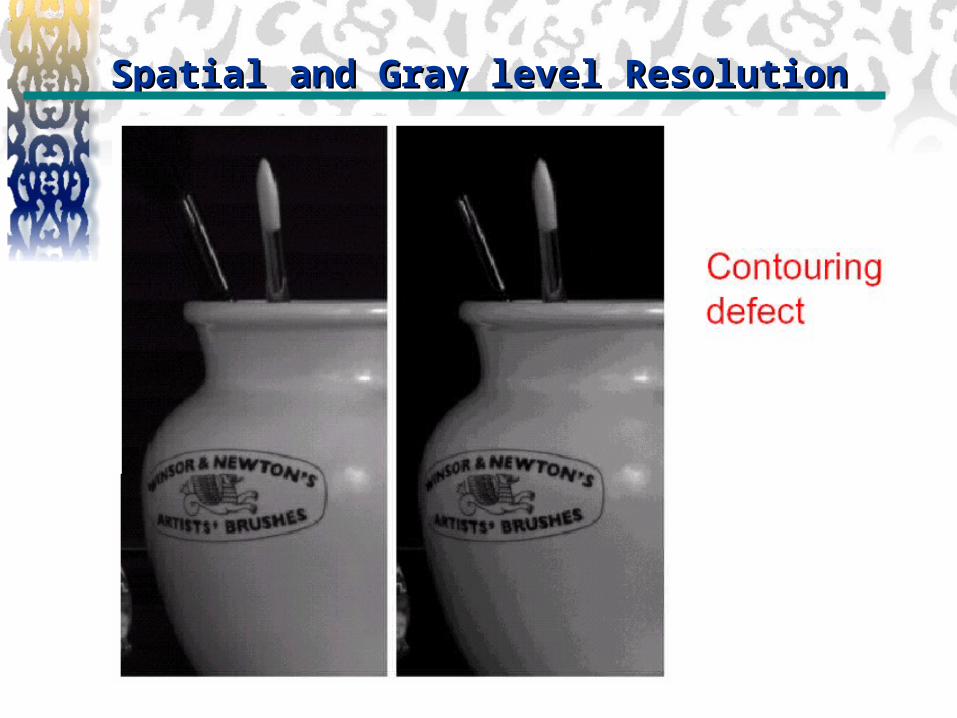
– The number of gray level for digital image– Contouring Effect: Not sufficient no. of gray levels
Brightness Adaptation & DiscriminationBrightness Adaptation & Discrimination
Brightness Adaptation & DiscriminationBrightness Adaptation & Discrimination
Perceived brightness is not a simple function of intensity, rather it is log of intensity
Brightness Adaptation & DiscriminationBrightness Adaptation & Discrimination
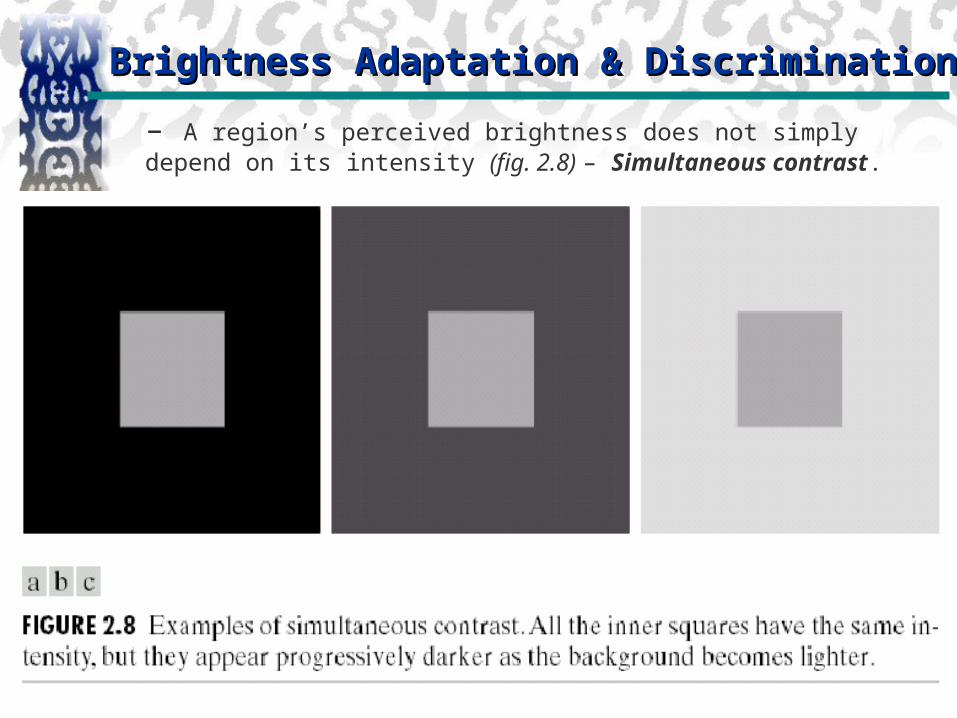
– A region’s perceived brightness does not simply depend on its intensity (fig. 2.8) – Simultaneous contrast.
Light and EM SpectrumLight and EM Spectrum
•Light is a particular type of EM radiation that can be seen by human eye.
•EM waves are massless particles each traveling in a wavelike pattern and moving at a speed of light.
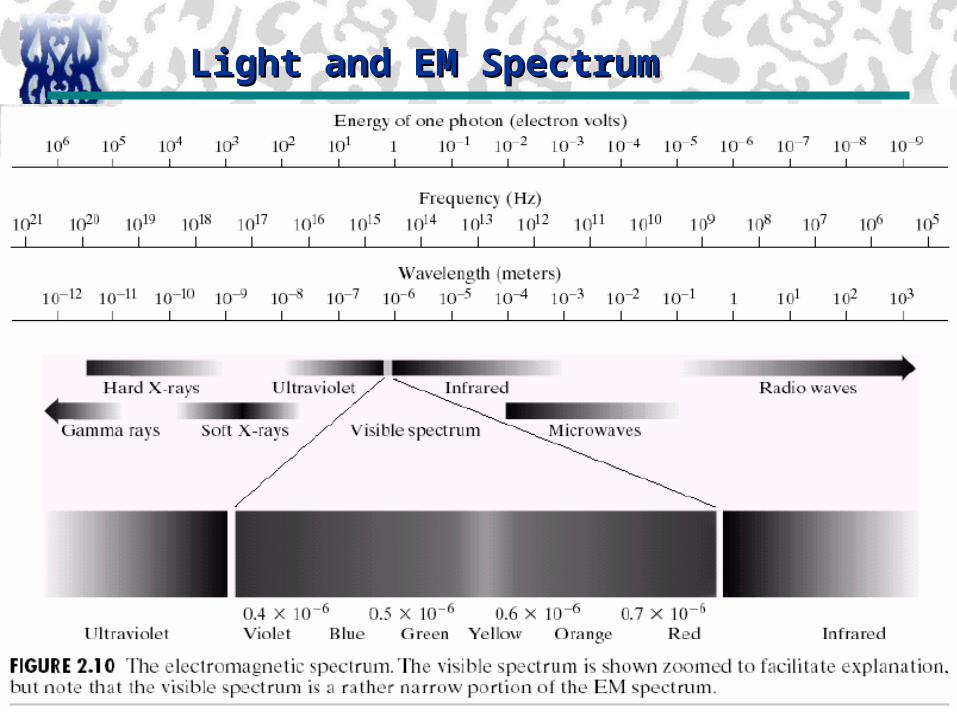
•We can specify waves through frequency and wavelength.
•The colors that human perceive in an object are determined by the nature of the light reflected from the object.
For example green objects reflect light with wavelengths primarily in the 500 to 570nm range while absorbing most of the energy at other wavelengths.
Light and EM SpectrumLight and EM Spectrum
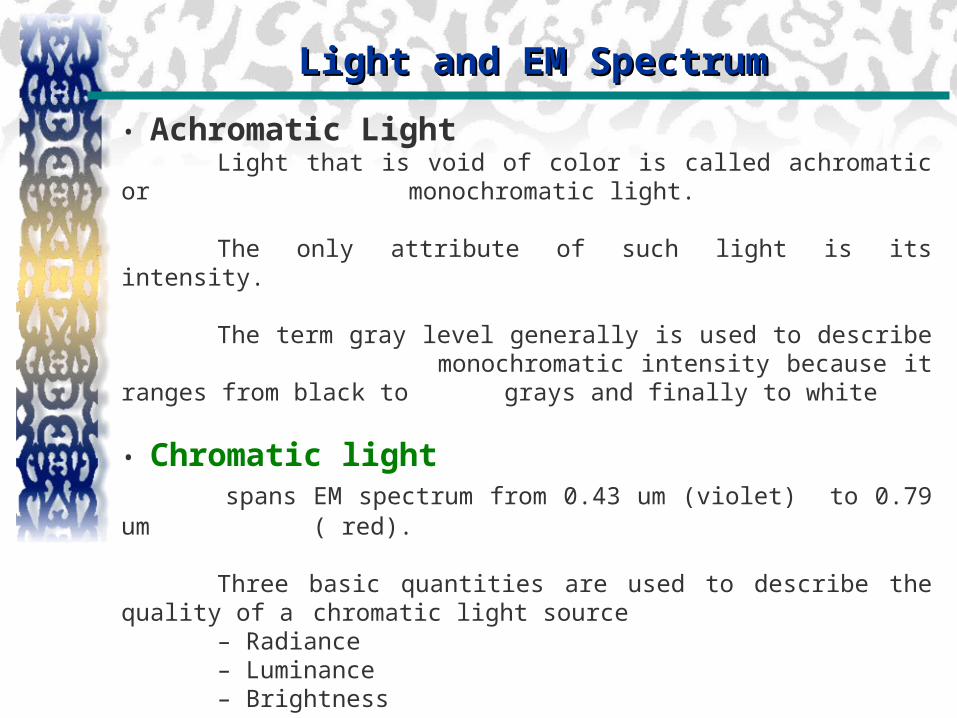
• Achromatic LightLight that is void of color is called achromatic or monochromatic light.
The only attribute of such light is its intensity.
The term gray level generally is used to describe monochromatic intensity because it ranges from black to grays and finally to white
• Chromatic light spans EM spectrum from 0.43 um (violet) to 0.79 um ( red).
Three basic quantities are used to describe the quality of a chromatic light source– Radiance– Luminance– Brightness
Light and EM SpectrumLight and EM Spectrum
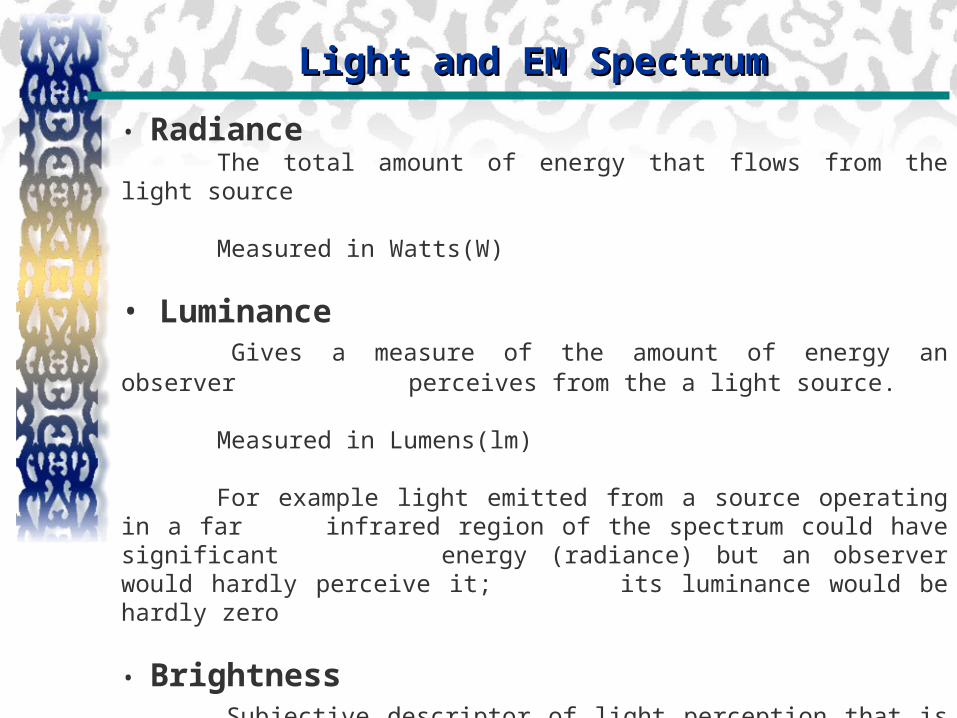
• RadianceThe total amount of energy that flows from the light source
Measured in Watts(W)
• Luminance Gives a measure of the amount of energy an observer
perceives from the a light source.
Measured in Lumens(lm)
For example light emitted from a source operating in a far infrared region of the spectrum could have significant energy (radiance) but an observer would hardly perceive it; its luminance would be hardly zero
• Brightness Subjective descriptor of light perception that is practically impossible to measure
Light and EM SpectrumLight and EM Spectrum
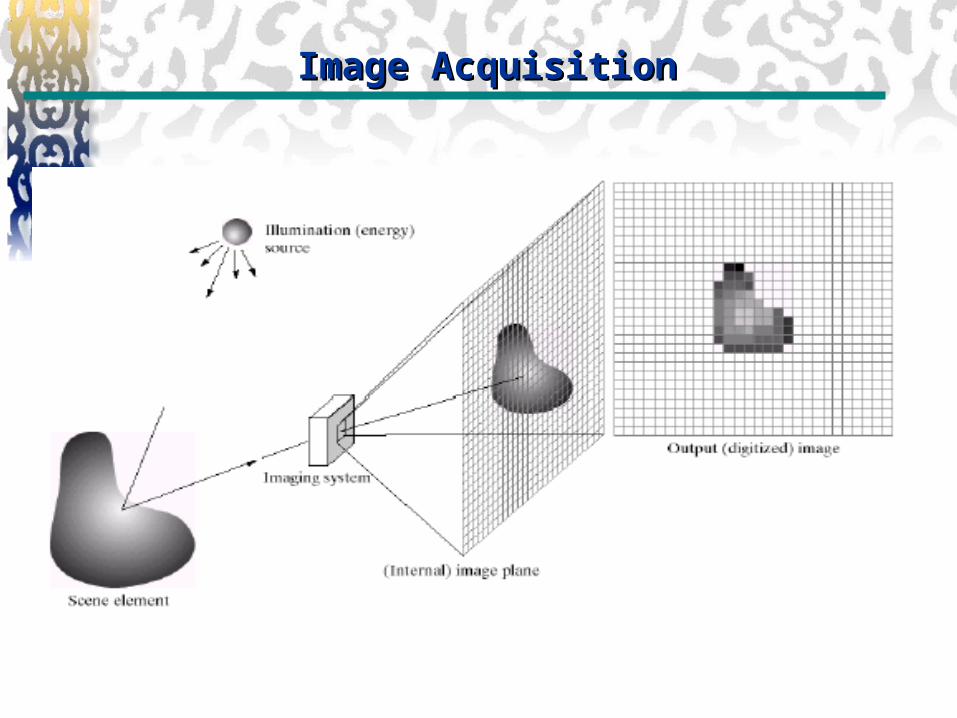
Image AcquisitionImage Acquisition
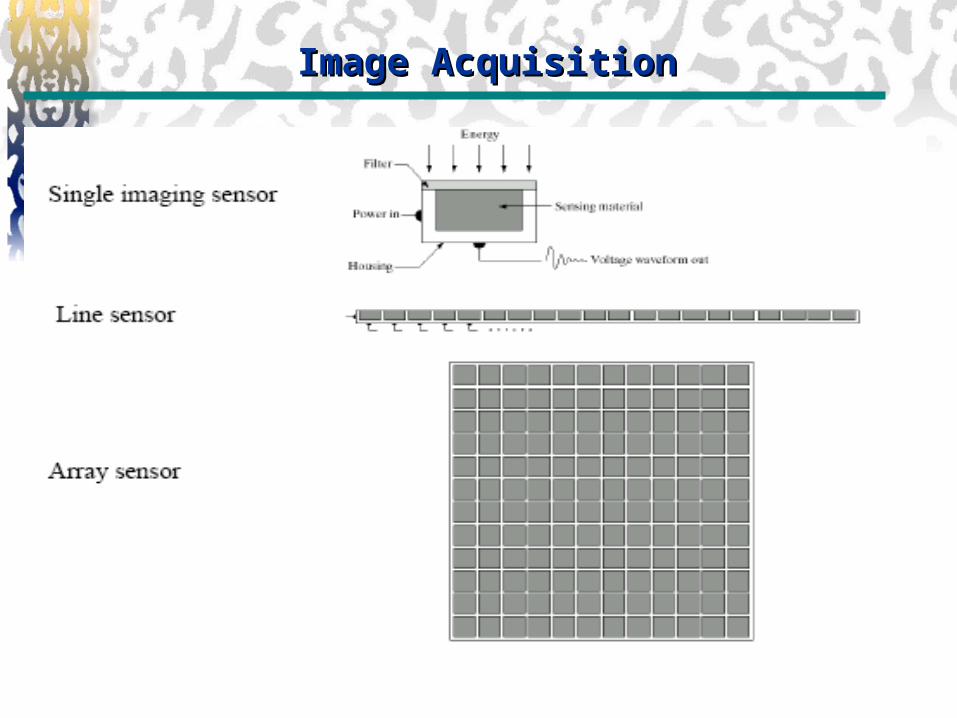
Image AcquisitionImage Acquisition
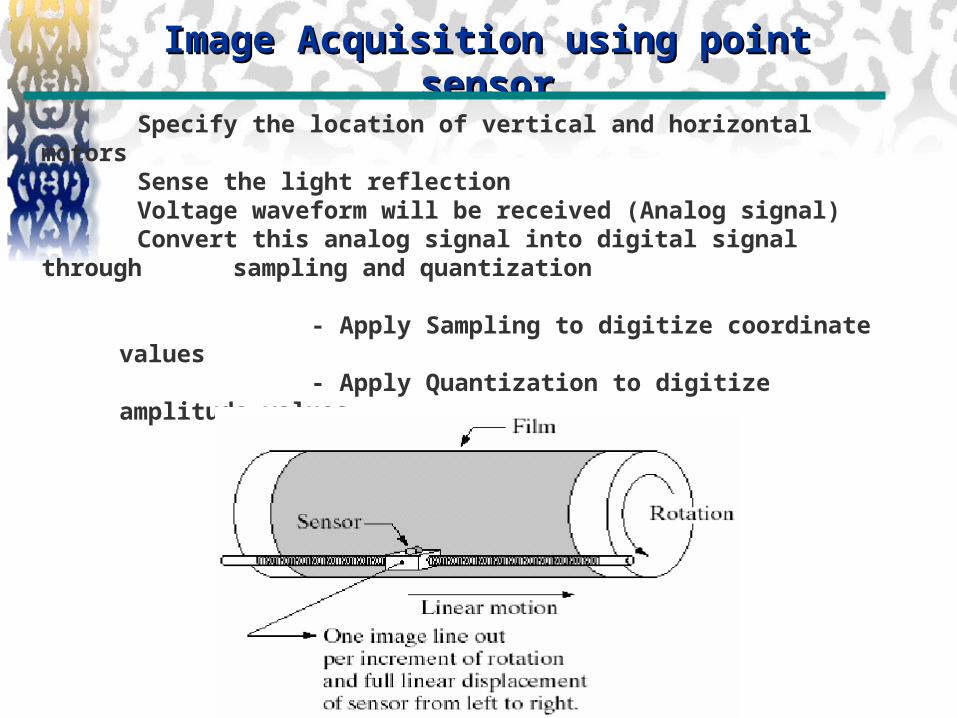
Image Acquisition using point sensorImage Acquisition using point sensor
Specify the location of vertical and horizontal motorsSense the light reflection Voltage waveform will be received (Analog signal)Convert this analog signal into digital signal through
sampling and quantization
- Apply Sampling to digitize coordinate values
- Apply Quantization to digitize amplitude values
Store the digitized value in memory
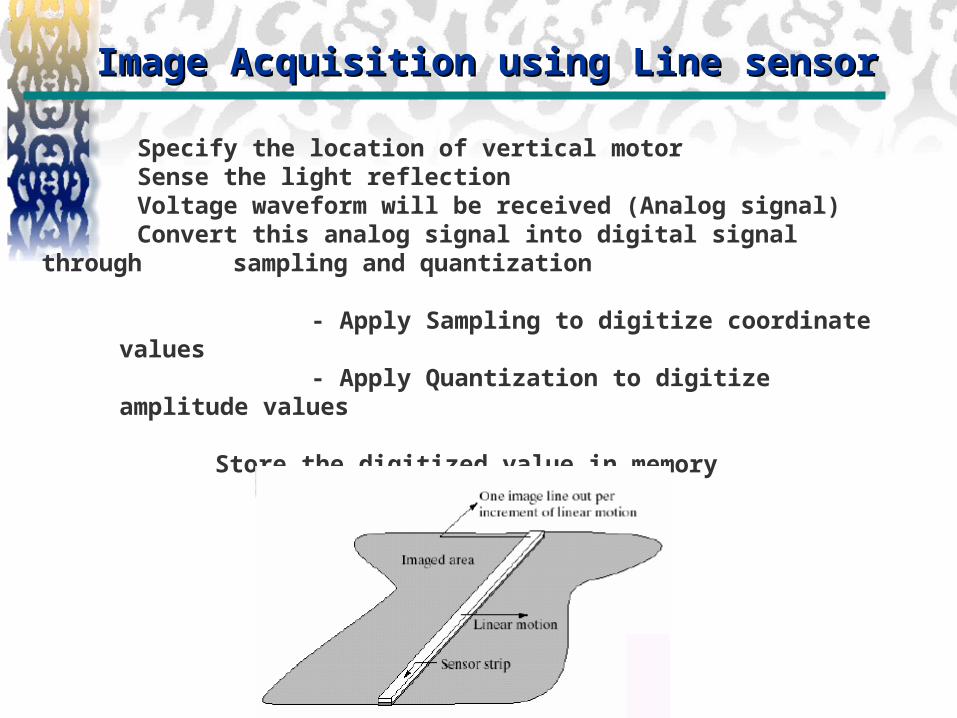
Image Acquisition using Line sensorImage Acquisition using Line sensor
Specify the location of vertical motorSense the light reflection Voltage waveform will be received (Analog signal)Convert this analog signal into digital signal through
sampling and quantization
- Apply Sampling to digitize coordinate values
- Apply Quantization to digitize amplitude values
Store the digitized value in memory
Image Acquisition using Array sensorImage Acquisition using Array sensor
Specify the location of vertical and horizontal motors
Sense the light reflection
Voltage waveform will be received (Analog signal)
Convert this analog signal into digital signal through sampling and quantization
- Apply Sampling to digitize coordinate values
- Apply Quantization to digitize amplitude values
Store the digitized value in memory
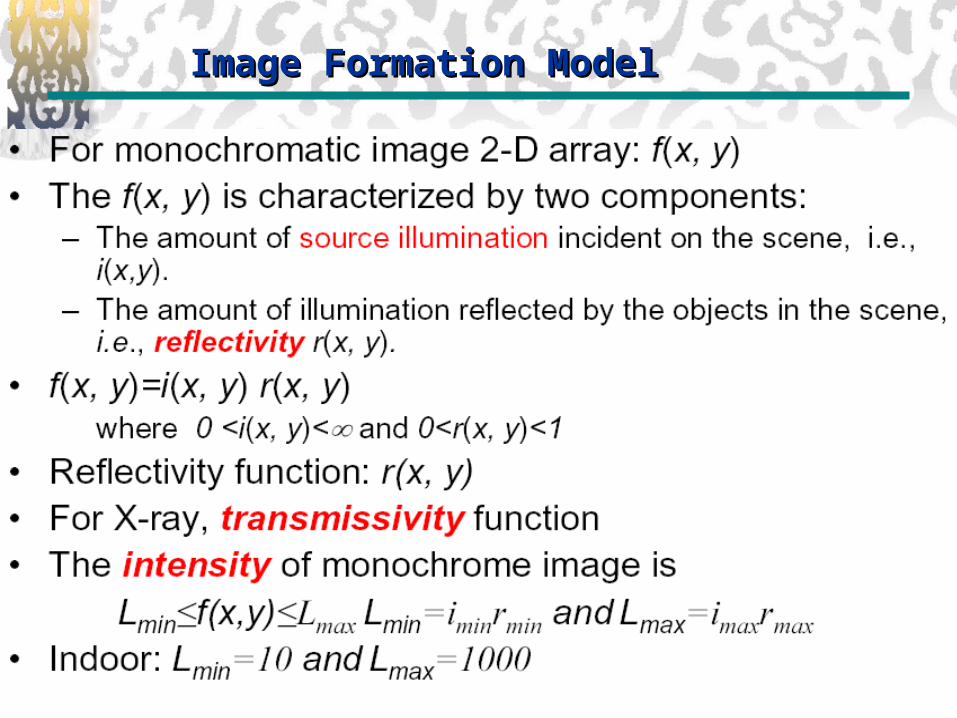
Image Formation ModelImage Formation Model
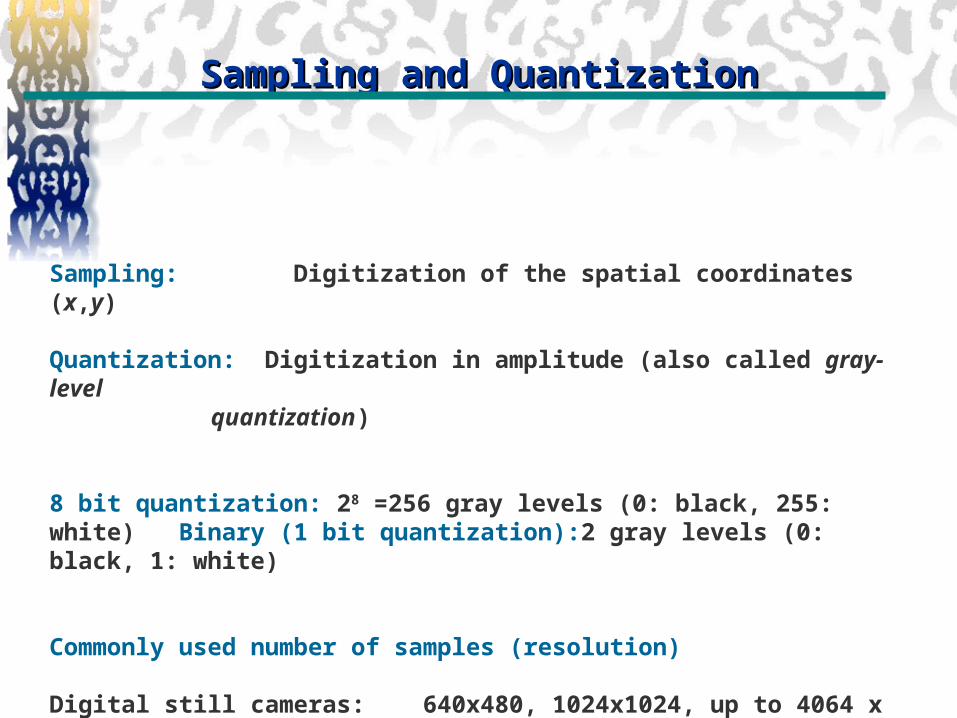
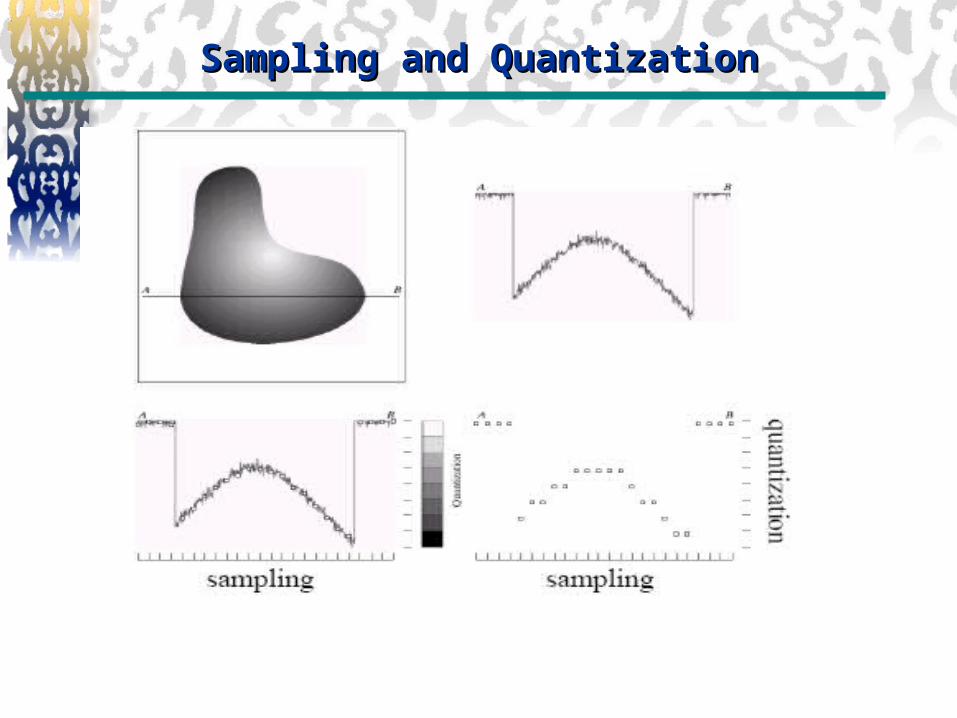
Sampling and QuantizationSampling and Quantization
Sampling: Digitization of the spatial coordinates (x,y)
Quantization: Digitization in amplitude (also called gray-level quantization)
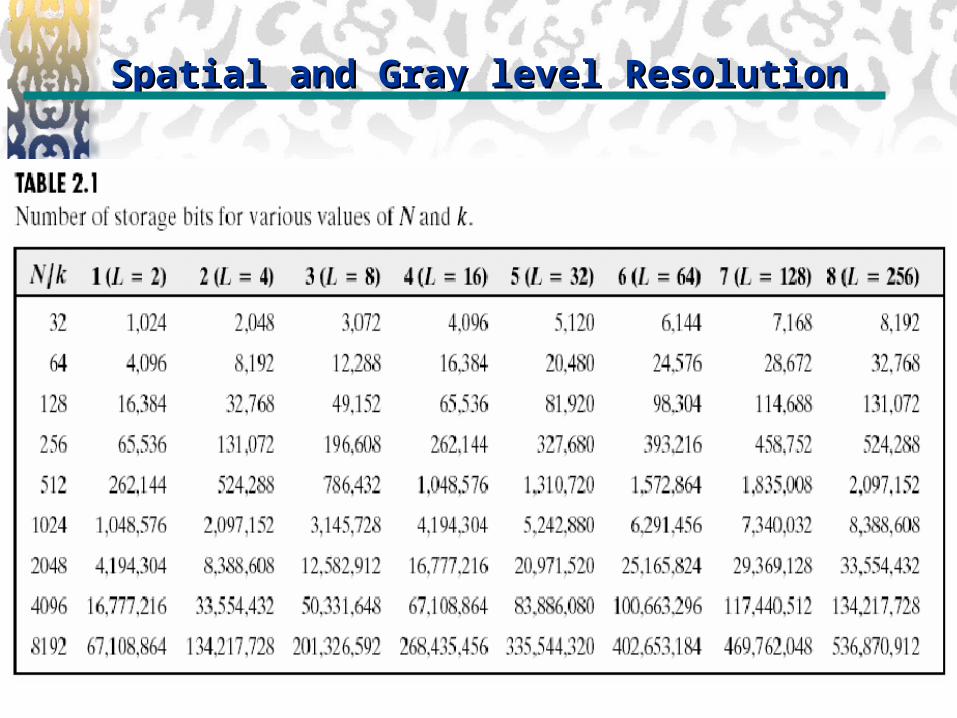
8 bit quantization: 28 =256 gray levels (0: black, 255: white) Binary (1 bit quantization):2 gray levels (0: black, 1: white)
Commonly used number of samples (resolution)
Digital still cameras: 640x480, 1024x1024, up to 4064 x 2704Digital video cameras: 640x480 at 30 frames/second
Sampling and QuantizationSampling and Quantization
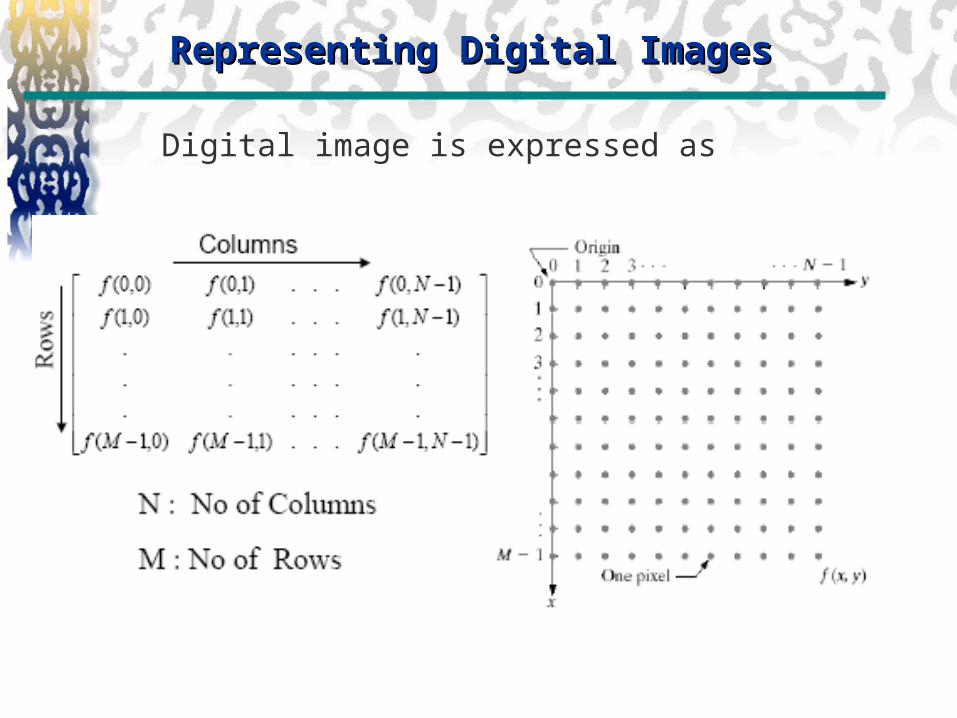
Representing Digital ImagesRepresenting Digital Images
Digital image is expressed as
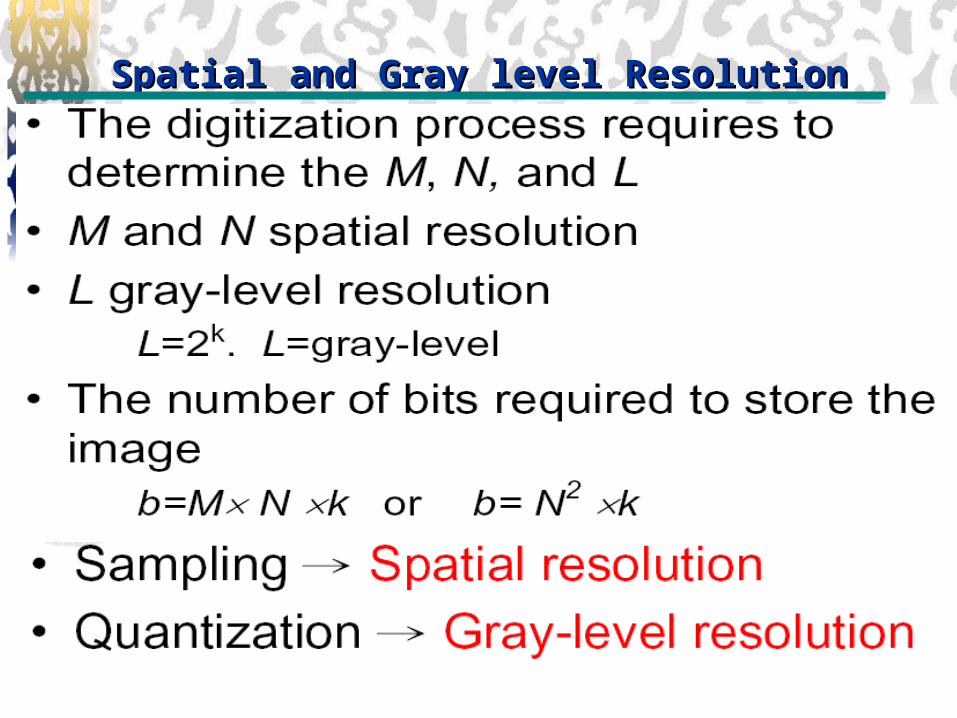
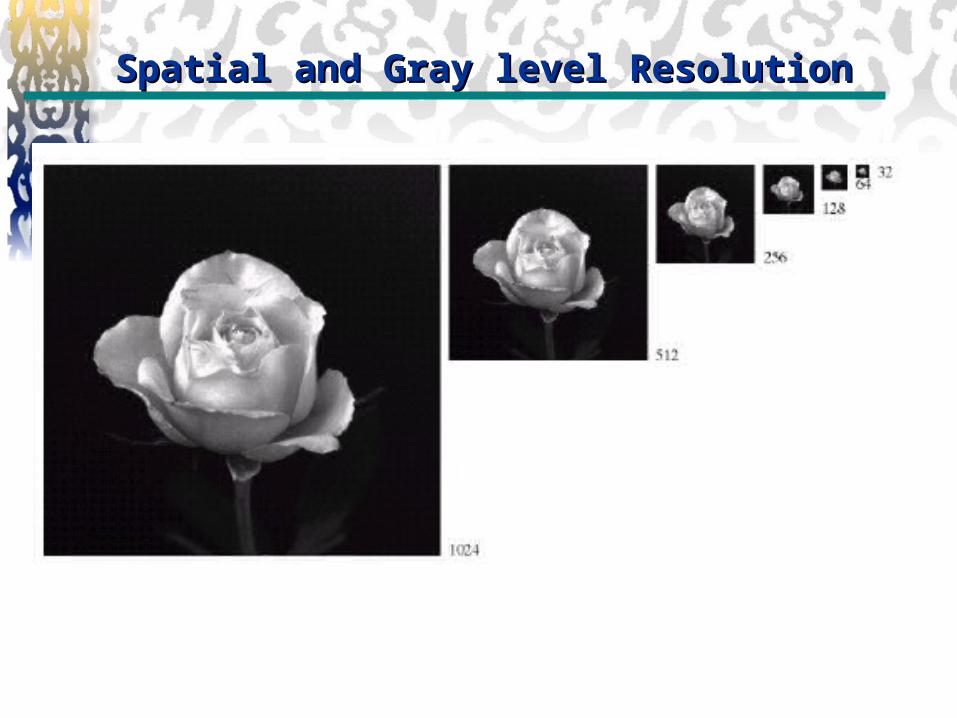
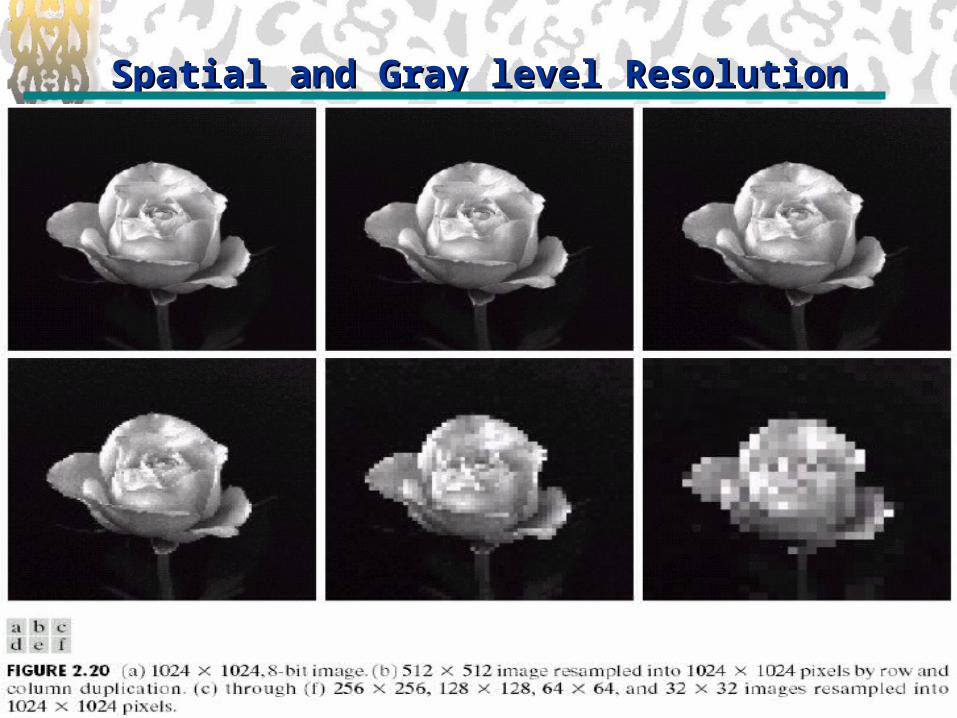
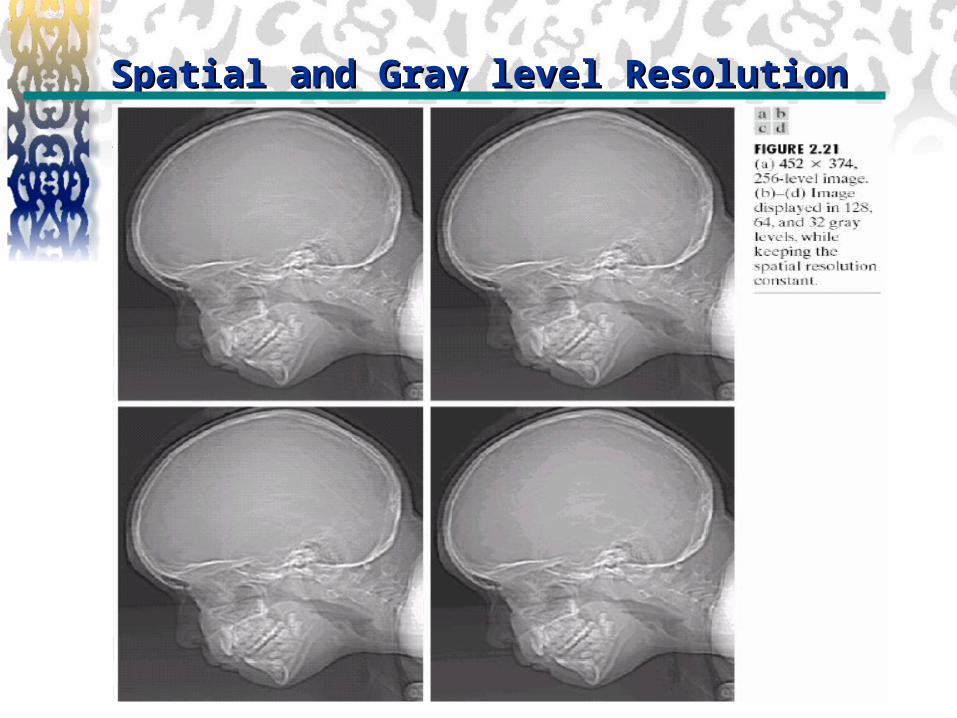
Spatial and Gray level ResolutionSpatial and Gray level Resolution
Spatial and Gray level ResolutionSpatial and Gray level Resolution
Spatial and Gray level Resolution Spatial and Gray level Resolution
Spatial and Gray level ResolutionSpatial and Gray level Resolution
Spatial and Gray level ResolutionSpatial and Gray level Resolution
Spatial and Gray level ResolutionSpatial and Gray level Resolution
Spatial and Gray level ResolutionSpatial and Gray level Resolution
Aliasing and Moire PatternsAliasing and Moire Patterns•Aliasing:– If a function is under-sampled then a phenomena called aliasing corrupts the sampled image.
– A signal sampled too slowly is misrepresented by the samples, “ high spatial frequency components of the original signal appear as low spatial frequency components in the sampled signal (an effect known as aliasing.
–The corruption is in the form of additional frequency components being introduced into the sampled function. These are called Aliased frequencies.
–The principal approach for reducing the aliasing effects on an image is to reduce its high frequency components by blurring the image
•Moire Patterns–Moire Pattern is caused by a break-up of the periodicity, i.e., images are scanned from a printed page, which consists of periodic ink dots.
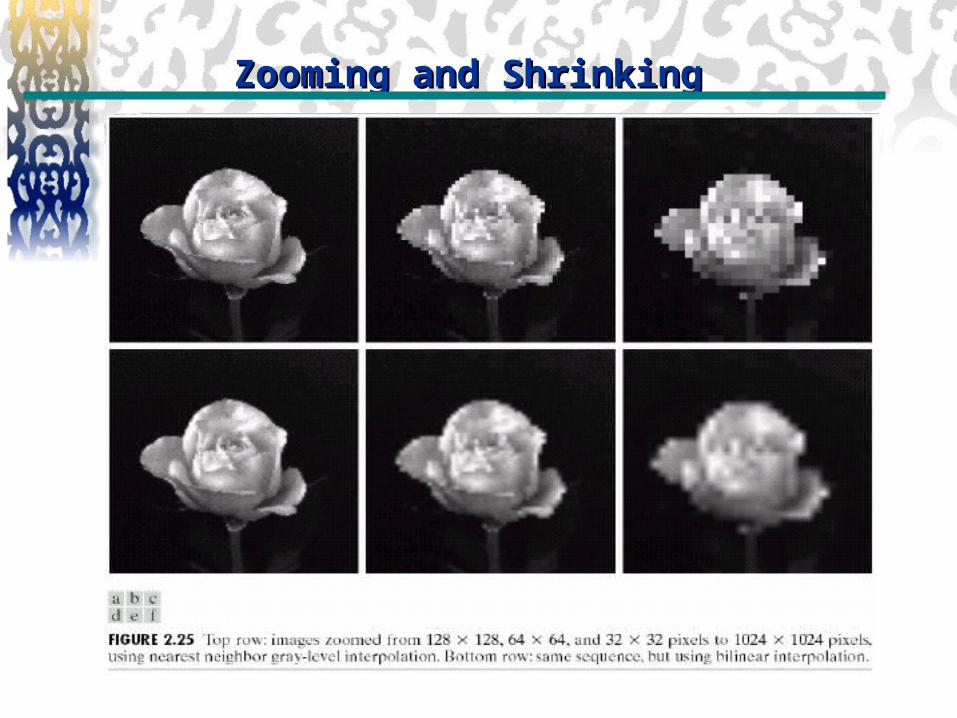
Zooming and Shrinking Zooming and Shrinking
Zooming:–Create a new pixel locations–Assign a gray-levels to those new locations
•Nearest neighbor interpolation–Pixel replication–Bilinear interpolation using four nearest neighbors–Higher-order non-linear interpolation: using more neighbors for interpolation
•Shrinking:–Direct shrinking causes aliasing–Expansion then Shrinking: blurring the image before shrinking it and reduce aliasing.
Zooming and Shrinking Zooming and Shrinking
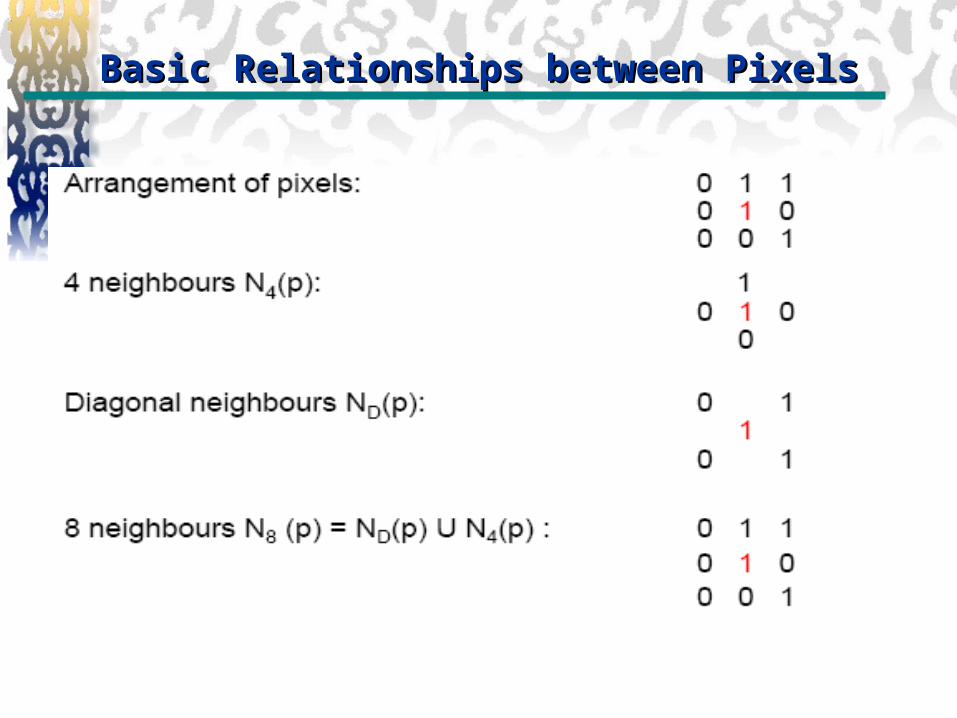
Basic Relationships between PixelsBasic Relationships between Pixels
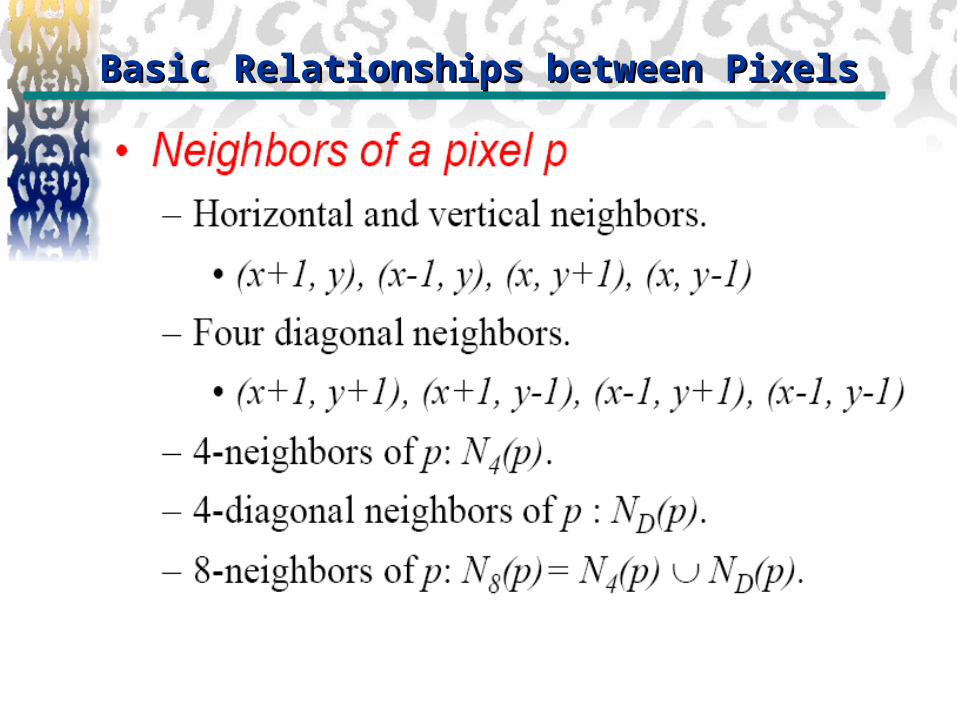
Basic Relationships between PixelsBasic Relationships between Pixels
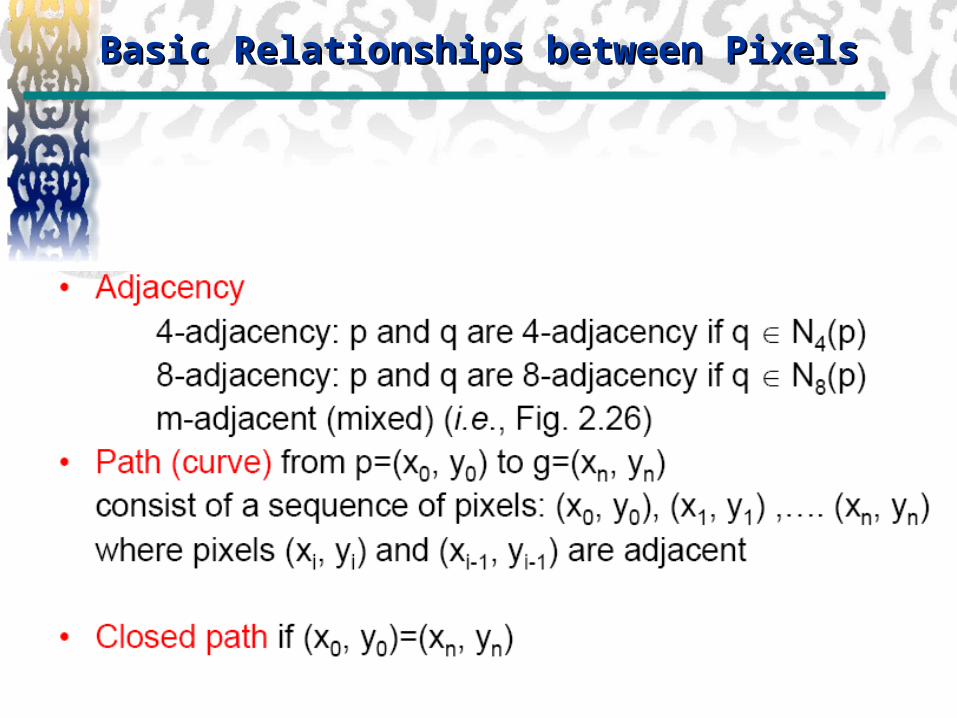
Basic Relationships between PixelsBasic Relationships between Pixels
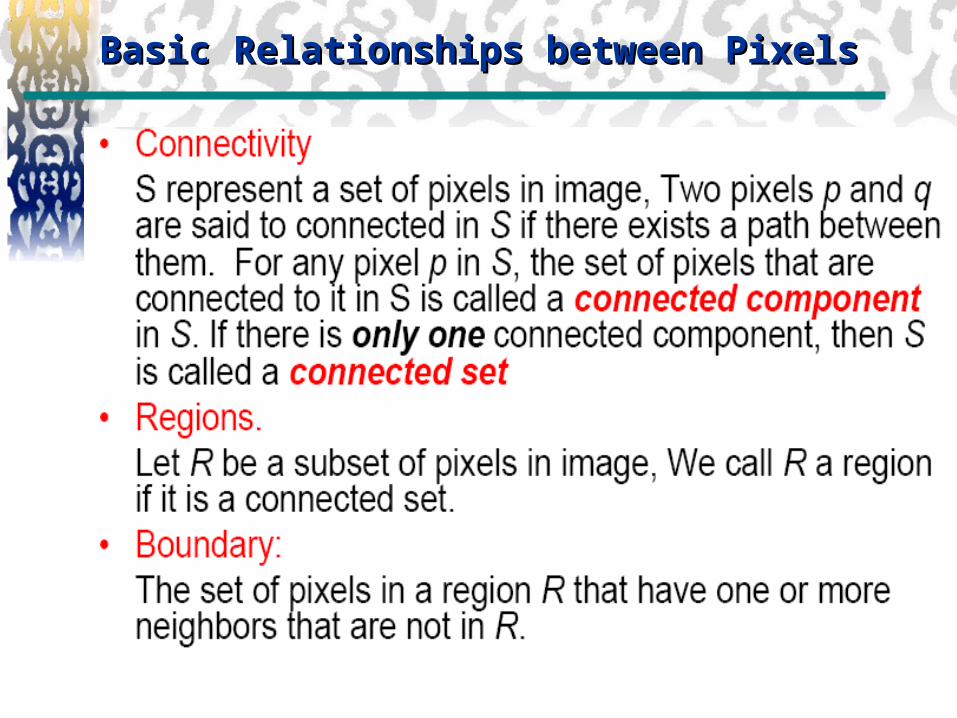
Basic Relationships between PixelsBasic Relationships between Pixels
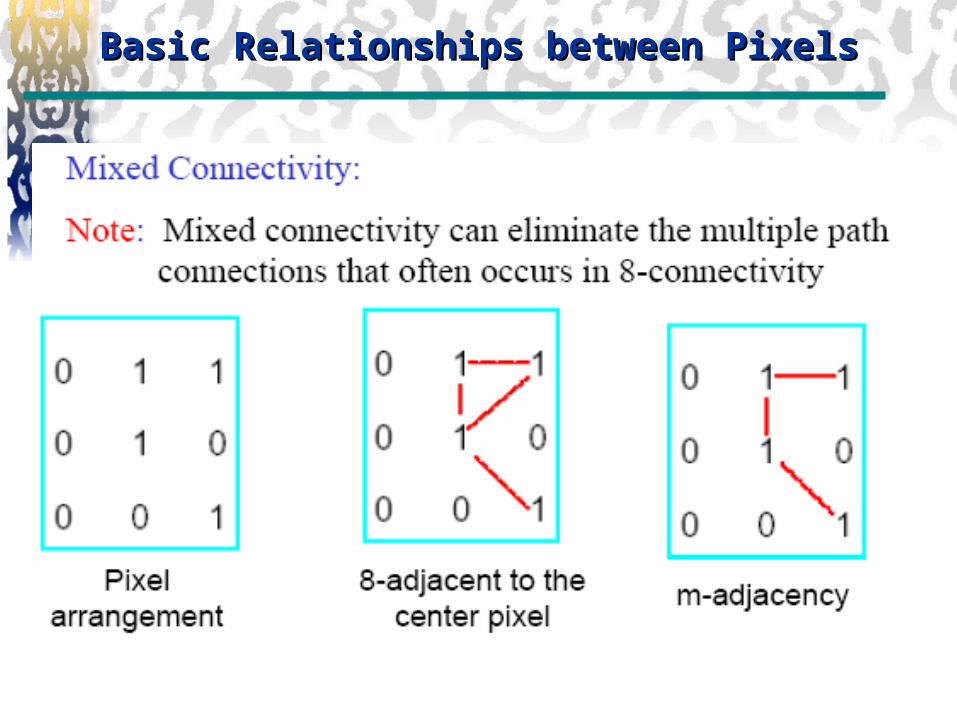
Basic Relationships between PixelsBasic Relationships between Pixels
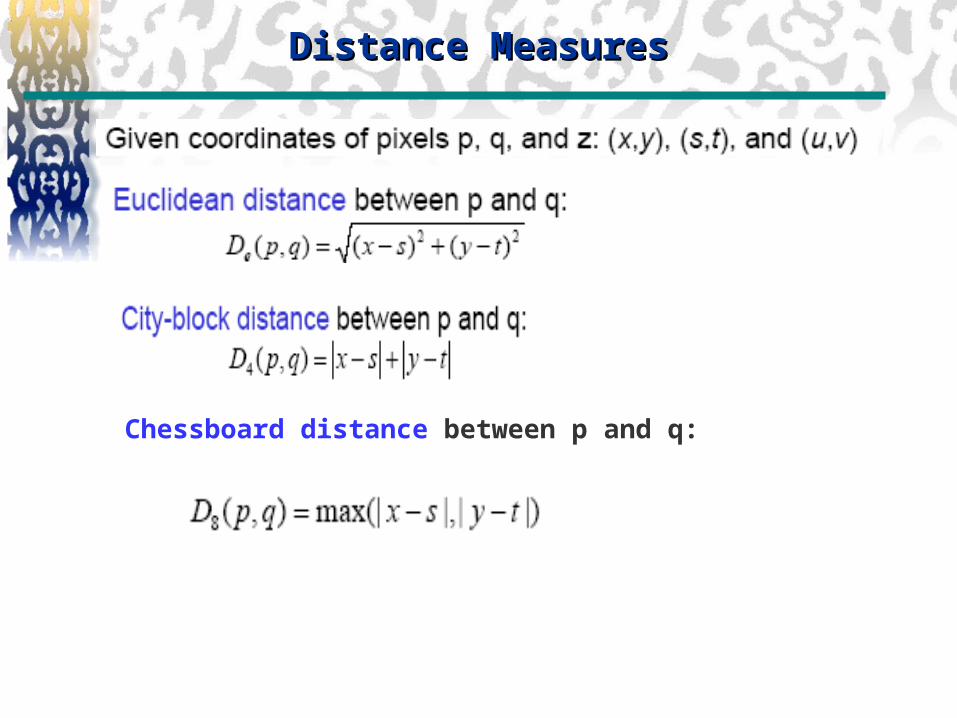
Distance MeasuresDistance Measures
Chessboard distance between p and q:
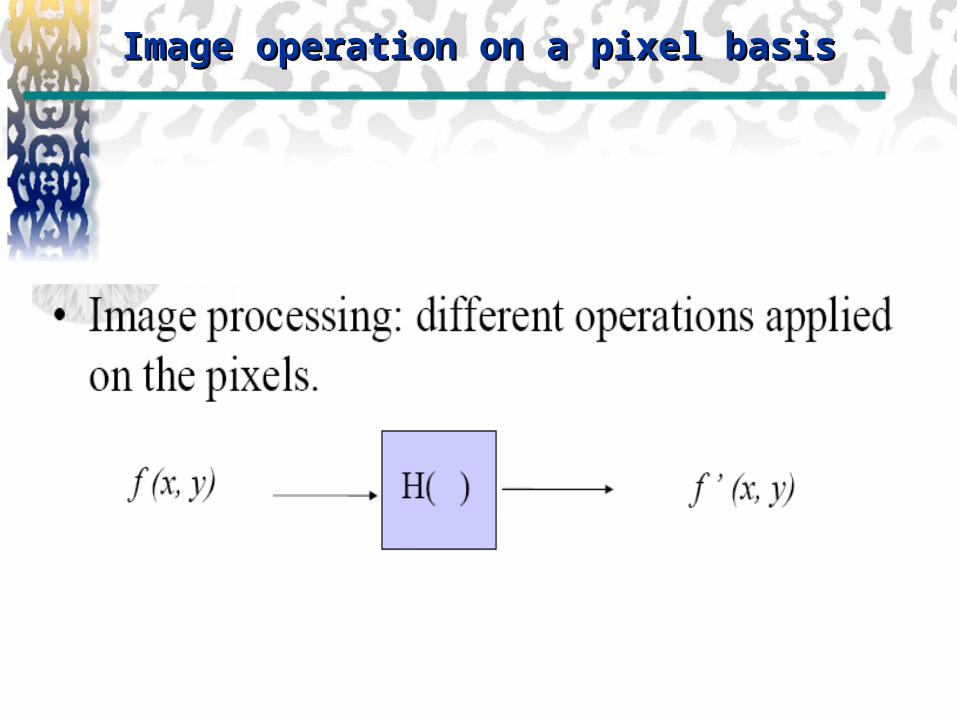
Image operation on a pixel basisImage operation on a pixel basis

Any question