computer-aided diagnosis for the detection and classification of lung cancers on chest radiographs
TRANSCRIPT

Computer-aided Diagnosis for the Detectionand Classification of Lung Cancers on
Chest Radiographs:ROC Analysis of Radiologists’ Performance1
Junji Shiraishi, PhD, Hiroyuki Abe, MD, PhD, Feng Li, MD, PhD, Roger Engelmann, MSHeber MacMahon, MB, Kunio Doi, PhD
Rationale and Objectives. The aim of the study is to investigate the effect of a computer-aided diagnostic (CAD) schemeon radiologist performance in the detection of lung cancers on chest radiographs.
Materials and Methods. We combined two independent CAD schemes for the detection and classification of lung nod-ules into one new CAD scheme by use of a database of 150 chest images, including 108 cases with solitary pulmonarynodules and 42 cases without nodules. For the observer study, we selected 48 chest images, including 24 lung cancers, 12benign nodules, and 12 cases without nodules, from the database to investigate radiologist performance in the detection oflung cancers. Nine radiologists participated in a receiver operating characteristic (ROC) study in which cases were inter-preted first without and then with computer output, which indicated locations of possible lung nodules, together with afive-color scale illustrating the computer-estimated likelihood of malignancy of the detected nodules.
Results. Performance of the CAD scheme indicated that sensitivity in detecting lung nodules was 80.6%, with 1.2 false-positive results per image, and sensitivity and specificity for classification of nodules by use of the same database fortraining and testing the CAD scheme were 87.7% and 66.7%, respectively. Average area under the ROC curve value fordetection of lung cancers improved significantly (P � .008) from without (0.724) to with CAD (0.778).
Conclusion. This type of CAD scheme, which includes two functions, namely detection and classification, can improveradiologist accuracy in the diagnosis of lung cancer.
Key Words. Computer-aided diagnosis (CAD); ROC; lung cancer; lung nodule©
AUR, 2006Because some evidence suggests that early detection oflung cancer may allow timely therapeutic intervention andthus a more favorable prognosis for the patient (1–5),lung cancer screening by use of chest radiographs and
Acad Radiol 2006; 13:995–1003
1 From the Department of Radiology, Kurt Rossmann Laboratories forRadiologic Image Research, The University of Chicago, 5841 South Mary-land Avenue, MC2026 Chicago, IL 60637. Received February 2, 2006; revi-sion received April 17; revision accepted April 19. Address correspon-dence to: J.S. e-mail: [email protected]
©
AUR, 2006doi:10.1016/j.acra.2006.04.007low-dose computed tomographic (CT) scans has been pro-posed (6–8), although this is a highly controversial issue(9) at present. Chest radiography, which is simple to per-form and inexpensive, commonly has been used as a firstexamination for detecting lung cancers; however, it waswell shown that detecting lung cancer at an early stage onchest radiographs is a very difficult task for radiologists(6,10). Although CT is more sensitive than chest radiog-raphy in the detection of small noncalcified nodules (8), itis very difficult to distinguish benign from malignant le-sions, and interpretation of a large number of CT images
is time consuming for radiologists. Therefore, a number995
SHIRAISHI ET AL Academic Radiology, Vol 13, No 8, August 2006
of investigators are developing computer-aided diagnostic(CAD) schemes to facilitate early identification of lungcancer, including the detection of lung nodules on chestradiographs (11–15) and CT images (16–21), and the dis-tinction between benign and malignant lung nodules onchest radiographs (22,23) and CT images (24–26).
A number of CAD schemes were developed for thedetection of lung nodules and also for distinction betweenbenign and malignant lung nodules in chest radiographsduring the last 20 years (11–15,22,23), and several ob-server performance studies were carried out to show theusefulness of the application of each CAD scheme forradiologist decision making (22,27–30). However, interms of lung cancer diagnosis on chest radiographs, theeffect of these CAD schemes on radiologist decision mak-ing may be more complicated because radiologists arelikely to perform two tasks simultaneously for detectionand classification. To introduce these computerizedschemes into clinical practice, we believe the develop-ment and evaluation of an integrated computerizedscheme for such multiple functions as detection and clas-sification is necessary.
In this study, we combine two independent CADschemes for the detection and classification of lung nod-ules to evaluate the performance of radiologist decisionmaking for lung cancer diagnosis on chest radiographswhen the CAD scheme provided radiologists with boththe location and likelihood of malignancy of suspectedlung nodules.
MATERIALS AND METHODS
Our institutional review board approved the use of theimage database and participation of radiologists in thisobserver performance study. Informed consent for eachcase was waived because this is a retrospective study, andinformed consent for the observer performance study wasobtained from all observers.
Image DatabaseWe used 150 chest images, which consisted of 108
cases with solitary lung nodules (75 malignant and 33benign nodules) and 42 non-nodule cases, for training andtesting the computerized schemes. For the observer study,we selected 48 cases (24 malignant, 12 benign, and 12non-nodule cases) from the total of 150 cases by using astratified sampling method (31), which can keep the frac-tion of nodules constant in terms of their degrees of
subtlety.996
All chest images used in this study were selected fromthe Japanese Standard Digital Image (JSRT) Databasedeveloped by the Japanese Society of Radiological Tech-nology (32), which is available publicly. The JSRT Data-base includes 154 abnormal chest radiographs, each witha solitary pulmonary nodule, and 93 non-nodule chestradiographs. These original screen-film images were digi-tized with a 0.175-mm pixel size, matrix size of 2048 �2048, and 12 bits of gray scale. All cases in the JSRTDatabase were confirmed by means of CT examinationregarding the presence or absence of a lung nodule. Allnodule cases were classified as malignant based on histo-logic and cytologic examination or as benign based onhistologic examination, definitive isolation of a patho-genic organism, shrinkage and disappearance with the useof antibiotics, or no change observed during a 2-yearfollow-up. Nodule images included in the JSRT Databasewere divided into five subjective rating groups accordingto the degree of subtlety of the lung nodule. Numbers ofcases in the database for each group according to degreeof subtlety were 25 extremely subtle cases, 29 very subtlecases, 50 subtle cases, 38 relatively obvious cases, and 12obvious cases. Degree of subtlety correlated closely withlevel of radiologist performance in the detection of lungnodules, which was shown in receiver operating charac-teristic (ROC) analysis by 20 radiologists (32).
We selected 108 lung nodule cases from the original154 cases, with several exclusion criteria determined bytwo chest radiologists (H.A. and F.L.) as follows: (1)nodules categorized as either extremely subtle or ex-tremely obvious (n � 37), (2) nodule size larger than35 mm on the chest radiograph (n � 3), (3) another un-confirmed abnormality (ie, nodule) in the image (n � 5),and (4) contour of nodule not well defined (n � 1). Inaddition, 42 non-nodule cases were selected randomlyfrom the original 93 non-nodule cases. Table 1 lists finaldiagnoses for the 108 nodule cases (75 malignant and 33benign) and selected 36 cases (24 malignant and 12 be-nign) used in the observer performance study. Mean sizesof the 75 malignant and 33 benign nodules were 17.8 mm(range, 9.5–31.1 mm) and 15.2 mm (range, 8.9–28.8 mm),respectively.
Computerized Scheme for Detection of LungNodules
The computerized nodule detection scheme used in thisstudy consisted of five steps, ie, (1) preprocessing andsegmentation of lung fields by use of ribcage edge detec-
tion techniques (33,34), (2) identification of initial nodule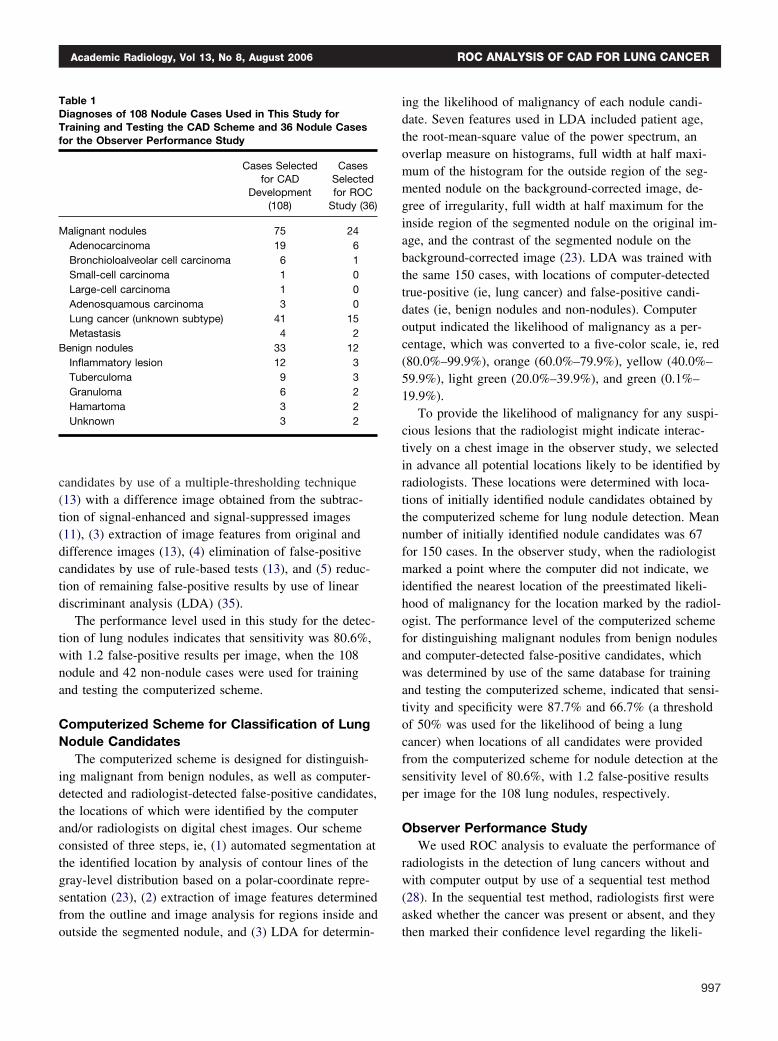
Academic Radiology, Vol 13, No 8, August 2006 ROC ANALYSIS OF CAD FOR LUNG CANCER
candidates by use of a multiple-thresholding technique(13) with a difference image obtained from the subtrac-tion of signal-enhanced and signal-suppressed images(11), (3) extraction of image features from original anddifference images (13), (4) elimination of false-positivecandidates by use of rule-based tests (13), and (5) reduc-tion of remaining false-positive results by use of lineardiscriminant analysis (LDA) (35).
The performance level used in this study for the detec-tion of lung nodules indicates that sensitivity was 80.6%,with 1.2 false-positive results per image, when the 108nodule and 42 non-nodule cases were used for trainingand testing the computerized scheme.
Computerized Scheme for Classification of LungNodule Candidates
The computerized scheme is designed for distinguish-ing malignant from benign nodules, as well as computer-detected and radiologist-detected false-positive candidates,the locations of which were identified by the computerand/or radiologists on digital chest images. Our schemeconsisted of three steps, ie, (1) automated segmentation atthe identified location by analysis of contour lines of thegray-level distribution based on a polar-coordinate repre-sentation (23), (2) extraction of image features determinedfrom the outline and image analysis for regions inside and
Table 1Diagnoses of 108 Nodule Cases Used in This Study forTraining and Testing the CAD Scheme and 36 Nodule Casesfor the Observer Performance Study
Cases Selectedfor CAD
Development(108)
CasesSelectedfor ROC
Study (36)
Malignant nodules 75 24Adenocarcinoma 19 6Bronchioloalveolar cell carcinoma 6 1Small-cell carcinoma 1 0Large-cell carcinoma 1 0Adenosquamous carcinoma 3 0Lung cancer (unknown subtype) 41 15Metastasis 4 2
Benign nodules 33 12Inflammatory lesion 12 3Tuberculoma 9 3Granuloma 6 2Hamartoma 3 2Unknown 3 2
outside the segmented nodule, and (3) LDA for determin-
ing the likelihood of malignancy of each nodule candi-date. Seven features used in LDA included patient age,the root-mean-square value of the power spectrum, anoverlap measure on histograms, full width at half maxi-mum of the histogram for the outside region of the seg-mented nodule on the background-corrected image, de-gree of irregularity, full width at half maximum for theinside region of the segmented nodule on the original im-age, and the contrast of the segmented nodule on thebackground-corrected image (23). LDA was trained withthe same 150 cases, with locations of computer-detectedtrue-positive (ie, lung cancer) and false-positive candi-dates (ie, benign nodules and non-nodules). Computeroutput indicated the likelihood of malignancy as a per-centage, which was converted to a five-color scale, ie, red(80.0%–99.9%), orange (60.0%–79.9%), yellow (40.0%–59.9%), light green (20.0%–39.9%), and green (0.1%–19.9%).
To provide the likelihood of malignancy for any suspi-cious lesions that the radiologist might indicate interac-tively on a chest image in the observer study, we selectedin advance all potential locations likely to be identified byradiologists. These locations were determined with loca-tions of initially identified nodule candidates obtained bythe computerized scheme for lung nodule detection. Meannumber of initially identified nodule candidates was 67for 150 cases. In the observer study, when the radiologistmarked a point where the computer did not indicate, weidentified the nearest location of the preestimated likeli-hood of malignancy for the location marked by the radiol-ogist. The performance level of the computerized schemefor distinguishing malignant nodules from benign nodulesand computer-detected false-positive candidates, whichwas determined by use of the same database for trainingand testing the computerized scheme, indicated that sensi-tivity and specificity were 87.7% and 66.7% (a thresholdof 50% was used for the likelihood of being a lungcancer) when locations of all candidates were providedfrom the computerized scheme for nodule detection at thesensitivity level of 80.6%, with 1.2 false-positive resultsper image for the 108 lung nodules, respectively.
Observer Performance StudyWe used ROC analysis to evaluate the performance of
radiologists in the detection of lung cancers without andwith computer output by use of a sequential test method(28). In the sequential test method, radiologists first wereasked whether the cancer was present or absent, and they
then marked their confidence level regarding the likeli-997
SHIRAISHI ET AL Academic Radiology, Vol 13, No 8, August 2006
hood of the presence of a cancer by using a continuousrating scale displayed on the monitor (29,30). After theradiologist marked the initial level of confidence, a num-ber of computer outputs were shown on the chest image,and they again were asked to mark their confidence levelif they wished to change the initial result. Nine radiolo-gists, including five chest radiologists and four generalradiologists, participated in this observer study.
In our observer study interface, locations of computer-detected nodule candidates were marked by arrowheads,with a five-color scale corresponding to different levels oflikelihood of malignancy. In addition, radiologists wereable to obtain the likelihood of malignancy for any sus-pected nodule candidates that could be located interac-tively by the radiologist, but were not detected by thecomputer. We used one monochrome (1600 � 1200pixel; 800 cd/m2; Totoku Electric Co Ltd, Tokyo, Japan)and one color liquid crystal display (LCD) monitor (1600� 1200 pixel; 220 cd/m2; Totoku Electric Co Ltd) forthis observer performance study. We used the color LCDmonitor for displaying computer output and other infor-mation for the observer study, and the high-contrast(600:1) monochrome LCD monitor, for interpreting chestimages. Radiologists were allowed to change the windowlevel and width on the LCD monitor. Reading time wasnot limited. Radiologists were asked about the presenceof lung cancer on an image, and they then marked theirconfidence level regarding the likelihood of the presenceof lung cancer by using a continuous rating scale (26) andalso identified the location of the most suspicious lesion.It is important to note that radiologists were forced toselect the most suspicious location for Localization ROC(LROC) analysis (36), even if they believed there was nolung cancer on the image. As soon as the radiologistmarked the initial level of confidence and location, alarge circle with one of five colors corresponding to thecomputer estimation of the likelihood of malignancy wasdisplayed at the location the radiologist indicated. In addi-tion, computer outputs of nodule candidates detected bythe computer and color-coded likelihood of malignancyfor each were displayed on the monitor with arrowheads.The radiologist then was asked again to mark his or herconfidence level and location if he or she wished tochange from the initial decision.
Before training and testing, radiologists were instructedas follows: (1) the purpose of this study is to evaluate theusefulness of CAD for lung cancer diagnosis on chestradiographs; (2) the role of CAD output is to serve as a
“second opinion”; (3) 50% of 48 chest images include998
solitary lung cancer, and another 50% of chest images arenon-nodule cases or include benign nodules; (4) the digi-tized chest image is shown on the monochrome LCDmonitor on the right side; (5) CAD output is shown onthe color LCD monitor with color markers indicating thelikelihood of the lesion being lung cancer as follows: red,high probability of being lung cancer; yellow, moderateprobability; and green, low probability; (6) computer per-formance for marking of lung nodules is about 80% sen-sitivity, with 1.2 false-positive results per image; (7)accuracy of computer output for the distinction of lungcancer and other benign nodules or false-positive resultsis about 85% sensitivity and 70% specificity when athreshold of 50% is used as the cutoff value for benignversus malignant; (8) click on a bar on the screen by us-ing a mouse to indicate your confidence level regardingthe presence or absence of a lung cancer, first withoutand then with computer output; (9) after each decision(without and with CAD), click one location by using theright button of a mouse; and (10) try to use the ratingscale consistently and uniformly.
For a training session, we used another four cases (twolung cancer, one benign, and one non-nodule case) se-lected from the 150 cases. In the training session only,the actual diagnosis (ie, location of lung cancer) was indi-cated on the monitor after the radiologists’ final decisionbased on the computer output.
ROC analysis was used for comparison of radiologists’performances in lung cancer diagnosis on chest radio-graphs without and with computer output. A binormalROC curve was fitted to each radiologist’s confidence-rating data from the two reading conditions with quasi-maximum likelihood estimation (37). A computer pro-gram (PROPROC, [Metz CE, The University of Chicago,IL] [38]) was used for obtaining binormal ROC andLROC curves for each radiologist. The statistical signifi-cance of the difference between ROC curves obtainedwithout and with computer output was tested by use ofthe computer program, LABMRMC (Metz CE, The Uni-versity of Chicago, IL)(39), which uses analyses of vari-ance in pseudo-values of the area under the best fit binor-mal ROC curve (AUC) calculated from all rating scoresof all radiologists (40). In addition, we applied JAFROC(Chakraborty DP, University of Pittsburgh, PA) software(41,42) to test the statistical significance of differencebetween two LROC data sets. JAFROC software was de-veloped by Chakraborty and Berbaum (42) for estimatingthe statistically significant difference between two aver-
aged free-response ROC (FROC) curves by use of the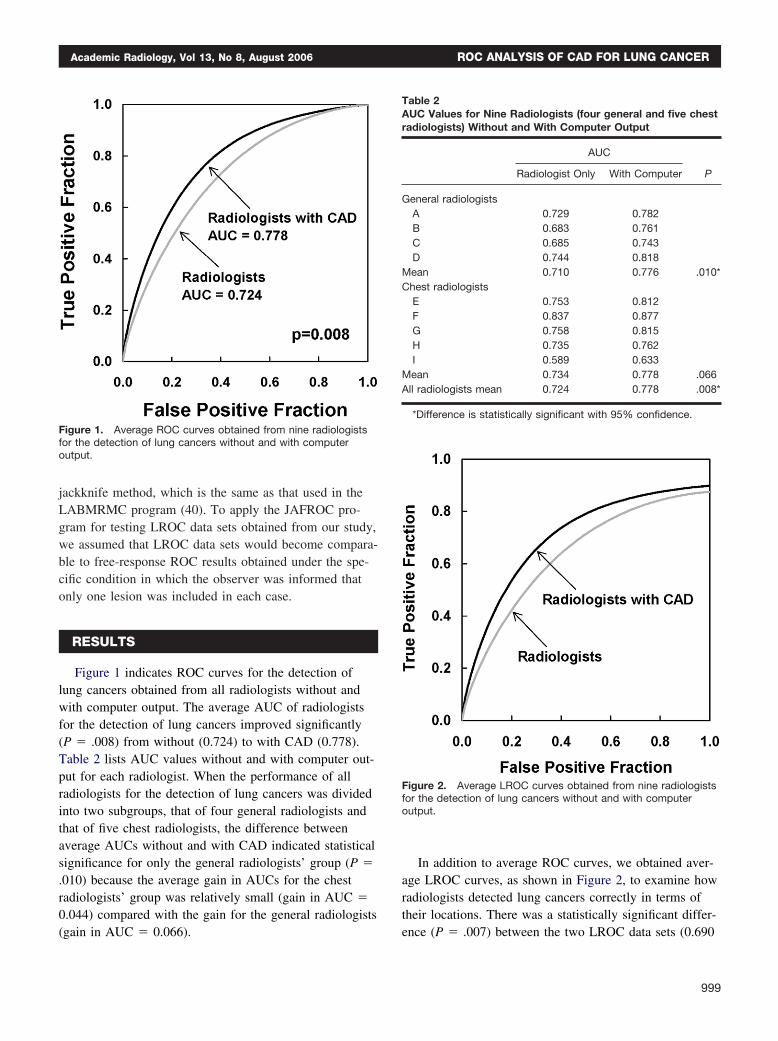
Academic Radiology, Vol 13, No 8, August 2006 ROC ANALYSIS OF CAD FOR LUNG CANCER
jackknife method, which is the same as that used in theLABMRMC program (40). To apply the JAFROC pro-gram for testing LROC data sets obtained from our study,we assumed that LROC data sets would become compara-ble to free-response ROC results obtained under the spe-cific condition in which the observer was informed thatonly one lesion was included in each case.
RESULTS
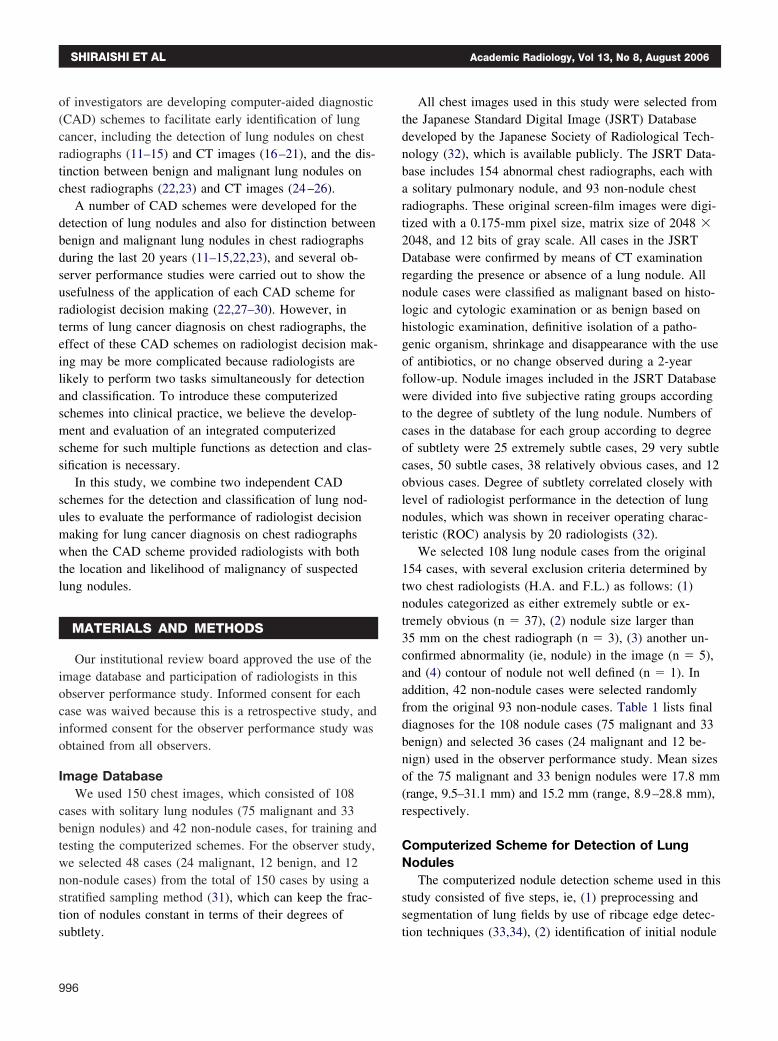
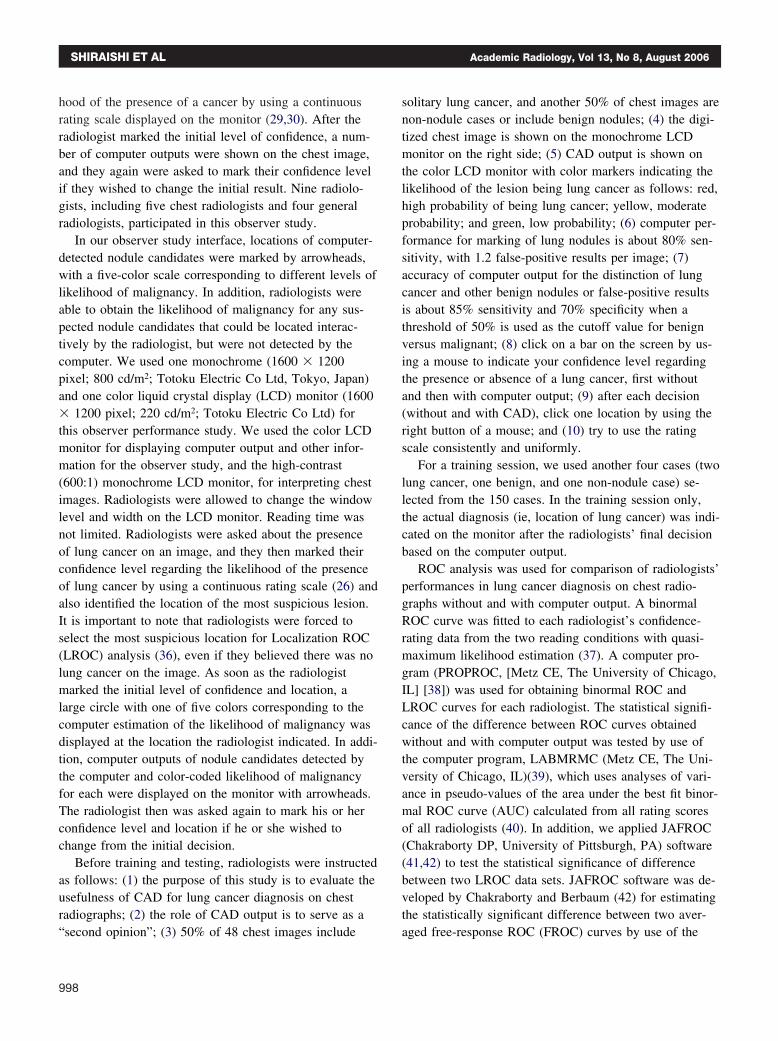
Figure 1 indicates ROC curves for the detection oflung cancers obtained from all radiologists without andwith computer output. The average AUC of radiologistsfor the detection of lung cancers improved significantly(P � .008) from without (0.724) to with CAD (0.778).Table 2 lists AUC values without and with computer out-put for each radiologist. When the performance of allradiologists for the detection of lung cancers was dividedinto two subgroups, that of four general radiologists andthat of five chest radiologists, the difference betweenaverage AUCs without and with CAD indicated statisticalsignificance for only the general radiologists’ group (P �.010) because the average gain in AUCs for the chestradiologists’ group was relatively small (gain in AUC �0.044) compared with the gain for the general radiologists
Figure 1. Average ROC curves obtained from nine radiologistsfor the detection of lung cancers without and with computeroutput.
(gain in AUC � 0.066).
In addition to average ROC curves, we obtained aver-age LROC curves, as shown in Figure 2, to examine howradiologists detected lung cancers correctly in terms oftheir locations. There was a statistically significant differ-
Table 2AUC Values for Nine Radiologists (four general and five chestradiologists) Without and With Computer Output
AUC
PRadiologist Only With Computer
General radiologistsA 0.729 0.782B 0.683 0.761C 0.685 0.743D 0.744 0.818
Mean 0.710 0.776 .010*Chest radiologists
E 0.753 0.812F 0.837 0.877G 0.758 0.815H 0.735 0.762I 0.589 0.633
Mean 0.734 0.778 .066All radiologists mean 0.724 0.778 .008*
*Difference is statistically significant with 95% confidence.
Figure 2. Average LROC curves obtained from nine radiologistsfor the detection of lung cancers without and with computeroutput.
ence (P � .007) between the two LROC data sets (0.690
999
SHIRAISHI ET AL Academic Radiology, Vol 13, No 8, August 2006
vs 0.742) for all radiologists. From LROC analysis, itshould be noted that the mean number of lung cancers notdetected correctly by all radiologists with CAD outputwas 2.44 (10.2%) of 24 lung cancers. However, of thesefalse-negative cases, the mean number of lung cancersthat was marked correctly by the computer was 2.11, butthese were not considered to be lung cancer by the major-ity of radiologists; these cases therefore were consideredto be “nonactionable” and extremely difficult lung-nodulecases (29) that were included in this observer study.
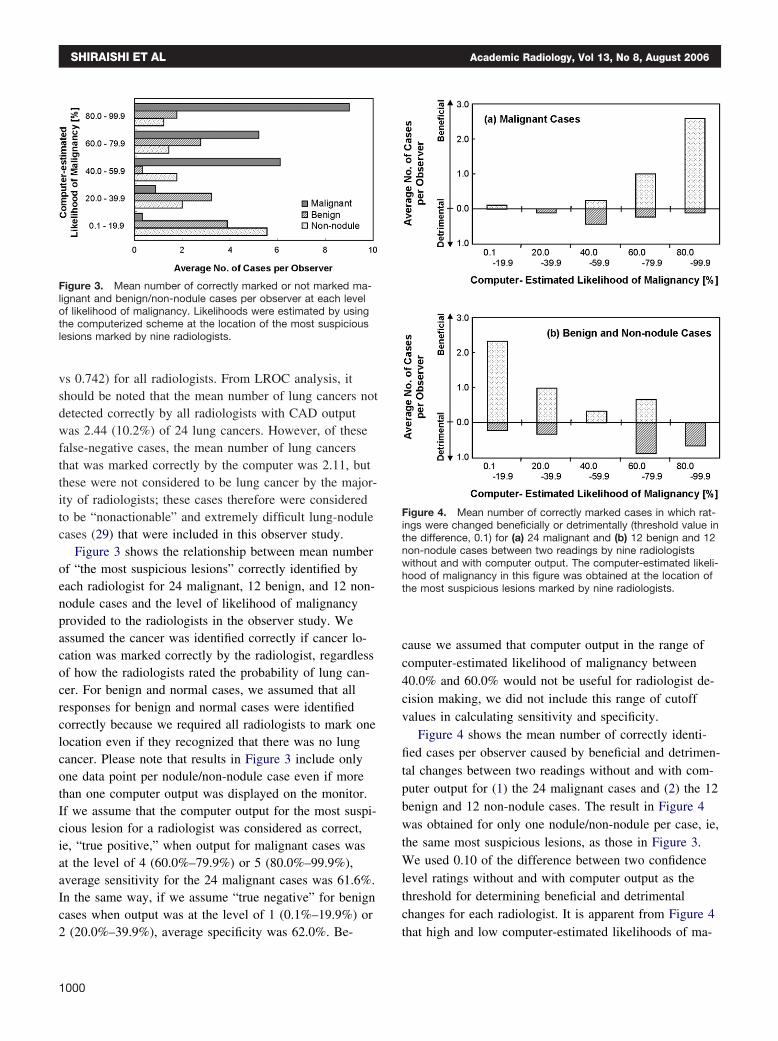
Figure 3 shows the relationship between mean numberof “the most suspicious lesions” correctly identified byeach radiologist for 24 malignant, 12 benign, and 12 non-nodule cases and the level of likelihood of malignancyprovided to the radiologists in the observer study. Weassumed the cancer was identified correctly if cancer lo-cation was marked correctly by the radiologist, regardlessof how the radiologists rated the probability of lung can-cer. For benign and normal cases, we assumed that allresponses for benign and normal cases were identifiedcorrectly because we required all radiologists to mark onelocation even if they recognized that there was no lungcancer. Please note that results in Figure 3 include onlyone data point per nodule/non-nodule case even if morethan one computer output was displayed on the monitor.If we assume that the computer output for the most suspi-cious lesion for a radiologist was considered as correct,ie, “true positive,” when output for malignant cases wasat the level of 4 (60.0%–79.9%) or 5 (80.0%–99.9%),average sensitivity for the 24 malignant cases was 61.6%.In the same way, if we assume “true negative” for benigncases when output was at the level of 1 (0.1%–19.9%) or
Figure 3. Mean number of correctly marked or not marked ma-lignant and benign/non-nodule cases per observer at each levelof likelihood of malignancy. Likelihoods were estimated by usingthe computerized scheme at the location of the most suspiciouslesions marked by nine radiologists.
2 (20.0%–39.9%), average specificity was 62.0%. Be-
1000
cause we assumed that computer output in the range ofcomputer-estimated likelihood of malignancy between40.0% and 60.0% would not be useful for radiologist de-cision making, we did not include this range of cutoffvalues in calculating sensitivity and specificity.
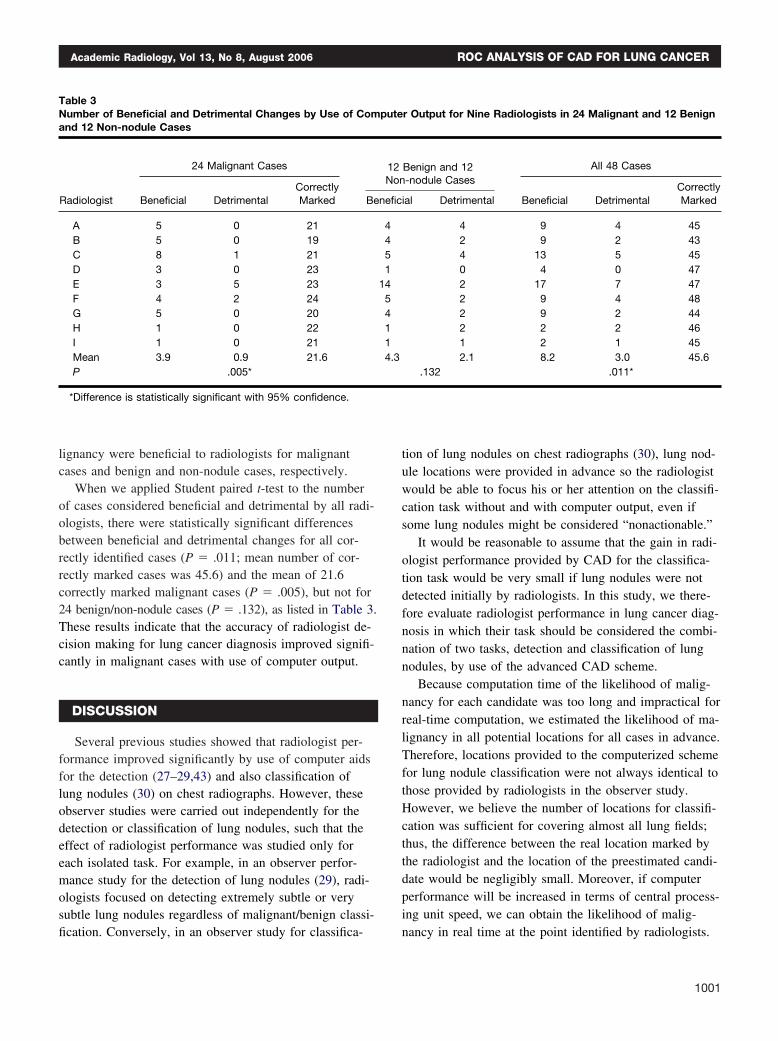
Figure 4 shows the mean number of correctly identi-fied cases per observer caused by beneficial and detrimen-tal changes between two readings without and with com-puter output for (1) the 24 malignant cases and (2) the 12benign and 12 non-nodule cases. The result in Figure 4was obtained for only one nodule/non-nodule per case, ie,the same most suspicious lesions, as those in Figure 3.We used 0.10 of the difference between two confidencelevel ratings without and with computer output as thethreshold for determining beneficial and detrimentalchanges for each radiologist. It is apparent from Figure 4
Figure 4. Mean number of correctly marked cases in which rat-ings were changed beneficially or detrimentally (threshold value inthe difference, 0.1) for (a) 24 malignant and (b) 12 benign and 12non-nodule cases between two readings by nine radiologistswithout and with computer output. The computer-estimated likeli-hood of malignancy in this figure was obtained at the location ofthe most suspicious lesions marked by nine radiologists.
that high and low computer-estimated likelihoods of ma-
Academic Radiology, Vol 13, No 8, August 2006 ROC ANALYSIS OF CAD FOR LUNG CANCER
lignancy were beneficial to radiologists for malignantcases and benign and non-nodule cases, respectively.
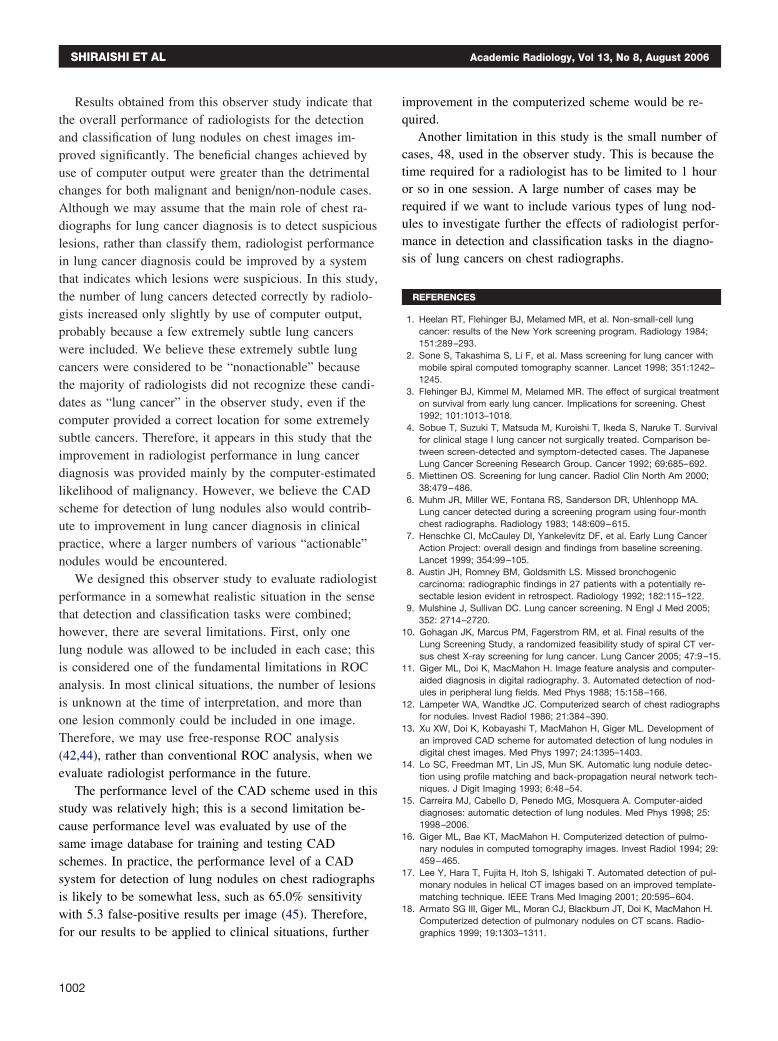
When we applied Student paired t-test to the numberof cases considered beneficial and detrimental by all radi-ologists, there were statistically significant differencesbetween beneficial and detrimental changes for all cor-rectly identified cases (P � .011; mean number of cor-rectly marked cases was 45.6) and the mean of 21.6correctly marked malignant cases (P � .005), but not for24 benign/non-nodule cases (P � .132), as listed in Table 3.These results indicate that the accuracy of radiologist de-cision making for lung cancer diagnosis improved signifi-cantly in malignant cases with use of computer output.
DISCUSSION
Several previous studies showed that radiologist per-formance improved significantly by use of computer aidsfor the detection (27–29,43) and also classification oflung nodules (30) on chest radiographs. However, theseobserver studies were carried out independently for thedetection or classification of lung nodules, such that theeffect of radiologist performance was studied only foreach isolated task. For example, in an observer perfor-mance study for the detection of lung nodules (29), radi-ologists focused on detecting extremely subtle or verysubtle lung nodules regardless of malignant/benign classi-
Table 3Number of Beneficial and Detrimental Changes by Use of Comand 12 Non-nodule Cases
Radiologist
24 Malignant Cases
Beneficial DetrimentalCorrectlyMarked Be
A 5 0 21B 5 0 19C 8 1 21D 3 0 23E 3 5 23F 4 2 24G 5 0 20H 1 0 22I 1 0 21Mean 3.9 0.9 21.6P .005*
*Difference is statistically significant with 95% confidence.
fication. Conversely, in an observer study for classifica-
tion of lung nodules on chest radiographs (30), lung nod-ule locations were provided in advance so the radiologistwould be able to focus his or her attention on the classifi-cation task without and with computer output, even ifsome lung nodules might be considered “nonactionable.”
It would be reasonable to assume that the gain in radi-ologist performance provided by CAD for the classifica-tion task would be very small if lung nodules were notdetected initially by radiologists. In this study, we there-fore evaluate radiologist performance in lung cancer diag-nosis in which their task should be considered the combi-nation of two tasks, detection and classification of lungnodules, by use of the advanced CAD scheme.
Because computation time of the likelihood of malig-nancy for each candidate was too long and impractical forreal-time computation, we estimated the likelihood of ma-lignancy in all potential locations for all cases in advance.Therefore, locations provided to the computerized schemefor lung nodule classification were not always identical tothose provided by radiologists in the observer study.However, we believe the number of locations for classifi-cation was sufficient for covering almost all lung fields;thus, the difference between the real location marked bythe radiologist and the location of the preestimated candi-date would be negligibly small. Moreover, if computerperformance will be increased in terms of central process-ing unit speed, we can obtain the likelihood of malig-
r Output for Nine Radiologists in 24 Malignant and 12 Benign
Benign and 12-nodule Cases
All 48 Cases
ial Detrimental Beneficial DetrimentalCorrectlyMarked
4 9 4 452 9 2 434 13 5 450 4 0 472 17 7 472 9 4 482 9 2 442 2 2 461 2 1 452.1 8.2 3.0 45.6
.132 .011*
pute
12Non
nefic
4451
1454114.3
nancy in real time at the point identified by radiologists.
1001
SHIRAISHI ET AL Academic Radiology, Vol 13, No 8, August 2006
Results obtained from this observer study indicate thatthe overall performance of radiologists for the detectionand classification of lung nodules on chest images im-proved significantly. The beneficial changes achieved byuse of computer output were greater than the detrimentalchanges for both malignant and benign/non-nodule cases.Although we may assume that the main role of chest ra-diographs for lung cancer diagnosis is to detect suspiciouslesions, rather than classify them, radiologist performancein lung cancer diagnosis could be improved by a systemthat indicates which lesions were suspicious. In this study,the number of lung cancers detected correctly by radiolo-gists increased only slightly by use of computer output,probably because a few extremely subtle lung cancerswere included. We believe these extremely subtle lungcancers were considered to be “nonactionable” becausethe majority of radiologists did not recognize these candi-dates as “lung cancer” in the observer study, even if thecomputer provided a correct location for some extremelysubtle cancers. Therefore, it appears in this study that theimprovement in radiologist performance in lung cancerdiagnosis was provided mainly by the computer-estimatedlikelihood of malignancy. However, we believe the CADscheme for detection of lung nodules also would contrib-ute to improvement in lung cancer diagnosis in clinicalpractice, where a larger numbers of various “actionable”nodules would be encountered.
We designed this observer study to evaluate radiologistperformance in a somewhat realistic situation in the sensethat detection and classification tasks were combined;however, there are several limitations. First, only onelung nodule was allowed to be included in each case; thisis considered one of the fundamental limitations in ROCanalysis. In most clinical situations, the number of lesionsis unknown at the time of interpretation, and more thanone lesion commonly could be included in one image.Therefore, we may use free-response ROC analysis(42,44), rather than conventional ROC analysis, when weevaluate radiologist performance in the future.
The performance level of the CAD scheme used in thisstudy was relatively high; this is a second limitation be-cause performance level was evaluated by use of thesame image database for training and testing CADschemes. In practice, the performance level of a CADsystem for detection of lung nodules on chest radiographsis likely to be somewhat less, such as 65.0% sensitivitywith 5.3 false-positive results per image (45). Therefore,
for our results to be applied to clinical situations, further1002
improvement in the computerized scheme would be re-quired.
Another limitation in this study is the small number ofcases, 48, used in the observer study. This is because thetime required for a radiologist has to be limited to 1 houror so in one session. A large number of cases may berequired if we want to include various types of lung nod-ules to investigate further the effects of radiologist perfor-mance in detection and classification tasks in the diagno-sis of lung cancers on chest radiographs.
REFERENCES
1. Heelan RT, Flehinger BJ, Melamed MR, et al. Non-small-cell lungcancer: results of the New York screening program. Radiology 1984;151:289–293.
2. Sone S, Takashima S, Li F, et al. Mass screening for lung cancer withmobile spiral computed tomography scanner. Lancet 1998; 351:1242–1245.
3. Flehinger BJ, Kimmel M, Melamed MR. The effect of surgical treatmenton survival from early lung cancer. Implications for screening. Chest1992; 101:1013–1018.
4. Sobue T, Suzuki T, Matsuda M, Kuroishi T, Ikeda S, Naruke T. Survivalfor clinical stage I lung cancer not surgically treated. Comparison be-tween screen-detected and symptom-detected cases. The JapaneseLung Cancer Screening Research Group. Cancer 1992; 69:685–692.
5. Miettinen OS. Screening for lung cancer. Radiol Clin North Am 2000;38:479–486.
6. Muhm JR, Miller WE, Fontana RS, Sanderson DR, Uhlenhopp MA.Lung cancer detected during a screening program using four-monthchest radiographs. Radiology 1983; 148:609–615.
7. Henschke CI, McCauley DI, Yankelevitz DF, et al. Early Lung CancerAction Project: overall design and findings from baseline screening.Lancet 1999; 354:99–105.
8. Austin JH, Romney BM, Goldsmith LS. Missed bronchogeniccarcinoma: radiographic findings in 27 patients with a potentially re-sectable lesion evident in retrospect. Radiology 1992; 182:115–122.
9. Mulshine J, Sullivan DC. Lung cancer screening. N Engl J Med 2005;352: 2714–2720.
10. Gohagan JK, Marcus PM, Fagerstrom RM, et al. Final results of theLung Screening Study, a randomized feasibility study of spiral CT ver-sus chest X-ray screening for lung cancer. Lung Cancer 2005; 47:9–15.
11. Giger ML, Doi K, MacMahon H. Image feature analysis and computer-aided diagnosis in digital radiography. 3. Automated detection of nod-ules in peripheral lung fields. Med Phys 1988; 15:158–166.
12. Lampeter WA, Wandtke JC. Computerized search of chest radiographsfor nodules. Invest Radiol 1986; 21:384–390.
13. Xu XW, Doi K, Kobayashi T, MacMahon H, Giger ML. Development ofan improved CAD scheme for automated detection of lung nodules indigital chest images. Med Phys 1997; 24:1395–1403.
14. Lo SC, Freedman MT, Lin JS, Mun SK. Automatic lung nodule detec-tion using profile matching and back-propagation neural network tech-niques. J Digit Imaging 1993; 6:48–54.
15. Carreira MJ, Cabello D, Penedo MG, Mosquera A. Computer-aideddiagnoses: automatic detection of lung nodules. Med Phys 1998; 25:1998–2006.
16. Giger ML, Bae KT, MacMahon H. Computerized detection of pulmo-nary nodules in computed tomography images. Invest Radiol 1994; 29:459–465.
17. Lee Y, Hara T, Fujita H, Itoh S, Ishigaki T. Automated detection of pul-monary nodules in helical CT images based on an improved template-matching technique. IEEE Trans Med Imaging 2001; 20:595–604.
18. Armato SG III, Giger ML, Moran CJ, Blackburn JT, Doi K, MacMahon H.
Computerized detection of pulmonary nodules on CT scans. Radio-graphics 1999; 19:1303–1311.
Academic Radiology, Vol 13, No 8, August 2006 ROC ANALYSIS OF CAD FOR LUNG CANCER
19. Armato SG III, Giger ML, MacMahon H. Automated detection of lungnodules in CT scans: preliminary results. Med Phys 2001; 28:1552–1561.
20. Gurcan MN, Sahiner B, Petrick N, et al. Lung nodule detection on tho-racic computed tomography images: preliminary evaluation of a com-puter-aided diagnosis system. Med Phys 2002; 29:2552–2558.
21. Arimura H, Katsuragawa S, Suzuki K, et al. Computerized scheme forautomated detection of lung nodules in low-dose computed tomogra-phy images for lung cancer screening. Acad Radiol 2004; 11:617–629.
22. Nakamura K, Yoshida H, Engelmann R, et al. Computerized analysis ofthe likelihood of malignancy in solitary pulmonary nodules with use ofartificial neural networks. Radiology 2000; 214:823–830.
23. Aoyama M, Li Q, Katsuragawa S, MacMahon H, Doi K. Automatedcomputerized scheme for distinction between benign and malignantsolitary pulmonary nodules on chest images. Med Phys 2002; 29:701–708.
24. McNitt-Gray MF, Hart EM, Wyckoff N, Sayre JW, Goldin JG, AberleDR. A pattern classification approach to characterizing solitary pulmo-nary nodules imaged on high resolution CT: preliminary results. MedPhys 1999; 26:880–888.
25. Aoyama M, Li Q, Katsuragawa S, Li F, Sone S, Doi K. Computerizedscheme for determination of the likelihood measure of malignancy forpulmonary nodules on low-dose CT images. Med Phys 2003; 30:387–394.
26. Armato SG III, Altman MB, Wilkie J, et al. Automated lung nodule clas-sification following automated nodule detection on CT: a serial ap-proach. Med Phys 2003; 30:1188–1197.
27. Matsumoto T, Yoshimura H, Giger ML, et al. Potential usefulness ofcomputerized nodule detection in screening programs for lung cancer.Invest Radiol 1992; 27:471–475.
28. Kobayashi T, Xu XW, MacMahon H, Metz CE, Doi K. Effect of a com-puter-aided diagnosis scheme on radiologists’ performance in detec-tion of lung nodules on radiographs. Radiology 1996; 199:843–848.
29. Shiraishi J, Abe H, Engelmann R, Doi K. Effect of high sensitivity in acomputerized scheme for detecting extremely subtle solitary pulmonarynodules in chest radiographs: observer performance study. AcadRadiol 2003; 10:1302–1311.
30. Shiraishi J, Abe H, Engelmann R, Aoyama M, MacMahon H, Doi K.Computer-aided diagnosis to distinguish benign from malignant solitarypulmonary nodules on radiographs: ROC analysis of radiologists’ per-formance—initial experience. Radiology 2003; 227:469–474.
31. Metz CE. Some practical issues of experimental design and data anal-ysis in radiological ROC studies. Invest Radiol 1989; 24:234–245.
32. Shiraishi J, Katsuragawa S, Ikezoe J, et al. Development of a digitalimage database for chest radiographs with and without a lung nodule:receiver operating characteristic analysis of radiologists’ detection ofpulmonary nodules. AJR Am J Roentgenol 2000; 174:71–74.
33. Xu XW, Doi K. Image feature analysis for computer-aided diagnosis:detection of right and left hemidiaphragm edges and delineation oflung field in chest radiographs. Med Phys 1996; 23:1613–1624.
34. Xu XW, Doi K. Image feature analysis for computer-aided diagnosis:accurate determination of ribcage boundary in chest radiographs. MedPhys 1995; 22:617–626.
35. Wu YC, Doi K, Giger ML, Metz CE, Zhang W. Reduction of false posi-tives in computerized detection of lung nodules in chest radiographsusing artificial neural networks, discriminant analysis, and a rule-basedscheme. J Digit Imaging 1994; 7:196–207.
36. Starr SJ, Metz CE, Lusted LB, Goodenough DJ. Visual detection andlocalization of radiographic images. Radiology 1975; 116:533–538.
37. Metz CE, Herman BA, Shen JH. Maximum likelihood estimation of re-ceiver operating characteristic (ROC) curves from continuously-distrib-uted data. Stat Med 1998; 17:1033–1053.
38. Pan X, Metz CE. The “proper” binormal model: parametric receiver op-erating characteristic curve estimation with degenerate data. Acad Ra-diol 1997; 4:380–389.
39. Metz CE. LABMRMC software. Accessed at: http://www-radiology.uchicago.edu/krl/roc_soft.htm.
40. Dorfman DD, Berbaum KS, Metz CE. Receiver operating characteristicrating analysis. Generalization to the population of readers and patientswith the jackknife method. Invest Radiol 1992; 27:723–731.
41. Zheng B, Chakraborty DP, Rockette HE, Maitz GS, Gur D. A compari-son of two data analyses from two observer performance studies usingJackknife ROC and JAFROC. Med Phys 2005; 32:1031–1034.
42. Chakraborty DP, Berbaum KS. Observer studies involving detectionand localization: modeling, analysis, and validation. Med Phys 2004;31:2313–2330.
43. Kakeda S, Moriya J, Sato H, et al. Improved detection of lung noduleson chest radiographs using a commercial computer-aided diagnosissystem. AJR Am J Roentgenol 2004; 182:505–510.
44. Chakraborty DP, Winter LH. Free-response methodology: alternateanalysis and a new observer-performance experiment. Radiology 1990;174:873–881.
45. Freedman MT, Lo SCB, Osicka T, et al. Computer aided detection oflung cancer on chest radiographs: Effect of machine CAD false positive
locations on radiologists’ behavior. Proc SPIE Medical Imaging: ImageProcessing 2002; 4684:1311–1319.1003