computational fluid dynamics modeling of amsino … · computational fluid dynamics modeling of...
TRANSCRIPT
www.arelabs.com (p) 913-850-6630 (f) 913-850-6635
ARE Labs Inc. 2013 project # 10766.2 for Amsino International, Inc. 1 of 16
Computational Fluid Dynamics Modeling of Amsino OneMask™ Oxygen Mask
Abstract
This study’s objective was to model the Amsino OneMask™ Oxygen Mask using
Computational Fluid Dynamics (CFD). A three-dimensional CFD model was used to compute
the flow dynamics of a simulated breathing patient. The numerical model was based on the
finite volume method using an structured grid with tetrahedral cells. A low Reynolds number
realizable k−ε viscous model was used to predict turbulence, and the SIMPLE method was
used to compute the pressure. To account for the influence of the three-dimensional form of
the human body, a model that replicated the actual forms of a real human head was used.
First, steady-state conditions were examined with the assumption of steady inhalation (peak
inhalation velocity). Subsequently, an unsteady breathing model was introduced and
analyzed.
A custom user-defined function (UDF) was used to compute sinusoidal breathing
parameters for patient model. The UDF, in additional to controlling the sinusoidal velocity
profile, further controlled: temperature, O2 depletion, CO2 enrichment, and H2O enrichment
during exhalation cycle.
The quantitative analyses showed gas flow compositions, velocity profiles, temperatures,
and mixing profile of the Amsino OneMask™ Oxygen Mask under typical mask oxygen flow
rates and patient breathing parameters.
Introduction
Amsino OneMask™ Adult Oxygen Mask is a
combination device that allows the delivery of
aerosolized medication via a nebulizer or metered dose
inhaler while providing oxygen therapy. The mask
features an over-the-nose enclosed design with elastic
straps to hold the mask in position on the patient’s
face. The Amsino OneMask™ Adult Oxygen Mask
is equipped with a single opening near the mouth to
allow patients to imbibe food or drink during oxygen
or nebulization therapy. This opening also helps to
reduce CO2 buildup within the mask during oxygen
therapy while still delivering high patient oxygen
concentration.
The objective of the study was to fully
characterize the performance of the mask under typical
use using a computational fluid dynamics, CFD,
model. The CFD model was used to illustrate mixing
patterns, patient oxygen and carbon dioxide delivery
concentrations and aerosol drug delivery rates under a
variety of respiratory conditions and mask oxygen
flow rates.
www.arelabs.com (p) 913-850-6630 (f) 913-850-6635
ARE Labs Inc. 2013 project # 10766.2 for Amsino International, Inc. 2 of 16
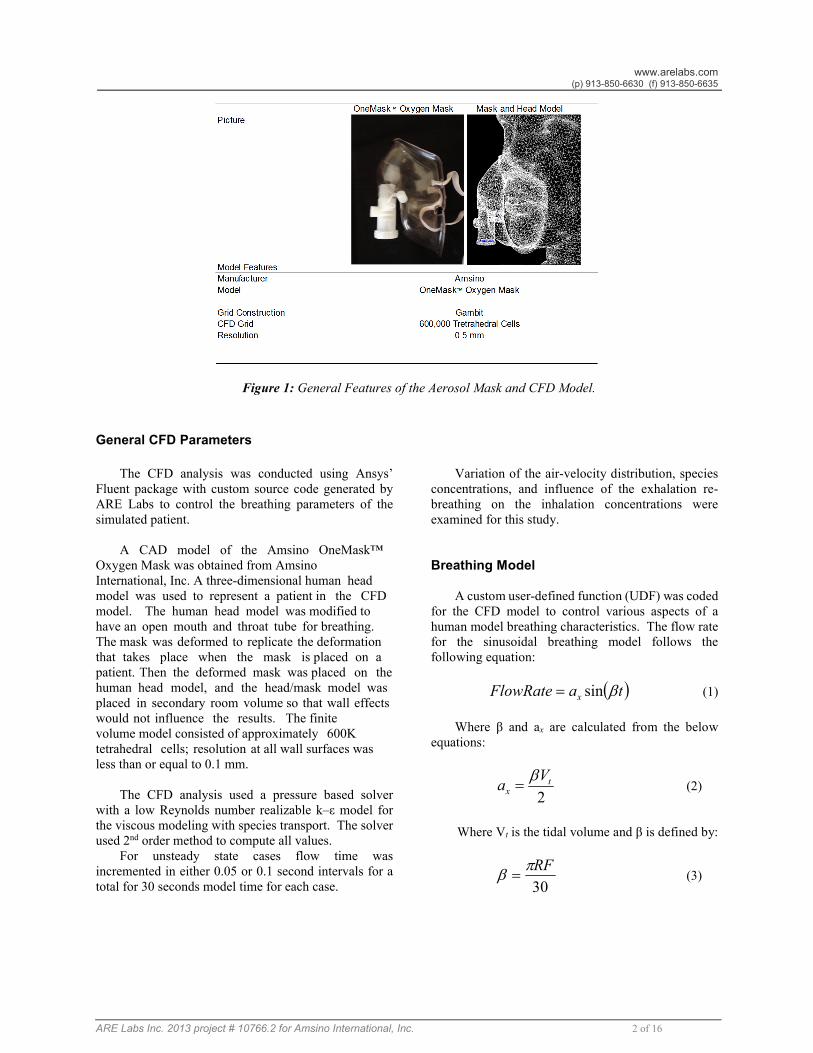
Figure 1: General Features of the Aerosol Mask and CFD Model.
General CFD Parameters
The CFD analysis was conducted using Ansys’
Fluent package with custom source code generated by
ARE Labs to control the breathing parameters of the
simulated patient.
A CAD model of the Amsino OneMask™
Oxygen Mask was obtained from Amsino
International, Inc. A three-dimensional human head
model was used to represent a patient in the CFD
model. The human head model was modified to
have an open mouth and throat tube for breathing.
The mask was deformed to replicate the deformation
that takes place when the mask is placed on a
patient. Then the deformed mask was placed on the
human head model, and the head/mask model was
placed in secondary room volume so that wall effects
would not influence the results. The finite
volume model consisted of approximately 600K
tetrahedral cells; resolution at all wall surfaces was
less than or equal to 0.1 mm.
The CFD analysis used a pressure based solver
with a low Reynolds number realizable k–ε model for
the viscous modeling with species transport. The solver
used 2nd order method to compute all values.
For unsteady state cases flow time was
incremented in either 0.05 or 0.1 second intervals for a
total for 30 seconds model time for each case.
Variation of the air-velocity distribution, species
concentrations, and influence of the exhalation re-
breathing on the inhalation concentrations were
examined for this study.
Breathing Model
A custom user-defined function (UDF) was coded
for the CFD model to control various aspects of a
human model breathing characteristics. The flow rate
for the sinusoidal breathing model follows the
following equation:
( )taFlowRate x βsin= (1)
Where β and ax are calculated from the below
equations:
2
tx
Va
β= (2)
Where Vt is the tidal volume and β is defined by:
30
RFπβ = (3)
www.arelabs.com (p) 913-850-6630 (f) 913-850-6635
ARE Labs Inc. 2013 project # 10766.2 for Amsino International, Inc. 3 of 16
Where RF is the Respiratory Frequency in
Breaths-Per-Minute (BPM). Figure 1 shows the flow
rate in liter-per-second for one breathing cycle period
using 11 BPM and a tidal volume of 700cc.
Figure 2: Flow Rate vs. Time for CFD Model
For a tidal volume of 700cc with a frequency of
11BPM the graph shows a peak inhalation flow rate of
0.4 lps (24 lpm) with a period of 5.4 seconds. This
peak flow rate was used for the Steady State Models
to obtain baseline performance.
Total minute volume for the above parameters can
be calculated by equation 4 below:
RFVMV t ⋅= (4)
Oxygen consumption was computed from the
volume-weighted average of the inhalation oxygen
concentration minus a constant use rate for
metabolism. For the models, a constant use rate of 4%
oxygen depletion from the incoming stream was
assumed which equates to an oxygen use rate of 0.310
lpm or 410mg/min.
Carbon dioxide enrichment in the exhalation
cycle is computed in a similar manner. The exhalation
is a function of the incoming carbon dioxide
concentration plus a carbon dioxide generation rate.
The generation rate was set equal to the oxygen
consumption rate which equals 0.310 lpm or 565
mg/min. Water vapor in the exhaled gasses were set to
be fully saturated upon exit and temperature was
assumed to equilibrate to a body temperature of 37°C
(310K) and set for the exhalation cycle.
Steady-State Cases Overview
Initial steady-state models were run to investigate
oxygen and aerosol delivery at peak inhalation
velocities. The steady-state models were used to
establish maximums/minimums and to compare
against the unsteady state runs during peak
inhalation/exhalation cycles. Although the steady-
state runs were helpful in evaluating the CFD model,
no real-world data could be extracted, and therefore all
data in the report are from the unsteady state cases.
Un-Steady Cases Overview
The Unsteady State Model incorporates the full
user-defined function (UDF) to control the simulated
human patient breathing parameters. The unsteady
state cases are divided into three main categories:
Oxygen delivery vs. Mask O2 flow rate, Respiratory
Parameter Effects on O2 delivery and Validation of
the CFD model using Nebulizer Test Data.
I. Mask O2 Flow Rate Effects on O2 and CO2 Delivery
The first set of cases focused on oxygen and
carbon dioxide concentrations delivered to the patient
as the oxygen flow rate to the mask is increased. The
mask oxygen flow was varied form 2 lpm up to 15 lpm.
II. Respiratory Parameters Effects on O2 and CO2
Delivery.
The second set of cases focuses on the effect of
changing breath per minute (BPM) while leaving the
tidal volume unchanged and the effect of changing
tidal volume while leaving breaths-per-minute
unchanged. Respiratory frequency was varied from
11 to 13 BPM, and tidal volume was varied from
700cc to 880cc.
III. CFD Model Validation – Nebulizer Drug Delivery.
The last set of unsteady state cases were used to
validate the model accuracy by comparing the model
output to actual run data. The run directly compares
the aerosol drug delivery rate (ug/min) to a patient
when using a nebulizer at a flow rate of 8 lpm. The
Breathing Cycle(11 Breaths per minute, Tidal Volume = 700cc)
-30
-20
-10
0
10
20
30
0 1 2 3 4 5 6
Time (seconds)
Flo
w R
ate
(lp
m)
www.arelabs.com (p) 913-850-6630 (f) 913-850-6635
ARE Labs Inc. 2013 project # 10766.2 for Amsino International, Inc. 4 of 16
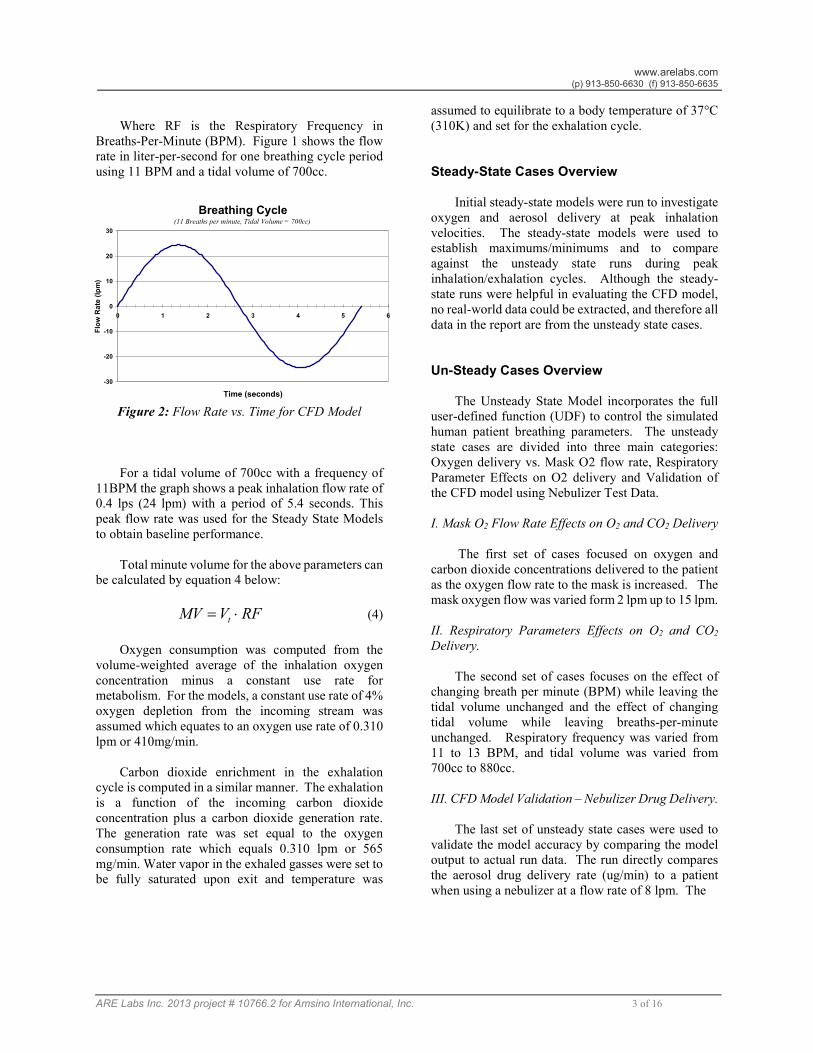
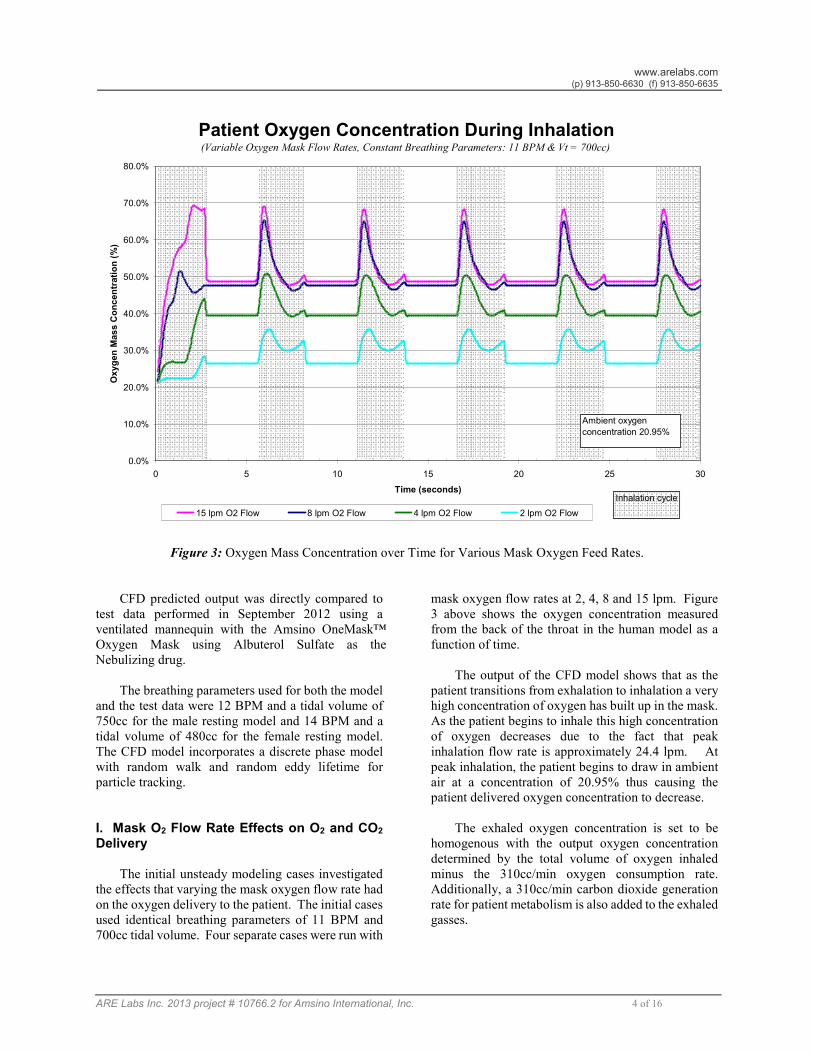
Figure 3: Oxygen Mass Concentration over Time for Various Mask Oxygen Feed Rates.
CFD predicted output was directly compared to
test data performed in September 2012 using a
ventilated mannequin with the Amsino OneMask™
Oxygen Mask using Albuterol Sulfate as the
Nebulizing drug.
The breathing parameters used for both the model
and the test data were 12 BPM and a tidal volume of
750cc for the male resting model and 14 BPM and a
tidal volume of 480cc for the female resting model.
The CFD model incorporates a discrete phase model
with random walk and random eddy lifetime for
particle tracking.
I. Mask O2 Flow Rate Effects on O2 and CO2
Delivery
The initial unsteady modeling cases investigated
the effects that varying the mask oxygen flow rate had
on the oxygen delivery to the patient. The initial cases
used identical breathing parameters of 11 BPM and
700cc tidal volume. Four separate cases were run with
mask oxygen flow rates at 2, 4, 8 and 15 lpm. Figure
3 above shows the oxygen concentration measured
from the back of the throat in the human model as a
function of time.
The output of the CFD model shows that as the
patient transitions from exhalation to inhalation a very
high concentration of oxygen has built up in the mask.
As the patient begins to inhale this high concentration
of oxygen decreases due to the fact that peak
inhalation flow rate is approximately 24.4 lpm. At
peak inhalation, the patient begins to draw in ambient
air at a concentration of 20.95% thus causing the
patient delivered oxygen concentration to decrease.
The exhaled oxygen concentration is set to be
homogenous with the output oxygen concentration
determined by the total volume of oxygen inhaled
minus the 310cc/min oxygen consumption rate.
Additionally, a 310cc/min carbon dioxide generation
rate for patient metabolism is also added to the exhaled
gasses.
Patient Oxygen Concentration During Inhalation(Variable Oxygen Mask Flow Rates, Constant Breathing Parameters: 11 BPM & Vt = 700cc)
0.0%
10.0%
20.0%
30.0%
40.0%
50.0%
60.0%
70.0%
80.0%
0 5 10 15 20 25 30
Time (seconds)
Ox
yg
en
Mas
s C
on
cen
trati
on
(%
)
15 lpm O2 Flow 8 lpm O2 Flow 4 lpm O2 Flow 2 lpm O2 Flow
Inhalation cycle
Ambient oxygen
concentration 20.95%
www.arelabs.com (p) 913-850-6630 (f) 913-850-6635
ARE Labs Inc. 2013 project # 10766.2 for Amsino International, Inc. 5 of 16
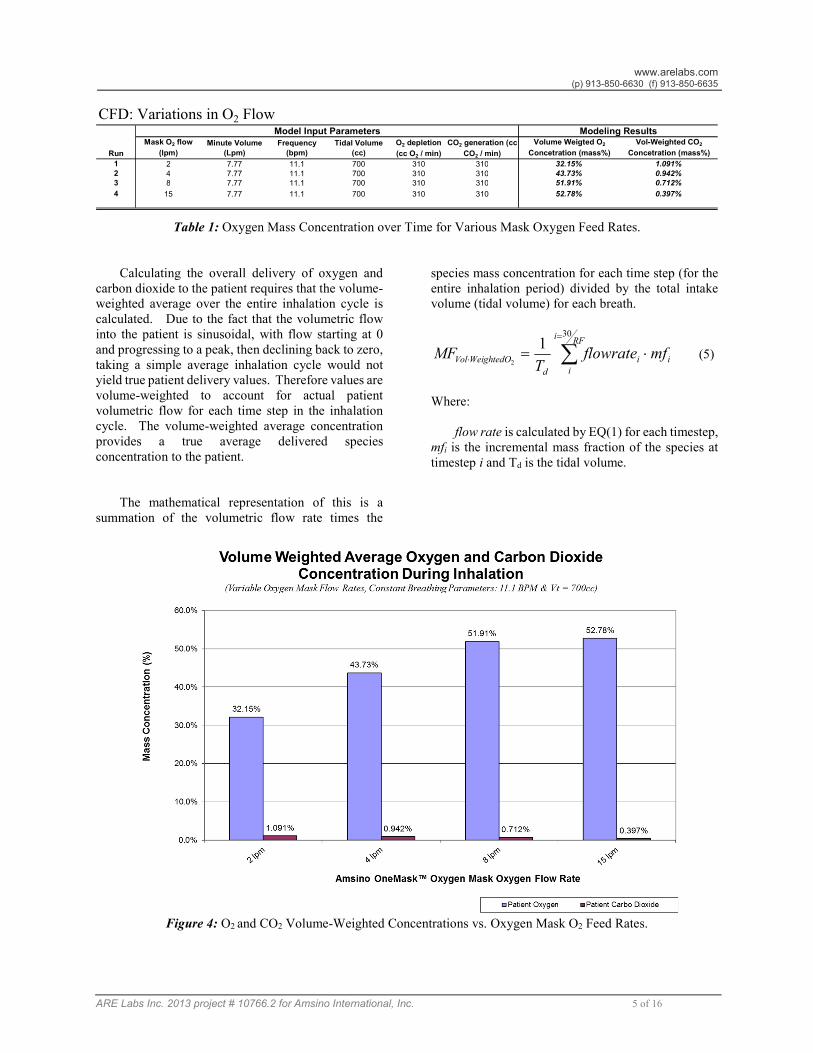
Table 1: Oxygen Mass Concentration over Time for Various Mask Oxygen Feed Rates.
Calculating the overall delivery of oxygen and
carbon dioxide to the patient requires that the volume-
weighted average over the entire inhalation cycle is
calculated. Due to the fact that the volumetric flow
into the patient is sinusoidal, with flow starting at 0
and progressing to a peak, then declining back to zero,
taking a simple average inhalation cycle would not
yield true patient delivery values. Therefore values are
volume-weighted to account for actual patient
volumetric flow for each time step in the inhalation
cycle. The volume-weighted average concentration
provides a true average delivered species
concentration to the patient.
The mathematical representation of this is a
summation of the volumetric flow rate times the
species mass concentration for each time step (for the
entire inhalation period) divided by the total intake
volume (tidal volume) for each breath.
∑=
⋅ ⋅=RF
i
i
ii
d
WeightedOVol mfflowrateT
MF
30
12
(5)
Where:
flow rate is calculated by EQ(1) for each timestep,
mfi is the incremental mass fraction of the species at
timestep i and Td is the tidal volume.
Figure 4: O2 and CO2 Volume-Weighted Concentrations vs. Oxygen Mask O2 Feed Rates.
CFD: Variations in O2 Flow
Run
Mask O2 flow
(lpm)
Minute Volume
(Lpm)
Frequency
(bpm)
Tidal Volume
(cc)
O2 depletion
(cc O2 / min)
CO2 generation (cc
CO2 / min)
Volume Weigted O2
Concetration (mass%)
Vol-Weighted CO2
Concetration (mass%)
1 2 7.77 11.1 700 310 310 32.15% 1.091%
2 4 7.77 11.1 700 310 310 43.73% 0.942%
3 8 7.77 11.1 700 310 310 51.91% 0.712%
4 15 7.77 11.1 700 310 310 52.78% 0.397%
Modeling ResultsModel Input Parameters
www.arelabs.com (p) 913-850-6630 (f) 913-850-6635
ARE Labs Inc. 2013 project # 10766.2 for Amsino International, Inc. 6 of 16
The summation of this term, from the start of the
cycle to 30/RF, yields the volume-weighted average
mass fraction of the species either inhaled or exhaled.
Table 2 shows the various runs that were modeled for
a single set of breathing parameters
The CFD model shows that as mask oxygen feed
rate is increased the patient volume-weighted average
of oxygen increases and the volume-weighted carbon
dioxide concentration decreases.
Additionally, the CFD model shows that
increasing the O2 from 8 lpm to 15 lpm does not
significantly increase the oxygen concentration
delivered to the patient. This is probably due to losses
to the atmosphere and inhalation of ambient air
through the mask open mouth port. The data also
shows that, although oxygen delivery only increases
slightly when increasing the mask oxygen flow rate
from 8 lpm to 15 lpm, the carbon dioxide still
continues to decrease at a substantial rate.
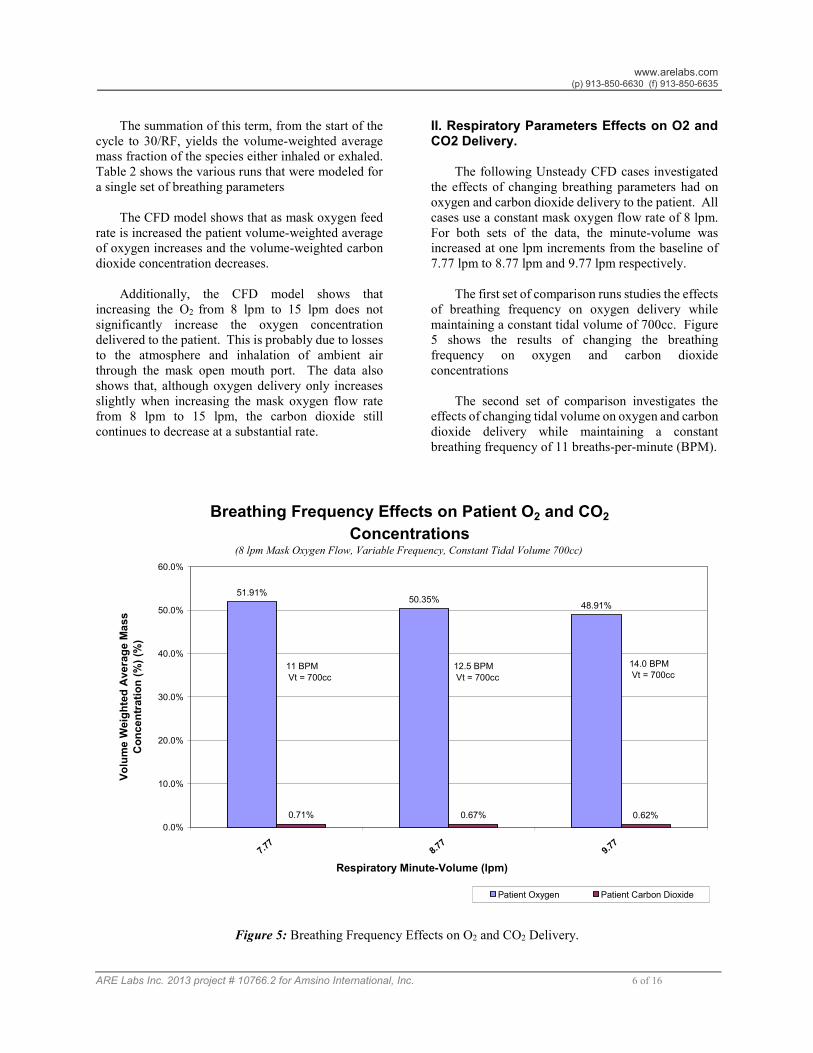
II. Respiratory Parameters Effects on O2 andCO2 Delivery.
The following Unsteady CFD cases investigated
the effects of changing breathing parameters had on
oxygen and carbon dioxide delivery to the patient. All
cases use a constant mask oxygen flow rate of 8 lpm.
For both sets of the data, the minute-volume was
increased at one lpm increments from the baseline of
7.77 lpm to 8.77 lpm and 9.77 lpm respectively.
The first set of comparison runs studies the effects
of breathing frequency on oxygen delivery while
maintaining a constant tidal volume of 700cc. Figure
5 shows the results of changing the breathing
frequency on oxygen and carbon dioxide
concentrations
The second set of comparison investigates the
effects of changing tidal volume on oxygen and carbon
dioxide delivery while maintaining a constant
breathing frequency of 11 breaths-per-minute (BPM).
Figure 5: Breathing Frequency Effects on O2 and CO2 Delivery.
Breathing Frequency Effects on Patient O2 and CO2
Concentrations(8 lpm Mask Oxygen Flow, Variable Frequency, Constant Tidal Volume 700cc)
51.91%50.35%
48.91%
0.71% 0.67% 0.62%
0.0%
10.0%
20.0%
30.0%
40.0%
50.0%
60.0%
7.77
8.77
9.77
Respiratory Minute-Volume (lpm)
Vo
lum
e W
eig
hte
d A
ve
rag
e M
as
s
Co
nc
en
tra
tio
n (
%)
(%)
Patient Oxygen Patient Carbon Dioxide
11 BPM
Vt = 700cc
12.5 BPM
Vt = 700cc
14.0 BPM
Vt = 700cc
www.arelabs.com (p) 913-850-6630 (f) 913-850-6635
ARE Labs Inc. 2013 project # 10766.2 for Amsino International, Inc. 7 of 16
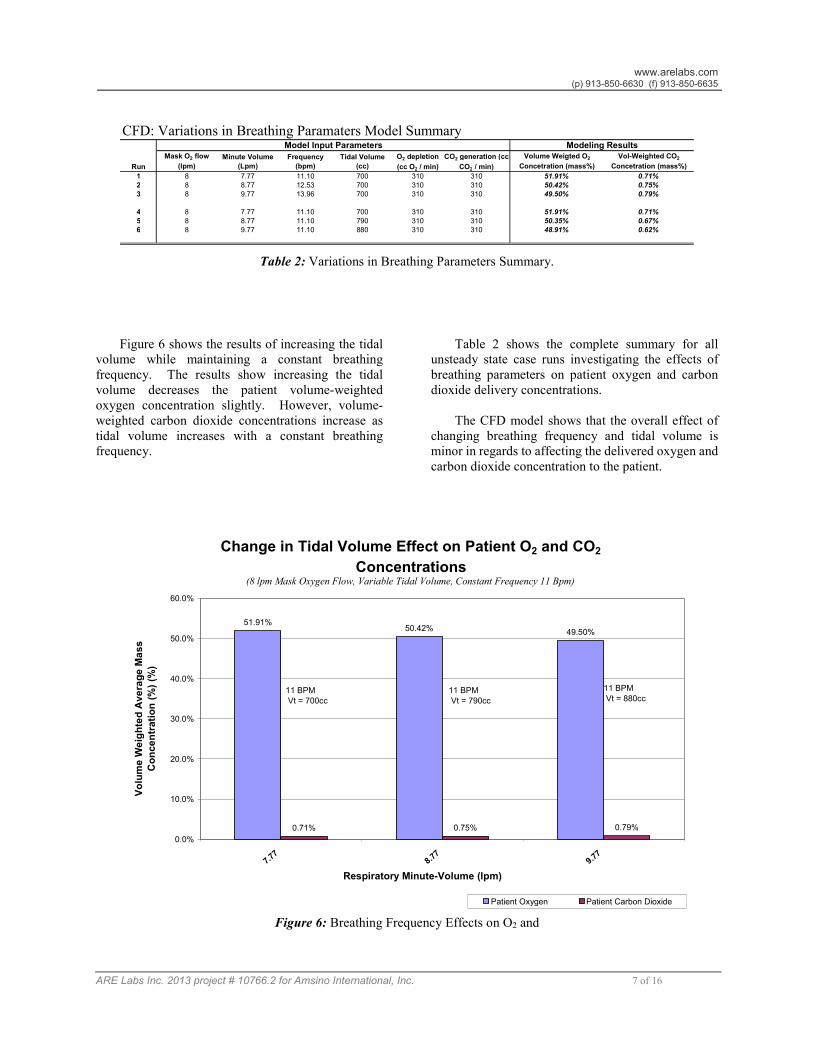
Table 2: Variations in Breathing Parameters Summary.
Figure 6 shows the results of increasing the tidal
volume while maintaining a constant breathing
frequency. The results show increasing the tidal
volume decreases the patient volume-weighted
oxygen concentration slightly. However, volume-
weighted carbon dioxide concentrations increase as
tidal volume increases with a constant breathing
frequency.
Table 2 shows the complete summary for all
unsteady state case runs investigating the effects of
breathing parameters on patient oxygen and carbon
dioxide delivery concentrations.
The CFD model shows that the overall effect of
changing breathing frequency and tidal volume is
minor in regards to affecting the delivered oxygen and
carbon dioxide concentration to the patient.
Figure 6: Breathing Frequency Effects on O2 and
CFD: Variations in Breathing Paramaters Model Summary
Run
Mask O2 flow
(lpm)
Minute Volume
(Lpm)
Frequency
(bpm)
Tidal Volume
(cc)
O2 depletion
(cc O2 / min)
CO2 generation (cc
CO2 / min)
Volume Weigted O2
Concetration (mass%)
Vol-Weighted CO2
Concetration (mass%)
1 8 7.77 11.10 700 310 310 51.91% 0.71%
2 8 8.77 12.53 700 310 310 50.42% 0.75%
3 8 9.77 13.96 700 310 310 49.50% 0.79%
4 8 7.77 11.10 700 310 310 51.91% 0.71%
5 8 8.77 11.10 790 310 310 50.35% 0.67%
6 8 9.77 11.10 880 310 310 48.91% 0.62%
Model Input Parameters Modeling Results
Change in Tidal Volume Effect on Patient O2 and CO2
Concentrations(8 lpm Mask Oxygen Flow, Variable Tidal Volume, Constant Frequency 11 Bpm)
51.91%50.42% 49.50%
0.71% 0.75% 0.79%
0.0%
10.0%
20.0%
30.0%
40.0%
50.0%
60.0%
7.77
8.77
9.77
Respiratory Minute-Volume (lpm)
Vo
lum
e W
eig
hte
d A
ve
rag
e M
ass
Co
ncen
trati
on
(%
) (%
)
Patient Oxygen Patient Carbon Dioxide
11 BPM
Vt = 700cc
11 BPM
Vt = 790cc
11 BPM
Vt = 880cc
www.arelabs.com (p) 913-850-6630 (f) 913-850-6635
ARE Labs Inc. 2013 project # 10766.2 for Amsino International, Inc. 8 of 16
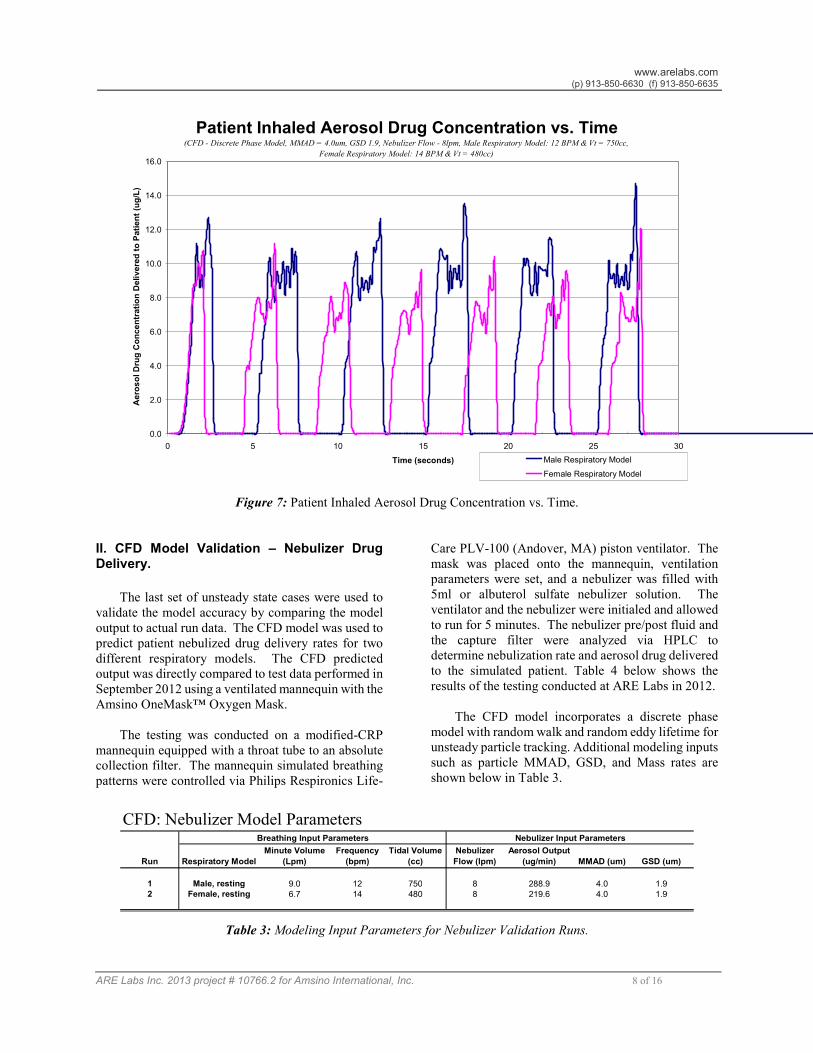
Figure 7: Patient Inhaled Aerosol Drug Concentration vs. Time.
II. CFD Model Validation – Nebulizer DrugDelivery.
The last set of unsteady state cases were used to
validate the model accuracy by comparing the model
output to actual run data. The CFD model was used to
predict patient nebulized drug delivery rates for two
different respiratory models. The CFD predicted
output was directly compared to test data performed in
September 2012 using a ventilated mannequin with the
Amsino OneMask™ Oxygen Mask.
The testing was conducted on a modified-CRP
mannequin equipped with a throat tube to an absolute
collection filter. The mannequin simulated breathing
patterns were controlled via Philips Respironics Life-
Care PLV-100 (Andover, MA) piston ventilator. The
mask was placed onto the mannequin, ventilation
parameters were set, and a nebulizer was filled with
5ml or albuterol sulfate nebulizer solution. The
ventilator and the nebulizer were initialed and allowed
to run for 5 minutes. The nebulizer pre/post fluid and
the capture filter were analyzed via HPLC to
determine nebulization rate and aerosol drug delivered
to the simulated patient. Table 4 below shows the
results of the testing conducted at ARE Labs in 2012.
The CFD model incorporates a discrete phase
model with random walk and random eddy lifetime for
unsteady particle tracking. Additional modeling inputs
such as particle MMAD, GSD, and Mass rates are
shown below in Table 3.
Table 3: Modeling Input Parameters for Nebulizer Validation Runs.
Patient Inhaled Aerosol Drug Concentration vs. Time (CFD - Discrete Phase Model, MMAD = 4.0um, GSD 1.9, Nebulizer Flow - 8lpm, Male Respiratory Model: 12 BPM & Vt = 750cc,
Female Respiratory Model: 14 BPM & Vt = 480cc)
0.0
2.0
4.0
6.0
8.0
10.0
12.0
14.0
16.0
0 5 10 15 20 25 30
Time (seconds)
Aero
so
l D
rug
Co
ncen
trati
on
Delivere
d t
o P
ati
en
t (u
g/L
)
Male Respiratory Model
Female Respiratory Model
CFD: Nebulizer Model Parameters
Run Respiratory Model
Minute Volume
(Lpm)
Frequency
(bpm)
Tidal Volume
(cc)
Nebulizer
Flow (lpm)
Nebulizer
Aerosol Output
(ug/min) MMAD (um) GSD (um)
1 Male, resting 9.0 12 750 8 288.9 4.0 1.9
2 Female, resting 6.7 14 480 8 219.6 4.0 1.9
Breathing Input Parameters Nebulizer Input Parameters
www.arelabs.com (p) 913-850-6630 (f) 913-850-6635
ARE Labs Inc. 2013 project # 10766.2 for Amsino International, Inc. 9 of 16
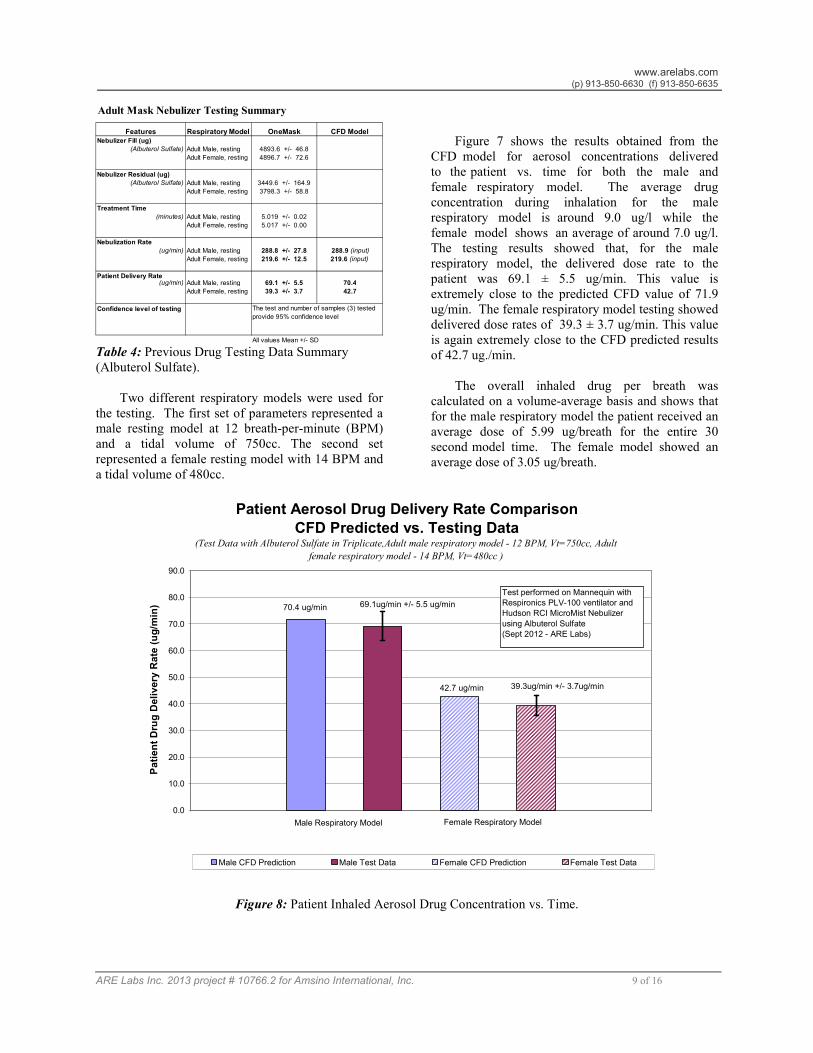
Table 4: Previous Drug Testing Data Summary
(Albuterol Sulfate).
Two different respiratory models were used for
the testing. The first set of parameters represented a
male resting model at 12 breath-per-minute (BPM)
and a tidal volume of 750cc. The second set
represented a female resting model with 14 BPM and
a tidal volume of 480cc.
Figure 7 shows the results obtained from the
CFD model for aerosol concentrations delivered
to the patient vs. time for both the male and
female respiratory model. The average drug
concentration during inhalation for the male
respiratory model is around 9.0 ug/l while the
female model shows an average of around 7.0 ug/l.
The testing results showed that, for the male
respiratory model, the delivered dose rate to the
patient was 69.1 ± 5.5 ug/min. This value is
extremely close to the predicted CFD value of 71.9
ug/min. The female respiratory model testing showed
delivered dose rates of 39.3 ± 3.7 ug/min. This value
is again extremely close to the CFD predicted results
of 42.7 ug./min.
The overall inhaled drug per breath was
calculated on a volume-average basis and shows that
for the male respiratory model the patient received an
average dose of 5.99 ug/breath for the entire 30
second model time. The female model showed an
average dose of 3.05 ug/breath.
Figure 8: Patient Inhaled Aerosol Drug Concentration vs. Time.
Adult Mask Nebulizer Testing Summary
Nebulizer Fill (ug)
(Albuterol Sulfate) Adult Male, resting 4893.6 +/- 46.8
Adult Female, resting 4896.7 +/- 72.6
Nebulizer Residual (ug)
(Albuterol Sulfate) Adult Male, resting 3449.6 +/- 164.9
Adult Female, resting 3798.3 +/- 58.8
Treatment Time
(minutes) Adult Male, resting 5.019 +/- 0.02
Adult Female, resting 5.017 +/- 0.00
Nebulization Rate
(ug/min) Adult Male, resting 288.8 +/- 27.8 288.9 (input)
Adult Female, resting 219.6 +/- 12.5 219.6 (input)
Patient Delivery Rate (ug/min) Adult Male, resting 69.1 +/- 5.5 70.4
Adult Female, resting 39.3 +/- 3.7 42.7
Confidence level of testing
All values Mean +/- SD
Respiratory ModelFeatures OneMask CFD Model
The test and number of samples (3) tested
provide 95% confidence level
Patient Aerosol Drug Delivery Rate Comparison
CFD Predicted vs. Testing Data(Test Data with Albuterol Sulfate in Triplicate,Adult male respiratory model - 12 BPM, Vt=750cc, Adult
female respiratory model - 14 BPM, Vt=480cc )
70.4 ug/min 69.1ug/min +/- 5.5 ug/min
42.7 ug/min 39.3ug/min +/- 3.7ug/min
0.0
10.0
20.0
30.0
40.0
50.0
60.0
70.0
80.0
90.0
1
Pati
en
t D
rug
Deli
very
Rate
(u
g/m
in)
Male CFD Prediction Male Test Data Female CFD Prediction Female Test Data
Test performed on Mannequin with
Respironics PLV-100 ventilator and
Hudson RCI MicroMist Nebulizer
using Albuterol Sulfate
(Sept 2012 - ARE Labs)
Male Respiratory Model Female Respiratory Model
www.arelabs.com (p) 913-850-6630 (f) 913-850-6635
ARE Labs Inc. 2013 project # 10766.2 for Amsino International, Inc. 10 of 16
The results also show that variations in breathing
frequency and tidal volume have only a slight effect
on the average oxygen delivery to the patient. Patient
minute-volumes ranged from 7.8 lpm to 9.8 lpm while
the volume-averaged patient oxygen concentration
only varied from 48.9% to 51.9% with an oxygen
mask feed rate of 8lpm. From the data, we can see that
even with a fairly high resting minute-volume of 9.8
lpm the Amsino OneMask™ Oxygen Mask was still
able to deliver a 48.9% average oxygen concentration
to the patient.
The Amsino OneMask™ Oxygen Mask also
showed excellent results at reducing the patient carbon
dioxide re-uptake. This is due to the open mouth
design which allows patient expired gasses to more
easily escape the mask. The volume averaged patient
carbon dioxide concentrations ranged was 1.1% at 2
lpm oxygen flow, 0.97% at 4 lpm oxygen flow, 0.72%
at 8 lpm oxygen flow and 0.4% at 15lpm oxygen flow.
This is under typical resting breathing parameters of
11 breath-per-minute with a tidal volume of 700cc.
The results are similar to that of the oxygen
delivery rates except that high oxygen flows to the
mask continue to lower the carbon dioxide re-uptake
due to the persistent flushing of the exhaled gasses.
The computation fluid dynamics model shows
that the Amsino OneMask™ Oxygen Mask not only
provides the patients with high oxygen delivery rates
but also significantly reduces carbon dioxide re-uptake
by the patient.
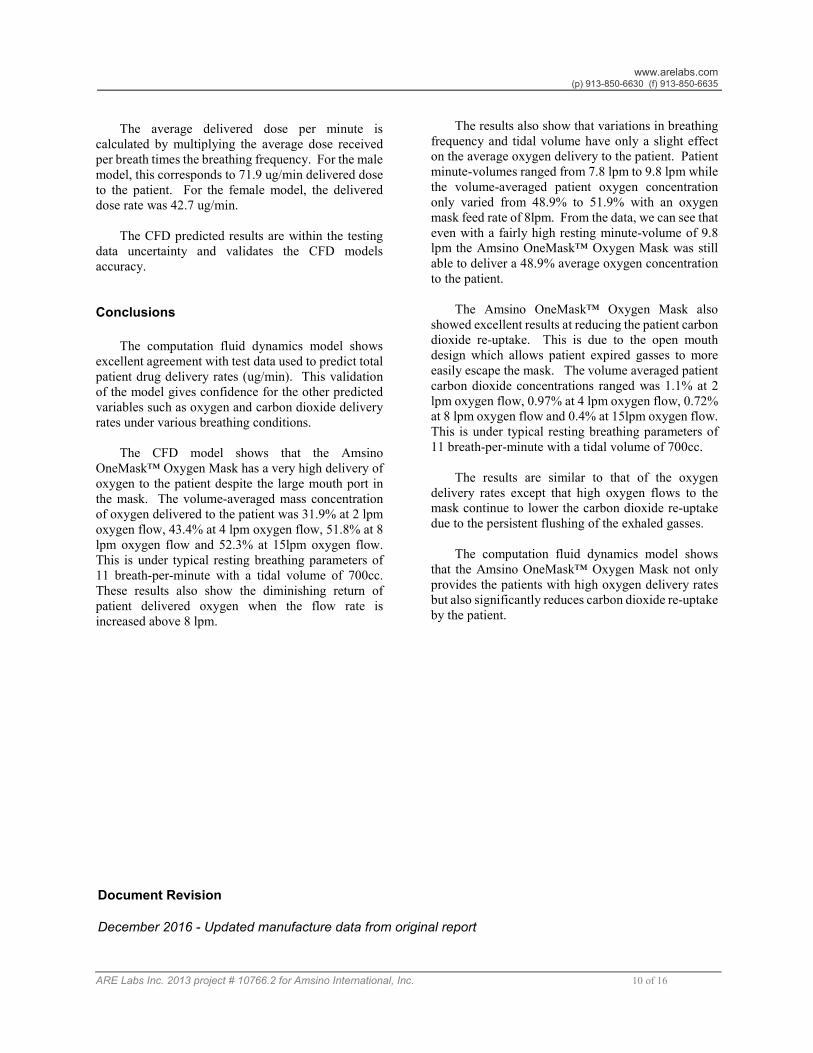
The average delivered dose per minute is
calculated by multiplying the average dose received
per breath times the breathing frequency. For the male
model, this corresponds to 71.9 ug/min delivered dose
to the patient. For the female model, the delivered
dose rate was 42.7 ug/min.
The CFD predicted results are within the testing
data uncertainty and validates the CFD models
accuracy.
Conclusions
The computation fluid dynamics model shows
excellent agreement with test data used to predict total
patient drug delivery rates (ug/min). This validation
of the model gives confidence for the other predicted
variables such as oxygen and carbon dioxide delivery
rates under various breathing conditions.
The CFD model shows that the Amsino
OneMask™ Oxygen Mask has a very high delivery of
oxygen to the patient despite the large mouth port in
the mask. The volume-averaged mass concentration
of oxygen delivered to the patient was 31.9% at 2 lpm
oxygen flow, 43.4% at 4 lpm oxygen flow, 51.8% at 8
lpm oxygen flow and 52.3% at 15lpm oxygen flow.
This is under typical resting breathing parameters of
11 breath-per-minute with a tidal volume of 700cc.
These results also show the diminishing return of
patient delivered oxygen when the flow rate is
increased above 8 lpm.
Document Revision
December 2016 - Updated manufacture data from original report
www.arelabs.com (p) 913-850-6630 (f) 913-850-6635
ARE Labs Inc. 2013 project # 10766.2 for Amsino International, Inc. 11 of 16
Aerosol Research and Engineering Laboratory Inc. “Drug Delivery Comparison using the Adult Amsino OneMask™ Oxygen Mask on a Ventilated Human Model.” Project 10766.1 for Amsino International. Sept 2012
Gupta, J.K., Lin, C.-H., and Chen, Q. 2010. "Characterizing exhaled airflow from breathing and talking,"Indoor Air, 20, 31-39.
Gao, N. and Niu, J. (2006) Transient CFD simulation of the respiration process and interpersonal exposure assessment. Building and Environment, 41 (9), 1214-1222.
References
www.arelabs.com (p) 913-850-6630 (f) 913-850-6635
ARE Labs Inc. 2013 project # 10766.2 for Amsino International, Inc. 12 of 16
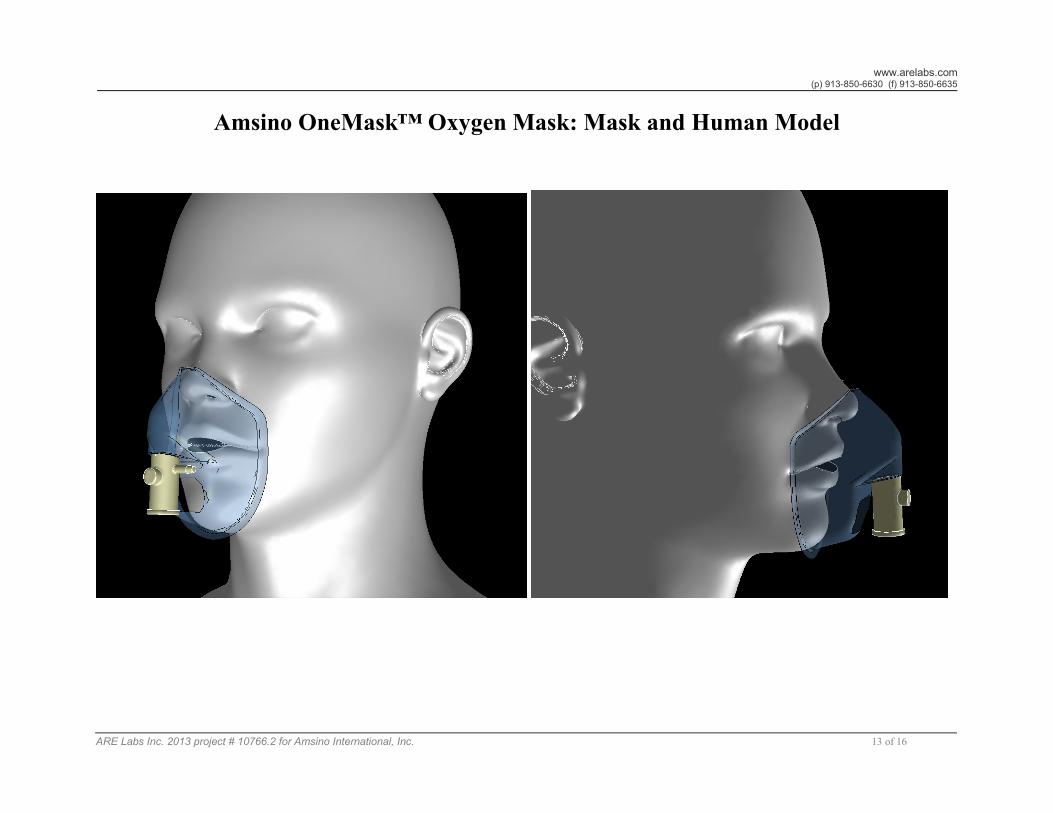
Appendix A
Select Images from CFD runs
www.arelabs.com (p) 913-850-6630 (f) 913-850-6635
ARE Labs Inc. 2013 project # 10766.2 for Amsino International, Inc. 13 of 16
Amsino OneMask™ Oxygen Mask: Mask and Human Model
www.arelabs.com (p) 913-850-6630 (f) 913-850-6635
ARE Labs Inc. 2013 project # 10766.2 for Amsino International, Inc. 14 of 16
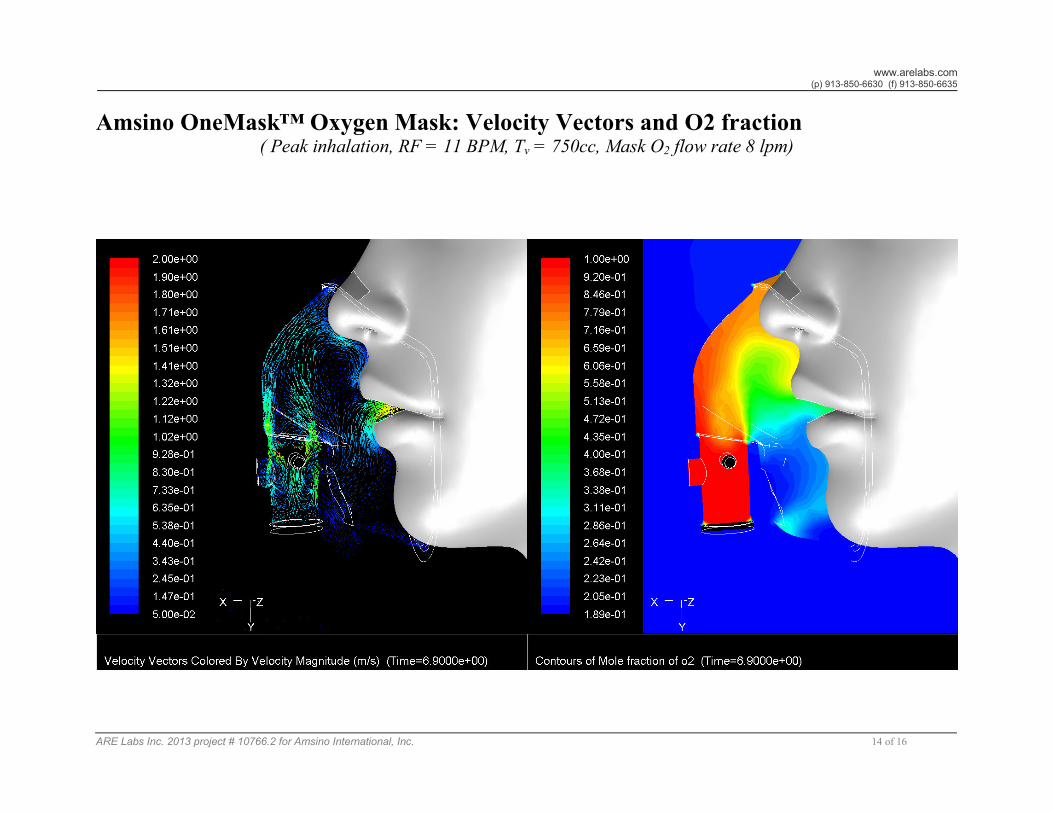
Amsino OneMask™ Oxygen Mask: Velocity Vectors and O2 fraction ( Peak inhalation, RF = 11 BPM, Tv = 750cc, Mask O2 flow rate 8 lpm)
www.arelabs.com
(p) 913-850-6630 (f) 913-850-6635
ARE Labs Inc. 2013 project # 10766.2 for Amsino International, Inc. 15 of 16
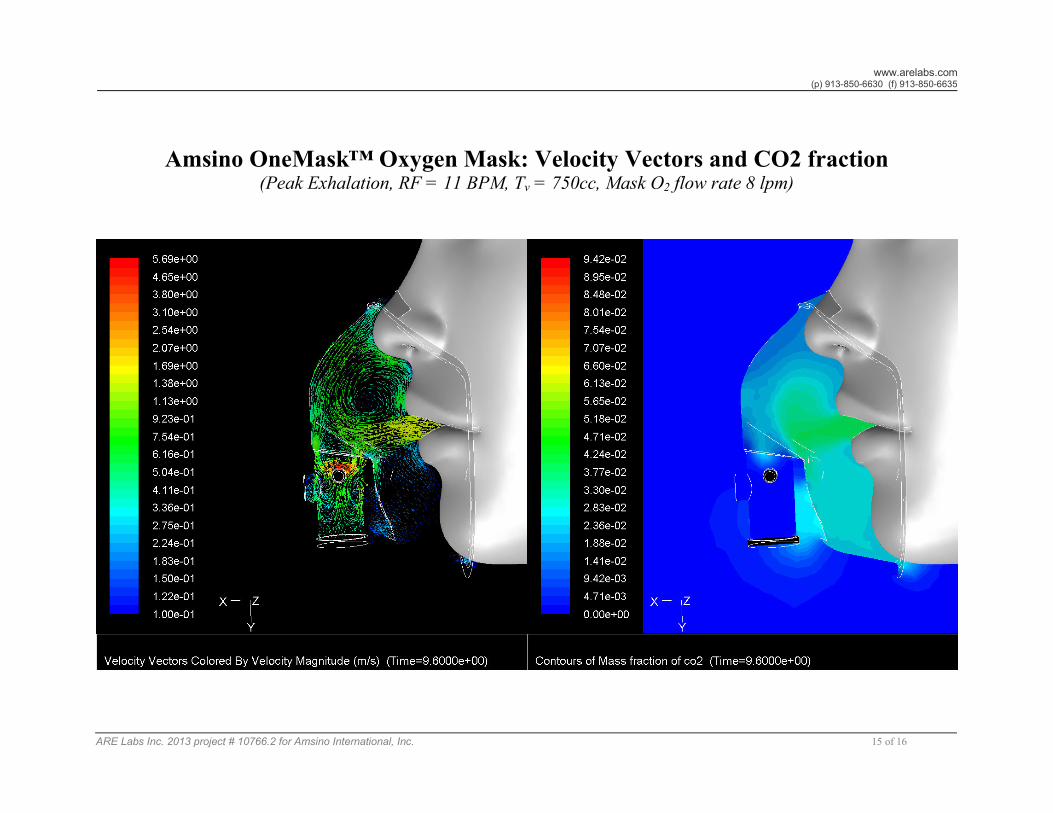
Amsino OneMask™ Oxygen Mask: Velocity Vectors and CO2 fraction (Peak Exhalation, RF = 11 BPM, Tv = 750cc, Mask O2 flow rate 8 lpm)
www.arelabs.com
(p) 913-850-6630 (f) 913-850-6635
ARE Labs Inc. 2013 project # 10766.2 for Amsino International, Inc. 16 of 16
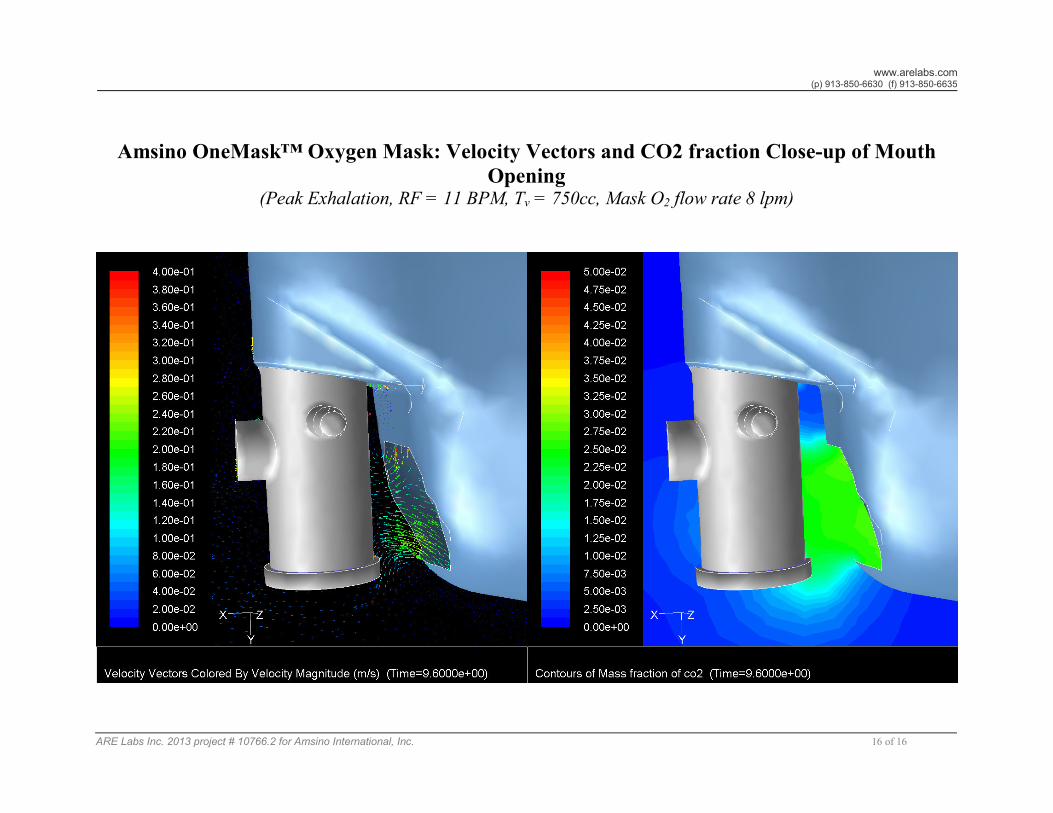
Amsino OneMask™ Oxygen Mask: Velocity Vectors and CO2 fraction Close-up of Mouth
Opening (Peak Exhalation, RF = 11 BPM, Tv = 750cc, Mask O2 flow rate 8 lpm)