comprehensive industry analysis food processing industry
TRANSCRIPT
Comprehensive Industry Analysis
FFoooodd PPrroocceessssiinngg IInndduussttrryy Winnebago County, Illinois
November 2005
Regional Development Institute
NIU Outreach Northern Illinois University
DeKalb, IL 60115 www.outreach.niu.edu
Winnebago County Comprehensive Industry Analysis Food Processing Industry
1
About the Winnebago County Initiative
The Comprehensive Industry Analysis for the Food Processing Industry in Winnebago County was commissioned by the County of Winnebago to evaluate the relative strengths and weaknesses of the county�s business climate for the food processing industry. The primary goal of this research is to provide the region with tools and information to develop a targeted marketing campaign to attract the food processing industry to the region. It also focuses on identifying and providing recommendations on positioning the region to be competitive in attracting the food processing industry to Winnebago County. The Comprehensive Industry Analysis and the research provided is just one step the region is taking to bolster business attraction efforts. Resources are being provided for technology that will facilitate the collection and dissemination of available industrial space to site selection consultants and companies. This technology uses satellite imagery and data mapping to inventory available sites and buildings. Another significant movement is toward regionalism. Winnebago County is considering participation in a regional economic coalition that will work collectively to access federal grants and other funding sources for special projects. Under contract with Winnebago County, the Regional Development Institute at Northern Illinois University has prepared the following analysis and recommendations for the food processing industry in the region. Additional analysis and recommendations will be prepared in 2005 for the plastics manufacturing industry.
Winnebago County Comprehensive Industry Analysis Food Processing Industry
2
Comprehensive Industry Analysis for the Food Processing Industry
The food processing industry analysis for Winnebago County is being conducted in two phases. Phase I includes a national perspective on the industry�s background and historical performance along with a review of overall industry trends. Phase I of this analysis will review the economic impacts of industry clusters to regional economic development and industry targets for site selection. Finally, secondary data will be utilized to evaluate the region�s existing industry mix in terms of food processing clusters. Recommendations for target industry selection will be provided based on the analysis conducted in Phase I. Once industries for the food processing industry have been reviewed, evaluated and confirmed by Winnebago County for targets of site selection, Phase II will evaluate strengths and weaknesses of the region relative to the target industries selected. This evaluation will include interviews with food processing companies, an analysis of comparative regions in terms of site selection criteria critical to the food processing industry, and recommendations for building the food processing industry cluster in the region. Phase I Page Industry Background and History 5 Role of Industry Clusters 11 The State of the Food Processing Industry 12 Phase II Site Selection Criteria 20 Labor Market Analysis 24 Cost of Doing Business 31 Conclusions and Recommendations 37
Appendices Buyers and Suppliers 42 Industry Subsectors 45 Winnebago County Food Processing Companies 51 Regional Comparative Cost Analysis 52
Winnebago County Comprehensive Industry Analysis Food Processing Industry
3
Executive Summary
The food processing industry accounts for 10% of total U.S. manufacturing shipments and is valued at over $461 billion.1 Food consumption is relatively stable even through economic downturns making it an attractive industry which can contribute to the economic stability of the region. Even during the most recent recession, growth in the value of food processing industry shipments and total employment continued. Total industry employment in Illinois for 2003 is distributed across subsectors as follows: % of Total Employment Animal food processing 3% Sugar and confectionary product manufacturing 13% Meat slaughtering and processing 25% Dairy product manufacturing 5% Fruit and vegetable manufacturing 9% Bakeries and bread product manufacturing 23% Grain and oilseed 8% Other food product manufacturing including snack foods 14% The food processing industry has proven to be relatively stable during economic downturns, due in part to the fact that it is consumer expenditure driven. Another contributing factor to the industry�s relative stability is an increase in consumer demand for pre-packaged food products. Even during the most recent recession, the industry continued modest annual growth in value of shipments through 2003. Annual operating costs are an important evaluation criteria for site selection as well. Operating costs include labor, energy, property, shipping, and land acquisition costs. An evaluation of operating costs between a select group of comparison regions indicates that Winnebago County is a competitive region for food processing. Overall, Winnebago County is the second lowest region in terms of total annual operating costs. Total operating costs in Dubuque County, IA, were -10.2% lower, but other comparative regions were between 3.7% to 13.6% higher than Winnebago County. Winnebago County was second lowest in terms of labor costs but highest in overall energy costs. Another important site selection criteria for the food processing industry is location, both in relation to supply chains and transportation costs. What becomes more significant within northern Illinois are other key site selection factors such as access to highways, labor costs, availability, and quality as well as construction-ready sites and buildings.
1 U.S. Census Bureau, 2003.
Winnebago County Comprehensive Industry Analysis Food Processing Industry
4
Labor availability and quality continues to be a critical element for all industries. In the food processing industry in general, the quantity and need for highly skilled workers decreases with the integration of technology and automation into processes. Subsequently, labor demands and level of skills needed are impacted. Winnebago County has many positive attributes for attracting the food processing industry to the region, but also faces some challenges. Capitalizing on the strengths and addressing the weaknesses should be the focus of the region in the future. Regional strengths include location, productivity, value added and overall operating costs. Regional weaknesses include workforce concerns and business climate issues.
Regional Strengths Regional Weaknesses • Location and access • Wastewater treatment • Industry productivity • Industry value added • Low labor stress • Low cost of doing business • Regional focus on addressing
manufacturing workforce shortages
• Transitional manufacturing workforce
• Competitive workforce environment
• Labor availability in industrial and maintenance mechanics positions
• Higher overall wages • Negative business climate • Industrial/residential zoning
In order for Winnebago County to be competitive in business attraction, the region should focus on developing a comprehensive marketing plan that incorporates the results of this analysis into a marketing and promotion piece that can be distributed to companies and site selection consultants. In addition, it is recommended that a business attraction team be assembled to provide leadership, identify targets, build relationships, and manage site selection inquiries. Participation in the I-39 Corridor Association will further assist in site selection activities not only for logistics but also for food processing. Building a more positive business climate for the existing food processing companies will further advance industry attraction efforts. Finally, Winnebago County should continue to provide support and advocacy for initiatives and programs that focus on building the regions workforce, infrastructure and quality of life.
Winnebago County Comprehensive Industry Analysis Food Processing Industry
5
Industry Background and History FFrroomm TThhee UU..SS.. CCeennssuuss BBuurreeaauu��ss 22000044 IInndduussttrryy OOuuttllooookk ffoorr PPrroocceesssseedd FFooooddss
Industry Subsectors The food processing or food manufacturing industry includes companies that transform livestock and agricultural products into products used for intermediate or final consumption. Processed foods are products in which a raw commodity is transformed into a processed product through the use of materials, labor, equipment, and technology. �Any product that requires some degree of processing is referred to as a processed product regardless of whether the amount of processing is minor, such as canned fruit, or more complex, such as snack foods.�2 The North American Industrial Classification Systems (NAICS) categorizes the food processing industry into nine subsectors:
! 3111 animal food manufacturing ! 3112 grain and oilseed milling ! 3113 sugar and confectionary product manufacturing ! 3114 fruit and vegetable preserving and specialty food manufacturing ! 3115 dairy product manufacturing ! 3116 meat product manufacturing ! 3117 seafood product preparation and packaging ! 3118 bakeries and tortilla manufacturing ! 3119 other food manufacturing
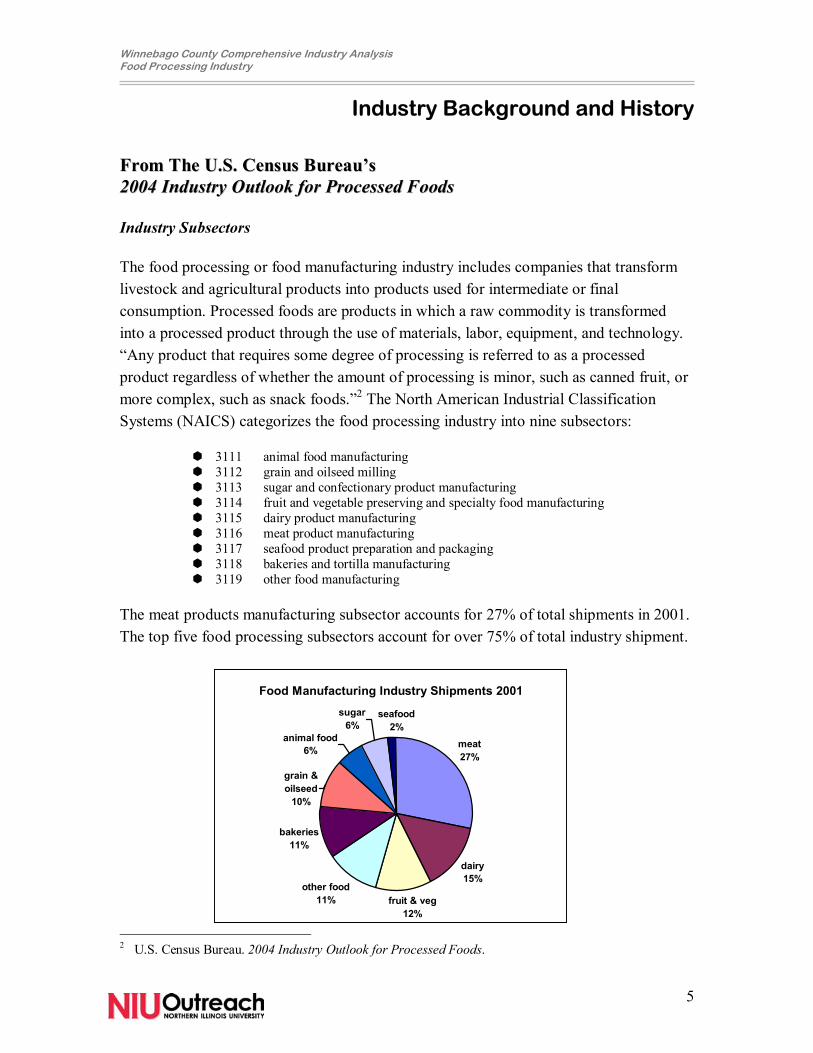
The meat products manufacturing subsector accounts for 27% of total shipments in 2001. The top five food processing subsectors account for over 75% of total industry shipment.
2 U.S. Census Bureau. 2004 Industry Outlook for Processed Foods.
Food Manufacturing Industry Shipments 2001
meat 27%
dairy15%
fruit & veg12%
other food11%
bakeries11%
grain & oilseed
10%
animal food6%
sugar6%
seafood2%
Winnebago County Comprehensive Industry Analysis Food Processing Industry
6
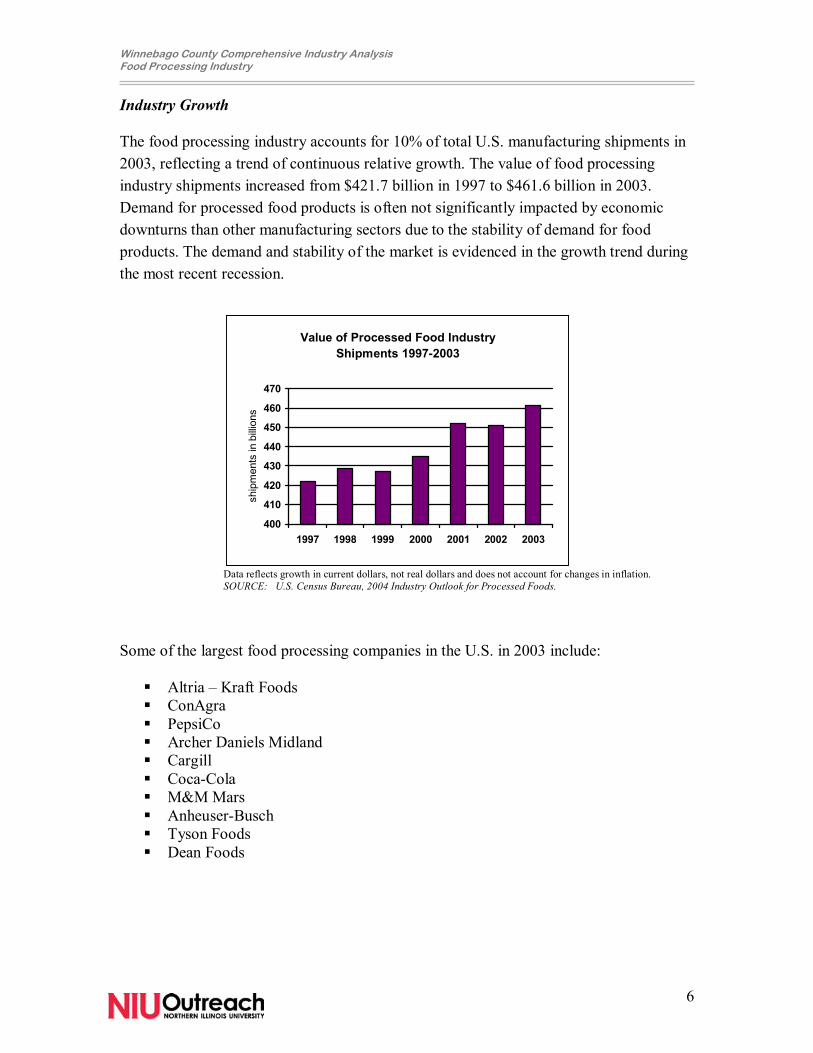
Industry Growth The food processing industry accounts for 10% of total U.S. manufacturing shipments in 2003, reflecting a trend of continuous relative growth. The value of food processing industry shipments increased from $421.7 billion in 1997 to $461.6 billion in 2003. Demand for processed food products is often not significantly impacted by economic downturns than other manufacturing sectors due to the stability of demand for food products. The demand and stability of the market is evidenced in the growth trend during the most recent recession.
Data reflects growth in current dollars, not real dollars and does not account for changes in inflation. SOURCE: U.S. Census Bureau, 2004 Industry Outlook for Processed Foods.
Some of the largest food processing companies in the U.S. in 2003 include: ! Altria � Kraft Foods ! ConAgra ! PepsiCo ! Archer Daniels Midland ! Cargill ! Coca-Cola ! M&M Mars ! Anheuser-Busch ! Tyson Foods ! Dean Foods
Value of Processed Food Industry Shipments 1997-2003
400
410
420
430
440
450
460
470
1997 1998 1999 2000 2001 2002 2003
ship
men
ts in
billi
ons
Winnebago County Comprehensive Industry Analysis Food Processing Industry
7
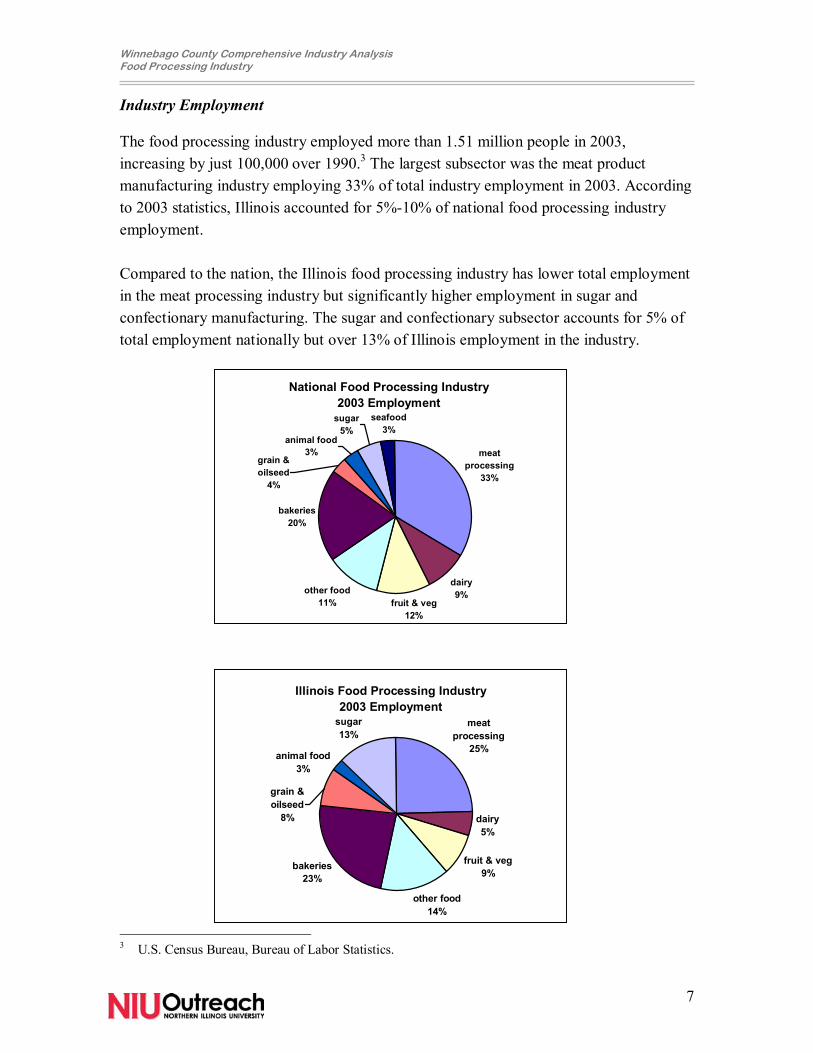
Industry Employment The food processing industry employed more than 1.51 million people in 2003, increasing by just 100,000 over 1990.3 The largest subsector was the meat product manufacturing industry employing 33% of total industry employment in 2003. According to 2003 statistics, Illinois accounted for 5%-10% of national food processing industry employment. Compared to the nation, the Illinois food processing industry has lower total employment in the meat processing industry but significantly higher employment in sugar and confectionary manufacturing. The sugar and confectionary subsector accounts for 5% of total employment nationally but over 13% of Illinois employment in the industry.
3 U.S. Census Bureau, Bureau of Labor Statistics.
National Food Processing Industry 2003 Employment
meat processing
33%
dairy9%
fruit & veg12%
other food11%
bakeries20%
seafood3%
sugar5%
animal food3%
grain & oilseed
4%
Illinois Food Processing Industry2003 Employment
meat processing
25%
dairy5%
fruit & veg9%
other food14%
bakeries23%
grain & oilseed
8%
animal food3%
sugar13%
Winnebago County Comprehensive Industry Analysis Food Processing Industry
8
FFoooodd PPrroocceessssiinngg IInndduussttrryy TTrreennddss Mergers, Acquisitions, and Consolidations The industry has been active in mergers, acquisitions, and consolidations. In 2003, 415 mergers and acquisitions were recorded by the Food Institute, down from a high of 813 mergers in 1998. Companies in the food processing industry continue to consolidate, but at a slower pace than in the past. �Mergers or consolidations can be in a company�s interest in order to take advantage of more efficient manufacturing plants and close inefficient ones or quickly expand a firm�s product lines by acquiring market share in a mature domestic market.� 4 Globalization The food processing industry is active in exporting and foreign direct investment. In 2003, the industry exported $26.7 billion and imported $23.7 billion according to U.S. Department of Commerce statistics. Weakening of the U.S. dollar has contributed to growth in exports of food processing industries. Additionally, companies in the industry have expanded production and distribution into foreign markets. Technology While employment has remained relatively stable over the past decade, productivity in the food processing industry has increased. These productivity gains have been achieved through process automation and investments in technology. Labor demands are impacted by this increase in automation and technology as the number of employees required in processing and need for highly skilled workers generally decline. Industry Clusters Food processing companies are increasingly interested in locating in close proximity to other food processing companies. Clustering of like companies tends to build a larger and more qualified workforce in the region. �The cluster provides not only a community with the right skill set, but an area where suppliers and equipment service companies are located close by.� 5 These clusters also promote more specialized training programs in regions with high concentrations of food processing companies. In addition to improvements in workforce quality and availability, other benefits include the following6:
4 U.S. Farm Sector Overview. Economic Research Service of the U.S. Department of Agriculture (USDA), March 31, 2003. 5 Fassl, Joyce. Site Selection Requires a Delicate Balance. Food Engineering Magazine, June 1, 2002. 6 Porter, Michael. Clusters and the New Economics of Competition. Harvard Business Review, Boston, Nov/Dec 1998.
Winnebago County Comprehensive Industry Analysis Food Processing Industry
9
! Better access to suppliers ! Access to specialized information ! Linkages between complementary industries ! Access to institutions and public goods ! Better motivation and measurement of performance ! Foundation building for an innovative culture within the industry ! New business attraction and promotion
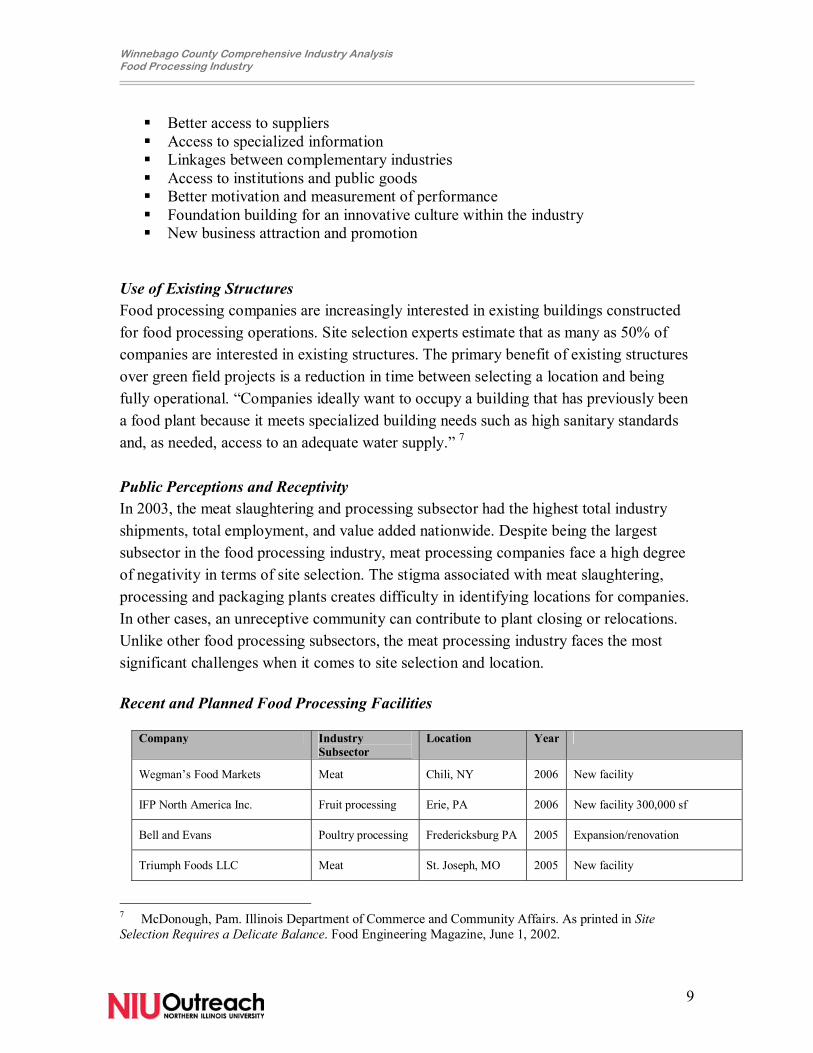
Use of Existing Structures Food processing companies are increasingly interested in existing buildings constructed for food processing operations. Site selection experts estimate that as many as 50% of companies are interested in existing structures. The primary benefit of existing structures over green field projects is a reduction in time between selecting a location and being fully operational. �Companies ideally want to occupy a building that has previously been a food plant because it meets specialized building needs such as high sanitary standards and, as needed, access to an adequate water supply.� 7 Public Perceptions and Receptivity In 2003, the meat slaughtering and processing subsector had the highest total industry shipments, total employment, and value added nationwide. Despite being the largest subsector in the food processing industry, meat processing companies face a high degree of negativity in terms of site selection. The stigma associated with meat slaughtering, processing and packaging plants creates difficulty in identifying locations for companies. In other cases, an unreceptive community can contribute to plant closing or relocations. Unlike other food processing subsectors, the meat processing industry faces the most significant challenges when it comes to site selection and location. Recent and Planned Food Processing Facilities
Company Industry Subsector
Location Year
Wegman�s Food Markets Meat Chili, NY 2006 New facility
IFP North America Inc. Fruit processing Erie, PA 2006 New facility 300,000 sf
Bell and Evans Poultry processing Fredericksburg PA 2005 Expansion/renovation
Triumph Foods LLC Meat St. Joseph, MO 2005 New facility
7 McDonough, Pam. Illinois Department of Commerce and Community Affairs. As printed in Site Selection Requires a Delicate Balance. Food Engineering Magazine, June 1, 2002.
Winnebago County Comprehensive Industry Analysis Food Processing Industry
10
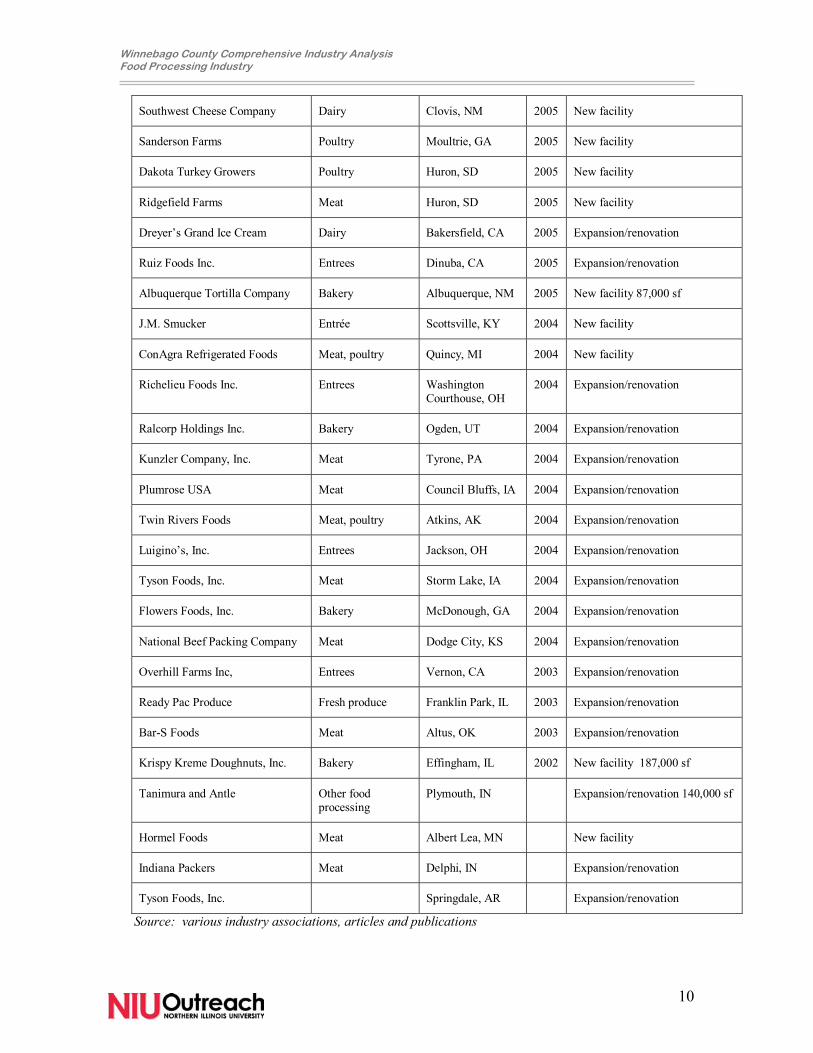
Southwest Cheese Company Dairy Clovis, NM 2005 New facility
Sanderson Farms Poultry Moultrie, GA 2005 New facility
Dakota Turkey Growers Poultry Huron, SD 2005 New facility
Ridgefield Farms Meat Huron, SD 2005 New facility
Dreyer�s Grand Ice Cream Dairy Bakersfield, CA 2005 Expansion/renovation
Ruiz Foods Inc. Entrees Dinuba, CA 2005 Expansion/renovation
Albuquerque Tortilla Company Bakery Albuquerque, NM 2005 New facility 87,000 sf
J.M. Smucker Entrée Scottsville, KY 2004 New facility
ConAgra Refrigerated Foods Meat, poultry Quincy, MI 2004 New facility
Richelieu Foods Inc. Entrees Washington Courthouse, OH
2004 Expansion/renovation
Ralcorp Holdings Inc. Bakery Ogden, UT 2004 Expansion/renovation
Kunzler Company, Inc. Meat Tyrone, PA 2004 Expansion/renovation
Plumrose USA Meat Council Bluffs, IA 2004 Expansion/renovation
Twin Rivers Foods Meat, poultry Atkins, AK 2004 Expansion/renovation
Luigino�s, Inc. Entrees Jackson, OH 2004 Expansion/renovation
Tyson Foods, Inc. Meat Storm Lake, IA 2004 Expansion/renovation
Flowers Foods, Inc. Bakery McDonough, GA 2004 Expansion/renovation
National Beef Packing Company Meat Dodge City, KS 2004 Expansion/renovation
Overhill Farms Inc, Entrees Vernon, CA 2003 Expansion/renovation
Ready Pac Produce Fresh produce Franklin Park, IL 2003 Expansion/renovation
Bar-S Foods Meat Altus, OK 2003 Expansion/renovation
Krispy Kreme Doughnuts, Inc. Bakery Effingham, IL 2002 New facility 187,000 sf
Tanimura and Antle Other food processing
Plymouth, IN Expansion/renovation 140,000 sf
Hormel Foods Meat Albert Lea, MN New facility
Indiana Packers Meat Delphi, IN Expansion/renovation
Tyson Foods, Inc. Springdale, AR Expansion/renovation
Source: various industry associations, articles and publications
Winnebago County Comprehensive Industry Analysis Food Processing Industry
11
Role of Industry Clusters
Industry clusters are defined by Professor Michael Porter of Harvard University as �geographic concentrations of interconnected companies and institutes in a particular field that encompass not just the industry itself, but key components of that industry�s supply chain.�8 Industry clusters are not a new phenomenon and can be found throughout the U.S. Common examples include information technology in the Silicon Valley, textiles in the Carolinas, and the California wine industry. Clusters are also evident in retail, tourism, manufacturing, insurance, and finance. Industry clusters reflect a change in the role of competition away from a focus on the costs of input, cheap labor, and location toward more productive use of inputs which requires continuous improvement and innovation. �The enduring competitive advantages in a global economy lie increasingly in local things � knowledge, relationships, motivation � that distant rivals cannot match.� 9 An important advantage of clusters rests not only in a more highly specialized workforce, but also in motivation driven by local competitive forces, a community of specialized information, and industry innovation. Clusters can have a significant impact on competition by increasing productivity, driving the pace of innovation, and stimulating the formation of new businesses in a region. A key assumption in the forgoing analysis is that economic development initiatives targeting business attraction should focus on existing clusters to develop the supply chain and strengthen the geographic concentration. Strengthening the industry clusters will spur new business development. Phase I of the Winnebago County Food Processing Industry analysis evaluates the region�s existing clusters and identifies potential targets for industry attraction not only in terms of food processing but also in the supply chain for the food processing industry.
8 Porter, Michael E. Clusters and the New Economics of Competition. Harvard Business Review; Boston; Nov/Dec 1998. 9 Ibid.
Winnebago County Comprehensive Industry Analysis Food Processing Industry
12
The State of the Food Processing Industry in the Region
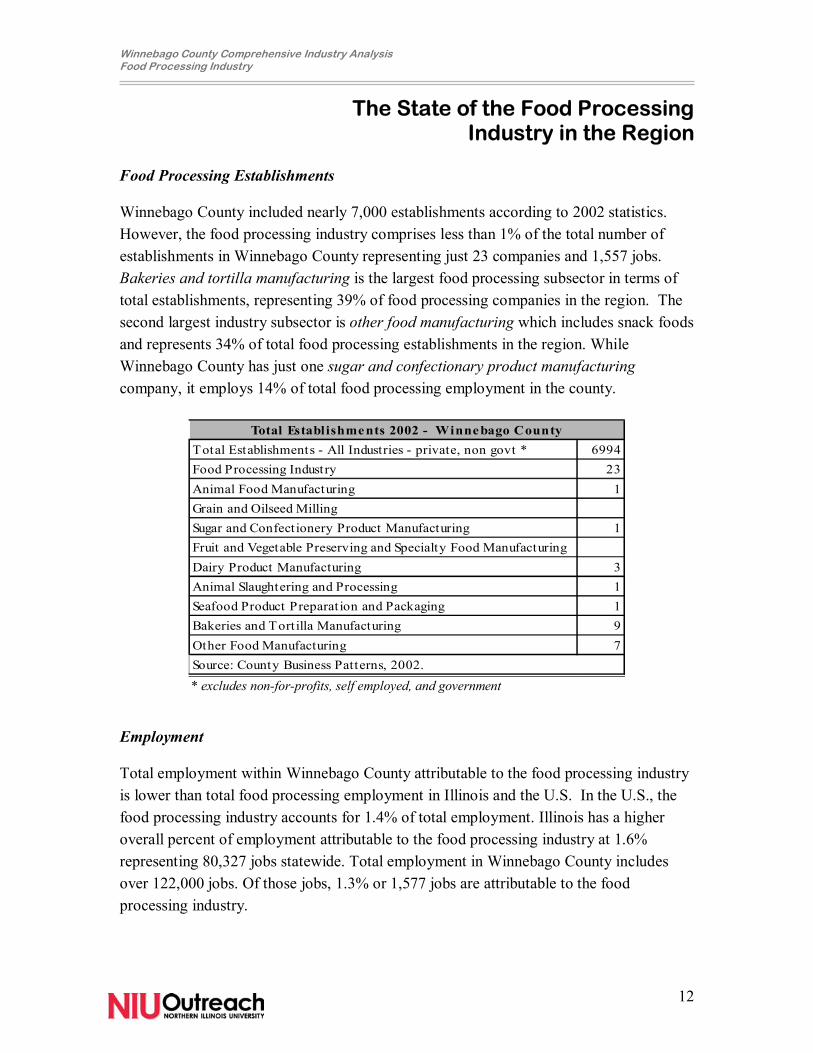
Food Processing Establishments Winnebago County included nearly 7,000 establishments according to 2002 statistics. However, the food processing industry comprises less than 1% of the total number of establishments in Winnebago County representing just 23 companies and 1,557 jobs. Bakeries and tortilla manufacturing is the largest food processing subsector in terms of total establishments, representing 39% of food processing companies in the region. The second largest industry subsector is other food manufacturing which includes snack foods and represents 34% of total food processing establishments in the region. While Winnebago County has just one sugar and confectionary product manufacturing company, it employs 14% of total food processing employment in the county.
Total Establishments - All Industries - private, non govt * 6994Food Processing Industry 23Animal Food Manufacturing 1Grain and Oilseed MillingSugar and Confectionery Product Manufacturing 1Fruit and Vegetable Preserving and Specialty Food ManufacturingDairy Product Manufacturing 3Animal Slaughtering and Processing 1Seafood Product Preparat ion and Packaging 1Bakeries and Tort illa Manufacturing 9Other Food Manufacturing 7
Total Establishments 2002 - Winnebago County
Source: County Business Patterns, 2002. * excludes non-for-profits, self employed, and government Employment Total employment within Winnebago County attributable to the food processing industry is lower than total food processing employment in Illinois and the U.S. In the U.S., the food processing industry accounts for 1.4% of total employment. Illinois has a higher overall percent of employment attributable to the food processing industry at 1.6% representing 80,327 jobs statewide. Total employment in Winnebago County includes over 122,000 jobs. Of those jobs, 1.3% or 1,577 jobs are attributable to the food processing industry.
Winnebago County Comprehensive Industry Analysis Food Processing Industry
13
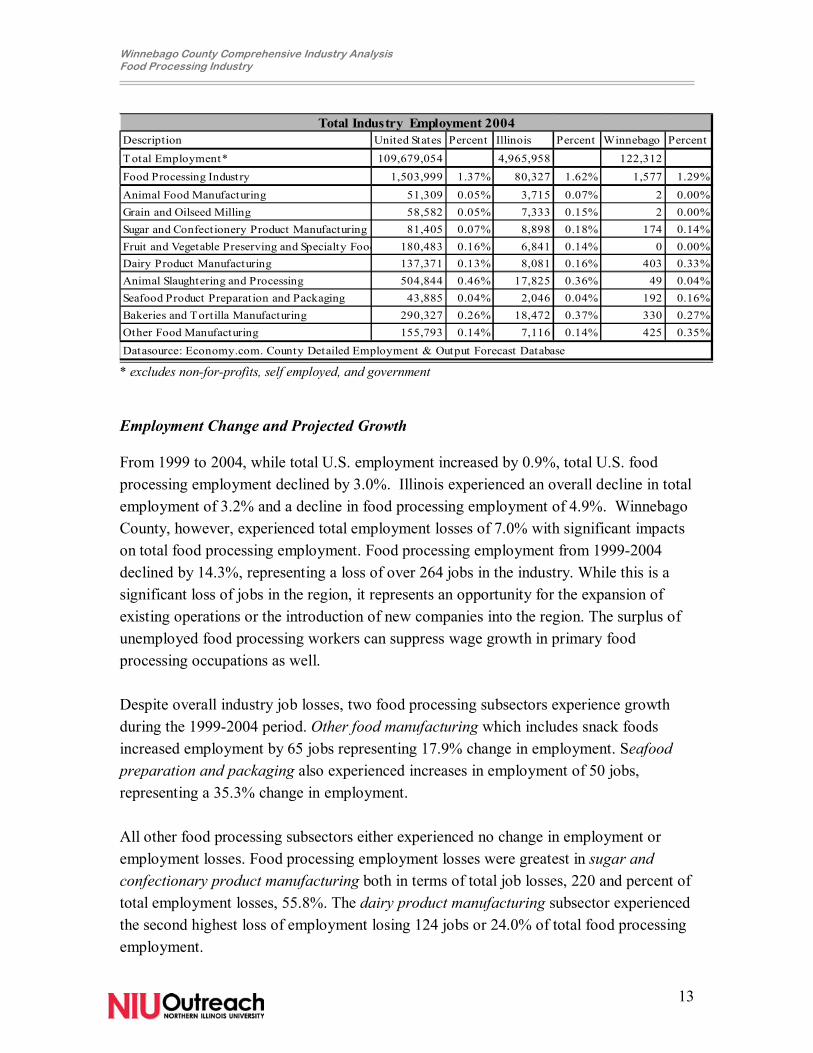
Description United States Percent Illinois Percent Winnebago Percent
T otal Employment* 109,679,054 4,965,958 122,312Food Processing Industry 1,503,999 1.37% 80,327 1.62% 1,577 1.29%Animal Food Manufacturing 51,309 0.05% 3,715 0.07% 2 0.00%Grain and Oilseed Milling 58,582 0.05% 7,333 0.15% 2 0.00%Sugar and Confectionery Product Manufacturing 81,405 0.07% 8,898 0.18% 174 0.14%Fruit and Vegetable Preserving and Specialty Food 180,483 0.16% 6,841 0.14% 0 0.00%Dairy Product Manufacturing 137,371 0.13% 8,081 0.16% 403 0.33%Animal Slaughtering and Processing 504,844 0.46% 17,825 0.36% 49 0.04%Seafood Product Preparation and Packaging 43,885 0.04% 2,046 0.04% 192 0.16%Bakeries and Tortilla Manufacturing 290,327 0.26% 18,472 0.37% 330 0.27%Other Food Manufacturing 155,793 0.14% 7,116 0.14% 425 0.35%Datasource: Economy.com. County Detailed Employment & Output Forecast Database
Total Industry Employment 2004
* excludes non-for-profits, self employed, and government Employment Change and Projected Growth From 1999 to 2004, while total U.S. employment increased by 0.9%, total U.S. food processing employment declined by 3.0%. Illinois experienced an overall decline in total employment of 3.2% and a decline in food processing employment of 4.9%. Winnebago County, however, experienced total employment losses of 7.0% with significant impacts on total food processing employment. Food processing employment from 1999-2004 declined by 14.3%, representing a loss of over 264 jobs in the industry. While this is a significant loss of jobs in the region, it represents an opportunity for the expansion of existing operations or the introduction of new companies into the region. The surplus of unemployed food processing workers can suppress wage growth in primary food processing occupations as well. Despite overall industry job losses, two food processing subsectors experience growth during the 1999-2004 period. Other food manufacturing which includes snack foods increased employment by 65 jobs representing 17.9% change in employment. Seafood preparation and packaging also experienced increases in employment of 50 jobs, representing a 35.3% change in employment. All other food processing subsectors either experienced no change in employment or employment losses. Food processing employment losses were greatest in sugar and confectionary product manufacturing both in terms of total job losses, 220 and percent of total employment losses, 55.8%. The dairy product manufacturing subsector experienced the second highest loss of employment losing 124 jobs or 24.0% of total food processing employment.
Winnebago County Comprehensive Industry Analysis Food Processing Industry
14
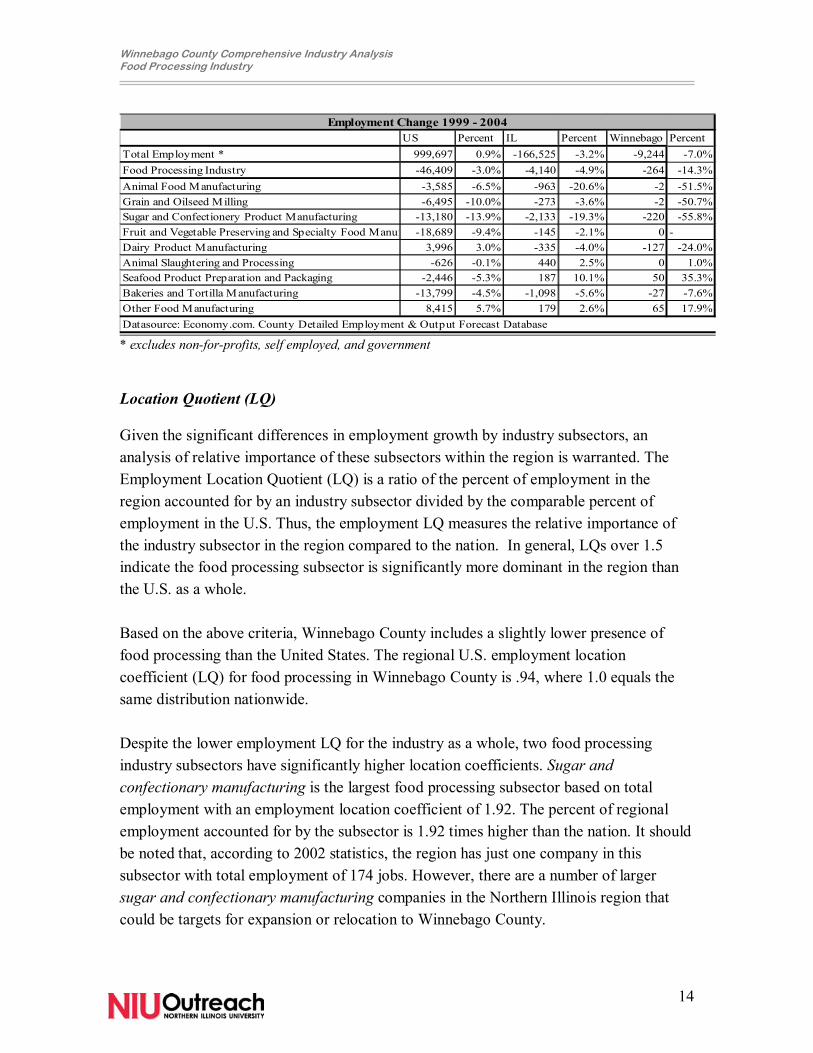
US Percent IL Percent Winnebago PercentTotal Employment * 999,697 0.9% -166,525 -3.2% -9,244 -7.0%Food Processing Industry -46,409 -3.0% -4,140 -4.9% -264 -14.3%Animal Food Manufacturing -3,585 -6.5% -963 -20.6% -2 -51.5%Grain and Oilseed Milling -6,495 -10.0% -273 -3.6% -2 -50.7%Sugar and Confectionery Product Manufacturing -13,180 -13.9% -2,133 -19.3% -220 -55.8%Fruit and Vegetable Preserving and Specialty Food Manuf -18,689 -9.4% -145 -2.1% 0 -Dairy Product Manufacturing 3,996 3.0% -335 -4.0% -127 -24.0%Animal Slaughtering and Processing -626 -0.1% 440 2.5% 0 1.0%Seafood Product Preparation and Packaging -2,446 -5.3% 187 10.1% 50 35.3%Bakeries and Tortilla Manufacturing -13,799 -4.5% -1,098 -5.6% -27 -7.6%Other Food Manufacturing 8,415 5.7% 179 2.6% 65 17.9%
Employment Change 1999 - 2004
Datasource: Economy.com. County Detailed Employment & Output Forecast Database
* excludes non-for-profits, self employed, and government Location Quotient (LQ) Given the significant differences in employment growth by industry subsectors, an analysis of relative importance of these subsectors within the region is warranted. The Employment Location Quotient (LQ) is a ratio of the percent of employment in the region accounted for by an industry subsector divided by the comparable percent of employment in the U.S. Thus, the employment LQ measures the relative importance of the industry subsector in the region compared to the nation. In general, LQs over 1.5 indicate the food processing subsector is significantly more dominant in the region than the U.S. as a whole. Based on the above criteria, Winnebago County includes a slightly lower presence of food processing than the United States. The regional U.S. employment location coefficient (LQ) for food processing in Winnebago County is .94, where 1.0 equals the same distribution nationwide. Despite the lower employment LQ for the industry as a whole, two food processing industry subsectors have significantly higher location coefficients. Sugar and confectionary manufacturing is the largest food processing subsector based on total employment with an employment location coefficient of 1.92. The percent of regional employment accounted for by the subsector is 1.92 times higher than the nation. It should be noted that, according to 2002 statistics, the region has just one company in this subsector with total employment of 174 jobs. However, there are a number of larger sugar and confectionary manufacturing companies in the Northern Illinois region that could be targets for expansion or relocation to Winnebago County.
Winnebago County Comprehensive Industry Analysis Food Processing Industry
15
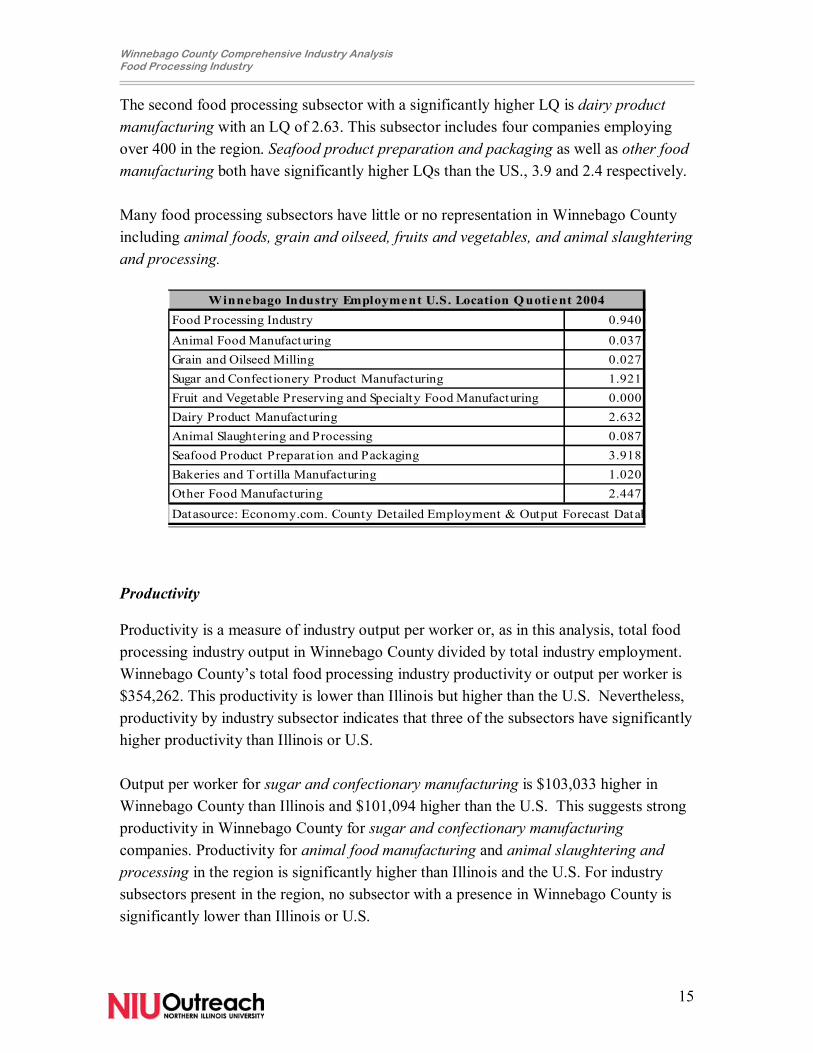
The second food processing subsector with a significantly higher LQ is dairy product manufacturing with an LQ of 2.63. This subsector includes four companies employing over 400 in the region. Seafood product preparation and packaging as well as other food manufacturing both have significantly higher LQs than the US., 3.9 and 2.4 respectively. Many food processing subsectors have little or no representation in Winnebago County including animal foods, grain and oilseed, fruits and vegetables, and animal slaughtering and processing.
Food Processing Industry 0.940
Animal Food Manufacturing 0.037Grain and Oilseed Milling 0.027Sugar and Confectionery Product Manufacturing 1.921Fruit and Vegetable Preserving and Specialty Food Manufacturing 0.000Dairy Product Manufacturing 2.632Animal Slaughtering and Processing 0.087Seafood Product Preparat ion and Packaging 3.918Bakeries and Tortilla Manufacturing 1.020Other Food Manufacturing 2.447
Winnebago Industry Employment U.S. Location Q uotient 2004
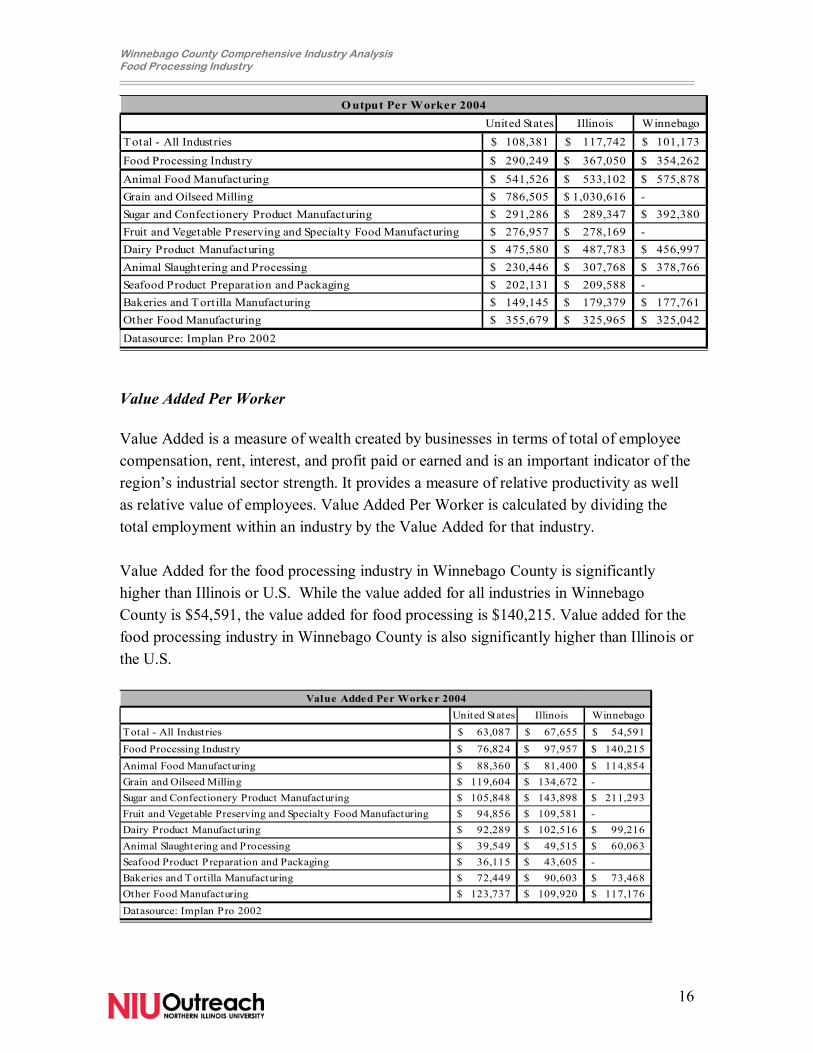
Datasource: Economy.com. County Detailed Employment & Output Forecast Datab Productivity Productivity is a measure of industry output per worker or, as in this analysis, total food processing industry output in Winnebago County divided by total industry employment. Winnebago County�s total food processing industry productivity or output per worker is $354,262. This productivity is lower than Illinois but higher than the U.S. Nevertheless, productivity by industry subsector indicates that three of the subsectors have significantly higher productivity than Illinois or U.S. Output per worker for sugar and confectionary manufacturing is $103,033 higher in Winnebago County than Illinois and $101,094 higher than the U.S. This suggests strong productivity in Winnebago County for sugar and confectionary manufacturing companies. Productivity for animal food manufacturing and animal slaughtering and processing in the region is significantly higher than Illinois and the U.S. For industry subsectors present in the region, no subsector with a presence in Winnebago County is significantly lower than Illinois or U.S.
Winnebago County Comprehensive Industry Analysis Food Processing Industry
16
United States Illinois WinnebagoTotal - All Industries 108,381$ 117,742$ 101,173$
Food Processing Industry 290,249$ 367,050$ 354,262$ Animal Food Manufacturing 541,526$ 533,102$ 575,878$ Grain and Oilseed Milling 786,505$ 1,030,616$ -Sugar and Confectionery Product Manufacturing 291,286$ 289,347$ 392,380$ Fruit and Vegetable Preserving and Specialty Food Manufacturing 276,957$ 278,169$ -Dairy Product Manufacturing 475,580$ 487,783$ 456,997$ Animal Slaughtering and Processing 230,446$ 307,768$ 378,766$ Seafood Product Preparation and Packaging 202,131$ 209,588$ -Bakeries and Tortilla Manufacturing 149,145$ 179,379$ 177,761$ Other Food Manufacturing 355,679$ 325,965$ 325,042$
O utput Per Worker 2004
Datasource: Implan Pro 2002
Value Added Per Worker
Value Added is a measure of wealth created by businesses in terms of total of employee compensation, rent, interest, and profit paid or earned and is an important indicator of the region�s industrial sector strength. It provides a measure of relative productivity as well as relative value of employees. Value Added Per Worker is calculated by dividing the total employment within an industry by the Value Added for that industry. Value Added for the food processing industry in Winnebago County is significantly higher than Illinois or U.S. While the value added for all industries in Winnebago County is $54,591, the value added for food processing is $140,215. Value added for the food processing industry in Winnebago County is also significantly higher than Illinois or the U.S.
United States Illinois WinnebagoTotal - All Industries 63,087$ 67,655$ 54,591$ Food Processing Industry 76,824$ 97,957$ 140,215$ Animal Food Manufacturing 88,360$ 81,400$ 114,854$ Grain and Oilseed Milling 119,604$ 134,672$ -Sugar and Confectionery Product Manufacturing 105,848$ 143,898$ 211,293$ Fruit and Vegetable Preserving and Specialty Food Manufacturing 94,856$ 109,581$ -Dairy Product Manufacturing 92,289$ 102,516$ 99,216$ Animal Slaughtering and Processing 39,549$ 49,515$ 60,063$ Seafood Product Preparation and Packaging 36,115$ 43,605$ -Bakeries and T ortilla Manufacturing 72,449$ 90,603$ 73,468$ Other Food Manufacturing 123,737$ 109,920$ 117,176$
Value Added Per Worke r 2004
Datasource: Implan Pro 2002
Winnebago County Comprehensive Industry Analysis Food Processing Industry
17
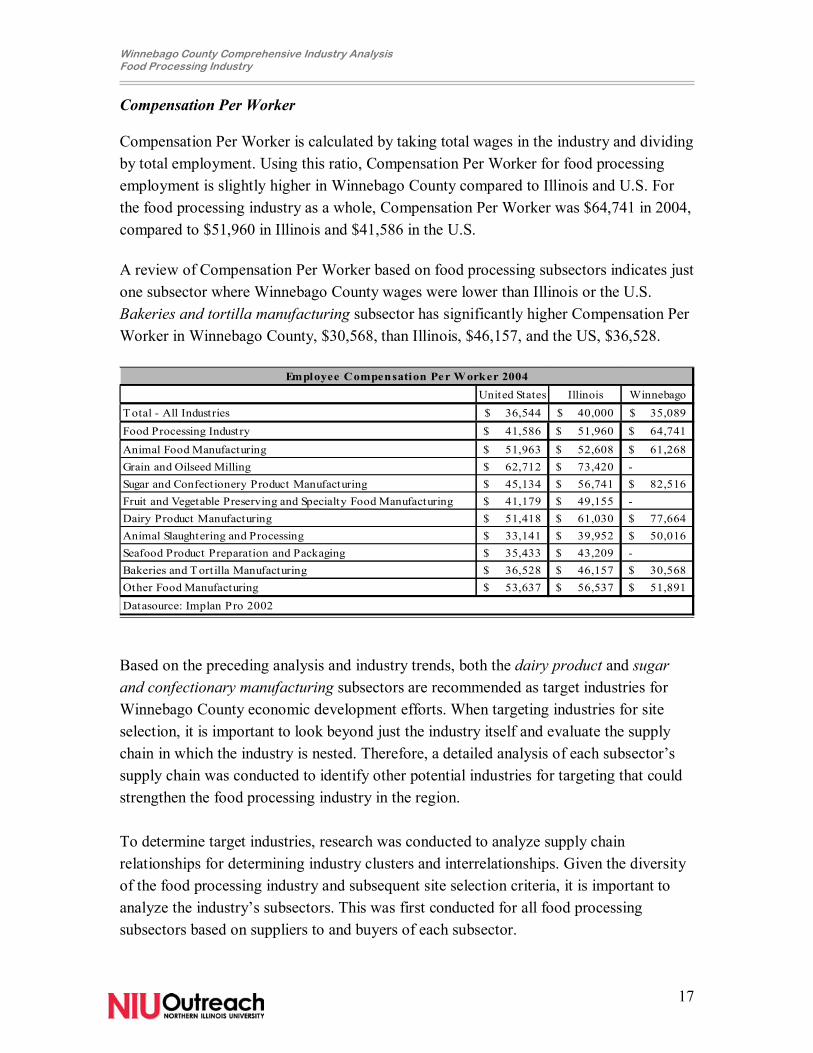
Compensation Per Worker Compensation Per Worker is calculated by taking total wages in the industry and dividing by total employment. Using this ratio, Compensation Per Worker for food processing employment is slightly higher in Winnebago County compared to Illinois and U.S. For the food processing industry as a whole, Compensation Per Worker was $64,741 in 2004, compared to $51,960 in Illinois and $41,586 in the U.S. A review of Compensation Per Worker based on food processing subsectors indicates just one subsector where Winnebago County wages were lower than Illinois or the U.S. Bakeries and tortilla manufacturing subsector has significantly higher Compensation Per Worker in Winnebago County, $30,568, than Illinois, $46,157, and the US, $36,528.
United States Illinois WinnebagoT otal - All Industries 36,544$ 40,000$ 35,089$ Food Processing Industry 41,586$ 51,960$ 64,741$
Animal Food Manufacturing 51,963$ 52,608$ 61,268$ Grain and Oilseed Milling 62,712$ 73,420$ -Sugar and Confectionery Product Manufacturing 45,134$ 56,741$ 82,516$ Fruit and Vegetable Preserving and Specialty Food Manufacturing 41,179$ 49,155$ -Dairy Product Manufacturing 51,418$ 61,030$ 77,664$ Animal Slaughtering and Processing 33,141$ 39,952$ 50,016$ Seafood Product Preparation and Packaging 35,433$ 43,209$ -Bakeries and T ortilla Manufacturing 36,528$ 46,157$ 30,568$ Other Food Manufacturing 53,637$ 56,537$ 51,891$
Employee Compensation Per Worker 2004
Datasource: Implan Pro 2002
Based on the preceding analysis and industry trends, both the dairy product and sugar and confectionary manufacturing subsectors are recommended as target industries for Winnebago County economic development efforts. When targeting industries for site selection, it is important to look beyond just the industry itself and evaluate the supply chain in which the industry is nested. Therefore, a detailed analysis of each subsector�s supply chain was conducted to identify other potential industries for targeting that could strengthen the food processing industry in the region. To determine target industries, research was conducted to analyze supply chain relationships for determining industry clusters and interrelationships. Given the diversity of the food processing industry and subsequent site selection criteria, it is important to analyze the industry�s subsectors. This was first conducted for all food processing subsectors based on suppliers to and buyers of each subsector.
Winnebago County Comprehensive Industry Analysis Food Processing Industry
18
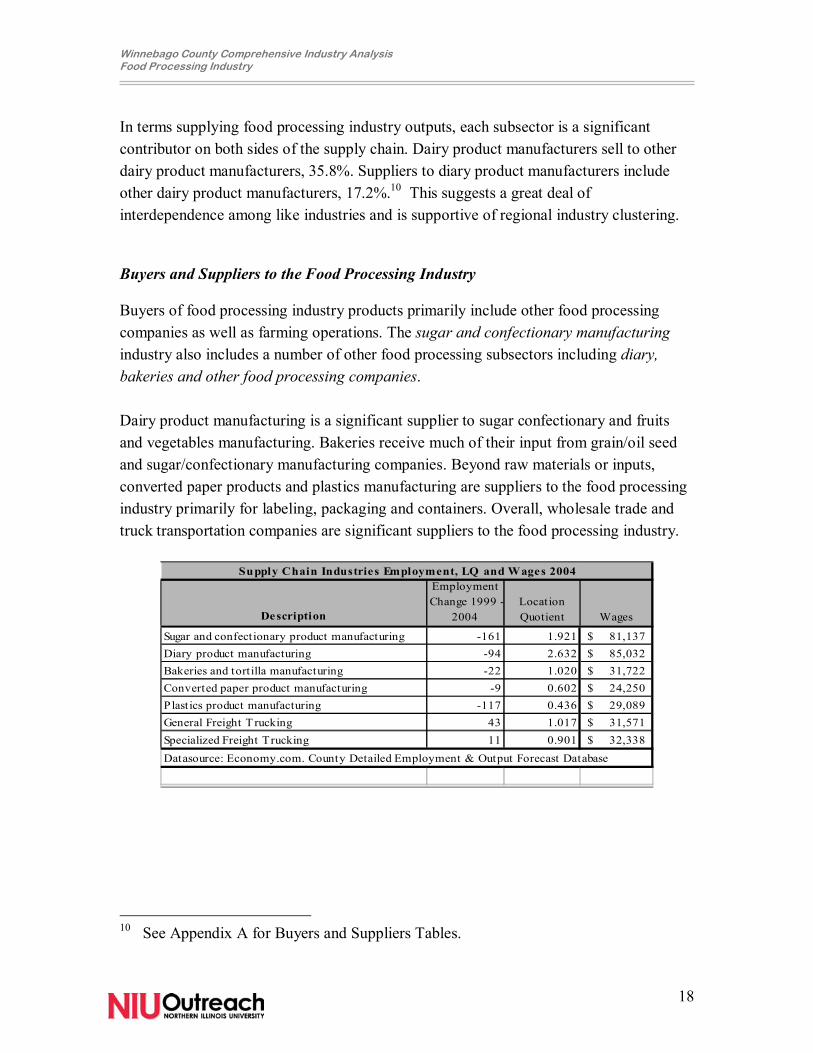
In terms supplying food processing industry outputs, each subsector is a significant contributor on both sides of the supply chain. Dairy product manufacturers sell to other dairy product manufacturers, 35.8%. Suppliers to diary product manufacturers include other dairy product manufacturers, 17.2%.10 This suggests a great deal of interdependence among like industries and is supportive of regional industry clustering. Buyers and Suppliers to the Food Processing Industry Buyers of food processing industry products primarily include other food processing companies as well as farming operations. The sugar and confectionary manufacturing industry also includes a number of other food processing subsectors including diary, bakeries and other food processing companies. Dairy product manufacturing is a significant supplier to sugar confectionary and fruits and vegetables manufacturing. Bakeries receive much of their input from grain/oil seed and sugar/confectionary manufacturing companies. Beyond raw materials or inputs, converted paper products and plastics manufacturing are suppliers to the food processing industry primarily for labeling, packaging and containers. Overall, wholesale trade and truck transportation companies are significant suppliers to the food processing industry.
Description
Employment Change 1999 -
2004Location Quotient Wages
Sugar and confectionary product manufacturing -161 1.921 81,137$ Diary product manufacturing -94 2.632 85,032$ Bakeries and tort illa manufacturing -22 1.020 31,722$ Converted paper product manufacturing -9 0.602 24,250$ Plastics product manufacturing -117 0.436 29,089$ General Freight T rucking 43 1.017 31,571$ Specialized Freight Trucking 11 0.901 32,338$
Supply Chain Industries Employment, LQ and Wages 2004
Datasource: Economy.com. County Detailed Employment & Output Forecast Database
10 See Appendix A for Buyers and Suppliers Tables.
Winnebago County Comprehensive Industry Analysis Food Processing Industry
19
Strengthening the Food Processing Industry in Winnebago County In order for Winnebago County to develop its food processing industry cluster in the region, efforts should be undertaken to attract not only select subsectors in the industry but also buyers and suppliers in the supply chain. Based on the preceding analysis, the following industries are recommended as targets for business attraction efforts: Primary
3113 Sugar and confectionary product manufacturing 20 Chocolate and confectionary manufacturing from cacao beans 30 Confectionary manufacturing from purchased chocolate 40 Non chocolate confectionary manufacturing
3114 Diary product manufacturing 11 Fluid milk manufacturing 12 Creamery butter manufacturing 13 Cheese manufacturing 14 Dry, condensed, and evaporated dairy product manufacturing 15 Ice cream and frozen dessert manufacturing
Secondary 3118 Bakeries and tortilla manufacturing 3222 Converted paper product manufacturing
1001 paperboard containers, boxes, corrugated paperboard manufacturing
3261 Plastics product manufacturing 28 Plastics containers
42 Wholesale trade 484 Truck transportation
Phase II of this industry analysis includes a detailed site selection evaluation based on the needs of industries identified along with recommendations to Winnebago County on economic development efforts and target companies.
Winnebago County Comprehensive Industry Analysis Food Processing Industry
20
Site Selection Criteria Existing regional food processing companies provided a first-hand account of the state of the business climate for the food processing industry in Winnebago County. Approximately 43% of the region�s food processing employers were contacted to gauge their perceptions of the region�s business climate and workforce characteristics. Employers in Winnebago County and southern Wisconsin participated in the interviews conducted in the summer and fall of 2005. Employers were asked to respond to questions focusing on their perceptions of Winnebago County as a place to do business and ratings of the regions strengths and weaknesses based on site selection criteria. Site selection professionals utilize a wide variety of data and information to analyze various potential locations. Employers were asked to rate Winnebago County based on these key criteria and other significant factors used in site selection activities. Information on labor quality was also collected. Below is a summary of both the importance of site selection criteria and employer ratings of Winnebago County. While the summary indicates the county has more strengths than weaknesses in terms of important food processing industry criteria, there are areas for improvement such as improved public perceptions and local government and regulatory support. Detailed analysis of these site selection criteria is the focus of the following section of this report. Location The most important site selection criteria for the food processing industry is location in terms of proximity, access, and transportation costs. Proximity to supply chain partners is crucial for operations. For the food processing industry, some of the most important supply chain partners are the distribution centers that warehouse and distribute products to markets as well as container manufacturing companies that provide paper and plastic containers for food products. Another key component of location is access to interstates and other major highway transportation corridors. Of growing importance to food processing industry is proximity to multi-modal transportation infrastructure particularly in the light of rising fuel costs. Location to supply chain partners and access to transportation are both critical for their impact on transportation costs. The farther a company is from both the supply and
Winnebago County Comprehensive Industry Analysis Food Processing Industry
21
demand side of its operations, the higher the transportation costs.11 And since higher transportation costs increase labor costs, the most significant consideration for any company is location. Workforce Availability and Cost The second most important site selection criteria for the food processing industry is workforce availability and cost. The availability of an appropriately skilled workforce at a reasonable cost is one of the key site selection criteria. Recent manufacturing closures and layoffs are contributing to increased availability of workers and may have an impact on suppressing regional wages. Nevertheless, employers report that the presence of dominant employers in the region impacts their ability to attract a quality workforce, particularly in machinist and maintenance occupations. Another aspect of the food processing industry, which is changing the need for a high skilled workforce is automation. Over the past few decades increased technology and automation has reduced the number of workers required to process and package products. However, the increased use of machines to process and package food products results in greater reliance on industrial mechanics and machinery maintenance occupations. Regional food processing employers report difficulty in finding quality workers in both occupations. Wastewater Treatment Another important site selection criteria relatively unique to the food processing industry is wastewater treatment. During the production of food products, waste water run off from both the production process and equipment sanitation requires treatment before it can be returned to public water systems. While many food processing companies operate in-house wastewater treatment systems, the availability of water sources both for waste water treatment and return of sanitized water is very important. The Rock River provides an excellent source for wastewater treatment and return.
11 Transportation costs include fuel, labor and other costs required to moving goods from one location to another. While toll costs are highly visible transportation costs, their overall impact is marginal on total transportation costs.
Winnebago County Comprehensive Industry Analysis Food Processing Industry
22
Access to Air Service For select operations, access to air service is critical. In addition to close proximity (within 1.5 hours) to Chicago�s O�Hare Airport, Winnebago County has its own airport service at the Northwest Chicago land Regional Airport at Rockford (RFD), which is a valuable asset to regional companies. RFD has the distinction of being the nation�s 23rd largest air cargo airport. RFD offers many benefits to cargo operations including excellent facilities, a congestion-free airspace, and proximity to a major intermodal transportation hub. In addition, RFD is a U.S. Customs Port of Entry and home to Foreign Trade Zone 176. Rockford's UPS Air Hub was constructed at RFD in 1994 as a key component in the global UPS network. RFD is home to the second largest air hub sorting facility in United Parcel Service's system. The Rockford UPS facility serves over 200 countries and territories and sorts an average 130,000 to 170,000 packages nightly. In addition, Airborne Express and BAX Global have smaller facilities at RFD.
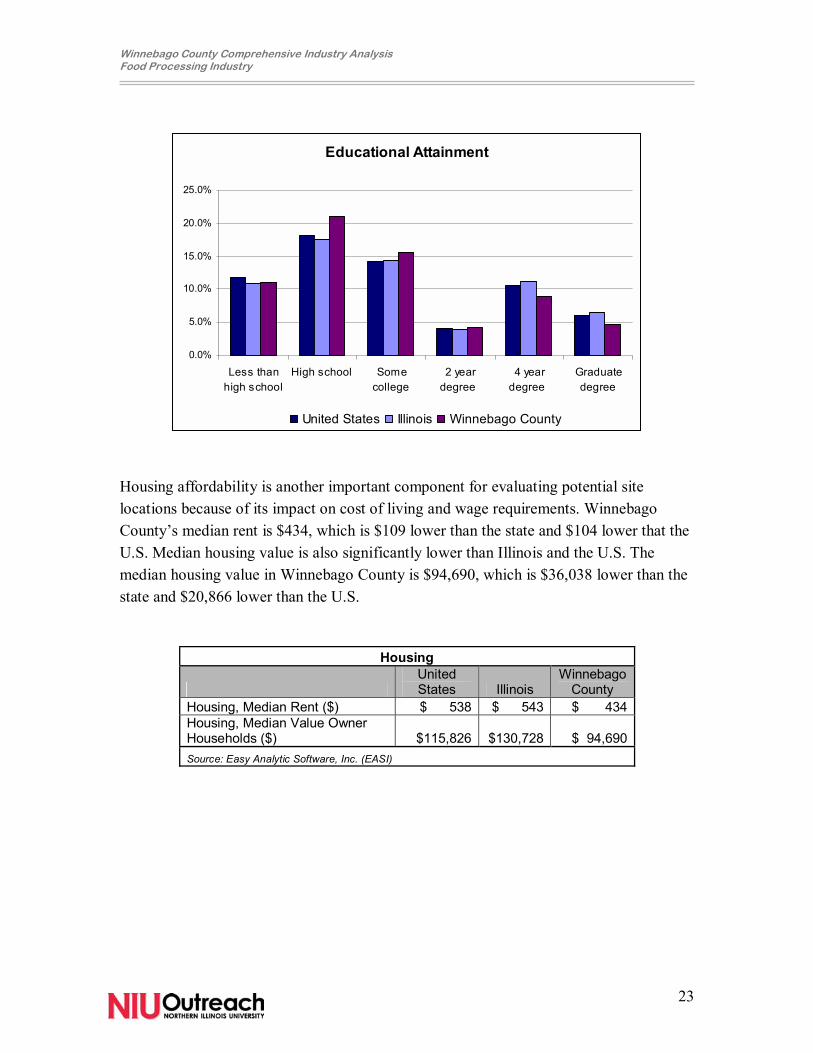
Quality of Life Quality of life is important, not necessarily by itself, but for its impact on labor availability and quality. A region with higher quality of life factors will be better able to attract and maintain a high quality workforce. Key quality of life factors include access to higher education, overall educational attainment, cost of living, and housing affordability. Access to higher education in a region is important for site selection as it implies a higher quality labor pool with better employment skills and work ethic. The county includes both two-year and four-year degree granting institutions, Rock Valley College and Rockford College respectively. In addition, Northern Illinois University whose main campus is located in nearly DeKalb, also offers a secondary campus at NIU Rockford which provide bachelor�s degree completion programs and graduate courses as well as partnerships with other four-year universities that supplement access to four-year degree programs. In terms of educational attainment, Winnebago County has a lower percent of residents age 25 or older with a four-year or graduate level degree than the state or U.S. A greater percent of the county�s population has a high school diploma or some college courses.
Winnebago County Comprehensive Industry Analysis Food Processing Industry
23
Housing affordability is another important component for evaluating potential site locations because of its impact on cost of living and wage requirements. Winnebago County�s median rent is $434, which is $109 lower than the state and $104 lower that the U.S. Median housing value is also significantly lower than Illinois and the U.S. The median housing value in Winnebago County is $94,690, which is $36,038 lower than the state and $20,866 lower than the U.S.
Housing
United States Illinois
Winnebago County
Housing, Median Rent ($) $ 538 $ 543 $ 434 Housing, Median Value Owner Households ($) $115,826
$130,728 $ 94,690
Source: Easy Analytic Software, Inc. (EASI)
Educational Attainment
0.0%
5.0%
10.0%
15.0%
20.0%
25.0%
Less thanhigh school
High school Somecollege
2 yeardegree
4 yeardegree
Graduatedegree
United States Illinois Winnebago County
Winnebago County Comprehensive Industry Analysis Food Processing Industry
24
Labor Market Analysis
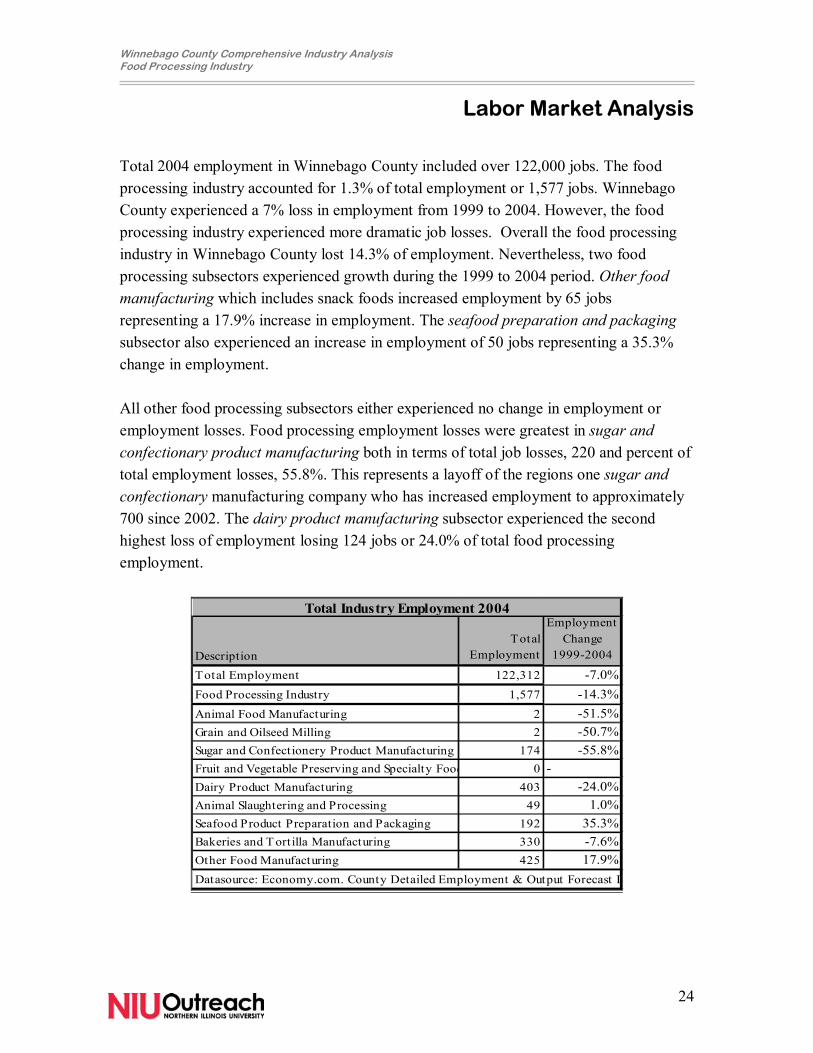
Total 2004 employment in Winnebago County included over 122,000 jobs. The food processing industry accounted for 1.3% of total employment or 1,577 jobs. Winnebago County experienced a 7% loss in employment from 1999 to 2004. However, the food processing industry experienced more dramatic job losses. Overall the food processing industry in Winnebago County lost 14.3% of employment. Nevertheless, two food processing subsectors experienced growth during the 1999 to 2004 period. Other food manufacturing which includes snack foods increased employment by 65 jobs representing a 17.9% increase in employment. The seafood preparation and packaging subsector also experienced an increase in employment of 50 jobs representing a 35.3% change in employment. All other food processing subsectors either experienced no change in employment or employment losses. Food processing employment losses were greatest in sugar and confectionary product manufacturing both in terms of total job losses, 220 and percent of total employment losses, 55.8%. This represents a layoff of the regions one sugar and confectionary manufacturing company who has increased employment to approximately 700 since 2002. The dairy product manufacturing subsector experienced the second highest loss of employment losing 124 jobs or 24.0% of total food processing employment.
DescriptionTotal
Employment
Employment Change
1999-2004
Total Employment 122,312 -7.0%Food Processing Industry 1,577 -14.3%Animal Food Manufacturing 2 -51.5%Grain and Oilseed Milling 2 -50.7%Sugar and Confect ionery Product Manufacturing 174 -55.8%Fruit and Vegetable Preserving and Specialty Food 0 -Dairy Product Manufacturing 403 -24.0%Animal Slaughtering and Processing 49 1.0%Seafood Product Preparation and Packaging 192 35.3%Bakeries and T ort illa Manufacturing 330 -7.6%Other Food Manufacturing 425 17.9%Datasource: Economy.com. County Detailed Employment & Output Forecast D
Total Industry Employment 2004
Winnebago County Comprehensive Industry Analysis Food Processing Industry
25
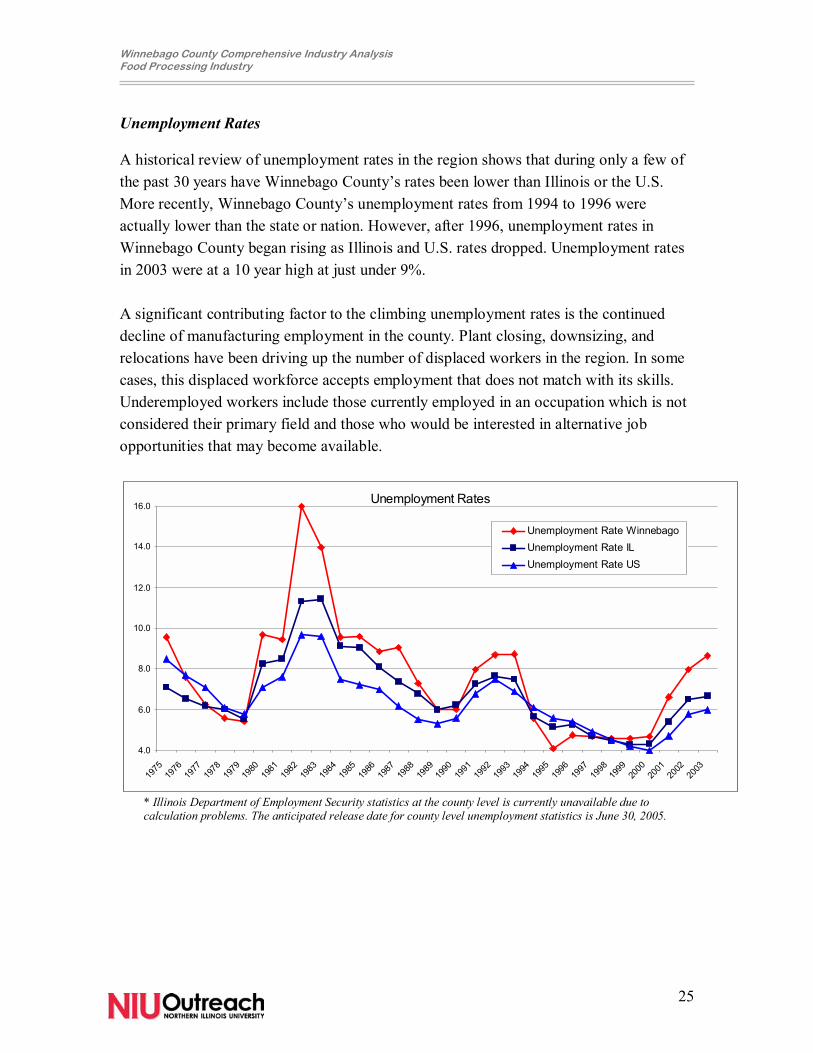
Unemployment Rates A historical review of unemployment rates in the region shows that during only a few of the past 30 years have Winnebago County�s rates been lower than Illinois or the U.S. More recently, Winnebago County�s unemployment rates from 1994 to 1996 were actually lower than the state or nation. However, after 1996, unemployment rates in Winnebago County began rising as Illinois and U.S. rates dropped. Unemployment rates in 2003 were at a 10 year high at just under 9%.
A significant contributing factor to the climbing unemployment rates is the continued decline of manufacturing employment in the county. Plant closing, downsizing, and relocations have been driving up the number of displaced workers in the region. In some cases, this displaced workforce accepts employment that does not match with its skills. Underemployed workers include those currently employed in an occupation which is not considered their primary field and those who would be interested in alternative job opportunities that may become available.
Unemployment Rates
4.0
6.0
8.0
10.0
12.0
14.0
16.0
1975
1976
1977
1978
1979
1980
1981
1982
1983
1984
1985
1986
1987
1988
1989
1990
1991
1992
1993
1994
1995
1996
1997
1998
1999
2000
2001
2002
2003
Unemployment Rate WinnebagoUnemployment Rate ILUnemployment Rate US
* Illinois Department of Employment Security statistics at the county level is currently unavailable due to calculation problems. The anticipated release date for county level unemployment statistics is June 30, 2005.
Winnebago County Comprehensive Industry Analysis Food Processing Industry
26
Workforce Availability and Labor Stress Interviews with existing food processing employers indicate that, in general, labor availability in the region is good. According to employers, finding workers to fill lower skilled positions such as packagers is relatively easy, but those workers are more difficult to retain. The difficulty in retention of lower skilled positions is not unique to the food processing industry in the region. Despite relatively high unemployment in recent years and the loss of several manufacturing companies in the region, food processing employers still report workforce availability issues within several occupations. Machine operators and machinery maintenance mechanics are reportedly difficult to find within the existing labor pool. This is due in large part to other more dominant industries such as Chrysler in Belvidere which has recently added new assembly lines. Food processing employers are experiencing competition from these dominant employers, which provide workers with the perception of greater stability and, in many cases, higher wage and benefit packages. Another key element important in site selection decisions is the extent to which the potential labor market region is experiencing labor stress within a specific industry. A region with an overload of food processing operations is likely to experience significant labor stress for the critical occupations as workers are more likely to transition from one company to another. The decline of manufacturing establishments and employment suggests labor stress should not be problematic for the region. However, the impact of dominant employers on smaller operations will continue to be a challenge.
Winnebago County Comprehensive Industry Analysis Food Processing Industry
27
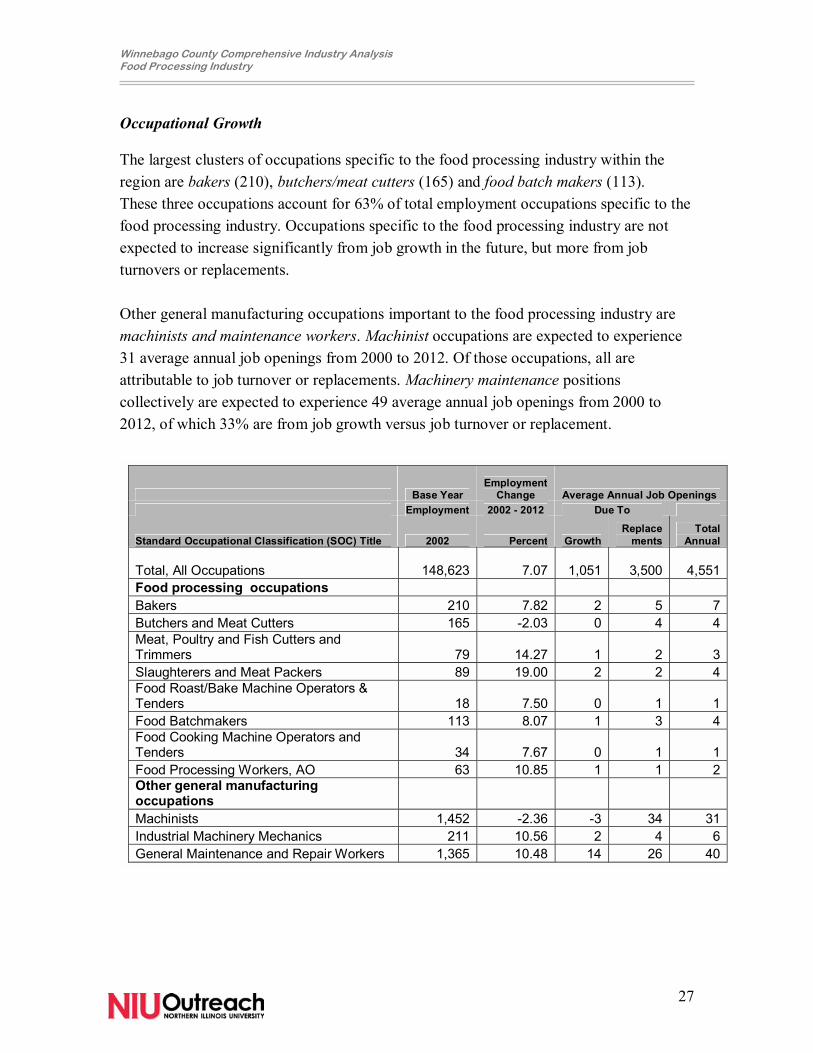
Occupational Growth The largest clusters of occupations specific to the food processing industry within the region are bakers (210), butchers/meat cutters (165) and food batch makers (113). These three occupations account for 63% of total employment occupations specific to the food processing industry. Occupations specific to the food processing industry are not expected to increase significantly from job growth in the future, but more from job turnovers or replacements. Other general manufacturing occupations important to the food processing industry are machinists and maintenance workers. Machinist occupations are expected to experience 31 average annual job openings from 2000 to 2012. Of those occupations, all are attributable to job turnover or replacements. Machinery maintenance positions collectively are expected to experience 49 average annual job openings from 2000 to 2012, of which 33% are from job growth versus job turnover or replacement.
Base Year Employment
Change Average Annual Job Openings Employment 2002 - 2012 Due To
Standard Occupational Classification (SOC) Title 2002 Percent Growth Replace
ments Total
Annual
Total, All Occupations 148,623 7.07
1,051 3,500
4,551Food processing occupations Bakers 210 7.82 2 5 7Butchers and Meat Cutters 165 -2.03 0 4 4Meat, Poultry and Fish Cutters and Trimmers 79 14.27 1 2 3Slaughterers and Meat Packers 89 19.00 2 2 4Food Roast/Bake Machine Operators & Tenders 18 7.50 0 1 1Food Batchmakers 113 8.07 1 3 4Food Cooking Machine Operators and Tenders 34 7.67 0 1 1Food Processing Workers, AO 63 10.85 1 1 2Other general manufacturing occupations Machinists 1,452 -2.36 -3 34 31Industrial Machinery Mechanics 211 10.56 2 4 6General Maintenance and Repair Workers 1,365 10.48 14 26 40
Winnebago County Comprehensive Industry Analysis Food Processing Industry
28
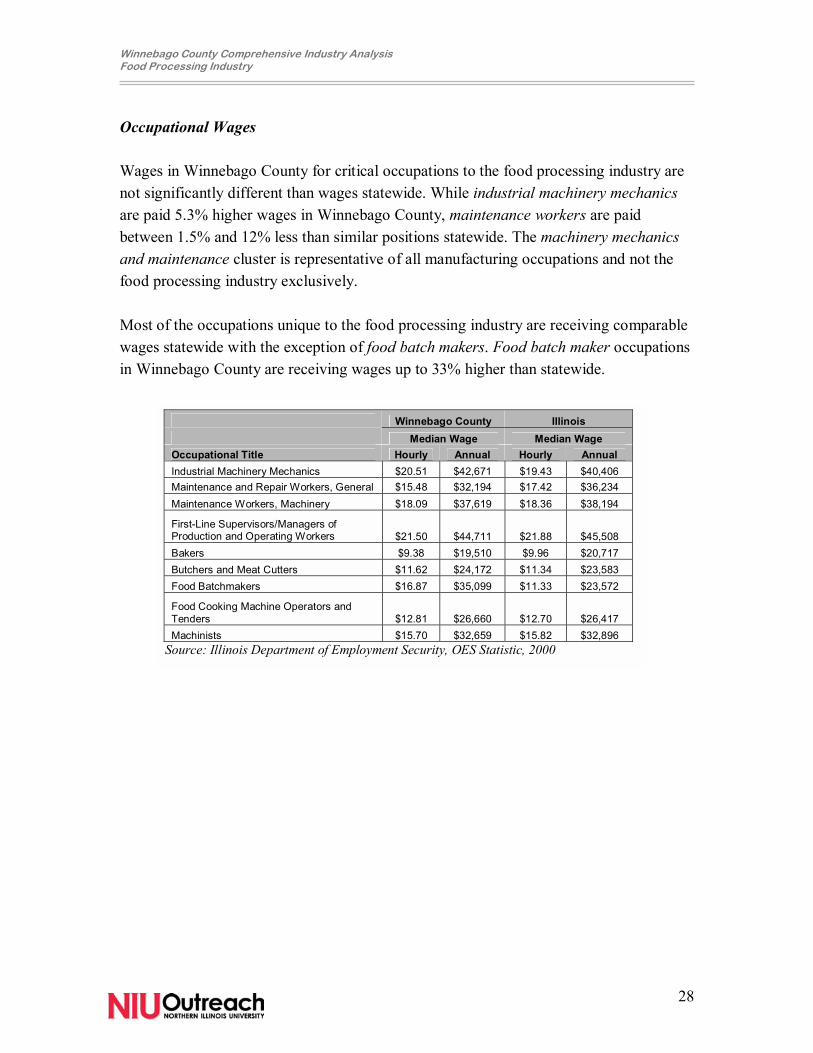
Occupational Wages Wages in Winnebago County for critical occupations to the food processing industry are not significantly different than wages statewide. While industrial machinery mechanics are paid 5.3% higher wages in Winnebago County, maintenance workers are paid between 1.5% and 12% less than similar positions statewide. The machinery mechanics and maintenance cluster is representative of all manufacturing occupations and not the food processing industry exclusively. Most of the occupations unique to the food processing industry are receiving comparable wages statewide with the exception of food batch makers. Food batch maker occupations in Winnebago County are receiving wages up to 33% higher than statewide.
Winnebago County Illinois Median Wage Median Wage Occupational Title Hourly Annual Hourly Annual Industrial Machinery Mechanics $20.51 $42,671 $19.43 $40,406 Maintenance and Repair Workers, General $15.48 $32,194 $17.42 $36,234 Maintenance Workers, Machinery $18.09 $37,619 $18.36 $38,194
First-Line Supervisors/Managers of Production and Operating Workers $21.50 $44,711 $21.88 $45,508 Bakers $9.38 $19,510 $9.96 $20,717 Butchers and Meat Cutters $11.62 $24,172 $11.34 $23,583 Food Batchmakers $16.87 $35,099 $11.33 $23,572
Food Cooking Machine Operators and Tenders $12.81 $26,660 $12.70 $26,417 Machinists $15.70 $32,659 $15.82 $32,896
Source: Illinois Department of Employment Security, OES Statistic, 2000
Winnebago County Comprehensive Industry Analysis Food Processing Industry
29
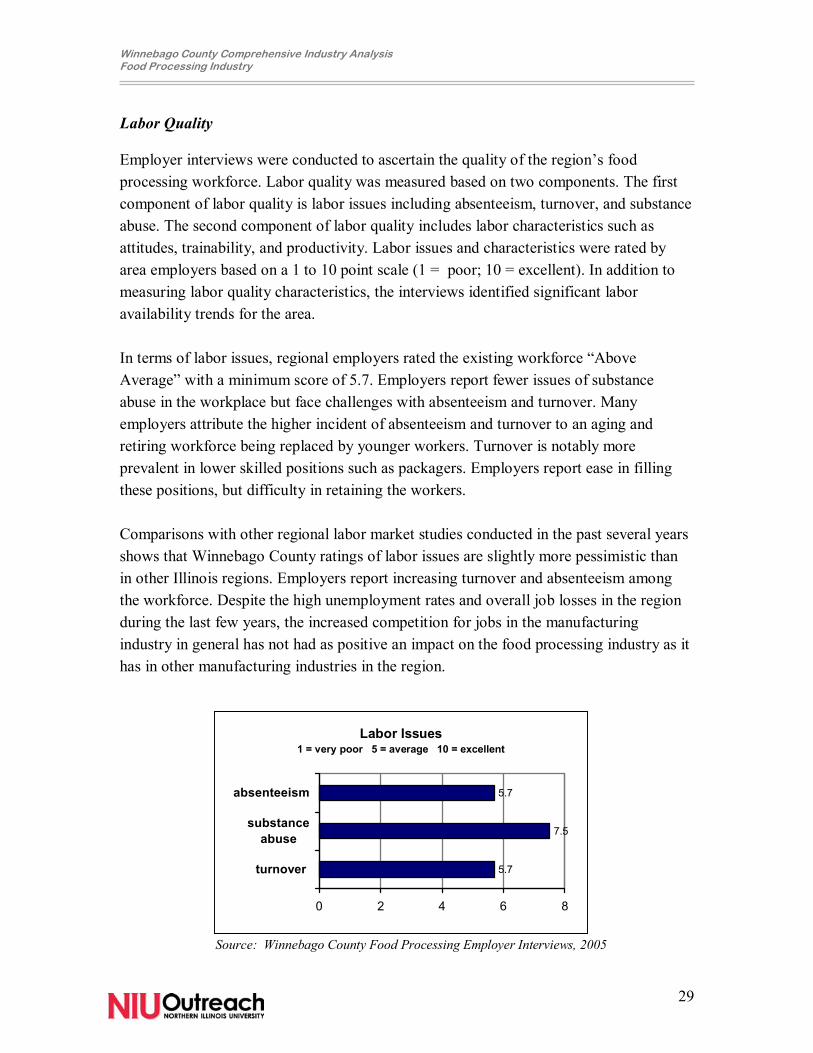
Labor Quality Employer interviews were conducted to ascertain the quality of the region�s food processing workforce. Labor quality was measured based on two components. The first component of labor quality is labor issues including absenteeism, turnover, and substance abuse. The second component of labor quality includes labor characteristics such as attitudes, trainability, and productivity. Labor issues and characteristics were rated by area employers based on a 1 to 10 point scale (1 = poor; 10 = excellent). In addition to measuring labor quality characteristics, the interviews identified significant labor availability trends for the area.
In terms of labor issues, regional employers rated the existing workforce �Above Average� with a minimum score of 5.7. Employers report fewer issues of substance abuse in the workplace but face challenges with absenteeism and turnover. Many employers attribute the higher incident of absenteeism and turnover to an aging and retiring workforce being replaced by younger workers. Turnover is notably more prevalent in lower skilled positions such as packagers. Employers report ease in filling these positions, but difficulty in retaining the workers.
Comparisons with other regional labor market studies conducted in the past several years shows that Winnebago County ratings of labor issues are slightly more pessimistic than in other Illinois regions. Employers report increasing turnover and absenteeism among the workforce. Despite the high unemployment rates and overall job losses in the region during the last few years, the increased competition for jobs in the manufacturing industry in general has not had as positive an impact on the food processing industry as it has in other manufacturing industries in the region.
Source: Winnebago County Food Processing Employer Interviews, 2005
Labor Issues1 = very poor 5 = average 10 = excellent
5.7
7.5
5.7
0 2 4 6 8
turnover
substanceabuse
absenteeism
Winnebago County Comprehensive Industry Analysis Food Processing Industry
30
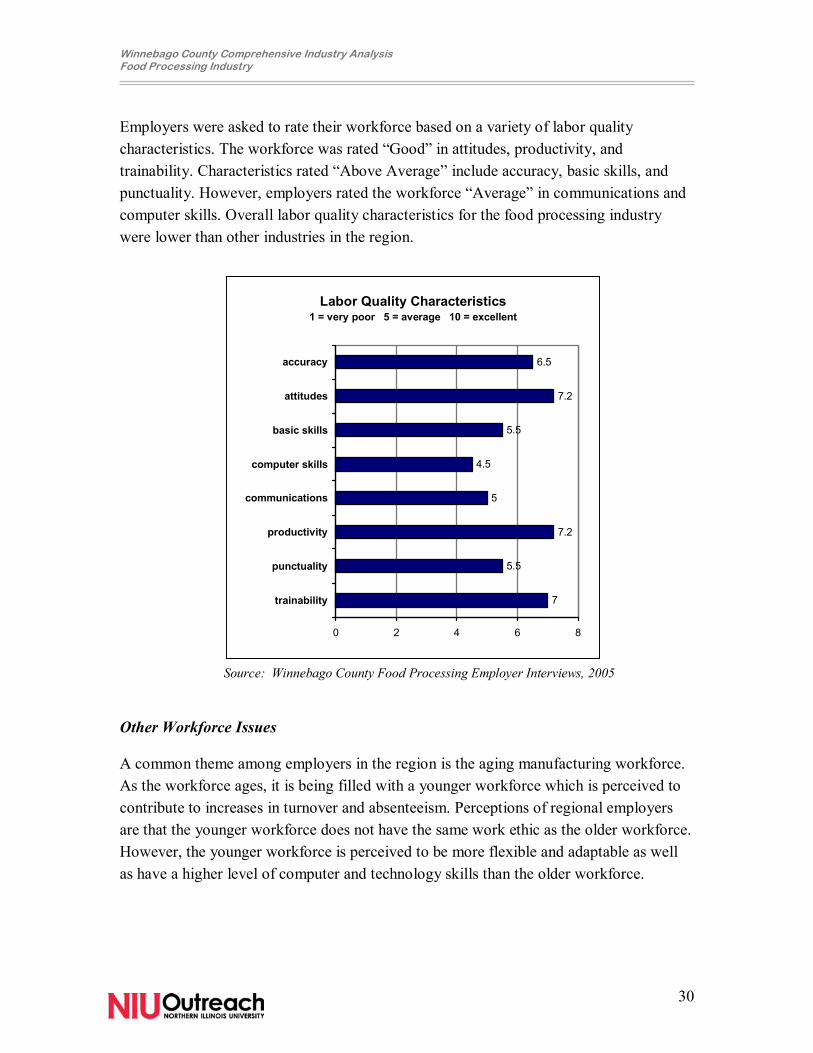
Employers were asked to rate their workforce based on a variety of labor quality characteristics. The workforce was rated �Good� in attitudes, productivity, and trainability. Characteristics rated �Above Average� include accuracy, basic skills, and punctuality. However, employers rated the workforce �Average� in communications and computer skills. Overall labor quality characteristics for the food processing industry were lower than other industries in the region.
Source: Winnebago County Food Processing Employer Interviews, 2005 Other Workforce Issues A common theme among employers in the region is the aging manufacturing workforce. As the workforce ages, it is being filled with a younger workforce which is perceived to contribute to increases in turnover and absenteeism. Perceptions of regional employers are that the younger workforce does not have the same work ethic as the older workforce. However, the younger workforce is perceived to be more flexible and adaptable as well as have a higher level of computer and technology skills than the older workforce.
Labor Quality Characteristics1 = very poor 5 = average 10 = excellent
7
5.5
7.2
5
4.5
5.5
7.2
6.5
0 2 4 6 8
trainability
punctuality
productivity
communications
computer skills
basic skills
attitudes
accuracy
Winnebago County Comprehensive Industry Analysis Food Processing Industry
31
Cost of Doing Business Economic Impact of Food Processing Industry Subsectors As part of this study, an economic impact analysis was conducted for various subsectors of the food processing industry on the Winnebago County economy. The analysis was completed using the ImplanPro input/output model developed by the Implan Group. The model is unique in that the input/output coefficients are based on county specific patterns. The analysis was completed based on a food processing facility which employs 300 workers and is based on Winnebago County statistics for 2002. The analysis was completed separately for subsectors with a reportable presence in the region including:
• Fluid milk products • Non chocolate confectionary foods • Bakery and bread • Snack foods • Animal food processing
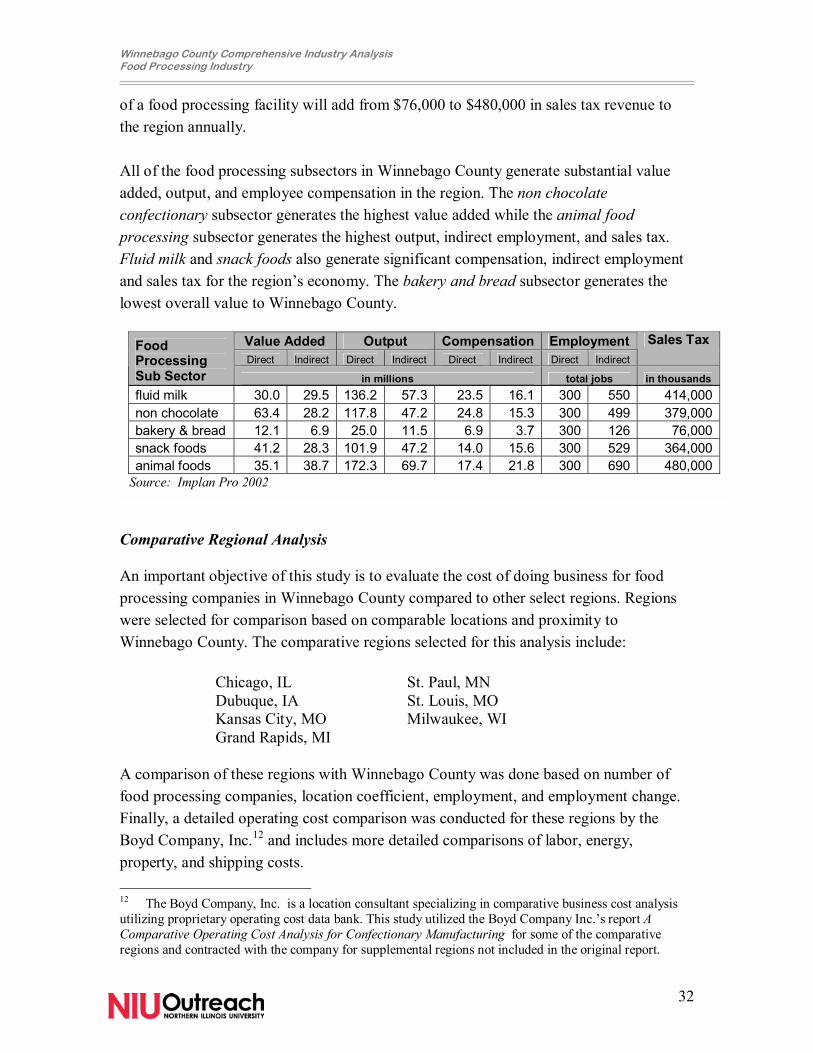
The analysis provides annual estimates for each food processing subsector in value added, output, compensation, employment, and sales tax generation for Winnebago County. Direct impacts are those estimates that result from the operation of the 300 person facility. Indirect or induced impacts reflect the secondary effects in the region of the operation of that facility. For example, as a result of the 300 person food processing company, the Winnebago County economy will experience increased economic activity in other industries such as retail, food services, and health services. Value Added is a measure of wealth created by businesses in terms of total of employee compensation, rent, interest, and profit paid or earned and is an important indicator of the region�s industrial sector strength. It provides a measure of relative productivity as well as relative value of employees. For the food processing subsectors identified above, the operation of a facility with 300 employees generates direct value added to the region of $12.1 to $63.4 million and indirect Value Added of an additional $6.9 to $38.7 million. Output refers to the total economic value of an industry�s product and is a measure of overall productivity. Direct output for a food processing facility with 300 employees produces from $25 to $172.3 million in output annually. Annual direct compensation for a food processing facility ranges from $6.9 to $24.8 million and creates from 126 to 690 jobs in other industries in the region. The operation
Winnebago County Comprehensive Industry Analysis Food Processing Industry
32
of a food processing facility will add from $76,000 to $480,000 in sales tax revenue to the region annually. All of the food processing subsectors in Winnebago County generate substantial value added, output, and employee compensation in the region. The non chocolate confectionary subsector generates the highest value added while the animal food processing subsector generates the highest output, indirect employment, and sales tax. Fluid milk and snack foods also generate significant compensation, indirect employment and sales tax for the region�s economy. The bakery and bread subsector generates the lowest overall value to Winnebago County.
Comparative Regional Analysis An important objective of this study is to evaluate the cost of doing business for food processing companies in Winnebago County compared to other select regions. Regions were selected for comparison based on comparable locations and proximity to Winnebago County. The comparative regions selected for this analysis include: Chicago, IL St. Paul, MN Dubuque, IA St. Louis, MO Kansas City, MO Milwaukee, WI Grand Rapids, MI A comparison of these regions with Winnebago County was done based on number of food processing companies, location coefficient, employment, and employment change. Finally, a detailed operating cost comparison was conducted for these regions by the Boyd Company, Inc.12 and includes more detailed comparisons of labor, energy, property, and shipping costs. 12 The Boyd Company, Inc. is a location consultant specializing in comparative business cost analysis utilizing proprietary operating cost data bank. This study utilized the Boyd Company Inc.�s report A Comparative Operating Cost Analysis for Confectionary Manufacturing for some of the comparative regions and contracted with the company for supplemental regions not included in the original report.
Value Added Output Compensation Employment Direct Indirect Direct Indirect Direct Indirect Direct Indirect
Sales Tax Food Processing Sub Sector in millions total jobs in thousands fluid milk 30.0 29.5 136.2 57.3 23.5 16.1 300 550 414,000non chocolate 63.4 28.2 117.8 47.2 24.8 15.3 300 499 379,000bakery & bread 12.1 6.9 25.0 11.5 6.9 3.7 300 126 76,000snack foods 41.2 28.3 101.9 47.2 14.0 15.6 300 529 364,000animal foods 35.1 38.7 172.3 69.7 17.4 21.8 300 690 480,000
Source: Implan Pro 2002
Winnebago County Comprehensive Industry Analysis Food Processing Industry
33
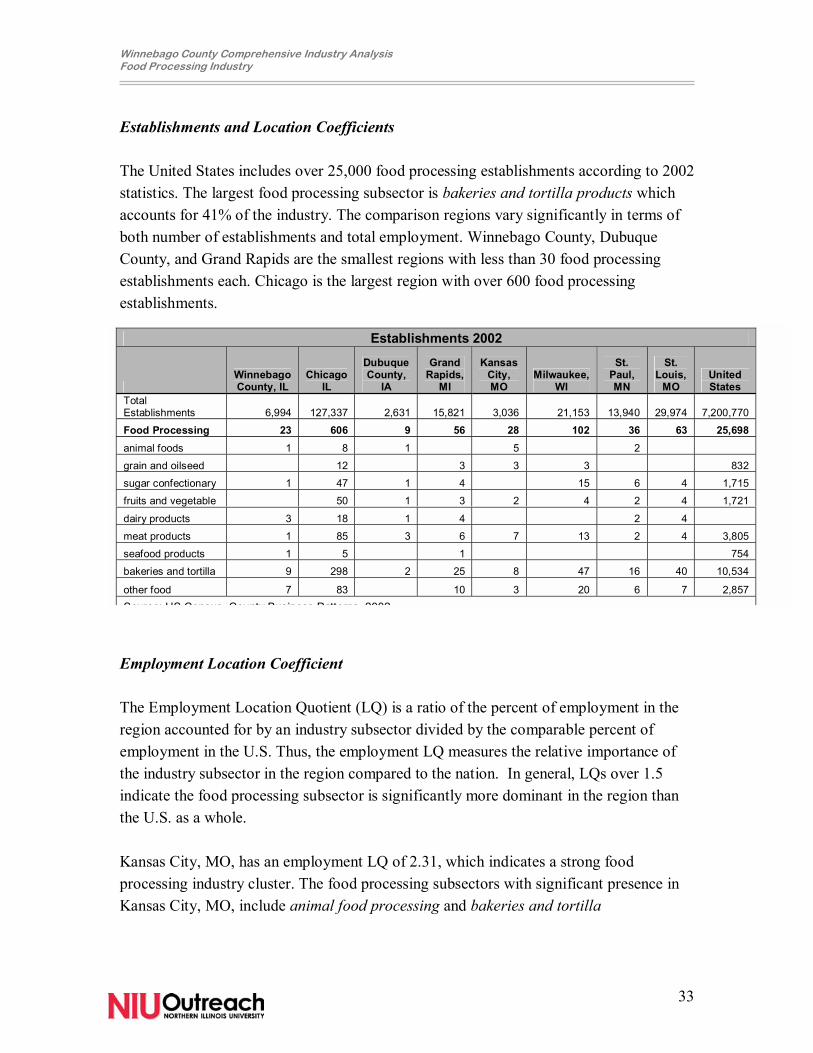
Establishments and Location Coefficients The United States includes over 25,000 food processing establishments according to 2002 statistics. The largest food processing subsector is bakeries and tortilla products which accounts for 41% of the industry. The comparison regions vary significantly in terms of both number of establishments and total employment. Winnebago County, Dubuque County, and Grand Rapids are the smallest regions with less than 30 food processing establishments each. Chicago is the largest region with over 600 food processing establishments.
Employment Location Coefficient The Employment Location Quotient (LQ) is a ratio of the percent of employment in the region accounted for by an industry subsector divided by the comparable percent of employment in the U.S. Thus, the employment LQ measures the relative importance of the industry subsector in the region compared to the nation. In general, LQs over 1.5 indicate the food processing subsector is significantly more dominant in the region than the U.S. as a whole. Kansas City, MO, has an employment LQ of 2.31, which indicates a strong food processing industry cluster. The food processing subsectors with significant presence in Kansas City, MO, include animal food processing and bakeries and tortilla
Establishments 2002
Winnebago County, IL
Chicago IL
Dubuque County,
IA
Grand Rapids,
MI
Kansas City, MO
Milwaukee, WI
St. Paul, MN
St. Louis,
MO United States
Total Establishments 6,994 127,337 2,631 15,821 3,036 21,153 13,940 29,974 7,200,770
Food Processing 23 606 9 56 28 102 36 63 25,698 animal foods 1 8 1 5 2
grain and oilseed 12 3 3 3 832
sugar confectionary 1 47 1 4 15 6 4 1,715
fruits and vegetable 50 1 3 2 4 2 4 1,721
dairy products 3 18 1 4 2 4
meat products 1 85 3 6 7 13 2 4 3,805
seafood products 1 5 1 754
bakeries and tortilla 9 298 2 25 8 47 16 40 10,534
other food 7 83 10 3 20 6 7 2,857 Source: US Census County Business Patterns 2002
Winnebago County Comprehensive Industry Analysis Food Processing Industry
34
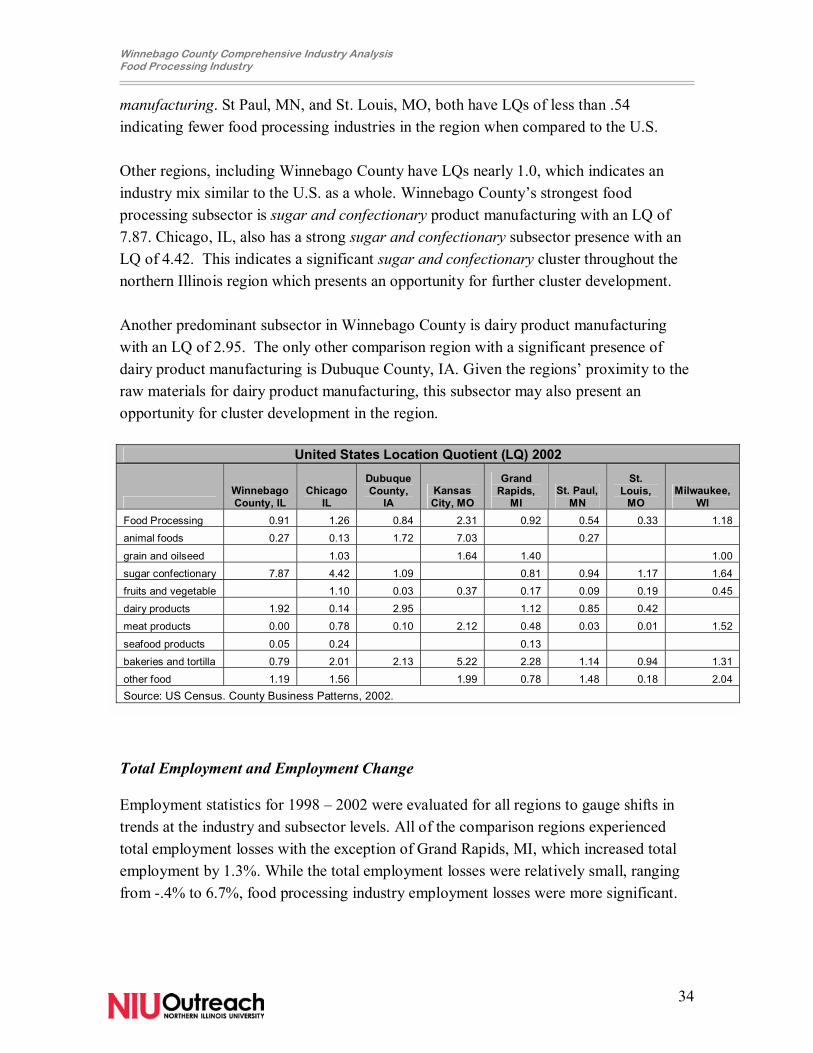
manufacturing. St Paul, MN, and St. Louis, MO, both have LQs of less than .54 indicating fewer food processing industries in the region when compared to the U.S. Other regions, including Winnebago County have LQs nearly 1.0, which indicates an industry mix similar to the U.S. as a whole. Winnebago County�s strongest food processing subsector is sugar and confectionary product manufacturing with an LQ of 7.87. Chicago, IL, also has a strong sugar and confectionary subsector presence with an LQ of 4.42. This indicates a significant sugar and confectionary cluster throughout the northern Illinois region which presents an opportunity for further cluster development. Another predominant subsector in Winnebago County is dairy product manufacturing with an LQ of 2.95. The only other comparison region with a significant presence of dairy product manufacturing is Dubuque County, IA. Given the regions� proximity to the raw materials for dairy product manufacturing, this subsector may also present an opportunity for cluster development in the region.
Total Employment and Employment Change Employment statistics for 1998 � 2002 were evaluated for all regions to gauge shifts in trends at the industry and subsector levels. All of the comparison regions experienced total employment losses with the exception of Grand Rapids, MI, which increased total employment by 1.3%. While the total employment losses were relatively small, ranging from -.4% to 6.7%, food processing industry employment losses were more significant.
United States Location Quotient (LQ) 2002
Winnebago County, IL
Chicago IL
Dubuque County,
IA Kansas City, MO
Grand Rapids,
MI St. Paul,
MN
St. Louis,
MO Milwaukee,
WI Food Processing 0.91 1.26 0.84 2.31 0.92 0.54 0.33 1.18
animal foods 0.27 0.13 1.72 7.03 0.27
grain and oilseed 1.03 1.64 1.40 1.00
sugar confectionary 7.87 4.42 1.09 0.81 0.94 1.17 1.64
fruits and vegetable 1.10 0.03 0.37 0.17 0.09 0.19 0.45
dairy products 1.92 0.14 2.95 1.12 0.85 0.42
meat products 0.00 0.78 0.10 2.12 0.48 0.03 0.01 1.52
seafood products 0.05 0.24 0.13
bakeries and tortilla 0.79 2.01 2.13 5.22 2.28 1.14 0.94 1.31
other food 1.19 1.56 1.99 0.78 1.48 0.18 2.04 Source: US Census. County Business Patterns, 2002.
Winnebago County Comprehensive Industry Analysis Food Processing Industry
35
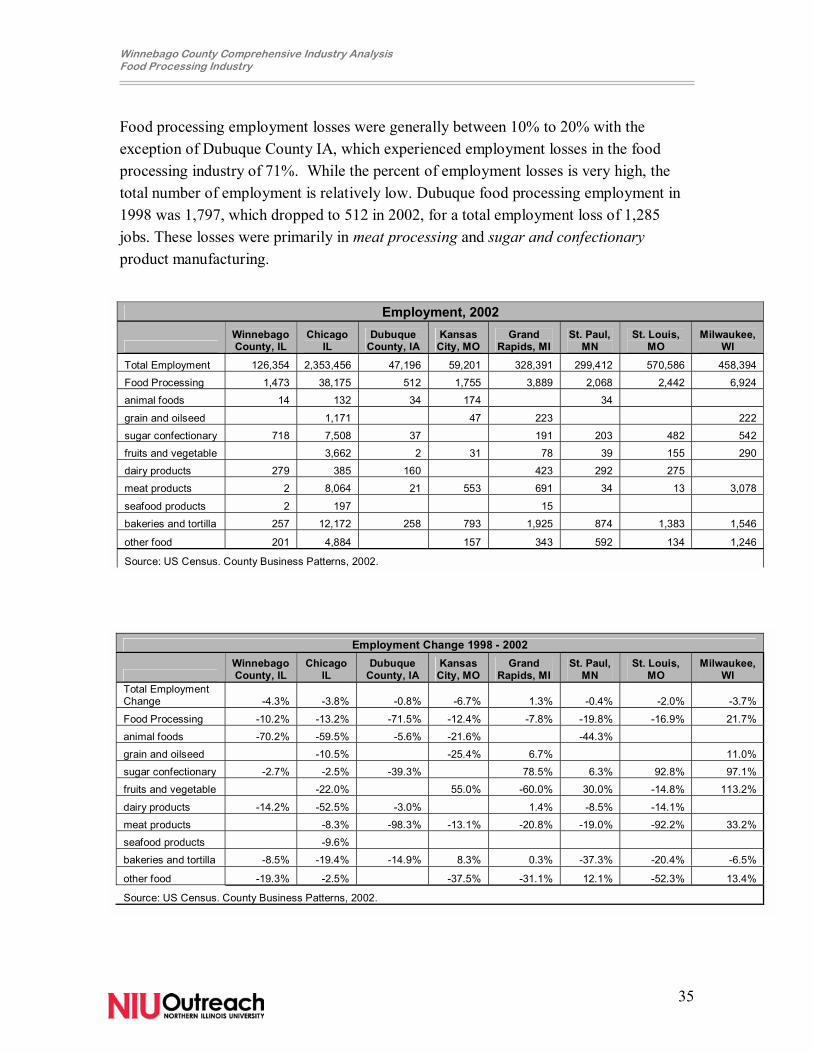
Food processing employment losses were generally between 10% to 20% with the exception of Dubuque County IA, which experienced employment losses in the food processing industry of 71%. While the percent of employment losses is very high, the total number of employment is relatively low. Dubuque food processing employment in 1998 was 1,797, which dropped to 512 in 2002, for a total employment loss of 1,285 jobs. These losses were primarily in meat processing and sugar and confectionary product manufacturing.
Employment Change 1998 - 2002
Winnebago County, IL
Chicago IL
Dubuque County, IA
Kansas City, MO
Grand Rapids, MI
St. Paul, MN
St. Louis, MO
Milwaukee, WI
Total Employment Change -4.3% -3.8% -0.8% -6.7% 1.3% -0.4% -2.0% -3.7%
Food Processing -10.2% -13.2% -71.5% -12.4% -7.8% -19.8% -16.9% 21.7%
animal foods -70.2% -59.5% -5.6% -21.6% -44.3%
grain and oilseed -10.5% -25.4% 6.7% 11.0%
sugar confectionary -2.7% -2.5% -39.3% 78.5% 6.3% 92.8% 97.1%
fruits and vegetable -22.0% 55.0% -60.0% 30.0% -14.8% 113.2%
dairy products -14.2% -52.5% -3.0% 1.4% -8.5% -14.1%
meat products -8.3% -98.3% -13.1% -20.8% -19.0% -92.2% 33.2%
seafood products -9.6%
bakeries and tortilla -8.5% -19.4% -14.9% 8.3% 0.3% -37.3% -20.4% -6.5%
other food -19.3% -2.5% -37.5% -31.1% 12.1% -52.3% 13.4%
Source: US Census. County Business Patterns, 2002.
Employment, 2002
Winnebago County, IL
Chicago IL
Dubuque County, IA
Kansas City, MO
Grand Rapids, MI
St. Paul, MN
St. Louis, MO
Milwaukee, WI
Total Employment 126,354 2,353,456 47,196 59,201 328,391 299,412 570,586 458,394
Food Processing 1,473 38,175 512 1,755 3,889 2,068 2,442 6,924
animal foods 14 132 34 174 34
grain and oilseed 1,171 47 223 222
sugar confectionary 718 7,508 37 191 203 482 542
fruits and vegetable 3,662 2 31 78 39 155 290
dairy products 279 385 160 423 292 275
meat products 2 8,064 21 553 691 34 13 3,078
seafood products 2 197 15
bakeries and tortilla 257 12,172 258 793 1,925 874 1,383 1,546
other food 201 4,884 157 343 592 134 1,246
Source: US Census. County Business Patterns, 2002.
Winnebago County Comprehensive Industry Analysis Food Processing Industry
36
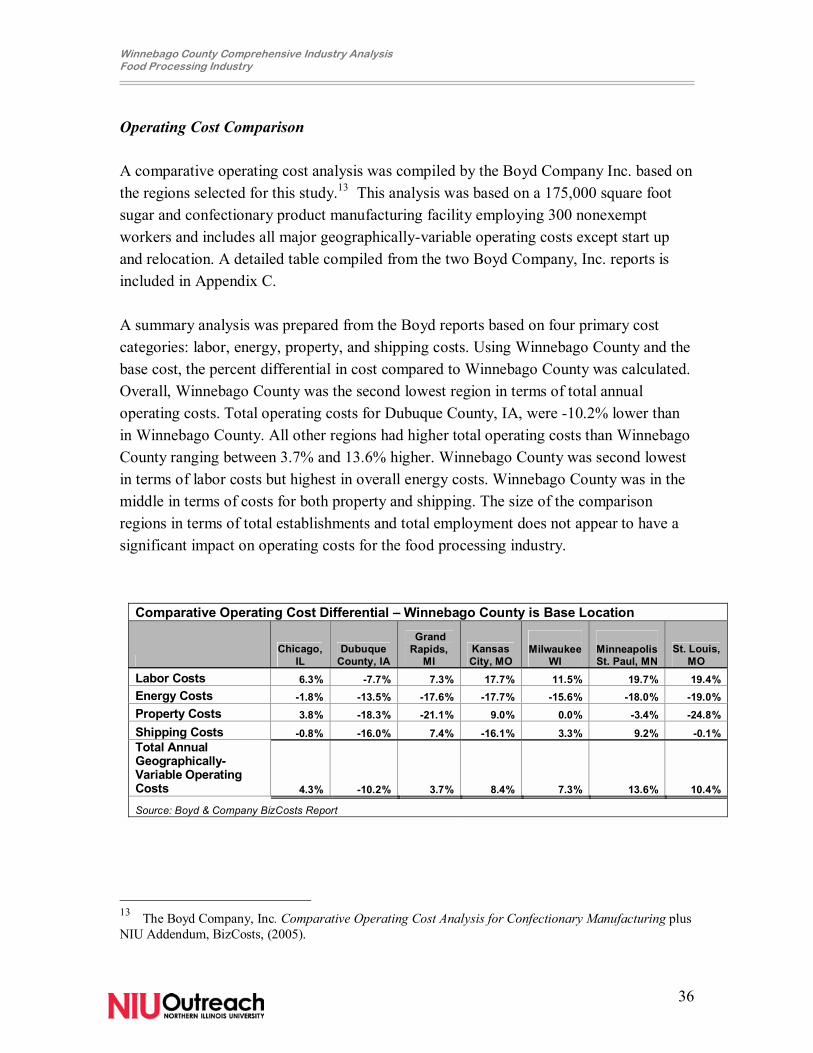
Operating Cost Comparison A comparative operating cost analysis was compiled by the Boyd Company Inc. based on the regions selected for this study.13 This analysis was based on a 175,000 square foot sugar and confectionary product manufacturing facility employing 300 nonexempt workers and includes all major geographically-variable operating costs except start up and relocation. A detailed table compiled from the two Boyd Company, Inc. reports is included in Appendix C. A summary analysis was prepared from the Boyd reports based on four primary cost categories: labor, energy, property, and shipping costs. Using Winnebago County and the base cost, the percent differential in cost compared to Winnebago County was calculated. Overall, Winnebago County was the second lowest region in terms of total annual operating costs. Total operating costs for Dubuque County, IA, were -10.2% lower than in Winnebago County. All other regions had higher total operating costs than Winnebago County ranging between 3.7% and 13.6% higher. Winnebago County was second lowest in terms of labor costs but highest in overall energy costs. Winnebago County was in the middle in terms of costs for both property and shipping. The size of the comparison regions in terms of total establishments and total employment does not appear to have a significant impact on operating costs for the food processing industry.
13 The Boyd Company, Inc. Comparative Operating Cost Analysis for Confectionary Manufacturing plus NIU Addendum, BizCosts, (2005).
Comparative Operating Cost Differential � Winnebago County is Base Location
Chicago,
IL Dubuque
County, IA
Grand Rapids,
MI Kansas City, MO
Milwaukee
WI
Minneapolis St. Paul, MN
St. Louis, MO
Labor Costs 6.3% -7.7% 7.3% 17.7% 11.5% 19.7% 19.4% Energy Costs -1.8% -13.5% -17.6% -17.7% -15.6% -18.0% -19.0% Property Costs 3.8% -18.3% -21.1% 9.0% 0.0% -3.4% -24.8% Shipping Costs -0.8% -16.0% 7.4% -16.1% 3.3% 9.2% -0.1% Total Annual Geographically-Variable Operating Costs 4.3% -10.2% 3.7% 8.4% 7.3% 13.6% 10.4%
Source: Boyd & Company BizCosts Report
Winnebago County Comprehensive Industry Analysis Food Processing Industry
37
Conclusions and Recommendations
The food processing industry has proven to be relatively stable during economic downturns, due in part to the fact that it is consumer expenditure driven. Another contributing factor to the industry�s relative stability is an increase in consumer demand for pre-packaged food products. Even during the most recent recession, the industry continued modest annual growth in value of shipments through 2003. The increased use of technology and automation to further productivity growth in the industry leads to lower demands for labor and level of skills. New investments in food processing plants generally include increases use of technology and automation in processes which decreases both the number of jobs needed and level of worker skills. This, in turn, can lead to lower overall wages. However, the combined effect of technology and automation generates an increase in productivity or output per worker for the industry as a whole. Winnebago County is inherently well positioned within the broader Midwest region in terms of both access to major markets and transportation infrastructure. However, location alone is not sufficient for successful business attraction efforts. The region must be more proactive in efforts to target and attract business to the county through more comprehensive development activities such as partnerships and relationship development, marketing programs, and advocacy for growing the regions� infrastructure and higher education opportunities. Over the past decade Winnebago County has developed and improved characteristics that can provide a regional competitiveness for business attraction. These characteristics include the improvement and expansion of the Northwest Chicago land Regional Airport at Rockford, the expansion of the railport hub in nearby Rochelle, the proposed expansion of broadband telecommunications infrastructure through NIUNET and ROCKNET, and further development of higher education opportunities. Yet the region has been experiencing significant losses, not only in employment, but also in business closures and relocations. These events contribute to a higher unemployed and underemployed workforce, which can also be positive in terms of labor availability. Based on the preceding analysis, this section includes recommendations for actions and initiatives that could expand the opportunities for successful attraction of the food processing industry to Winnebago County.
Winnebago County Comprehensive Industry Analysis Food Processing Industry
38
Winnebago County Strengths
• Access to transportation corridors and infrastructure
• Availability and access to waterways for treated wastewater return
• Significantly higher regional productivity in sugar and confectionary products and animal food manufacturing than Illinois or U.S.
• Significantly higher regional value added for food processing than Illinois or U.S.
• Low labor stress for occupations specific to the food processing industry
• High quality of the workforce in their ability to work independently and responsibly
• Low regional cost of doing business
• Regional focus on workforce shortages in manufacturing, particularly industrial mechanics and machinery maintenance occupations
Winnebago County Weaknesses
• Transitioning to younger manufacturing workforce and its perceived impact on turnover and absenteeism
• Competitive workforce environment driven by dominant larger employers who diminish the ability of food processing companies to attract and retain workers
• Lower availability of machine operators and maintenance mechanics
• Higher overall wages in food processing, but with significantly higher productivity and value added
• Negative business climate including lack of support by local and regional government and perceptions that the industry is undervalued for its impact on the local economy. Lack of responsiveness and cooperation from regulatory agencies, sanitation and sewer, wastewater treatment, utilities, intra-city transportation planning, and other infrastructure support
• Proximity of residential to industrial zoning which leads to conflicts
Winnebago County Comprehensive Industry Analysis Food Processing Industry
39
Recommendation 1: Select targets for industry attraction. The food processing industry is relatively diverse and includes markets from animal slaughtering and processing to sugar and confectionary product manufacturing. Therefore it is important to narrow the scope of food processing to two or three primary sub sectors. Both dairy products and sugar and confectionary product manufacturing subsectors are recommended for targeted business attraction efforts. These two subsectors have a presence in the region and the potential for cluster development. Additionally, the subsectors have relatively high productivity, value added, and compensation. The next step is to identify individual companies for business attraction efforts. There are several approaches to identifying targets for food processing industry attraction to the region. The first approach seeks to identify individual companies that may be interested in locating to the region either by evaluating the subsectors continuing growth and drilling down to company names or by detailed company analysis. The second approach is to work through site selection consultants who specialize in the food processing industry. The first approach suggested selection of subsectors then company identification. From the preceding analysis, suggestions for subsector targets include sugar and confectionary and diary product manufacturing. It is also recommended that the region target important supply chain partners to the food processing industry to strengthen existing food processing industries and build regional appeal for new business attraction. Important supply chain partners to the food processing industry include both distribution facilities and paper productions and container manufacturing companies. Nevertheless, the selection of target companies should not exclude other subsectors that have had a presence or may be interested in establishing a presence in the region. Below are some potential targets for industry attraction based on the above criteria. Ferra Pan Candy Company Dean Foods M&M Mars Muller-Pinehurst Tootsie Roll Delmonte Foods Wrigley Nestle The second approach for identification of companies involves site selection consultants. Site selection consultants are a rich and valuable source of information both to the location seeking attraction and the companies looking for sites. For this reason, it is recommended that Winnebago County develop relationships with site selection consultants specializing in the issues and requirements of the food processing industry.
Winnebago County Comprehensive Industry Analysis Food Processing Industry
40
These relationships can generate an awareness of companies that will be or are currently evaluating expansion opportunities. They can also be used as a resource for strategies to increase the attractiveness of the region. Site selection consultants are often the driving force behind short lists of alternative locations for companies. Recommendation 2: Improve the business climate for the food processing industry. A common theme surfaced among a majority of the regions� food processing employers included perceptions of negativity by local and regional government toward the industry. Additionally, in the Rockford area, zoning mixes between industrial and residential development can cause friction between business and residents. Both of these issues can lead to negative perceptions regarding the regions� business climate which can have a detrimental impact on regional business attraction efforts. While the perceptions of local food processing companies may not appear to directly impact new business attraction, it can have a significant impact when potential new businesses evaluate the region. Site selection consultants and companies often interview existing employers for feedback on the region being considered. To improve business climate, a region can provide public relations support for existing industries and advocate the Value Added and impact of the industry on regional economic stability and growth. Support can also be provided for business operations in dealing with regulatory agencies and utility companies. Part of this recommendation includes having Winnebago County take the lead in supporting the existing food processing companies through public awareness and communication with local government and regulatory agencies in an effort to improve the overall business climate. Recommendation 3: Involvement in regional initiatives to promote manufacturing occupations. Over the past few years, a great deal of effort has gone into identifying regional manufacturing workforce shortages. The Critical Skills Shortages Initiative lead by the Boone and Winnebago Workforce Investment Board (WIB) evaluated the region�s capacity and availability of critical manufacturing occupations and found significant shortages in machinist, industrial machinery mechanics, and maintenance occupations in the region. The results of this effort included funding for marketing and expanded training to address these workforce shortages. Given the food processing industry�s reliance on these occupations, Winnebago County should be supportive of and involved in the efforts of the WIB which include bolstering opportunities in manufacturing and promoting an influx of younger candidates to replace the aging workforce.
Winnebago County Comprehensive Industry Analysis Food Processing Industry
41
Recommendation 4: Develop a comprehensive marketing plan for industry attraction. In order to effectively recruit food processing companies to the region, Winnebago County should develop a comprehensive marketing plan that addresses target audiences, marketing materials, relationship development, and implementation. The marketing plan should include the following key components:
1) Environmental Scan 2) Competitive Regional Analysis 3) Marketing Objectives and Strategy 4) Action/Implementation Plan
The environmental scan and competitive regional analysis are the focus of this report and provide the background and information that shape and impact site selection decisions. The next step in this process is to formalize marketing objectives and develop an appropriate marketing strategy. The county should identify not only who they want to target (companies, site selection consultants, real estate developers) but the role of various marketing approaches (direct mail, trade shows, relationship development). The marketing strategy should include identification of the audience, selection and role of media and materials, and area of focus for content. For example, content could emphasize the region�s location, available buildings, workforce, and labor productivity. The last component to the marketing plan is the action or implementation plan. This part of the overall plan identifies the activities or tasks that need to be accomplished and who is charged with the activity. A set of goals may accompany the implementation plan with dates, timelines, and interviews. Recommendation 5: Develop an industrial building and space inventory database. The development of an industrial space inventory which will use satellite imagery combined with layers of data to provide a resource to site selection firms and companies is already being planned. While the logistics industry favors green field development, a trend in the food processing industry is toward existing structures. For the food processing industry, development and construction time frames are often prohibitive of new development. Therefore, the database should identify available building and land parcels in the county and include ratings on construction readiness such as availability of power to site, roads, and other infrastructure information. This component of site selection is more important once the company has narrowed its search to specific regions. Those regions that have construction-ready sites or a solid, attainable plan to get sites construction ready will have a competitive advantage over those that do not. Once completed, the inventory database should be used as part of the larger marketing and business attraction program identified in Recommendation 1.
Winnebago County Comprehensive Industry Analysis Food Processing Industry
42
Recommendation 6: Develop an incentive package and expertise in funding opportunities. Regardless of the targeted industry, an important element of the region�s industry business attraction program is a comprehensive incentive package. Incentive packages are not exclusively focused in areas of tax reductions or abatements. If not already available, the county should develop knowledge of and expertise in the grant programs and other funding sources available at the local, state and federal level that can be leveraged to assist economic development agencies and companies in infrastructure and construction costs. This includes not only identification of grant funding opportunities, but also assistance in completions of grant applications and business agreements. Winnebago County has many inherent features that make it an attractive location for many types of industries including location, access to markets, and workforce availability and quality. However, in order to be competitive in food processing industry site selection, the region should develop a comprehensive marketing plan that incorporates the results of this analysis into a marketing strategy and plan. Accomplishing these activities will require a team from local/regional government, economic development, and the food processing industry to work together toward providing overall leadership, identifying targets, developing marketing strategy, building relationships, addressing business climate issues, and managing site selection inquiries. To become a player in the site selection arena requires planning, initiative, and regional coordination all of which will be necessary for Winnebago County to successfully attract not only food processing companies but other industries to the region.

Winnebago County Comprehensive Industry Analysis Food Processing Industry
43
Appendix A Buyers and Suppliers
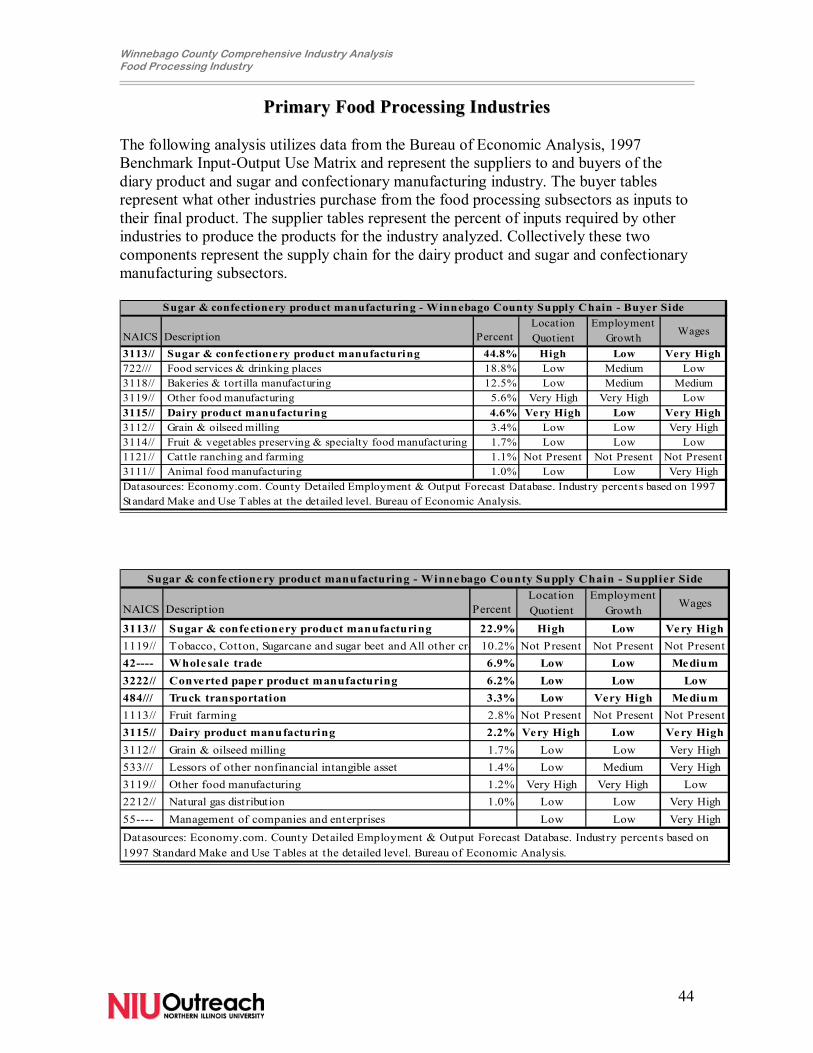
Winnebago County Comprehensive Industry Analysis Food Processing Industry
44
PPrriimmaarryy FFoooodd PPrroocceessssiinngg IInndduussttrriieess The following analysis utilizes data from the Bureau of Economic Analysis, 1997 Benchmark Input-Output Use Matrix and represent the suppliers to and buyers of the diary product and sugar and confectionary manufacturing industry. The buyer tables represent what other industries purchase from the food processing subsectors as inputs to their final product. The supplier tables represent the percent of inputs required by other industries to produce the products for the industry analyzed. Collectively these two components represent the supply chain for the dairy product and sugar and confectionary manufacturing subsectors.
NAICS Descript ion PercentLocation Quotient
Employment Growth Wages
3113// Sugar & confectionery product manufacturing 44.8% High Low Very High722/// Food services & drinking places 18.8% Low Medium Low3118// Bakeries & tort illa manufacturing 12.5% Low Medium Medium3119// Other food manufacturing 5.6% Very High Very High Low3115// Dairy product manufacturing 4.6% Very High Low Very High3112// Grain & oilseed milling 3.4% Low Low Very High3114// Fruit & vegetables preserving & specialty food manufacturing 1.7% Low Low Low1121// Cat tle ranching and farming 1.1% Not Present Not Present Not Present3111// Animal food manufacturing 1.0% Low Low Very High
Sugar & confectionery product manufacturing - Winnebago County Supply Chain - Buyer Side
Datasources: Economy.com. County Detailed Employment & Output Forecast Database. Industry percents based on 1997 Standard Make and Use T ables at the detailed level. Bureau of Economic Analysis.
NAICS Description PercentLocation Quotient
Employment Growth Wages
3113// Sugar & confectionery product manufacturing 22.9% High Low Very High1119// Tobacco, Cotton, Sugarcane and sugar beet and All other cro 10.2% Not Present Not Present Not Present42---- Wholesale trade 6.9% Low Low Medium3222// Converted paper product manufacturing 6.2% Low Low Low484/// Truck transportation 3.3% Low Very High Medium1113// Fruit farming 2.8% Not Present Not Present Not Present3115// Dairy product manufacturing 2.2% Very High Low Very High3112// Grain & oilseed milling 1.7% Low Low Very High533/// Lessors of other nonfinancial intangible asset 1.4% Low Medium Very High3119// Other food manufacturing 1.2% Very High Very High Low2212// Natural gas distribution 1.0% Low Low Very High55---- Management of companies and enterprises Low Low Very High
Sugar & confectionery product manufacturing - Winnebago County Supply Chain - Supplier Side
Datasources: Economy.com. County Detailed Employment & Output Forecast Database. Industry percents based on 1997 Standard Make and Use Tables at the detailed level. Bureau of Economic Analysis.
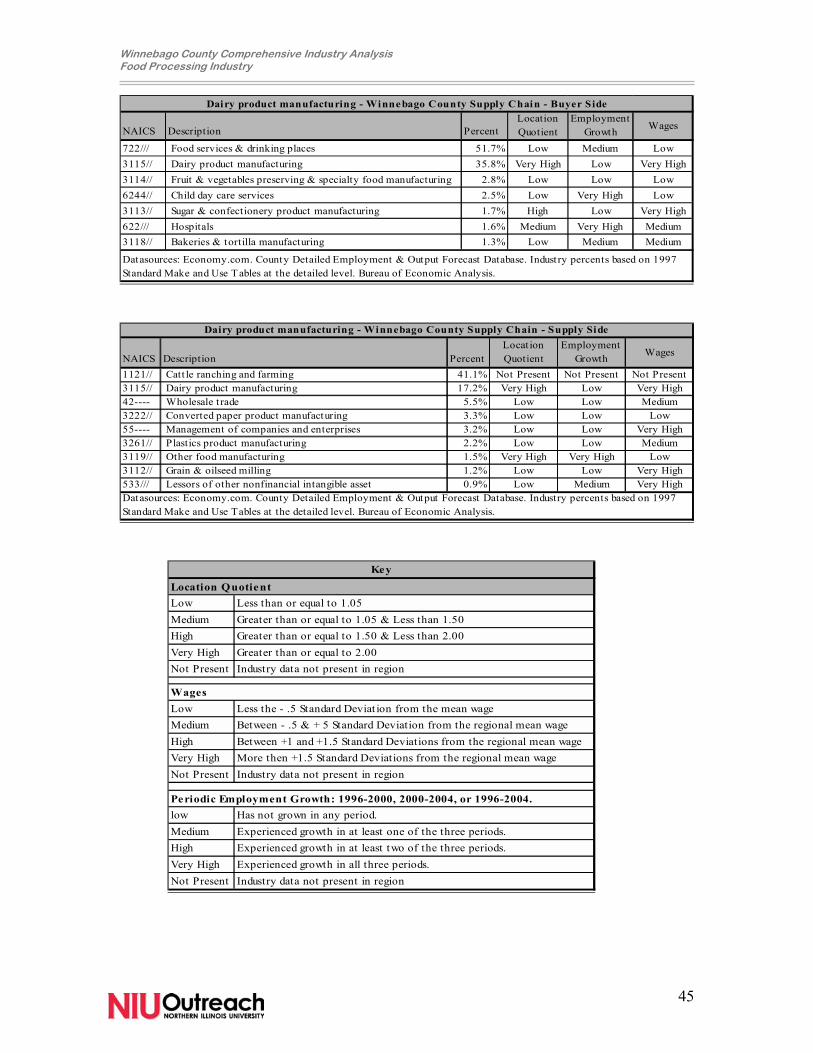
Winnebago County Comprehensive Industry Analysis Food Processing Industry
45
NAICS Description PercentLocation Quotient
Employment Growth Wages
722/// Food services & drinking places 51.7% Low Medium Low3115// Dairy product manufacturing 35.8% Very High Low Very High3114// Fruit & vegetables preserving & specialty food manufacturing 2.8% Low Low Low6244// Child day care services 2.5% Low Very High Low3113// Sugar & confectionery product manufacturing 1.7% High Low Very High622/// Hospitals 1.6% Medium Very High Medium3118// Bakeries & tortilla manufacturing 1.3% Low Medium Medium
Dairy product manufacturing - Winnebago County Supply Chain - Buyer Side
Datasources: Economy.com. County Detailed Employment & Output Forecast Database. Indust ry percents based on 1997 Standard Make and Use Tables at the detailed level. Bureau of Economic Analysis.
NAICS Description PercentLocat ion Quotient
Employment Growth Wages
1121// Catt le ranching and farming 41.1% Not Present Not Present Not Present3115// Dairy product manufacturing 17.2% Very High Low Very High42---- Wholesale t rade 5.5% Low Low Medium3222// Converted paper product manufacturing 3.3% Low Low Low55---- Management of companies and enterprises 3.2% Low Low Very High3261// Plastics product manufacturing 2.2% Low Low Medium3119// Other food manufacturing 1.5% Very High Very High Low3112// Grain & oilseed milling 1.2% Low Low Very High533/// Lessors of other nonfinancial intangible asset 0.9% Low Medium Very High
Dairy product manufacturing - Winnebago County Supply Chain - Supply Side
Datasources: Economy.com. County Detailed Employment & Output Forecast Database. Industry percents based on 1997 Standard Make and Use Tables at the detailed level. Bureau of Economic Analysis.
Low Less than or equal to 1.05Medium Greater than or equal to 1.05 & Less than 1.50High Greater than or equal to 1.50 & Less than 2.00Very High Greater than or equal to 2.00Not Present Industry data not present in region
Low Less the - .5 Standard Deviat ion from the mean wageMedium Between - .5 & + 5 Standard Deviation from the regional mean wageHigh Between +1 and +1.5 Standard Deviations from the regional mean wageVery High More then +1.5 Standard Deviations from the regional mean wageNot Present Industry data not present in region
low Has not grown in any period.Medium Experienced growth in at least one of the three periods.High Experienced growth in at least two of the three periods.Very High Experienced growth in all three periods.Not Present Industry data not present in region
Key
Location Quotient
Wages
Periodic Employment Growth: 1996-2000, 2000-2004, or 1996-2004.
Winnebago County Comprehensive Industry Analysis Food Processing Industry
Appendix B Industry Subsectors
311 Food Manufacturing Industry
Industries in the Food Manufacturing subsector transform livestock and agricultural products into products for intermediate or final consumption. The industry groups are distinguished by the raw materials (generally of animal or vegetable origin) processed into food products.
The food products manufactured in these establishments are typically sold to wholesalers or retailers for distribution to consumers, but establishments primarily engaged in retailing bakery and candy products made on the premises not for immediate consumption are included.
Establishments primarily engaged in manufacturing beverages are classified in Subsector 312, Beverage and Tobacco Product Manufacturing.
31111 Animal Food Manufacturing
This industry comprises establishments primarily engaged in manufacturing food and feed for animals from ingredients, such as grains, oilseed mill products, and meat products.
Cross-References. Establishments primarily engaged in--
• Slaughtering animals for feed--are classified in Industry 31161, Animal Slaughtering and Processing; and
• Manufacturing vitamins and minerals for animals--are classified in Industry 32541, Pharmaceutical and Medicine Manufacturing.
3112 Grain and Oilseed Milling
This industry comprises establishments primarily engaged in processing and manufacturing flour, malts, rice, corn, soybeans, starches and vegetable oils.
31121 Flour Milling and Malt Manufacturing
Winnebago County Comprehensive Industry Analysis Food Processing Industry
47
This industry comprises establishments primarily engaged in one or more of the following: (1) milling flour or meal from grains or vegetables; (2) preparing flour mixes or doughs from flour milled in the same establishment; (3) milling, cleaning, and polishing rice; and (4) manufacturing malt from barley, rye, or other grains.
311212 Rice Milling
This U.S. industry comprises establishments primarily engaged in one of the following: (1) milling rice; (2) cleaning and polishing rice; or (3) milling, cleaning, and polishing rice. The establishments in this industry may package the rice they mill with other ingredients.
311213 Malt Manufacturing
This U.S. industry comprises establishments primarily engaged in manufacturing malt from barley, rye, or other grains.
31122 Starch and Vegetable Fats and Oils Manufacturing
This industry comprises establishments primarily engaged in one or more of the following: (1) wet milling corn and vegetables; (2) crushing oilseeds and tree nuts; (3) refining and/or blending vegetable oils; (4) manufacturing shortening and margarine; and (5) blending purchased animal fats with vegetable fats.
311221 Wet Corn Milling
This U.S. industry comprises establishments primarily engaged in wet milling corn and other vegetables (except to make ethyl alcohol). Examples of products made in these establishments are corn sweeteners, such as glucose, dextrose, and fructose; corn oil; and starches (except laundry).
311222 Soybean Processing
This U.S. industry comprises establishments engaged in crushing soybeans. Examples of products produced in these establishments are soybean oil, soybean cake and meal, and soybean protein isolates and concentrates.
311223 Other Oilseed Processing
This U.S. industry comprises establishments engaged in crushing oilseeds (except soybeans) and tree nuts, such as cottonseeds, linseeds, peanuts, and sunflower seeds.
311225 Fats and Oils Refining and Blending
Winnebago County Comprehensive Industry Analysis Food Processing Industry
48
This U.S. industry comprises establishments primarily engaged in one or more of the following: (1) manufacturing shortening and margarine from purchased fats and oils; (2) refining and/or blending vegetable, oilseed, and tree nut oils from purchased oils; and (3) blending purchased animal fats with purchased vegetable fats.
311230 Breakfast Cereal Manufacturing
This industry comprises establishments primarily engaged in manufacturing breakfast cereal foods.
3113 Sugar and Confectionery Product Manufacturing
This industry group comprises (1) establishments that process agricultural inputs, such as sugarcane, beet, and cacao, to give rise to a new product (sugar or chocolate), and (2) those that begin with sugar and chocolate and process these further.
3114 Fruit and Vegetable Preserving and Specialty Food Manufacturing
This industry group includes (1) establishments that freeze food and (2) those that use preservation processes, such as pickling, canning, and dehydrating. Both types begin their production process with inputs of vegetable or animal origin.
3115 Dairy Product Manufacturing
This industry group comprises establishments that manufacture dairy products from raw milk, processed milk, and dairy substitutes.
3116 Animal Slaughtering and Processing
This industry comprises establishments primarily engaged in one or more of the following: (1) slaughtering animals; (2) preparing processed meats and meat byproducts; and (3) rendering and/or refining animal fat, bones, and meat scraps. This industry includes establishments primarily engaged in assembly cutting and packing of meats (i.e., boxed meats) from purchased carcasses.
Winnebago County Comprehensive Industry Analysis Food Processing Industry
49
3117 Seafood Product Preparation and Packaging
This industry comprises establishments primarily engaged in one or more of the following: (1) canning seafood (including soup); (2) smoking, salting, and drying seafood; (3) eviscerating fresh fish by removing heads, fins, scales, bones, and entrails; (4) shucking and packing fresh shellfish; (5) processing marine fats and oils; and (6) freezing seafood. Establishments known as "floating factory ships" that are engaged in the gathering and processing of seafood into canned seafood products are included in this industry.
3118 Bakeries and Tortilla Manufacturing
This industry comprises establishments primarily engaged in manufacturing fresh and frozen bread and other bakery products including tortillas, flour mixes and doughs, dry pasta, cakes, cookies and crackers.
3119 Other Food Manufacturing
This industry group comprises establishments primarily engaged in manufacturing food (except animal food; grain and oilseed milling; sugar and confectionery products; preserved fruit, vegetable, and specialty foods; dairy products; meat products; seafood products; and bakeries and tortillas). The industry group includes industries with different productive processes, such as snack food manufacturing; coffee and tea manufacturing; concentrate, syrup, condiment, and spice manufacturing; and, in general, an entire range of other miscellaneous food product manufacturing.
Source: The official 2002 US NAICS Manual North American Industry Classification System--United States, 2002.
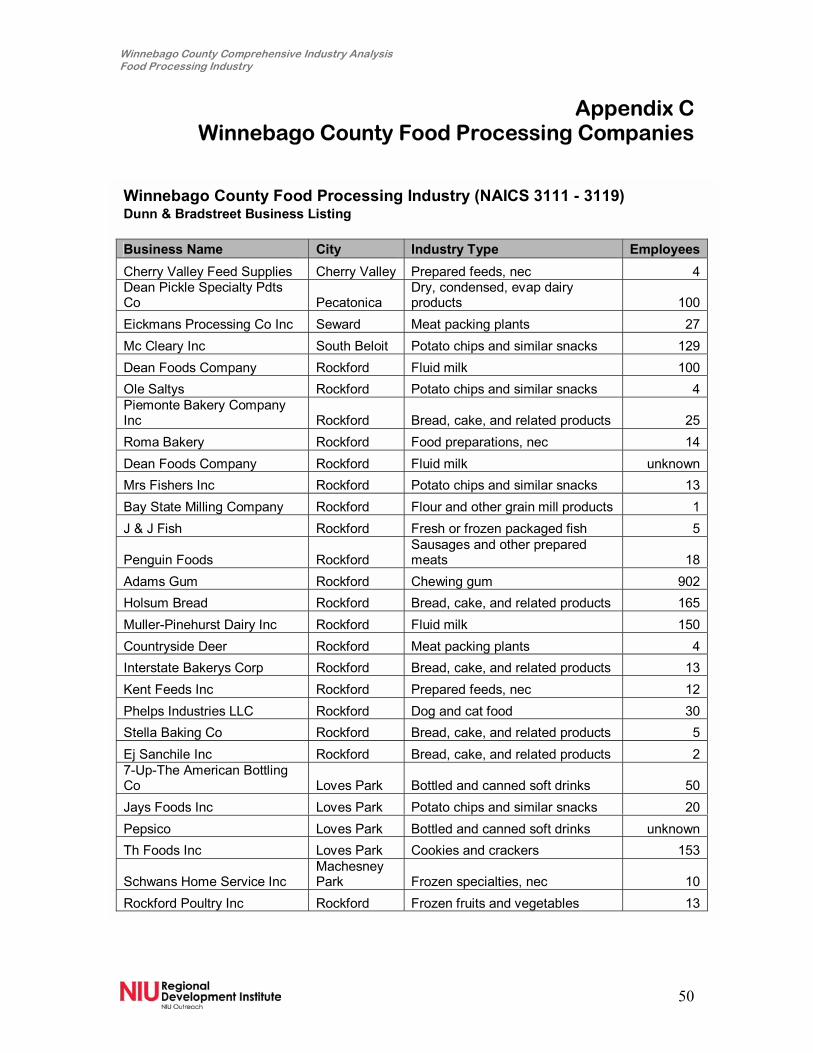
Winnebago County Comprehensive Industry Analysis Food Processing Industry
50
Appendix C Winnebago County Food Processing Companies
Winnebago County Food Processing Industry (NAICS 3111 - 3119) Dunn & Bradstreet Business Listing Business Name City Industry Type EmployeesCherry Valley Feed Supplies Cherry Valley Prepared feeds, nec 4Dean Pickle Specialty Pdts Co Pecatonica
Dry, condensed, evap dairy products 100
Eickmans Processing Co Inc Seward Meat packing plants 27Mc Cleary Inc South Beloit Potato chips and similar snacks 129Dean Foods Company Rockford Fluid milk 100Ole Saltys Rockford Potato chips and similar snacks 4Piemonte Bakery Company Inc Rockford Bread, cake, and related products 25Roma Bakery Rockford Food preparations, nec 14Dean Foods Company Rockford Fluid milk unknownMrs Fishers Inc Rockford Potato chips and similar snacks 13Bay State Milling Company Rockford Flour and other grain mill products 1J & J Fish Rockford Fresh or frozen packaged fish 5
Penguin Foods Rockford Sausages and other prepared meats 18
Adams Gum Rockford Chewing gum 902Holsum Bread Rockford Bread, cake, and related products 165Muller-Pinehurst Dairy Inc Rockford Fluid milk 150Countryside Deer Rockford Meat packing plants 4Interstate Bakerys Corp Rockford Bread, cake, and related products 13Kent Feeds Inc Rockford Prepared feeds, nec 12Phelps Industries LLC Rockford Dog and cat food 30Stella Baking Co Rockford Bread, cake, and related products 5Ej Sanchile Inc Rockford Bread, cake, and related products 27-Up-The American Bottling Co Loves Park Bottled and canned soft drinks 50Jays Foods Inc Loves Park Potato chips and similar snacks 20Pepsico Loves Park Bottled and canned soft drinks unknownTh Foods Inc Loves Park Cookies and crackers 153
Schwans Home Service Inc Machesney Park Frozen specialties, nec 10
Rockford Poultry Inc Rockford Frozen fruits and vegetables 13
Winnebago County Comprehensive Industry Analysis Food Processing Industry
51
Appendix D Detailed Regional Comparative Cost Analysis

Win
neb
ago
Cou
nty
Co
mp
rehe
nsiv
e In
dus
try
Ana
lysi
s Fo
od P
roce
ssin
g In
dus
try
Com
para
tive
Ope
ratin
g C
ost A
naly
sis
W
inne
bago
C
ount
y C
hica
go,
IL
D
ubuq
ue
Cou
nty,
IA
Gra
nd
Rap
ids,
MI
Kan
sas
City
, M
O
Milw
auke
e,
WI
M
inne
apol
is
St. P
aul,
MN
St
. Lou
is,
MO
Wei
ghte
d A
vera
ge H
ourly
Ear
ning
s
$15.
28
$16.
25
$14.
11
$16.
39
$17.
98
$17.
03
$18.
29
$18.
25
Ann
ual B
ase
Pay
roll
Cos
ts (1
) $8
,727
,936
$9
,282
,000
$8
,059
,632
$9
,361
,968
$1
0,27
0,17
6 $9
,727
,536
$1
0,44
7,24
8 $1
0,42
4,40
0
Frin
ge B
enef
its (2
) $3
,316
,616
$3
,527
,160
$3
,062
,660
$3
,557
,548
$3
,902
,667
$3
,696
,464
$3
,969
,954
$3
,961
,272
La
bor C
osts
$1
2,04
4,55
2 $1
2,80
9,16
0 $1
1,12
2,29
2 $1
2,91
9,51
6 $1
4,17
2,84
3 $1
3,42
4,00
0 $1
4,41
7,20
2 $1
4,38
5,67
2 P
erce
nt D
iffer
ence
- W
inne
bago
Cou
nty
6.
3%
-7.7
%
7.3%
17
.7%
11
.5%
19
.7%
19
.4%
E
lect
ric P
ower
Cos
ts (3
) $4
52,5
56
$452
,556
$3
80,1
47
$378
,300
$3
22,9
08
$362
,904
$3
53,0
16
$322
,464
Nat
ural
Gas
Cos
ts (4
) $4
92,9
16
$505
,674
$4
41,7
92
$421
,668
$5
46,0
91
$486
,948
$4
14,7
32
$546
,090
H
eatin
g an
d A
ir C
ondi
tioni
ng C
osts
(5a
5b)
$403
,553
$3
66,6
60
$344
,801
$3
11,5
75
$241
,757
$2
89,3
27
$338
,175
$2
23,7
07
Ener
gy C
osts
$1
,349
,025
$1
,324
,890
$1
,166
,740
$1
,111
,543
$1
,110
,756
$1
,139
,179
$1
,105
,923
$1
,092
,261
P
erce
nt D
iffer
ence
- W
inne
bago
Cou
nty
-1
.8%
-1
3.5%
-1
7.6%
-1
7.7%
-1
5.6%
-1
8.0%
-1
9.0%
Con
stru
ctio
n an
d A
mor
tizat
ion
Cos
ts (6
) $3
29,6
85
$354
,500
$2
90,6
90
$276
,510
$3
19,6
17
$315
,505
$3
68,6
80
$326
,140
Indu
stria
l Lea
se C
osts
(7)
$686
,000
$7
00,0
00
$539
,000
$5
25,0
00
$787
,500
$7
00,0
00
$612
,500
$4
37,5
00
Prop
erty
Cos
ts
$1,0
15,6
85
$1,0
54,5
00
$829
,690
$8
01,5
10
$1,1
07,1
17
$1,0
15,5
05
$981
,180
$7
63,6
40
Per
cent
Diff
eren
ce -
Win
neba
go C
ount
y
3.8%
-1
8.3%
-2
1.1%
9.
0%
0.0%
-3
.4%
-2
4.8%
Sh
ippi
ng C
osts
(8)
$3,1
34,0
25
$3,1
08,2
02
$2,6
34,0
33
$3,3
65,5
81
$2,6
30,7
57
$3,2
37,2
90
$3,4
21,2
28
$3,1
32,1
66
Per
cent
Diff
eren
ce -
Win
neba
go C
ount
y
-0.8
%
-16.
0%
7.4%
-1
6.1%
3.
3%
9.2%
-0
.1%
Tota
l Ann
ual G
eogr
aphi
cally
-Va
riabl
e O
pera
ting
Cos
ts
$17,
543,
287
$18,
296,
752
$15,
752,
755
$18,
198,
150
$19,
021,
473
$18,
815,
974
$19,
925,
533
$19,
373,
739
Per
cent
Diff
eren
ce -
Win
neba
go C
ount
y
4.3%
-1
0.2%
3.
7%
8.4%
7.
3%
13.6
%
10.4
%
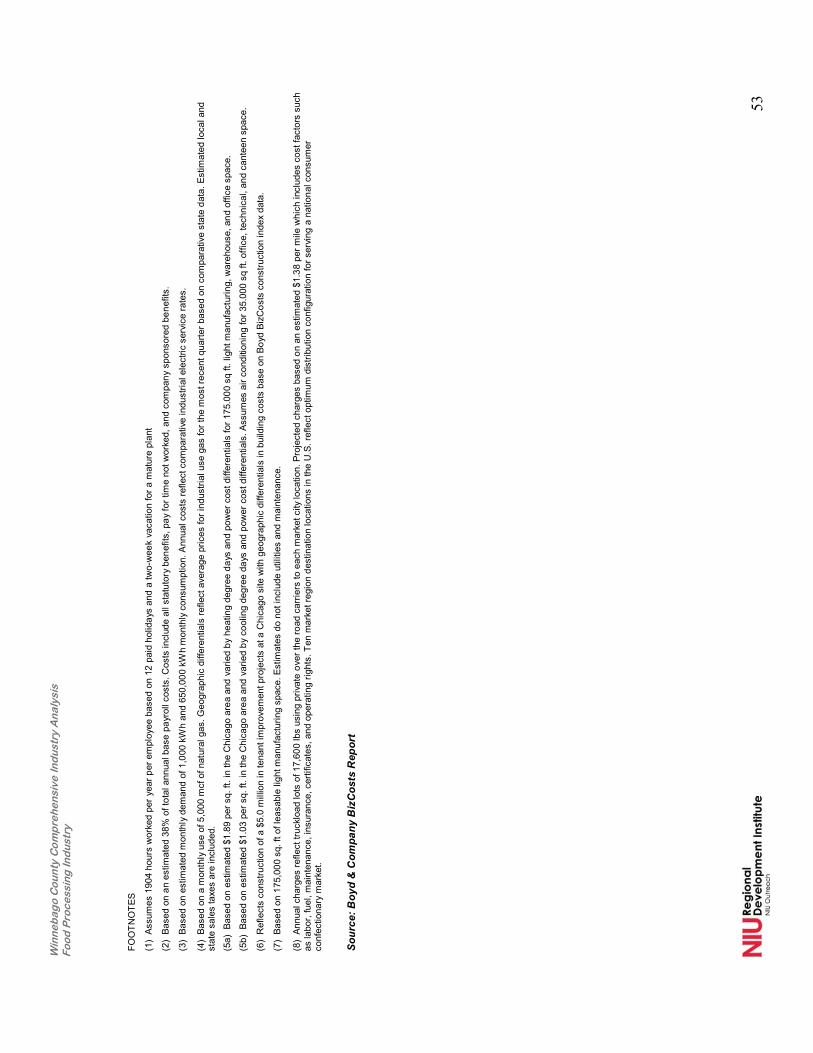
Win
neb
ago
Cou
nty
Co
mp
rehe
nsiv
e In
dus
try
Ana
lysi
s Fo
od P
roce
ssin
g In
dus
try
53
FOO
TNO
TES
(1)
Assu
mes
190
4 ho
urs
wor
ked
per y
ear p
er e
mpl
oyee
bas
ed o
n 12
pai
d ho
liday
s an
d a
two-
wee
k va
catio
n fo
r a m
atur
e pl
ant
(2)
Base
d on
an
estim
ated
38%
of t
otal
ann
ual b
ase
payr
oll c
osts
. Cos
ts in
clud
e al
l sta
tuto
ry b
enef
its, p
ay fo
r tim
e no
t wor
ked,
and
com
pany
spo
nsor
ed b
enef
its.
(3)
Base
d on
est
imat
ed m
onth
ly d
eman
d of
1,0
00 k
Wh
and
650,
000
kWh
mon
thly
con
sum
ptio
n. A
nnua
l cos
ts re
flect
com
para
tive
indu
stria
l ele
ctric
ser
vice
rate
s.
(4)
Base
d on
a m
onth
ly u
se o
f 5,0
00 m
cf o
f nat
ural
gas
. Geo
grap
hic
diffe
rent
ials
refle
ct a
vera
ge p
rices
for i
ndus
trial
use
gas
for t
he m
ost r
ecen
t qua
rter b
ased
on
com
para
tive
stat
e da
ta. E
stim
ated
loca
l and
st
ate
sale
s ta
xes
are
incl
uded
.
(5a)
Bas
ed o
n es
timat
ed $
1.89
per
sq.
ft. i
n th
e C
hica
go a
rea
and
varie
d by
hea
ting
degr
ee d
ays
and
pow
er c
ost d
iffer
entia
ls fo
r 175
.000
sq
ft. li
ght m
anuf
actu
ring,
war
ehou
se, a
nd o
ffice
spa
ce.
(5b)
Bas
ed o
n es
timat
ed $
1.03
per
sq.
ft. i
n th
e C
hica
go a
rea
and
varie
d by
coo
ling
degr
ee d
ays
and
pow
er c
ost d
iffer
entia
ls. A
ssum
es a
ir co
nditi
onin
g fo
r 35.
000
sq ft
. offi
ce, t
echn
ical
, and
can
teen
spa
ce.
(6)
Ref
lect
s co
nstru
ctio
n of
a $
5.0
mill
ion
in te
nant
impr
ovem
ent p
roje
cts
at a
Chi
cago
site
with
geo
grap
hic
diffe
rent
ials
in b
uild
ing
cost
s ba
se o
n Bo
yd B
izC
osts
con
stru
ctio
n in
dex
data
.
(7)
Base
d on
175
,000
sq.
ft o
f lea
sabl
e lig
ht m
anuf
actu
ring
spac
e. E
stim
ates
do
not i
nclu
de u
tiliti
es a
nd m
aint
enan
ce.
(8)
Annu
al c
harg
es re
flect
truc
kloa
d lo
ts o
f 17,
600
lbs
usin
g pr
ivat
e ov
er th
e ro
ad c
arrie
rs to
eac
h m
arke
t city
loca
tion.
Pro
ject
ed c
harg
es b
ased
on
an e
stim
ated
$1.
38 p
er m
ile w
hich
incl
udes
cos
t fac
tors
suc
h as
labo
r, fu
el, m
aint
enan
ce, i
nsur
ance
, cer
tific
ates
, and
ope
ratin
g rig
hts.
Ten
mar
ket r
egio
n de
stin
atio
n lo
catio
ns in
the
U.S
. ref
lect
opt
imum
dis
tribu
tion
conf
igur
atio
n fo
r ser
ving
a n
atio
nal c
onsu
mer
co
nfec
tiona
ry m
arke
t.
So
urce
: Boy
d &
Com
pany
Biz
Cos
ts R
epor
t