comprehensive bacterial census of cleanrooms using dna
TRANSCRIPT
1
Comprehensive Bacterial Census of Cleanrooms Using
DNA Microarray and Cloning Methods
Myron T. La Duc1†
, Shariff Osman2†
, Parag Vaishampayan1, Yvette Piceno
2, Gary Andersen
2, J.
A. Spry1, and Kasthuri Venkateswaran
1* 5
1Biotechnology and Planetary Protection Group, NASA Jet Propulsion Laboratory, California
Institute of Technology, Pasadena, CA 91109
2Lawrence Berkeley National Laboratory, Berkeley, CA 85721
Running Title: Clone Library vs. Microarray-derived Bacterial Diversity 10
Abbreviations: JPL: Jet Propulsion Laboratory; TSB: trypticase soy broth; TSA: trypticase
soy agar; CFU: colony-forming unit; OTU: operational taxonomic unit; SAC: Spacecraft
Assembly Cleanroom. 15
Key words: microbial diversity, cleanrooms, NASA spacecraft assembly facility, PhyloChip,
16S rRNA gene sequencing
*Author for correspondence: Kasthuri Venkateswaran
Present address and Mailing address:
Biotechnology and Planetary Protection, NASA Jet Propulsion Laboratory, California 20
Institute of Technology, Mail Stop 89, Oak Grove Dr., Pasadena, CA 91109, USA
Tel: (818) 393-1481; Fax: (818) 393-4176
Email: [email protected]
†Authors contributed equally. 25
Copyright © 2009, American Society for Microbiology and/or the Listed Authors/Institutions. All Rights Reserved.Appl. Environ. Microbiol. doi:10.1128/AEM.01073-09 AEM Accepts, published online ahead of print on 21 August 2009
on January 30, 2018 by guesthttp://aem
.asm.org/
Dow
nloaded from
2
ABSTRACT
A census of cleanroom surface-associated bacterial populations was derived from the
results of both the cloning and sequencing of 16S rRNA genes and DNA microarray
(PhyloChip) analyses. Samples from the Lockheed Martin Aeronautics – Multiple Testing
Facility (LMA-MTF), Kennedy Space Center – Payload Hazard and Servicing Facility (KSC-30
PHSF), and Jet Propulsion Laboratory – Spacecraft Assembly Facility (JPL-SAF) cleanrooms
were collected during the various assembly phases of the Phoenix and Mars Science
Laboratory (MSL) spacecraft. Clone library-derived analyses detected a larger bacterial
diversity prior to the arrival of spacecraft hardware in these cleanroom facilities. PhyloChip
results were in agreement with this trend, but also unveiled the presence of anywhere from 9- 35
to 70-fold more bacterial taxa than cloning approaches. Among the facilities sampled, the
JPL-SAF (MSL mission) housed a significantly less diverse bacterial population than either
the LMA-MTF or KSC-PHSF (Phoenix mission). Bacterial taxa known to thrive in arid
conditions were frequently detected in MSL-associated JPL-SAF samples, whereas
proteobacterial lineages dominated Phoenix-associated KSC-PHSF samples. Comprehensive 40
bacterial censuses, such as that reported here, will help space-faring nations preemptively
identify contaminant biomatter that may compromise extraterrestrial life-detection
experiments. The robust nature and high sensitivity of DNA microarray technologies should
prove beneficial to a wide range of scientific, electronic, homeland security, medical,
pharmaceutical, and any other ventures with vested interest in monitoring and controlling 45
contamination in exceptionally clean environments.
on January 30, 2018 by guesthttp://aem
.asm.org/
Dow
nloaded from

3
INTRODUCTION
Planetary protection efforts work towards protecting: a) solar system bodies from
contamination by terrestrial biological material (forward contamination), thus preserving
opportunities for future scientific investigation, and b) the Earth from harmful contamination 50
by materials returned from outer space (back contamination) (5). These approaches apply
directly to the control and eradication of microorganisms present on the surfaces of spacecraft
intended to land, orbit, fly-by, or be in the vicinity of extraterrestrial bodies. Consequently,
current planetary protection policies require that spacecraft be assembled and readied for
launch in controlled cleanroom environments. To achieve these conditions, and maintain 55
compliance with Good Manufacturing Practice regulations, robotic spacecraft components are
assembled in ultra-clean facilities. Much like facilities in the medical, pharmaceutical, and
semiconductor sectors, NASA spacecraft assembly cleanrooms (SAC) are kept extremely
clean and are maintained to the highest of industry standards (17). Filtered air circulation,
controlled temperature and humidity, routine exposure to disinfectants and surfactants, and 60
nutrient-limiting, oligotrophic conditions make it very challenging for microorganisms to
persist in such environments, but by no means eradicate biological contaminants entirely (18).
Several investigations, both culture based and culture independent, have demonstrated that a
variety of bacterial taxa are repeatedly isolated under cleanroom conditions (18, 24, 26, 34).
However, despite a growing understanding of the diverse microbial populations present in 65
SAC, predicting the true risk of any such microbes compromising the findings of
extraterrestrial life-detection efforts remains a significant challenge (29). A better
understanding of the distribution and frequency at which high risk contaminant microbes are
encountered on spacecraft surfaces would significantly aid in assessing the threat of forward
contamination (32). 70
on January 30, 2018 by guesthttp://aem
.asm.org/
Dow
nloaded from
4
The purification of nucleic acids, subsequent PCR amplification, and shuttling of 16S
ribosomal “fingerprint” genes from non-cultivable microorganisms into genetically amenable
lab strains of E. coli has evolved into a “gold standard” molecular means of elucidating the
microbial diversity in a given sample. In theory, the cloning and sequencing of 16S ribosomal
genes from each and every cell present, regardless of cultivability and inclusive of novel taxa, 75
would result in a comprehensive survey of microbial communities about the surfaces of SAC
and co-located spacecraft (24, 26). Unfortunately the full length sequencing of all 16S rRNA
genes from environmental samples would be prohibitively expensive, making the approach
unfeasible for generating comprehensive phylogenetic profiles of complex microbial
communities. 80
Attempting to infer population membership from clone libraries limited to hundreds or
thousands of sequences has proven to be insufficient for detecting extremely low abundance
organisms. Recent analyses of phylogenetic DNA extracted from soil, water and air revealed
that laboriously derived clone libraries severely under-represent complex bacterial
communities when compared to very rapid (i.e., hours) DNA microarray approaches (1, 6, 11, 85
23, 36). One of the reasons for this is the high sensitivity of PhyloChip methodologies, which
are able to detect organisms present in amounts below 10-4
abundance of the total sample
(12). Numerous validation experiments using sequence-specific PCR have confirmed that taxa
identified by the microarray were indeed present in the original environmental samples,
despite their absence in corresponding clone libraries (3). This highlights the utility of the 90
method compared to classical cloning. Although each sample analysis by the PhyloChip
provides detailed information on microbial composition, the highly parallel and reproducible
nature of this array allows tracking community dynamics over time and treatment. With no
on January 30, 2018 by guesthttp://aem
.asm.org/
Dow
nloaded from
5
prior knowledge, specific microbial interactions may be identified that are key to particular
changing environments. 95
A comprehensive census of the microbial communities about the surfaces of three
NASA SAC supporting two distinct missions was conducted. To ensure that the maximum
diversity of resident microbiota was uncovered, subsamples from each cleanroom surface
sampling were subjected to both DNA microarray protocols and conventional cloning and
sequencing of 16S rRNA genes. This study, to our knowledge the first of its kind, focused on 100
comparing the microbial diversity profiles resulting from DNA microarray analyses and
conventional cloning and sequencing of 16S rRNA genes arising from a variety of low
biomass surfaces.
MATERIALS AND METHODS
Sampling locations. Three different NASA cleanrooms were sampled, the Lockheed Martin 105
Aeronautics’ Multiple Testing Facility (LMA-MTF), the Kennedy Space Center’s Payload
Hazardous Servicing Facility (KSC-PHSF), and the Jet Propulsion Laboratory’s Spacecraft
Assembly Facility (JPL-SAF). Each of the facilities examined were a certified Class 100K
(100,000 particles >0.5 µm ft-3
air) or ISO 8 (3,520,000 particles >0.5 µm m-3
) cleanroom. All
spacecraft assembly facilities examined in this study were maintained with daily cleaning 110
regiments consisting of the replacing of tacky mats, wiping of surfaces and support hardware
fixtures, and vacuuming and mopping of floors with cleanroom certified sanitizing agents
(disinfectants, alcohol, and/or ultrapure water). Prior to entering the cleanroom, staff must
take appropriate actions to minimize the influx of particulate matter. Specific entry procedures
varied depending on the certification level of the cleanroom and the presence or absence of 115
mission hardware. All facilities utilized High Efficiency Particle Air (HEPA) filters for
continuous air filtration. Air was volumetrically exchanged a minimum of four times per hour,
on January 30, 2018 by guesthttp://aem
.asm.org/
Dow
nloaded from
6
with positive pressure maintained at all times. For all three facilities, temperature, relative
humidity, and airborne particle concentration were continuously monitored and recorded.
Surface particulate matter, nonvolatile residue, and volatile hydrocarbons were monitored 120
using conventional methods (NASA-KSC, 1999).
Sample collection. Samples were collected from the surfaces of various NASA SAC. Wet
surface sampling of SAC floor (1m2) was performed using Biological Sampling Kits
(BiSKits, QuickSilver Analytics, Abingdon, Md.) as previously described (4). Controls
specific for each BiSKit were prepared in a class II biohood immediately prior to sampling. 125
The manufacturer provided buffer was brought to a volume of 30 mL using sterile PBS and
was then added to the macrofoam sponge component of the BiSKit. The modified buffer was
recovered from the sponge by screwing the sponge casing against the BiSKit cover several
times, allowing sample to be collected into the attached sample bottle. A 15 mL portion of
buffer was removed from the sample bottle and stored in 50 mL centrifuge tubes to serve as a 130
sample control. The remaining modified buffer was used for sample collection. Once the PBS
had adequately absorbed to the macrofoam sponge, the sampler was unscrewed from the
module and was traversed about the surface area of interest (ca. 1m2), first in a horizontal
fashion, then vertical, and finally in a diagonal sweeping pattern. Immediately following the
collection of sample from a surface, the macrofaom sponge sampler was forcefully screwed 135
back into the BiSKit module, as to squeeze as much sample as possible from the sponge into
the collection tube. The module and attached collection tube was then transported in a sealed
bag back to the laboratory where it was further processed in a biohood. Overall, 10 distinct
sampling events collected a total of 107 samples. The date of collection, functional relevance
of the facility, and other sample characteristics are given in Table 1. 140
on January 30, 2018 by guesthttp://aem
.asm.org/
Dow
nloaded from
7
Concentration of Biomolecules. Previous studies have demonstrated that SAC samples are
seldom laden with levels of microbial biomass able to yield PCR amplifiable DNA following
extraction regimes; we therefore opted to pool several samples (24-26). All samples (~100
mL to 300 mL) were aseptically transferred to an Amicon Ultra-15 centrifugal filter tube
(Millipore, Jaffrey, NH, Ultracel-50 membrane Cat #: UFC905096), which were in turn 145
placed within a Sorvall RC-5B refrigerated centrifuge (Thermo Scientific, Waltham, MA) and
spun at 4,000 rpm for 10 minutes. Each filter unit has a molecular weight cut-off of 50kDa,
which facilitates the concentration of bacterial cells, spores, and exogenous nucleic
acid fragments greater than 100 bp into a final volume of ca. 500 µL. This resulting volume
was aseptically transferred to a sterile microfuge tube. A comparable amount of sterile PBS 150
was concentrated in a separate filter tube, serving as a negative control for each
concentration/extraction.
Clone library construction, and 16S rRNA sequencing. DNA was purified directly from
each sample, or pooled sample. Approximately 400µL of each concentrated sample was
subjected to bead beating and automated DNA extraction in an Autolyser A-2 DNA extraction 155
instrument (Axcyte Genomics, Menlo Park, CA), as demonstrated before (19). The total DNA
extract (ca. 70 µL) arising from any given sample was then bifurcated for downstream DNA
microarray and 16S rRNA cloning analyses. To generate PCR amplicons for subsequent
cloning manipulations, bacterial 16S small subunit rRNA genes were PCR-amplified with
eubacterially biased primers B27F (5’-AGA GTT TGA TCM TGG CTC AG-3’) and B1512R 160
(5’-AAG GAG GTG ATC CAN CCR CA-3’). Two distinct PCR regimes were employed in
this study, gradient (see below), and conventional conditions which were as follows: 1 min.
95oC denaturation, 2 min. 55
oC annealing, and 3 min. 72
oC elongation for 35 cycles using a
DNA Engine thermal cycler (MJ Research; Waltham, MA). After 10 minutes incubation at
on January 30, 2018 by guesthttp://aem
.asm.org/
Dow
nloaded from
8
72oC, the amplification product was purified with a gel excision kit (Qiagen, Chatsworth, 165
CA). PCR conditions as they relate to each sample are given in Table 1. Purified PCR
amplicons were cloned into the pCR-4 TOPO vector, and recombinant plasmids were used to
transform competent E. coli TOP10 cells via TA cloning protocols (Invitrogen, Carlsbad,
CA), per manufacturers’ instruction. Approximately 1,000 clones each were analyzed and
sequenced bi-directionally using M13F and M13R primers at Agencourt Biosciences Corp. 170
(Beverly, MA).
Statistical, phylogenetic, and bioinformatic analyses. An in-house designed program
(STITCH) was used to merge sequence pairs generating near full length (~1500 bp) 16S
rRNA sequences (34). The phylogenetic relationship of clones was determined via
comparison with quality checked type-strain 16S rRNA gene sequences (27) using the 175
BLAST function in STITCH. Evolutionary trees were constructed using PAUP software (36).
Rarefaction analysis (15), and coverage calculations (14) were applied to estimate the
representation of the phylotypes in bacterial libraries. Operational taxonomic units (OTUs)
were defined as clones sharing >97.5% sequence identity (21, 28, 33). The DOTUR-1.53
program (30), which considers distance matrix in describing genetic distance between 180
sequences and assigning them to OTUs, was used to analyze the data generated in this study.
DOTUR uses the frequency at which each OTU was observed to construct rarefaction. The
sequences were aligned by using ClustalW (20), and a Jukes-Cantor corrected distance matrix
was constructed by using the DNADIST program from PHYLIP (10). The rarefaction curve
was produced by plotting the number of OTUs observed against the number of clones 185
screened using DOTUR. The coverage of clone libraries was calculated (14) according to the
equation: C= [1-(n1/N)]*100, where C is the homologous coverage, n1 is the number of
OTU’s appearing only once in the library, and N is the total number of clones examined.
on January 30, 2018 by guesthttp://aem
.asm.org/
Dow
nloaded from
9
PhyloChip PCR amplification. Bacterial 16S rRNA genes were amplified from pooled
genomic DNA preparations from each sampling event using the primers 27f (5’-AGA GTT 190
TGA TCC TGG CTC AG) and 1492r (GGT TAC CTT GTT ACG ACT T). PCR conditions
were as follows: 1 cycle of 3 min at 95°C, followed by 35 cycles of 30 sec at 95°C, 30 sec at
48-57.5°C (various annealing temperatures), and 2 min at 72°C, with a final 10 min
incubation at 72°C. To maximize observed diversity, four separate PCR reactions were
performed for each sample using a gradient of annealing temperatures (48°C, 50.1°C, 54.4°C, 195
and 57.5°C). Whenever possible, a total of 500ng of amplified PCR fragments from each
sampling event was used for phylogenetic microarray analysis.
PhyloChip processing, scanning, probe set scoring, and normalization. A detailed
explanation of the processing of the PhyloChip assay has been previously published
elsewhere (35). Briefly, the pooled PCR product from each sampling event was spiked with 200
known amounts (5.02 x 10⁸ to 7.29 x 10
10 molecules) of synthetic 16S rRNA gene fragments
and non-16S rRNA gene fragments (200 ng total). Fluorescent intensities from these controls
were used as standards for normalization amongst samples. Target fragmentation, biotin
labeling, PhyloChip hybridization, scanning and staining, as well as background subtraction,
noise calculation and detection and quantification criteria were performed as reported 205
elsewhere (11). An OTU was considered present in the sample when 90% or more of its
assigned probe pairs for its corresponding probe set were positive (positive fraction > 0.90).
Controls and lower detection limits of assays employed. Appropriate controls were used at
each step of the sampling and analysis to ensure high quality data. Liquid samples from
unopened sample cartridges served as negative controls in all molecular assays. In the same 210
manner, sterilized water, free of nucleic acids, served as a blank to monitor reagent
cleanliness. Purified DNA from B. pumilus ATCC 7061 was included in the PCR
on January 30, 2018 by guesthttp://aem
.asm.org/
Dow
nloaded from
10
amplification protocols as a positive control. In this manner, samples containing inhibitory
substances were monitored for false negative results. None of the sample matrices used in this
study inhibited the PCR reaction as shown by internal DNA standards. Internal standards 215
consisted of 1 pg extracted B. pumilus genomic DNA added to a PCR reaction.
RESULTS
Sampling and sample processing. Over a period of 18 months, 107 individual surface
samples were collected from 3 distinct NASA SAC. Due to the limitations and challenges
associated with processing samples of such extremely low biomass, several individual 220
samples from a given sampling event/locale were pooled, which resulted in 10 distinct pooled
samples for further analysis (Table 1). These pooled samples were grouped into 3 separate
categories, based on the presence/absence of spacecraft and the mission it was supporting in a
given SAC, as is shown in Table 1. Category A enveloped 37 samples that were collected
from SAC in the presence of Phoenix spacecraft hardware, category B comprised 30 samples 225
that were collected within SAC devoid of spacecraft, and category C encompassed 40 samples
collected from a SAC (JPL-SAF) during the assembly of the Mars Science Laboratory (MSL)
spacecraft.
Even though all 10 pooled samples yielded full length 16S rRNA gene amplicons (1.5-kb),
only seven gave rise to clone libraries following transformation of competent E. coli TOP 10. 230
Despite the faint visibility of some bands in agarose gels, the PCR products from all 10 of
these samples were sufficient to be analyzed via PhyloChip DNA microarray. The number of
distinct OTUs detected by conventional cloning and/or PhyloChip DNA microarray analyses
in each sample is given in Table 1.
Clone library derived bacterial diversity. The number of high-quality sequence reads, 235
number of detected OTUs, coverage values, and fold-increase in detection via PhyloChip
on January 30, 2018 by guesthttp://aem
.asm.org/
Dow
nloaded from
11
DNA microarray, per sample, are provided in Table 1. After chimeras were disregarded , 76%
of the total 3,852 full-length 16S rRNA sequences generated were deemed of sufficient
quality to be included in this study (GenBank accession # FJ191310 to FJ194034; GQ129843
to GQ130128). A detailed breakdown of the clones including relative abundance, members 240
assigned to each bacterial family or genera based on RDP classifier are provided in
Supplementary Table 1.
A trend was observed linking coverage values to the presence or absence of spacecraft
hardware in the SAC. Based on clone library-derived coverage values, sampling efforts were
incomplete for category B samples (those collected prior to the arrival of spacecraft 245
hardware), as was evident in two different facilities (74 % to 87%; Table 1). However,
samples falling into categories A and C, which were collected in the presence of spacecraft
hardware, yielded much higher coverage values (>94%). While PHSF-PHX-A (category B)
may seem to contradict such a trend (98.5% coverage), it must be noted that the PHSF SAC in
which this sample was collected was kept under stringent maintenance (as that of categories A 250
and C) in the unlikely event of launch delay and consequential return of the Phoenix
spacecraft. A similar trend was noted in the occurrence of singleton OTUs (taxa whose unique
sequence is retrieved only once), suggestive of broader bacterial diversity prior to the arrival
of spacecraft hardware in SAC (59 in JPL-SAF and 129 in KSC-PHSF). Of the SAC sampled,
the JPL-SAF (0 to 7 OTUs) exhibited significantly less diversity than either the LMA-MTF 255
(33 OTUs) or KSC-PHSF (18 and 48 OTUs), as assessed by 16S rRNA-based cloning (Table
1).
Perhaps the most striking of all cloning-based results was the correlation between the
incidence of streptococci and the presence of humans due to MSL hardware assembly in the
JPL-SAF. Upon introduction of MSL hardware the bacterial diversity was drastically reduced 260
on January 30, 2018 by guesthttp://aem
.asm.org/
Dow
nloaded from
12
to streptococci only, devoid of even the cosmopolitan Acinetobacter, Bradyrhizobium, and
Ralstonia species (data not shown). Also evident via cloning approaches was a considerable
disparity in bacterial diversity between MSL- and Phoenix-housing SAC. As Table 1 clearly
illustrates, SAC partaking in the housing of Phoenix hardware were significantly more diverse
than those associated with the MSL spacecraft. 265
DNA microarray-derived bacterial diversity. When analyzed with PhyloChip DNA
microarrays, samples obtained from one sampling trip (MTF-PHSF-D1) to the LMA-MTF
housed 1,222 distinct OTUs (Table 1). Samples obtained from four sampling events at the
KSC-PHSF yielded between 728 and 1,519 OTUs, and samples collected from five samplings
of the JPL-SAF yielded between 468 and 1,492 OTUs. PhyloChip DNA microarrays were 270
able to detect the presence of anywhere from 9- to 70-fold more bacterial taxa than 16S
rRNA-based cloning approaches. The PhyloChip detected biosignatures in over 140 known
bacterial families, almost 100 of which were never observed in any of the clone libraries (Fig.
1). Furthermore, meaningful data was retrieved from three samples with PhyloChip arrays
even after several attempts at PCR and subsequent TA-cloning regimes had failed (Table 1). 275
Whenever possible, the authors limited bacterial taxonomic classification to the family level
for the purposes of this study. However, certain taxa were either not able to be resolved below
the level of order, or had previously been described as genera belonging to orders lacking
familial assignments (16). Since it was not feasible to provide familial taxomomic description
to such taxa, in these instances OTUs were categorized according to their first available 280
classified taxonomic levels. Along these lines, there were 107 bacterial lineages (280 total)
that simply could not be included for consideration at the family level due to the degenerate
nature of the PhyloChip taxonomic calling procedure. For example, PhyloChip probes
specific for phylum, class, and order that lacked specific probes for family level resolution or
on January 30, 2018 by guesthttp://aem
.asm.org/
Dow
nloaded from
13
lower were removed from consideration. Furthermore, OTUs designated at the family level as 285
“unclassified” belonged to an order, class, or phylm that is recognized by the Hugenholtz
taxonomy (8, 16, 22) but contained insufficient sequence data in public databases to form a
cluster below that taxonomic level.
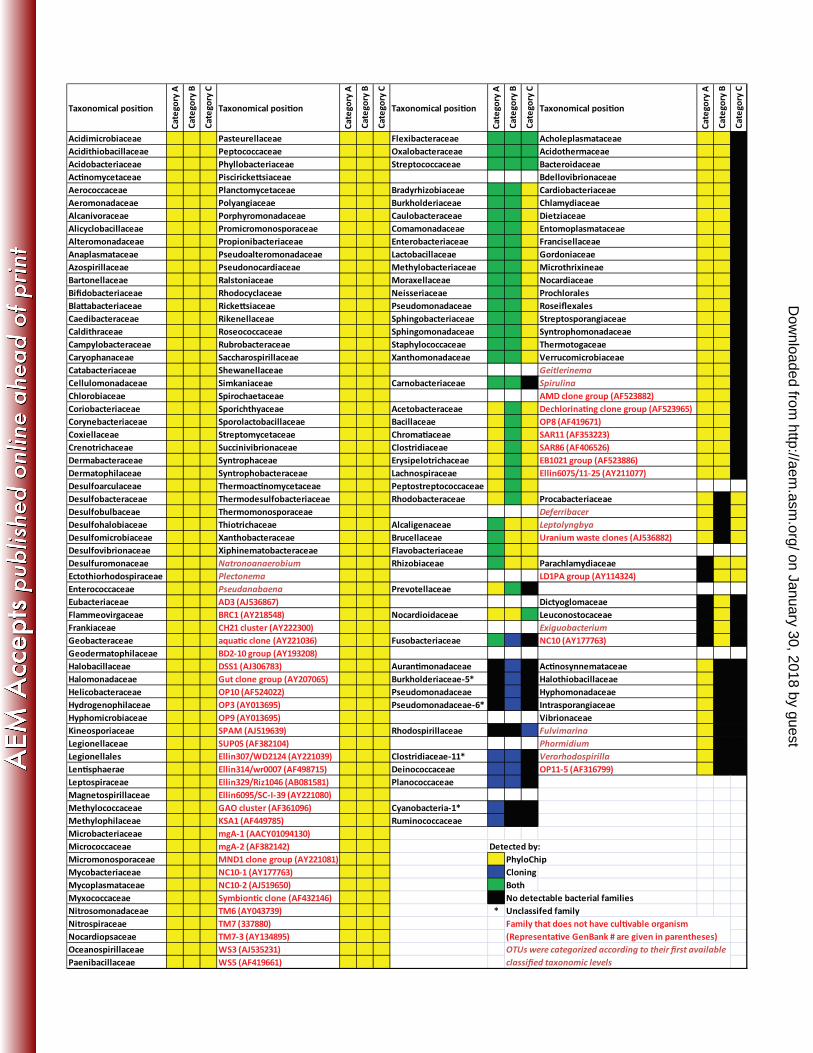
Correlations were observed between the detected presence of certain bacterial families and the
presence or absence of Phoenix or MSL hardware in SAC facilities. The PhyloChip 290
exclusively inferred the presence of Dictoglomaceae and Leuconostocaceae members, and
cloning approaches exclusively detected members of Burkholderiaceae, Pseudomonodaceae,
and Aurantimonadaceae, in spacecraft-devoid SAC (category B) but neither were able to
detect such microbes when spacecraft were present (both category A and C) (Fig. 2). Certain
bacterial families appeared to be associated with a given spacecraft, as is evident in the 295
PhyloChip-derived detection of Actinosynnemataceae, Halothiobacillaceae,
Hyphomonadaceae, Intrasporangiaceae, and Vibrionaceae solely in samples collected in the
presence of the Phoenix spacecraft (category A). Similarly, Procabacteriaceae spp. were
uncovered via PhyloChip in the presence of either the Phoenix (category A) and/or MSL
(category C) spacecraft, but were not encountered at all when such hardware was absent 300
(category B; Fig 2).
There were very few bacterial families observed to be truly cosmopolitan when assessed via
cloning. Only 3 (Flexibacteraceae, Oxalobacteraceae, and Streptococcaceae) of 173 families
were detected in all SAC categories by both PhyloChip and cloning approaches (Fig. 2).
There were, however, a great many bacterial families (130) whose presence was revealed in 305
all 3 SAC categories, exclusively by PhyloChip (Fig. 2). Species likely to be novel were
encountered within 10 bacterial families, as these were detected via cloning yet their presence
remained elusive to the PhyloChip. It was overly apparent that the MSL spacecraft housed a
on January 30, 2018 by guesthttp://aem
.asm.org/
Dow
nloaded from

14
significantly more limited bacterial diversity than the Phoenix. While not a single family was
encountered solely in the presence of MSL hardware, 23 families of bacteria were detected 310
while either in the presence of Phoenix (category A) or in empty SAC (category B), but not
detected when MSL was present (category C).
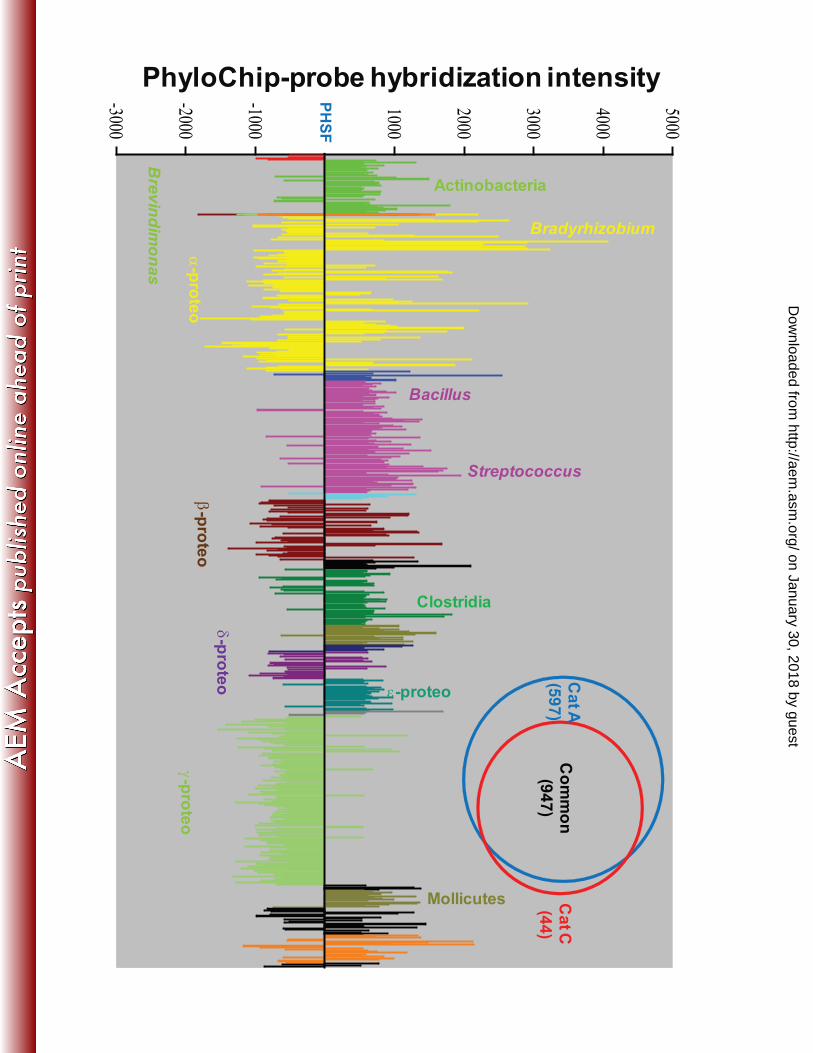
Category C samples were collected from a SAC located in an arid, desert-like location (JPL,
Pasadena, California; RH 40 - 45%), whereas category A samples were collected from a
brackish, swamp-like location (KSC, Cape Canaveral, Florida; RH 60 - 85%). Changes in 315
relative abundance at the OTU level, as inferred from PhyloChip DNA microarray, of
category A and C samples are depicted in Fig. 3. This analysis can readily be determined
between samples based on the fluorescence intensity of OTU probe sets, where a change in
500 relative fluorescence units corresponds to an approximate 5 fold change in 16S rRNA
gene copy number (2). Members of genera known to thrive in dry conditions exhibited high 320
fluorescent intensities in category C samples, sensu lato, and included Bacillus, Clostridium,
Streptococcus and some actinobacteria, ε-proteobacteria and mollicutes. Conversely,
α−, β−, γ−, and δ−proteobacteria yielded significantly elevated fluorescence intensities in
category A samples. An expanded, statistically significant (p value >95%) biodiversity was
observed in aquatic bacterial families in samples collected at the more humid KSC, in 325
comparison to those collected at JPL (Table 2).
DISCUSSION
While molecular biology has seen monumental advances in the specificity and
sensitivity of modern techniques, the efficient collection and accurate phylogenetic analysis of
microorganisms from low-biomass samples remains extremely challenging (19). Since the 330
effective sampling area of a spacecraft is fixed, it is not possible to simply increase the sample
size to improve yield (4). It is of utmost importance to assure that current methods of
on January 30, 2018 by guesthttp://aem
.asm.org/
Dow
nloaded from

15
assessing phylogenetic breadth and overall microbial burden from these precious allotments
are optimal for conserving of the true microbial community structure of the sampled
environment. Therefore, as reported previously (19), considerable measures were taken to 335
ensure that optimized sample collection and automated sample processing procedures were
integrated as to elucidate the fullest possible spectrum of microbial life associated with
spacecraft surfaces. Given the constraints inherent to working with such low biomass
samples, technologies capable of accurately registering low abundance organisms are vital.
The rapidity, repeatability, comprehensiveness and sensitivity of the PhyloChip for 340
surveying entire bacterial communities in environmental samples suggest that the approach
could significantly advance microbial detection and environmental monitoring. Key features
that set the PhyloChip apart from similar technologies are the use of multiple oligonucleotide
probes for all known prokaryotic taxa for high confidence detection and the pairing of a
mismatch probe for every perfectly matched probe to minimize the effect of non-specific 345
hybridization (35). A strong linear correlation has been confirmed between microarray probe
set intensity and concentration of OTU specific 16S rRNA gene copies, allowing
quantification in a wide dynamic range. Validation experiments have demonstrated high
reproducibility, as intensity responses among replicate chips show less than 10% variation (3).
PhyloChip results from complex environmental samples have been confirmed by additional 350
methods, including quantitative PCR and 16S rRNA gene clone libraries (7), and analysis of
split-samples have confirmed that >90% of all 16S rRNA sequence types identified by the
more expensive clone library method are also identified by the PhyloChip. When the high-
density PhyloChip microarray, with all known DNA sequences encoding bacterial and
archaeal 16S rRNA (9), was applied to urban aerosols, the spatio-temporal distributions of 355
on January 30, 2018 by guesthttp://aem
.asm.org/
Dow
nloaded from
16
known bacterial groups, including specific pathogens, were related to meteorologically driven
transport processes as well as sources (12).
Previous analyses of surface samples collected at three different time periods (before,
during, and after Phoenix Lander assembly/occupancy) from the same locations within the
KSC-PHSF cleanroom led to the conclusion that cleaning protocols in use were indeed 360
effective in significantly reducing both microbial burden (13) and diversity (34). As might be
expected, the clone libraries representing the pre-Phoenix sampling (PHSF-PHX-B) exhibited
a great many OTUs (166 OTUs by cloning), and the corresponding coverage value was low
(86.5%). However, with increased cleaning efforts during- (PHX-D1; Table 1) and post-
(PHX-A) Phoenix, detectable OTUs were significantly reduced (~20), and coverage values 365
escalated to ~92 %. Such a trend was also observed with samples collected prior to- (MSL-B;
76% coverage), and during- (MSL-D1; 93% coverage) MSL occupancy of the JPL-SAF.
These observed reductions in bacterial numbers while facilities were housing spacecraft (see
coverage values; Table 1) can likely be attributed to more diligent cleaning efforts, as the
frequency of cleaning increased (2 to 3-fold increase in schedule) when spacecraft were 370
present, as opposed to standard facility maintenance during non operational periods (twice per
week). Immediately following the departure of the Phoenix spacecraft from the KSC-PHSF
the facility was maintained at utmost stringency and no changes were made in cleaning
practices, so as to be ready to accommodate any unforeseen needs associated with a launch
delay. Samples collected at this time (post-Phoenix with bolstered cleaning and maintenance) 375
continued to exhibit appreciable coverage values (98.5%) even though the spacecraft was not
present.
Perhaps the greatest advantage of cloning-based biodiversity analysis was the ability
to generate rarefaction curves and corresponding coverage values, which provide an
on January 30, 2018 by guesthttp://aem
.asm.org/
Dow
nloaded from
17
invaluable approximation of just how representative each sample was of its true environment 380
(30, 31). Due in large part to biases in the generation and picking of transformant colonies,
PhyloChip DNA microarrays detected a much broader biodiversity than clone libraries, even
at very high taxonomic levels (7, 35). There was an appreciable difference in the level at
which the PhyloChip “out-detected” cloning approaches based on the presence or absence of
spacecraft hardware at the time of sample collection. The superior detection capabilities of the 385
PhyloChip were far more pronounced when the facility was sampled while housing spacecraft
hardware (32 to 70-fold), as opposed to when sampled facilities sat vacant (9 to 16-fold). This
was a reasonable correlation, since the bacterial diversity associated with any given SAC
should be a combination of the bacterial diversities associated with that facility plus that
associated with foreign spacecraft components that have been fabricated from countless 390
geographic locations.
When compared directly, MSL-supporting SAC samples did not house as rich of
bacterial diversity as those collected from facilities housing Phoenix hardware. This is not to
say that MSL-associated SAC were not diverse. DNA microarray analyses detected roughly
4,000 OTUs in the 5 MSL-associated SAC samples, however, only ca. 150 OTUs were 395
detected in all 5 of these samples. This is of immense consequence for planetary protection
and/or the validation of cleanroom maintenance, as it suggests that frequent monitoring is
required over the course of a project or process to confidently assess the majority of
contaminant microbes associated with production/assembly facility surfaces (and therefore at
risk of being sent into space on spacecraft). 400
The systematic approach taken during this study revealed that the PhyloChip
microarray analyses were superior to conventional 16S rRNA gene cloning and sequencing
strategies in all aspects of microbial diversity analysis save one: the detection of novel
on January 30, 2018 by guesthttp://aem
.asm.org/
Dow
nloaded from

18
microbial taxa. Since DNA microarrays are dependent on the hybridization of environmental
oligonucleotides to known probes of specific sequence, an enormous amount of a priori 405
sequence information is required. This need for previously inferred probe sequence data
precludes the ability of this technique to detect the presence of DNA arising from novel
microorganisms. As shown in Figure 1, there were a handful of novel taxa whose presence
completely eluded the PhyloChip and was inferred from clone library analysis alone. As for
limitations, with the cloning and mass-sequencing approach there was likely a molecular bias 410
that favored the PCR amplification and/or amplicon ligation of certain bacterial lineages and
henceforth masked the detection of taxa that were present in much lower abundance. High-
throughput approaches possess a significant advantage to cloning in that they are much more
capable of yielding valuable phylogenetic information from samples (7). Ultimately,
PhyloChip DNA microarray analyses supported, and accentuated, the general trends observed 415
by clone libraries with regards to geographic clustering (data not shown). The results of this
comparative study underscore a central theme in current molecular biology: a shift towards
high-throughput, data-rich molecular assays requiring significant bioinformatic analysis.
There are numerous factors to consider when choosing an appropriate methodology
for elucidating microbial diversity in environmental samples. While cost, time, labor intensity, 420
and reproducibility each weigh quite heavily in their own right, the bias and accuracy of a
given approach are perhaps the most important aspects when considering the goal of planetary
protection endeavors. In an effort to significantly strengthen the inferences drawn from
extraterrestrial life-detection experiments, NASA has stressed the importance of taking
necessary precautions to ensure that spacecraft outbound Earth are as devoid of microbial 425
contaminants as is reasonably possible. One approach to achieving this objective is to
routinely survey, and catalog the genetic microbial inventory present on SAC and co-located
on January 30, 2018 by guesthttp://aem
.asm.org/
Dow
nloaded from
19
spacecraft surfaces. These efforts will prove invaluable in interpreting the findings of
numerous robotic extraterrestrial life-detection missions. By working to minimize the
microbial burden associated with robotic spacecraft to levels approaching near-sterility, and 430
routinely sampling from, and maintaining a genetic inventory of the microbes associated with
spacecraft and SAC, planetary protection efforts are a) minimizing the likelihood of life-
detection experiments being compromised by contaminant terrestrial biomatter, b)
empowering the ability to discriminate authigenic from contaminant biomaterial, should any
be detected, and c) benefitting a wide range of scientific, electronic, homeland security, 435
medical, and pharmaceutical ventures by developing superior means of detecting and
mitigating microbial contaminants from low biomass environments.
ACKNOWLEDGMENTS
Part of the research described in this paper was carried out by the Jet Propulsion Laboratory,
California Institute of Technology, under contract with the National Aeronautics and Space 440
Administration. An additional part of this work was performed under the auspices of the U.S.
Department of Energy by the University of California, Lawrence Berkeley National
Laboratory, under Contract DE-AC02-05CH11231. We thank K. Buxbaum and C. Conley for
valuable advice and encouragement. The authors would also like to thank Todd DeSantis for
his input and support using the Greengenes suite of tools (www.greengenes.lbl.gov). 445
on January 30, 2018 by guesthttp://aem
.asm.org/
Dow
nloaded from
20
REFERENCES
1. Bergogne-Berezin, E., and M. L. Joly-Guillou. 1985. An underestimated nosocomial pathogen,
Acinetobacter calcoaceticus. Journal of Antimicrobial Chemotheraphy 16:535-8.
2. Brodie, E. L., T. Z. DeSantis, D. C. Joyner, S. M. Baek, J. T. Larsen, G. L. Andersen, T. C. Hazen,
P. M. Richardson, D. J. Herman, T. K. Tokunaga, J. M. Wan, and M. K. Firestone. 2006. 450 Application of a high-density oligonucleotide microarray approach to study bacterial population
dynamics during uranium reduction and reoxidation. Appl. Environ. Microbiol. 72:6288-6298.
3. Brodie, E. L., T. Z. DeSantis, J. P. M. Parker, I. X. Zubietta, Y. M. Piceno, and G. L. Andersen.
2007. Urban aerosols harbor diverse and dynamic bacterial populations. Proceedings of the National
Academy of Sciences 104:299-304. 455
4. Bruckner, J. C., and K. Venkateswaran. 2007. Overview of methodologies to sample and assess
microbial burden in low biomass environments. Jap. J. Food Microbiol. 24:61-70.
5. COSPAR. 2002. Presented at the Planetary Protection Policy, October 2002, as amended, March 2005,
Committee of Space Research 2002, Houston, TX.
6. Cruz-Martinez, K., K. B. Suttle, E. L. Brodie, M. E. Power, G. L. Andersen, and J. F. Banfield. 460 2009. Despite strong seasonal responses, soil microbial consortia are more resilient to long-term
changes in rainfall than overlying grassland. ISME J.
7. DeSantis, T. Z., E. L. Brodie, J. P. Moberg, I. X. Zubieta, Y. M. Piceno, and G. L. Andersen. 2007.
High-density universal 16S rRNA microarray analysis reveals broader diversity than typical clone
library when sampling the environment. Microb. Ecol. 53:371-383. 465
8. DeSantis, T. Z., P. Hugenholtz, K. Keller, E. L. Brodie, N. Larsen, Y. M. Piceno, R. Phan, and G.
L. Andersen. 2006. NAST: a multiple sequence alignment server for comparative analysis of 16S
rRNA genes. Nucleic Acids Res 34:W394-9.
9. Dojka, M. A., P. Hugenholtz, S. K. Haack, and N. R. Pace. 1998. Microbial diversity in a
hydrocarbon- and chlorinated-solvent- contaminated aquifer undergoing intrinsic bioremediation. Appl 470 Environ Microbiol 64:3869-77.
10. Felsenstein, J. 1989. PHYLIP - Phylogeny Inference Package (Version 3.65). Cladistics 5:164-166.
11. Flanagan, J. L., E. L. Brodie, L. Weng, S. V. Lynch, O. Garcia, R. Brown, P. Hugenholtz, T. Z.
DeSantis, G. L. Andersen, J. P. Wiener-Kronish, and J. Bristow. 2007. Loss of bacterial diversity
during antibiotic treatment of intubated patients colonized with Pseudomonas aeruginosa. J. Clin. 475 Microbiol. 45:1954-1962.
12. Fodor, S. P., J. L. Read, M. C. Pirrung, L. Stryer, A. T. Lu, and D. Solas. 1991. Light-directed,
spatially addressable parallel chemical synthesis. Science 251:767-73.
13. Ghosh, S., S. Osman, P. Vaishampayan, and K. Venkateswaran. 2009. Recurrent isolation of
extremo-tolerant bacteria from the clean room where Phoenix spacecraft components are assembled. 480 Astrobiology in press.
14. Good, I. J. 1953. The population frequencies of species and the estimation of population parameters.
Biometrika 40:237-264.
15. Heck, J. K., van Belle, G, Simberloff, D. 1975. Explicit calculation of the rarefaction diversity
measurement and the determination of sufficient sample size. Ecology 56:1459-1461. 485
16. Hugenholtz, P. 2002. Exploring prokaryotic diversity in the genomic era. Genome Biol 3:1-8.
17. ISO. Clean Rooms - International Standard Organization Standard 14644;
http://www.engineeringtoolbox.com/clean-rooms-iso-d_933.html.
18. La Duc, M. T., A. E. Dekas, S. Osman, C. Moissl, D. Newcombe, and K. Venkateswaran. 2007.
Isolation and characterization of bacteria capable of tolerating the extreme conditions of clean-room 490 environments. Appl. Environ. Microbiol. 73:2600-2611.
on January 30, 2018 by guesthttp://aem
.asm.org/
Dow
nloaded from
21
19. La Duc, M. T., S. Osman, and K. Venkateswaran. 2009. Comparative analysis of methods for the
purification of DNA from low-biomass samples based on total yield and conserved microbial diversity.
J. Rapid Meth. Auto. Microbiol. 17.
20. Larkin, M. A., G. Blackshields, N. P. Brown, R. Chenna, P. A. McGettigan, H. McWilliam, F. 495 Valentin, I. M. Wallace, A. Wilm, R. Lopez, J. D. Thompson, T. J. Gibson, and D. G. Higgins. 2007. Clustal W and Clustal X version 2.0. Bioinformatics 23:2947-2948.
21. Lawley, B., S. Ripley, P. Bridge, and P. Convey. 2004. Molecular analysis of geographic patterns of
eukaryotic diversity in Antarctic soils. Appl. Environ. Microbiol. 70:5963-5972.
22. Liu, Z., T. Z. DeSantis, G. L. Andersen, and R. Knight. 2008. Accurate taxonomy assignments from 500 16S rRNA sequences produced by highly parallel pyrosequencers. Nucleic Acids Res 36:e120.
23. Ludwig, W., O. Strunk, R. Westram, L. Richter, H. Meier, Yadhukumar, A. Buchner, T. Lai, S.
Steppi, G. Jobb, W. Forster, I. Brettske, S. Gerber, A. W. Ginhart, O. Gross, S. Grumann, S.
Hermann, R. Jost, A. Konig, T. Liss, R. Lussmann, M. May, B. Nonhoff, B. Reichel, R. Strehlow,
A. Stamatakis, N. Stuckmann, A. Vilbig, M. Lenke, T. Ludwig, A. Bode, and K. H. Schleifer. 505 2004. ARB: a software environment for sequence data. Nucleic Acids Res. 32:1363-71.
24. Moissl, C., J. Bruckner, and K. Venkateswaran. 2008. Archaeal community analysis of spacecraft
assembly facilities. The ISME Journal 2:115-119.
25. Moissl, C., N. Hosoya, J. Bruckner, T. Stuecker, M. Roman, and K. Venkateswaran. 2007.
Molecular microbial community structure of the regenerative enclosed life support module simulator 510 (REMS) air system. Int. J. Astrobiol. 6:131-145.
26. Moissl, C., M. T. La Duc, S. Osman, A. E. Dekas, and K. Venkateswaran. 2007. Molecular bacterial
community analysis of clean rooms where spacecraft are assembled. FEMS Microbiol. Ecol. 61:509-
521.
27. Pruesse, E., C. Quast, K. Knittel, B. M. Fuchs, W. Ludwig, J. Peplies, and F. O. Glockner. 2007. 515 SILVA: a comprehensive online resource for quality checked and aligned ribosomal RNA sequence
data compatible with ARB. Nucleic Acids Res. 35:7188-7196.
28. Rossello-Mora, R., and R. Amann. 2001. The species concept for prokaryotes. FEMS Microbiol. Rev.
25:39-67.
29. Rummel, J. D. 2001. Planetary exploration in the time of astrobiology: protecting against biological 520 contamination. Proc. Nat. Acad. Sci. USA 98:2128-2131.
30. Schloss, P. D., and J. Handelsman. 2005. Introducing DOTUR, a computer program for defining
operational taxonomic units and estimating species richness. Appl. Environ. Microbiol. 71:1501-1506.
31. Schloss, P. D., and J. Handelsman. 2006. Toward a census of bacteria in soil. PLoS Comput Biol
2:e92. 525
32. Space Science Board, and National Research Council. 1992. Biological contamination of Mars:
Issues and Recommendations. Task Group on Planetary Protection. National Academy of Sciences,
Washington, D.C.
33. Stackebrandt, E., and B. M. Goebel. 1994. Taxonomic note: a place for DNA-RNA reassociation and
16S RNA sequence analysis in the present species defiintion of bacteriology. Int. J. Syst. Bacteriol. 530 44:846-849.
34. Vaishampayan, P., S. Osman, G. Andersen, and K. Venkateswaran. 2009. Molecular methods to
monitor microbial community composition of the phoenix spacecraft assembly clean room. Environ.
Microbiol. submitted.
35. Wilson, K. H., W. J. Wilson, J. L. Radosevich, T. Z. DeSantis, V. S. Viswanathan, T. A. 535 Kuczmarski, and G. L. Andersen. 2002. High-density microarray of small-subunit ribosomal DNA
probes. Appl. Environ. Microbiol. 68:2535-2541.
36. Yergeau, E., S. A. Schoondermark-Stolk, E. L. Brodie, S. Dejean, T. Z. DeSantis, O. Goncalves,
Y. M. Piceno, G. L. Andersen, and G. A. Kowalchuk. 2009. Environmental microarray analyses of
Antarctic soil microbial communities. ISME J 3:340-51. 540
on January 30, 2018 by guesthttp://aem
.asm.org/
Dow
nloaded from
22
Legend
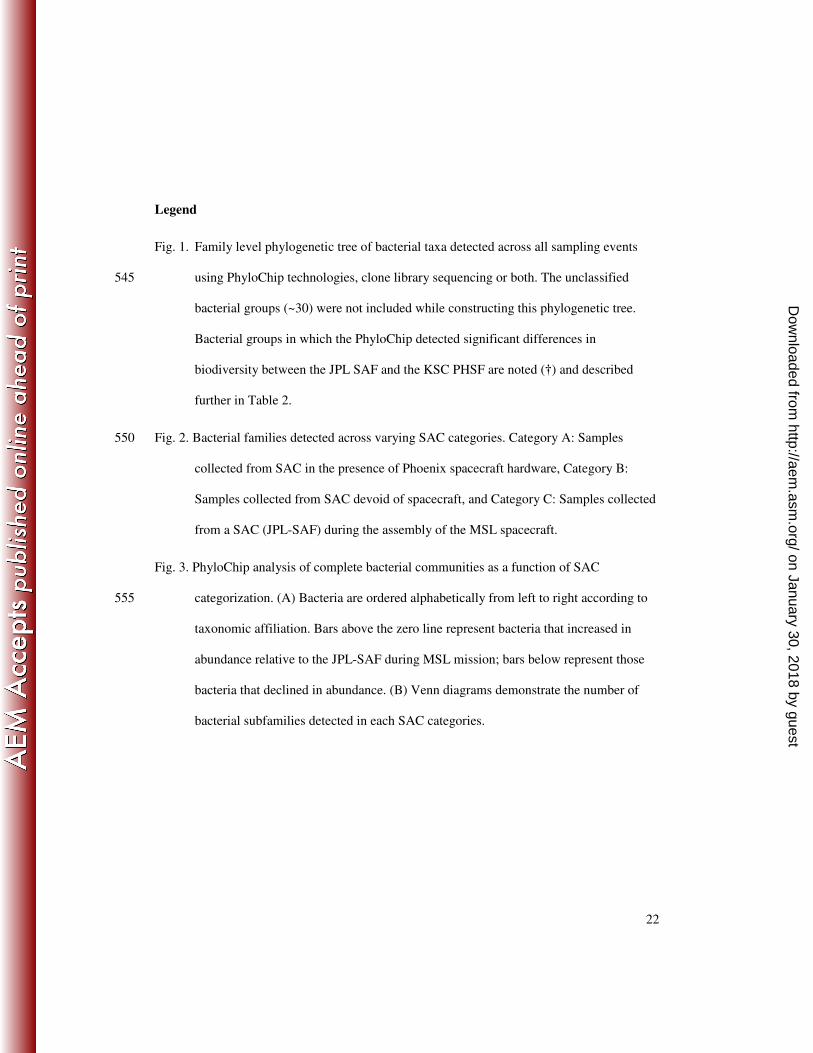
Fig. 1. Family level phylogenetic tree of bacterial taxa detected across all sampling events
using PhyloChip technologies, clone library sequencing or both. The unclassified 545
bacterial groups (~30) were not included while constructing this phylogenetic tree.
Bacterial groups in which the PhyloChip detected significant differences in
biodiversity between the JPL SAF and the KSC PHSF are noted (†) and described
further in Table 2.
Fig. 2. Bacterial families detected across varying SAC categories. Category A: Samples 550
collected from SAC in the presence of Phoenix spacecraft hardware, Category B:
Samples collected from SAC devoid of spacecraft, and Category C: Samples collected
from a SAC (JPL-SAF) during the assembly of the MSL spacecraft.
Fig. 3. PhyloChip analysis of complete bacterial communities as a function of SAC
categorization. (A) Bacteria are ordered alphabetically from left to right according to 555
taxonomic affiliation. Bars above the zero line represent bacteria that increased in
abundance relative to the JPL-SAF during MSL mission; bars below represent those
bacteria that declined in abundance. (B) Venn diagrams demonstrate the number of
bacterial subfamilies detected in each SAC categories.
on January 30, 2018 by guesthttp://aem
.asm.org/
Dow
nloaded from
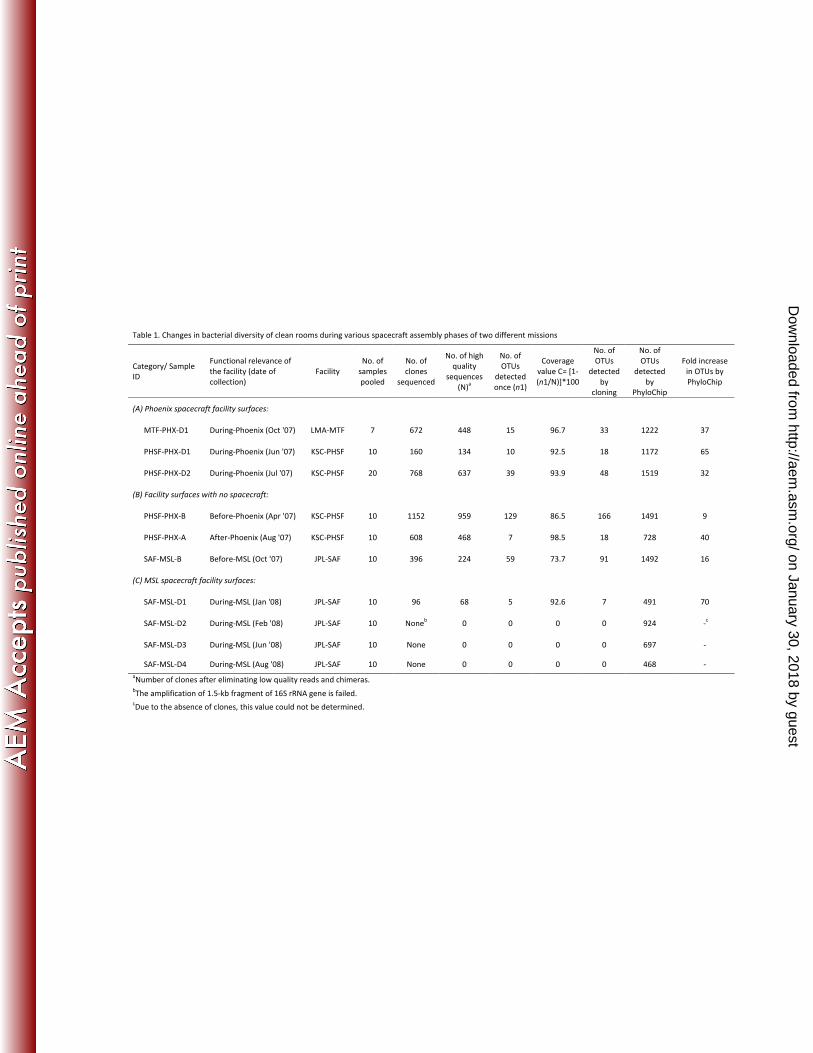
Table 1. Changes in bacterial diversity of clean rooms during various spacecraft assembly phases of two different missions
Category/ Sample
ID
Functional relevance of
the facility (date of
collection)
Facility
No. of
samples
pooled
No. of
clones
sequenced
No. of high
quality
sequences
(N)a
No. of
OTUs
detected
once (n1)
Coverage
value C= [1-
(n1/N)]*100
No. of
OTUs
detected
by
cloning
No. of
OTUs
detected
by
PhyloChip
Fold increase
in OTUs by
PhyloChip
(A) Phoenix spacecraft facility surfaces:
MTF-PHX-D1 During-Phoenix (Oct '07) LMA-MTF 7 672 448 15 96.7 33 1222 37
PHSF-PHX-D1 During-Phoenix (Jun '07) KSC-PHSF 10 160 134 10 92.5 18 1172 65
PHSF-PHX-D2 During-Phoenix (Jul '07) KSC-PHSF 20 768 637 39 93.9 48 1519 32
(B) Facility surfaces with no spacecraft:
PHSF-PHX-B Before-Phoenix (Apr '07) KSC-PHSF 10 1152 959 129 86.5 166 1491 9
PHSF-PHX-A After-Phoenix (Aug '07) KSC-PHSF 10 608 468 7 98.5 18 728 40
SAF-MSL-B Before-MSL (Oct '07) JPL-SAF 10 396 224 59 73.7 91 1492 16
(C) MSL spacecraft facility surfaces:
SAF-MSL-D1 During-MSL (Jan '08) JPL-SAF 10 96 68 5 92.6 7 491 70
SAF-MSL-D2 During-MSL (Feb '08) JPL-SAF 10 Noneb 0 0 0 0 924 -
c
SAF-MSL-D3 During-MSL (Jun '08) JPL-SAF 10 None 0 0 0 0 697 -
SAF-MSL-D4 During-MSL (Aug '08) JPL-SAF 10 None 0 0 0 0 468 -
aNumber of clones after eliminating low quality reads and chimeras.
bThe amplification of 1.5-kb fragment of 16S rRNA gene is failed.
cDue to the absence of clones, this value could not be determined.
on January 30, 2018 by guesthttp://aem
.asm.org/
Dow
nloaded from
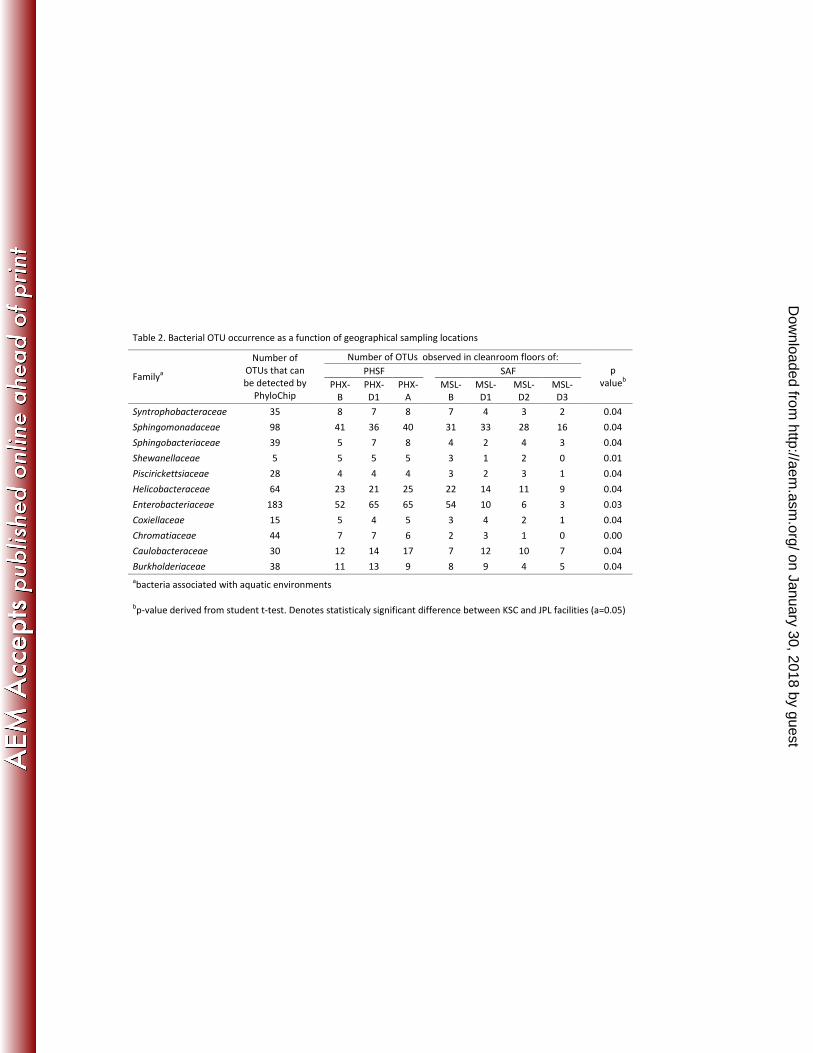
Table 2. Bacterial OTU occurrence as a function of geographical sampling locations
Number of OTUs observed in cleanroom floors of:
PHSF SAF Family
a
Number of
OTUs that can
be detected by
PhyloChip
PHX-
B
PHX-
D1
PHX-
A
MSL-
B
MSL-
D1
MSL-
D2
MSL-
D3
p
valueb
Syntrophobacteraceae 35 8 7 8 7 4 3 2 0.04
Sphingomonadaceae 98 41 36 40 31 33 28 16 0.04
Sphingobacteriaceae 39 5 7 8 4 2 4 3 0.04
Shewanellaceae 5 5 5 5 3 1 2 0 0.01
Piscirickettsiaceae 28 4 4 4 3 2 3 1 0.04
Helicobacteraceae 64 23 21 25 22 14 11 9 0.04
Enterobacteriaceae 183 52 65 65 54 10 6 3 0.03
Coxiellaceae 15 5 4 5 3 4 2 1 0.04
Chromatiaceae 44 7 7 6 2 3 1 0 0.00
Caulobacteraceae 30 12 14 17 7 12 10 7 0.04
Burkholderiaceae 38 11 13 9 8 9 4 5 0.04
abacteria associated with aquatic environments
bp-value derived from student t-test. Denotes statisticaly significant difference between KSC and JPL facilities (a=0.05)
on January 30, 2018 by guesthttp://aem
.asm.org/
Dow
nloaded from

Myxococcaceae
Polyangiaceae
Desulfovibrionaceae
Desulfomicrobiaceae
Syntrophaceae
Desulfobulbaceae
Syntrophobacteraceae
Thermodesulfobacteriaceae
Desulfuromonaceae
Nitrospiraceae
Sphin
gom
onadaceae
Aceto
bacte
raceaee
ae
ca
cc
oc
oe
so
RR
ickettsia
ceae
Anapla
sm
ata
ceae
SA
R11
Azospirill
aceae
Caulo
bacte
raceae
Hyphom
icro
bia
ceae
Bru
cella
ceae
Phyl
lobact
eriace
ae
Rhi
zobi
acea
e
Bar
tone
llace
aeX
anth
obact
era
ceae
Bra
dyr
hiz
obia
ceae
Beije
rinck/R
hodopla
n/M
eth
ylo
cyst
Meth
ylobact
eriace
ae
Rhodobacte
raceae
Hyd
roge
noph
ilace
ae
Com
amon
adac
eae
Nei
sser
iace
ae
Nitr
osom
onad
acea
e
Rho
docy
clac
eae
Meth
ylophila
ceae
Burkholderia
ceae
Oxalobacte
race
ae
Alcaligenaceae
Ralstoniaceae
Coxiellaceae
Halomonadaceae
MoraxellaceaeLegionellaceae
Pasteurellaceae
Halothiobacillaceae
ChromatiaceaeMethylococcaceaeEctothiorhodospiraceae
Alcanivoraceae
Pseudomonadaceae
Acidithiobacillaceae
Aeromonadaceae
Vibrionaceae
Enterobacteriaceae
Alteromonadaceae
Shewanellaceae
PiscirickettsiaceaeOceanospirillaceae
Chlo
ropla
sts
Mycopla
sm
ata
ceae
Achole
pla
sm
ata
ceae
Derm
ato
phila
ceae
Caedib
acte
raceae
Gallio
nella
ceae
Helicobacteraceae
Cam
pylobacteraceae
Chlorobiaceae
Crenotrichaceae
Sapro
spira
ceae
Fle
xibacte
race
ae
Porp
hyro
monadace
ae
Bacte
roid
ace
ae
Pre
vote
llace
ae
Flavobacteriaceae
Blattabacteriaceae
Sphingobacteriaceae
Leptospiraceae
Chlam
ydiaceae
Fusobacteriaceae
Clostridiaceae
Lachnospiraceae
Therm
oactinomycetaceae
Paenibacillaceae
Lactobacillaceae
Halo
bacilla
ceae
Bacilla
ceae
Sta
phylo
cocca
ceae
Stre
pto
cocca
ceae
Aero
cocca
ceae
Ente
rococcaceae
Leuconosto
caceae
Actinosynnemataceae
Anammoxales
Pirellulae
Isosphaerae
Mic
roth
rixin
eae
Bre
vib
acte
riaceae
Act
inom
yceta
ceae
Pse
udonoca
rdia
ceae
Die
tzia
ceae
Noc
ardi
acea
e
Myc
obac
teria
ceae
Noc
ardi
oida
ceae
Gord
onia
ceae
Cor
yneb
acte
riace
ae
Pro
pio
nib
acte
riaceae
Str
epto
myceta
ceae
Mic
rococcaceae
Pro
mic
rom
onospora
ceae
Cellu
lom
onadaceae
Mic
robact
eriace
ae
Derm
abacte
raceae
Geoderm
ato
phila
ceae
Fra
nkia
ceae
Therm
om
onospora
ceae
ea
ec
airo
ps
oe
niK M
icro
monospora
ceae
Str
epto
spora
ngia
ceae
Corio
bacte
riaceae
Ver
ruco
micro
bia
sub
7
Verruco
micr
obiace
ae
Xiphin
emato
bactera
ceae
Opi
tuta
ceae
Geobactera
ceae
Thermoanaero
bacteriaceae
Peptococc/Acidaminococc
Alicyclobacillaceae
Erysipelotrichaceae
Acidobacteriaceae
Bifidobacteriaceae
Peptostreptococcaceae
Rubrobacteraceae
Acidimicrobiaceae
Intrasporangiaceae
Thiotrichaceae
Spirochaetaceae
Thermotogaceae
DesulfobacteraceaeParachlamydiaceaeVerrucomicrobia sub 5
MagnetospirillaceaeBdellovibrionaceaeNitrospinaceae
Planctomycetaceae
Detected only on PhyloChip
Detected by both methods
Detected only in Clone Libraries on January 30, 2018 by guesthttp://aem
.asm.org/
Dow
nloaded from
Taxonomical posi�on
Ca
teg
ory
A
Ca
teg
ory
B
Ca
teg
ory
C
Taxonomical posi�on
Ca
teg
ory
A
Ca
teg
ory
B
Ca
teg
ory
C
Taxonomical posi�on
Ca
teg
ory
A
Ca
teg
ory
B
Ca
teg
ory
C
Taxonomical posi�on
Ca
teg
ory
A
Ca
teg
ory
B
Ca
teg
ory
C
Acidimicrobiaceae Pasteurellaceae Flexibacteraceae Acholeplasmataceae 0
Acidithiobacillaceae Peptococcaceae Oxalobacteraceae Acidothermaceae 0
Acidobacteriaceae Phyllobacteriaceae Streptococcaceae Bacteroidaceae 0
Ac�nomycetaceae Pisciricke!siaceae Bdellovibrionaceae 0
Aerococcaceae Planctomycetaceae Bradyrhizobiaceae Cardiobacteriaceae 0
Aeromonadaceae Polyangiaceae Burkholderiaceae Chlamydiaceae 0
Alcanivoraceae Porphyromonadaceae Caulobacteraceae Dietziaceae 0
Alicyclobacillaceae Promicromonosporaceae Comamonadaceae Entomoplasmataceae 0
Alteromonadaceae Propionibacteriaceae Enterobacteriaceae Francisellaceae 0
Anaplasmataceae Pseudoalteromonadaceae Lactobacillaceae Gordoniaceae 0
Azospirillaceae Pseudonocardiaceae Methylobacteriaceae Microthrixineae 0
Bartonellaceae Ralstoniaceae Moraxellaceae Nocardiaceae 0
Bifidobacteriaceae Rhodocyclaceae Neisseriaceae Prochlorales 0
Bla!abacteriaceae Ricke!siaceae Pseudomonadaceae Roseiflexales 0
Caedibacteraceae Rikenellaceae Sphingobacteriaceae Streptosporangiaceae 0
Caldithraceae Roseococcaceae Sphingomonadaceae Syntrophomonadaceae 0
Campylobacteraceae Rubrobacteraceae Staphylococcaceae Thermotogaceae 0
Caryophanaceae Saccharospirillaceae Xanthomonadaceae Verrucomicrobiaceae 0
Catabacteriaceae Shewanellaceae Geitlerinema 0
Cellulomonadaceae Simkaniaceae Carnobacteriaceae 0 Spirulina 0
Chlorobiaceae Spirochaetaceae AMD clone group (AF523882) 0
Coriobacteriaceae Sporichthyaceae Acetobacteraceae Dechlorina�ng clone group (AF523965) 0
Corynebacteriaceae Sporolactobacillaceae Bacillaceae OP8 (AF419671) 0
Coxiellaceae Streptomycetaceae Chroma�aceae SAR11 (AF353223) 0
Crenotrichaceae Succinivibrionaceae Clostridiaceae SAR86 (AF406526) 0
Dermabacteraceae Syntrophaceae Erysipelotrichaceae EB1021 group (AF523886) 0
Dermatophilaceae Syntrophobacteraceae Lachnospiraceae Ellin6075/11-25 (AY211077) 0
Desulfoarculaceae Thermoac�nomycetaceae Peptostreptococcaceae
Desulfobacteraceae Thermodesulfobacteriaceae Rhodobacteraceae Procabacteriaceae 0
Desulfobulbaceae Thermomonosporaceae Deferribacer 0
Desulfohalobiaceae Thiotrichaceae Alcaligenaceae Leptolyngbya 0
Desulfomicrobiaceae Xanthobacteraceae Brucellaceae Uranium waste clones (AJ536882) 0
Desulfovibrionaceae Xiphinematobacteraceae Flavobacteriaceae
Desulfuromonaceae Natronoanaerobium Rhizobiaceae Parachlamydiaceae 0
Ectothiorhodospiraceae Plectonema LD1PA group (AY114324) 0
Enterococcaceae Pseudanabaena Prevotellaceae 0
Eubacteriaceae AD3 (AJ536867) Dictyoglomaceae 0 0
Flammeovirgaceae BRC1 (AY218548) Nocardioidaceae Leuconostocaceae 0 0
Frankiaceae CH21 cluster (AY222300) Exiguobacterium 0 0
Geobacteraceae aqua�c clone (AY221036) Fusobacteriaceae 0 NC10 (AY177763) 0 0
Geodermatophilaceae BD2-10 group (AY193208)
Halobacillaceae DSS1 (AJ306783) Auran�monadaceae 0 0 Ac�nosynnemataceae 0 0
Halomonadaceae Gut clone group (AY207065) Burkholderiaceae-5* 0 0 Halothiobacillaceae 0 0
Helicobacteraceae OP10 (AF524022) Pseudomonadaceae 0 0 Hyphomonadaceae 0 0
Hydrogenophilaceae OP3 (AY013695) Pseudomonadaceae-6* 0 0 Intrasporangiaceae 0 0
Hyphomicrobiaceae OP9 (AY013695) Vibrionaceae 0 0
Kineosporiaceae SPAM (AJ519639) Rhodospirillaceae 0 0 Fulvimarina 0 0
Legionellaceae SUP05 (AF382104) Phormidium 0 0
Legionellales Ellin307/WD2124 (AY221039) Clostridiaceae-11* 0 Verorhodospirilla 0 0
Len�sphaerae Ellin314/wr0007 (AF498715) Deinococcaceae 0 OP11-5 (AF316799) 0 0
Leptospiraceae Ellin329/Riz1046 (AB081581) Planococcaceae 0
Magnetospirillaceae Ellin6095/SC-I-39 (AY221080)
Methylococcaceae GAO cluster (AF361096) Cyanobacteria-1* 0 0
Methylophilaceae KSA1 (AF449785) Ruminococcaceae 0 0
Microbacteriaceae mgA-1 (AACY01094130)
Micrococcaceae mgA-2 (AF382142) Detected by:
Micromonosporaceae MND1 clone group (AY221081) PhyloChip
Mycobacteriaceae NC10-1 (AY177763) Cloning
Mycoplasmataceae NC10-2 (AJ519650) Both
Myxococcaceae Symbion�c clone (AF432146) 0 No detectable bacterial families
Nitrosomonadaceae TM6 (AY043739) * Unclassifed family
Nitrospiraceae TM7 (337880)
Nocardiopsaceae TM7-3 (AY134895)
Oceanospirillaceae WS3 (AJ535231)
Paenibacillaceae WS5 (AF419661)
OTUs were categorized according to their first available
classified taxonomic levels
Family that does not have cul�vable organism
(Representa�ve GenBank # are given in parentheses)
on January 30, 2018 by guesthttp://aem
.asm.org/
Dow
nloaded from
-3000
-2000
-1000 0
1000
2000
3000
4000
5000
Actinobacteria
Brevindimonas
α-p
rote
oβ
-pro
teo
γ-p
rote
o
δ-p
rote
o
Streptococcus
Clostridia
ε-proteo
PhyloChip-probe hybridization intensity
Ca
t A
(59
7)
Ca
t C
(44
)
Co
mm
on
(94
7)
PH
SF
Bradyrhizobium
Bacillus
Mollicutes
on January 30, 2018 by guesthttp://aem
.asm.org/
Dow
nloaded from