composition and annual cycle of phytoplankton assemblages in the northeastern adriatic sea
TRANSCRIPT

Botanica Marina 52 (2009): 291–305 � 2009 by Walter de Gruyter • Berlin • New York. DOI 10.1515/BOT.2009.004
Article in press - uncorrected proof
2009/28
Composition and annual cycle of phytoplanktonassemblages in the northeastern Adriatic Sea
Damir Vilicic1,*, Tamara Djakovac2, ZrinkaBuric1 and Suncica Bosak1
1 Division of Biology, Faculty of Science, Universityof Zagreb, Rooseveltov trg 6, 10000 Zagreb, Croatia,e-mail: [email protected] Rud-er Boskovic Institute, Center for Marine Research,G. Paliage 5, 52210 Rovinj, Croatia
* Corresponding author
Abstract
Phytoplankton abundance and seasonality in the north-eastern Adriatic Sea were directly related to the annualregime of the Po River discharge in the period2002–2007. In 2005, 2006, and 2007, there was a shiftin the timing of the annual Po River maximum dischargeand of phytoplankton maxima from spring to autumn. Inaddition, the eastern coastal area was greatly influencedby oligotrophic karstic rivers and the Eastern AdriaticCurrent. Dominant phytoplankton taxa were defined onthe basis of abundance and frequency of appearance.Such an approach may help in the comparison of phy-toplankton communities within different environments.The dominant taxa were the diatoms Cerataulina pelagi-ca, Chaetoceros socialis, Chaetoceros vixvisibilis andPseudo-nitzschia spp., which appeared at maximumabundances )106 cells l-1 in more than 20% of samples.Among other phytoplankton, the most common was thecoccolithophorid Emiliania huxleyi (maximum abundanceof 2=105 cells l-1 in 50% of samples), and the dinoflag-ellate Prorocentrum minimum (maximum abundance of3=105 cells l-1 in 12% of samples). The present state ofthe phytoplankton community may provide valuableinformation for evaluation of possible future environmen-tal changes in the shallow Mediterranean ecosystem.
Keywords: abundance; Adriatic Sea; phytoplankton;Po River; seasonality.
Introduction
There is information on the diversity of phytoplankton inthe Adriatic Sea (Revelante 1985, Vilicic 1985, Caroppo2000, Caroppo et al. 1999, Vilicic et al. 2002). Data onphytoplankton abundance and seasonality (Honsell andCabrini 1990, Honsell et al. 1992, Honsell 1993, Sidari etal. 1995, Bernardi Aubry and Acri 2004, Bernardi Aubryet al. 2004, 2006), photosynthetic properties (Mangoni etal. 2008), and biomass and production (Zoppini et al.
1995, Harding et al. 1999, Polimene et al. 2006, Mauri etal. 2007) mostly refer to the western part of the AdriaticSea, which is greatly influenced by the Po River influx,and to a lesser extent to the eastern part, which is char-acterized by a different hydrological regime (Revelanteand Gilmartin 1980, Revelante et al. 1984, Mozetic et al.1998). Seasonality in the middle Adriatic sub-basin wasdocumented by Totti et al. (2000).
The scope of this paper is to present abundance andseasonality of phytoplankton in the northeastern AdriaticSea during the period 2001–2007 at times when thePo River discharge was high (2001–2004) and low(2005–2007). An additional goal is to present phytoplank-ton composition as maximum abundance and frequencyof appearance of common taxa, which may providevaluable information for future evaluation of processes inthe changing environment.
Area investigated
The Adriatic Sea is the northernmost section of the Med-iterranean Sea, where specific hydrodynamic conditionsresult from the freshwater discharge, wind regime, strat-ification, and mixing. Hydrography (Franco and Michelato1992, Orlic et al. 1992, Polimene et al. 2006, Jeffries andLee 2007) and phytoplankton distribution (Smodlaka1986, Vilicic 1991) make the Adriatic Sea longitudinallyand transversely asymmetrical. Longitudinally, there arethree distinct sections, the northern, mid and southernparts; transversely, there are eastern and western parts.The shallow northernmost part is -50 m deep. The east-ern part of the area, on which we focus in this paper(Figure 1), is greatly influenced by the continental andstrong northeasterly wind, the bora (Dorman et al. 2006).
Freshwater input from the largest Italian and Mediter-ranean river, the Po, regulates the general distribution ofnutrients (Degobbis et al. 1986, Degobbis and Gilmartin1990, Franco and Michelato 1992, Raicich 1996, Zava-tarelli et al. 1998, Socal et al. 2008), productivity (Chiau-dani et al. 1980, Smodlaka 1986, Giordani et al. 1997),and circulation (Gacic et al. 2001). There are two distinctwater masses influencing the northeastern Adriatic area,viz., the less saline northern Adriatic water and the highersaline Eastern Adriatic Current (EAC). The northeasternregion is mostly oligotrophic, due to the influences of thenorth-westerly ingoing EAC (Artegiani et al. 1997, Poulain1999, Gacic et al. 2001) and the oligotrophic karstic rivers(Vilicic et al. 2008).
Advection of the EAC influences biological character-istics in the northern basin, where biomass is frequentlyaccumulated in frontal zones close to the Po (Mangoniet al. 2008) or further to the eastern coast along theIstrian front (Zore-Armanda et al. 1983, Krsinic 1995, Leeet al. 2005).
Brought to you by | University of VirginiaAuthenticated | 128.143.23.241
Download Date | 10/4/12 8:01 AM
292 D. Vilicic et al.: Phytoplankton composition in the NE Adriatic Sea
Article in press - uncorrected proof
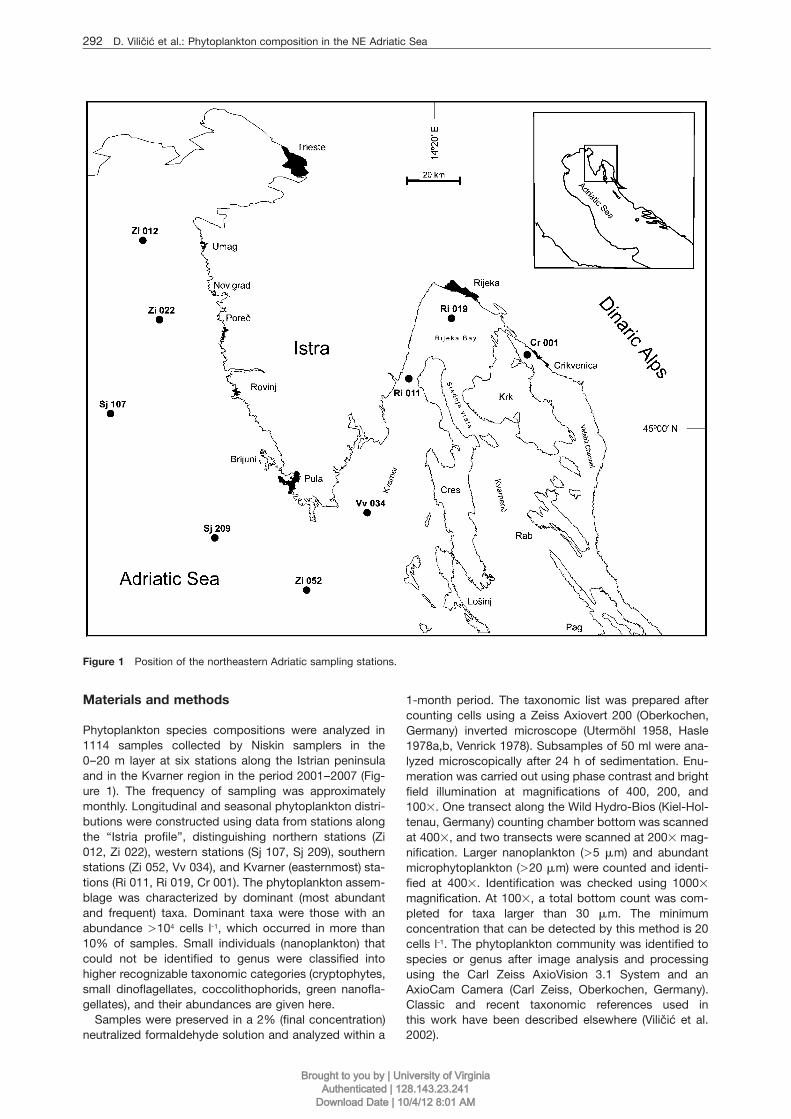
Figure 1 Position of the northeastern Adriatic sampling stations.
Materials and methods
Phytoplankton species compositions were analyzed in1114 samples collected by Niskin samplers in the0–20 m layer at six stations along the Istrian peninsulaand in the Kvarner region in the period 2001–2007 (Fig-ure 1). The frequency of sampling was approximatelymonthly. Longitudinal and seasonal phytoplankton distri-butions were constructed using data from stations alongthe ‘‘Istria profile’’, distinguishing northern stations (Zi012, Zi 022), western stations (Sj 107, Sj 209), southernstations (Zi 052, Vv 034), and Kvarner (easternmost) sta-tions (Ri 011, Ri 019, Cr 001). The phytoplankton assem-blage was characterized by dominant (most abundantand frequent) taxa. Dominant taxa were those with anabundance )104 cells l-1, which occurred in more than10% of samples. Small individuals (nanoplankton) thatcould not be identified to genus were classified intohigher recognizable taxonomic categories (cryptophytes,small dinoflagellates, coccolithophorids, green nanofla-gellates), and their abundances are given here.
Samples were preserved in a 2% (final concentration)neutralized formaldehyde solution and analyzed within a
1-month period. The taxonomic list was prepared aftercounting cells using a Zeiss Axiovert 200 (Oberkochen,Germany) inverted microscope (Utermohl 1958, Hasle1978a,b, Venrick 1978). Subsamples of 50 ml were ana-lyzed microscopically after 24 h of sedimentation. Enu-meration was carried out using phase contrast and brightfield illumination at magnifications of 400, 200, and100=. One transect along the Wild Hydro-Bios (Kiel-Hol-tenau, Germany) counting chamber bottom was scannedat 400=, and two transects were scanned at 200= mag-nification. Larger nanoplankton ()5 mm) and abundantmicrophytoplankton ()20 mm) were counted and identi-fied at 400=. Identification was checked using 1000=magnification. At 100=, a total bottom count was com-pleted for taxa larger than 30 mm. The minimumconcentration that can be detected by this method is 20cells l-1. The phytoplankton community was identified tospecies or genus after image analysis and processingusing the Carl Zeiss AxioVision 3.1 System and anAxioCam Camera (Carl Zeiss, Oberkochen, Germany).Classic and recent taxonomic references used inthis work have been described elsewhere (Vilicic et al.2002).
Brought to you by | University of VirginiaAuthenticated | 128.143.23.241
Download Date | 10/4/12 8:01 AM

D. Vilicic et al.: Phytoplankton composition in the NE Adriatic Sea 293
Article in press - uncorrected proof
Figure 2 Cluster diagram for eight stations on the basis ofaverage abundance of diatoms and nanoplankton, salinity, con-centration of orthosilicates, and total inorganic nitrogen in theperiod 2002–2007.See Figure 1 for station locations.
Table 1 Maximum and average values of phytoplankton abundance (cells l-1), temperature, salinity, oxygen saturation, and nutrientconcentrations across the northeastern Adriatic stations (data are for the 0–20 m layer).
Stations Abundance (1000 cells l-1) TEMP SAL OXY PO42- TIN SiO4
4q
DIATO DINO COCCO NANO(8C) (psu) SAT (%) (mmol l-1) (mmol l-1) (mmol l-1)
Northern Istra Zi 012, Zi 022MAX 1065 101 226 308 27.72 38.34 1.19 0.08 8.52 10.69AVG 108 17 24 55 17.90 37.33 0.98 0.04 1.35 2.05SD 170 17 26 54 4.49 0.91 0.07 0.07 1.20 1.67
Western Istra Sj 107, Sj 209MAX 11,350 321 144 678 28.61 38.61 1.32 0.13 13.67 8.92AVG 190 16 19 54 17.66 37.44 1.01 0.02 1.51 2.04SD 2464 261 24 77 5.79 1.10 0.06 0.02 1.82 1.58
Southern Istra Zi 052, Vv 034MAX 807 90 139 204 28.61 38.69 1.12 0.05 3.46 5.19AVG 36 13 16 41 17.81 36.24 1.04 0.01 0.91 1.70SD 83 11 20 34 5.61 0.49 0.03 0.01 0.70 1.00
Kvarner Ri 011, Ri 019, Cr 001MAX 610 273 139 599 27.35 38.48 1.25 0.05 5.85 8.46AVG 26 21 36 51 18.49 37.69 1.08 0.01 1.84 2.10SD 57 39 21 52 5.31 1.04 0.06 0.01 1.25 1.43
MAX, maximum; AVG, average; SD, standard deviation. For station positions, see Figure 1.DIATO, diatoms; DINO, dinoflagellates; COCCO, coccolithophorids; NANO, nanoflagellates; TEMP, temperature; SAL, salinity;OXY SAT, oxygen saturation; TIN, total inorganic nitrogen.
Nutrients and oxygen concentrations were determinedaccording to standard methods (Strickland and Parsons1972). Temperature and salinity conditions were meas-ured by a CTD probe (Seabird SBE25, Bellevue, WA,USA).
The program Statistica, version 7.0 (Statsoft, Tulsa,OK, USA) was used for multivariate data analysis andstatistical procedures. The data were analyzed by multi-variate analysis of variance (MANOVA) and one-wayANOVAs with post-hoc Bonferroni tests to differentiateamong stations on the basis of particular environmentalparameters (diatom abundance, nanoplankton abun-dance, salinity, orthosilicates, and total inorganic nitro-gen). A logarithmic transformation wlog10 (xq1)x was usedon the data prior to statistical analyses in order to obtainnormal distribution and homogeneity of variances (con-firmed by Cochran’s C test for MANOVA and Levene’stest for ANOVA). A cluster analysis (single linkage) wasused to determine the grouping of stations, applied tothe Euclidean dissimilarity index computed on fivevariables (diatom abundance, nanoplankton abundance,salinity, orthosilicates, and total inorganic nitrogen).
This research is more focused on comparisonsbetween stations than on inter-annual changes.
Results
Multivariate analysis grouped stations according to bio-logical (diatoms and nanoplankton abundance) andchemical (salinity, SiO4, total inorganic nitrogen) condi-tions existing along the northeastern Adriatic profile inwinter (Figure 2A) and in summer (Figure 2B). Accordingto MANOVA, stations were significantly different (Wilk’sF-tests4, p-0.05). The westernmost Istrian station Sj107 and the northernmost station Zi 012 differed mostlyfrom other stations in winter as well as in summer. Inwinter, hierarchical clustering provided differentiation
Brought to you by | University of VirginiaAuthenticated | 128.143.23.241
Download Date | 10/4/12 8:01 AM

294 D. Vilicic et al.: Phytoplankton composition in the NE Adriatic Sea
Article in press - uncorrected proof
Figure 3 Seasonal abundances of diatoms, dinoflagellates, and coccolithophorids along the Istria profile and in the Kvarner regionin the period 2001–2007.Data are maximum abundance in the 0–10 m layer (325 data). For station locations, see Figure 1.
between two groups of stations: 1) the western stationSj 107 and the northernmost Zi 012, which are greatlyinfluenced by northern Italian rivers; and 2) other Istrianand Kvarner stations. Station Sj 107 differed significantly(ANOVA F-tests4, p-0.05) from other stations based ondiatom abundance (stations Zi 052, Vv 034, and Ri 019).Among Istrian and Kvarner stations, the easternmostStation Cr 001 differed significantly (ANOVA F-tests4,p-0.05) from all other stations with regard to salinity,total inorganic nitrogen, and silicates. In stratified sum-mer conditions, the dissimilarity among stations otherthan Sj 107 and Zi 012 increased, clustering them intothree similar groups: 1) the western and northernmostarea (Stations Sj 107, Sj 209, Zi 012); 2) the southernmoststations (Vv 034 and Zi 052); and 3) the Kvarner areastations (Ri 011, Ri 019, Cr 001).
There was an approximately 6-fold decrease in theaverage abundance of diatoms from western stations(1.9=105 cells l-1) to southern and Kvarner stations
(3.1=104 cells l-1) (Table 1, Figure 3). Maximum abun-dance of diatoms at the western station Sj 107 (1.1=107
cells l-1) was approximately 20 times greater than atKvarner stations (6.1=105 cells l-1).
Average diatom abundance at all stations (1.4=105
cells l-1) was approximately 3 times greater than theabundance of dinoflagellates (4.5=104 cells l-1) andapproximately 5 times greater than the abundance ofcoccolithophorids (2.9=104 cells l-1).
Dinoflagellates had maximum abundance in spring andsummer (Figure 3). As major mixotrophs, they followedthe distribution of organic matter secreted by diatoms.Low abundances were found at most oligotrophic south-ern stations. The Kvarner region is influenced by the dis-charge of oligotrophic karstic waters, leading to relativelystable abundance of phytoplankton.
Coccolithophorid abundance was mostly highest inwinter and autumn (Figure 3). Average abundancesof other larger nanoflagellates ()5 mm size fraction),
Brought to you by | University of VirginiaAuthenticated | 128.143.23.241
Download Date | 10/4/12 8:01 AM
D. Vilicic et al.: Phytoplankton composition in the NE Adriatic Sea 295
Article in press - uncorrected proof
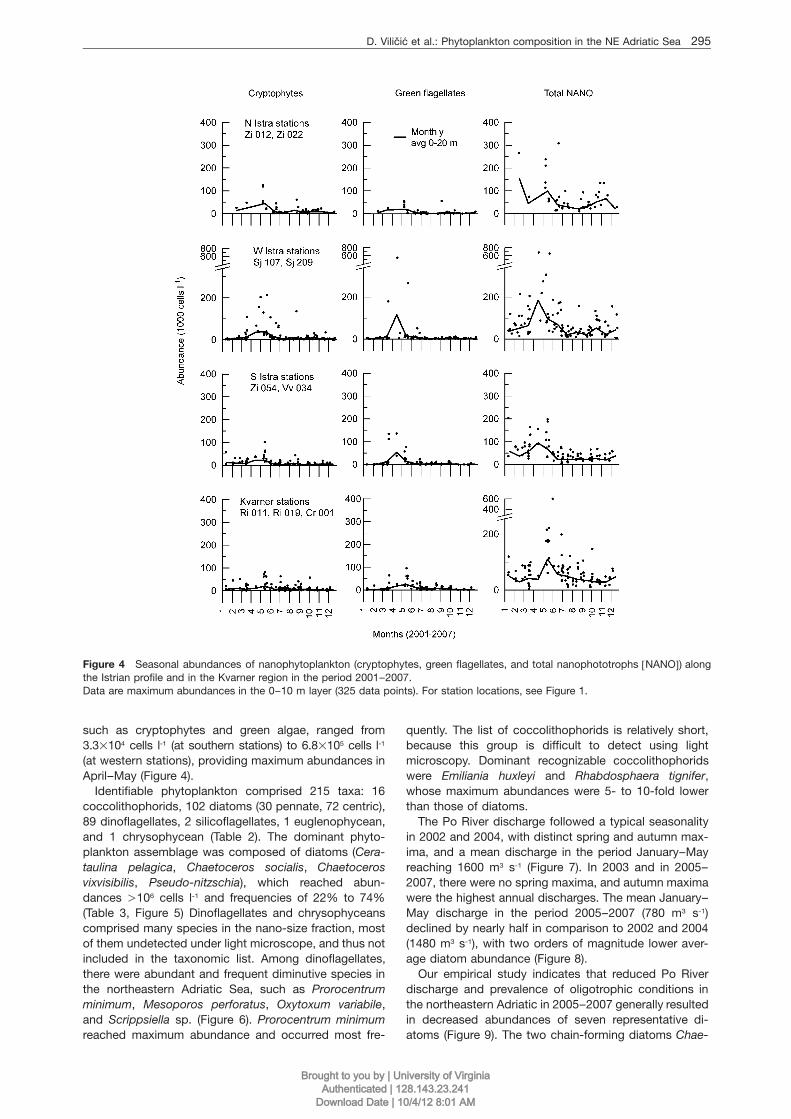
Figure 4 Seasonal abundances of nanophytoplankton (cryptophytes, green flagellates, and total nanophototrophs wNANOx) alongthe Istrian profile and in the Kvarner region in the period 2001–2007.Data are maximum abundances in the 0–10 m layer (325 data points). For station locations, see Figure 1.
such as cryptophytes and green algae, ranged from3.3=104 cells l-1 (at southern stations) to 6.8=105 cells l-1
(at western stations), providing maximum abundances inApril–May (Figure 4).
Identifiable phytoplankton comprised 215 taxa: 16coccolithophorids, 102 diatoms (30 pennate, 72 centric),89 dinoflagellates, 2 silicoflagellates, 1 euglenophycean,and 1 chrysophycean (Table 2). The dominant phyto-plankton assemblage was composed of diatoms (Cera-taulina pelagica, Chaetoceros socialis, Chaetocerosvixvisibilis, Pseudo-nitzschia), which reached abun-dances )106 cells l-1 and frequencies of 22% to 74%(Table 3, Figure 5) Dinoflagellates and chrysophyceanscomprised many species in the nano-size fraction, mostof them undetected under light microscope, and thus notincluded in the taxonomic list. Among dinoflagellates,there were abundant and frequent diminutive species inthe northeastern Adriatic Sea, such as Prorocentrumminimum, Mesoporos perforatus, Oxytoxum variabile,and Scrippsiella sp. (Figure 6). Prorocentrum minimumreached maximum abundance and occurred most fre-
quently. The list of coccolithophorids is relatively short,because this group is difficult to detect using lightmicroscopy. Dominant recognizable coccolithophoridswere Emiliania huxleyi and Rhabdosphaera tignifer,whose maximum abundances were 5- to 10-fold lowerthan those of diatoms.
The Po River discharge followed a typical seasonalityin 2002 and 2004, with distinct spring and autumn max-ima, and a mean discharge in the period January–Mayreaching 1600 m3 s-1 (Figure 7). In 2003 and in 2005–2007, there were no spring maxima, and autumn maximawere the highest annual discharges. The mean January–May discharge in the period 2005–2007 (780 m3 s-1)declined by nearly half in comparison to 2002 and 2004(1480 m3 s-1), with two orders of magnitude lower aver-age diatom abundance (Figure 8).
Our empirical study indicates that reduced Po Riverdischarge and prevalence of oligotrophic conditions inthe northeastern Adriatic in 2005–2007 generally resultedin decreased abundances of seven representative di-atoms (Figure 9). The two chain-forming diatoms Chae-
Brought to you by | University of VirginiaAuthenticated | 128.143.23.241
Download Date | 10/4/12 8:01 AM

296 D. Vilicic et al.: Phytoplankton composition in the NE Adriatic Sea
Article in press - uncorrected proof
Table 2 List of phytoplankton taxa (with maximum abundance )40 cells l-1) in the northeastern Adriatic Sea (along the Istrianpeninsula and in the Kvarner region; see Figure 1), during 2001–2007.
MAX Fr (%) AVG SD
CoccolithophoridsAcanthoica quattrospina Lohm. 2840 1.3 69.9 1138Anoplosolenia brasiliensis (Lohm.) Gerl. 4260 8.7 239.6 745Calciopappus caudatus Gaarder et Ramsfiell 1600 0.5 20.0 438Calciopappus rigidus Heimdal 8510 4.8 591.0 1974Calciosolenia murrayi Gran 17,030 3.8 228.0 2602Calyptrosphaera oblonga Lohm. 42,560 16.6 3015.3 5547Coccolithus pelagicus Wallich 4000 0.6 46.7 1244Coccolithus sp. 16,000 1.2 339.3 5244Emiliania huxleyi (Lohm.) Hay et Mohler 226,100 55.7 48999.6 25,926Halopappus adriaticus Schiller 3200 0.3 18.3 1514Ophiaster hydroideus (Gran) 8510 7.5 708.9 2091Ophiaster formosus Gran 3200 2.3 140.0 1082Rhabdosphaera stylifer Lohm. 12,800 0.6 155.0 4518Rhabdosphaera tignifer Schiller 62,430 49.7 12702.9 6905Scyphosphaera apsteinii Lohm. 1600 0.3 15.0 400Syracosphaera pulchra Lohm. 44,800 33.5 3316.9 3400
820Diatoms
Achnanthes brevipes Agardh 800 0.1 3.3 537Amphiprora sp. 14,190 2.1 145.7 2936Asterionellopsis glacialis (Castr.) Round 50,160 10.7 2267.8 7041Asteromphalus heptactis (Breb.) Ralfs. 1600 1.3 35.7 470Asteromphalus robustus Castr. 2840 0.2 12.6 106Bacillaria paxillifera (Mull.) Hendey 18,180 0.3 79.4 10,247Bacteriastrum delicatulum Cleve 28,400 6.0 371.4 3610Bacteriastrum hyalinum Lauder 10,600 2.4 170.3 2290Bacteriastrum mediterraneum Pav. 30,300 4.4 709.3 5476Bacteriastrum sp. 2270 0.6 20.7 1034Blakeleya notata (Grun.) Round 63,840 0.5 279.5 25,802Cerataulina pelagica (Cleve) Hendey 1,416,700 48.9 24778.3 89,332Cerataulus smithii Ralfs. 18,180 0.1 75.8 12,827Chaetoceros affinis Laud. 244,240 13.4 2767.8 20,306Chaetoceros anastomosans Grun. 198,520 3.1 1965.0 38,438Chaetoceros atlanticus Cleve 380 0.1 1.6 240Chaetoceros borealis Bailey 280 0.3 3.0 40Chaetoceros brevis Schutt 53,900 3.6 804.6 10,731Chaetoceros coarctatus Laud. 320 0.2 2.0 113Chaetoceros compressus Laud. 401,900 3.9 3504.3 63,001Chaetoceros convolutus Castr. 1520 2.3 33.0 369Chaetoceros costatus Pav. 72,960 2.2 1309.7 20,422Chaetoceros curvisetus Cleve 313,480 13.6 4757.3 29,707Chaetoceros dadayi Pav. 7580 0.2 36.3 4554Chaetoceros danicus Cleve 7580 9.5 352.5 1384Chaetoceros decipiens Cleve 99,090 22.9 2917.0 7301Chaetoceros densus (Cleve) Cleve 2270 0.9 27.4 701Chaetoceros didymus Ehrenb. 1890 0.1 7.9 1308Chaetoceros diversus Cleve 458,460 4.9 3098.1 63,378Chaetoceros eibenii Grun. 380 0.1 1.6 240Chaetoceros lauderi Ralfs 16,670 3.9 363.9 3485Chaetoceros lorenzianus Grun. 2460 0.7 41.3 924Chaetoceros messanensis Castr. 4550 0.9 40.5 1289Chaetoceros pseudocrinitus.Ostenf. 17,430 0.7 123.9 5956Chaetoceros pseudocurvisetus Mangin 1510 0.3 14.2 378Chaetoceros rostratus Laud. 65,260 8.3 1352.1 7906Chaetoceros simplex Ostenf. 11,360 1.4 152.3 2913Chaetoceros subtilis Cleve 380 0.2 3.2 40Chaetoceros socialis Laud. 1,030,920 27.8 60978.3 543,508Chaetoceros tenuissimus Meun. 40,750 1.3 477.1 10,873Chaetoceros throndsenii (Mar. Montr. Zing.) Mar. 40,750 7.7 2442.3 8287Chaetoceros tetrastichon Cleve 5680 1.3 54.2 1705Chaetoceros tortissimus Gran 85,120 3.5 1237.7 14,134Chaetoceros vixvisibilis Schiller 1,528,200 22.1 65608.2 154,491Chaetoceros wighamii Brightw. 7090 0.2 31.2 4731Chaetoceros sp. 683,230 14.6 14563.3 65,231Cocconeis scutellum Ehrenb. 380 0.1 1.6 240Coscinodiscus gigas Ehrenb. 120 0.1 0.5 57Coscinodiscus perforatus Ehrenb. 400 0.4 2.8 170
Brought to you by | University of VirginiaAuthenticated | 128.143.23.241
Download Date | 10/4/12 8:01 AM

D. Vilicic et al.: Phytoplankton composition in the NE Adriatic Sea 297
Article in press - uncorrected proof
(Table 2 continued)
MAX Fr (%) AVG SD
Coscinodiscus sp. 1420 3.1 30.0 292Cyclotella sp. 281,330 11.2 8610.7 37,114Cylindrotheca closterium (Ehrenb.) Reim. et Lewin 11,350 8.3 1003.3 2681Dactyliosolen blavyanus (Perag.) Hasle 800 0.2 3.9 537Dactyliosolen fragilissimus (Bergon) Hasle 246,240 27.1 4311.1 15,281Dactiyliosolen phuktensis (Sundstr.) Hasle 203,680 2.9 3685.3 44,265Detonula pumila (Castr.) Schuett 57,600 0.7 295.1 19,769Diploneis bombus Ehrenb. 8510 10.4 353.2 1069Diploneis sp. 1890 0.5 31.1 591Ditylum brightwellii (West) Grun. 41,420 1.4 563.7 15,404Eucampia cornuta (Cleve) Grun. 10,600 5.3 361.4 2302Eucampia zoodiacus Ehrenb. 380 0.2 2.6 99Guinardia flaccida (Castr.) Perag. 30,400 43.1 1214.5 1644Guinardia striata (Stolter.) Hasle 232,880 39.9 7585.9 13,700Gyrosigma balticum (Ehrenb.) Rabenh. 800 0.4 10.8 305Hemiaulus hauckii Grun. 14,400 42.3 1166.1 1005Hemiaulus sinensis Grev. 10,600 8.5 401.3 1425Lauderia annulata Cleve 1510 1.0 25.0 490Leptocylindrus adriaticus Schroeder 8000 0.4 53.3 3266Leptocylindrus danicus Cleve 73,780 35.8 9010.1 9971Leptocylindrus mediterraneus (Perag.) Hasle 19,000 14.7 790.2 1911Leptocylindrus minimus Gran 25,600 0.6 147.5 9139Licmophora ehrenbergii (Kuetz.) Grun. 570 0.1 2.4 375Licmophora sp. 190 0.4 1.5 67Lioloma pacificum (Cupp) Hasle 5680 9.1 293.0 886Nitzschia incerta Grun. 380 0.4 3.3 139Nitzschia insignis Greg. 1600 0.1 6.7 1103Nitzschia longissima (Breb.) Ralfs. 120,570 52.6 9063.7 8696Nitzschia lorenziana Grun. 760 0.2 4.0 403Nitzschia sicula (Castr.) Hust. 3030 4.3 122.6 641Nitzschia sp. 1600 0.4 10.0 686Odontella mobiliensis (Bail.) Grun. 80 0.1 0.3 28Paralia sulcata (Ehrenb.) Kutz. 6820 2.3 160.3 1504Pleurosigma angulatum (Quekett) W.Sm. 380 0.4 5.5 95Pleurosygma sp. 6060 17.9 368.5 762Proboscia alata (Brightw.) Sund. 51,200 61.1 3364.1 2787Pseudo-nitzschia spp.* 1,207,030 74.1 112624.2 104,038Pseudosolenia calcar-avis (Schultze) Sund. 1520 15.7 112.8 215Rhizosolenia alata f. indica (H.Perag.) Ostenf. 1190 1.1 10.4 300Rhizosolenia castracanei Perag. 200 0.2 1.6 7Rhizosolenia hebetata Bailey 1600 1.7 35.0 376Rhizosolenia imbricata Brightw. 7580 47.3 1028.4 602Rhizosolenia robusta Norm. 2840 8.7 37.0 289Skeletonema marinoi Sarno et Zingone 11,247,450 6.0 81675.9 1,491,737Stauroneis quarnerensis Grun. 380 0.2 3.2 240Striatella unipunctata (Lyngb.) Agardh 190 0.3 1.1 87Synedra toxoneides Castr. 1600 0.3 17.7 611Synedra sp. 2650 0.2 11.7 742Thalassionema nitzschioides Grun. 30,300 35.9 2176.4 2671Thalassionema frauenfeldii (Grun.) Hellegr. 12,800 9.2 407.4 1593Thalassiosira rotula Meunier 51,200 1.8 395.3 10,918Thalassiosira sp. 272,260 12.8 5430.6 28,626Thalassiothrix longissima Cleve et Grun. 800 0.8 9.4 258
DinoflagellatesAmphidinium sp. 2840 0.4 47.3 1261Brachydinium capitatum Taylor 40 0.1 0.2 12Ceratium candelabrum Ehrenb. 755 4.1 21.9 142Ceratium carriense var. volans (Cleve) Joerg. 380 0.8 4.2 120Ceratium contortum (Gourret) Cleve 40 0.1 0.2 12Ceratium extensum (Gourr.) Cleve 1600 7.2 36.8 209Ceratium falcatum (Kof.) Joerg. 380 0.4 2.1 170Ceratium furca (Efrenb.) Clap. et Lachm. 2400 22.4 172.6 255Ceratium fusus (Ehrenb.) Dujardin. 4000 21.6 201.1 360Ceratium gibberum Gourr. 40 0.1 0.2 12Ceratium hexacanthum Gourr. 380 0.9 3.7 113Ceratium horridum (Cleve) Gran 380 1.2 4.4 100Ceratium longirostrum Gourr. 40 0.2 0.3 23Ceratium macroceros (Ehrenb.) Cleve 40 0.3 0.5 20Ceratium massiliense (Gourr.) Karsten 1520 1.7 10.5 338
Brought to you by | University of VirginiaAuthenticated | 128.143.23.241
Download Date | 10/4/12 8:01 AM

298 D. Vilicic et al.: Phytoplankton composition in the NE Adriatic Sea
Article in press - uncorrected proof
(Table 2 continued)
MAX Fr (%) AVG SD
Ceratium pentagonum Gourr. 190 0.7 2.0 53Ceratium symmetricum Pav. 40 0.2 0.3 23Ceratium teres Kof. 760 0.2 3.3 509Ceratium trichoceros (Ehrenb.) Kof. 760 7.5 28.2 101Ceratium tripos (Muell.) Nitzsch. 1600 6.6 37.9 204Corythodinium constrictum Stein et Taylor 190 0.1 0.8 106Corythodinium tesselatum (Stein) Loeblich Jr. 760 0.2 3.5 509et Loeblich IIIDinophysis acuminata Clap. et Lachm.* 570 0.5 4.8 228Dinophysis acuta Ehrenb.* 40 0.1 0.2 23Dinophysis caudata Seville-Kent* 3200 2.3 35.0 679Dinophysis fortii Pav.* 1520 1.3 11.5 381Dinophysis hastata Stein 40 0.1 0.2 23Dinophysis parvula (Schuett) Joerg. Bal. 190 0.2 1.0 106Dinophysis rotundata (Clap. et Lachm.) Abe* 380 0.3 3.2 110Dinophysis sphaerica Stein 1520 0.6 11.3 510Diplopsalis ‘‘complex’’ 6060 7.0 162.8 877Dissodinium elegans Pav. 800 0.3 8.3 231Dissodinium obtusum (Pav.) Matz. 190 0.6 2.4 73Glenodinium sp. 1600 0.3 13.0 28Goniodoma polyedricum (Pouchet) Joerg. 1140 2.3 15.1 227Gonyaulax digitale Kof. 1520 0.2 7.1 940Gonyaulax fragilis (Schuett) Kof. 16,670 3.9 260.9 3010Gonyaulax hyalina Ostenf. et Schm. 3200 0.4 21.8 1430Gonyaulax polygramma Stein 6060 5.4 130.3 927Gonyaulax sp. 1520 2.2 56.3 448Gonyaulax verior Sournia 190 0.3 2.4 269Gymnodinium ‘‘simplex’’ (Lohm.) Kof. et Sw. 19,200 24.6 1291.1 1993Gymnodinium cucumis Schuett 800 0.1 3.3 922Gymnodinium sp. 16,670 16.9 705.3 1928Gyrodinium fusiformis Kof. et Sw. 1890 0.7 16.3 617Gyrodinium sp. 12,800 38.3 1378.7 1252Kofoidinium velleloides Pav. 570 2.5 15.5 142Lingulodinium polyedricum (Stein) Dodge* 1600 1.3 20.0 392Mesoporos perforatus (Gran) Lillick 19,870 8.3 1012.0 3636Ornithocercus magnificus Stein 1520 0.3 8.1 775Oxytoxum adriaticum Schiller 2840 0.4 19.9 1069Oxytoxum caudatum Schiller 3030 1.5 64.0 790Oxytoxum longum Schiller 3030 3.9 88.8 584Oxytoxum milneri Murr. et Whitt. 380 0.3 1.9 196Oxytoxum sceptrum (Stein) Schroeder 380 0.3 2.5 170Oxytoxum scolopax Stein 800 0.2 3.5 537Oxytoxum sphaeroideum Stein 5680 4.2 153.9 741Oxytoxum variabile Schiller 12,800 12.8 24.3 2093Podolampas bipes Stein 40 0.1 0.2 23Podolampas elegans Schuett 760 0.2 4.0 403Podolampas palmipes Stein 380 1.2 7.8 145Prorocentrum compressum (Bailey) Abe 1520 4.3 58.4 293Prorocentrum dentatum Stein 4260 1.2 48.8 1738Prorocentrum micans Ehrenb. 7200 22.3 523.0 722Prorocentrum minimum (Pav.) Schiller* 321,520 11.8 3073.7 28,092Prorocentrum scutellum Schroeder 380 0.3 3.3 1396Prorocentrum vaginulum (Ehrenb.) Dodge 9930 2.0 220.5 2480Prorocentrum sp. 5680 1.2 96.3 1626Prorocentrum triestinum Schiller 11,350 10.2 720.6 1912Pseliodinium vaubanii Sournia 1520 2.7 27.0 338Pyrocystis noctiluca Murray ex Haeckel 40 0.1 0.2 23Scrippsiella sp. 17,030 19.9 955.3 1786Spatulodinium pseudonoctiluca (Pouchet) 2840 1.6 35.1 842Cachon et Cachon 134
Heterotrophic dinoflagellates 28Hermesinum adriaticum Zacharias 1600 1.3 43.0 561Noctiluca scintillans (Macartney) Ehrenb. 160 0.7 2.2 42Pronoctiluca acuta (Lohm.) Schiller 5680 0.8 43.6 327Protoperidinium diabolus (Cleve) Bal. 380 0.1 1.6 240Protoperidinium divergens (Ehrenb.) Bal. 1520 3.7 37.2 292Protoperidinium globulus (Stein) Bal. 1520 3.4 64.9 389Protoperidinium maranense Tolomio 2840 1.4 24.0 489Protoperidinium oceanicum (Vanhoeffen) Bal. 760 1.1 9.1 224
Brought to you by | University of VirginiaAuthenticated | 128.143.23.241
Download Date | 10/4/12 8:01 AM

D. Vilicic et al.: Phytoplankton composition in the NE Adriatic Sea 299
Article in press - uncorrected proof
(Table 2 continued)
MAX Fr (%) AVG SD
Protoperidinium pallidum (Ostenf.) Bal. 380 0.1 1.6 240Protoperidinium pellucidum Bergh 190 0.3 1.1 87Protoperidinium pyriforme (Pauls.) Bal. 2840 0.9 21.2 847Protoperidinium steinii (Joerg.) Bal. 2270 5.7 125.6 507Protoperidinium tubum (Schiller) Bal. 1520 3.2 49.2 296
1478Euglenophytes 2412
Eutreptia lanowii Steuer 8510 1.9 102.7 181728
Silicoflagellates 194Dictyocha fibula Ehrenb. 3030 14.5 253.5 462Dictyocha speculum Ehrenb. 2840 4.5 63.1 416
28Chrysophyceae
Dinobryon sp. 6820 0.6 106.3 2461
Total number of sampless1114.MAX, maximum abundance; Fr, frequency of appearance; AVG, average abundance; SD, standard deviation.* Toxic and potentially toxic species.
Table 3 Dominant phytoplankton species in the northeastern Adriatic Sea, with maximum abundance )104 cells l-1 and frequencyof appearance )10% of samples.
Taxa MAX Fr (%) AVG SD
CoccolithophoridsCalyptrosphaera oblonga Lohm. 42,560 16.6 3015 5547Emiliania huxleyi (Lohm.) Hay et Mohler 226,100 55.7 49,000 25,926Rhabdosphaera tignifer Schiller 62,430 49.7 12,703 6905Syracosphaera pulchra Lohm. 44,800 33.5 3317 3400
DiatomsAsterionellopsis glacialis (Castr.) Round 50,160 10.7 2268 7041Cerataulina pelagica (Cleve) Hendey 1,416,700 48.9 24,778 89,332Chaetoceros affinis Laud. 244,240 13.4 2768 20,306Chaetoceros curvisetus Cleve 313,480 13.6 4757 29,707Chaetoceros decipiens Cleve 99,090 22.9 2917 7301Chaetoceros socialis Laud. 1,030,920 27.8 60,978 543,508Chaetoceros vixvisibilis Schiller 1,528,200 22.1 65,608 154,491Cyclotella sp. 281,330 11.2 8611 37,114Dactyliosolen fragilissimus (Bergon) Hasle 246,240 27.1 4311 15,281Guinardia flaccida (Castr.) Perag. 30,400 43.1 1214 1644Guinardia striata (Stolter.) Hasle 232,880 39.9 7586 13,700Hemiaulus hauckii Grun. 14,400 42.3 1166 1005Leptocylindrus danicus Cleve 73,780 35.8 9010 9971Leptocylindrus mediterraneus (Perag.) Hasle 19,000 14.7 790 1911Nitzschia longissima/Cylindrotheca closterium 120,570 52.6 9064 8696Proboscia alata (Brightw.) Sund. 51,200 61.1 3364 2787Pseudo-nitzschia spp. 1,207,030 74.1 112,624 104,038Thalassionema nitzschioides Grun. 30,300 35.9 2176 2671Thalassiosira sp. 272,260 12.8 5431 28,626
DinoflagellatesOxytoxum variabile Schiller 12,800 12.8 1118 2093Gymnodinium ‘‘simplex’’ (Lohm.) Kof. et Sw. 19,200 24.6 1291 1993Gymnodinium sp. 16,670 16.9 705 1928Gyrodinium sp. 12,800 38.3 1379 1252Prorocentrum minimum (Pav.) Schiller 321,520 11.8 3074 28,092Prorocentrum triestinum Schiller 11,350 10.2 721 1912Scrippsiella sp. 17,030 19.9 955 1786
Analysis was performed on 1114 Niskin samples in the period 2001–2007.MAX, maximum abundance; Fr, frequency of appearance; AVG, average abundance; SD, standard deviation.
toceros tetrastichon and Thalassiosira spp. becameincreasingly abundant in 2005–2007. Cyclotella andChaetoceros abundances were significantly correlatedwith the Po River discharge (Spearman’s rank correlationtest, p-0.01), while other diatoms were not correlated(Table 4).
Discussion
Different sources of nutrients are evident along the north-eastern Adriatic coastal trophic gradient. Po River out-flows and meteorological factors are the main agentstriggering the alternation of stratification and mixing of
Brought to you by | University of VirginiaAuthenticated | 128.143.23.241
Download Date | 10/4/12 8:01 AM

300 D. Vilicic et al.: Phytoplankton composition in the NE Adriatic Sea
Article in press - uncorrected proof
Figure 5 Most abundant and most frequent phytoplankton(diatoms) in the northeastern Adriatic Sea.(A) Chaetoceros socialis, (B) Chaetoceros vixvisibilis, (C) Pseudo-nitzschia sp., and (D) Cerataulina pelagica.
Figure 6 Phytoplankton, other than diatoms that were relativelyabundant and frequent in the northeastern Adriatic Sea.Coccolithophorids: (A) Emiliania huxleyi; small dinoflagellates: (B)Prorocentrum minimum, (C) Mesoporos perforatus, (D) Oxytox-um variabile, and (E) Scrippsiella sp.the water column that strongly affect the trophic status
of the northern basin (Socal et al. 2008). The easternbasin is mostly influenced by oligotrophic sources ofnutrients, such as karstic rivers and the Eastern AdriaticCurrent (Vilicic et al. 2008). There is a close coupling ofphysical and biological processes over a range of spaceand time scales in the northern Adriatic Sea (Spillman etal. 2007). Episodes of strong north winds (bora) may ini-tiate a double-gyre system (mostly in winter): a cyclonicgyre in the Gulf of Trieste, an anticyclonic gyre off west-ern Istria (Kuzmic et al. 2006, Lyons et al. 2007, Pullenet al. 2007), and the formation of the Istrian CoastalCounter Current which transfers water enriched withnutrients from the Po River close to the Istrian coast(Supic et al. 2000), resulting in higher productivity (atstations Zi 012, Zi 022 and occasionally at Sj 209).
Stations Sj 209 and Vv 034 are situated in the areawith most frequent influence of EAC coming from thesouth. Salinity at stations Sj 107, Zi 012, and Cr 001differed significantly (ANOVA F-tests4, p-0.05) fromother stations. There were significant differences (ANOVAF-tests4, p-0.05) in diatom abundance between StationSj 107 and Zi 012, Vv 0 34, and Ri 019. The easternmostStation Cr 001 differed significantly from stationsZi 052, Vv 034, and Ri 011 in terms of salinity and from
stations Zi 022, Sj 209, Zi 052, and Vv 034 in terms ofnanoplankton.
The greatest abundances of diatoms at the westernstation Sj 107 were found in winter and spring, with Ske-letonema marinoi dominating in February 2004, andChaetoceros vixvisibilis in May 2002. The first peak prob-ably coincided with an increase in day length, and thesecond with the greatest nutrient inflow from the Po River(Figure 3). At station Sj 107, other abundant diatomswere recorded, such as Chaetoceros socialis (November2003) and Pseudo-nitzschia (May 2002, October 2007).Abundance of diatoms was significantly correlated withphosphorus (r2s0.4, p-0.01, Table 5), which is the mainlimiting nutrient in this region (Maestrini et al. 1997,Vukic-Lusic et al. 2008).
Phytoplankton seasonality was directly proportional tothe annual regime of the Po River influx. In the period2002–2004, the high winter-spring Po River freshwaterinputs were accompanied by spring phytoplankton max-ima. However, in the period 2005–2007, there was a shiftin the timing of the annual Po River maximum discharge,and phytoplankton maxima moved from spring toautumn. The trend of autumnal highest Po discharge and
Brought to you by | University of VirginiaAuthenticated | 128.143.23.241
Download Date | 10/4/12 8:01 AM

D. Vilicic et al.: Phytoplankton composition in the NE Adriatic Sea 301
Article in press - uncorrected proof
Figure 7 Seasonal variability in Po River inflow 2002–2007.
highest chlorophyll a biomass has been recorded since1993 (Supic et al. 2006).
Maximum phytoplankton abundances were commonat western stations and along the Western Adriatic Cur-rent (WAC). The ratio between the large ()20 mm) andsmall (-20 mm) phytoplankton biomass shows that theWAC is not only a physical frontal structure but also asystem where larger phytoplankton grow inshore, whilesmaller ones are present offshore (Polimene et al. 2006).The shift in phytoplankton composition has been foundacross the frontal zone near the Po, where diatom-dominated and phytoflagellate-dominated areas wereseparated by the front (Mangoni et al. 2008). Minimumabundances at oligotrophic southern stations were com-pensated for by a greater contribution of nanoplanktonin total primary biomass. Average contribution of nano-and picophototrophs in the total phytoplankton chloro-phyll biomass at western stations, including those close
to the Po, amount to 43% and 38%, respectively (Radicet al. 2009). At southern stations this contribution mightpossibly be larger. The small warm-water dinoflagellateOxytoxum variabile is a common tracer of the EAC(Figure 6D).
The northwestern stations Sj 107 and Zi 012 are rela-tively isolated, due to the greater Po River influence(Figure 2). On the other hand, the southwestern stationZi 209 is isolated, likely due to its position in the transitionarea where the influences of the EAC and northern Adri-atic less saline water frequently change. The southern-most stations Vv 034 and Zi 052 were mostly influencedby the EAC. In winter, these stations were more similardue to bora forcing and mixing of the water column alongthe eastern coast.
The creation of a list of dominant phytoplankton taxa,prepared on the basis of maximum abundance andfrequency of appearance, is a suitable approach for
Brought to you by | University of VirginiaAuthenticated | 128.143.23.241
Download Date | 10/4/12 8:01 AM

302 D. Vilicic et al.: Phytoplankton composition in the NE Adriatic Sea
Article in press - uncorrected proof
Figure 8 Correlation between Po River average inflow and di-atom abundance at station Sj 107 in spring (January–May)2002–2007.
Figure 9 Diatoms with increasing and decreasing annual max-imum abundances along the Istria profile in the period2002–2007.Ch, Chaetoceros; Ch tetra, Chaetoceros tetrastichon; Dact frag,Dactyliosolen fragilissimus; Cyclo, Cyclotella spp.; Nitz/Cylindro,Nitzschia/Cylindrotheca; Pseudo, Pseudo-nitzschia spp.; Skele-to, Skeletonema marinoi; Thal, Thalassiosira spp.
Table 4 Spearman rank correlation coefficients between annual average Po River inflow and annual maximum abundances of eightdiatoms over six years (2002–2007).
Ch spp. Cyclo Dact frag Nitz/Cylindro Pseudo Skeleto Ch tetra Thal
Po inflow 0.80* 0.94** 0.77 0.62 0.72 0.59 -0.67 -0.61
Correlations in bold font are significant at p-0.05 (*) and p-0.01 (**).For names of taxa, see legend to Figure 9.
comparing assemblages within particular environments.Unfortunately, such data are mostly unavailable in otherregions of the Mediterranean Sea and cannot be used forsuccessful comparison.
In comparison to the shallow western part of the Adri-atic, there are many fewer nanoplanktonic diatoms in thedeeper eastern side. The diatoms Skeletonema, Pseudo-nitzschia, Leptocylindrus, and the dinoflagellate Proro-centrum minimum are abundant in more eutrophicatedwaters (Blanc and Leveau 1970, Pucher-Petkovic andMarasovic 1980, Spies and Parsons 1985, Ignatiadeset al. 1986, Heil et al. 2005), thus appearing in low abun-dances in the EAC. Skeletonema, Pseudo-nitzschia, andChaetoceros are diatoms that remain convincing indica-tors of nutrient influx in the Adriatic Sea. Diatoms, suchas Chaetoceros, are typical inhabitants of nutrient richwaters (Aizawa et al. 2005). The empirical correlationbetween river discharge and appearance/disappearanceof some diatoms in the northern Adriatic Sea may be theresult of various influences, such as circulation, nutrientdistribution or grazing, which are again indirectly regu-lated by the river discharge.
In contrast to other representatives of Chaetoceros,Ch. tetrastichon (Figure 9) is able to survive in thenutrient-limited regions when associated with the tintin-
nid Eutintinnus. The cells of Ch. tetrastichon are char-acterized by the presence of chloroplasts in the setaewhich increase the photosynthetic capacity and the sur-face area for nutrient uptake (Hernandez-Becerril 1992).
Brought to you by | University of VirginiaAuthenticated | 128.143.23.241
Download Date | 10/4/12 8:01 AM
D. Vilicic et al.: Phytoplankton composition in the NE Adriatic Sea 303
Article in press - uncorrected proof
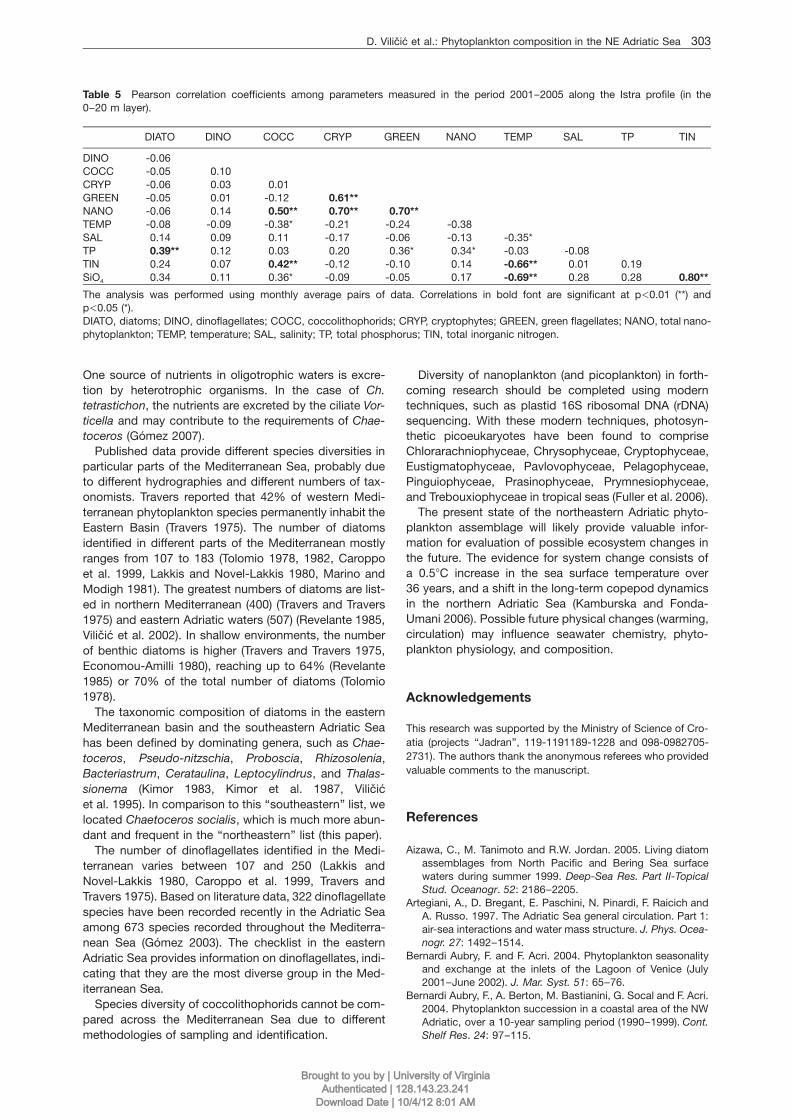
Table 5 Pearson correlation coefficients among parameters measured in the period 2001–2005 along the Istra profile (in the0–20 m layer).
DIATO DINO COCC CRYP GREEN NANO TEMP SAL TP TIN
DINO -0.06COCC -0.05 0.10CRYP -0.06 0.03 0.01GREEN -0.05 0.01 -0.12 0.61**NANO -0.06 0.14 0.50** 0.70** 0.70**TEMP -0.08 -0.09 -0.38* -0.21 -0.24 -0.38SAL 0.14 0.09 0.11 -0.17 -0.06 -0.13 -0.35*TP 0.39** 0.12 0.03 0.20 0.36* 0.34* -0.03 -0.08TIN 0.24 0.07 0.42** -0.12 -0.10 0.14 -0.66** 0.01 0.19SiO4 0.34 0.11 0.36* -0.09 -0.05 0.17 -0.69** 0.28 0.28 0.80**
The analysis was performed using monthly average pairs of data. Correlations in bold font are significant at p-0.01 (**) andp-0.05 (*).DIATO, diatoms; DINO, dinoflagellates; COCC, coccolithophorids; CRYP, cryptophytes; GREEN, green flagellates; NANO, total nano-phytoplankton; TEMP, temperature; SAL, salinity; TP, total phosphorus; TIN, total inorganic nitrogen.
One source of nutrients in oligotrophic waters is excre-tion by heterotrophic organisms. In the case of Ch.tetrastichon, the nutrients are excreted by the ciliate Vor-ticella and may contribute to the requirements of Chae-toceros (Gomez 2007).
Published data provide different species diversities inparticular parts of the Mediterranean Sea, probably dueto different hydrographies and different numbers of tax-onomists. Travers reported that 42% of western Medi-terranean phytoplankton species permanently inhabit theEastern Basin (Travers 1975). The number of diatomsidentified in different parts of the Mediterranean mostlyranges from 107 to 183 (Tolomio 1978, 1982, Caroppoet al. 1999, Lakkis and Novel-Lakkis 1980, Marino andModigh 1981). The greatest numbers of diatoms are list-ed in northern Mediterranean (400) (Travers and Travers1975) and eastern Adriatic waters (507) (Revelante 1985,Vilicic et al. 2002). In shallow environments, the numberof benthic diatoms is higher (Travers and Travers 1975,Economou-Amilli 1980), reaching up to 64% (Revelante1985) or 70% of the total number of diatoms (Tolomio1978).
The taxonomic composition of diatoms in the easternMediterranean basin and the southeastern Adriatic Seahas been defined by dominating genera, such as Chae-toceros, Pseudo-nitzschia, Proboscia, Rhizosolenia,Bacteriastrum, Cerataulina, Leptocylindrus, and Thalas-sionema (Kimor 1983, Kimor et al. 1987, Vilicicet al. 1995). In comparison to this ‘‘southeastern’’ list, welocated Chaetoceros socialis, which is much more abun-dant and frequent in the ‘‘northeastern’’ list (this paper).
The number of dinoflagellates identified in the Medi-terranean varies between 107 and 250 (Lakkis andNovel-Lakkis 1980, Caroppo et al. 1999, Travers andTravers 1975). Based on literature data, 322 dinoflagellatespecies have been recorded recently in the Adriatic Seaamong 673 species recorded throughout the Mediterra-nean Sea (Gomez 2003). The checklist in the easternAdriatic Sea provides information on dinoflagellates, indi-cating that they are the most diverse group in the Med-iterranean Sea.
Species diversity of coccolithophorids cannot be com-pared across the Mediterranean Sea due to differentmethodologies of sampling and identification.
Diversity of nanoplankton (and picoplankton) in forth-coming research should be completed using moderntechniques, such as plastid 16S ribosomal DNA (rDNA)sequencing. With these modern techniques, photosyn-thetic picoeukaryotes have been found to compriseChlorarachniophyceae, Chrysophyceae, Cryptophyceae,Eustigmatophyceae, Pavlovophyceae, Pelagophyceae,Pinguiophyceae, Prasinophyceae, Prymnesiophyceae,and Trebouxiophyceae in tropical seas (Fuller et al. 2006).
The present state of the northeastern Adriatic phyto-plankton assemblage will likely provide valuable infor-mation for evaluation of possible ecosystem changes inthe future. The evidence for system change consists ofa 0.58C increase in the sea surface temperature over36 years, and a shift in the long-term copepod dynamicsin the northern Adriatic Sea (Kamburska and Fonda-Umani 2006). Possible future physical changes (warming,circulation) may influence seawater chemistry, phyto-plankton physiology, and composition.
Acknowledgements
This research was supported by the Ministry of Science of Cro-atia (projects ‘‘Jadran’’, 119-1191189-1228 and 098-0982705-2731). The authors thank the anonymous referees who providedvaluable comments to the manuscript.
References
Aizawa, C., M. Tanimoto and R.W. Jordan. 2005. Living diatomassemblages from North Pacific and Bering Sea surfacewaters during summer 1999. Deep-Sea Res. Part II-TopicalStud. Oceanogr. 52: 2186–2205.
Artegiani, A., D. Bregant, E. Paschini, N. Pinardi, F. Raicich andA. Russo. 1997. The Adriatic Sea general circulation. Part 1:air-sea interactions and water mass structure. J. Phys. Ocea-nogr. 27: 1492–1514.
Bernardi Aubry, F. and F. Acri. 2004. Phytoplankton seasonalityand exchange at the inlets of the Lagoon of Venice (July2001–June 2002). J. Mar. Syst. 51: 65–76.
Bernardi Aubry, F., A. Berton, M. Bastianini, G. Socal and F. Acri.2004. Phytoplankton succession in a coastal area of the NWAdriatic, over a 10-year sampling period (1990–1999). Cont.Shelf Res. 24: 97–115.
Brought to you by | University of VirginiaAuthenticated | 128.143.23.241
Download Date | 10/4/12 8:01 AM

304 D. Vilicic et al.: Phytoplankton composition in the NE Adriatic Sea
Article in press - uncorrected proof
Bernardi Aubry, F., F. Acri, M. Bastianini, F. Bianchi, D. Cassin,A. Pugnetti and G. Socal. 2006. Seasonal and interannualvariations of phytoplankton in the Gulf of Venice (NorthernAdriatic Sea). Chem. Ecol. 22: 71–91.
Blanc, F. and M. Leveau. 1970. Eco-physiologie des populationsphytoplanctoniques dans des milieux eutrophiques. Tethys 2:321–328.
Caroppo, C. 2000. The contribution of picophytoplankton tocommunity structure in a Mediterranean brackish environ-ment. J. Plankton Res. 22: 381–397.
Caroppo, C., A. Fiocca, P. Sammarco and G. Magazu. 1999.Seasonal variations of nutrients and phytoplankton in thecoastal SW Adriatic Sea (1995–1997). Bot. Mar. 42: 389–400.
Chiaudani, G., R. Marchetti and M. Vighi. 1980. Eutrophicationin Emilia-Romagna coastal waters (North Adriatic Sea, Italy):a case history. Progr. Water Technol. 12: 185–192.
Degobbis, D. and M. Gilmartin. 1990. Nitrogen, phosphorus, andbiogenic silicon budgets for the northern Adriatic Sea. Ocea-nol. Acta 13: 31–45.
Degobbis, D., M. Gilmartin and N. Revelante. 1986. An annotat-ed nitrogen budget calculation for the northern Adriatic Sea.Mar. Chem. 20: 159–177.
Dorman, C.E., S. Carniel, L. Cavaleri, M. Sclavo, J. Chiggiato, J.Doyle, et al. 2006. February 2003 marine atmospheric con-ditions and the bora over the northern Adriatic. J. Geophys.Res. 111: C03S03.
Economou-Amilli, A. 1980. Marine diatoms from Greece. I. Di-atoms from the Saronicos Gulf. Nova Hedwigia 32: 63–104.
Franco, P. and A. Michelato. 1992. Northern Adriatic Sea: ocean-ography of the basin proper and the western coastal zone.Sci. Tot. Environ. (Suppl.) 1992: 35–62.
Fuller, N.J., G.A. Tarran, D.G. Cummings, E.M.S. Woodward,K.M. Orcutt, M. Yallop, et al. 2006. Molecular analysis ofphotosynthetic picoeukaryote community structure along anArabian Sea transect. Limnol. Oceanogr. 51: 2502–2514.
Gacic, M., P.M. Poulain, M. Zore-Armanda and V. Barale. 2001.Overview to the Adriatic Sea. In: (B. Cushman-Roisin, M.Gacic, P.-M. Poulain and A. Artegiani, eds) Physical ocean-ography of the Adriatic Sea. Kluwer, Dordrecht. pp. 1–44.
Giordani, P., S. Miserocchi, V. Balboni, A. Malaguti, R. Lorenzelli,G. Honsel, et al. 1997. Factors controlling trophic conditionsin the North-West Adriatic basin: seasonal variability. Mar.Chem. 58: 351–360.
Gomez, F. 2003. Checklist of Mediterranean free-living dinoflag-ellates. Bot. Mar. 46: 215–242.
Gomez, F. 2007. On the consortium of the tintinnid Eutintinnusand the diatom Chaetoceros in the Pacific Ocean. Mar. Biol.151:1899–1906.
Harding, L.W. Jr., D. Degobbis and R. Precali. 1999. Productionand fate of phytoplankton: annual cycles and interannual var-iability. In: (T. Malone, A. Malej, L.W. Harding Jr., N. Smodlakaand E. Turner, eds) Ecosystems at the land-sea margin: drain-age basin to coastal sea. Coastal and Estuarine Studies 55,AGU, Washington DC. pp. 131–172.
Hasle, G.R. 1978a. Using the inverted microscope. In: (A. Sour-nia, ed) Phytoplankton manual. UNESCO, Paris. pp. 191–196.
Hasle, G.R. 1978b. Some specific preparations: diatoms. In: (A.Sournia, ed) Phytoplankton manual. UNESCO, Paris.pp. 136–142.
Heil, C.A., P.M. Glibert and C. Fan. 2005. Prorocentrum minimum(Pavillard) Schiller a review of a harmful algal bloom speciesof growing worldwide importance. Harm. Algae 4: 449–470.
Hernandez-Becerril, D.U. 1992. Observations on two closelyrelated species, Chaetoceros tetrastichon and C. dadayi(Bacillariophyceae). Nord. J. Bot. 12: 365–371.
Honsell, G. 1993. First report of Alexandrium minutum inNorthern Adriatic waters (Mediterranean Sea). In: (T. Smaydaand Y. Shimizu, eds) Toxic phytoplankton blooms in the sea.Elsevier, Amsterdam. pp. 127–132.
Honsell, G. and M. Cabrini. 1990. Il fitoplancton durante il ‘‘maresporco’’ dell’agosto 1988 nel golfo di Trieste (Adriatico set-tentrionale). Boll. Soc. Adriat. Sci. 72: 1–14.
Honsell, G., L. Boni, M. Cabrini and M. Pompei. 1992. Toxic orpotentially toxic dinoflagellates from the Northern AdriaticSea. Sci. Tot. Environ. (Suppl.) 1992: 107–114.
Ignatiades, L., K. Pagou, A. Vassiliou. 1986. Long term responseof six diatom species to eutrophication. Oceanol. Acta 9:449–456.
Jeffries, M.A. and C.M. Lee. 2007. A climatology of the northernAdriatic Sea’s response to bora and river forcing. J. Geophys.Res. 112: C03S02.
Kamburska, L. and S. Fonda-Umani. 2006. Long-term copepoddynamics in the Gulf of Trieste (northern Adriatic Sea).Recent changes and trends. Climate Res. 31: 195–203.
Kimor, B. 1983. Distinctive features of the plankton of the east-ern Mediterranean. Ann. Inst. Oceanogr. Paris 59: 97–106.
Kimor, B., T. Berman and A. Schneller. 1987. Phytoplanktonassemblages in the deep chlorophyll maximum layers off theMediterranean coast of Israel. J. Plankton Res. 9: 433–443.
Krsinic, F. 1995. Changes in the microzooplankton assemblagesin the northern Adriatic Sea during 1989 to 1992. J. PlanktonRes. 17: 935–953.
Kuzmic, M., I. Janekovic, J.W. Book, P.J. Martin and J.D. Doyle.2006. Modeling the northern Adriatic double-gyre responseto intense bora wind: a revisit. J. Geophys. Res. 111:C03S13.
Lakkis, S. and V. Novel-Lakkis. 1980. Composition, annual cycleand species diversity of the phytoplankton in Lebanesecoastal water. J. Plankton Res. 3: 123–136.
Lee, C.M., F. Askari, J. Book, S. Carniel, B. Cushman-Roisin, C.Dorman, et al. 2005. Northern Adriatic response to a winter-time bora wind event. EOS, Trans. Am. Geophys. Union 86:157–165.
Lyons, D.M., N. Supic and N. Smodlaka. 2007. Geostrophic cir-culation patterns in the northeastern Adriatic Sea and theeffects of air-sea coupling: May–September 2003. J. Geo-phys. Res. 112: C03S08.
Maestrini, S.Y., B.R. Berland, M. Breret, C. Bechemin, R. Oilettiand A. Rinaldi. 1997. Nutrients limiting the algal growthpotential in the Po River plume and an adjacent area, north-west Adriatic Sea: enrichment bioassays with the test algaeNitzschia closterium and Thalassiosira pseudonana. Estuaries20: 416–429.
Mangoni, O., M. Modigh, P. Mozetic, A. Bergamasco, P. Rivaroand V. Saggiomo. 2008. Structure and photosynthetic prop-erties of phytoplankton assemblages in a higher dynamicsystem, the northern Adriatic Sea. Estuar. Coast. Shelf Sci.77: 633–644.
Marino, D. and M. Modigh. 1981. An annotated check-list ofplanktonic diatoms from the Gulf of Naples. P.S.Z.N.I. Mar.Ecol. 2: 317–333.
Mauri, E., P.M. Poulain, Z. Juznic-Zonta. 2007. MODIS chloro-phyll variability in the northern Adriatic sea and relationshipwith forcing parameters. J. Geophys. Res. 112: C03S11.
Mozetic, P., S. Fonda Umani, B. Cataletto and A. Malej. 1998.Seasonal and inter-annual planktonvariability in the Gulf ofTrieste (northern Adriatic). ICES J. Mar. Sci. 55: 711–722.
Orlic, M., M. Gacic and P.E. Laviolette. 1992. The currents andcirculation of the Adriatic Sea. Oceanol. Acta 15: 109–124.
Polimene, L., N. Pinardi, M. Zavatarelli and S. Colella. 2006. TheAdriatic Sea ecosystem seasonal cycle: validation of a three-dimensional numerical model. J. Geophys. Res. 111:C03S19.
Poulain, P.M. 1999. Drifter observations of surface circulation inthe Adriatic Sea between December 1994 and March 1996.J. Mar. Syst. 20: 231–253.
Pucher-Petkovic, T. and I. Marasovic. 1980. Developpment despopulations phytoplanctoniques caracteristiques pour unmilieu eutrophise (Baie de Kastela, Adriatique centrale). ActaAdriat. 21: 79–93.
Brought to you by | University of VirginiaAuthenticated | 128.143.23.241
Download Date | 10/4/12 8:01 AM

D. Vilicic et al.: Phytoplankton composition in the NE Adriatic Sea 305
Article in press - uncorrected proof
Pullen, J., J.D. Doyle, T. Haack, C. Dorman, R.P. Signell and C.M.Lee. 2007. Bora event variability and the role of air-sea feed-back. J. Geophys. Res. 112: C03S18.
Radic, T., T. Silovic, D. Santic, D. Fuks and M. Micic. 2009. Pre-liminary flow cytometric analyses of phototrophic pico- andnanoplankton communities in the northern Adriatic. FreseniusEnviron. Bull. 18: 715–724.
Raicich, F. 1996. On the fresh water balance of the Adriatic Sea.J. Mar. Syst. 9: 305–319.
Revelante, N. 1985. A catalogue of phytoplankton reported forthe Rovinj area of the northern Adriatic. Thalass. Jugosl. 21:139–169.
Revelante, N. and M. Gilmartin. 1980. Microplankton diversityindices as indicators of eutrophication in the northern Adri-atic Sea. Hydrobiologia 70: 277–286.
Revelante, N., W.T. Williams and M. Gilmartin. 1984. A numericalassessment of the temporal and spatial distribution of phy-toplankton assemblages in the northern Adriatic Sea. J. Exp.Mar. Biol. Ecol. 77: 137–150.
Sidari, L., S. Cok, M. Cabrini, A. Tubaro and G. Honsell. 1995.Temporal distribution of toxic phytoplankton in the Gulf ofTrieste (northern Adriatic Sea) in 1991 and 1992. In: (P. Las-sus, G. Arzul, P. Erard and C. Marcaillou, eds) Harmful marinealgal blooms, technique et documentation. Lavoisier Inter-cept, Paris. pp. 231–236.
Smodlaka, N. 1986. Primary production of the organic matter asan indicator of the eutrophication in the northern AdriaticSea. Sci. Tot. Environ. 56: 211–220.
Socal, G., F. Acri, F.M. Bastianini, F. Bernardi Aubry, F. Bianchi,D. Cassin, et al. 2008. Hydrological and biogeochemicalfeatures of the Northern Adriatic Sea in the period 2003–2006. Mar. Ecol. 29: 449–468.
Spies, A. and T.R. Parsons. 1985. Estuarine microplankton: anexperimental approach in combination with field studies. J.Exp. Mar. Biol. Ecol. 92: 63–82.
Spillman, C.M., J. Imberger, D.P. Hamilton, M.R. Hipsey and J.R.Romero. 2007. Modelling the effects of Po River discharge,internal nutrient cycling and hydrodynamics on biogeoche-mistry of the northern Adriatic Sea. J. Mar. Syst. 68: 167–200.
Strickland, J.D.H. and T.R. Parsons. 1972. A practical handbookof seawater analysis, 2nd edn. Bull. Fish. Res. B. Canada167: 1–310.
Supic, N., M. Orlic and D. Degobbis. 2000. Istrian coastal count-er current and its year-to-year variability. Estuar. Coast. ShelfSci. 50: 385–397.
Supic, N., T. Djakovac, V. Krajcar, M. Kuzmic and R. Precali.2006. Effects of excessive Po river discharges in the northernAdriatic. Fresenius Environ. Bull. 15: 193–199.
Tolomio, C. 1978. Catalogo delle diatomee e delle peridinee piusignificative segnalate nelle acque salmastre italiane. Mem.Biol. Mar. Ocean. 8: 129–150.
Tolomio, C. 1982. Ricerche sul fitoplancton e su alcuni fattoriambientali nella Laguna di Grado (Gorizia). Riv. Idrobiol. 21:75–96.
Totti, C., G. Civitarese, F. Acri, D. Barletta, G. Candelari, E.Paschini, et al. 2000. Seasonal variability of phytoplanktonpopulations in the middle Adriatic sub-basin. J. PlanktonRes. 22: 1735–1756.
Travers, M. 1975. Inventaire des protistes du Golfe de Marseilleet de ses parages. Ann. Inst. Oceanograph. N.S. 51: 51–75.
Travers, A. and M. Travers. 1975. Catalogue du microplanctondu Golfe de Marseille. Int. Rev. Gesamten Hydrobiol. 60:251–276.
Utermohl, H. 1958. Zur Vervollkommnung der quantitativen Phy-toplankton Methodik. Mitt. Int. Ver. Theor. Angew. Limnol. 9:1–38.
Venrick, E.L. 1978. How many cells to count? In: (A. Sournia,ed) Phytoplankton manual. UNESCO, Paris. pp. 167–180.
Vilicic, D. 1985. A phytoplankton study of southern Adriaticwaters near Dubrovnik for the period from June 1979 to July1980. Centro. 1: 35–56.
Vilicic, D. 1991. A study of phytoplankton in the Adriatic Seaafter the July 1984 bloom. Int. Revue Gesamten Hydrobiol.76: 197–211.
Vilicic, D., N. Leder, Z. Grzetic and N. Jasprica. 1995. Micro-phytoplankton in the Strait of Otranto (eastern Mediterrane-an). Mar. Biol. 123: 619–630.
Vilicic, D., I. Marasovic and D. Miokovic. 2002. Checklist of phy-toplankton in the eastern Adriatic Sea. Acta Bot. Croat. 61:57–91.
Vilicic, D., S. Terzic, M. Ahel, Z. Buric, N. Jasprica, M. Caric, etal. 2008. Phytoplankton abundance and pigment biomarkersin the oligotrophic, eastern Adriatic estuary. Environ. Monit.Assess. 142: 199–218.
Vukic-Lusic, D., V. Persic, J. Horvatic, D. Vilicic, L. Traven, T.Djakovac, et al. 2008. Assessment of nutrient limitation inRijeka Bay, NE Adriatic Sea, using miniaturized bioassay. J.Exp. Mar Biol. Ecol. 358: 46–56.
Zavatarelli, M., F. Raicich, D. Bregant, A. Russo and A. Artegiani.1998. Climatological biochemical characteristics of the Adri-atic Sea. J. Mar. Syst. 18: 227–263.
Zoppini, A., M. Pettine, C. Totti, A. Puddu, A. Artegiani and R.Pagnotta. 1995. Nutrients, standing crop and primary pro-duction in the western coastal waters of the Adriatic Sea.Est. Coast. Shelf Sci. 41: 493–513.
Zore-Armanda, M., V. Dadic, M. Gacic, M. Morovic and T. Vuce-tic. 1983. MEDALPEX in the north Adriatic. Preliminary report.Notes Inst. Oceanogr. Fish. Split 50: 1–8.
Received 25 February, 2009; accepted 28 May, 2009
Brought to you by | University of VirginiaAuthenticated | 128.143.23.241
Download Date | 10/4/12 8:01 AM