composite overwrap pressure vessels: mechanics and · pdf filecomposite overwrap pressure...
TRANSCRIPT
American Institute of Aeronautics and Astronautics
1
Composite Overwrap Pressure Vessels: Mechanics and Stress Rupture Lifing Philosophy
J. C. Thesken 1, NESC Ohio Aerospace Institute, Cleveland OH, 44135 USA
Pappu Murthy 2 NASA Glenn Research Center, Cleveland, OHIO, 44135, USA
Leigh Phoenix3 Cornell University, Ithaca, NY, 14853, USA
[Abstract] The NASA Engineering and Safety Center (NESC) has been conducting an independent technical assessment to address safety concerns related to the known stress rupture failure mode of filament wound pressure vessels in use on Shuttle and the International Space Station1 . The Shuttle’s Kevlar-49® fiber overwrapped tanks are of particular concern due to their long usage and the poorly understood stress rupture process in Kevlar-49® filaments. Existing long term data show that the rupture process is a function of stress, temperature and time. However due to the presence of load sharing liners and the complex manufacturing procedures, the state of actual fiber stress in flight hardware and test articles is not clearly known. Indeed non-conservative life predictions have been made where stress rupture data and lifing procedures have ignored the contribution of the liner in favor of applied pressure as the controlling load parameter. With the aid of analytical and finite element results, this paper examines the fundamental mechanical response of composite overwrapped pressure vessels including the influence of elastic-plastic liners and degraded/creeping overwrap properties. Graphical methods are presented describing the non-linear relationship of applied pressure to Kevlar-49® fiber stress/strain during manufacturing, operations and burst loadings. These are applied to experimental measurements made on a variety of vessel systems to demonstrate the correct calibration of fiber stress as a function of pressure. Applying this analysis to the actual qualification burst data for Shuttle flight hardware revealed that the nominal fiber stress at burst was in some cases 23% lower than what had previously been used to predict stress rupture life. These results motivate a detailed discussion of the appropriate stress rupture lifing philosophy for COPVs including the correct transference of stress rupture life data between dissimilar vessels and test articles.
.
Nomenclature x̂ = spherical coordinate vector
)ˆ(xf = form function P = pressure σ = membrane stress R = inner wall radius t = thickness K = stiffness β = composite elastic load share v = Poisson’s ratio E = elastic modulus
1 Principal Scientist/Research Team Manager, Ohio Aerospace Institute, Cleveland OH, 44135 2 Aerospace Engineer, NASA Glenn Research Center, Cleveland, OHIO, 44135, Assoc. Fellow 3 Prof. Dept. of Theoretical and Applied Mechanics, Cornell University, Ithaca, NY, 14853
https://ntrs.nasa.gov/search.jsp?R=20070022369 2018-05-12T17:41:21+00:00Z
American Institute of Aeronautics and Astronautics
2
E* = biaxial modulus n = superscript for nominal l = subscript for liner c = subscript for composite f = subscript for fiber y = superscript for liner yield stress or pressure u = superscript for ultimate tensile strength, stress or pressure i = sub- or superscript indicating interference fit pressure or stresses o = sub- or superscript for operating pressure load case Y = sub- or superscript pressure load case where liner yields P = sub- or superscript for proof sizing or autofrettage pressure B = sub- or superscript for vessel burst pressure
I. Introduction HE advent of high performance aramid and carbon fiber has enabled the evolution of filament wound pressure vessels capable of extreme energy storage capacity per unit mass, PBV/W, where PBV is the product of burst
pressure and vessel volume and W is the weight or mass of the vessel. In the 1970’s, this potential was recognized by Lark2,3 and Faddoul4 at the NASA Glenn Research Center as a number of design and manufacturing studies began to investigate the technical feasibility of filament wound pressure vessels for space flight. Landes5 and Ecord6 published early work describing this technology for shuttle applications with reported weight savings of 25 to 30% over comparable all titanium spherical vessels7. Today composite overwrapped pressure vessels (COPVs) are essential to numerous space vehicle power and environmental systems including a variety of crucial systems of the Space Shuttle and the International Space Station (ISS). The majority of Shuttle vessel overwraps are made of Kevlar-49®/Epoxy Composites while the newer ISS vessels have Carbon/Epoxy.
In early 2004, the NASA Engineering and Safety Center (NESC) formed an Independent Technical Assesment (ITA) team to investigate safety concerns attributed to the known stress rupture failure mode of Kevlar-49® filament wound pressure vessels. The Shuttle’s Kevlar-49® fiber overwrapped tanks are of particular concern due to their long usage and the known stress rupture failure mode of these filaments. These tanks were designed and developed in the late 1970’s and most of the 24 tanks per vehicle have been in service since delivery in the 1980’s. Stress rupture in Kevlar-49® gives no forewarning so Schmidt and Ecord8 at the Johnson Space Center initiated an accelerated stress rupture test program to lead the shuttle fleet’s flight hardware in actual time at pressure. The occurrence of burst events in that test program motivated the NESC’s ITA.
This paper surveys COPV structural mechanics and lifing methods employed to evaluate the shuttles flight hardware. An excellent review of early COPV design considerations may be found in Lark3 and key points are recalled here. It is interesting to note that early notions of high performance COPVs sought to achieve operation fiber stress levels at 60 to 70% of ultimate strength. At these stress levels strains in the composite exceed the limit for matrix cracking and crazing. As a result liners are required to achieve viable leak free structures. Early on elastomers and thin metallic liners were studied carefully due to the potential to achieve the greatest possible energy storage capacity. However elastomers are not viable in cryogenic applications and in high pressure gas uses due to cracking and blistering. Thin metallic liners yield during pressurization and must be bonded to the composite overwrap to prevent liner buckling or wrinkling during unloading phases. Lark3 reports difficulties in achieving leak free designs with good fatigue durability in the early attempts to develop thin metallic liner COPVs. At that time it was suggested that an interim approach to achieve a measure of the improved performance capacity would be to use load bearing liners. Lark notes that this concept was originally suggested by Johns and Kaufman [9] in 1966 and had matured more quickly than the thin metallic liner approach. It is one of the earliest references to the load sharing liner concept which is in use on the Shuttle and ISS.
Lark3 makes a clear distinction between load bearing/load sharing liner designs and the so called thin metallic liner designs. As will be demonstrated, the implication that the load carrying contribution of thin metallic liners is insignificant can lead to false conclusions when deriving the state of stress of such vessels. Load bearing liners are designed to carry one-third to one-half of the internal pressure load elastically3. The remainder of the load is carried by the composite overwrap. After the overwrap is cured in place on the liner an initial proof or sizing pressure is applied which takes the liner beyond its biaxial tensile yield limit and induces a permanent interference pressure between the liner and the overwrap. During unloading the liner transitions from a state of biaxial tension to biaxial compression while the overwrap filaments remain in tension even at zero applied pressure. These locked in residual stresses are superimposed on to the elastic load share of the internal pressure that each element carries. Subsequent
T
American Institute of Aeronautics and Astronautics
3
operation loads beneath the proof or sizing pressure are carried elastically by both the liner and the overwrap. While the current analysis indicates that residual stresses contribute over 15% of the composite stress at operating pressures, these values have not been accurately measured and monitored overtime.
Due to the presence of load sharing liners and the complex manufacturing procedures, the actual fiber stress in shuttle flight hardware and test articles is not clearly known. During qualification tests the shuttle flight hardware exceeded their required minimum design burst pressure targets of 1.5 x maximum expected operating pressure (MEOP). Analysis of the actual fiber stress at the qualification burst pressure was not required for acceptance purposes. Fiber stresses at minimum design burst pressures were also shown to be less than the design allowable of 320 ksi. Fiber stresses at operating pressures were determined but these were compared to the vendor’s design allowables. In the case of the Shuttle flight hardware, the design allowables were determined from a family of nine butyl lined vessels tested to burst. Operating stresses for the shuttle flight hardware were all less than 50% of the mean burst pressure for the family of nine rubber lined vessels. The use of fiber strength data from vessels of dissimilar size and liner type as a means to gage the severity of operating stress in flight hardware is questionable when actual burst data for each flight vessel was available. Non-conservative life predictions may be made where stress rupture data and lifing procedures have ignored the contribution of the liner in favor of applied pressure as the controlling load parameter. Nuances of vessel size and geometry must also be considered when making such appraisals.
In addition to Schmidt and Ecord’s fleet leader test program9 , the most exhaustive source of available data for the development of lifing models has been the well known Lawrence Livermore National Laboratory (LLNL) data (see e.g. Toland et al10). It should be noted that the vessels used in both of these test programs make use of relatively thin metallic liners with low yield strength. Furthermore, the early published data reduction did not correct for the influence of these thin liners.
With the aid of a simple thin shell theoretical analysis results and detailed finite element analysis based results, this paper describes the fundamental mechanical response of composite overwrapped pressure vessels. The development accounts for the influence of elastic-plastic liners and offers an approach to asses the influence of degraded/creeping overwrap properties. Graphical methods are presented describing the non-linear relationship of applied pressure to Kevlar-49® fiber stress/strain during manufacturing, operations and burst loadings. Thus far the methods have been used in designing and analyzing a new experimental program at the NASA White Sands Test Facility (WSTF) as described by Thesken et al11 and Greene et al12. Here the analysis is applied to determine operating stresses and stress ratios in vessels with ductile liners and vessels with elastic load sharing liners. Since time dependent degradation and creep of the overwrap is addressed. may cause a shift in the nominal pressure carried by the overwrap over time offering a potential to reduce the nominal fiber stress ratio. Results are provided to demonstrate this effect and to show adjustment of the stress ratio in the presence of creep.
The work concludes with an appraisal of the shuttle flight hardware. Applying this analysis to the actual qualification burst data for Shuttle flight hardware revealed that the nominal fiber stress at burst was in some cases 23% lower than what had previously been used to predict stress rupture life. These results motivate a detailed discussion of the appropriate stress rupture lifing philosophy for COPV’s including the correct transference of stress rupture life data between dissimilar vessels and test articles. Programs to generate stress rupture data typically comprise a series of short term load to failure tests to determine an ‘ultimate strength” for a coupon or test article and a group of long term tests where articles are held at some constant load until failure occurs. Results of the ultimate strength and long time tests are plotted with the load parameter as a function of time to failure. While the mechanisms of Kevlar-49® stress rupture remain unclear, Phoenix and Wu13 show that the mechanism is a function of stress, temperature and time that may be fundamentally linked to the failure process at the fiber bundle level. Scaling this process from small individual filaments to full scale COPV involves consideration of Weibull size effects in the failure process and understanding of the particulars of each individual structure. Historically a ratio of the operating state parameter to the ultimate state parameter has been used to scale life data to dissimilar structures. Lifting parameters such as pressure ratio, stress ratio and % of ultimate strength are among the common terms used for this comparison. It is further concluded that such parameters be based on failure data from bursts of the vessel to be analyzed and not upon a dissimilar vessel type.
This new entry point into the stress rupture life data accounted for the single largest impact on the perceived safety and reliability of the shuttle COPV flight hardware as the probability of COPV failure increased several orders of magnitude. However continuing work with the current mechanical analysis finds that it is not fully validated by existing experimental deformation data. The state of residual stress at zero pressure remains unsubstantiated by experimental measurement and records of internal and external vessel deformation indicate an increased compliance that may not be accurately represented by linear elastic analysis. In addition to vessel testing
American Institute of Aeronautics and Astronautics
4
at WSTF11,12, experiments are planned at the NASA Glenn Research Center and Cornell University to measure
residual stresses, overwrap mechanical properties and microstructure parameters. This has pointed to a new avenue of investigation using full 3D analytical methods and exploring the ramifications of non-linear through thickness compressibility of the overwrap. Measurements of lower residual stresses would shift the current stress ratio lower. The existence of any non-linear effect that exacts a higher penalty on the vessel at burst than at operating pressure would also demonstrate that the current stress ratios are too severe.
II. COPV Mechanics
A. Theory of Thin Shells To appraise the materials and geometry of the COPVs it is helpful to review the key design parameters which
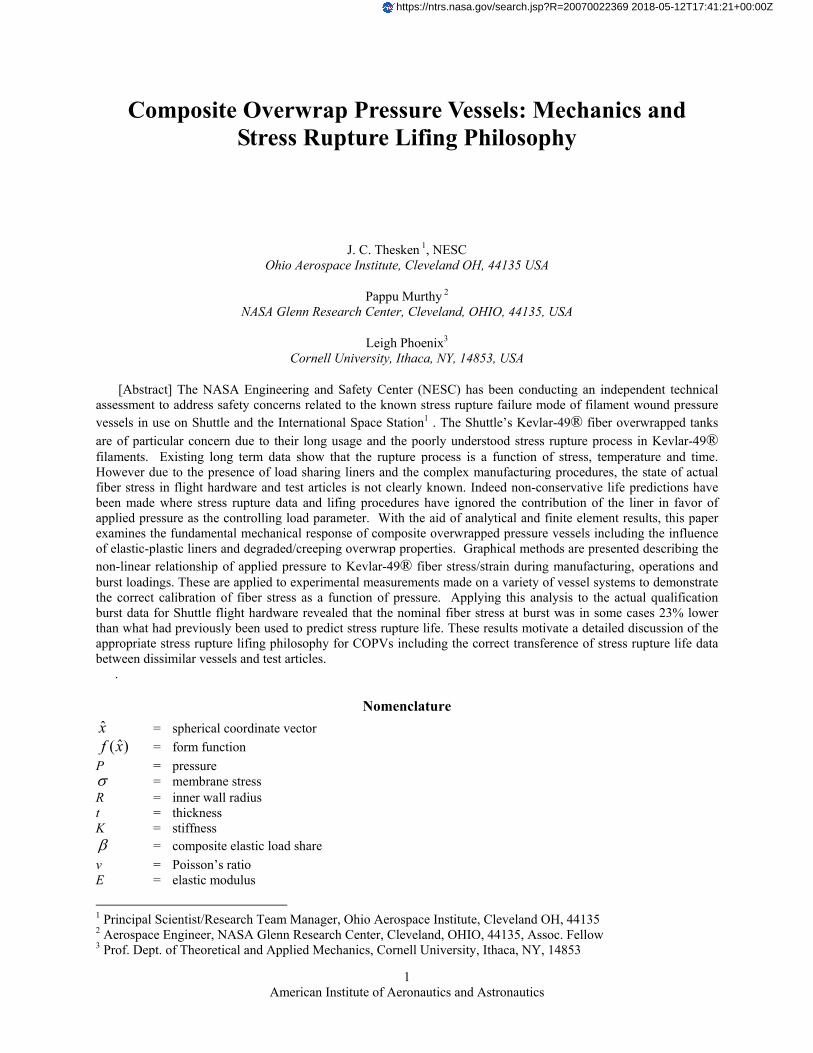
describe the nominal mechanical response of a spherical bi-material pressure vessel. Actual COPV structures will exhibit a non-uniform distribution of stresses and deformation owing to a number of factors. These include the nuances liner geometry its interaction with the overwrap winding pattern, the relative stiffness of the liner to the overwrap and the presence incompatible curvature changes. In areas where the liner thickness is uniform the overwrap may be seen to act as an elastic foundation which cradles the liner. The polar boss areas of liners are typically thickened and more rigid to support the port fixture. The local reinforcement acts as a stiff inclusion in the otherwise uniform metal membrane. Placed against the natural opening through the winding pattern this acts as stiff punch against the overwrap. Early boss failures were attributed to this stress concentration and new winding patterns increased the amount of fiber in the boss region to better support the boss fixture3. The nature of the elastic-plastic behavior of the liner is also prominent in determining the stress state of the overwrap. The liner’s plastic deformation and the presence of hardening will affect the sizing process, zero pressure residual stresses, the liners fatigue durability and the overwrap stress state at burst pressure.
Turning to the overwrap, complexity begins in the manufacturing phases with winding parameters, consolidation and curing schedule. The degree of anisotropy of the overwrap is a factor; Gerstle’s14 analysis may be used to demonstrate that high ratios of in-plane to through thickness stiffness can transform a geometrically thin shell into a thick shell problem with significant through thickness gradients. It is also known that filament wound structures can have different hereditary material responses transverse to the fiber depending upon whether the stress is compressive or tensile (Thesken15). This non-linearity coupled with the known damage mechanisms associated the matrix dominated properties of polymer matrix composites make the mechanical response of these COPVs a fundamentally complex problem.
With forethought to the objective of applying a correct lifing parameter for stress rupture let us discuss the notion of non-uniform fields in the overwrap. Assuming linear elasticity applies, the stress distribution in the composite overwrap, cσ , may be defined as
( )cnccc PxfPx σσ )ˆ(),ˆ( = (1)
where )ˆ(xf is a form function of the spherical coordinate vector x̂ and the superscript n identifies ( )c
nc Pσ as the
nominal stress in the overwrap at the composite’s pressure load share cP . The value of the form function at a local maximum of stress is commonly known as a stress concentration factor. Since the distribution function is decoupled from load, the formation of any stress ratio SR is found to be independent of the spatial distribution function and simplifies to
( )( )B
cnBc
oc
noc
Bc
Bc
oc
oc
PP
PxPxSR
σσ
σσ
==),ˆ(),ˆ(
. (2)
where supercripts o and B refer to operating and a burst pressures respectively. Since the Kevlar-49® fibers are the dominant load carrying elements of the composite overwrap the notion that the overwrap is linear elastic is valid first approximation. Additional information from a more detailed finite element analysis would provide no further information for lifing parameter determination. The stress ratio would only change if the spatial distribution
American Institute of Aeronautics and Astronautics
5
function became dependent upon load history i.e. a function of cP . This is identical to saying that the stress
concentration factor at a local maximum is a function of load cP . This would be the case if the composite behaved in a non-linear fashion due to material response or non-linear geometrical effects. Equation (2) has been verified in contracted finite element analysis performed by General Dynamics, Lincoln, Nebraska (current owner of the former Shuttle COPV vendor Brunswick). These results are reviewed later in the paper where nominal descriptions of the COPV structure based on thin shell theory have been found to agree well with large regions of the membrane portion of COPV structures. Therefore the use of thin shell theory is the preferred method for characterizing and appraising the performance capability of a COPV.
R
Kevlar/Epoxy Composite Overwrap
Metallic Liner
R
Kevlar/Epoxy Composite Overwrap
Metallic Liner
Figure 1. Typical spherical COPV geometry.
B. Load Equilibrium Requirements Load equilibrium in the bi-material COPV requires that the total applied pressure be equal to the sum of the
pressure carried by the individual components
cl PPP += . (3) For thin shell analysis flclc tttRR ,,>>≈ where typically the ratio of radii to shell membrane thickness is greater than 10 for all vessels considered here and nominal membrane stress (dropping the n superscript) are
c
ccc
l
lll
tRP
tRP
⋅⋅=
⋅⋅=
2
2
σ
σ . (4)
It is common to use mid-plane radii for membrane shell theory but comparisons to the exact elasticity solution (see e.g. Roark and Young [16]) show that this over predicts the maximum stress in the shell significantly. Using the inner wall radii in the familiar equations yields a membrane stress that agrees more closely with the maximum stress on the inner wall. The exact nominal stress for any membrane is found by the exact ratio of inner projected area to the projected thin shell area:
22
2
)( RtRRP
−+⋅=σ (5)
where
American Institute of Aeronautics and Astronautics
6
222
2
21
)(⎟⎠⎞
⎜⎝⎛+
=−+
Rt
RtRtR
R. (6)
As tR
is greater than 10 the squared term is of second order and maybe neglected so t
PR2
is a good approximation
of the nominal membrane stress. In the case of the equi-biaxially loaded quasi-isotropic filament wound overwrap, this formula maybe re-written
using the fundamental netting analysis relation between fiber stress and composite stress as
f
ccf
f
cc
f
cf
tR
P
tt
⋅=
==
σ
σνσ
σ2
2. (7)
Note that ft is conceptually the nominal thickness of the fiber had it been wound without resin. Following common filament winding design practice, no strength nor stiffness is ascribed to the resin. From the design stand point we can say that the ratio of ultimate fiber stress to composite pressure should always meet the following criteria to avoid failure:
cu
cc
fuf
f
c
c
uf
PPR
t
tR
P
>=
>
σ
σ
(8)
Characteristics of the liner at yield are also of interest; clearly the pressure load carrying capability of the liner post yield is at least
l
lyl
yl R
tP
2⋅= σ (9)
and is only greater if the liner hardens. If the liner is perfectly plastic post yield then the liner load share is constant and the composite load share post liner yield is simply
ylc PPP −= . (10)
Since the biaxial yield strain of the liner is less than one-third of Kevlar-49 fiber failure strain, this relation suggests that the burst pressure to fail the overwrap could be predicted by
yl
ucB PPP += . Alternatively the pressure carried by the composite at burst may be defined as
y
lBB
c PPP −= (11)
and the ratio uc
Bc PP may be seen as a measure of the strength efficiency of the composite overwrap design.
American Institute of Aeronautics and Astronautics
7
C. Strain continuity requirements: Continuity of strain and displacement in the liner and composite must be invoked to determine the load sharing
prior to proof or sizing of the vessel where the stress in the liner is less than the biaxial yield stress.
cl εεε == (12)
The biaxial strain for a spherical shell may be written as
** 2tERP
E==
σε (13)
where the biaxial modulus is
)1(*
ν−=
EE . (14)
Insertion into the equilibrium equation relates the applied pressure load to strain as
ε⋅⎟⎟⎠
⎞⎜⎜⎝
⎛+=+=
c
cc
l
llcl R
EtREtPPP
** 22 (15)
Defining the individual shell stiffnesses as
c
ccc
l
lll
REtK
REtK
*
*
=
= (16)
and the pressure-strain relationship is
( ) ε⋅+⋅= cl KKP 2 . (17)
The composite form of this parameter is the subject of some discussion as different methods have been used to approximate the effective biaxial stiffness. The design reference[17] for the flight hardware show that quasi-isotropic laminate properties have been used such that
)1(*
QIc
QIc
cE
Eν−
= . (18)
The netting analysis approach defines
2*ffc vEE ⋅= . (19)
As it will be seen, the value chosen for this biaxial modulus will influence the load sharing and the actual deformation response determined from design analysis.
The elastic load sharing parameters are defined as
American Institute of Aeronautics and Astronautics
8
( ) ( )
( ) ( ) ( )β
β
−=+
=+
=
=+
=+
=
11
11
1
lccl
ll
clcl
cc
KKKKK
PP
KKKKK
PP. (20)
Note that two important design parameters are the ratio ( )cl KK and the load sharing parameter β .
D. Proof-sizing and the Complete Mechanical Response The manufacturing process sets final the crucial design parameters that must be evaluated for the shuttle flight
hardware. After curing of the composite overwrap, the vessels are subjected to an autofrettage process which induces an interface pressure between the liner and composite. This interface pressure is carried as a tensile preload in the composite and a compression preload in the liner. Autofrettage is a process where the liner is stretched beyond yielding which induces permanent plastic deformation. As the green or newly cured vessel is loaded to the initial liner yield point, the strains in the vessel are governed by the pressure strain equation (16). At yield y
lc εε = so the
applied pressure in the vessel yP that initiates liner yielding is related to the liner yield stress by equation (16) as
( )cll
yl
y KKE
P +⋅= 2*
σ. (21)
For a perfectly plastic liner the pressure post liner yield is carried by the composite is given by equation (10) so
at proof
ylP
Pc PPP −= . (22)
Assuming the liner yields perfectly plastic the strain in the vessel during increasing load is controlled by the overwrap which is assumed to remain elastic so
c
yl
c
clc K
PPKP
22−
=== εε (23)
when ( )clyl KKP +⋅≥ 2ε .
Obviously the proof pressure should not exceed the burst pressure so BP PP < and since the specification
requires the min design burst (MDB) to be 1.5 times the max expected operating pressure (MEOP) MEOPP PP 5.1< . During the unload from proof the liner carries load elastically so the stain in the liner is determined by the liner strain at proof less the elastic unload strain as
( )cl
P
c
ylP
lc KKPP
KPP
+−
−−
==22
εε . (24)
The residual strain in the overwrap at zero pressure is
American Institute of Aeronautics and Astronautics
9
( )cl
P
c
ylPR
c KKP
KPP
+−
−=
22ε . (25)
The interface pressure iP which the composite and the liner carry identically is found by subtracting the elastic
unload pressure component Punload
c PP β= from PcP giving
( ) y
lPPy
lPi PPPPPP −−=−−= ββ 1 . (26) Comparing the equations (25&26) it is clear that the residual strain and interface pressure are related by
c
iRc K
P2
=ε . (27)
All post autofrettage loadings must carry this pressure superimposed on the elastic load share. For the composite
overwrap this is an additive component inducing tensile stress at zero pressure and it is subtractive in the case of theliner inducing compressive stress. Therefore load sharing after proof is governed by the following relations for
( ) ( )( ) ( )( ) y
lPil
ylPPic
P
PPPPPP
PPPPPPP
PP
+−−=−−=
−+−=+=
≤
ββ
ββ
11
. (28)
Deformation history referenced to the initial green state is preserved in the strain state of the overwrap so that
c
cc K
P2
== εε (29)
for the vessel. The liner has under gone a permanent plastic deformation
( ) yl
c
ylPy
lPc
pll K
PPεεεε −
−=−=
2 (30)
which is also the strain for zero stress in the liner. The computation of liner stress state from the deformation history strain requires the removal of this permanent offset strain. This shifts the elastic stress strain response to its new zero point so that
( )pllll E εεσ −= * . (31)
Alternatively stress in the liner may be determined using the stress-pressure relation for the post proof liner load share lP .
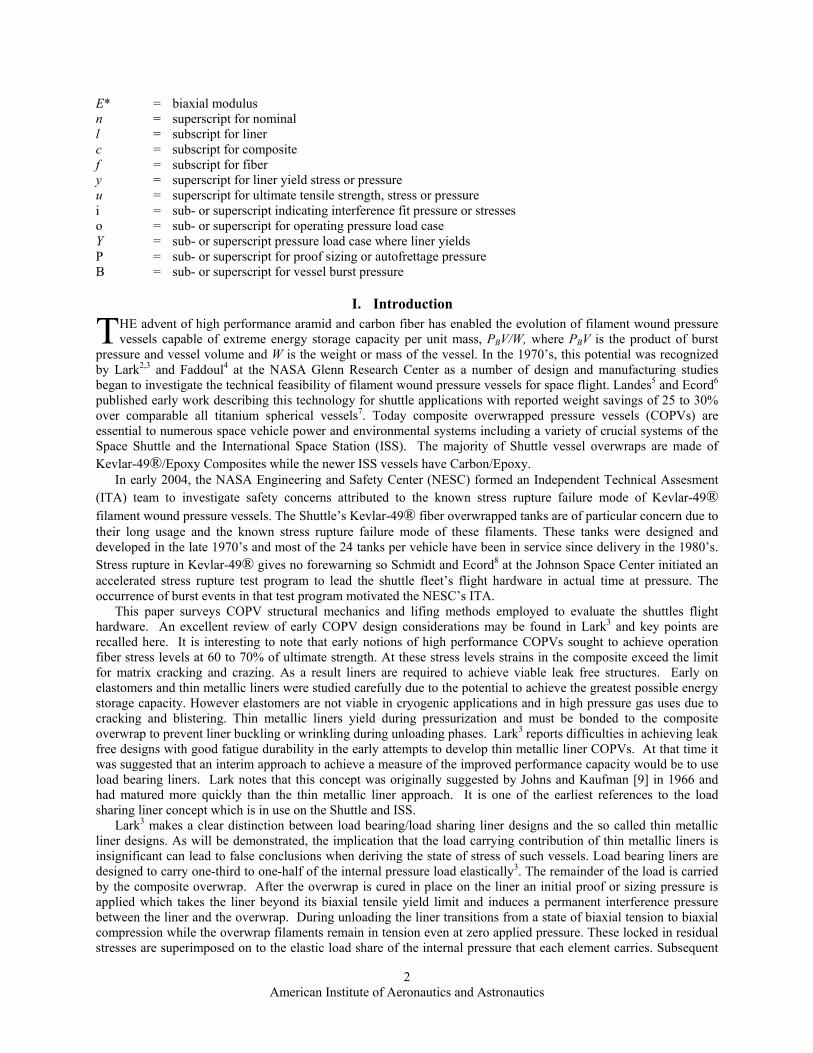
Figure 2 gives a complete graphical interpretation of the mechanical response of a COPV having a linear elastic overwrap and an elastic-perfectly plastic liner. In this presentation strain is given on the vertical axis and because of continuity it is identical for the COPV and the individual components. The corresponding pressures and stresses are
American Institute of Aeronautics and Astronautics
10
given on the horizontal axis.
BPPP ylσ
COPVStrain - Pressure
CompositeStrain - Stress
LinerStrain - Stress
ylε
Bcσ
Pcσ
Rcε
Pcε
Bcε
YPRcσ R
lσ
pllε
Strain
Pressure Stress Stress
Burst
ProofYield
Residual
ylP
BPPP ylσ
COPVStrain - Pressure
CompositeStrain - Stress
LinerStrain - Stress
ylε
Bcσ
Pcσ
Rcε
Pcε
Bcε
YPRcσ R
lσ
pllε
Strain
Pressure Stress Stress
Burst
ProofYield
Residual
ylP
Figure 2. Strain– pressure/stress relationships based on continuity of strain for a COPV, it’s composite and it’s liner respectively. Operational loads from P=0 to MEOP lie on the blue line for pressures less than PP
The as cured vessel in the green state will undergo the sizing operation as depicted by the green lines in Fig. 2 for the COPV and the liner. Focusing on the left hand curve for COPV strain – pressure behavior, when the biaxial yield stress is achieved at a pressure corresponding to Py the strain – pressure curve changes slope. Here the strain – pressure response changes from
( )cllc KK
P+⋅
===2
εεε (31)
to
c
yl
lc KPP
2−
=== εεε . (32)
Note that the slope of the post yield curve is controlled by the stiffness of the overwrap cK so that it can be explicitly measured from experimental strain data. The post yield line is offset so that its intercept with the pressure
axis corresponds to the pressure carried by the liner at yield ylP . This intercept could be converted to the biaxial
yield stress of the liner if the liner geometry is known. Note that for a rigid-perfectly plastic liner there would be no
strain in the vessel until the stress in the liner reached the yield stress at the applied pressure ylP at this intercept
point. Thereafter deformations would be governed by the stiffness of the overwrap and follow the usual post yield
slope. Once the overwrap stiffness cK is known; it is possible to resolve the stiffness of the liner from a
measurement of the pre yield slopes and solving for lK . Further inspection of the equations governing the green pre- and post-yield line reveals that the ratio of the pre-yield slope to the post-yield slope is identical to the elastic load sharing parameter β .
After the proof pressure is reached the vessel undergoes an elastic unloading. Inspection of the composite and liner strain – stress diagrams shows that both materials exhibit linear elastic response in this regime. The liner has locked in a permanent plastic deformation that will not let it return to zero deformation. At zero applied pressure the composite exhibits a residual tensile stress and the liner exhibits a residual compressive stress. Measurement of the overwrap strain at zero pressure determines residual stresses in the composite and the liner. Equilibrium between the liner and the composite requires that the membrane stress integrated over each thickness must balance.
ccRcc
Rcl
Rl tEtt *εσσ −=−= . (33)
American Institute of Aeronautics and Astronautics
11
As mentioned earlier the stress state in the liner post proof is no longer determined by the continuity strain
referred to the initial zero strain state. The elastic stress in the liner relative to the vessel or composite strain
measure must be determined by equation (31) where pllε can be determined from strain data as the delta strain
between the proof strain Pcε and the yield strain y
lε . Additional constitutive information may be derived from the strain – pressure curves if the geometry of the COPV is well described.
III. Applications and Issues in Stress Ratio Determination
A. Stress Ratios of Vessels Operating above Liner Yield: Appraisal of LLNL Test Vessels An important example application of the above fundamental principles and graphical analyses is the design
appraisal of the LLNL vessels which comprise the main body of stress rupture data for COPVs. It should be noted that these vessels were designed to operate with the liner above yield stress. In such a case the pressure carried by the composite at any post yield load point and at burst is given by equations (9,10 and 11) such that:
ylB
Bc
ylc
PPP
PPP
−=
−=. (34)
and the fiber stress at these load points is
)/(
)/(
fB
cBf
fo
cof
tRP
tRP
=
=
σ
σ. (35)
The LLNL stress rupture test data and the design curves have reported the Y-Axis controlled load parameter as a
percentage of the composite/fiber strength at burst which is %100%100 xPP
x Bc
oc
Bf
of =
σ
σ.
However, a closer examination of the data indicated that the percentages plotted actually correspond to the ratio
of the total applied test pressure to the mean static burst pressure of the vessels or
%100xP
PB
o
.
According to Toland et al10
“Liner load sharing is nearly negligible. The 1100-0 Al yields at pressures between 24 (3.5 ksi) and 34.5 MPa (5 ksi). (Hydroforming introduces some work hardening, however.) Classical shell formulas indicate that liner yield occurs at an approximate liner pressure of 1.25 MPa (181 psi). Strain gage data from virgin burst tests graphically illustrate the liner yield.”
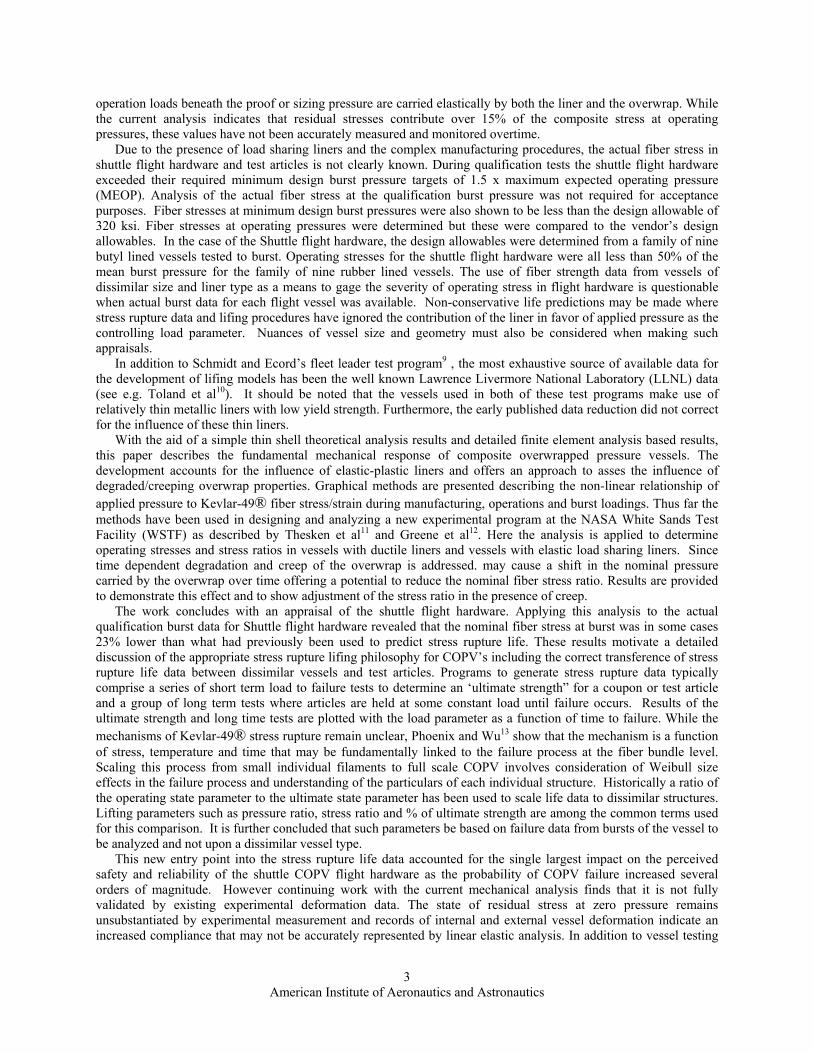
Indeed the Strain –Pressure curves given in Toland’s10 report (see Fig. 3) do exhibit the distinctive kink indicating the transition of the liner from elastic to plastic response. Analysis of the elastic load sharing parameter for this vessel would predict a severe kink since β =0.30 and the composite only carries 30% of the load up to yield. By applying graphical analysis to this strain gage–pressure burst data it was determined that the pressure carried by the liner at yield is significantly greater than what had been reported by Toland et al10. Extending a line tangent to the post yield strain data to the horizontal axis gives an intercept pressure (4 MPa) that corresponds to the pressure that the liner carries at yield (see Fig 3) . This corresponds to a liner yield stress of about 15.9 ksi. It has been noted that there is approximately 5 ksi pretension in the composite due to winding tension of the fiber. This shifts the intercept pressure to about 2.5 MPa which corresponds to a liner yield stress of 9.9 ksi. This finding prompted mechanical
American Institute of Aeronautics and Astronautics
12
testing to be conducted on four specimens extracted from remaining LLNL vessel liners to measure the yield stress. The yield stresses recorded were between 6.5 and 8 ksi.
PB
1.0
Py 17.15 29.50
Stre
ss R
atio
Stra
in %
Range of Stress Rupture Test Pressures
Pressure RatioTrue Fiber Stress Ratio
BPPy
lBy
l PPPP −−
ylP
Pressure
0.0PB
1.0
Py 17.15 29.50
Stre
ss R
atio
Stra
in %
Range of Stress Rupture Test Pressures
Pressure RatioTrue Fiber Stress Ratio
BPPy
lBy
l PPPP −−
ylP
Pressure
0.0
Figure 3. Graphical transformation of strain– pressure relationships into correct stress ratio calibration curves for the LLNL data base (Toland et al10) Black dashed line represents component pressure ratio and
the red line represents an exact fiber stress ratio.
The combined results indicate that the load carried by the liner is not insignificant. This can be demonstrated graphically by drawing a dashed black line from zero to the burst strain point on the strain curve in Fig. 3. This line corresponds to a strain –pressure response that is not influenced by the presence of the liner. This line is compared to
the red line tangent to the post yield strain data and intercepts the burst point and the pressure ylP at zero strain. The
offset between these curves indicates that the correct fiber stress ratio for vessels with yielded liners is
ylB
yl
Bc
c
PP
PP
PP
SR−
−== . (36)
and values range from 2 to 6% lower than LLNL’s reported pressure ratios. The pressure ratio and stress ratio are identical at burst pressure and diverge with decreasing applied pressure having the greatest difference at the lowest recorded pressure. The net result is to lower the LLNL stress rupture design data base relative to other component operating stress ratios and reducing the perceived reliability margins.
B. Stress Ratios for Vessels with Load Sharing Liners: Flight Hardware Example The LLNL vessels describe above have significant metallic liners but due to a low yield stress their contribution
to the load carrying remains constant in the range where testing took place. The shuttle flight hardware has significant titanium liners that carry over 30% of the load. Formulating a stress ratio for lifing purposes from the formulae for thin shell theory can be done in the following way. We define the ratio of fiber stress at operating pressure to fiber stress at burst by using equation (35) where
( ) ( )ylPPo
oc PPPPP −+−= β (37)
American Institute of Aeronautics and Astronautics
13
and y
lBB
c PPP −= (38).
Obviously the pressure – fiber stress conversion term for the numerator and denominator is the same so the stress ratio is seen to be identical to the composite pressure ratio
( ) ( )y
lB
ylPPo
Bc
oc
Bf
of
PP
PPPP
PP
−
−+−==
β
σ
σ (39)
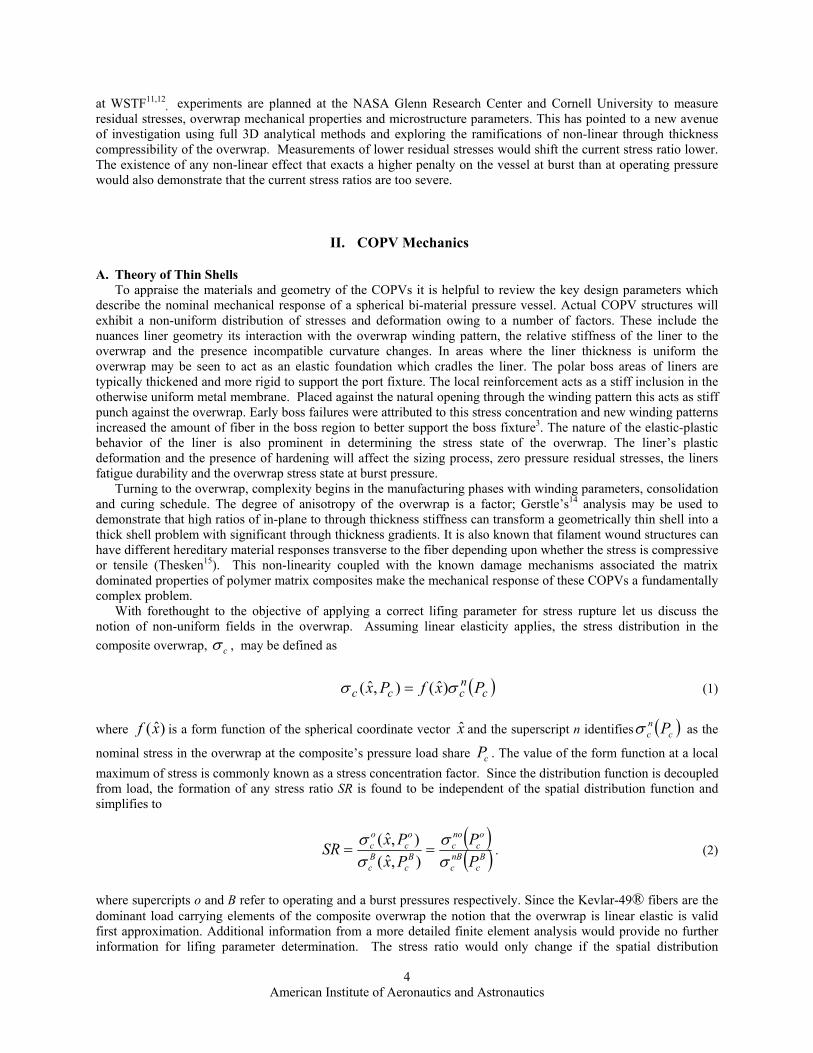
This result is similar to the finding concerning linear stress concentration factors. Figure 4 shows the graphic representation of the relation of the composite load share to its own stress ratio.
Figure 4. Graphical representation of composite load share (left vertical axis) and the corresponding fiber stress ratio (right hand vertical axis).
In this graph the post yield line has a slope of unity and the pre-yield line has a slope of β . The values that control
this ratio are seen to be the proof pressure PP , the elastic load sharing factor β and the pressure corresponding to
the yield stress in the liner ylP . Graphically the proof pressure less the post yield liner pressure may be seen as the
primary reference point for the operating state of the composite. The load sharing factor proportions the amount of pressure lost in the composite when unloading to the operating point. Clearly an upper bound may be determined for this ratio by setting the numerator to its maximum possible value and the denominator to its minimum possible
value. This may be done by setting β and ylP to their minimum expected value in the numerator and replacing
ylP in the denominator with
l
lUTSl
ul t
RP
2σ= (40)
BPPPylP
RcP
PcP
BcP
YPCOPV Pressure
ocP
1.0
Bc
oc PP /
0.0oP BPPPy
lPR
cP
PcP
BcP
YPCOPV Pressure
ocP
1.0
Bc
oc PP /
0.0oP
American Institute of Aeronautics and Astronautics
14
so that
( ) ( )u
lB
ylPPo
Bf
of
PP
PPPP
max
minmaxminmaxmax−
−+−=
β
σ
σ (41)
A numerical example is presented using the min values for composite stiffness in the Brunswick SAR17 and the
maximum values of liner stiffness: minβ =0.612, ylP min =1.387 ksi, u
lP max =1.496 ksi, maxPP =6.513 ksi , BP = 8.010 ksi. This yielded a maximum value for stress ratio of
Bf
of
σ
σmax =0.633 when the SAR17 reported values no greater than 0.50 for any vessel. The actual stress analysis for
the flight hardware will be discussed further in Section IV.
C. Stress Ratio Adjustments: First order simulation of creep or damage in the overwrap Early on in the NESC investigation the notion of creep and/or damage in the composite overwrap was raised.
The concern was similar to investigations into creep deformation in high performance flywheel rotor composites where dimensional tolerances are essential to maintaining the initial pre-load[15]. The thin shell membrane theory presented above may be used to examine the first order effects of this mechanism by invoking a degraded secant modulus for the overwrap stiffness. Inserting a linear scale factor from 1 to 0 on the composite modulus it was possible to explore the change in total deformation and stress ratio.
Figure 5. Typical change in total strain at operating and zero pressure as a function of degrading overwrap
secant modulus. Figures 5 and 6 describe the influence of degraded modulus on total deformation response and in turn its influence on stress ratio as total strain increases with creep relaxation. As additional data for creep in Kevlar-49® composites became available curves such as in Fig. 6 could be used to calibrate stress ratio for small creep allowances.
0
0.005
0.01
0.015
0.02
0.025
-0.2 0 0.2 0.4 0.6 0.8 1 1.2
Ec/Eco
Tota
l Str
ain
Total Strain-Operating Pressure
Total Strain at Zero Pressure
American Institute of Aeronautics and Astronautics
15
-0.1
0
0.1
0.2
0.3
0.4
0.5
0.6
0.7
0 0.005 0.01 0.015 0.02 0.025
Total Strain
Stre
ss R
atio
Stress Ratio
Figure 6. Typical change in stress ratio as a function of total strain increase due to creep relaxation.
IV. Appraisal of the Brunswick Corporation Shuttle Tankage Stress Analysis Report (SAR) The Brunswick Corporation Defense Division stress analysis report (Brunswick 1978 SAR17) of the Shuttle
vessels provided stress results for the liner and the overwrap. These values were used to demonstrate the adequacy in terms of operating safety margins and SR reliability requirements for the original flight hardware certification. The operating stresses in the composite were computed using an in house code LINER2 which includes liner load sharing. Composite stresses at design burst pressure (1.5 x maximum expected operating pressure, MEOP) were computed using SPHERE1 under the assumption that the composite carries the complete load at design burst. The SPHERE1 analyses showed that fiber stresses did not exceed the design allowable of 320 Ksi. at the design burst pressure.
Table 1 gives an appraisal of the results published using LINER2 compared to those using the thin shell theory presented here. It is assumed that the liner is pre-compressed at 60 Ksi.. This was an upper bound for the LINER2 residual stresses given in the Brunswick 1978 SAR17 stress report. Except for the RCS-HE vessel, the thin shell analysis Table 1 was found to agree with the LINER2 results within 2%. Review of the RCS analysis shows that the assumption of 60 ksi. compressive stress in the liner at zero pressure would account the larger difference. Given the close agreement between thin shell theory and LINER2 it would seem that the fundamental assumptions are similar in both analyses.
Table 1. Comparison of operating stresses determined from thin shell theory to Brunswick SAR LINER2 results using the QI laminate stiffness properties
MEOP (psi)
Ratio of Thin Shell Model to LINER2
Percent Variation
RCS He 4000 1.052 5.2% MPS He 4500 1.02 2% OMS He 4875 1.015 1.5% ARPCS N2 3300 1.000 0.0%
In Table 2 similar appraisal of the SPHERE1 analysis results can be made the results at the min design burst point. Note that it was assumed that the entire applied pressure is carried by the composite in this analysis. The ratio
American Institute of Aeronautics and Astronautics
16
of fiber stress to applied pressure is then equivalent to the ratio ftR in thin shell theory. Here again there is close agreement between thin shell theory and SPHERE1, however thin shell theory predicts a slightly greater fiber stress for a given composite pressure.
Table 2. Comparison of the stress/pressure ratios determined from thin shell theory and the maximum SPHERE1 results
Thin shell parameter
ftR MDB
c
MDBf
Pσ
Ratio of thin
shell results to SPHERE1
Percent Variation
RCS He 48.405 47.300 1.023 2.3% MPS He 43.445 41.452 1.048 4.8% OMS He 39.883 38.890 1.025 2.5%
ARPCS N2 59.046 58.061 1.017 1.7%
Table 3 Determination of Nominal Fiber Strength from Actual COPV Burst Data: Conversions Made Using Thin Shell Theory and Results from SPHERE1 (Table 2)
y
lP (psi)
Actual Burst Pressure BP
(psi)
B
yl
PP
Brunswick Estimate of Liner Load
Share
( ) f
ylB tRPP −
Thin Shell Fiber Strength
(Ksi)
( ) MDBc
MDBfy
lB PPP
σ−
SPHERE1 Fiber Strength (Ksi)
RCS He 1179.229 6980 0.169 0.23 280.8 274.4 MPS He 1309.791 8990 0.146 0.22 333.7 318.4 OMS He 1304.075 8010 0.163 0.20 267.5 260.8
ARPCS N2 960.000 6190 0.155 0.23 308.8 303.7
In Brunswick analysis it was demonstrated that the over wrap alone is capable of carrying the design burst pressure with positive margins based on the allowable fiber stress of 320 ksi. Furthermore, it was stated that although the liner contribution was neglected, the liner would indeed share significant load (20 to 23%) at burst so there would be additional margin to ensure that the actual qualification burst pressure exceeded the minimum design burst pressure requirements. The actual burst pressures of Table 3 certainly achieve 1.5 xMEOP (see Table 2) as required. However, Table 3 also shows the fiber stress determined from the burst pressure using the correct post-
yield composite load share equation ( )ylB
Bc PPP −= . Note that the 120 ksi. yield stress titanium liner in the
flight hardware caries at least 960 to 1300 psi depending upon the vessel design. This is considerably less of a load share than predicted in the Brunswick SAR. While all tanks exceeded the required min design burst pressure, it is seen that the MPS HE tank is the only tank that approaches a nominal fiber failure stress of about 320 ksi. as called out by the design allowable. The percentages of the design allowable are given in Table 4.
Table 4 Determination of nominal fiber strength as a percent of the 320 Ksi design allowable from actual COPV burst data: conversions made using thin shell theory and results from SPHERE1 (Table 3)
Thin Shell Burst Fiber Stress Results Percent of 320 Ksi Design Allowable
SPHERE1 Burst Fiber Stress Results
Percent of 320 Ksi Design Allowable
RCS He 87.8% 85.7% MPS He 104.3% 99.5% OMS He 83.6% 81.5%
ARPCS N2 96.5% 94.9%
American Institute of Aeronautics and Astronautics
17
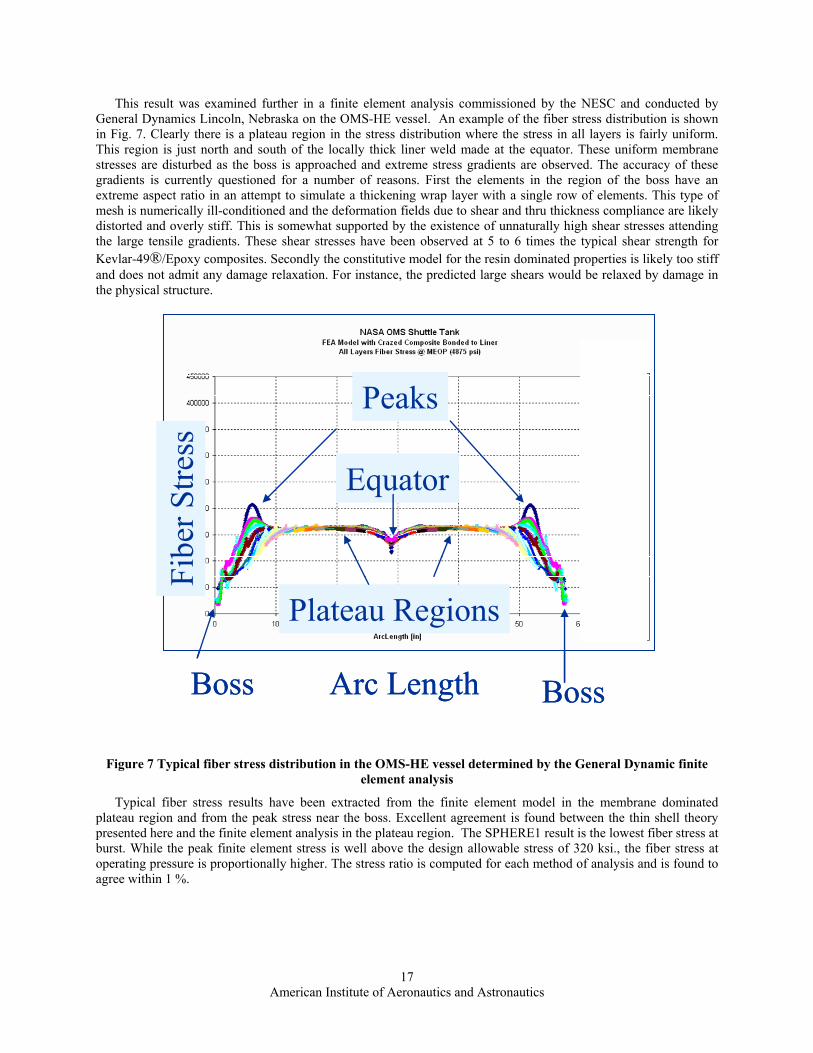
This result was examined further in a finite element analysis commissioned by the NESC and conducted by General Dynamics Lincoln, Nebraska on the OMS-HE vessel. An example of the fiber stress distribution is shown in Fig. 7. Clearly there is a plateau region in the stress distribution where the stress in all layers is fairly uniform. This region is just north and south of the locally thick liner weld made at the equator. These uniform membrane stresses are disturbed as the boss is approached and extreme stress gradients are observed. The accuracy of these gradients is currently questioned for a number of reasons. First the elements in the region of the boss have an extreme aspect ratio in an attempt to simulate a thickening wrap layer with a single row of elements. This type of mesh is numerically ill-conditioned and the deformation fields due to shear and thru thickness compliance are likely distorted and overly stiff. This is somewhat supported by the existence of unnaturally high shear stresses attending the large tensile gradients. These shear stresses have been observed at 5 to 6 times the typical shear strength for Kevlar-49®/Epoxy composites. Secondly the constitutive model for the resin dominated properties is likely too stiff and does not admit any damage relaxation. For instance, the predicted large shears would be relaxed by damage in the physical structure.
Figure 7 Typical fiber stress distribution in the OMS-HE vessel determined by the General Dynamic finite element analysis
Typical fiber stress results have been extracted from the finite element model in the membrane dominated plateau region and from the peak stress near the boss. Excellent agreement is found between the thin shell theory presented here and the finite element analysis in the plateau region. The SPHERE1 result is the lowest fiber stress at burst. While the peak finite element stress is well above the design allowable stress of 320 ksi., the fiber stress at operating pressure is proportionally higher. The stress ratio is computed for each method of analysis and is found to agree within 1 %.
Plateau Regions
Arc LengthBoss Boss
Equator
Peaks
Fibe
r Stre
ss
Plateau Regions
Arc LengthBoss Boss
Equator
Peaks
Fibe
r Stre
ss
American Institute of Aeronautics and Astronautics
18
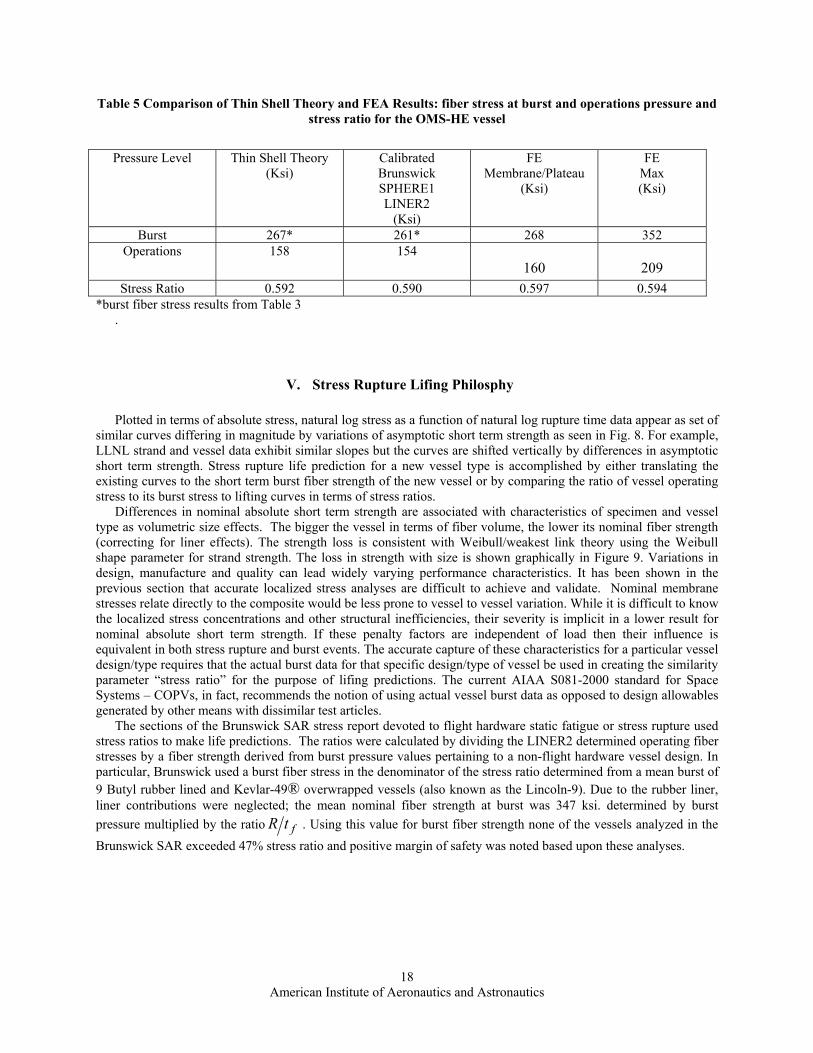
Table 5 Comparison of Thin Shell Theory and FEA Results: fiber stress at burst and operations pressure and stress ratio for the OMS-HE vessel
Pressure Level Thin Shell Theory
(Ksi) Calibrated Brunswick SPHERE1 LINER2
(Ksi)
FE Membrane/Plateau
(Ksi)
FE Max (Ksi)
Burst 267* 261* 268 352 Operations 158 154
160 209 Stress Ratio 0.592 0.590 0.597 0.594
*burst fiber stress results from Table 3 .
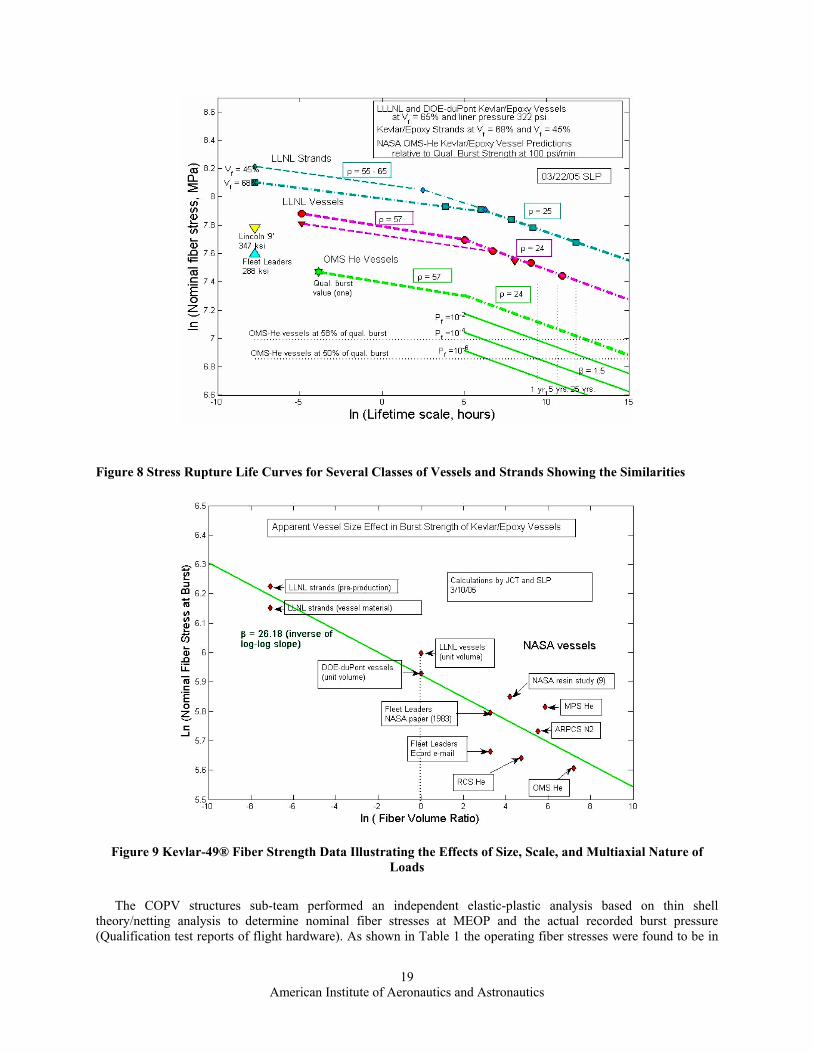
V. Stress Rupture Lifing Philosphy Plotted in terms of absolute stress, natural log stress as a function of natural log rupture time data appear as set of
similar curves differing in magnitude by variations of asymptotic short term strength as seen in Fig. 8. For example, LLNL strand and vessel data exhibit similar slopes but the curves are shifted vertically by differences in asymptotic short term strength. Stress rupture life prediction for a new vessel type is accomplished by either translating the existing curves to the short term burst fiber strength of the new vessel or by comparing the ratio of vessel operating stress to its burst stress to lifting curves in terms of stress ratios.
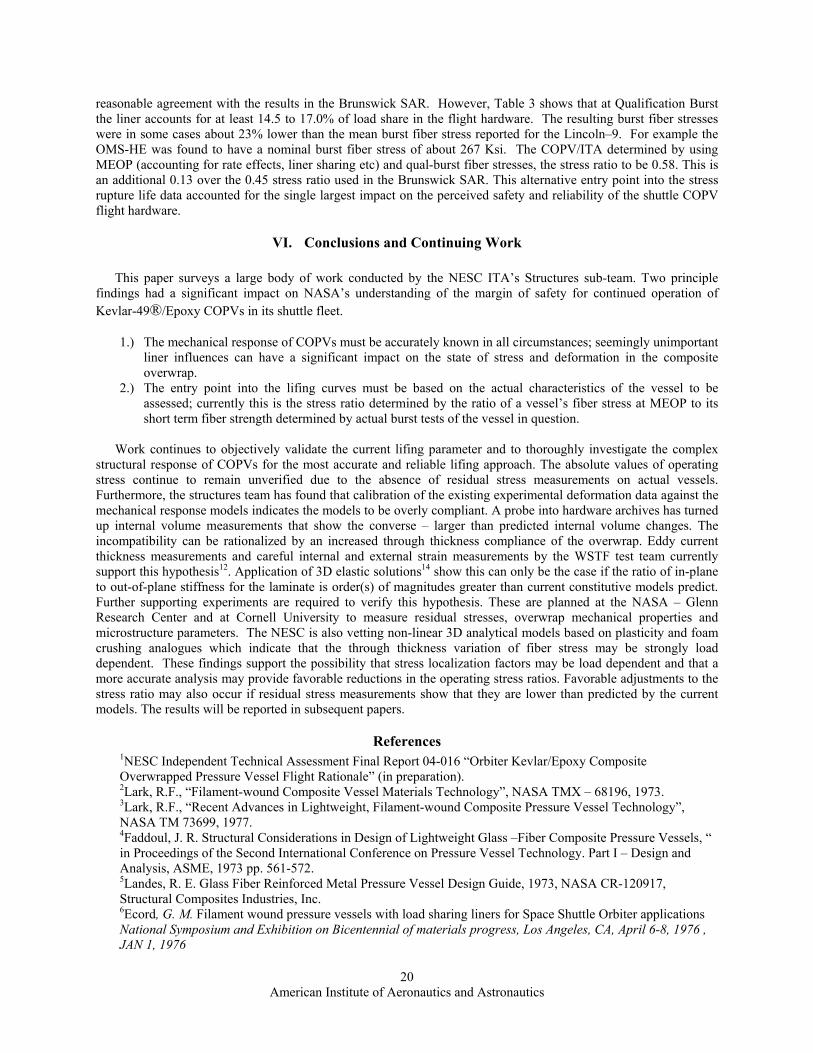
Differences in nominal absolute short term strength are associated with characteristics of specimen and vessel type as volumetric size effects. The bigger the vessel in terms of fiber volume, the lower its nominal fiber strength (correcting for liner effects). The strength loss is consistent with Weibull/weakest link theory using the Weibull shape parameter for strand strength. The loss in strength with size is shown graphically in Figure 9. Variations in design, manufacture and quality can lead widely varying performance characteristics. It has been shown in the previous section that accurate localized stress analyses are difficult to achieve and validate. Nominal membrane stresses relate directly to the composite would be less prone to vessel to vessel variation. While it is difficult to know the localized stress concentrations and other structural inefficiencies, their severity is implicit in a lower result for nominal absolute short term strength. If these penalty factors are independent of load then their influence is equivalent in both stress rupture and burst events. The accurate capture of these characteristics for a particular vessel design/type requires that the actual burst data for that specific design/type of vessel be used in creating the similarity parameter “stress ratio” for the purpose of lifing predictions. The current AIAA S081-2000 standard for Space Systems – COPVs, in fact, recommends the notion of using actual vessel burst data as opposed to design allowables generated by other means with dissimilar test articles.
The sections of the Brunswick SAR stress report devoted to flight hardware static fatigue or stress rupture used stress ratios to make life predictions. The ratios were calculated by dividing the LINER2 determined operating fiber stresses by a fiber strength derived from burst pressure values pertaining to a non-flight hardware vessel design. In particular, Brunswick used a burst fiber stress in the denominator of the stress ratio determined from a mean burst of 9 Butyl rubber lined and Kevlar-49® overwrapped vessels (also known as the Lincoln-9). Due to the rubber liner, liner contributions were neglected; the mean nominal fiber strength at burst was 347 ksi. determined by burst pressure multiplied by the ratio ftR . Using this value for burst fiber strength none of the vessels analyzed in the Brunswick SAR exceeded 47% stress ratio and positive margin of safety was noted based upon these analyses.
American Institute of Aeronautics and Astronautics
19
Figure 8 Stress Rupture Life Curves for Several Classes of Vessels and Strands Showing the Similarities
Figure 9 Kevlar-49® Fiber Strength Data Illustrating the Effects of Size, Scale, and Multiaxial Nature of Loads
The COPV structures sub-team performed an independent elastic-plastic analysis based on thin shell
theory/netting analysis to determine nominal fiber stresses at MEOP and the actual recorded burst pressure (Qualification test reports of flight hardware). As shown in Table 1 the operating fiber stresses were found to be in
American Institute of Aeronautics and Astronautics
20
reasonable agreement with the results in the Brunswick SAR. However, Table 3 shows that at Qualification Burst the liner accounts for at least 14.5 to 17.0% of load share in the flight hardware. The resulting burst fiber stresses were in some cases about 23% lower than the mean burst fiber stress reported for the Lincoln–9. For example the OMS-HE was found to have a nominal burst fiber stress of about 267 Ksi. The COPV/ITA determined by using MEOP (accounting for rate effects, liner sharing etc) and qual-burst fiber stresses, the stress ratio to be 0.58. This is an additional 0.13 over the 0.45 stress ratio used in the Brunswick SAR. This alternative entry point into the stress rupture life data accounted for the single largest impact on the perceived safety and reliability of the shuttle COPV flight hardware.
VI. Conclusions and Continuing Work This paper surveys a large body of work conducted by the NESC ITA’s Structures sub-team. Two principle
findings had a significant impact on NASA’s understanding of the margin of safety for continued operation of Kevlar-49®/Epoxy COPVs in its shuttle fleet.
1.) The mechanical response of COPVs must be accurately known in all circumstances; seemingly unimportant liner influences can have a significant impact on the state of stress and deformation in the composite overwrap.
2.) The entry point into the lifing curves must be based on the actual characteristics of the vessel to be assessed; currently this is the stress ratio determined by the ratio of a vessel’s fiber stress at MEOP to its short term fiber strength determined by actual burst tests of the vessel in question.
Work continues to objectively validate the current lifing parameter and to thoroughly investigate the complex
structural response of COPVs for the most accurate and reliable lifing approach. The absolute values of operating stress continue to remain unverified due to the absence of residual stress measurements on actual vessels. Furthermore, the structures team has found that calibration of the existing experimental deformation data against the mechanical response models indicates the models to be overly compliant. A probe into hardware archives has turned up internal volume measurements that show the converse – larger than predicted internal volume changes. The incompatibility can be rationalized by an increased through thickness compliance of the overwrap. Eddy current thickness measurements and careful internal and external strain measurements by the WSTF test team currently support this hypothesis12. Application of 3D elastic solutions14 show this can only be the case if the ratio of in-plane to out-of-plane stiffness for the laminate is order(s) of magnitudes greater than current constitutive models predict. Further supporting experiments are required to verify this hypothesis. These are planned at the NASA – Glenn Research Center and at Cornell University to measure residual stresses, overwrap mechanical properties and microstructure parameters. The NESC is also vetting non-linear 3D analytical models based on plasticity and foam crushing analogues which indicate that the through thickness variation of fiber stress may be strongly load dependent. These findings support the possibility that stress localization factors may be load dependent and that a more accurate analysis may provide favorable reductions in the operating stress ratios. Favorable adjustments to the stress ratio may also occur if residual stress measurements show that they are lower than predicted by the current models. The results will be reported in subsequent papers.
References 1NESC Independent Technical Assessment Final Report 04-016 “Orbiter Kevlar/Epoxy Composite Overwrapped Pressure Vessel Flight Rationale” (in preparation). 2Lark, R.F., “Filament-wound Composite Vessel Materials Technology”, NASA TMX – 68196, 1973. 3Lark, R.F., “Recent Advances in Lightweight, Filament-wound Composite Pressure Vessel Technology”, NASA TM 73699, 1977. 4Faddoul, J. R. Structural Considerations in Design of Lightweight Glass –Fiber Composite Pressure Vessels, “ in Proceedings of the Second International Conference on Pressure Vessel Technology. Part I – Design and Analysis, ASME, 1973 pp. 561-572. 5Landes, R. E. Glass Fiber Reinforced Metal Pressure Vessel Design Guide, 1973, NASA CR-120917, Structural Composites Industries, Inc. 6Ecord, G. M. Filament wound pressure vessels with load sharing liners for Space Shuttle Orbiter applications National Symposium and Exhibition on Bicentennial of materials progress, Los Angeles, CA, April 6-8, 1976 , JAN 1, 1976
American Institute of Aeronautics and Astronautics
21
7Landes, R. E. Filament –Reinforced Metal Composite Pressure Vessel Evaluation and Performance Demonstration, Structural Composites Industries, Inc. Report SCI-75154, 1976; also NASA CR-134975 8Schmidt, W. W. and Ecord, G. M Static fatigue life of Kevlar aramid/epoxy pressure vessels at room and elevated temperatures, AIAA PAPER 83-1328 ; Jun 1, 1983 9Johns, R. H. and Kaufman, A., Filament-Overwrapped Metallic Cylindrical Pressure Vessels, in AIAA/ASME Seventh Structures and Materials Conference, AIAA, 1966, pp. 52-63. 10Toland, H., et al., “Stress Rupture Life of Kevlar/Epoxy Overwrapped Pressure Vessels”, LLNL Report # N78-33492, Livermore, California, March 31, 1978. 11Thesken J.C. et al (2006) ”A Theoretical Investigation of Composite Overwrapped Pressure Vessel (COPV) Mechanics Applied to the NASA Full Scale Tests”The 21st ATC-ASC Dearborn, MI ASC 12Green, N., et al.(2006) “Experimental Investigation of Composite Overwrapped Pressure Vessels for Stress Rupture Life” The 21st ATC-ASC Dearborn, MI. 13Phoenix, S. Leigh, and Wu, E.M., “Statistics for The Time Dependent Failure of Kevlar-49/Epoxy Composites: Micromechanical Modeling and Data Interpretation.” IUTAM Symposium on Mechanics of Composite Materials, Pergamon (1983):135 14Gerstle, F.P. Jr., “Analysis of Filament-Reinforced Spherical Pressure Vessels”, ASME STP 546, pp 604-631, 1974. 15Thesken, J.C. et al “Time Temperature Dependent Response of Filament Wound Composites for Flywheel Rotors” Composite materials: Testing and Design Fourteenth Volume, ASTM STP 1436. C. E. Bakis,Ed. ASTM International, West Conshohocken, PA, 2003. 16Roark, R. J. and Young, W. C. Formulas for Stress and Strain, (1975)fith edition, McGraw-Hill Inc.
17Brunswick Corporation Defense Division, Stress Analysis Report for Shuttle Tankage, Report 9990-SA-03, Revised January 31, 1978.