complex disease and susceptibility gene environment disease a disease b disease c multifactorial...
TRANSCRIPT
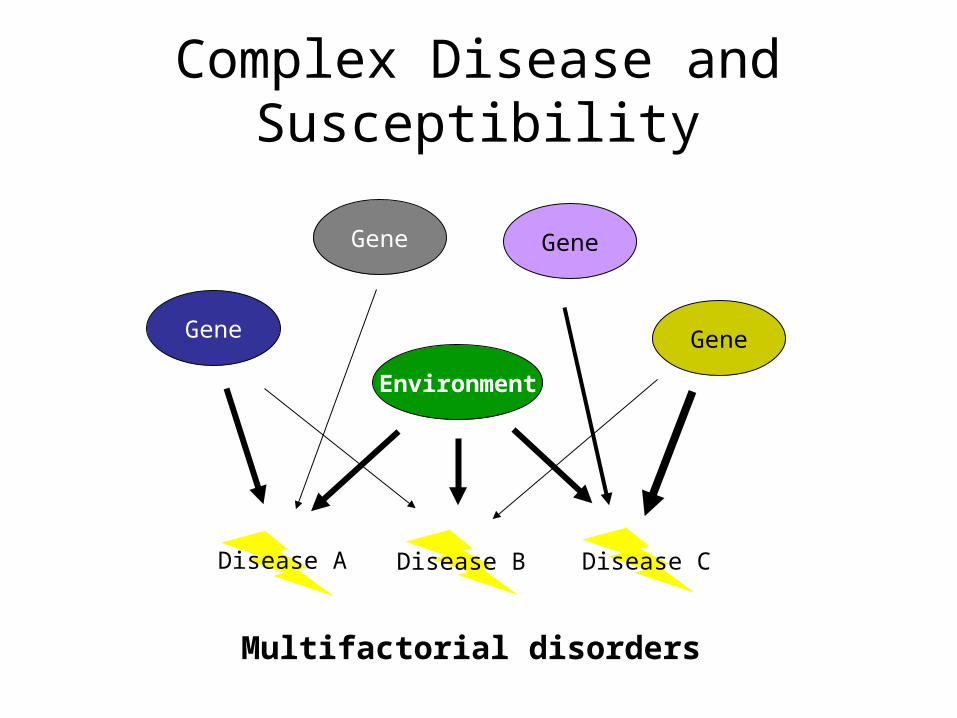
Complex Disease and Susceptibility
Gene
Gene
Gene
Gene
Environment
Disease A Disease B Disease C
Multifactorial disorders
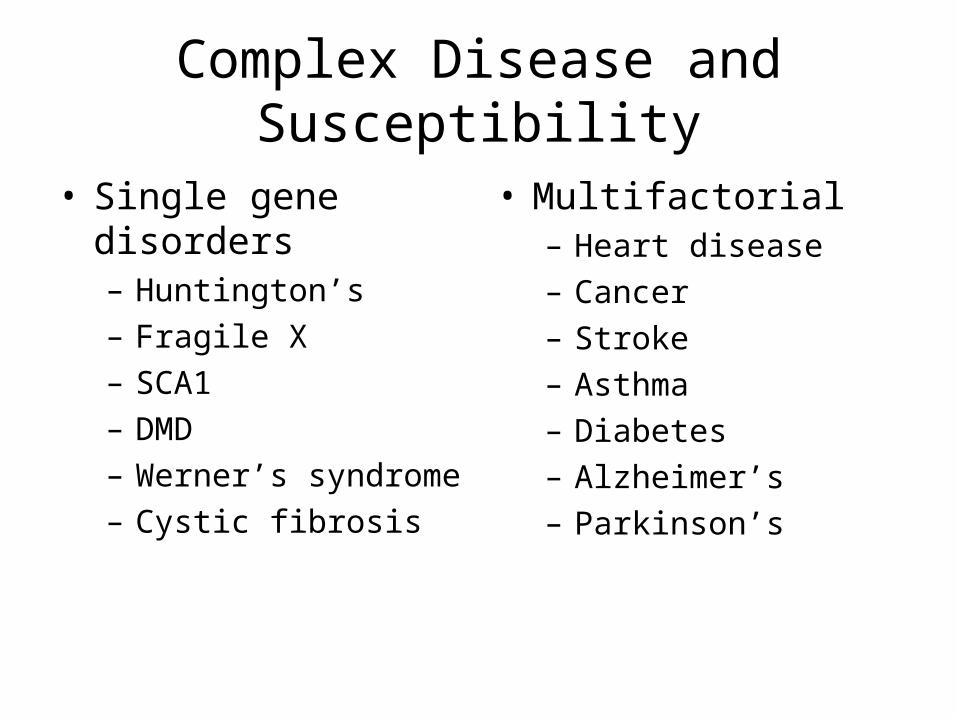
Complex Disease and Susceptibility
• Single gene disorders– Huntington’s– Fragile X– SCA1– DMD– Werner’s syndrome– Cystic fibrosis
• Multifactorial– Heart disease– Cancer– Stroke– Asthma– Diabetes– Alzheimer’s– Parkinson’s
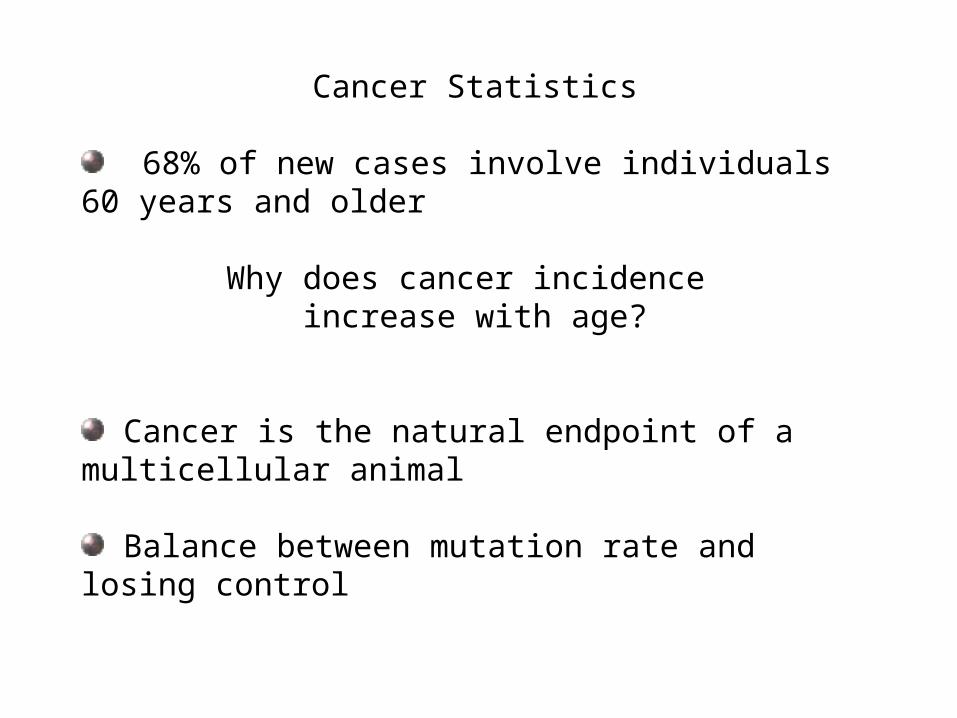
Cancer Statistics
68% of new cases involve individuals 60 years and older
Why does cancer incidence increase with age?
Cancer is the natural endpoint of a multicellular animal
Balance between mutation rate and losing control
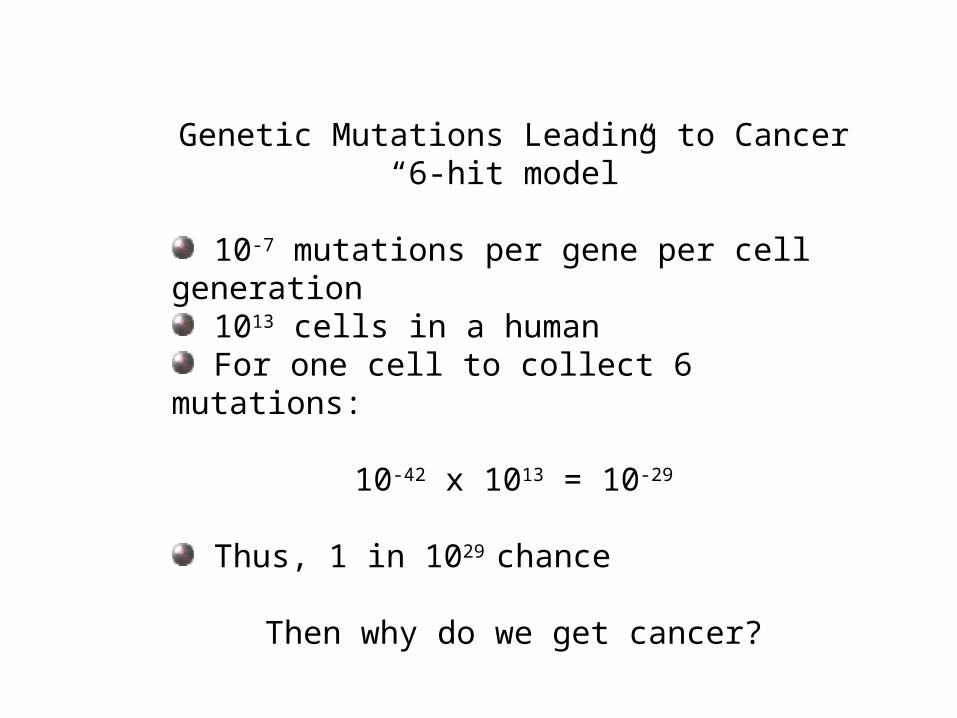
Genetic Mutations Leading to Cancer“6-hit model”
10-7 mutations per gene per cell generation 1013 cells in a human For one cell to collect 6 mutations:
10-42 x 1013 = 10-29
Thus, 1 in 1029 chance
Then why do we get cancer?
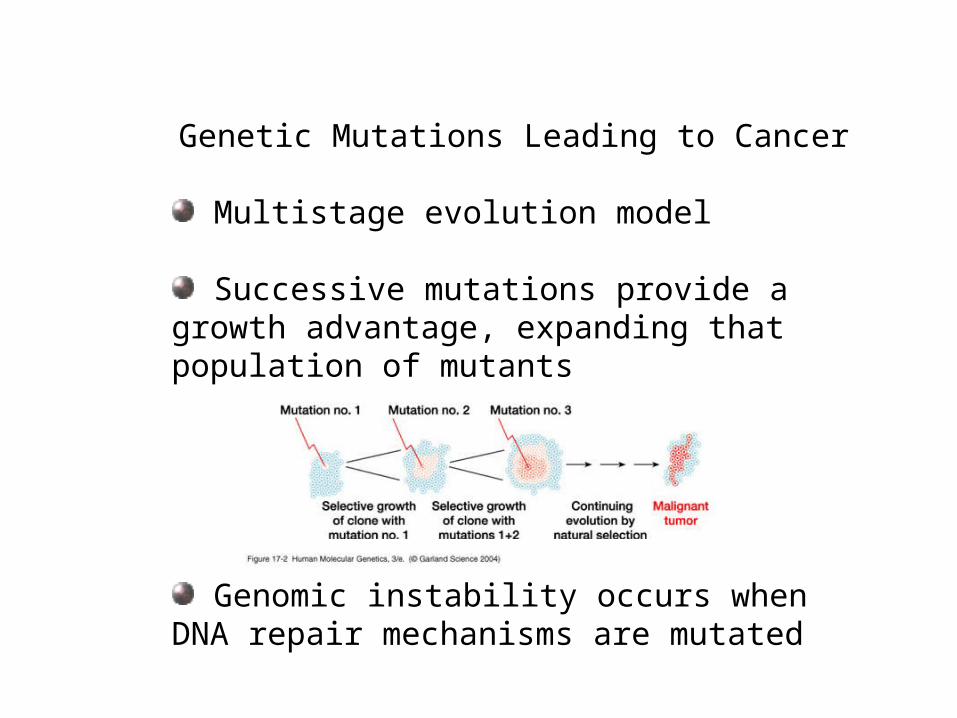
Genetic Mutations Leading to Cancer
Multistage evolution model
Successive mutations provide a growth advantage, expanding that population of mutants
Genomic instability occurs when DNA repair mechanisms are mutated
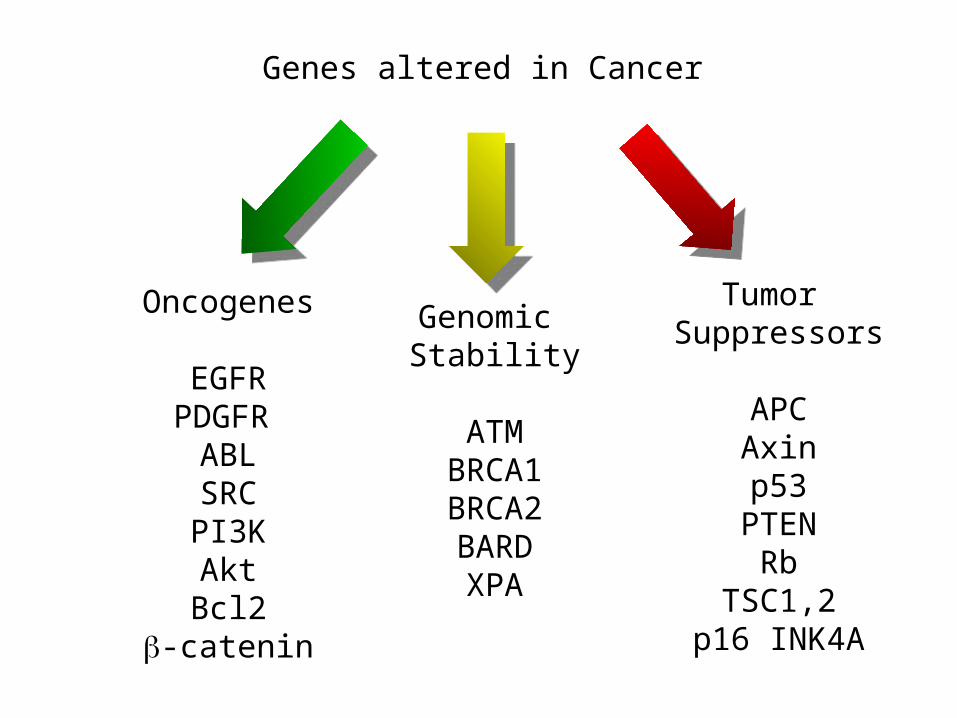
Genes altered in Cancer
Oncogenes
EGFRPDGFR
ABLSRCPI3KAktBcl2
-catenin
Genomic Stability
ATMBRCA1BRCA2BARDXPA
Tumor Suppressors
APCAxinp53
PTENRb
TSC1,2p16 INK4A
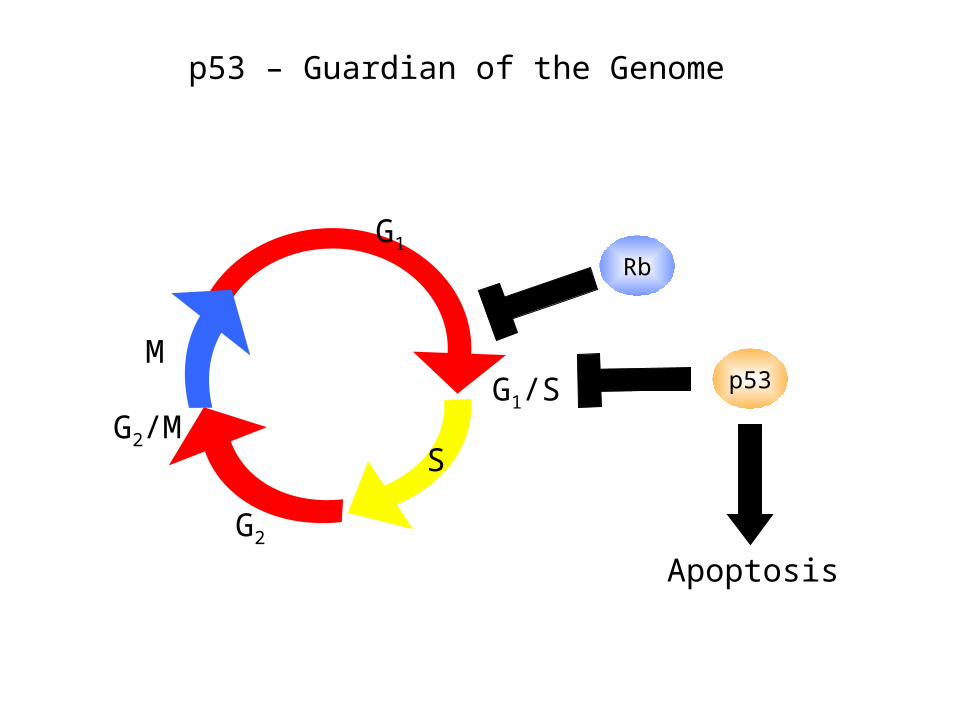
S
G1/S
G2
G2/M
M
G1
p53
Rb
Apoptosis
p53 – Guardian of the Genome
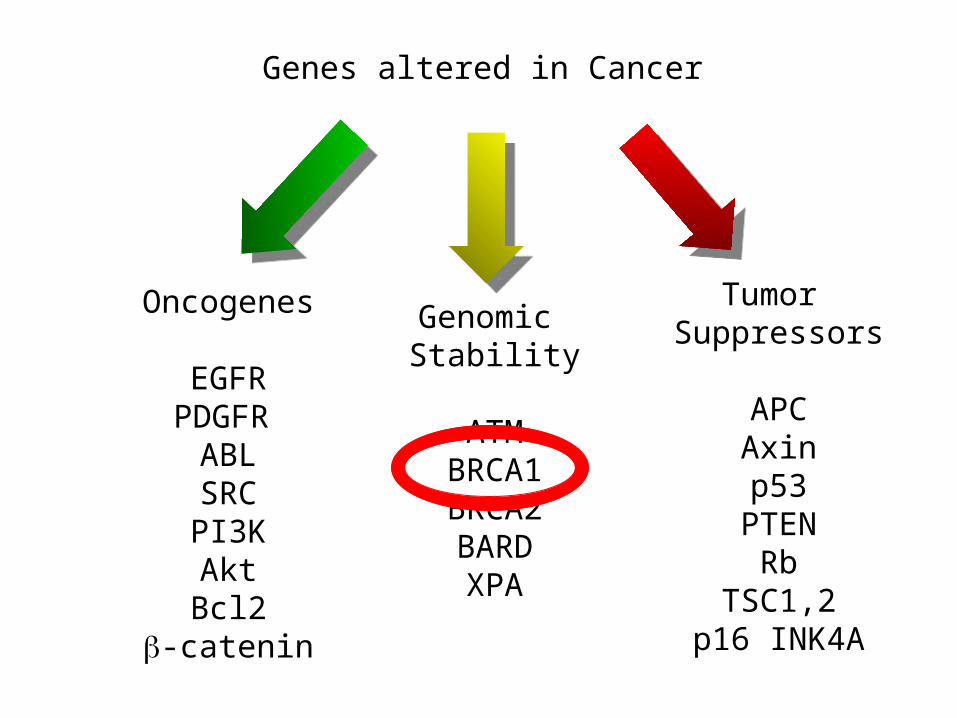
Genes altered in Cancer
Oncogenes
EGFRPDGFR
ABLSRCPI3KAktBcl2
-catenin
Genomic Stability
ATMBRCA1BRCA2BARDXPA
Tumor Suppressors
APCAxinp53
PTENRb
TSC1,2p16 INK4A
By Clark et al; Part B Cropped from original Fig 1 by SLE346_B3 [CC BY-SA 3.0 (http://creativecommons.org/licenses/by-sa/3.0)]
Ceshi Chen, Arun K. Seth and Andrew E. Aplin

Complex Disease and Susceptibility
• Single gene disorders– Huntington’s– Fragile X– SCA1– DMD– Werner’s syndrome– Cystic fibrosis
• Multifactorial– Heart disease– Cancer– Stroke– Asthma– Diabetes– Alzheimer’s– Parkinson’s
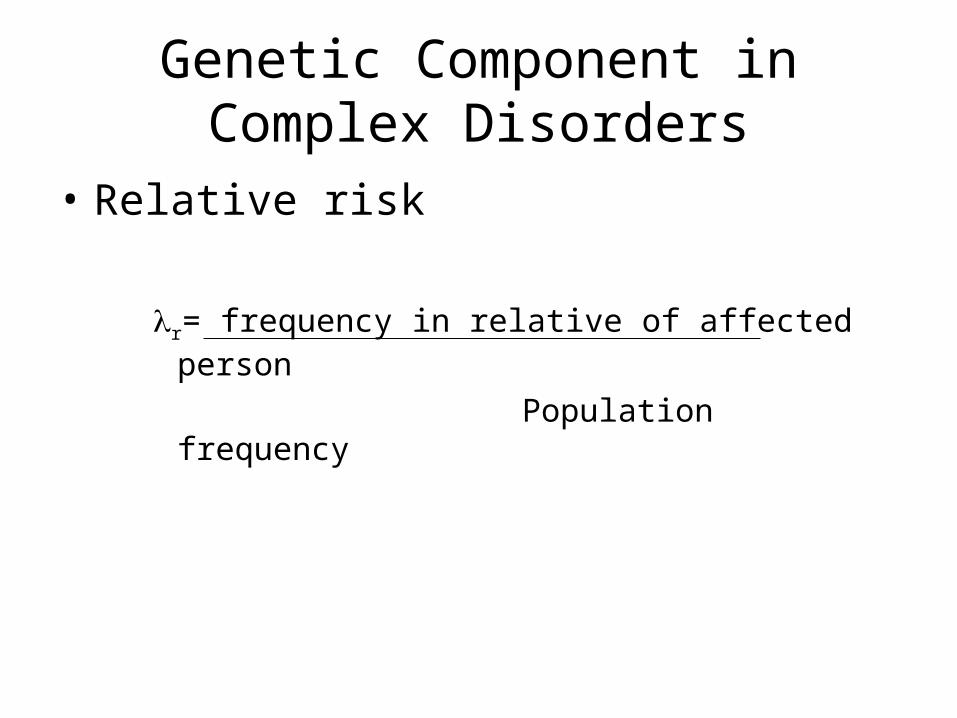
Genetic Component in Complex Disorders
• Relative risk
r= frequency in relative of affected person
Population frequency
Genetic Component in Complex Disorders
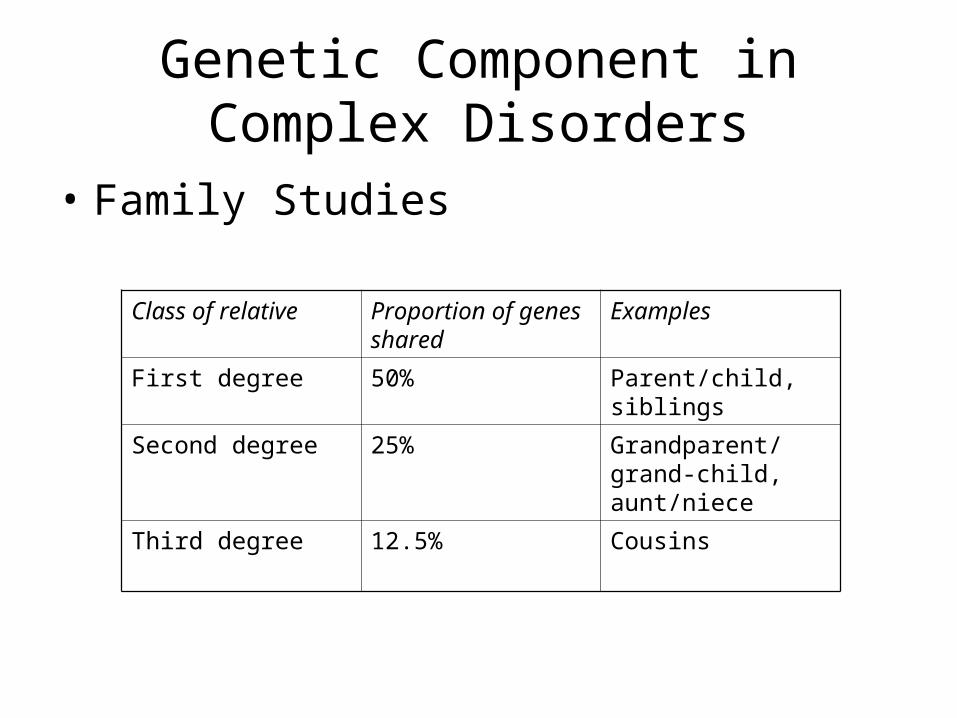
• Family Studies
Class of relative Proportion of genes shared
Examples
First degree 50% Parent/child, siblings
Second degree 25% Grandparent/grand-child, aunt/niece
Third degree 12.5% Cousins
Genetic Component in Complex Disorders
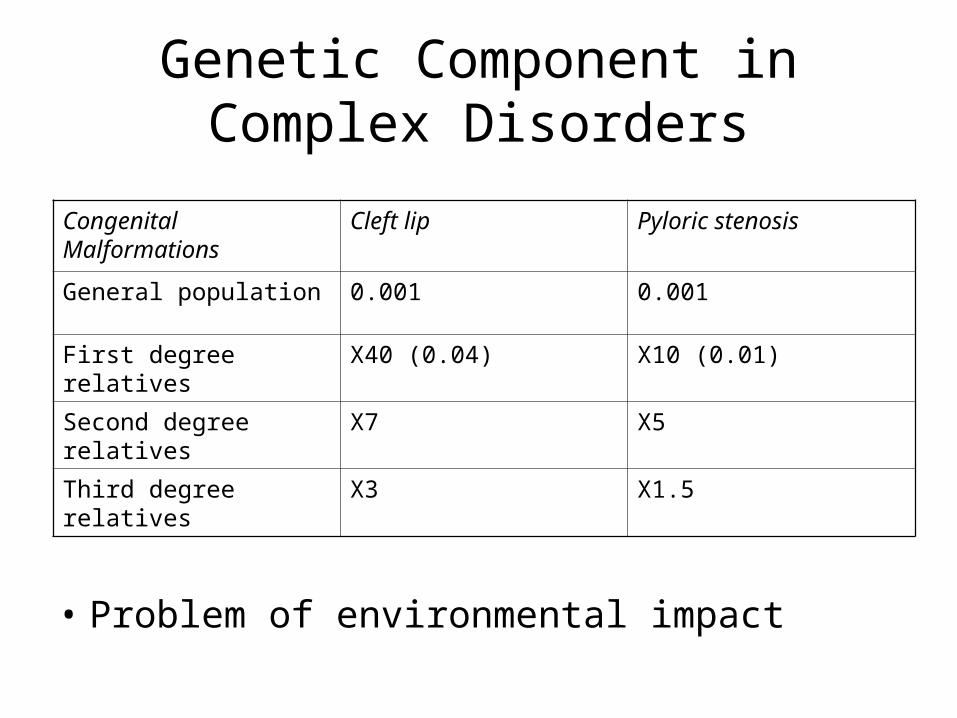
• Problem of environmental impact
Congenital Malformations
Cleft lip Pyloric stenosis
General population 0.001 0.001
First degree relatives X40 (0.04) X10 (0.01)
Second degree relatives X7 X5
Third degree relatives X3 X1.5
Genetic Component in Complex Disorders
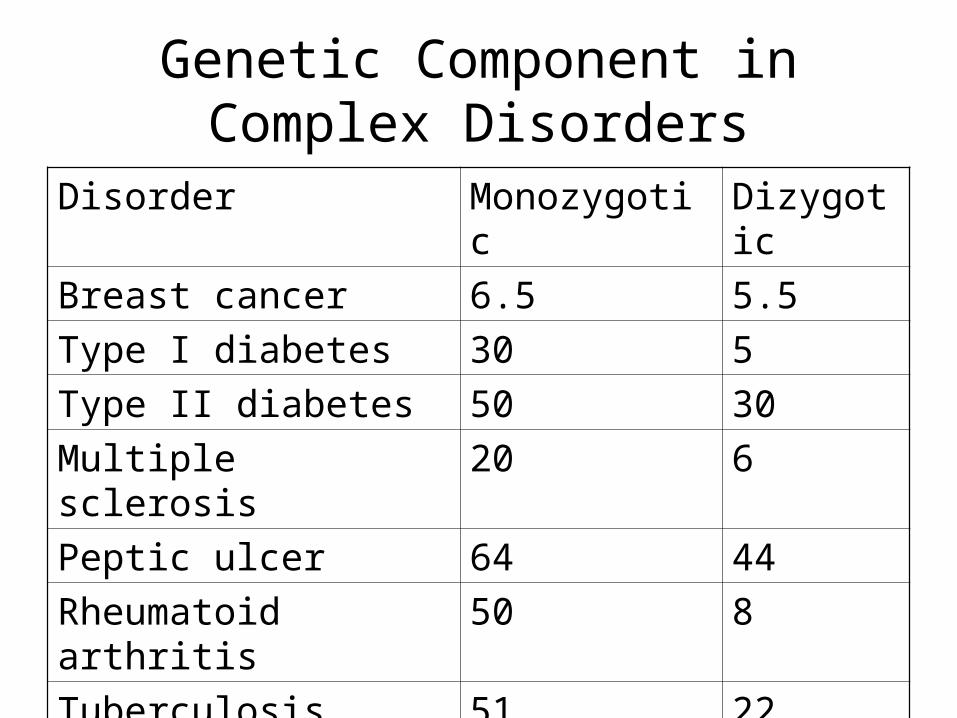
Disorder Monozygotic Dizygotic
Breast cancer 6.5 5.5
Type I diabetes 30 5
Type II diabetes 50 30
Multiple sclerosis 20 6
Peptic ulcer 64 44
Rheumatoid arthritis 50 8
Tuberculosis 51 22
Genetic Component in Complex Disorders
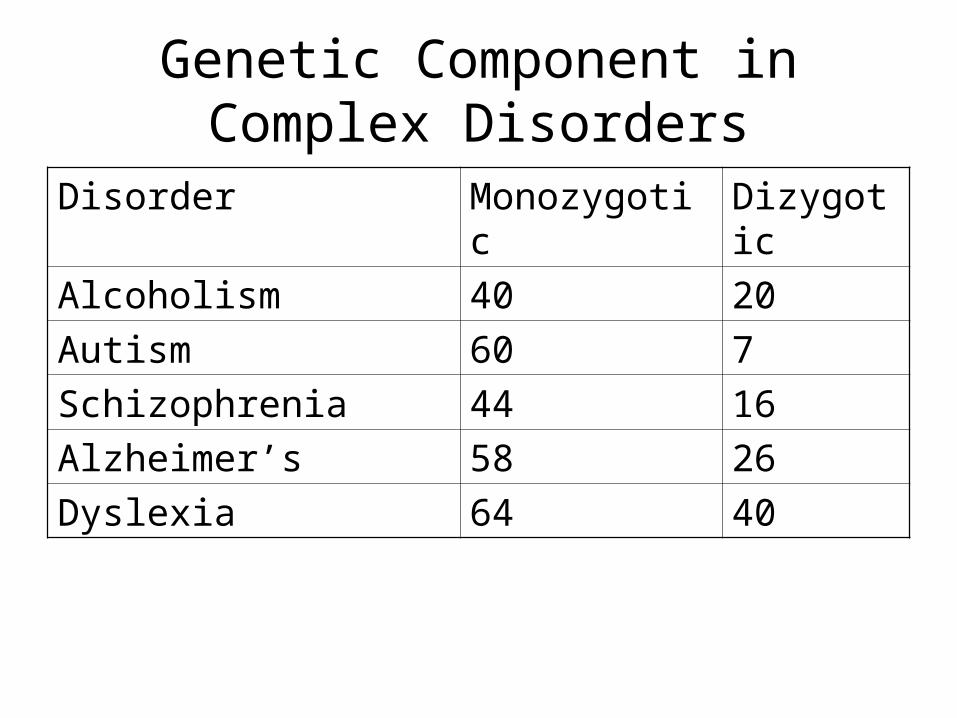
Disorder Monozygotic Dizygotic
Alcoholism 40 20
Autism 60 7
Schizophrenia 44 16
Alzheimer’s 58 26
Dyslexia 64 40
• In polygenic diseases, risk (susceptibility) alleles increase the phenotypic value
• Traits may appear continuously variable
• Traits may appear discontinuous
Genetic Component in Complex Disorders
Genetic Component in Complex Disorders
• How to find susceptibility gene?– Four main approaches
1. Candidate gene
2. Parametric linkage analysis
3. Non-parametric linkage analysis
4. Population association studies
Candidate gene
• Before searching the whole genome, think about what genes may be involved– Eg., Type I diabetes – Some genes involved in cell-mediated
immunity are located on chromosome 6 (Human leukocyte antigen region)
– Linkage between Type I diabetes and HLA was closely examined
• After a small genomic region is isolated, determine best candidate gene
Parametric Linkage Analysis
• Standard LOD score analysis, as used for single-gene disorders
Parametric Linkage Analysis
• Eg., breast cancer susceptibility genes• Collect family history of >1500 breast cancer
patients
– Some family histories showed multiple cases occurring at early ages – could be a Mendelian allele segregating
– Best model suggested a dominant single-gene allele with a population frequency of 0.0006 – this suggested about 5% of total breast cancers
Parametric Linkage Analysis
• Eg., breast cancer susceptibility genes• Collect family history of >1500 breast cancer
patients
– Now, look for families with multiple breast cancer cases with early onset
– Genotype family members and look for linkage
– Linkage (significant LOD score) to breast cancer was found to a marker on 17q21
Parametric Linkage Analysis
• Eg., breast cancer susceptibility genes• Collect family history of >1500 breast cancer
patients
– The gene involved was cloned, like other single-gene disorders
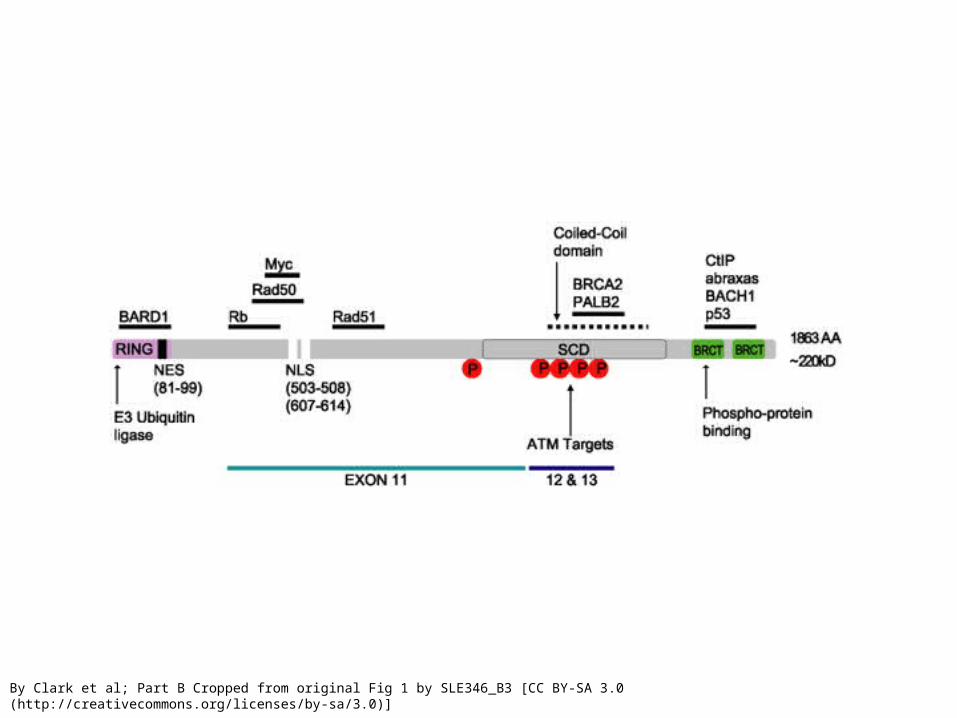
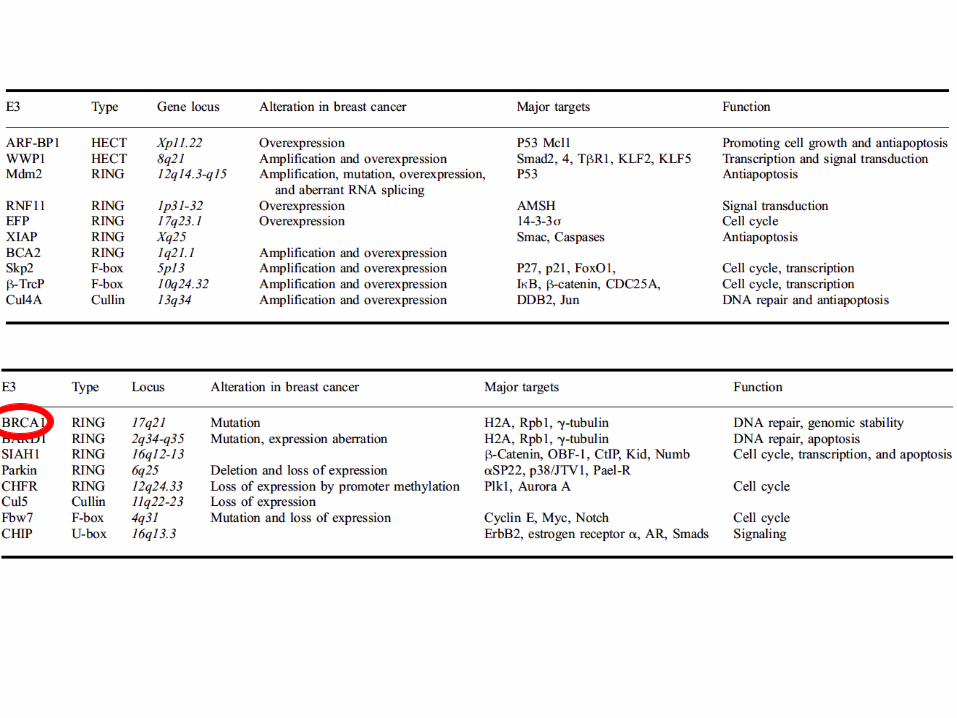
– Breast cancer (BRCA) 1 gene– tumor suppressor gene involved in genomic stability
– LOH leads to high penetrance of breast cancer, as well as ovarian cancer
Parametric Linkage Analysis
• Eg., breast cancer susceptibility genes• Collect family history of >1500 breast cancer
patients
– However, examination of BRCA1 mutations outside of affected families suggests lower penetrance
Parametric Linkage Analysis
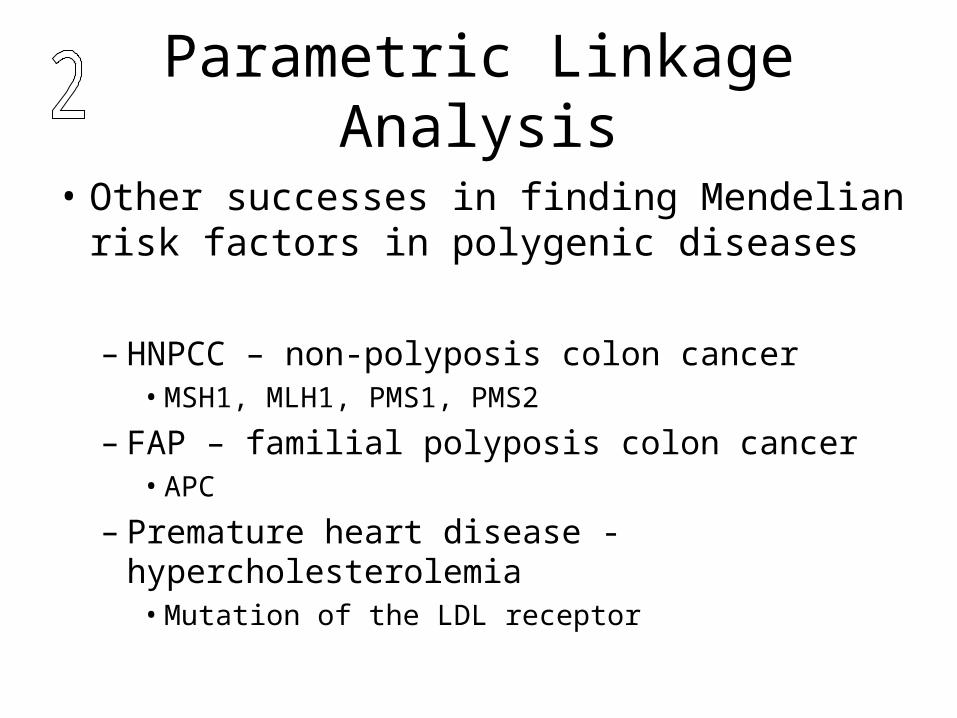
• Other successes in finding Mendelian risk factors in polygenic diseases
– HNPCC – non-polyposis colon cancer• MSH1, MLH1, PMS1, PMS2
– FAP – familial polyposis colon cancer• APC
– Premature heart disease - hypercholesterolemia• Mutation of the LDL receptor
Parametric Linkage Analysis
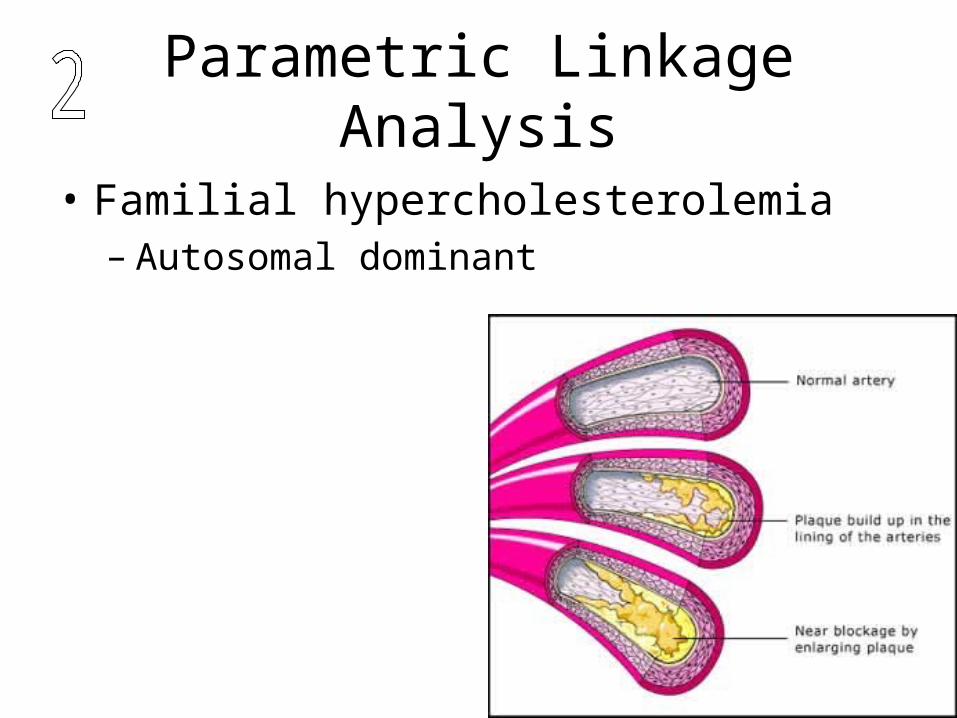
• Familial hypercholesterolemia– Autosomal dominant
Parametric Linkage Analysis
• Familial hypercholesterolemia
• 200 mg/dl - 350 mg/dl - dietary, common
• 400 mg/dl - 600 mg/dl - heterozygous, uncommon
• >600 mg/dl - homozygous, rare
Parametric Linkage Analysis
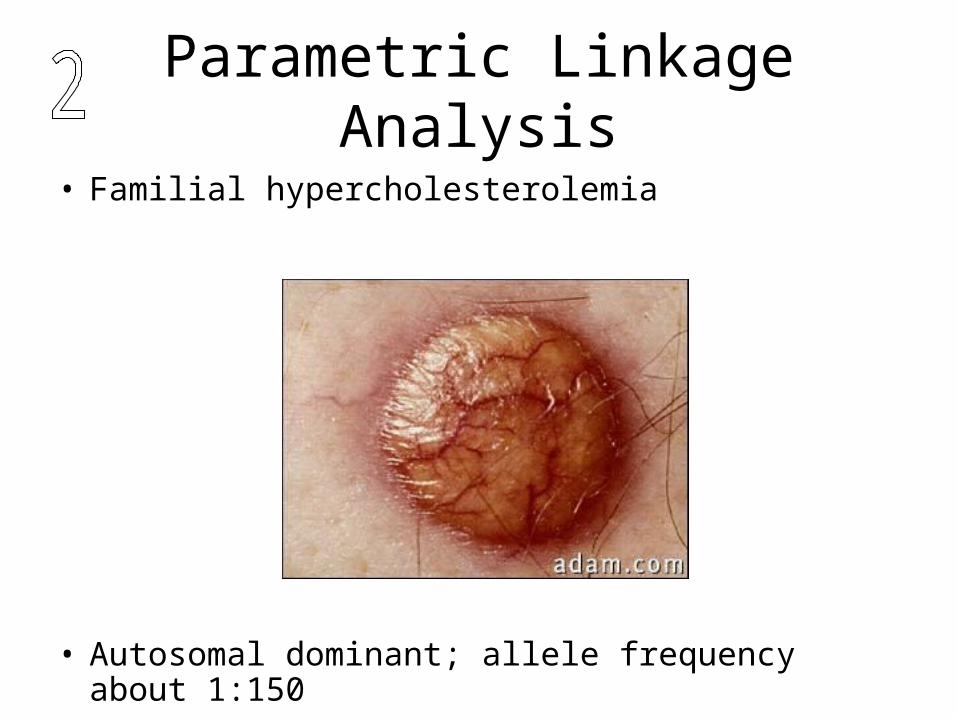
• Familial hypercholesterolemia
• Autosomal dominant; allele frequency about 1:150
Parametric Linkage Analysis
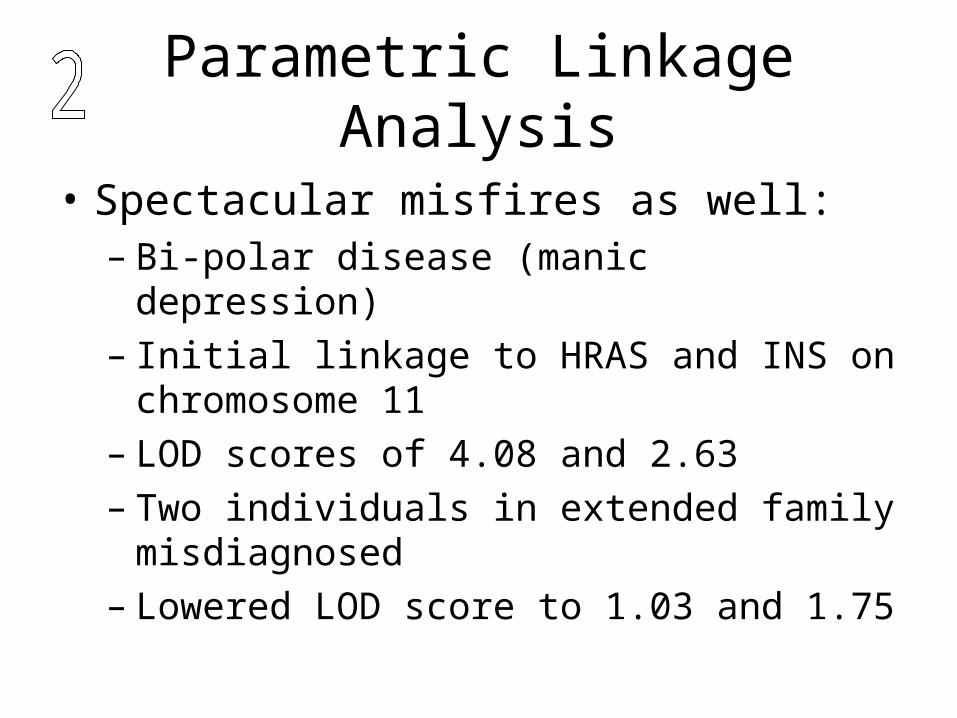
• Spectacular misfires as well:– Bi-polar disease (manic depression)– Initial linkage to HRAS and INS on
chromosome 11– LOD scores of 4.08 and 2.63– Two individuals in extended family
misdiagnosed– Lowered LOD score to 1.03 and 1.75
Non-parametric Linkage Analysis
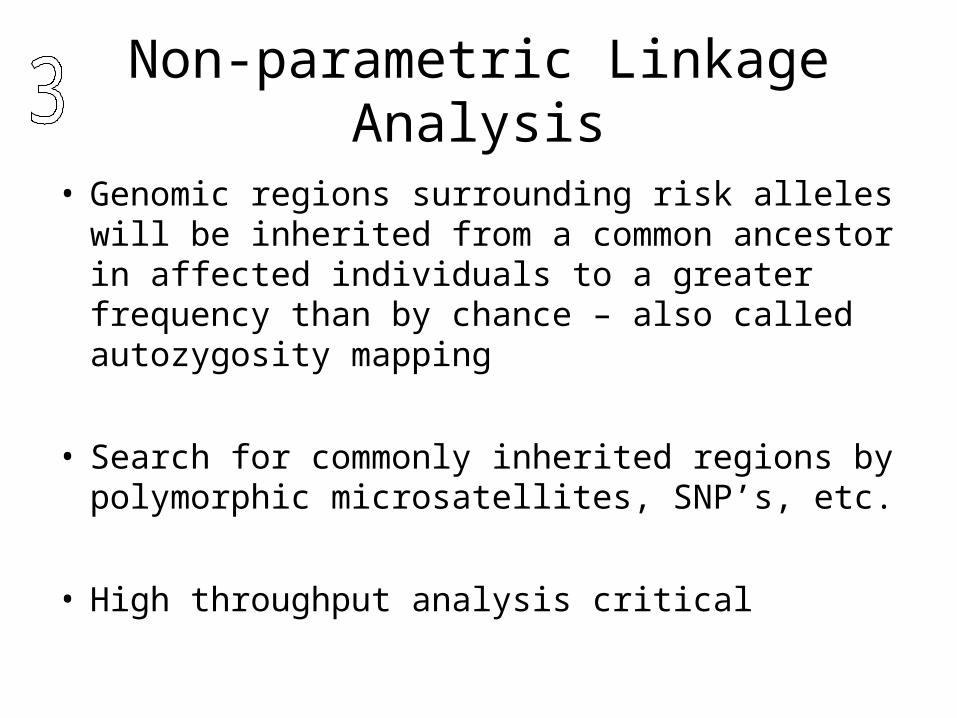
• Genomic regions surrounding risk alleles will be inherited from a common ancestor in affected individuals to a greater frequency than by chance – also called autozygosity mapping
• Search for commonly inherited regions by polymorphic microsatellites, SNP’s, etc.
• High throughput analysis critical
Non-parametric Linkage Analysis
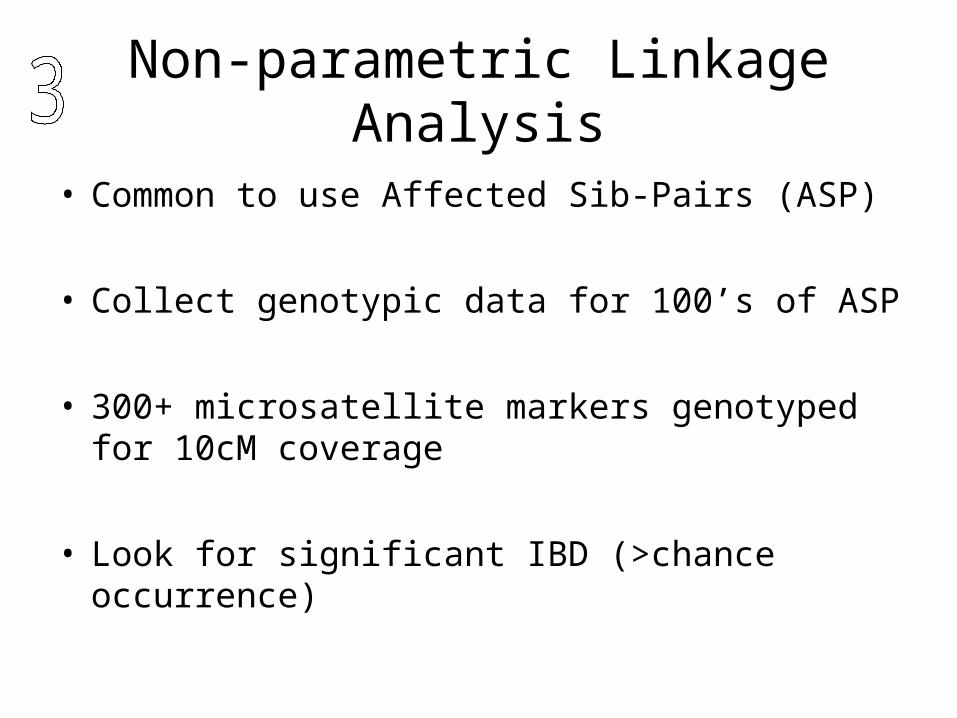
• Common to use Affected Sib-Pairs (ASP)
• Collect genotypic data for 100’s of ASP
• 300+ microsatellite markers genotyped for 10cM coverage
• Look for significant IBD (>chance occurrence)
Non-parametric Linkage Analysis
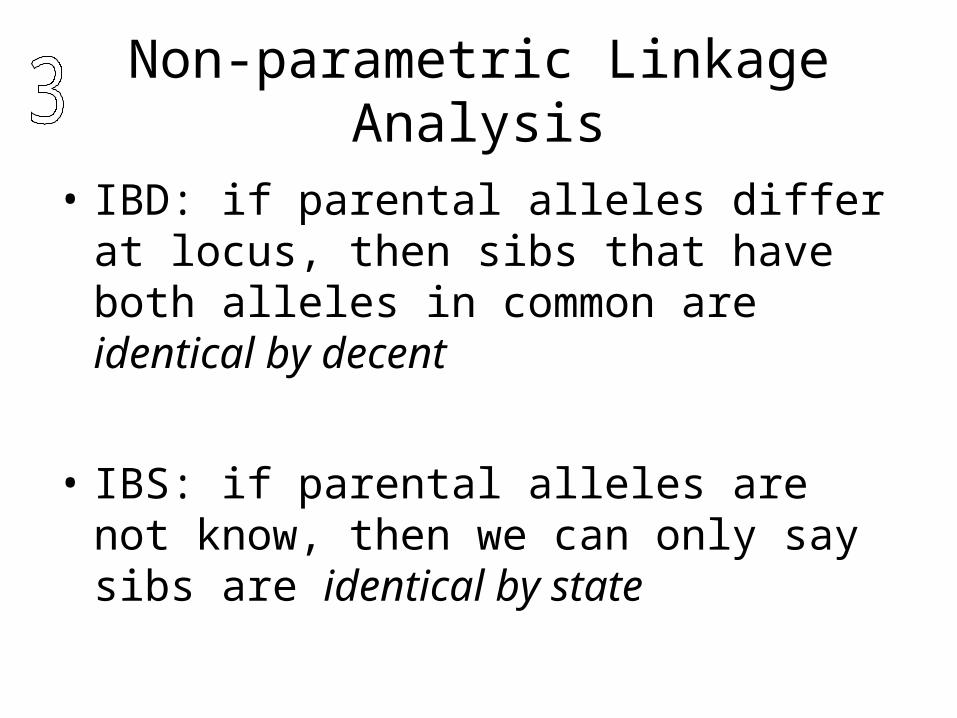
• IBD: if parental alleles differ at locus, then sibs that have both alleles in common are identical by decent
• IBS: if parental alleles are not know, then we can only say sibs are identical by state
Population association studies
• Association studies are carried out on populations
• Look for alleles that segregate with the disease in a whole population– Direct causation– Natural selection– Linkage disequilibrium
Population association studies
• Linkage disequilibrium
• Combination of alleles at two closely linked loci occur more often than expected by chance from population frequencies
• Recombination reduces linkage disequilibrium
Population association studies
• Linkage disequilibrium vs. Linkage Mapping– Mapping is performed on families with few
informative meiosis; LD is determined on populations after many generations
– Mapping will show linkage over large distances; LD is visible only over short distances
Genetic Component in Complex Disorders
• How to find susceptibility genes?– Four main approaches
1. Candidate gene
2. Parametric linkage analysis
3. Non-parametric linkage analysis
4. Population association studies
Alzheimer’s Disease (AD)
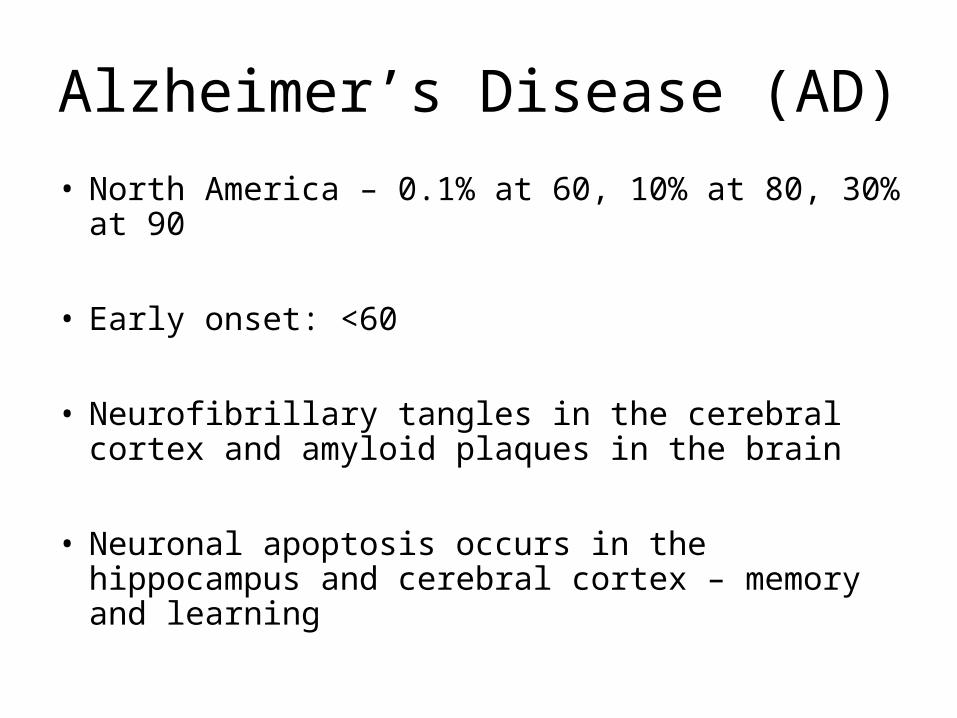
• North America – 0.1% at 60, 10% at 80, 30% at 90
• Early onset: <60
• Neurofibrillary tangles in the cerebral cortex and amyloid plaques in the brain
• Neuronal apoptosis occurs in the hippocampus and cerebral cortex – memory and learning
Alzheimer’s Disease (AD)
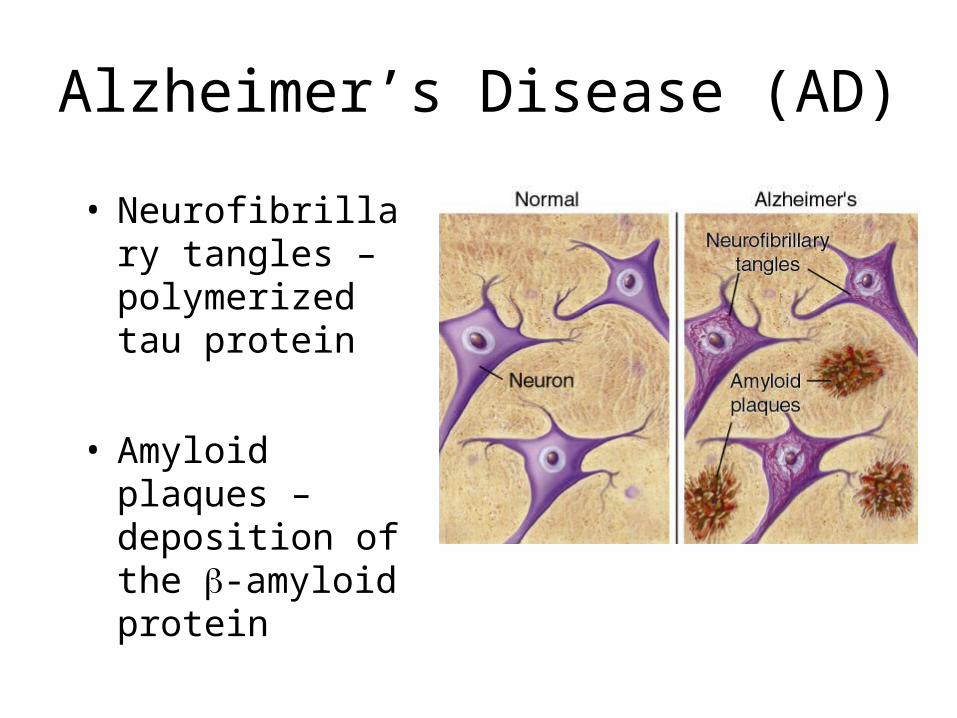
• Neurofibrillary tangles – polymerized tau protein
• Amyloid plaques – deposition of the -amyloid protein
Alzheimer’s Disease (AD)
• Apoptosis of neuronal cells– Sometimes called “Programmed cell death”– Energy-utilizing program of orderly self-
destruction– Organized dismantling of the cell to avoid
autoimmune reaction
Apoptosis
Apoptosis
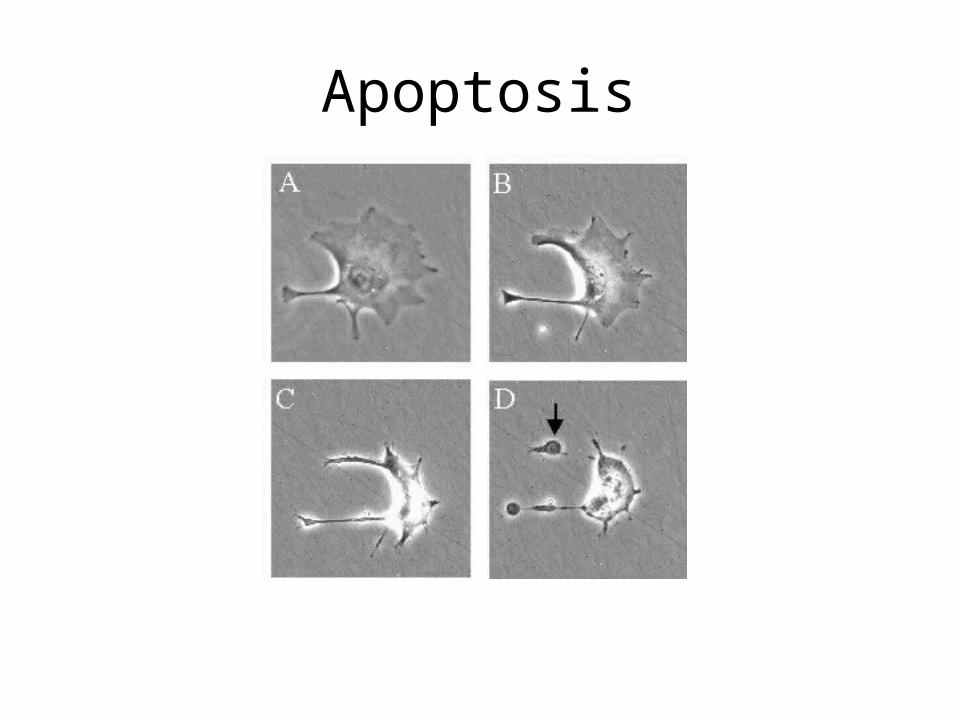
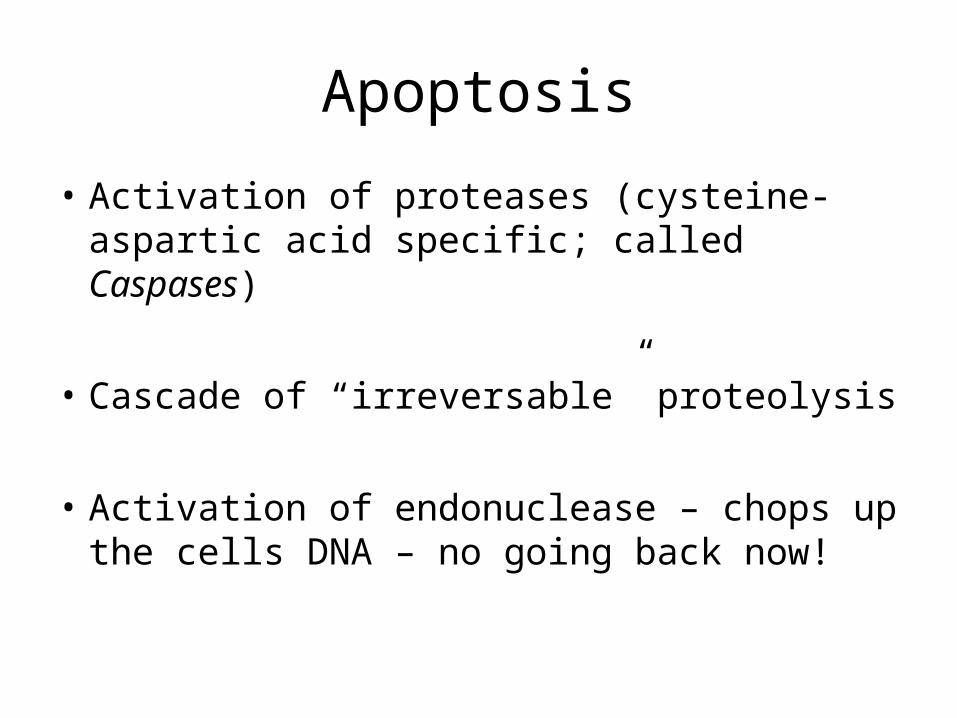
• Activation of proteases (cysteine-aspartic acid specific; called Caspases)
• Cascade of “irreversable” proteolysis
• Activation of endonuclease – chops up the cells DNA – no going back now!
Apoptosis
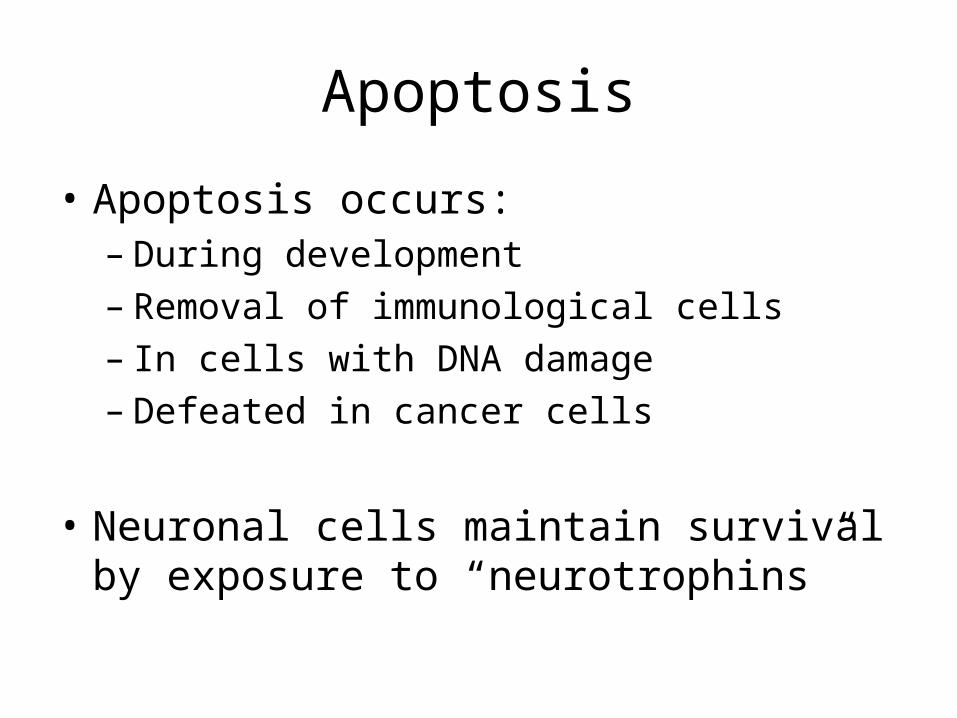
• Apoptosis occurs:– During development– Removal of immunological cells– In cells with DNA damage– Defeated in cancer cells
• Neuronal cells maintain survival by exposure to “neurotrophins”
Search for Susceptibility Alleles for Alzheimer’s Disease
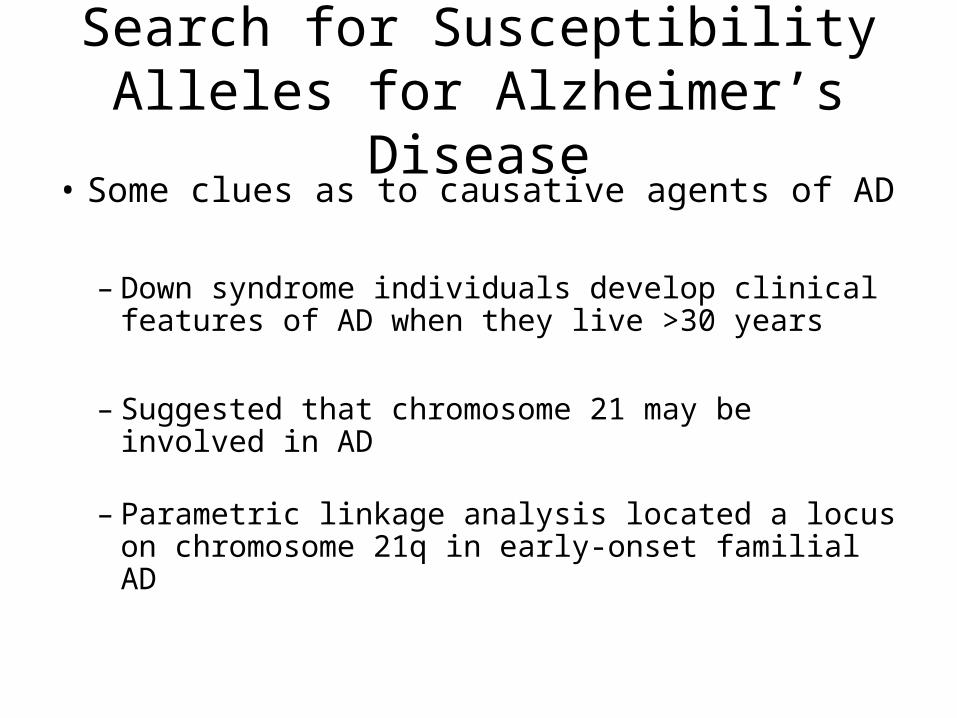
• Some clues as to causative agents of AD
– Down syndrome individuals develop clinical features of AD when they live >30 years
– Suggested that chromosome 21 may be involved in AD
– Parametric linkage analysis located a locus on chromosome 21q in early-onset familial AD
Causative genes in AD
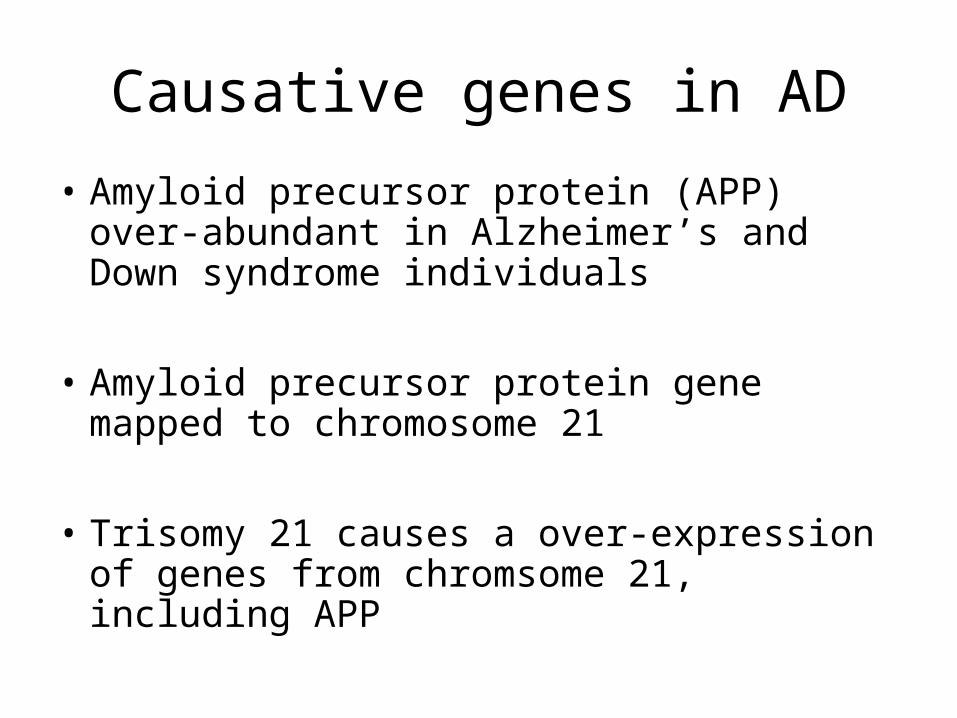
• Amyloid precursor protein (APP) over-abundant in Alzheimer’s and Down syndrome individuals
• Amyloid precursor protein gene mapped to chromosome 21
• Trisomy 21 causes a over-expression of genes from chromsome 21, including APP
Causative genes in AD
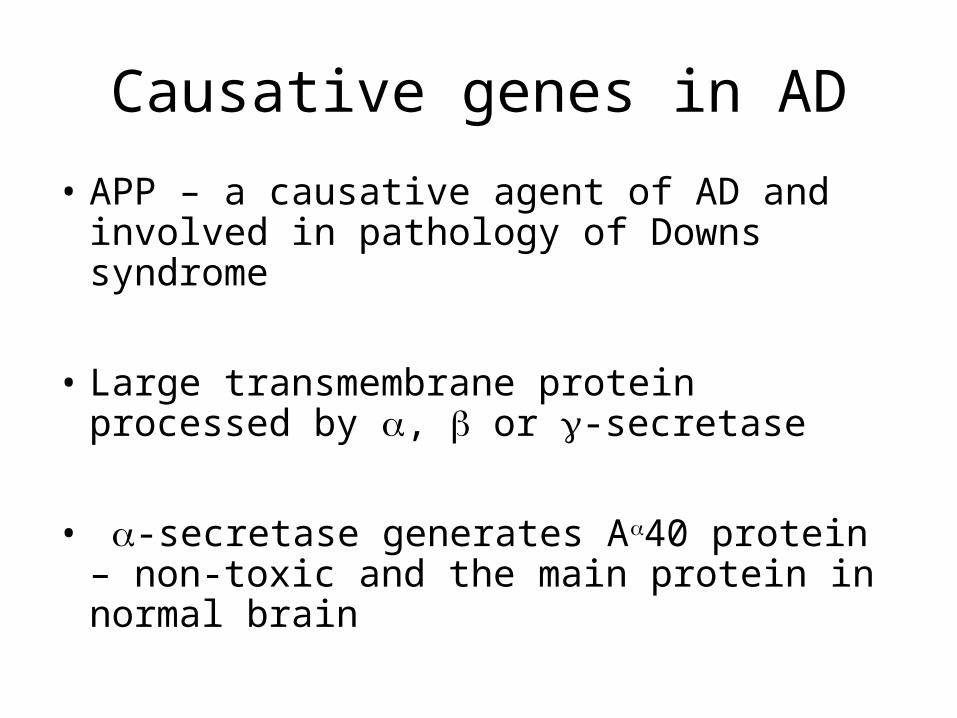
• APP – a causative agent of AD and involved in pathology of Downs syndrome
• Large transmembrane protein processed by , or -secretase
• -secretase generates A40 protein – non-toxic and the main protein in normal brain
Causative genes in AD
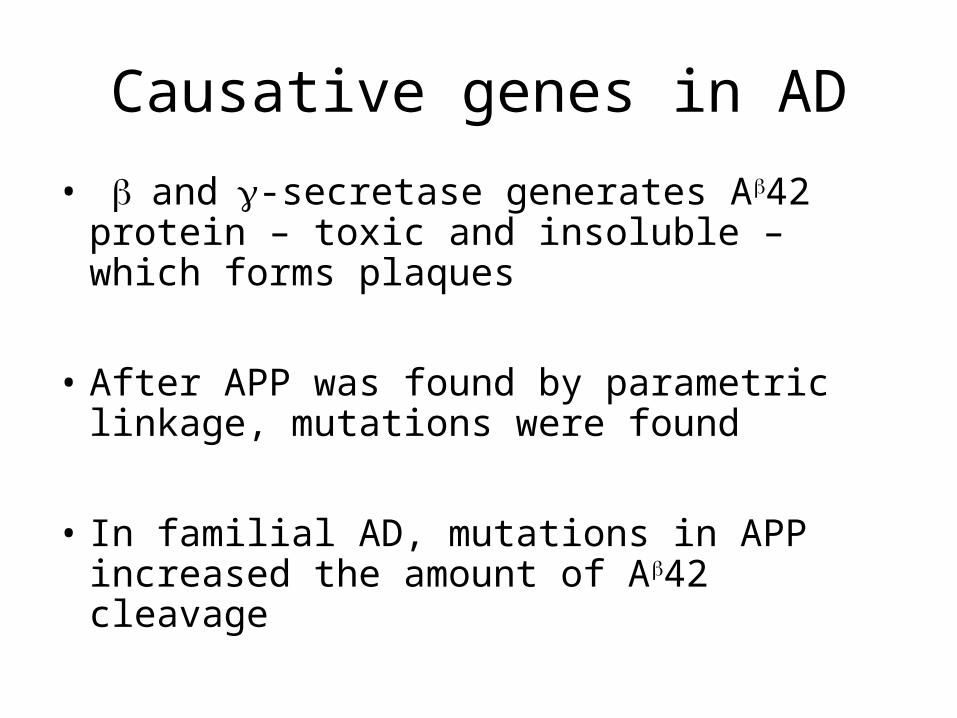
• and-secretase generates A42 protein – toxic and insoluble – which forms plaques
• After APP was found by parametric linkage, mutations were found
• In familial AD, mutations in APP increased the amount of A42 cleavage
Causative genes in AD
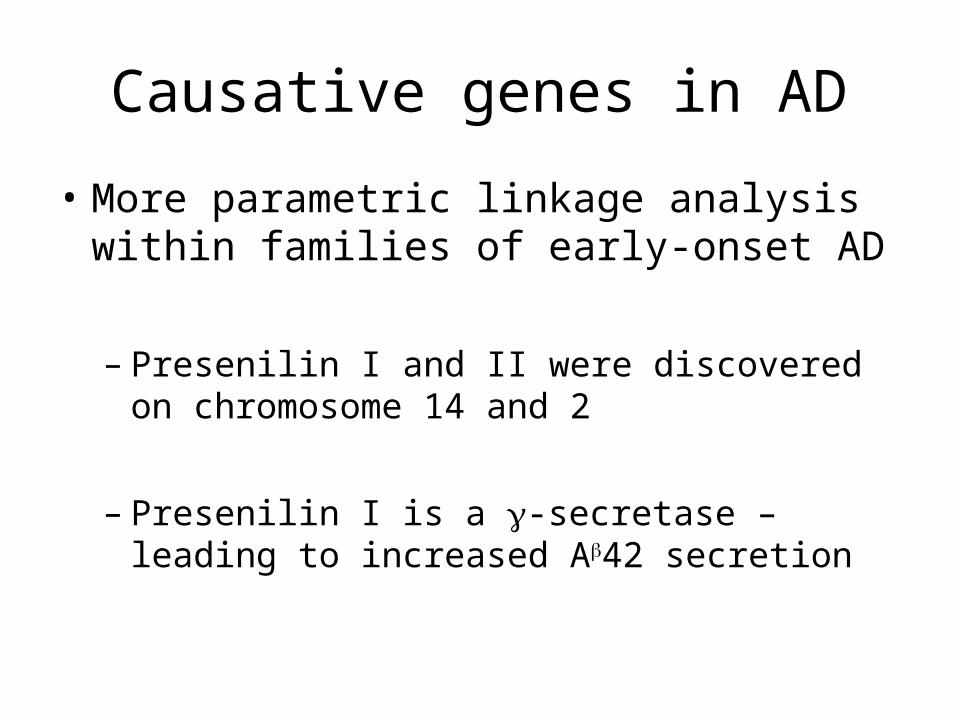
• More parametric linkage analysis within families of early-onset AD
– Presenilin I and II were discovered on chromosome 14 and 2
– Presenilin I is a -secretase – leading to increased A42 secretion
Causative genes in AD
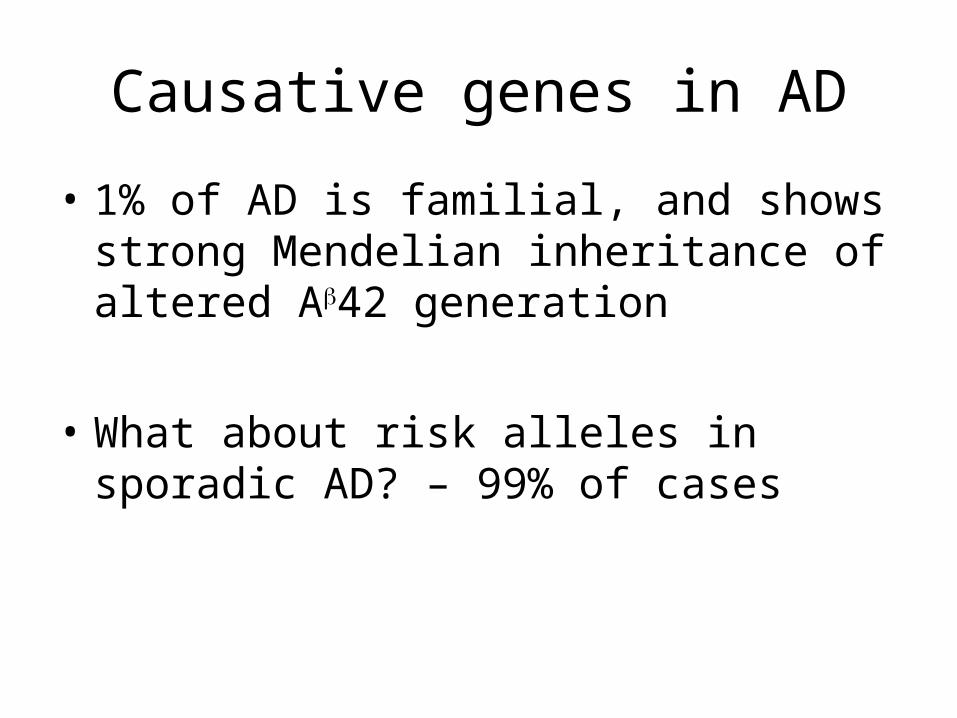
• 1% of AD is familial, and shows strong Mendelian inheritance of altered A42 generation
• What about risk alleles in sporadic AD? – 99% of cases
Causative genes in AD
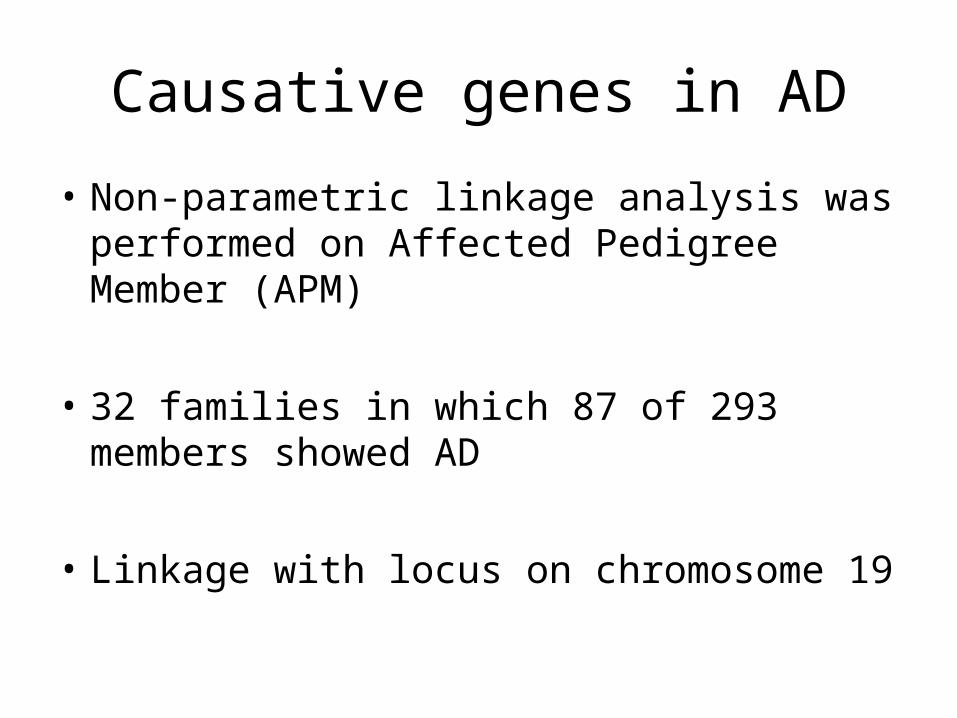
• Non-parametric linkage analysis was performed on Affected Pedigree Member (APM)
• 32 families in which 87 of 293 members showed AD
• Linkage with locus on chromosome 19
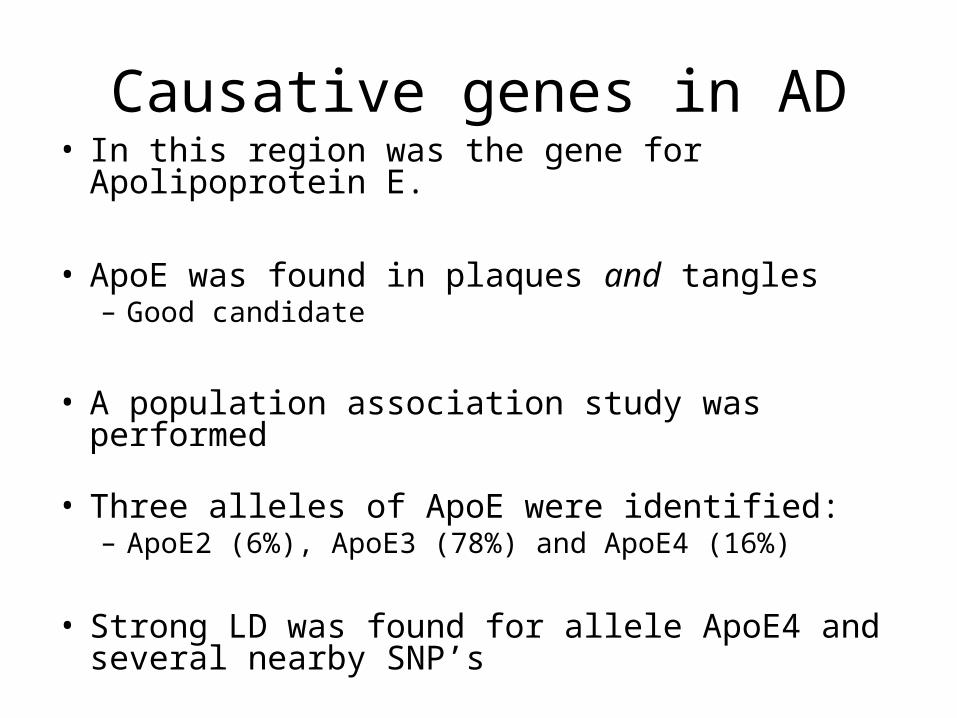
Causative genes in AD• In this region was the gene for Apolipoprotein E.
• ApoE was found in plaques and tangles– Good candidate
• A population association study was performed
• Three alleles of ApoE were identified:– ApoE2 (6%), ApoE3 (78%) and ApoE4 (16%)
• Strong LD was found for allele ApoE4 and several nearby SNP’s
Causative genes in AD
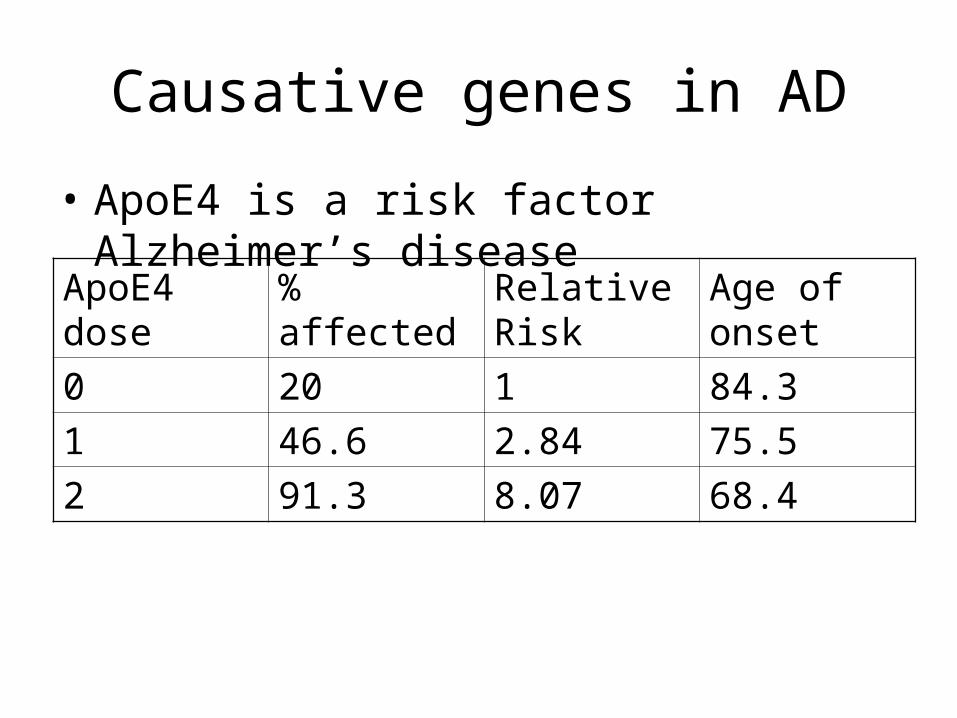
• ApoE4 is a risk factor Alzheimer’s disease
ApoE4 dose
% affected Relative Risk
Age of onset
0 20 1 84.3
1 46.6 2.84 75.5
2 91.3 8.07 68.4
Summary
• Family, adoption and twin studies provide evidence of genetic component to complex disease
• Risk of disease is the combined effect of polygenes influenced by environment, thus termed multifactorial
• Combined affect of many common alleles each providing a small effect, or of a few uncommon alleles with large effect
• Candidate gene, parametric and non-parametric linkage analysis, and population association analysis are used to find risk factors for multifactorial disease