competitiveness of the sme’s in albania
DESCRIPTION
Competitiveness of the SME’s in Albania. A review of the business conditions with a focus on financing conditions. With the support of the European Commission. Growth of the micro enterprises and SME. - PowerPoint PPT PresentationTRANSCRIPT
With the support of the European Commission
1
Competitiveness of the SME’s in Albania
A review of the business conditions with a focus on financing conditions
With the support of the European Commission
With the support of the European Commission 2
Growth of the micro enterprises and SME
• As the end of 2003, micro and SME’s registered and operating in the Albanian economy are about 35,694 firms, which make up to 99% of total firms operating during this year.
• In particular, micro enterprises dominate with 91% of total firms operating in the country.
• Micro and SME’s have provided employment for 56% of total employment, 65% of total turnover of the economy and 45% of total investment generated by private non agriculture sector.
With the support of the European Commission 3
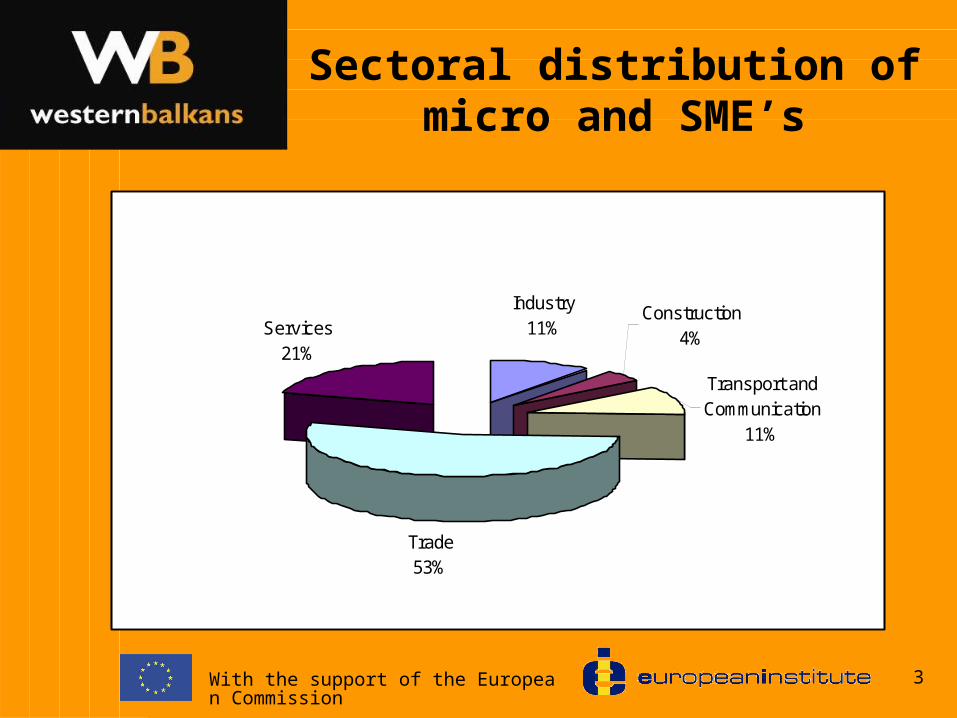
Sectoral distribution of micro and SME’s
Trade53%
Services21%
Transport and Communication
11%
Industry11%
Construction4%
With the support of the European Commission 4
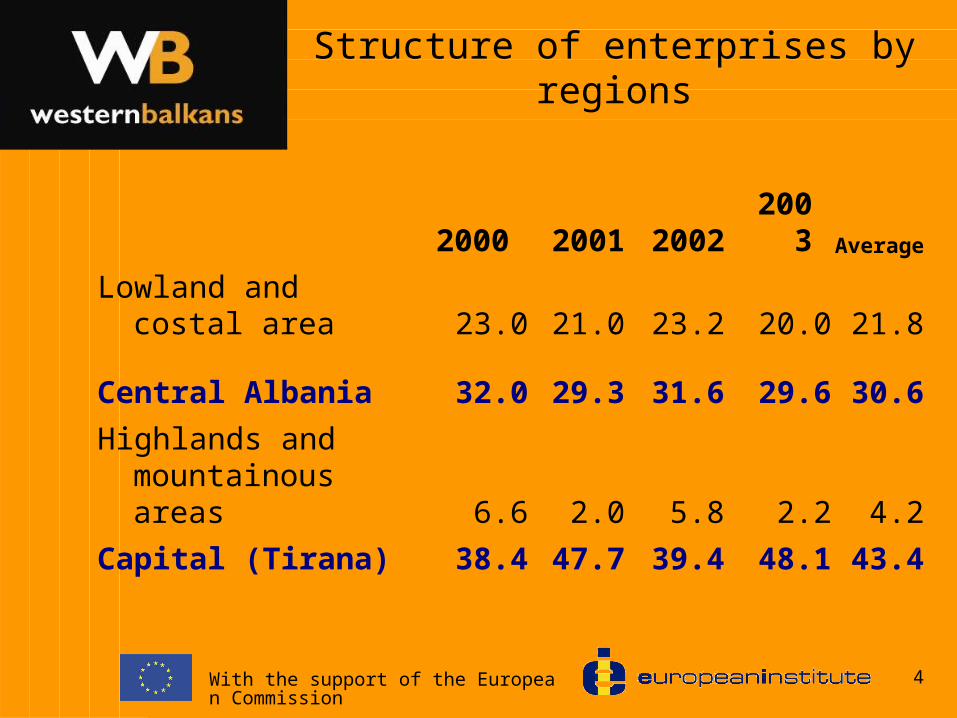
Structure of enterprises by regions
2000 2001 2002 2003 Average
Lowland and costal area 23.0 21.0 23.2 20.0 21.8
Central Albania 32.0 29.3 31.6 29.6 30.6
Highlands and mountainous areas 6.6 2.0 5.8 2.2 4.2
Capital (Tirana) 38.4 47.7 39.4 48.1 43.4
With the support of the European Commission 5
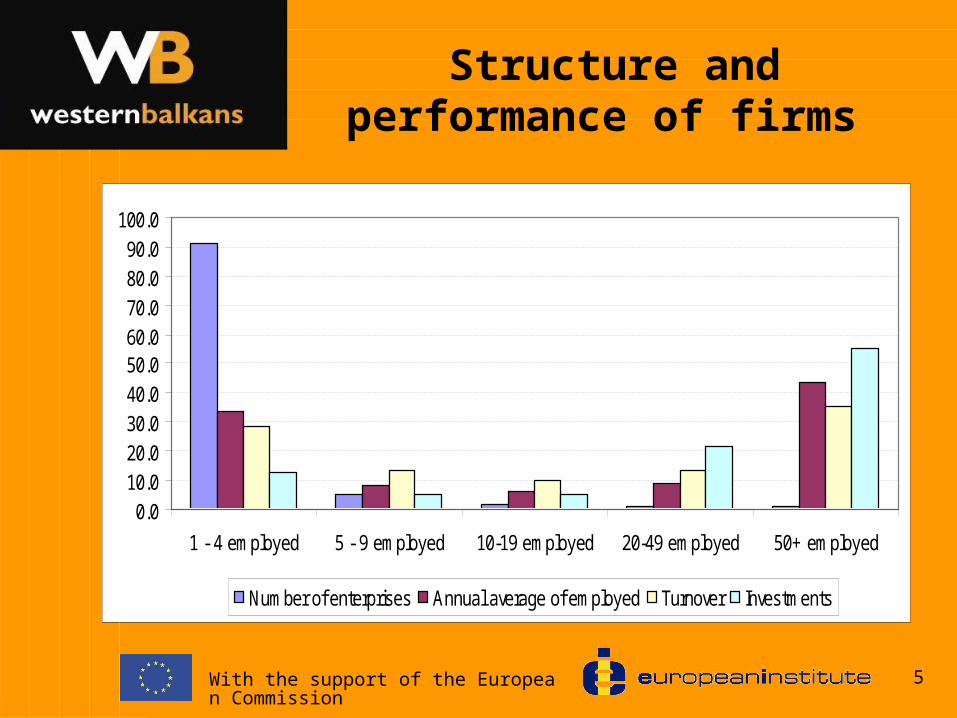
Structure and performance of firms
0.010.020.030.040.050.060.070.080.090.0
100.0
1 - 4 employed 5 - 9 employed 10-19 employed 20-49 employed 50+ employed
Number of enterprises Annual average of employed Turnover Investments
With the support of the European Commission 6
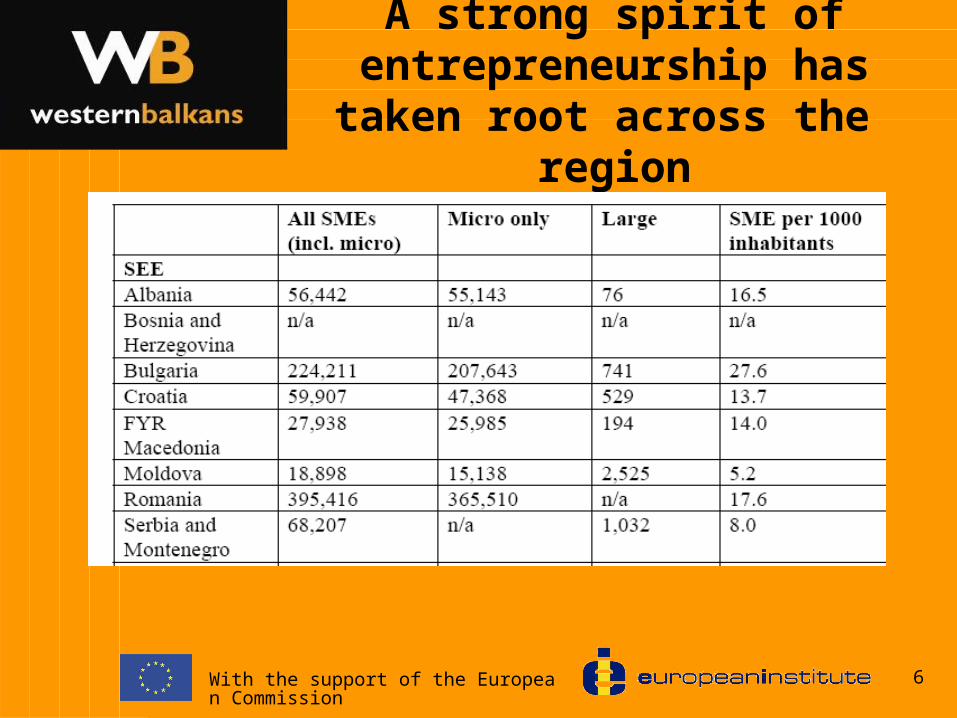
A strong spirit of entrepreneurship has taken root across the region

With the support of the European Commission 7
Competitiveness of the region economies
With the support of the European Commission 8
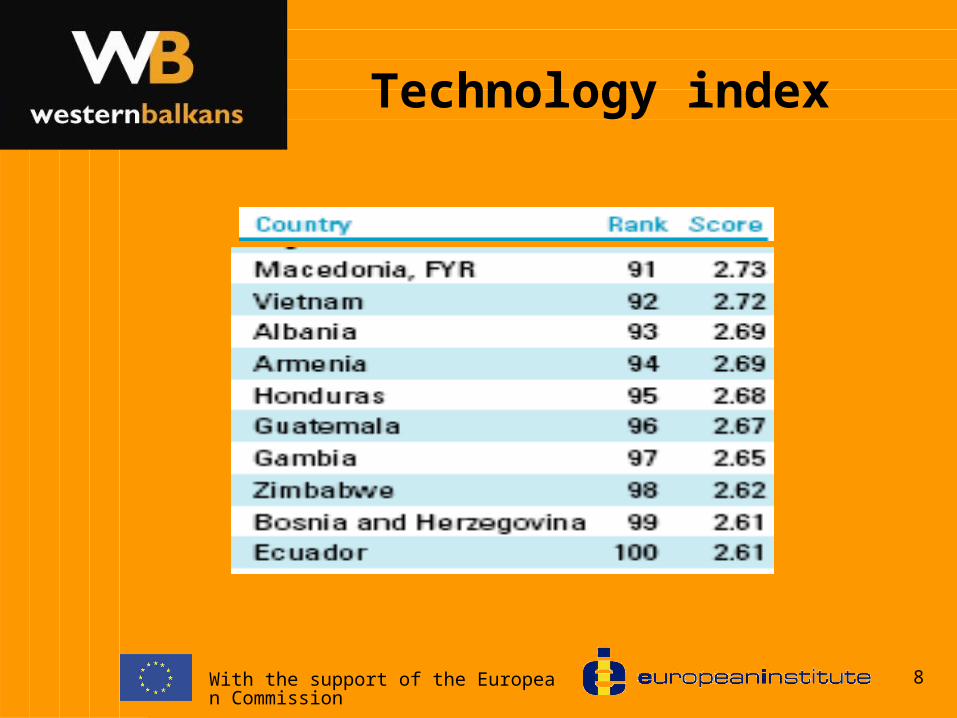
Technology index
With the support of the European Commission 9
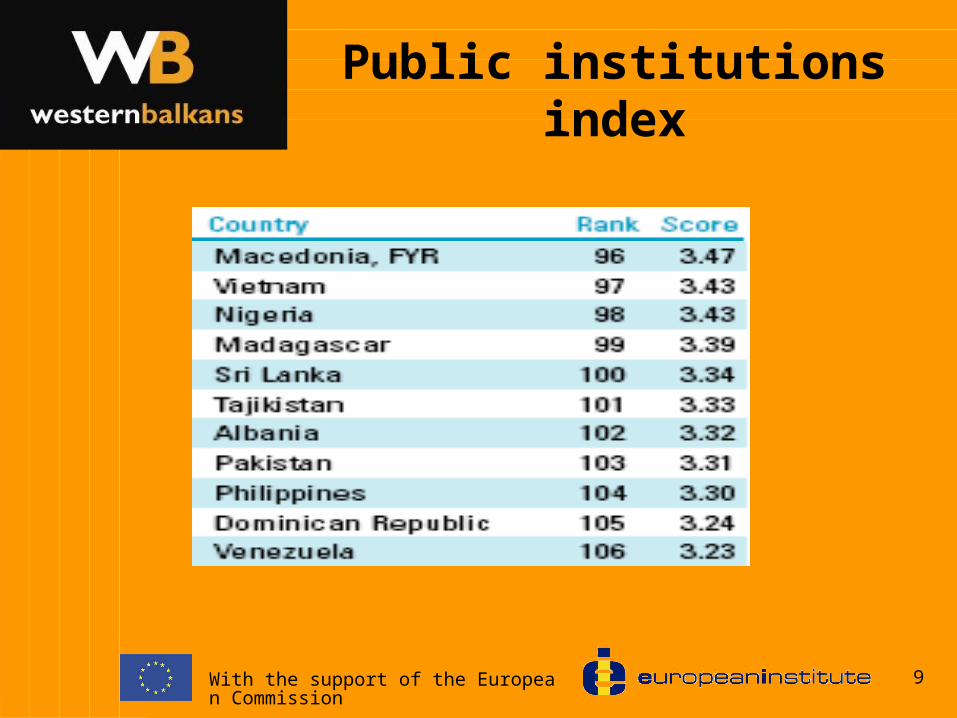
Public institutions index
With the support of the European Commission 10
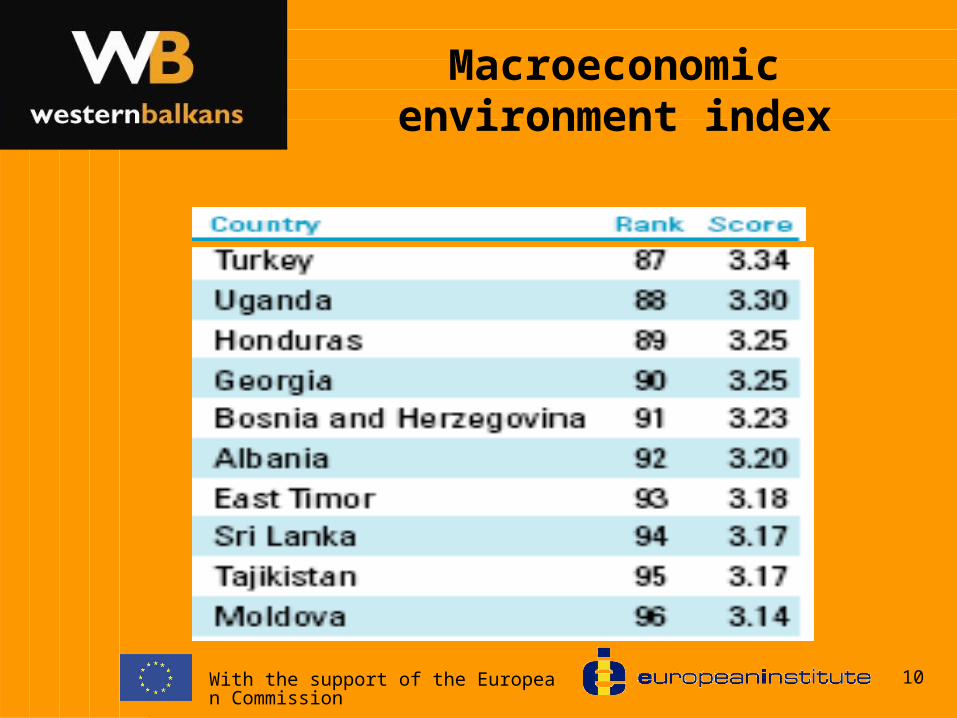
Macroeconomic environment index
With the support of the European Commission 11
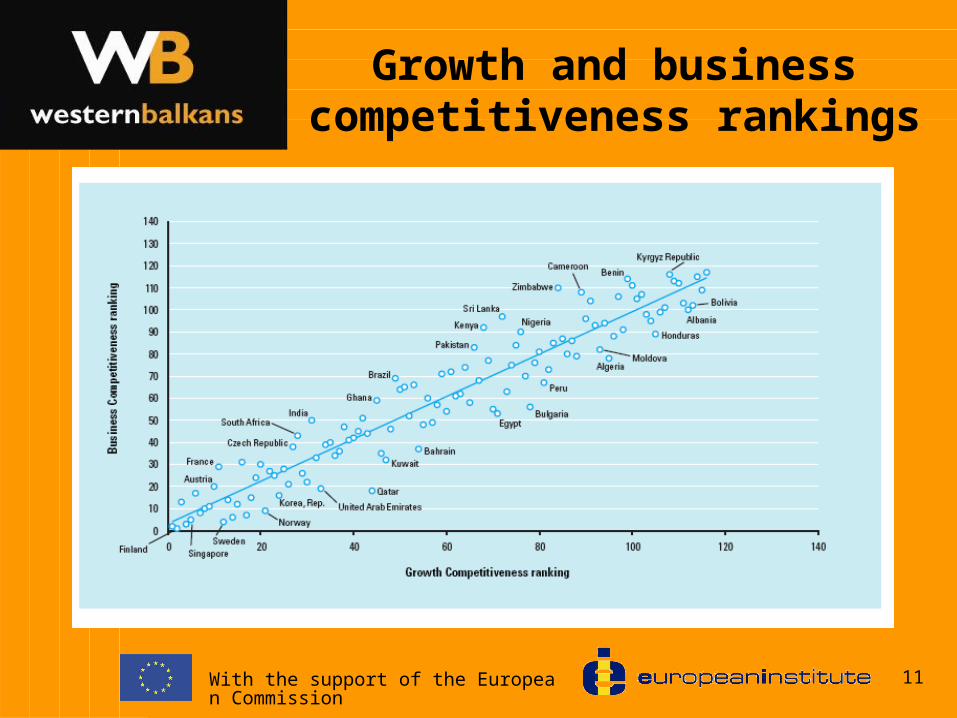
Growth and business competitiveness rankings
With the support of the European Commission 12
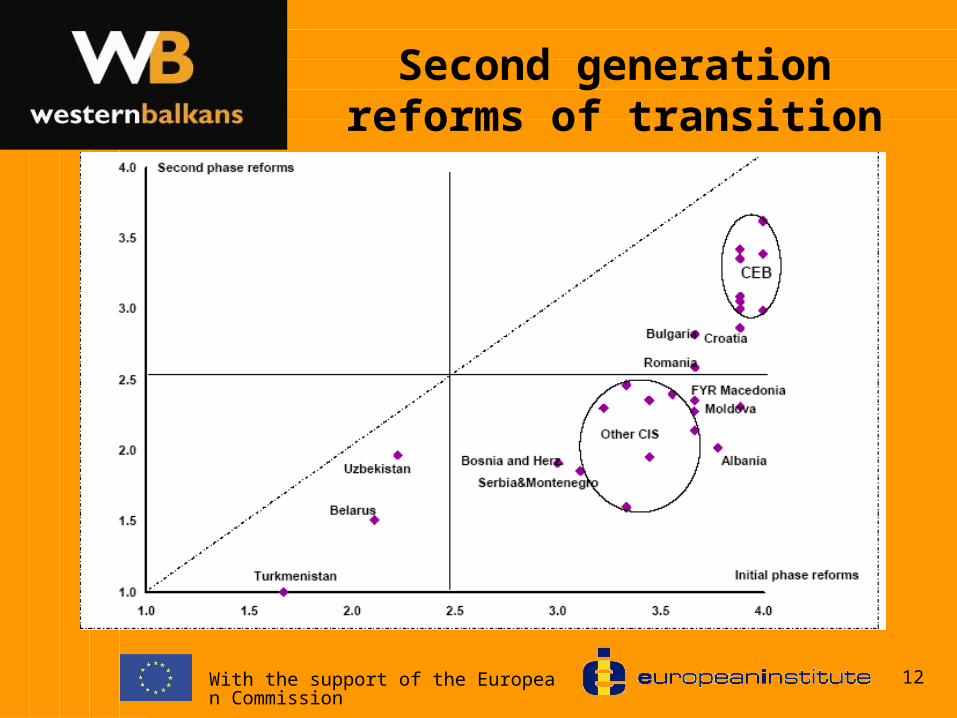
Second generation reforms of transition
With the support of the European Commission 13
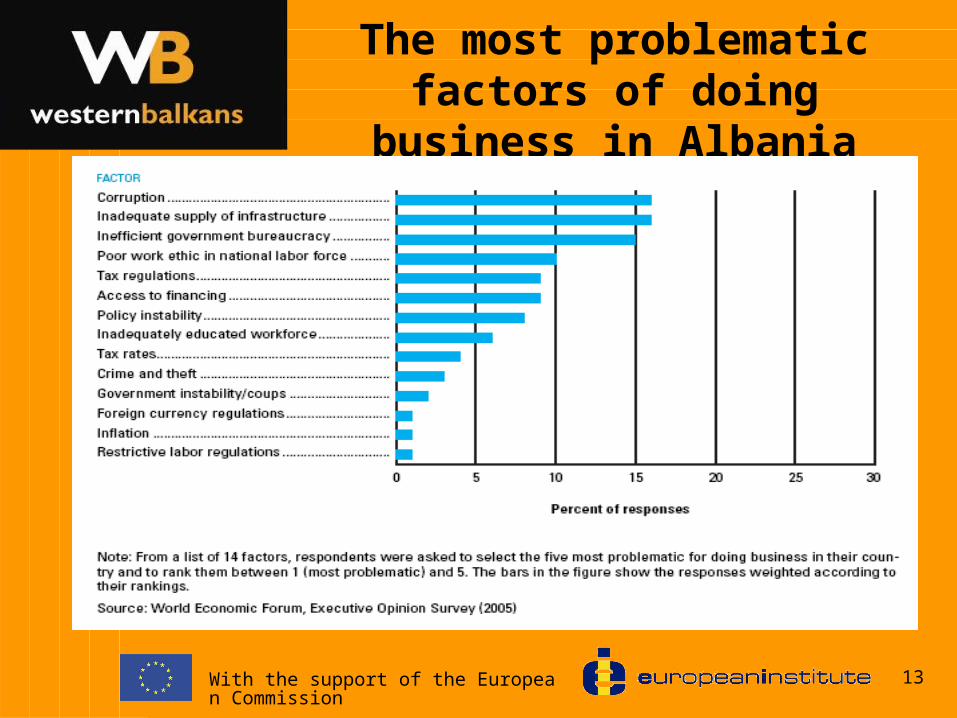
The most problematic factors of doing business in Albania
With the support of the European Commission 14
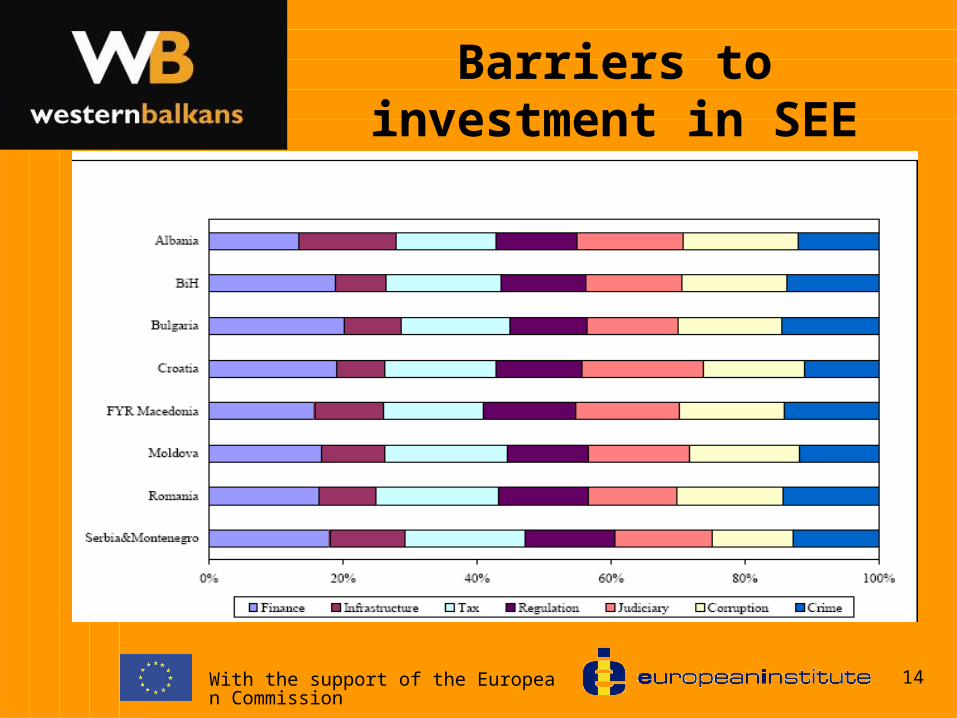
Barriers to investment in SEE
With the support of the European Commission 15
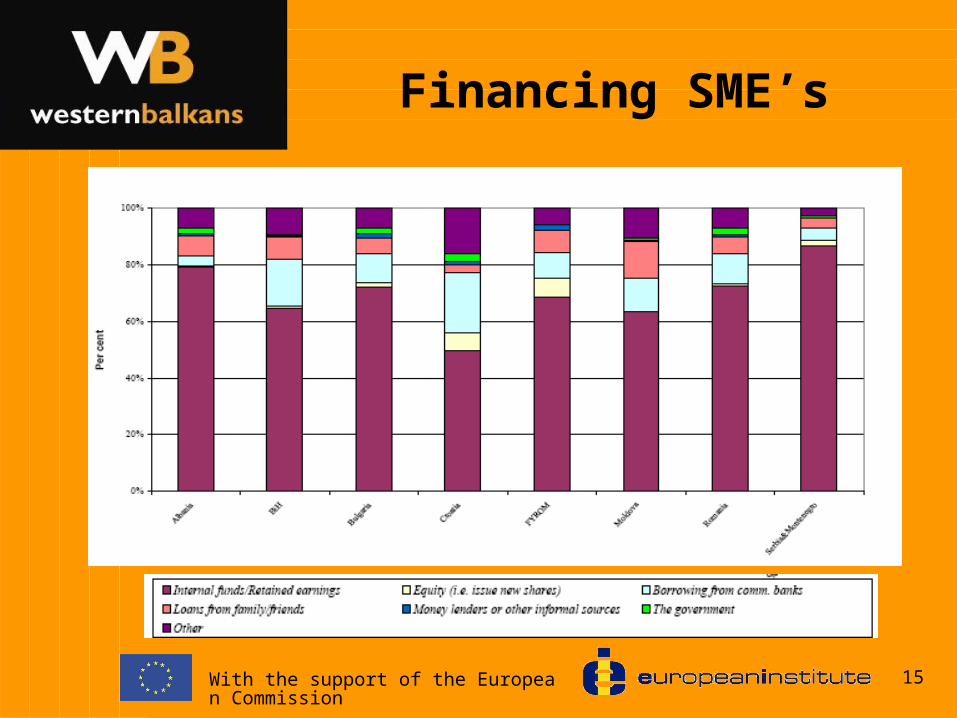
Financing SME’s
With the support of the European Commission 16
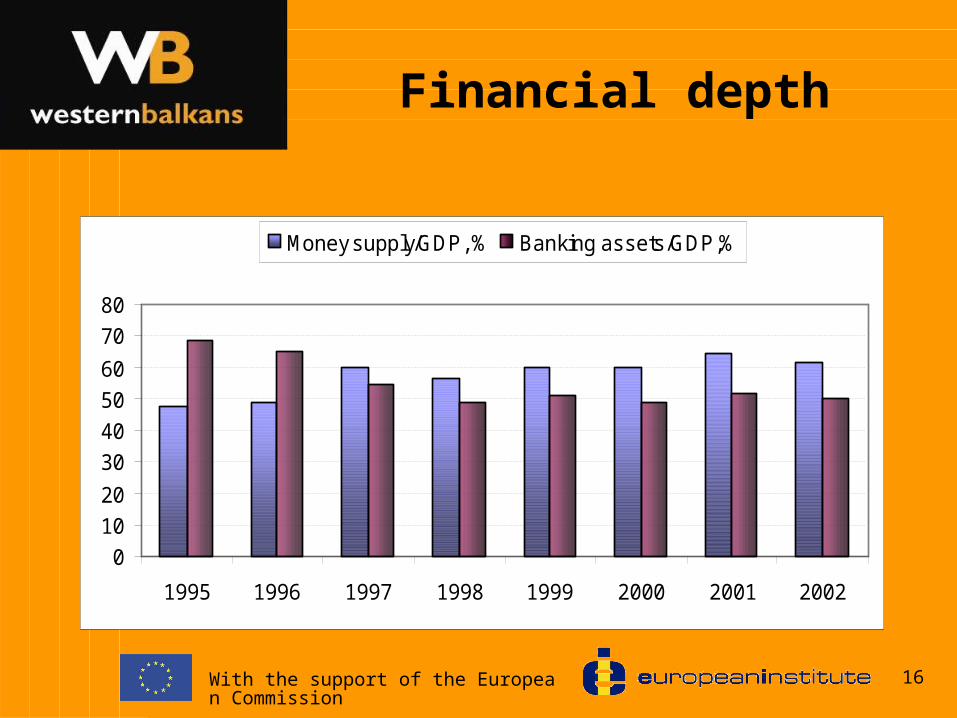
Financial depth
0
10
20
30
40
50
60
70
80
1995 1996 1997 1998 1999 2000 2001 2002
Money supply/GDP, % Banking assets/GDP,%
With the support of the European Commission 17
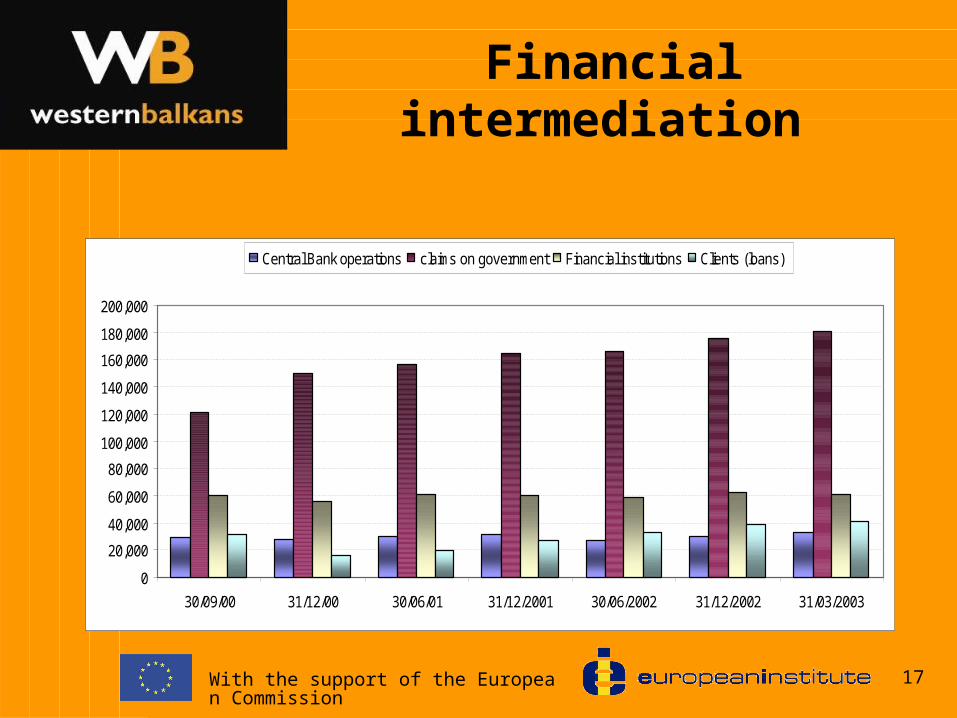
Financial intermediation
0
20,000
40,000
60,000
80,000
100,000
120,000
140,000
160,000
180,000
200,000
30/09/00 31/12/00 30/06/01 31/12/2001 30/06/2002 31/12/2002 31/03/2003
Central Bank operations claims on government Financial institutions Clients (loans)
With the support of the European Commission 18
Banking and economic development
• To what extent economic growth is related to bank lending and banking reform?
• Is there any crowding out of private investment due to high gov’t deficits?
With the support of the European Commission 19
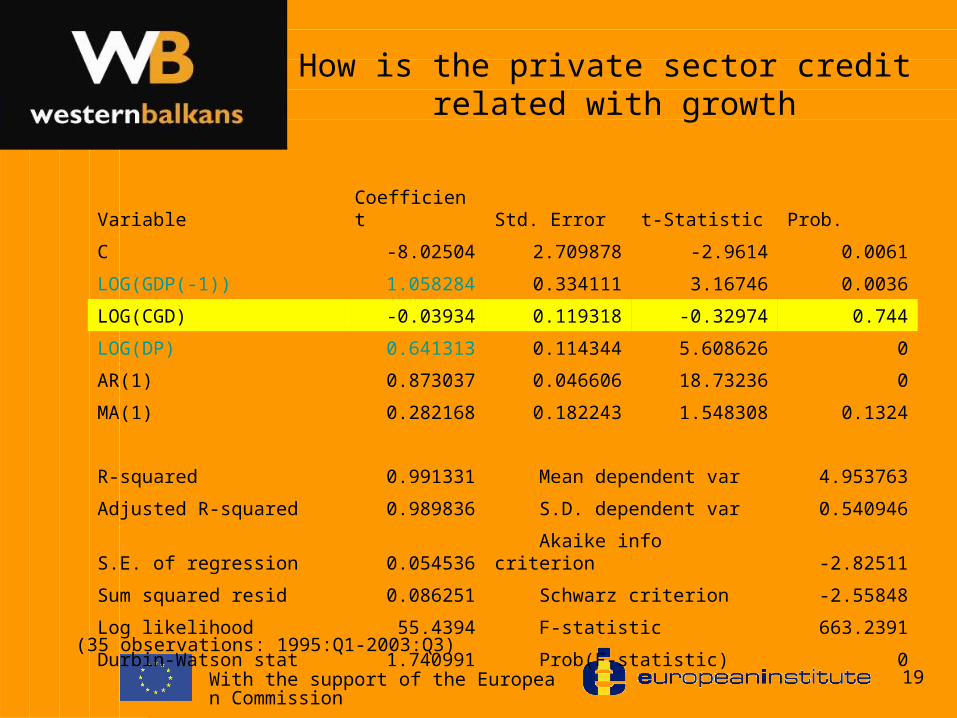
How is the private sector credit related with growth
(35 observations: 1995:Q1-2003:Q3)
Variable Coefficient Std. Error t-Statistic Prob.
C -8.02504 2.709878 -2.9614 0.0061
LOG(GDP(-1)) 1.058284 0.334111 3.16746 0.0036
LOG(CGD) -0.03934 0.119318 -0.32974 0.744
LOG(DP) 0.641313 0.114344 5.608626 0
AR(1) 0.873037 0.046606 18.73236 0
MA(1) 0.282168 0.182243 1.548308 0.1324
R-squared 0.991331 Mean dependent var 4.953763
Adjusted R-squared 0.989836 S.D. dependent var 0.540946
S.E. of regression 0.054536 Akaike info criterion -2.82511
Sum squared resid 0.086251 Schwarz criterion -2.55848
Log likelihood 55.4394 F-statistic 663.2391
Durbin-Watson stat 1.740991 Prob(F-statistic) 0
With the support of the European Commission 20
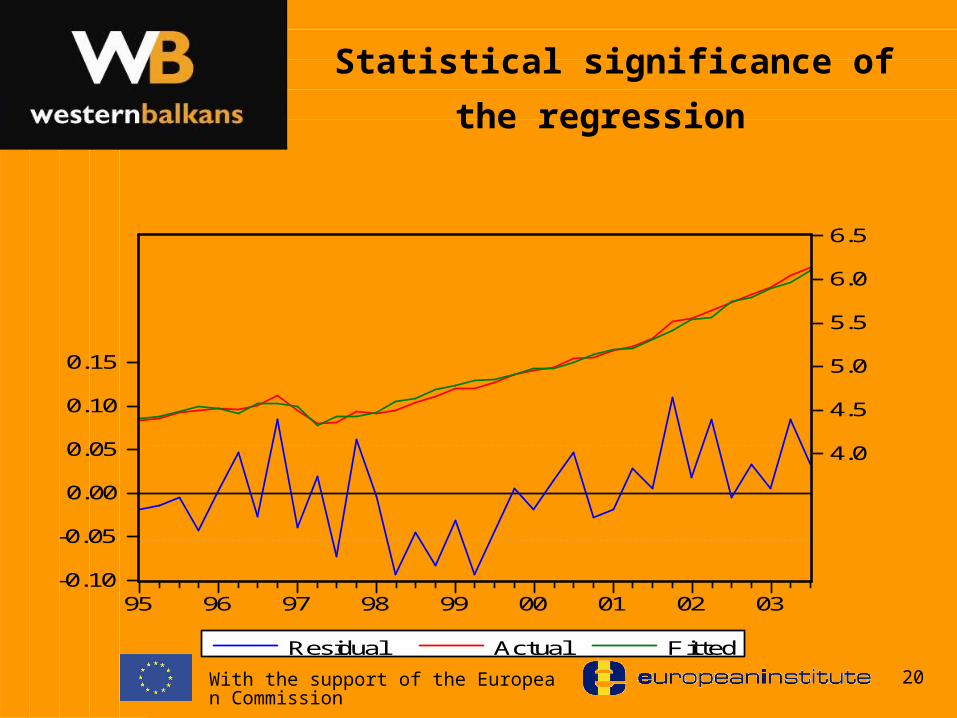
-0.10
-0.05
0.00
0.05
0.10
0.15
4.0
4.5
5.0
5.5
6.0
6.5
95 96 97 98 99 00 01 02 03
Residual Actual Fitted
Statistical significance of the regression
With the support of the European Commission 21
Findings:
• Despite low levels of private credits, there is a positive relationship between output growth and expansion of bank lending;
• No significant relationship with the government deficit; inconsistent with the crowding out argument. The investment opportunities and enterprise reforms seems to drive the credit performance;
With the support of the European Commission 22
The road ahead:
• Tackle the informal sector;• Enhance access to finance;• Work with business on investment climate
measures;• Enhance trade and cross border cooperation