comparison of cloudmr adaptive technology and traditional survey techniques
TRANSCRIPT

Comparison of CloudMR Adaptive Technology
and Traditional Survey Techniques
14 November 2014
Conducted in collaboration with Professor Raghu Santanam, PhD.

CloudMR Adaptive Technology
Some top ideas and
somenew ideas
Initial ideas
IdeaPool
SelectTen
• Question about any topic? Select the ideas you agree with and drag them into priority order
• Idea• Idea• Idea • Idea• Idea, etc.• Add your own ideas
Adaptive Question
Get answers and new ideas
Invite AnyGroup to Participate
Details
Adobe Acrobat Document
plus respondent
ideas
An advanced market research methodology that replaces traditional open-ended questions and rating scales
New Ideas

3
*Three-fourths of market researchers say surveys are too long; customers agreeCloudMR says that Adaptive Surveys® are shorter & more effective than traditional surveysCloudMR would like an independent evaluation of the adaptive technology compared to traditional methods
Background
*2014 Annual Survey of Market Research Professionals published by MarketResearchCareers.com

4
MethodologyA panel was asked to participate in two surveys about their smart phone
One traditional survey of 26 questions: 1 screener, 1 usage, 21 rating scales, 2 demographic & 1 open-endedOne Adaptive Survey® using Adaptive technology including 6 questions: 1 screener, 1 rating scale, 1 adaptive, 1 usage & 2 demographicBoth surveys were designed to determine demand for smart phone improvements

5
Contrast Adaptive & traditional surveysEvaluate Adaptive benefits
Survey lengthReplacement for rating scalesQuantifies open-ended commentsReduces effort and costTolerates low sample sizesEvaluate demand for smart phone feature improvements using identical samples with both techniques
Objectives

6
Summary of ResultsAdaptive Surveys® are dynamic and enable visualization of streaming survey dataAdaptive generates new ideas not conceived in the traditional designPriorities established are similar, not identical, for both techniquesAdaptive surveys require dramatically fewer questions, yet provide more answersAdaptive effectively quantifies open-ended comments Adaptive Surveys® reduce design, analysis and field costs

7
Samples
Totally satisfied
Very satisfied
Somewhat satisfied
Neither satisfied nor dissatisfied
Somewhat dissatisfied
Very dissatisfied
Totally dissatisfied
33%
49%
14%
2%
1%
0%
0%
32%
49%
16%
2%
0%
0%
1%
Traditional n=348
Adaptive n=364
First, please tell us which operating system is used by your smart phone. If you use more than one, please select the one you use most. Overall, how would you rate your [Smart phone OS] operating system?? Please indicate your gender. Which one of the following includes your age?
• Responses for both surveys came from the same panel
• As you would expect, the overall satisfaction and demographics are statistically identical
Adpative TraditionalMale 56% 55%Female 44% 45%Age 18-24 7% 6%25 to 34 29% 23%35 to 44 27% 27%45 to 54 19% 26%55 to 64 13% 16%65 or older 4% 3%Refused 1% 0%iOS 23% 24%Android 71% 71%Windows 6% 5%n= 364 348

8
Key Differences
Adaptive TraditionalNumber of questions asked 5 26Number of prioritized themes 29 20Number of prioritized themes/question 5.8 0.8Number of prioritized comments 67 0Minutes:Seconds to complete 3:24 4:00
• Adaptive questions are about 7 times more effective than tradition questions (5.6 prioritized themes per question versus less than 1 for traditional)

9
Results Comparison (All)
Adaptive TraditionalBattery l ife 1 Not askedPhone 2 16Built-in music 3 Not askedApp availabil ity 4 10Camera 5 11Voice features 6 6Delete permanent apps 7 Not askedInterface 8 13Video call ing 9 5Keyboard 10 Not askedFaster processor 11 Not askedHealth tracking 13 2News 14 17Maps 15 14Calendar 16 15Messaging 17 20Windows compatabil ity 18 Not askedSettings 19 8Notes 20 7Games 21 9Fix bugs 22 Not askedVideos 23 18Web browswer 24 12Security 25 Not askedBooks 26 4Stocks 27 3Passbook 28 1Clock 29 19
RankItem
• In total, the adaptive method identified and prioritized 8 issues not asked by the traditional method including three of the top ten issues and the number 1 issueNote: Adaptive rankings determined by product of Agree % and Priority %; Traditional rankings determined by Low satisfaction % (% not totally or very satisfied)

10
Evolution of Idea Stream
• Both surveys were set up to test the same 20 basic features
• The traditional method tested only the ideas included in the design
• The Adaptive method collected and tested a stream of new ideas suggested by respondents as the survey progressed
Adaptive Survey Traditional Survey

11
Evolution of Theme StreamP
riorit
y
Agreement
n =50
• After 50 responses themes begin to organize themselves
• A new idea, ‘Specific app’ appears in the top 10
25% 30% 35% 40% 45% 50% 55% 60%15%
20%
25%
30%
35%
40%
Specific app Improve video call-ing
Better voice fea-tures
Improve camera
More apps Better built-in music
Make phone work better
Longer battery life
n =100n =150n =200n =250n =300n =364
• The eventual top idea, ‘Longer battery life” shows up after 100 responses
• After 200 responses, themes are organized from upper right to lower left, a typical result
• ‘Longer battery life’ begins to look like a winner
• The final result shows ‘longer battery life’ is head and shoulders above the rest – an idea not even considered by the design

12
Recap• Adaptive provides more answers with
dramatically fewer questions than traditional• Sorted areas are similar for both techniques• Expect lower cost design, analysis and
respondents with adaptive
Adaptive vs. traditionalResults
• Good replacement for a series of rating & open-ended questions
• Quantifies open-ended answers• Works well with a relatively low sample size
Adaptive Technology
Uses
• Unable to test using panel; suggest looking at surveys conducted among real customers
Completions / Starts Ratio
Adaptive: Higher number and quality
of results from dramatically
smaller surveyProvides faster &
easier design, extra insights,
works with small sample

Thank you

Appendix

15
Messaging n=198Clock n=232Videos n=98News n=110
Phone n=158Calendar n=245
Maps n=211Interface n=291
Web browser n=110Camera n=281
App availability n=329Games n=140
Settings n=171Notes n=223
Voice features n=188Video calling n=96
Books n=187Stocks n=104Health n=142
Passbook n=118
15%16%16%17%18%
21%21%22%
25%25%26%26%26%
29%31%
34%37%
44%48%
60%
Not totally/very satisfied
• Traditional analysis looks at dissatisfaction as a way to identify improvement areas
• These quantified results are augmented by qualitative data from open-ended comments
• For purposes of this analysis, the results were adjusted by the percentage of people who actually use each feature
Traditional Results
For each of the following features of your [smart phone OS] operating system, please rate your satisfaction.

16
Adaptive Surveys®
Are short and conversational, resulting in high response rates & low drop-off ratesDeliver actionable improvement ideasUncover drivers you didn’t even ask aboutPrioritize touch points, themes, sub-themes and commentsFloat innovative ideas to the top – even if only one customer mentions itSet up in minutes and deliver results in hours or days
17
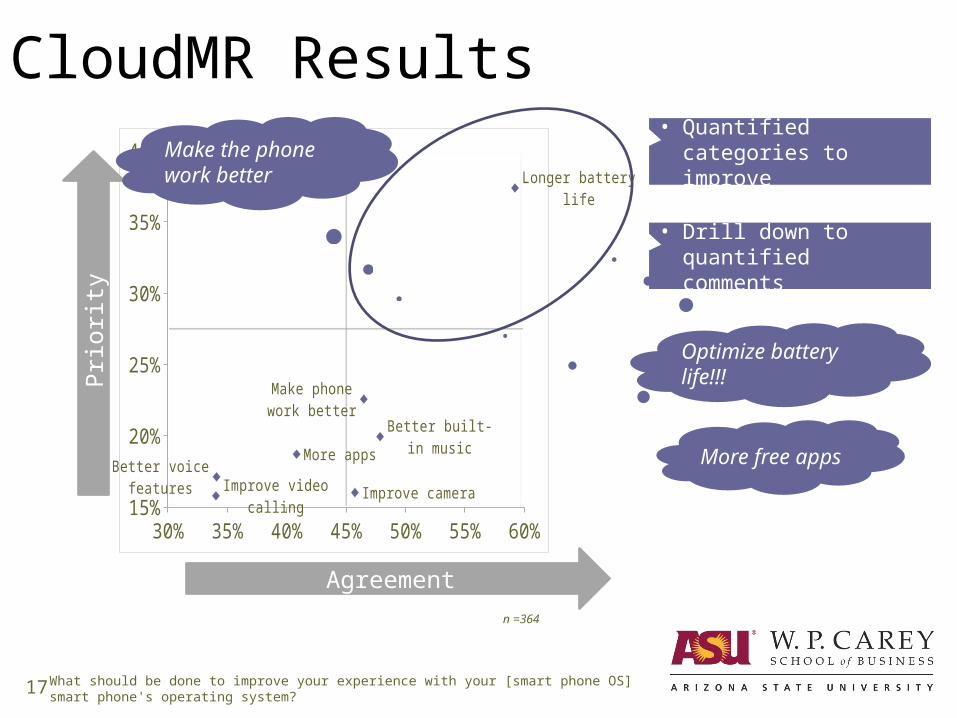
CloudMR Results
What should be done to improve your experience with your [smart phone OS] smart phone's operating system?
30% 35% 40% 45% 50% 55% 60%15%
20%
25%
30%
35%
40%
Improve video call-ing
Better voice fea-tures Improve camera
More appsBetter built-in music
Make phone work better
Longer battery life
Prio
rity
Agreement
n =364
• Quantified categories to improve
• Drill down to quantified comments
Optimize battery life!!!
More free apps
Make the phone work better

What should we do to increase the chances that you would recommend our company to your friends, family or colleagues?
CloudMR Results by Segment
• Segment results by category & view in an easy-to-read format• The most actionable ideas for each segment are determined
using a statistic that considers…– Percent who agree– Percent who say it is a priority– Number who viewed the idea
• Import segmentation or use a traditional survey question
Totally/Very Lower iOS AndroidPhone quality 94 93 37 60 100Video calling 52 36 12 1 64
More apps 47 40 47 16 56Improve camera 38 41 9 9 44
Voice features 37 36 12 8 44Health tracking 29 28 0 1 15
Improve UI 28 30 7 34 19Settings 28 25 3 0 31
News features 25 14 55 3 26Calendar 24 18 32 23 19
Base 688 509 114 144 444n Most, n least likely to resonate
Overall SatisfactionTotal
Operating System