comparison of blood counts in venous, fingertip and arterial blood and their measurement variation
TRANSCRIPT
TECHNICAL NOTE
Comparison of blood counts in venous,®ngertip and arterial blood and theirmeasurement variation
Z.-W. YANG*,
S.-H. YANG*,L. CHEN*,
J. QU*,
J. ZHU*,Z. TANG
*Morphometric Research Laboratory, North Sichuan Medical College and Department of Clinical
Laboratory Sciences, Af®liated Hospital of North Sichuan Medical College, Nanchong, Sichuan,
China
Summary We compared routine blood pictures in venous, ®ngertip and arterial blood and their
measurement variation. A pair of venous and ®ngertip blood samples were simulta-
neously collected from 24 volunteers, and another pair of venous and arterial samples
from another 12 volunteers. The volunteers were healthy adults, aged 20±22 years,
with males and females in equal numbers. Three aliquots of blood were taken from each
person for three measurements of blood counts, including haemoglobin concentration
and haemocrit, using an automatic haematology analyser. Compared to arterial blood,
there was a signi®cant increase of erythrocyte count (2.7%) and haematocrit (3.1%) in
the venous blood. The total and large leucocyte counts were signi®cantly higher (9.2%
and 12.6%, respectively) in the ®ngertip blood than in the venous blood. There were a
decreasing number of leucocytes in the ®ngertip blood with repeated sampling. The
intermeasurement variation for total leucocyte or haemoglobin measurement was
signi®cantly larger as measured with the ®ngertip blood or arterial blood than with the
venous blood. The intermeasurement coef®cients of variation of haemoglobin (1.3%)
and small leucocyte ratio or platelet (approximately 4.0%) measurements with venous
and arterial blood were the smallest and largest, respectively. Volume of arterial plasma
was diminished by 2±3% after microcirculation. Elevation of total leucocyte count in
the ®ngertip blood was mainly due to the increase of granulocytes. Measurement with
venous blood was of better precision than with ®ngertip or arterial blood.
Keywords Arterial, blood count, ®ngertip, haematocrit, haematology analyser, haemoglobin,
routine blood picture, venous
Introduction
Difference of blood counts in venous and ®ngertip blood,
including haematocrit and haemoglobin concentration,
has long been recognized; however, controversy remains
about the exact aspects or mechanism of the difference.
For example, using automatic haematology analysers, an
increased (Dacie & Lewis, 1984; Daae et al., 1988, 1991;
Li et al., 1997; Yuan et al., 1999) or unchanged (Leppa-
nen 1988; Liu et al., 1999) leucocyte count in the
®ngertip blood was found compared to the venous blood.
Only one measurement was usually obtained from each
blood sample in previous studies, thus variation of
measurement might have partly contributed to the
controversy. This study was undertaken to clarify the
disagreement by measuring each blood sample three times.
Furthermore, comparison between venous and arterial
Accepted for publication 1 May 2001
Correspondence: Zheng-Wei Yang, Morphometric Research Laborat-
ory, North Sichuan Medical College, 234 Fujiang Road, Nanchong,
Sichuan 637007, China. Fax: +86 817 224 2600; E-mail:
Clin. Lab. Haem.
2001, 23, 155±159
Ó 2001 Blackwell Science Limited
155
blood was also made to seek an explanation for the
difference between venous and ®ngertip blood.
Materials and methods
Volunteers
Thirty-six healthy adults, year 2±4 medical students from
North Sichuan Medical College, aged 20±22 years, vol-
unteered the blood samples. All samples were collected
within approximately 2 h in the afternoon between
15.30 h and 18.30 h. Eleven (group 1), 13 (group 2)
and 12 (group 3) volunteers were included in the study on
three afternoons, respectively, with males and females in
approximately equal numbers in each group.
Blood sampling and measurement
Fingertip blood from the tip of left ring ®nger after skin-
puncture and venous blood from the left median cubital
vein were simultaneously collected from each person in
groups 1 and 2; venous blood from the left median cubital
vein and arterial blood from the left radial artery simul-
taneously collected from each person in group 3. All
volunteers had been in a state of rest for more than 30 min
and sat with the arm resting on a worktable when blood
was sampled. For the ®ngerprick sampling, one skin
puncture was made using a blood sampling needle (Ruiqi
Technology Ltd, Chengdu, Sichuan, China). The ®rst drop
of blood after gentle squeezing was discarded, and then an
aliquot (20 ll) of blood was taken from the second, third
and fourth drops of blood, respectively. Each aliquot of blood
was immediately put in 10 ml of standard dilution liquid
(Sysmex, Japan). For venous or arterial blood, 4 ml of blood
was taken from each person using a vacuum tube with
EDTA-K2 (Ruiqi Technology Ltd) for anticoagulation, and
then three aliquots (20 ll each) of blood were directly taken
from the tube and immediately put in the standard dilution
liquid. All measurements were performed on the same
automatic haematology analyser (Sysmex F-820, Japan)
within 1 h after blood sampling, one set of measurements
being obtained from each aliquot of blood. The same two
experienced haematology technicians carried out all blood
sampling and measurement at the Department of Clinical
Laboratory Sciences, Af®liated Hospital of North Sichuan
Medical College, where quality control was checked daily as
required by the Ministry of Health, China. Quality control
was performed using control blood samples provided by the
Chinese Ministry of Health, and the relative difference
between the measured values and the control values for
all parameters were within 1±2%. All sampling and
measurement were carried out at room temperature and
local heating of skin was not done for blood sampling.
Statistical analysis
Data are presented as mean � SD. Comparison between
venous and ®ngertip blood or between venous and arterial
blood was made using paired t-test; multiple comparisons
between different parameters were performed using one-
way ANOVA (analysis of variance) in conjunction with
Student-Newman-Keuls method; and multiple compari-
sons between the ®rst, second and third aliquots of blood
were performed using one-way repeated measures ANOVA
in conjunction with Student-Newman-Keuls method.
P £ 0.05 was considered statistically signi®cant.
Results
Comparison between venous and ®ngertip blood
In the 24 volunteers from groups 1 and 2, the haema-
tological parameters, which were signi®cantly higher as
measured with the ®ngertip blood than with the venous
blood, were WBC (total leucocyte count) and large
leucocyte ratio (LLR, i.e. large leucocyte number as a
percentage of total leucocytes), being 9.2% and 3.6%
higher, respectively (Table 1). The large leucocyte count
(LLC) in the ®ngertip blood (5.23 � 1.68 ´ 109/l) was
also signi®cantly higher (12.6%) than in the venous blood
(4.65 � 1.40 ´ 109/l). There were no signi®cant differ-
ences in other parameters such as RBC (erythrocyte count;
P � 0.73), Hb (haemoglobin concentration; P � 0.75),
Hct (haematocrit; P � 0.32), Plt (platelet count; P � 0.58)
or SLC (small leucocyte count; 2.25 � 0.52 versus
2.24 � 0.56 ´ 109/l; P � 0.87).
Comparison between venous and arterial blood
In group 3, the haematological parameters that were
signi®cantly lower as measured with the arterial blood
than with the venous blood were RBC (by 2.7%) and Hct
(by 3.1%); Hb was also smaller (by 1.8%) but statistical
signi®cance was not found (P � 0.08) (Table 2). There
were no signi®cant differences (P > 0.10) in other param-
eters of Table 2, LLC (4.70 � 1.00 versus 4.81 � 0.98 ´109/l) or SLC (2.23 � 0.49 versus 2.27 � 0.51 ´ 109/l).
Variation of measurement
The mean coef®cient of variation (CV) between three
measurements from each blood sample was less than 6.5%
Comparison of venous, ®ngertip and arterial blood counts156
Ó 2001 Blackwell Science Ltd., Clin. Lab. Haem., 23, 155±159
for all parameters of all the blood samples. The CV was
signi®cantly larger as measured with the ®ngertip or
arterial blood than with the venous blood for WBC and Hb
(Tables 1 and 2).
To determine whether a different statistical conclusion
would be reached if only one random aliquot of blood was
obtained from each blood sample, the three measurements
from each blood sample were independently considered,
thus nine statistical comparisons between three venous
and three ®ngertip or between three venous and three
arterial measurements were performed for each param-
eter. Compared to the statistical inferences reached by
using the mean of the three measurements, all nine
comparisons for such parameters as WBC, RBC, Hb, Hct
and Plt showed the same statistical inferences (with or
without signi®cant differences), with only one of the nine
comparisons for the parameters of SLR and LLR showing
a different statistical inference.
To analyse which parameter has a signi®cantly smaller
variation between measurements in ®ngertip blood or in
venous and arterial blood, the CVs were compared
between parameters based on one-way ANOVA; thus 21
multiple comparisons between the seven parameters
shown in Table 1 or 2 were obtained. The CVs of the
®ngertip values (n � 24) are shown in Tables 1 and 20
pairs of the CVs, not including the pair between RBC and
Hct, were signi®cantly different. When venous and arterial
blood samples (n � 48, from groups 1±3) were considered
all together, the CVs were 4.23 � 5.29% (SLR),
3.99 � 2.44% (Plt), 2.97 � 2.28% (WBC), 2.58 � 1.68%
(Hct), 2.31 � 1.55% (RBC), 1.98 � 2.32% (LLR) and
1.26 � 0.78% (Hb), respectively; and 20 pairs of the
parameters, not including the pair between WBC and Hct,
were signi®cantly different.
To evaluate whether there is a signi®cant difference
between the ®rst, second and third aliquots of blood, one-
way repeated measures ANOVA was performed. All the
seven venous parameters (n � 36, from groups 1±3) had
no signi®cant difference (P > 0.46) between different
aliquots, and all the seven arterial parameters (n � 12)
had no such signi®cant difference (P > 0.40) either.
However, while ®ngertip parameters of RBC, Hb, Hct
and Plt were not signi®cantly different (P > 0.09) between
aliquots, there was a signi®cant difference in WBC-related
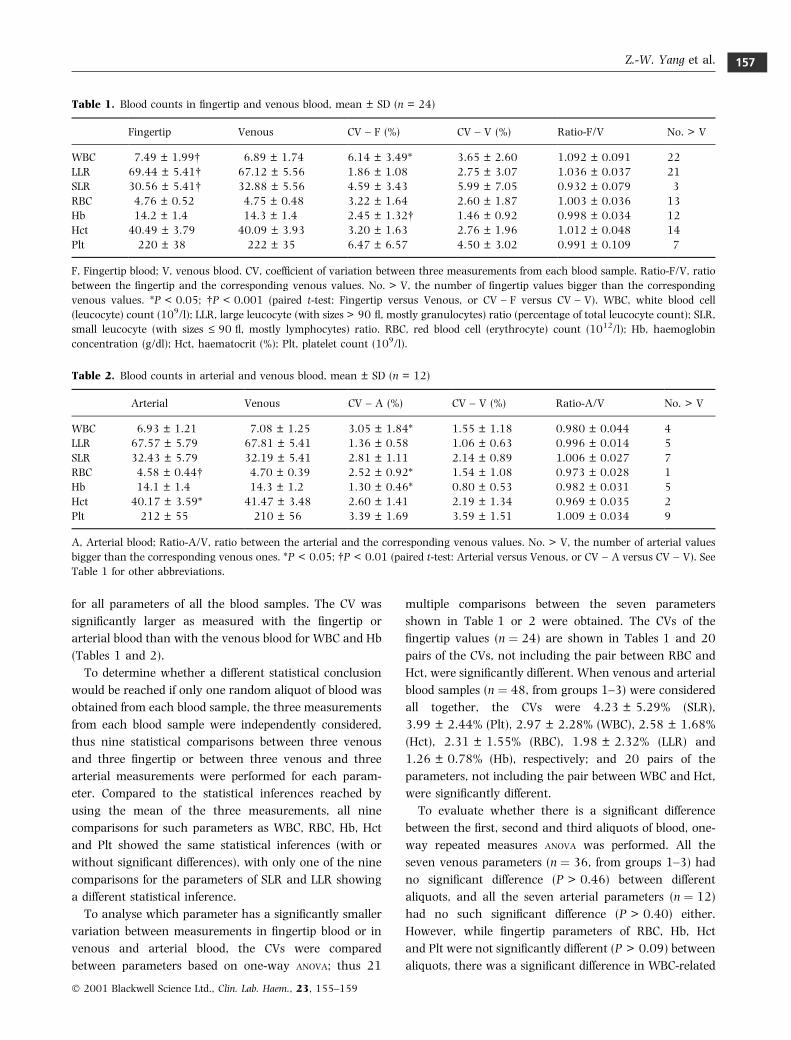
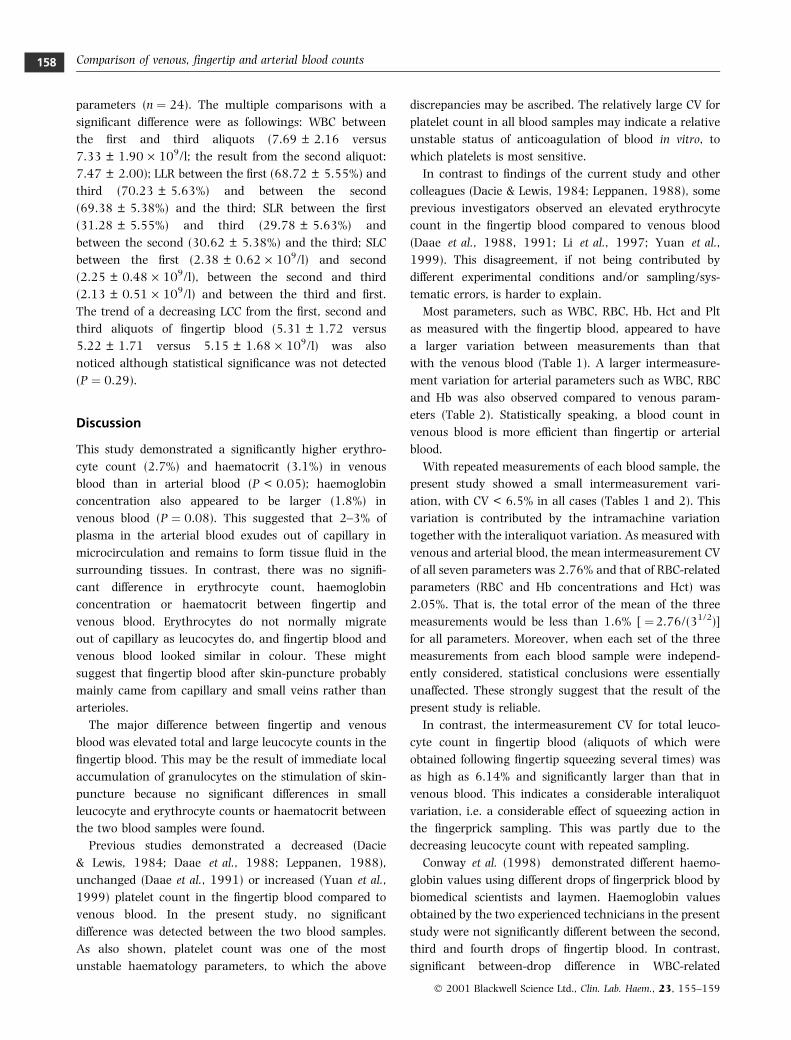
Table 2. Blood counts in arterial and venous blood, mean � SD (n = 12)
Arterial Venous CV ± A (%) CV ± V (%) Ratio-A/V No. > V
WBC 6.93 � 1.21 7.08 � 1.25 3.05 � 1.84* 1.55 � 1.18 0.980 � 0.044 4
LLR 67.57 � 5.79 67.81 � 5.41 1.36 � 0.58 1.06 � 0.63 0.996 � 0.014 5
SLR 32.43 � 5.79 32.19 � 5.41 2.81 � 1.11 2.14 � 0.89 1.006 � 0.027 7
RBC 4.58 � 0.44 4.70 � 0.39 2.52 � 0.92* 1.54 � 1.08 0.973 � 0.028 1
Hb 14.1 � 1.4 14.3 � 1.2 1.30 � 0.46* 0.80 � 0.53 0.982 � 0.031 5
Hct 40.17 � 3.59* 41.47 � 3.48 2.60 � 1.41 2.19 � 1.34 0.969 � 0.035 2
Plt 212 � 55 210 � 56 3.39 � 1.69 3.59 � 1.51 1.009 � 0.034 9
A, Arterial blood; Ratio-A/V, ratio between the arterial and the corresponding venous values. No. > V, the number of arterial values
bigger than the corresponding venous ones. *P < 0.05; P < 0.01 (paired t-test: Arterial versus Venous, or CV ± A versus CV ± V). See
Table 1 for other abbreviations.
Table 1. Blood counts in ®ngertip and venous blood, mean � SD (n = 24)
Fingertip Venous CV ± F (%) CV ± V (%) Ratio-F/V No. > V
WBC 7.49 � 1.99 6.89 � 1.74 6.14 � 3.49* 3.65 � 2.60 1.092 � 0.091 22
LLR 69.44 � 5.41 67.12 � 5.56 1.86 � 1.08 2.75 � 3.07 1.036 � 0.037 21
SLR 30.56 � 5.41 32.88 � 5.56 4.59 � 3.43 5.99 � 7.05 0.932 � 0.079 3
RBC 4.76 � 0.52 4.75 � 0.48 3.22 � 1.64 2.60 � 1.87 1.003 � 0.036 13
Hb 14.2 � 1.4 14.3 � 1.4 2.45 � 1.32 1.46 � 0.92 0.998 � 0.034 12
Hct 40.49 � 3.79 40.09 � 3.93 3.20 � 1.63 2.76 � 1.96 1.012 � 0.048 14
Plt 220 � 38 222 � 35 6.47 � 6.57 4.50 � 3.02 0.991 � 0.109 7
F, Fingertip blood; V, venous blood. CV, coef®cient of variation between three measurements from each blood sample. Ratio-F/V, ratio
between the ®ngertip and the corresponding venous values. No. > V, the number of ®ngertip values bigger than the corresponding
venous values. *P < 0.05; P < 0.001 (paired t-test: Fingertip versus Venous, or CV ± F versus CV ± V). WBC, white blood cell
(leucocyte) count (109/l); LLR, large leucocyte (with sizes > 90 ¯, mostly granulocytes) ratio (percentage of total leucocyte count); SLR,
small leucocyte (with sizes £ 90 ¯, mostly lymphocytes) ratio. RBC, red blood cell (erythrocyte) count (1012/l); Hb, haemoglobin
concentration (g/dl); Hct, haematocrit (%); Plt, platelet count (109/l).
Z.-W. Yang et al. 157
Ó 2001 Blackwell Science Ltd., Clin. Lab. Haem., 23, 155±159
parameters (n � 24). The multiple comparisons with a
signi®cant difference were as followings: WBC between
the ®rst and third aliquots (7.69 � 2.16 versus
7.33 � 1.90 ´ 109/l; the result from the second aliquot:
7.47 � 2.00); LLR between the ®rst (68.72 � 5.55%) and
third (70.23 � 5.63%) and between the second
(69.38 � 5.38%) and the third; SLR between the ®rst
(31.28 � 5.55%) and third (29.78 � 5.63%) and
between the second (30.62 � 5.38%) and the third; SLC
between the ®rst (2.38 � 0.62 ´ 109/l) and second
(2.25 � 0.48 ´ 109/l), between the second and third
(2.13 � 0.51 ´ 109/l) and between the third and ®rst.
The trend of a decreasing LCC from the ®rst, second and
third aliquots of ®ngertip blood (5.31 � 1.72 versus
5.22 � 1.71 versus 5.15 � 1.68 ´ 109/l) was also
noticed although statistical signi®cance was not detected
(P � 0.29).
Discussion
This study demonstrated a signi®cantly higher erythro-
cyte count (2.7%) and haematocrit (3.1%) in venous
blood than in arterial blood (P < 0.05); haemoglobin
concentration also appeared to be larger (1.8%) in
venous blood (P � 0.08). This suggested that 2±3% of
plasma in the arterial blood exudes out of capillary in
microcirculation and remains to form tissue ¯uid in the
surrounding tissues. In contrast, there was no signi®-
cant difference in erythrocyte count, haemoglobin
concentration or haematocrit between ®ngertip and
venous blood. Erythrocytes do not normally migrate
out of capillary as leucocytes do, and ®ngertip blood and
venous blood looked similar in colour. These might
suggest that ®ngertip blood after skin-puncture probably
mainly came from capillary and small veins rather than
arterioles.
The major difference between ®ngertip and venous
blood was elevated total and large leucocyte counts in the
®ngertip blood. This may be the result of immediate local
accumulation of granulocytes on the stimulation of skin-
puncture because no signi®cant differences in small
leucocyte and erythrocyte counts or haematocrit between
the two blood samples were found.
Previous studies demonstrated a decreased (Dacie
& Lewis, 1984; Daae et al., 1988; Leppanen, 1988),
unchanged (Daae et al., 1991) or increased (Yuan et al.,
1999) platelet count in the ®ngertip blood compared to
venous blood. In the present study, no signi®cant
difference was detected between the two blood samples.
As also shown, platelet count was one of the most
unstable haematology parameters, to which the above
discrepancies may be ascribed. The relatively large CV for
platelet count in all blood samples may indicate a relative
unstable status of anticoagulation of blood in vitro, to
which platelets is most sensitive.
In contrast to ®ndings of the current study and other
colleagues (Dacie & Lewis, 1984; Leppanen, 1988), some
previous investigators observed an elevated erythrocyte
count in the ®ngertip blood compared to venous blood
(Daae et al., 1988, 1991; Li et al., 1997; Yuan et al.,
1999). This disagreement, if not being contributed by
different experimental conditions and/or sampling/sys-
tematic errors, is harder to explain.
Most parameters, such as WBC, RBC, Hb, Hct and Plt
as measured with the ®ngertip blood, appeared to have
a larger variation between measurements than that
with the venous blood (Table 1). A larger intermeasure-
ment variation for arterial parameters such as WBC, RBC
and Hb was also observed compared to venous param-
eters (Table 2). Statistically speaking, a blood count in
venous blood is more ef®cient than ®ngertip or arterial
blood.
With repeated measurements of each blood sample, the
present study showed a small intermeasurement vari-
ation, with CV < 6.5% in all cases (Tables 1 and 2). This
variation is contributed by the intramachine variation
together with the interaliquot variation. As measured with
venous and arterial blood, the mean intermeasurement CV
of all seven parameters was 2.76% and that of RBC-related
parameters (RBC and Hb concentrations and Hct) was
2.05%. That is, the total error of the mean of the three
measurements would be less than 1.6% [ �2.76/(31/2)]
for all parameters. Moreover, when each set of the three
measurements from each blood sample were independ-
ently considered, statistical conclusions were essentially
unaffected. These strongly suggest that the result of the
present study is reliable.
In contrast, the intermeasurement CV for total leuco-
cyte count in ®ngertip blood (aliquots of which were
obtained following ®ngertip squeezing several times) was
as high as 6.14% and signi®cantly larger than that in
venous blood. This indicates a considerable interaliquot
variation, i.e. a considerable effect of squeezing action in
the ®ngerprick sampling. This was partly due to the
decreasing leucocyte count with repeated sampling.
Conway et al. (1998) demonstrated different haemo-
globin values using different drops of ®ngerprick blood by
biomedical scientists and laymen. Haemoglobin values
obtained by the two experienced technicians in the present
study were not signi®cantly different between the second,
third and fourth drops of ®ngertip blood. In contrast,
signi®cant between-drop difference in WBC-related
Comparison of venous, ®ngertip and arterial blood counts158
Ó 2001 Blackwell Science Ltd., Clin. Lab. Haem., 23, 155±159
parameters was detected. Small leucocyte count measured
with the third drop of blood is decreased by 5.61%
(P < 0.05) compared to the value with the second drop of
blood, and the count with the fourth drop was further
decreased by 5.01% compared to the third drop. This
suggested that, with repeated ®ngerprick sampling, fewer
and fewer leucocytes, especially small leucocytes (mostly
lymphocytes), accumulated in the blood. As described
above, relatively more large leucocytes accumulated in the
®ngertip blood. These may indicate a different pathological
response to ®ngerprick by the granulocytes and lympho-
cytes.
As expected, there was no signi®cant between-aliquot
difference in all venous values and arterial values because
each set of three aliquots of venous or arterial blood were
taken from the same pool (population) of blood.
The relatively large CV for the small leucocyte ratio
might be partly due to its smaller number in blood:
approximately 32% of total leucocytes and approximately
0.046% of all formed elements. The highest ef®ciency for
haemoglobin measurement in all blood samples may be
attributed to the fact that erythrocytes accounted for
approximately 95.5% of formed elements in blood
(Tables 1 and 2) and haemoglobin measurement was
not affected by the anticoagulation status of blood using
the haematology analyser.
In summary, examination of routine blood picture with
venous blood is more accurate than with ®ngertip or
arterial blood, and measurement of RBC-related param-
eters is more stable than WBC-related parameters or
platelet counts. A decreasing amount of leucocytes
accumulate in the ®ngerprick blood with repeated samp-
ling. The relative difference between ®ngertip and venous
parameters were 6.8±9.2% for WBC-related parameters
and 0.2±1.2% for other parameters (Table 1). Therefore, if
the above variations and differences are acceptable, blood
counts with ®ngertip blood (the sampling of which is
simple and more acceptable to most patients) would still be
acceptable in clinical practice.
Acknowledgements
The authors wish to thank Messrs Jun-An Li and Yong-
Sheng Feng (Department of Clinical Laboratory Sciences)
for their excellent technical work and Dr Jing-Guo Zhou
(Department of Haematology) for his helpful suggestion.
This study was ®nancially supported by an `Excellent
Young Researcher Grant' from the Chinese Ministry of
Education.
References
Conway A.M., Hinchliffe R.F., Earland J. & Anderson L.M. (1998)
Measurement of haemoglobin using single drops of skin
puncture blood: is precision acceptable? Journal of Clinical
Pathology 51, 248±250.
Daae L.N., Halvorsen S., Mathisen P.M. & Mironska K. (1988) A
comparison between haematological parameters in `capillary'
and venous blood from healthy adults. Scandinavian Journal of
Clinical and Laboratory Investigation 48, 723±726.
Daae L.N., Hallerud M. & Halvorsen S. (1991) A comparison
between haematological parameters in `capillary' and venous
blood samples from hospitalized children aged 3 months to 14
years. Scandinavian Journal of Clinical and Laboratory Investiga-
tion 51, 651±654.
Dacie J.W. & Lewis S.M. (1984) Practical Haematology, 6th edn.
Churchill Livingstone, London, 1±6.
Leppanen E.A. (1988) Experimental basis of standardized speci-
men collection: the effect of the site of venipuncture on the
blood picture, the white blood cell differential count, and the
serum albumin concentration. European Journal of Haematology
41, 445±448.
Li C.H., Zhu J.D. & Yin S.J. (1997) Comparison of multi-param-
eter haematological analysis between ®nger and venous blood
from 200 healthy adults. Chinese Journal of Medical and Labor-
atory Science 20, 46±47.
Liu N.D., Yuan H.R., Huang Y., Wang H. & Qin X.G. (1999)
Comparison of 18 haematological parameters between ®nger
and venous blood from 124 cases. Journal of Clinical and
Laboratory Science (China) 17, 88.
Yuan Q., Xu Y.R. & Wang F. (1999) Comparison of multi-
parameters between ®nger and venous blood with Coulter JT
haematology analyser. Information of Henan Medicine (China)
7, 42.
Z.-W. Yang et al. 159
Ó 2001 Blackwell Science Ltd., Clin. Lab. Haem., 23, 155±159