comparison of alternate cooling technologies
TRANSCRIPT
CALIFORNIA ENERGY COMMISSION
Comparison of Alternate Cooling Technologies for California Power PlantsEconomic, Environmental and Other Tradeoffs
February 2002
CO
NS
UL
TA
NT
RE
PO
RT
500-02-079F
Gray Davis, Governor
CALIFORNIAENERGYCOMMISSION
Prepared By:Electric Power Research Institute
Prepared For:California Energy Commission
Kelly BirkinshawPIER Program Area Lead
Marwan MasriDeputy DirectorTechnology Systems Division
Robert L. TherkelsenExecutive Director

PIER / EPRI TECHNICAL REPORT
Comparison of Alternate CoolingTechnologies for California Power Plants
Economic, Environmental and Other Tradeoffs
This report was prepared as the result of work sponsored by theCalifornia Energy Commission. It does not necessarily represent theviews of the Energy Commission, its employees or the State ofCalifornia. The Energy Commission, the State of California, itsemployees, contractors and subcontractors make no warrant,express or implied, and assume no legal liability for the information inthis report; nor does any party represent that the uses of thisinformation will not infringe upon privately owned rights. This reporthas not been approved or disapproved by the California EnergyCommission, nor has the California Energy Commission passedupon the accuracy or adequacy of the information in this report.
EPRI Project ManagerK. Zammit
EPRI • 3412 Hillview Avenue, Palo Alto, California 94304 • PO Box 10412, Palo Alto, California 94303 • USA800.313.3774 • 650.855.2121 • [email protected] • www.epri.com
Comparison of Alternate CoolingTechnologies for California Power Plants
Economic, Environmental and Other Tradeoffs
Final Report, February 2002
CosponsorCalifornia Energy Commission1516 9th StreetSacramento, CA 95814-5504
Project ManagersMatthew S. Layton, Joseph O’Hagan
DISCLAIMER OF WARRANTIES AND LIMITATION OF LIABILITIES
THIS DOCUMENT WAS PREPARED BY THE ORGANIZATION(S) NAMED BELOW AS ANACCOUNT OF WORK SPONSORED OR COSPONSORED BY THE ELECTRIC POWER RESEARCHINSTITUTE, INC. (EPRI). NEITHER EPRI, ANY MEMBER OF EPRI, ANY COSPONSOR, THEORGANIZATION(S) BELOW, NOR ANY PERSON ACTING ON BEHALF OF ANY OF THEM:
(A) MAKES ANY WARRANTY OR REPRESENTATION WHATSOEVER, EXPRESS OR IMPLIED, (I)WITH RESPECT TO THE USE OF ANY INFORMATION, APPARATUS, METHOD, PROCESS, ORSIMILAR ITEM DISCLOSED IN THIS DOCUMENT, INCLUDING MERCHANTABILITY AND FITNESSFOR A PARTICULAR PURPOSE, OR (II) THAT SUCH USE DOES NOT INFRINGE ON ORINTERFERE WITH PRIVATELY OWNED RIGHTS, INCLUDING ANY PARTY'S INTELLECTUALPROPERTY, OR (III) THAT THIS DOCUMENT IS SUITABLE TO ANY PARTICULAR USER'SCIRCUMSTANCE; OR
(B) ASSUMES RESPONSIBILITY FOR ANY DAMAGES OR OTHER LIABILITY WHATSOEVER(INCLUDING ANY CONSEQUENTIAL DAMAGES, EVEN IF EPRI OR ANY EPRI REPRESENTATIVEHAS BEEN ADVISED OF THE POSSIBILITY OF SUCH DAMAGES) RESULTING FROM YOURSELECTION OR USE OF THIS DOCUMENT OR ANY INFORMATION, APPARATUS, METHOD,PROCESS, OR SIMILAR ITEM DISCLOSED IN THIS DOCUMENT.
ORGANIZATION(S) THAT PREPARED THIS DOCUMENT
John S. Maulbetsch
CALIFORNIA ENERGY COMMISSION LEGAL NOTICE
THIS REPORT WAS PREPARED AS A RESULT OF WORK SPONSORED BY THE CALIFORNIAENERGY COMMISSION (COMMISSION). IT DOES NOT NECESSARILY REPRESENT THE VIEWSOF THE COMMISSION, ITS EMPLOYEES, OR THE STATE OF CALIFORNIA. THE COMMISSION,THE STATE OF CALIFORNIA, ITS EMPLOYEES, CONTRACTORS, AND SUBCONTRACTORSMAKE NO WARRANTY, EXPRESS OR IMPLIED, AND ASSUME NO LEGAL LIABILITY FOR THEINFORMATION IN THIS REPORT; NOR DOES ANY PARTY REPRESENT THAT THE USE OF THISINFORMATION WILL NOT INFRINGE UPON PRIVATELY OWNED RIGHTS. THIS REPORT HASNOT BEEN APPROVED OR DISAPPROVED BY THE COMMISSION NOR HAS THE COMMISSIONPASSED UPON THE ACCURACY OR ADEQUACY OF THIS INFORMATION IN THIS REPORT.
ORDERING INFORMATION
Requests for copies of this report should be directed to the EPRI Orders and Conferences, 1355 WillowWay, Suite 278, Concord, CA 94520, (800) 313-3774, press 2 or internally x5379, (925) 609-9169,(925) 609-1310 (fax). Copies of this report may also be downloaded from the California EnergyCommission's website: http://www.energy.ca.gov/reports/
Electric Power Research Institute and EPRI are registered service marks of the Electric PowerResearch Institute, Inc. EPRI. ELECTRIFY THE WORLD is a service mark of the Electric PowerResearch Institute, Inc.
Copyright © 2002 Electric Power Research Institute, Inc. All rights reserved.
iii
CITATIONS
This report was prepared by
John S. Maulbetsch90 Lloyden DriveAtherton, CA 94027
This report describes research sponsored by EPRI and California Energy Commission.
The report is a corporate document that should be cited in the literature in the following manner:
Comparison of Alternate Cooling Technologies for California Power Plants: Economic,Environmental, and Other Tradeoffs, EPRI, Palo Alto, CA, and California Energy Commission,Sacramento, CA: 2002. Product ID.

v
ABSTRACT
This study defines, explains, and documents the cost, performance, and environmental impacts ofboth wet and dry cooling systems. A survey of the cooling system literature is provided in anannotated bibliography and summarized in the body of the report. Conceptual designs aredeveloped for wet and dry cooling systems as applied to a new, gas-fired, combined-cycle 500-MW plant (170 MW produced by the steam turbine) at four sites chosen to be representative ofconditions in California. The initial capital costs range from $2.7 to $4.1 million for wet systemsusing mechanical-draft wet cooling towers with surface steam condensers and from $18 to $47million for dry systems using air-cooled condensers.
Cooling system power requirements for dry systems are four to six times those for wet systems.Dry systems, which are limited by the ambient dry bulb temperature, cannot achieve as low aturbine back pressure as wet systems, which are limited by the ambient wet bulb. Therefore, heatrate penalties and capacity limitations are incurred at some sites depending on local meteorology.A methodology is developed and illustrated that accounts for these several components of costand performance penalties in selecting an optimized design for a specific site.
A brief review is given of some advanced cooling system technologies currently in development,highlighting an evaporative condenser system with a water-conserving mode that halves theconsumptive water use of a conventional wet system. In addition, current research in the powerplant cooling field is reviewed with particular attention to concepts for enhancing theperformance of dry systems during the peak period (the hottest hours of the year).

vii
ACKNOWLEDGMENTS
The performance of this study was greatly aided and the quality of its results improved by thecontributions of many people and organizations.
From the cooling system vendor community, contributions were made by Ceramic CoolingTower Corporation, Hamon Cooling Towers, GEA Power Cooling Systems, The Marley CoolingTower Company, Graham Corporation, and Niagara Blower, Inc.
From the cooling system user community, gratitude is expressed to personnel with Crockett Co-Generation, Calpine, El Dorado Energy, MassPower, and Chinese Station.
Useful review comments were provided by K. Bulleit, J. Burns, R. Furnari, G. Innes, W.Micheletti, and, particularly, Prof. Detlev Kröger.
Extensive and valuable editorial assistance was provided by Chris Powicki of WEE Info.
Continuing discussion throughout the course of the work with Matt Layton and Joe O’Hagan ofthe California Energy Commission and Kent Zammit of EPRI provided invaluable guidance.
These acknowledgements should not be interpreted as meaning that all of the participants are incomplete accord with or endorse the results and conclusions of this study. Where differences inopinion or point of view remain, the final report reflects those of the author.

ix
CONTENTS
1 INTRODUCTION.................................................................................................................. 1-1
The Drivers.............................................................................................................................. 1-1
Cooling System Options ......................................................................................................... 1-6
Once-Through Systems ..................................................................................................... 1-6
Recirculating Wet Systems ................................................................................................ 1-6
Dry Systems ....................................................................................................................... 1-6
Hybrid Wet-Dry Systems.................................................................................................... 1-7
Tradeoffs ................................................................................................................................. 1-7
Scope of Project...................................................................................................................... 1-7
Organization of Report .......................................................................................................... 1-10
References ............................................................................................................................ 1-11
2 POWER PLANT COOLING SYSTEMS.............................................................................. 2-1
Combined-Cycle Plants .......................................................................................................... 2-1
Cooling System Alternatives ................................................................................................... 2-2
Once-Through Cooling ....................................................................................................... 2-3
Recirculating Wet Cooling.................................................................................................. 2-4
Mass and Heat Balances .............................................................................................. 2-6
Evaporation Rate ........................................................................................................... 2-7
Blowdown Rate.............................................................................................................. 2-8
Dry Cooling ......................................................................................................................... 2-9
Heat Balance............................................................................................................... 2-11
Hybrid Wet/Dry Systems.................................................................................................. 2-12
Nomenclature ........................................................................................................................ 2-17
References ............................................................................................................................ 2-18
x
3 COOLING TECHNOLOGIES: THE STATE OF THE ART................................................. 3-1
Literature Survey..................................................................................................................... 3-1
Wet Cooling ........................................................................................................................ 3-1
Dry Cooling ......................................................................................................................... 3-2
Hybrid Wet/Dry Cooling ...................................................................................................... 3-3
History of Dry Cooling Technology ......................................................................................... 3-4
Trends in Dry Cooling Use................................................................................................. 3-6
Recent Developments ........................................................................................................ 3-8
Operating Experience.............................................................................................................. 3-8
Crockett Co-Generation...................................................................................................... 3-9
El Dorado.......................................................................................................................... 3-11
Calpine.............................................................................................................................. 3-11
MassPower....................................................................................................................... 3-13
Chinese Station ................................................................................................................ 3-13
References ............................................................................................................................ 3-15
4 CASE STUDY SITE SELECTION....................................................................................... 4-1
Important Site Characteristics................................................................................................. 4-1
Site Meteorology................................................................................................................. 4-4
Site Elevation...................................................................................................................... 4-4
Water Availability................................................................................................................ 4-5
Wind Conditions ................................................................................................................. 4-5
Local Environmental Constraints ....................................................................................... 4-6
Proximity to Other Activities ............................................................................................... 4-6
Chosen Sites ........................................................................................................................... 4-6
References .............................................................................................................................. 4-9
5 COMPARATIVE COST ANALYSES................................................................................... 5-1
Introduction and Guidelines .................................................................................................... 5-1
Cautions and Limitations ......................................................................................................... 5-1
Methodology............................................................................................................................ 5-2
xi
Previous Analyses................................................................................................................... 5-4
Cost Development................................................................................................................... 5-8
Recirculating Wet Cooling....................................................................................................... 5-9
Surface Steam Condenser................................................................................................. 5-9
HEI Procedures ........................................................................................................... 5-10
Supplier Quotes ........................................................................................................... 5-11
Comparison with Published Costs .............................................................................. 5-13
Wet Cooling Towers......................................................................................................... 5-14
Wet System Cost Analysis ............................................................................................... 5-16
Performance Penalties for Wet Systems......................................................................... 5-23
Dry Cooling............................................................................................................................ 5-24
Cost Elements .................................................................................................................. 5-24
Installation/Erection ..................................................................................................... 5-26
Electrical Wiring/Hook-Up............................................................................................ 5-26
Auxiliary Cooling .......................................................................................................... 5-26
Additional Items........................................................................................................... 5-26
Dry System Cost Analysis ................................................................................................ 5-27
Power Requirements........................................................................................................ 5-28
Determination of Penalty Costs ....................................................................................... 5-30
Penalty Evaluation Methodology................................................................................. 5-31
Extension of Penalty Evaluation Procedure to Other Sites ........................................ 5-37
References ............................................................................................................................ 5-39
6 ENVIRONMENTAL IMPACTS............................................................................................ 6-1
Regulatory Matters.................................................................................................................. 6-1
Types of Cooling System Impacts .......................................................................................... 6-2
Water Resources .................................................................................................................... 6-3
Dry Cooling ......................................................................................................................... 6-3
Hybrid System .................................................................................................................... 6-4
Waste Management (Including Water Discharge) ................................................................. 6-4
Hazardous Materials ............................................................................................................... 6-5
Air Emissions .......................................................................................................................... 6-5
Federal Regulations ........................................................................................................... 6-5
xii
State Regulations ............................................................................................................... 6-6
Second-Order Effects ......................................................................................................... 6-7
Noise........................................................................................................................................ 6-7
Visual Resources .................................................................................................................... 6-8
Public Health............................................................................................................................ 6-8
Biological Impacts ................................................................................................................... 6-9
Agriculture and Soils ............................................................................................................. 6-10
Summary............................................................................................................................... 6-10
References ............................................................................................................................ 6-10
7 CURRENT RESEARCH AND DEVELOPMENT ................................................................ 7-1
Heat Exchanger Design .......................................................................................................... 7-1
Performance Enhancement .................................................................................................... 7-2
System Design ........................................................................................................................ 7-3
Direct-Contact Condensers................................................................................................ 7-3
Ammonia Dry Cooling......................................................................................................... 7-3
Evaporative Condensers.................................................................................................... 7-4
NWD................................................................................................................................... 7-4
Analytical Methods .................................................................................................................. 7-4
Summary................................................................................................................................. 7-4
References .............................................................................................................................. 7-5
8 EMERGING TECHNOLOGIES ........................................................................................... 8-1
Hybrid Cooling Systems: Evaporative Condenser ................................................................. 8-1
Comparison to Wet Cooling Tower with Surface Condenser............................................ 8-2
Comparison with Dry Cooling............................................................................................. 8-2
Water Use Considerations ................................................................................................. 8-3
Capital Cost Elements........................................................................................................ 8-3
Case Study Results............................................................................................................ 8-5
Development of Correlation for Evaporative Condenser Costs ........................................ 8-9
Unconstrained Water Availability................................................................................... 8-9
Constrained Water Availability .................................................................................... 8-10
xiii
Power Requirements........................................................................................................ 8-13
Summary............................................................................................................................... 8-15
References ............................................................................................................................ 8-16
9 SUMMARY AND CONCLUSIONS...................................................................................... 9-1
Water Consumption ................................................................................................................ 9-1
Plant Performance .................................................................................................................. 9-2
Operating Power Requirements......................................................................................... 9-2
Efficiency Penalties ............................................................................................................ 9-2
Capacity Penalties .............................................................................................................. 9-3
Cost......................................................................................................................................... 9-3
Wet Systems ...................................................................................................................... 9-4
Dry Systems ....................................................................................................................... 9-4
Operations and Maintenance.................................................................................................. 9-5
Environmental Effects ............................................................................................................. 9-5
Air Emissions...................................................................................................................... 9-5
Noise................................................................................................................................... 9-6
Visual Resources ............................................................................................................... 9-6
Biological Impacts .............................................................................................................. 9-6
Current R&D............................................................................................................................ 9-6
Emerging Technologies .......................................................................................................... 9-7
References .............................................................................................................................. 9-7
A ANNOTATED BIBLIOGRAPHY OF COOLING SYSTEM LITERATURE.......................A-1
B EXISTING AND PLANNED DRY AND HYBRID COOLING SYSTEMS.........................B-1
Major Manufacturers and Contact Information .......................................................................B-1
Installations..............................................................................................................................B-1
BDT Engineering: Air-Cooled Turbine Exhaust Steam Condensers, WorldwideProject Experience .............................................................................................................B-2
Marley: Parallel Path Wet Dry Cooling Towers (Plume Abatement Towers)....................B-5
xiv
GEA: Direct Air Cooled Condenser Installations ...............................................................B-7
Hamon: Direct Air Cooled Condenser Installations .........................................................B-13
C MATERIALS FROM DRY COOLING SYSTEM OWNER/OPERATORS........................C-1
Interview Meetings ..................................................................................................................C-1
Crockett Co-Generation Plant ............................................................................................C-1
Site Visit Report (June 12, 2000) ..................................................................................C-1
System Description: Crockett Co-generation Project, ..................................................C-4
Air-Cooled Condenser...................................................................................................C-4
El Dorado Energy .............................................................................................................C-18
Description: El Dorado Energy ....................................................................................C-20
Calpine..............................................................................................................................C-24
Chinese Station: Contact Information ..............................................................................C-27
MassPower: Contact Information .....................................................................................C-27
D CASE STUDY SITE CHARACTERISTICS.......................................................................D-1
Desert Site..........................................................................................................................D-3
Mountain Site......................................................................................................................D-7
Valley Site ...........................................................................................................................D-9
Bay Area Site....................................................................................................................D-11
xv
LIST OF FIGURES
Figure 1-1 California Population: History and Projections .......................................................... 1-2
Figure 1-2 California Gross State Product................................................................................. 1-2
Figure 1-3 California Water Use: Actual and Projected .............................................................. 1-3
Figure 2-1 Schematic of Typical Combined-Cycle Power Plant ................................................. 2-1
Figure 2-2 Power Plant Cooling System Arrangements: Once-Through Cooling ...................... 2-4
Figure 2-3 Recirculating Wet Cooling Tower............................................................................... 2-5
Figure 2-4 Mechanical- and Natural-Draft Cooling Towers ........................................................ 2-6
Figure 2-5 Cooling Tower Mass and Heat Balance .................................................................... 2-7
Figure 2-6 Dry (Air-Cooled) Cooling System............................................................................. 2-10
Figure 2-7 Dry Cooling System with Surface and Spray Condensers...................................... 2-11
Figure 2-8 Flows and Temperatures in an Air-Cooled Condenser ........................................... 2-12
Figure 2-9 Hybrid Systems—Single Tower (Plume Abatement)............................................... 2-14
Figure 2-10 Hybrid Systems—Separate Towers (Water Conservation)................................... 2-14
Figure 2-11 Hybrid Systems—Pre-Cooling Section (Water Conservation).............................. 2-15
Figure 2-12 Separate Towers and Surface Condensers (Water Conservation) ...................... 2-16
Figure 3-1 Trends in Dry Cooling................................................................................................. 3-6
Figure 4-1 California Power Plants (Source: CEC website) ....................................................... 4-2
Figure 4-2 Current, Expected, and Recently Approved Licensing Cases (Source: CECwebsite)................................................................................................................................ 4-3
Figure 5-1 Heat Rate Ratio vs. Back Pressure........................................................................... 5-3
Figure 5-2 Schematic of Tradeoffs .............................................................................................. 5-4
Figure 5-3 Capital Cost Ratio ...................................................................................................... 5-6
Figure 5-4 Capital Plus Capacity Replacement Cost Ratio ........................................................ 5-7
Figure 5-5 Total Evaluated Cost Ratio ........................................................................................ 5-7
Figure 5-6 Busbar Power Cost Ratio........................................................................................... 5-8
Figure 5-7 Supplier Quote Correlation....................................................................................... 5-13
Figure 5-8 Wet Cooling Tower Capital Cost vs. Approach for Low First Cost Design (forNew 500-MWe Facilities with 170-MWe Steam Cycle) .................................................... 5-18
Figure 5-9 Wet Cooling System Capital Cost vs. Approach for Low First Cost Design (forNew 500-MWe Facilities with 170-MWe Steam Cycle) .................................................... 5-19
Figure 5-10 Wet Cooling Tower Capital Cost vs. Approach for Minimum Evaluated CostDesign (for New 500-MWe Facilities with 170-MWe Steam Cycle) ................................. 5-19
xvi
Figure 5-11 Wet Cooling System Capital Cost vs. Approach for Minimum Evaluated CostDesign (for New 500-MWe Facilities with 170-MWe Steam Cycle) ................................. 5-20
Figure 5-12 Wet Cooling System Power Requirement (Pumps and Fans) vs. Approach(for New 500-MWe Facilities with 170-MWe Steam Cycle).............................................. 5-20
Figure 5-13 Wet Cooling System Total Evaluated Cost vs. Approach for Low First CostDesign (for New 500-MWe Facilities with 170-MWe Steam Cycle) ................................. 5-21
Figure 5-14 Wet Cooling System Total Evaluated Cost vs. Approach for MinimumEvaluated Cost Design (for New 500-MWe Facilities with 170-MWe Steam Cycle)........ 5-22
Figure 5-15 Comparison of Total Evaluated Costs for Wet Cooling Systems, MinimumEvaluated Cost Design vs. Low First Cost Design (for New 500-MWe Facilities with170-MWe Steam Cycle)..................................................................................................... 5-22
Figure 5-16 Wet Bulb Duration Curves ..................................................................................... 5-24
Figure 5-17 Capital Cost vs. ITD for Air-Cooled Condenser (for New 500-MWe Facilitieswith 170-MWe Steam Cycle)............................................................................................. 5-27
Figure 5-18 Normalized Cost vs. ITD for Air-Cooled Condenser (for New 500-MWeFacilities with 170-MWe Steam Cycle).............................................................................. 5-28
Figure 5-19 Fan Power vs. ITD.................................................................................................. 5-29
Figure 5-20 Evaluated Cost of Power ....................................................................................... 5-29
Figure 5-21 Total Evaluated Costs vs. ITD ............................................................................... 5-30
Figure 5-22 ACC Performance—Back Pressure vs. Tamb (for New 500-MWe Facilitieswith 170-MWe Steam Cycle)............................................................................................. 5-30
Figure 5-23 Desert Site Annual Temperature Profile ................................................................ 5-32
Figure 5-24 ACC Performance—Back Pressure vs. Tamb (for New 500-MWe Facilitieswith 170-MWe Steam Cycle)............................................................................................. 5-32
Figure 5-25 Lost Output vs. Turbine Back Pressure................................................................. 5-33
Figure 5-26 Total Evaluated Cost and Penalties—Steam Side Only ....................................... 5-37
Figure 5-27 Total Evaluated Cost and Penalties—Whole Plant ............................................... 5-37
Figure 5-28 Site Temperature Profiles ...................................................................................... 5-38
Figure 7-1 Effect of Pre-Cooling of Inlet Air (source: Kroeger 1998).......................................... 7-3
Figure 8-1 Schematic of Wet Surface Air Cooler (source: Niagara Blower Co. brochure) ........ 8-2
Figure 8-2 Evaporative Condenser Cost vs. Approach (for New 500-MWe Combined-Cycle Plants with 170-MWe Steam Cycle)........................................................................ 8-10
Figure 8-3 Evaporative Condenser Cost vs. Approach—50% Water Availability (for New500-MWe Combined-Cycle Plants with 170-MWe Steam Cycle)..................................... 8-11
Figure 8-4 Wet/Dry Surface Air Cooler: Normalized Cost vs. Approach (for New 500-MWe Combined-Cycle Plants with 170-MWe Steam Cycle) ............................................ 8-11
Figure 8-5 Evaporative Condenser—Increase in Cost for Water Conservation (for New500-MWe Combined-Cycle Plants with 170-MWe Steam Cycle)..................................... 8-12
Figure 8-6 Evaporative Condenser Curve-Fitted Cost (for New 500-MWe Combined-Cycle Plants with 170-MWe Steam Cycle)........................................................................ 8-12
Figure 8-7 Evaporative Condenser—Fan and Pump Power vs. Approach (for New 500-MWe Combined-Cycle Plants with 170-MWe Steam Cycle) ............................................ 8-13

xvii
Figure 8-8 Evaporative Condenser Power Requirements in Dry-Mode Operation (forNew 500-MWe Combined-Cycle Plants with 170-MWe Steam Cycle) ............................ 8-13
Figure 8-9 Evaporative Condenser Total Evaluated Cost vs. Approach (for New 500-MWe Combined-Cycle Plants with 170-MWe Steam Cycle) ............................................ 8-14
Figure 8-10 Evaporative Condenser Cost Comparison............................................................ 8-15
Figure 8-11 Evaporative Condenser Power Use Comparison.................................................. 8-15
Figure 9-1 Case Study Cost Summary ....................................................................................... 9-4

xix
LIST OF TABLES
Table 1-1 Water Requirements for Power Generation (in Gallons per MWh of PlantOutput) ................................................................................................................................. 1-4
Table 1-2 California Power Plants Approved or Under Review by the CEC as of October9, 2001 (CEC, 2001) ............................................................................................................ 1-5
Table 1-3 Tradeoffs Among Various Types of Cooling Systems................................................ 1-9
Table 2-1 Steam Cycle Cooling System Conditions ................................................................... 2-3
Table 2-2 Nomenclature ............................................................................................................ 2-17
Table 3-1 Early Major Dry Cooling Installations .......................................................................... 3-5
Table 3-2 Dry Cooling in the United States (Source: Vendor Lists—Appendix B) ..................... 3-7
Table 3-3 Plants Interviewed for O&M Experience..................................................................... 3-9
Table 4-1 Site Specifications ....................................................................................................... 4-8
Table 5-1 Overall Heat Transfer Coefficient vs. Tubeside Water Velocity in SurfaceSteam Condensers (source: HEI Handbook) .................................................................... 5-10
Table 5-2 Surface Steam Condensers, Supplier-Quoted Prices (Equipment "Ex-Works") ..... 5-12
Table 5-3 Surface Steam Condensers—Normalized Budget Prices........................................ 5-12
Table 5-4 Capital Cost Elements for Wet Cooling System Equipment for New Plants ............ 5-15
Table 5-5 Capital Cost Breakdown for Wet Cooling System Equipment at CaliforniaCentral Valley Location, “Low First Cost” Design ............................................................. 5-16
Table 5-6 Site-to-Site Cost Estimates—Wet Cooling Tower and Surface Condenser forNew 500-MWe Combined-Cycle Plants with 170-MWe Steam Cycle.............................. 5-17
Table 5-7 Relative Humidity at Peak Temperature Periods...................................................... 5-23
Table 5-8 Capital Cost Elements for Dry Cooling System Equipment for New Facilities......... 5-25
Table 5-9 Cases for Penalty Evaluation Analysis ..................................................................... 5-31
Table 5-10 Operating Hours Above Given Back Pressure ....................................................... 5-33
Table 5-11 Lost Energy from Heat Rate Penalty....................................................................... 5-34
Table 5-12 Lost Output from Capacity Reduction Penalty—Steam Side Only......................... 5-34
Table 5-13 Lost Output from Capacity Reduction Penalty—Whole Plant ................................ 5-35
Table 5-14 Lost Energy from Heat Rate Penalty....................................................................... 5-35
Table 5-15 Evaluated Cost of Lost Output from Capacity Reduction Penalty—SteamSide Only............................................................................................................................ 5-36
Table 5-16 Evaluated Cost of Lost Output from Capacity Reduction Penalty—WholePlant ................................................................................................................................... 5-36
xx
Table 5-17 Capital Cost Breakdown for Dry Cooling System Equipment at CaliforniaCentral Valley Location—Optimized Design (for New 500-MWe Facilities with 170-MWe Steam Cycle)............................................................................................................ 5-39
Table 5-18 Site-to-Site Cost Estimates—Air-Cooled Condenser ((for New 500-MWeFacilities with 170-MWe Steam Cycle).............................................................................. 5-39
Table 6-1 Power Plant Cooling Systems: Requirements for Approval (from CaliforniaCode of Regulations, Title 20, Div. 2, Chap. 5---§2012, App. B) ........................................ 6-2
Table 8-1 Capital Cost Elements for Evaporative Condenser Equipment (for New 500-MWe Combined-Cycle Plants with 170-MWe Steam Cycle) .............................................. 8-4
Table 8-2 Capital Cost Breakdown for a 106 lb/hr Steam Condenser, Central ValleySite—Unconstrained Water Availability (for New 500-MWe Combined-Cycle Plantswith 170-MWe Steam Cycle)............................................................................................... 8-5
Table 8-3 Capital Cost Breakdown for a 106 lb/hr Steam Condenser, Central ValleySite—Constrained to 50% Water Availability (for New 500-MWe Combined-CyclePlants with 170-MWe Steam Cycle).................................................................................... 8-6
Table 8-4 Cost Breakdown for 45 x 106 Btu/hour Auxiliary Cooler, Central Valley Site (forNew 500-MWe Combined-Cycle Plants with 170-MWe Steam Cycle) .............................. 8-7
Table 8-5 Site-to-Site Cost Estimates ($1000s)—Evaporative Condenser, UnlimitedWater Availability (for New 500-MWe Combined-Cycle Plants with 170-MWe SteamCycle) ................................................................................................................................... 8-8
Table 8-6 Site-to-Site Cost Estimates ($1000s)—Evaporative Condenser, 50% WaterConsumption (for New 500-MWe Combined-Cycle Plants with 170-MWe SteamCycle) ................................................................................................................................... 8-9
1-1
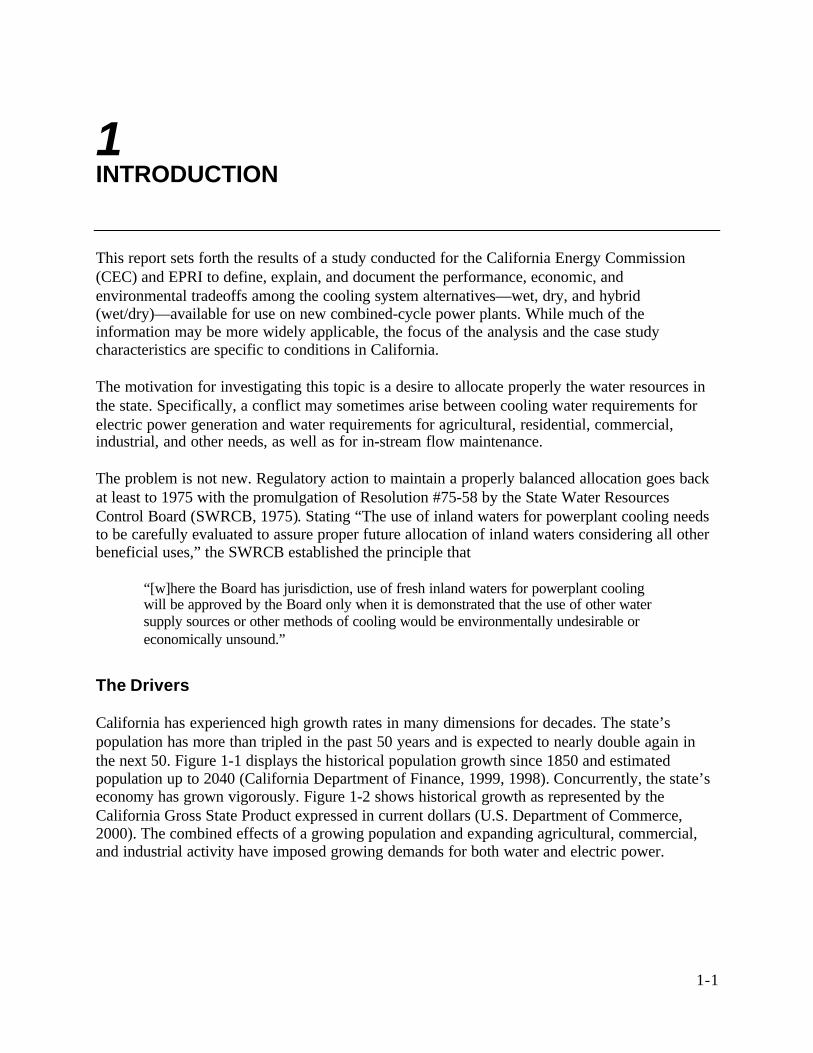
1 INTRODUCTION
This report sets forth the results of a study conducted for the California Energy Commission(CEC) and EPRI to define, explain, and document the performance, economic, andenvironmental tradeoffs among the cooling system alternatives—wet, dry, and hybrid(wet/dry)—available for use on new combined-cycle power plants. While much of theinformation may be more widely applicable, the focus of the analysis and the case studycharacteristics are specific to conditions in California.
The motivation for investigating this topic is a desire to allocate properly the water resources inthe state. Specifically, a conflict may sometimes arise between cooling water requirements forelectric power generation and water requirements for agricultural, residential, commercial,industrial, and other needs, as well as for in-stream flow maintenance.
The problem is not new. Regulatory action to maintain a properly balanced allocation goes backat least to 1975 with the promulgation of Resolution #75-58 by the State Water ResourcesControl Board (SWRCB, 1975). Stating “The use of inland waters for powerplant cooling needsto be carefully evaluated to assure proper future allocation of inland waters considering all otherbeneficial uses,” the SWRCB established the principle that
“[w]here the Board has jurisdiction, use of fresh inland waters for powerplant coolingwill be approved by the Board only when it is demonstrated that the use of other watersupply sources or other methods of cooling would be environmentally undesirable oreconomically unsound.”
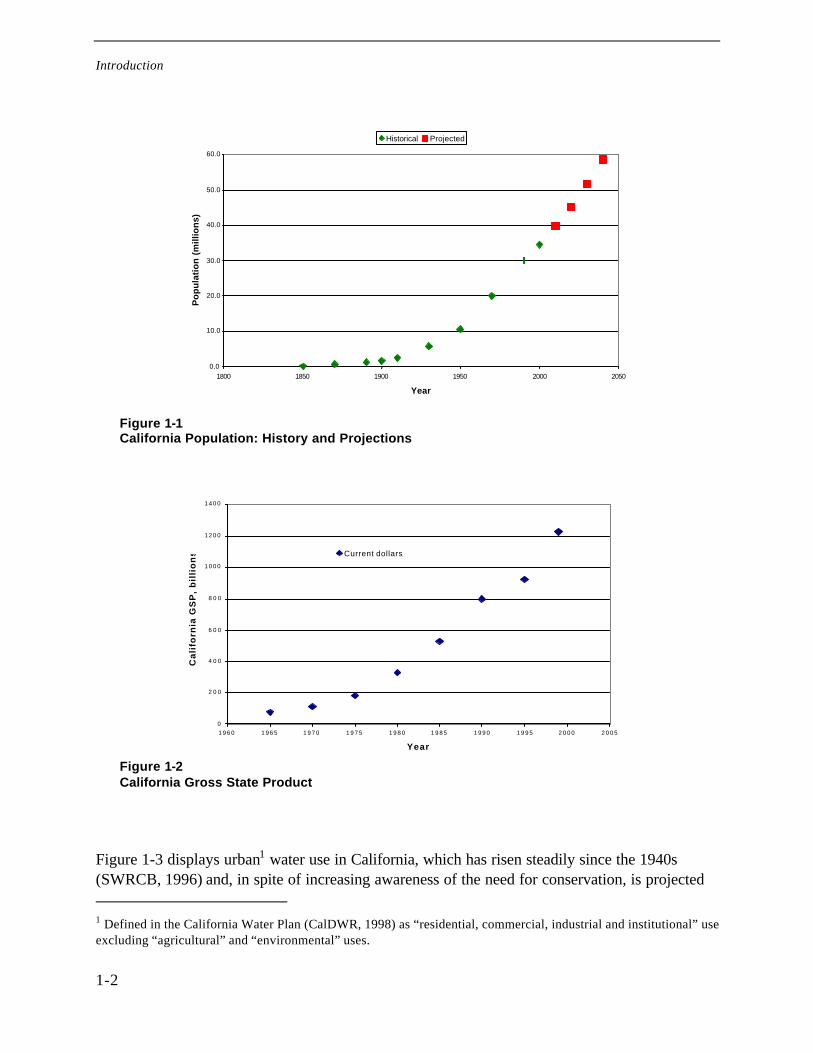
The Drivers
California has experienced high growth rates in many dimensions for decades. The state’spopulation has more than tripled in the past 50 years and is expected to nearly double again inthe next 50. Figure 1-1 displays the historical population growth since 1850 and estimatedpopulation up to 2040 (California Department of Finance, 1999, 1998). Concurrently, the state’seconomy has grown vigorously. Figure 1-2 shows historical growth as represented by theCalifornia Gross State Product expressed in current dollars (U.S. Department of Commerce,2000). The combined effects of a growing population and expanding agricultural, commercial,and industrial activity have imposed growing demands for both water and electric power.
Introduction
1-2
0
2 0 0
4 0 0
6 0 0
8 0 0
1 0 0 0
1 2 0 0
1 4 0 0
1 9 6 0 1 9 6 5 1 9 7 0 1 9 7 5 1 9 8 0 1 9 8 5 1 9 9 0 1 9 9 5 2 0 0 0 2 0 0 5 Year
Ca
lifo
rnia
GS
P,
bil
lio
ns
$ Current dollars
0.0
10.0
20.0
30.0
40.0
50.0
60.0
1800 1850 1900 1950 2000 2050
Year
Po
pu
lati
on
(m
illio
ns)
Historical Projected
Figure 1-1California Population: History and Projections
Figure 1-2California Gross State Product
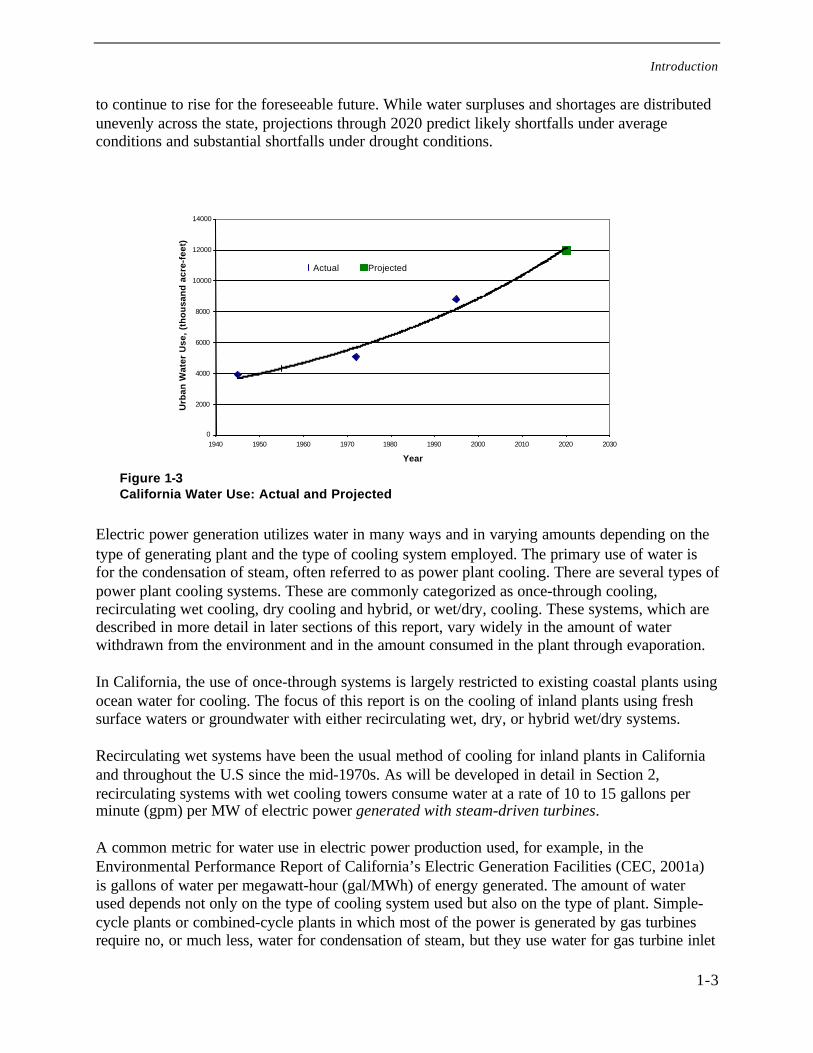
Figure 1-3 displays urban1 water use in California, which has risen steadily since the 1940s(SWRCB, 1996) and, in spite of increasing awareness of the need for conservation, is projected 1 Defined in the California Water Plan (CalDWR, 1998) as “residential, commercial, industrial and institutional” useexcluding “agricultural” and “environmental” uses.
Introduction
1-3
to continue to rise for the foreseeable future. While water surpluses and shortages are distributedunevenly across the state, projections through 2020 predict likely shortfalls under averageconditions and substantial shortfalls under drought conditions.
0
2000
4000
6000
8000
10000
12000
14000
1940 1950 1960 1970 1980 1990 2000 2010 2020 2030
Year
Urb
an W
ater
Use
, (t
ho
usa
nd
acr
e-fe
et)
Actual Projected
Figure 1-3California Water Use: Actual and Projected
Electric power generation utilizes water in many ways and in varying amounts depending on thetype of generating plant and the type of cooling system employed. The primary use of water isfor the condensation of steam, often referred to as power plant cooling. There are several types ofpower plant cooling systems. These are commonly categorized as once-through cooling,recirculating wet cooling, dry cooling and hybrid, or wet/dry, cooling. These systems, which aredescribed in more detail in later sections of this report, vary widely in the amount of waterwithdrawn from the environment and in the amount consumed in the plant through evaporation.
In California, the use of once-through systems is largely restricted to existing coastal plants usingocean water for cooling. The focus of this report is on the cooling of inland plants using freshsurface waters or groundwater with either recirculating wet, dry, or hybrid wet/dry systems.
Recirculating wet systems have been the usual method of cooling for inland plants in Californiaand throughout the U.S since the mid-1970s. As will be developed in detail in Section 2,recirculating systems with wet cooling towers consume water at a rate of 10 to 15 gallons perminute (gpm) per MW of electric power generated with steam-driven turbines.
A common metric for water use in electric power production used, for example, in theEnvironmental Performance Report of California’s Electric Generation Facilities (CEC, 2001a)is gallons of water per megawatt-hour (gal/MWh) of energy generated. The amount of waterused depends not only on the type of cooling system used but also on the type of plant. Simple-cycle plants or combined-cycle plants in which most of the power is generated by gas turbinesrequire no, or much less, water for condensation of steam, but they use water for gas turbine inlet
Introduction
1-4
cooling, emissions control, auxiliary equipment cooling, plant maintenance, etc. Stand-alonethermal steam plants and the steam portion of combined-cycle plants use the bulk of their waterfor steam cycle cooling. This portion of the water use can be eliminated or reduced by the use ofdry or wet/dry cooling systems.
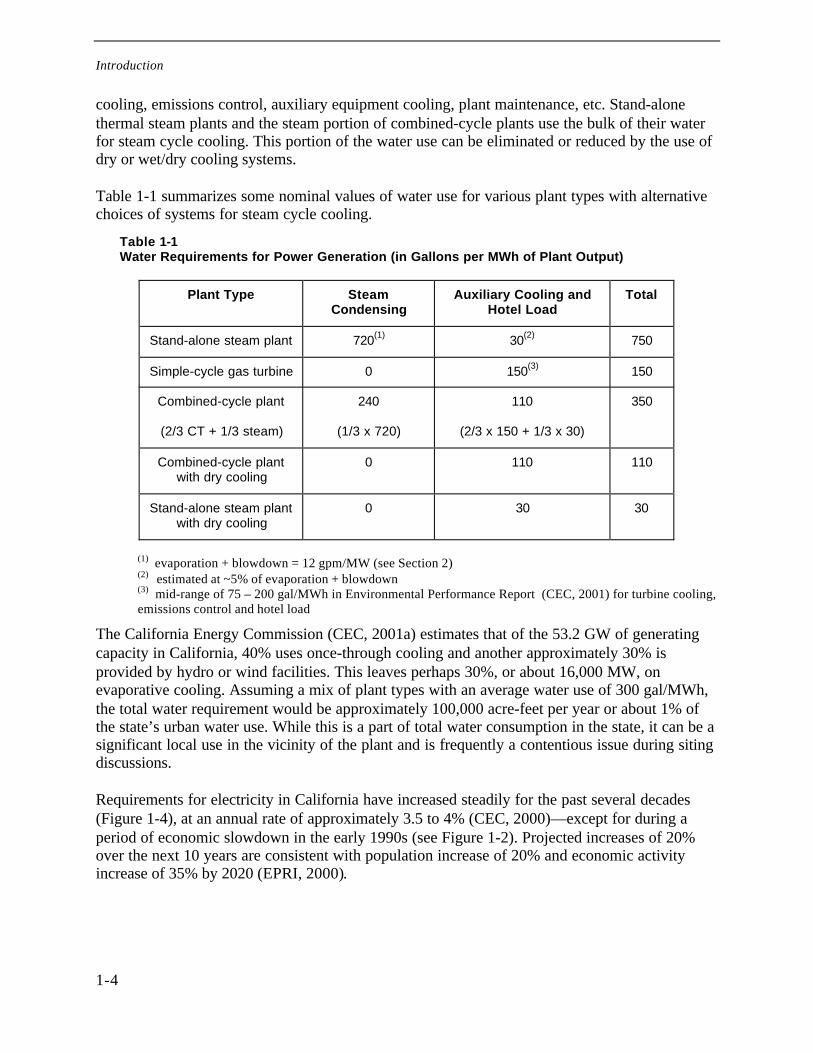
Table 1-1 summarizes some nominal values of water use for various plant types with alternativechoices of systems for steam cycle cooling.
Table 1-1Water Requirements for Power Generation (in Gallons per MWh of Plant Output)
Plant Type SteamCondensing
Auxiliary Cooling andHotel Load
Total
Stand-alone steam plant 720(1) 30(2) 750
Simple-cycle gas turbine 0 150(3) 150
Combined-cycle plant
(2/3 CT + 1/3 steam)
240
(1/3 x 720)
110
(2/3 x 150 + 1/3 x 30)
350
Combined-cycle plantwith dry cooling
0 110 110
Stand-alone steam plantwith dry cooling
0 30 30
(1) evaporation + blowdown = 12 gpm/MW (see Section 2)(2) estimated at ~5% of evaporation + blowdown(3) mid-range of 75 – 200 gal/MWh in Environmental Performance Report (CEC, 2001) for turbine cooling,emissions control and hotel load
The California Energy Commission (CEC, 2001a) estimates that of the 53.2 GW of generatingcapacity in California, 40% uses once-through cooling and another approximately 30% isprovided by hydro or wind facilities. This leaves perhaps 30%, or about 16,000 MW, onevaporative cooling. Assuming a mix of plant types with an average water use of 300 gal/MWh,the total water requirement would be approximately 100,000 acre-feet per year or about 1% ofthe state’s urban water use. While this is a part of total water consumption in the state, it can be asignificant local use in the vicinity of the plant and is frequently a contentious issue during sitingdiscussions.
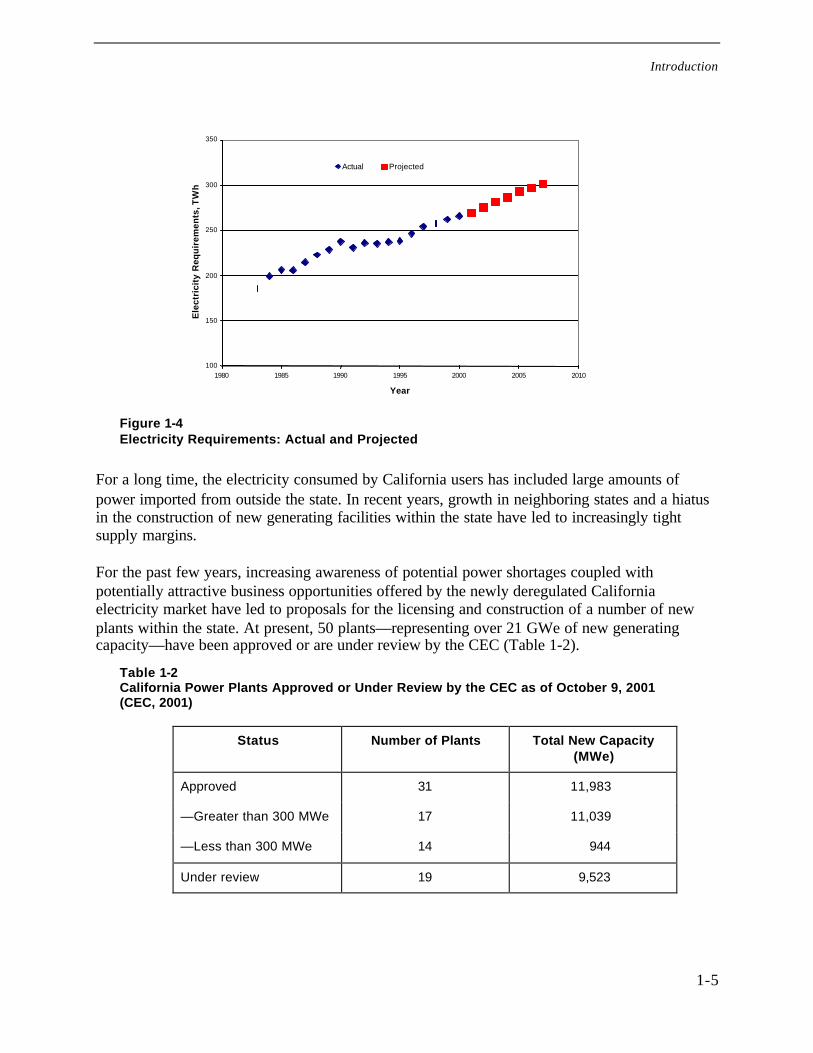
Requirements for electricity in California have increased steadily for the past several decades(Figure 1-4), at an annual rate of approximately 3.5 to 4% (CEC, 2000)—except for during aperiod of economic slowdown in the early 1990s (see Figure 1-2). Projected increases of 20%over the next 10 years are consistent with population increase of 20% and economic activityincrease of 35% by 2020 (EPRI, 2000).
Introduction
1-5
100
150
200
250
300
350
1980 1985 1990 1995 2000 2005 2010
Year
Ele
ctri
city
Req
uir
emen
ts, T
Wh
Actual Projected
Figure 1-4Electricity Requirements: Actual and Projected
For a long time, the electricity consumed by California users has included large amounts ofpower imported from outside the state. In recent years, growth in neighboring states and a hiatusin the construction of new generating facilities within the state have led to increasingly tightsupply margins.
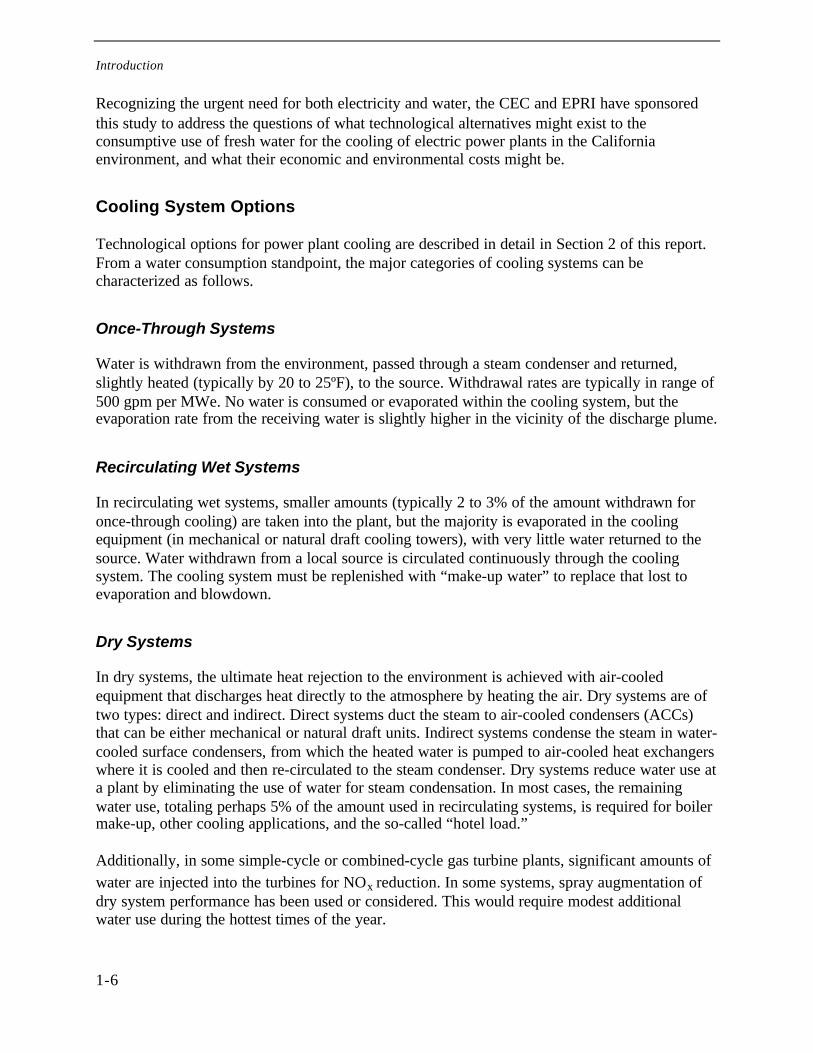
For the past few years, increasing awareness of potential power shortages coupled withpotentially attractive business opportunities offered by the newly deregulated Californiaelectricity market have led to proposals for the licensing and construction of a number of newplants within the state. At present, 50 plants—representing over 21 GWe of new generatingcapacity—have been approved or are under review by the CEC (Table 1-2).
Table 1-2California Power Plants Approved or Under Review by the CEC as of October 9, 2001(CEC, 2001)
Status Number of Plants Total New Capacity(MWe)
Approved 31 11,983
—Greater than 300 MWe 17 11,039
—Less than 300 MWe 14 944
Under review 19 9,523
Introduction
1-6
Recognizing the urgent need for both electricity and water, the CEC and EPRI have sponsoredthis study to address the questions of what technological alternatives might exist to theconsumptive use of fresh water for the cooling of electric power plants in the Californiaenvironment, and what their economic and environmental costs might be.
Cooling System Options
Technological options for power plant cooling are described in detail in Section 2 of this report.From a water consumption standpoint, the major categories of cooling systems can becharacterized as follows.
Once-Through Systems
Water is withdrawn from the environment, passed through a steam condenser and returned,slightly heated (typically by 20 to 25ºF), to the source. Withdrawal rates are typically in range of500 gpm per MWe. No water is consumed or evaporated within the cooling system, but theevaporation rate from the receiving water is slightly higher in the vicinity of the discharge plume.
Recirculating Wet Systems
In recirculating wet systems, smaller amounts (typically 2 to 3% of the amount withdrawn foronce-through cooling) are taken into the plant, but the majority is evaporated in the coolingequipment (in mechanical or natural draft cooling towers), with very little water returned to thesource. Water withdrawn from a local source is circulated continuously through the coolingsystem. The cooling system must be replenished with “make-up water” to replace that lost toevaporation and blowdown.
Dry Systems
In dry systems, the ultimate heat rejection to the environment is achieved with air-cooledequipment that discharges heat directly to the atmosphere by heating the air. Dry systems are oftwo types: direct and indirect. Direct systems duct the steam to air-cooled condensers (ACCs)that can be either mechanical or natural draft units. Indirect systems condense the steam in water-cooled surface condensers, from which the heated water is pumped to air-cooled heat exchangerswhere it is cooled and then re-circulated to the steam condenser. Dry systems reduce water use ata plant by eliminating the use of water for steam condensation. In most cases, the remainingwater use, totaling perhaps 5% of the amount used in recirculating systems, is required for boilermake-up, other cooling applications, and the so-called “hotel load.”
Additionally, in some simple-cycle or combined-cycle gas turbine plants, significant amounts ofwater are injected into the turbines for NOx reduction. In some systems, spray augmentation ofdry system performance has been used or considered. This would require modest additionalwater use during the hottest times of the year.
Introduction
1-7
Hybrid Wet-Dry Systems
In hybrid wet-dry systems, both wet and dry components are included in the system, and theycan be used separately or simultaneously for either water conservation or plume abatementpurposes. A combination of wet and dry cooling technology is used; depending on systemconfiguration, water consumption can approach that of recirculating wet systems or be muchlower. Design studies have ranged from 30 to 98% reduction in water use compared to all wetrecirculating systems (Mitchell, 1989).
In this report, the primary emphasis is on closed-cycle wet cooling using mechanical draft wetcooling towers and on direct dry systems using mechanical draft air-cooled condensers, sincethese systems are the ones that will be found almost exclusively on new combined-cycle plantsin California. However, descriptions of each of the systems mentioned above are included inSection 2 for convenience of reference for readers unacquainted with types of cooling systemsand their associated terminology.
Dry cooling has been used rarely in the U.S. until recently. A history of the U.S. and global useof dry cooling is reviewed briefly in Section 3.
Tradeoffs
The choice among the major categories of cooling systems involves a number of tradeoffs. Asnoted above, the SWRCB policy for allocating fresh water resources in California requires otherthan fresh inland water to be used for power plant cooling unless the alternatives are shown to be“environmentally undesirable or economically unsound” on the basis that there is a “limitedsupply of inland water resources in California.” Therefore, the primary tradeoffs are betweenwater use and the cost of electric power. Other environmental considerations exist, but they arenormally secondary in importance.
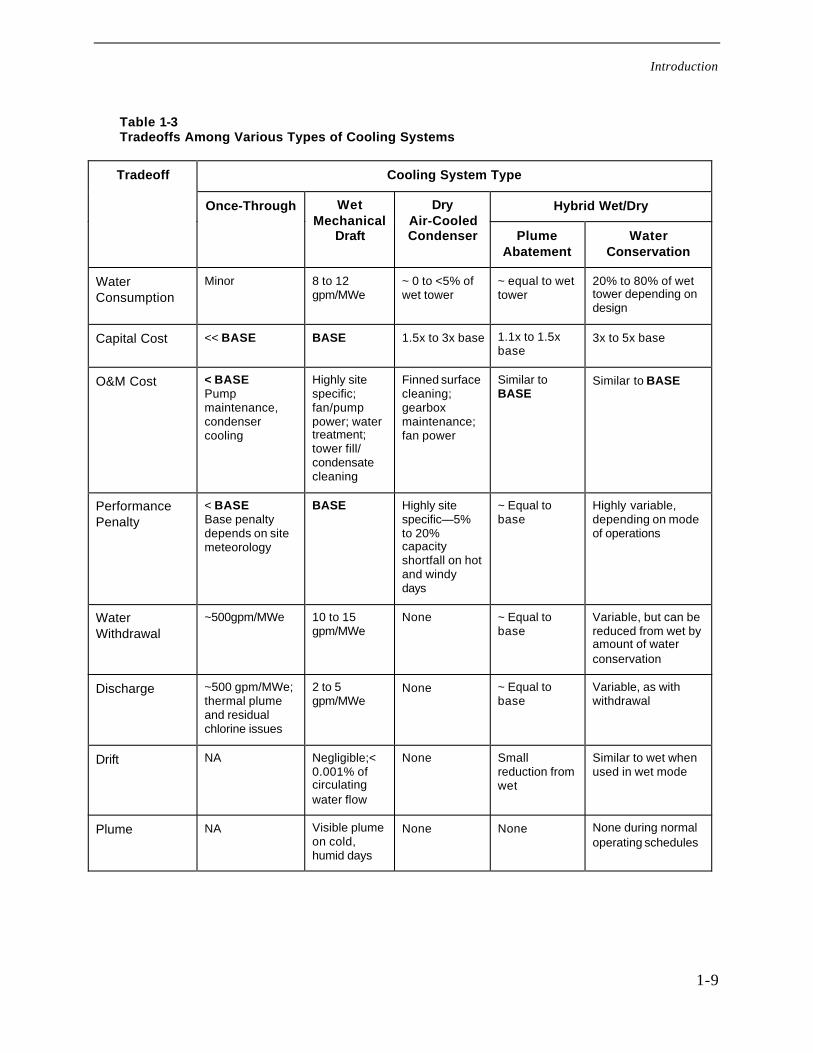
The emphasis of the remainder of this report is on an in-depth analysis of the comparative costsand the environmental impacts of alternative cooling systems. However, to provide somebackground and context for the discussion, qualitative comparisons between a “base” mechanicaldraft wet cooling system and other systems are given in Table 1-3. The bases for comparison arewater consumption; system costs, including capital, O&M, and performance penalty costs; andenvironmental issues, including water withdrawal and discharge, drift, and visible atmosphericplumes.
Scope of Project
The purpose of this study is to
• Define and compare the current costs and performance in California of dry and hybridwet/dry cooling towers relative to wet cooling towers;
• Identify the environmental benefits and tradeoffs between wet, dry, and hybrid wet/drycooling towers;

Introduction
1-8
• Identify future research that can improve the costs and performance of wet, dry, and hybridwet/dry cooling towers; and
• Identify any other alternative power plant cooling technologies that can improve theenvironmental and public health costs/risks of California’s electricity.
The project has two major elements:
1. Select representative regions in California for a detailed analysis of the cost, performance,and environmental tradeoffs among dry, hybrid, and wet cooling towers; and
2. Identify current research that can improve the relative costs and performance of the dry andhybrid cooling towers and evaluate the relative merits and gaps in this research forapplicability in California.
Introduction
1-9
Table 1-3Tradeoffs Among Various Types of Cooling Systems
Cooling System Type
Hybrid Wet/Dry
Tradeoff
Once-Through WetMechanical
Draft
DryAir-CooledCondenser Plume
AbatementWater
Conservation
WaterConsumption
Minor 8 to 12gpm/MWe
~ 0 to <5% ofwet tower
~ equal to wettower
20% to 80% of wettower depending ondesign
Capital Cost << BASE BASE 1.5x to 3x base 1.1x to 1.5xbase
3x to 5x base
O&M Cost < BASEPumpmaintenance,condensercooling
Highly sitespecific;fan/pumppower; watertreatment;tower fill/condensatecleaning
Finned surfacecleaning;gearboxmaintenance;fan power
Similar toBASE
Similar to BASE
PerformancePenalty
< BASEBase penaltydepends on sitemeteorology
BASE Highly sitespecific—5%to 20%capacityshortfall on hotand windydays
~ Equal tobase
Highly variable,depending on modeof operations
WaterWithdrawal
~500gpm/MWe 10 to 15gpm/MWe
None ~ Equal tobase
Variable, but can bereduced from wet byamount of waterconservation
Discharge ~500 gpm/MWe;thermal plumeand residualchlorine issues
2 to 5gpm/MWe
None ~ Equal tobase
Variable, as withwithdrawal
Drift NA Negligible;<0.001% ofcirculatingwater flow
None Smallreduction fromwet
Similar to wet whenused in wet mode
Plume NA Visible plumeon cold,humid days
None None None during normaloperating schedules
Introduction
1-10
The work was carried out in several tasks:
1. Define the state-of-the-art of alternative cooling system technologies for gas turbinecombined-cycle plants by
– conducting a literature search and preparing an annotated bibliography, and
– describing selected existing units and their operating and maintenance experience.
2. Compare the costs, performance, and environmental effects of wet and dry cooling systemsby
– selecting four case study sites representative of the range of operating conditions inCalifornia;
– conducting engineering analyses to determine the capital, operating, and maintenancecosts and system performance for each of the alternative cooling systems optimizedfor conditions at each site;
– providing bases of comparison, figures of merit, comparisons, and rankings for thealternative systems; and
– quantifying the environmental effects and describing the advantages anddisadvantages of each technology.
3. Identify and discuss current areas of research directed at improving the performance,reducing the installed and operating costs, and minimizing the environmental impacts ofpower plant cooling systems; and recommend areas worthy of expanded support for thebenefit of California citizens.
4. Identify potential alternative technologies and discuss the advantages and disadvantagescompared to current systems; review the development status or commercial status anddeployment experience; and describe potential barriers to their utilization and opportunitiesfor reducing or removing the barriers.
Organization of Report
The remaining sections of this report describe the methodology, results, and recommendations ofthe work conducted for the CEC and EPRI under the Tailored Collaboration project, “Wet, Dry,Hybrid Wet/Dry, and Alternative Cooling Technologies.”
Section 2 provides background information on cooling system alternatives for gas turbinecombined-cycle power plants. Section 3 defines the state of the art for wet, dry, and hybridcooling tower technologies on the basis of a survey of the literature, identification of existing andplanned installations of alternative cooling systems in the United States and abroad, anddiscussion of the operating experience of the owner/operators of four dry-cooled plants. Section4 reviews the selection of four case study sites representative of the range of cooling system
Introduction
1-11
operating conditions in California and presents the characteristics of each site. Section 5develops the cost comparison methodology, assembles the cost information, applies the approachto each of the four case studies, and provides an analysis/synthesis of the results that can be usedfor more generalized comparisons and for understanding the effect of selected site-specificconditions. Section 6 provides a brief comparison of the environmental effects of the differentsystems.
The next two sections look to the future: Section 7 reviews current research and developmentactivities with promise for addressing some of the problems associated with water-conservingcooling systems, and Section 8 identifies and describes emerging technologies that may becomepreferred alternatives to current technology. Section 9 summarizes the conclusions andrecommendations resulting from the study. Several appendices contain much of the rawinformation obtained in the course of the study.
References
1. California Department of Finance (CaDOF, 1998). California population statistics, URL:http://www. dof.ca.gov/html/Demograp/Proj_race.htm.
2. California Department of Finance (CaDOF, 1999). California population statistics, URL:http://www. dof.ca.gov/html/Demograp/1900-90.htm.
3. California Department of Water Resources, (CaDWR, 1998), California Water Plan Update,Bulletin 160-98, Nov. 1998.
4. California Energy Commission (CEC, 2001) Power Plant Licensing Cases, URL:http://www.energy.ca.gov/sitingcases/backgrounder.html
5. California Energy Commission (CEC, 2001a), Environmental Performance Report ofCalifornia’s Electric Generation Facilities, P700-01-001, July, 2001
6. (EPRI, 2000), Maulbetsch, J. S. CEC/EPRI Workshop: Environmental Impacts of NewGeneration in California; San Diego, CA. Palo Alto, CA
7. (EPRI, 1989) Mitchell, R. D. Survey of Water-Conserving Heat Rejection Systems, EPRIGS-6252, EPRI, Palo Alto, CA, 1989 Mar.
8. SWRCB, 1975. Resolution No. 75-58: Water Quality Control Policy on the Use and Disposalof Inland Waters Used for Power Plant Cooling. California State Water Resources ControlBoard, 1975 Jul.
9. SWRCB, 1996 . California Water Use Statistics URL: http://www.swrcb.ca.gov, 1996.
10. U. S. Department of Commerce, (USDOC, 2000). California Gross State Product, 1963 to1998,. URL: http://www.bea.doc.gov /bea/regional/gsp/action.cfm, 2000 Sept. 5.

Introduction
1-12
2-1
2 POWER PLANT COOLING SYSTEMS
The following section provides general background information on the typical power plant beingproposed for construction in California at the present time and on the cooling system alternativesto be considered.
Combined-Cycle Plants
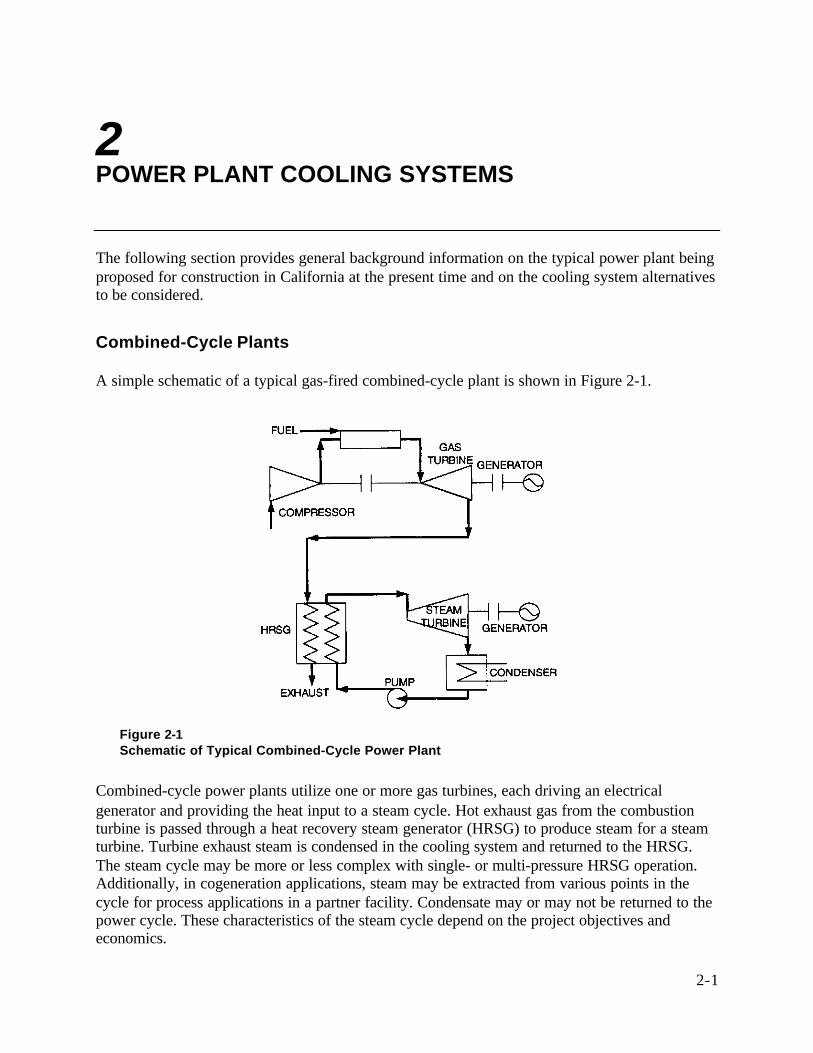
A simple schematic of a typical gas-fired combined-cycle plant is shown in Figure 2-1.
Figure 2-1Schematic of Typical Combined-Cycle Power Plant
Combined-cycle power plants utilize one or more gas turbines, each driving an electricalgenerator and providing the heat input to a steam cycle. Hot exhaust gas from the combustionturbine is passed through a heat recovery steam generator (HRSG) to produce steam for a steamturbine. Turbine exhaust steam is condensed in the cooling system and returned to the HRSG.The steam cycle may be more or less complex with single- or multi-pressure HRSG operation.Additionally, in cogeneration applications, steam may be extracted from various points in thecycle for process applications in a partner facility. Condensate may or may not be returned to thepower cycle. These characteristics of the steam cycle depend on the project objectives andeconomics.
Power Plant Cooling Systems
2-2
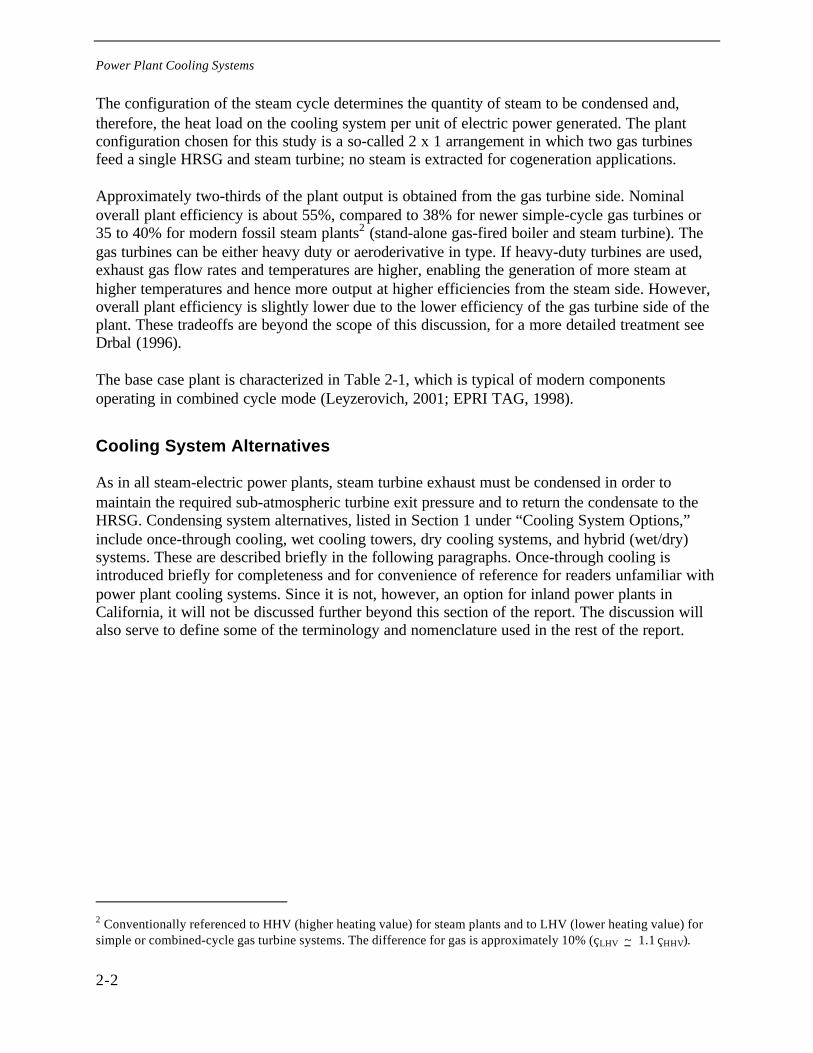
The configuration of the steam cycle determines the quantity of steam to be condensed and,therefore, the heat load on the cooling system per unit of electric power generated. The plantconfiguration chosen for this study is a so-called 2 x 1 arrangement in which two gas turbinesfeed a single HRSG and steam turbine; no steam is extracted for cogeneration applications.
Approximately two-thirds of the plant output is obtained from the gas turbine side. Nominaloverall plant efficiency is about 55%, compared to 38% for newer simple-cycle gas turbines or35 to 40% for modern fossil steam plants2 (stand-alone gas-fired boiler and steam turbine). Thegas turbines can be either heavy duty or aeroderivative in type. If heavy-duty turbines are used,exhaust gas flow rates and temperatures are higher, enabling the generation of more steam athigher temperatures and hence more output at higher efficiencies from the steam side. However,overall plant efficiency is slightly lower due to the lower efficiency of the gas turbine side of theplant. These tradeoffs are beyond the scope of this discussion, for a more detailed treatment seeDrbal (1996).
The base case plant is characterized in Table 2-1, which is typical of modern componentsoperating in combined cycle mode (Leyzerovich, 2001; EPRI TAG, 1998).
Cooling System Alternatives
As in all steam-electric power plants, steam turbine exhaust must be condensed in order tomaintain the required sub-atmospheric turbine exit pressure and to return the condensate to theHRSG. Condensing system alternatives, listed in Section 1 under “Cooling System Options,”include once-through cooling, wet cooling towers, dry cooling systems, and hybrid (wet/dry)systems. These are described briefly in the following paragraphs. Once-through cooling isintroduced briefly for completeness and for convenience of reference for readers unfamiliar withpower plant cooling systems. Since it is not, however, an option for inland power plants inCalifornia, it will not be discussed further beyond this section of the report. The discussion willalso serve to define some of the terminology and nomenclature used in the rest of the report.
2 Conventionally referenced to HHV (higher heating value) for steam plants and to LHV (lower heating value) forsimple or combined-cycle gas turbine systems. The difference for gas is approximately 10% (çLHV ~ 1.1 çHHV).
Power Plant Cooling Systems
2-3
Table 2-1Steam Cycle Cooling System Conditions
Quantity Value
Nominal plant capacity 500 MWe
Configuration 2 x 1
Gas turbine output 165 MW each; (330 MW total)
Steam turbine output 170 MWe
Steam turbine exhaust flow 1,000,000 pounds per hour @ 5% moisture
Turbine back pressure 2.5 in Hga; (Tcond = 108.7 ºF)
Cooling system heat load 980 million Btu per hour
Performance Characteristics
Plant heat input 3.1 x 10⁹ Btu per hour
Overall plant efficiency, LHV 55%
Steam turbine heat rate 9,200 Btu/kwh @ 2.5 in Hga
Steam turbine efficiency, LHV 37%
Gas turbine efficiency, LHV 36%
Once-Through Cooling
In this simplest case, cooling water is drawn from a local source (i.e., ocean, lake, river, orother), passed through the condenser tubes, and returned to the environment at a highertemperature. Steam is condensed in a shell-and-tube surface condenser. The system is shownschematically in Figure 2-2.
For the base plant defined in Table 2-1, the cooling system load is met with circulating waterflows of 500 to 750 gpm/MWe (30,000 to 45,000 gal/MWh) and a water temperature rise ofabout 15 to 25ºF.
Advantages are
• Highest efficiency,
• Lowest installation and operating costs, and
• Low water consumption.
Power Plant Cooling Systems
2-4
Disadvantages are
• Highest withdrawal rates,
• Entrainment/impingement, and
• Thermal discharge plume.
River
Condenser
Cooling Water InletTcold
Steam
Cooling Water DischargeThot
Thot - Tcold = Range = 20ºF (typ.)
Figure 2-2Power Plant Cooling System Arrangements: Once-Through Cooling
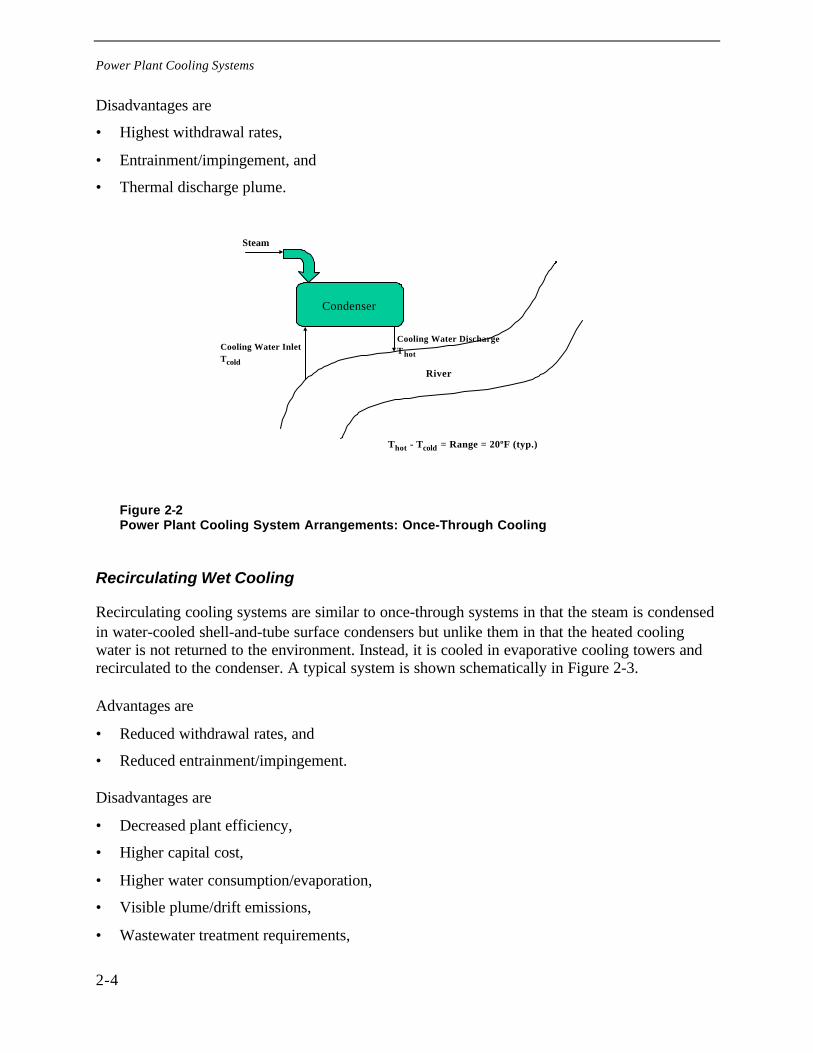
Recirculating Wet Cooling
Recirculating cooling systems are similar to once-through systems in that the steam is condensedin water-cooled shell-and-tube surface condensers but unlike them in that the heated coolingwater is not returned to the environment. Instead, it is cooled in evaporative cooling towers andrecirculated to the condenser. A typical system is shown schematically in Figure 2-3.
Advantages are
• Reduced withdrawal rates, and
• Reduced entrainment/impingement.
Disadvantages are
• Decreased plant efficiency,
• Higher capital cost,
• Higher water consumption/evaporation,
• Visible plume/drift emissions,
• Wastewater treatment requirements,
Power Plant Cooling Systems
2-5
• Chemical treatment programs,
• Emissions of controlled air pollutants or pathogens, and
• Site space.
Figure 2-3Recirculating Wet Cooling Tower
The cooling is achieved by the evaporation of a small fraction (1 to 2%) of the recirculatingwater flow. Therefore, once the system is filled, the only water withdrawn from the environmentis makeup water in amounts sufficient to replace that lost to evaporation, blowdown, 3 and drift.4
These quantities are discussed in more detail in Section 6, Environmental Effects. Therefore,withdrawal rates from the environment are much less than for once-through systems—typically10 to 15 gpm/MWe (600 to 900 gal/MWh).
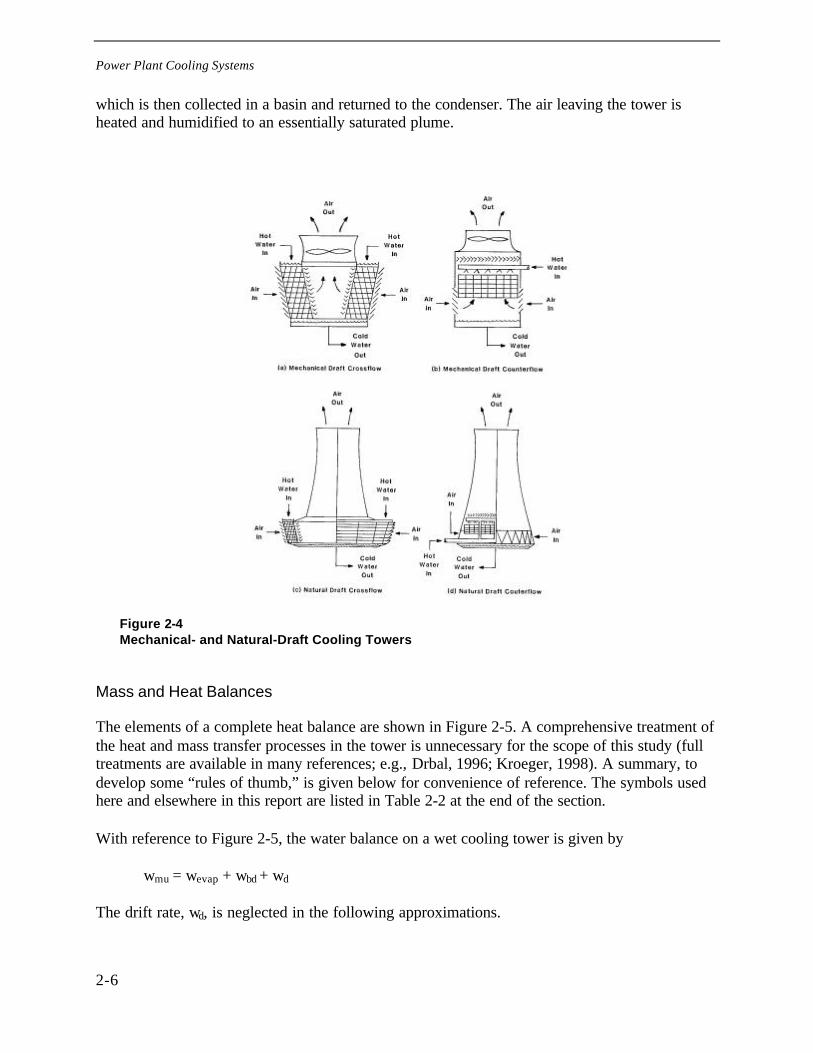
There are two common types of wet cooling tower—mechanical draft and natural draft (Figure2-4). Natural draft towers, in which the airflow through the tower is induced by densitydifferences in a “chimney effect,” are less likely to be considered in many areas of California onthe basis of aesthetic and seismic concerns. The higher capital costs in comparison to mechanicaldraft towers are also less favorable for the smaller steam condensation loads (less than 250 MWeon steam) associated with combined-cycle plants. Therefore, they will not be considered furtherin this study.
Mechanical draft towers are built in both cross-flow and counter-flow designs. Hot water fromthe condenser is introduced at the top of the tower and flows down through a “fill” section whereit is brought into intimate contact with ambient air flowing across, or counter to, the direction ofthe falling water flow. Both sensible and latent heat transfer to the air cools the bulk of the water,
3 Blowdown is water discharged from the cooling system in order to control the buildup of dissolved and suspendedmaterials that concentrate in the system as a result of the evaporation cycles.
4 Drift refers to liquid water droplets entrained in the tower exit plume and released to the atmosphere.
Power Plant Cooling Systems
2-6
which is then collected in a basin and returned to the condenser. The air leaving the tower isheated and humidified to an essentially saturated plume.
Figure 2-4Mechanical- and Natural-Draft Cooling Towers
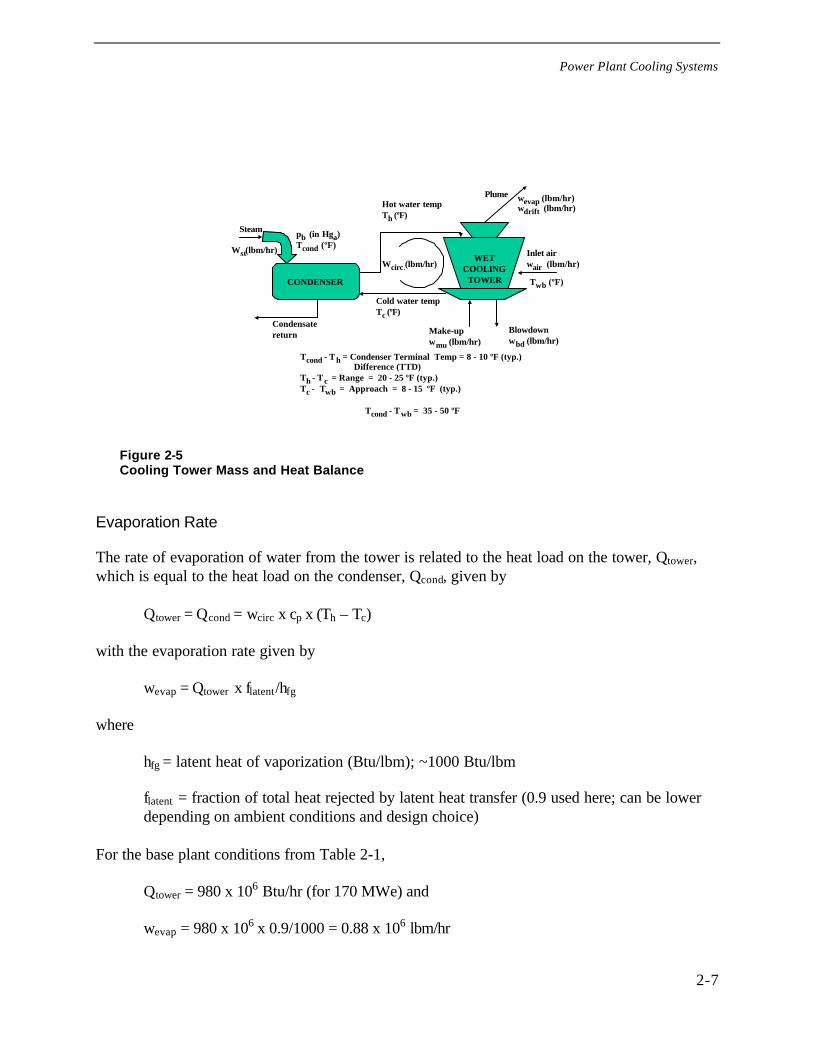
Mass and Heat Balances
The elements of a complete heat balance are shown in Figure 2-5. A comprehensive treatment ofthe heat and mass transfer processes in the tower is unnecessary for the scope of this study (fulltreatments are available in many references; e.g., Drbal, 1996; Kroeger, 1998). A summary, todevelop some “rules of thumb,” is given below for convenience of reference. The symbols usedhere and elsewhere in this report are listed in Table 2-2 at the end of the section.
With reference to Figure 2-5, the water balance on a wet cooling tower is given by
wmu = wevap + wbd + wd
The drift rate, wd, is neglected in the following approximations.
Power Plant Cooling Systems
2-7
CONDENSER
WETCOOLING
TOWER
Wcirc .(lbm/hr)
Condensatereturn
Steam
Wst(lbm/hr)
Hot water tempTh (ºF)
Cold water tempTc (ºF)
Make-upwmu (lbm/hr)
Blowdownwbd (lbm/hr)
Inlet airwair (lbm/hr)
Twb (ºF)
Plume wevap (lbm/hr)wdrift (lbm/hr)
Tcond - Th = Condenser Terminal Temp = 8 - 10 ºF (typ.) Difference (TTD)
Th - Tc = Range = 20 - 25 ºF (typ.)Tc - Twb = Approach = 8 - 15 ºF (typ.)
Tcond - Twb = 35 - 50 ºF
pb (in Hga)Tcond (ºF)
Figure 2-5Cooling Tower Mass and Heat Balance
Evaporation Rate
The rate of evaporation of water from the tower is related to the heat load on the tower, Qtower,which is equal to the heat load on the condenser, Qcond, given by
Qtower = Qcond = wcirc x cp x (Th – Tc)
with the evaporation rate given by
wevap = Qtower x flatent/hfg
where
hfg = latent heat of vaporization (Btu/lbm); ~1000 Btu/lbm
flatent = fraction of total heat rejected by latent heat transfer (0.9 used here; can be lowerdepending on ambient conditions and design choice)
For the base plant conditions from Table 2-1,
Qtower = 980 x 106 Btu/hr (for 170 MWe) and
wevap = 980 x 106 x 0.9/1000 = 0.88 x 10⁶ lbm/hr
Power Plant Cooling Systems
2-8
On a “per unit output basis,”
wevap = 5.2 lb/kWh or ~ 10 gpm/MW
Blowdown Rate
Blowdown rates are set to control scaling, fouling, and corrosion by limiting the buildup ofimpurities in the circulating water. This criterion is normally expressed in terms of maximumallowable cycles of concentration (n), defined as the ratio of the concentration of conservedspecies in the circulating water (Ci circ) to that in the makeup water (Ci mu):
n = Ci circ/Ci mu
The mass balance of species i in the tower requires that
wmu × Ci mu = wbd × Ci circ
wbd = (wevap + wbd) × (Ci mu/Ci circ) = (wevap + wbd) x 1/n
Therefore,
wbd = wevap / (n – 1)
Typical allowable cycles of concentration are from 3 to 6 (DiFilippo, 2001). For n = 6 as atypical value, the required blowdown is
wbd = [1/(6 – 1)] × wevap
= 2 gpm/MWe
and the required make-up is
wmu = wevap + wbd = 12 gpm/MWe
Additionally, typical consistent values of tower operating conditions are
Circulating water flow rate, wcirc: ~ 500 gpm/MWeCondenser terminal temperature difference (TTD), Tcond – Th: 7 to 10ºFTower range, Th – Tc: 20 to 24ºFTower approach, Tc - Tamb. wet bulb: 8 to 15ºF
Therefore, the achievable steam condensing temperature is given by
Tcond = Tamb. wet bulb + Approach + Range + TTD
Power Plant Cooling Systems
2-9
For an ambient wet bulb temperature of 70ºF, values in the typical ranges of TTD = 8ºF, Range =20 ºF, and Approach = 11 ºF would provide a condensing temperature of 109ºF corresponding toa turbine back pressure of 2.5 in. Hga. Tower approach temperature depends on design ambientconditions as well as many other factors including tower type, size, fill choice, and air flow. Ingeneral, warmer, more humid conditions lead to lower approach temperatures in the southeasternU.S. and cooler, drier climates lead to higher ones in the northern and western regions.
Dry Cooling
Dry cooling systems may be categorized as direct or indirect. In direct systems, turbine exhauststeam is delivered directly to an air-cooled condenser (ACC), as shown in Figure 2-6. Heatrejection to the environment takes place in a single step, where steam is condensed inside finnedtubes, which are typically arranged in an A-frame configuration, and is then cooled by air blownacross the finned surfaces. As for wet cooling systems, the dry cooling tower can be eithermechanical or natural draft in type. For reasons similar to those discussed for wet systems, thisreport will restrict attention to mechanical draft units.
Advantages are
• Least water consumption, and
• No entrainment/impingement losses.
Disadvantages are
• Highest installation and operating costs,
• Highest efficiency penalty,
• Increased air emissions/MCU,
• Load limitations on hottest days,
• Site space, and
• Possibility of increased unit trips.
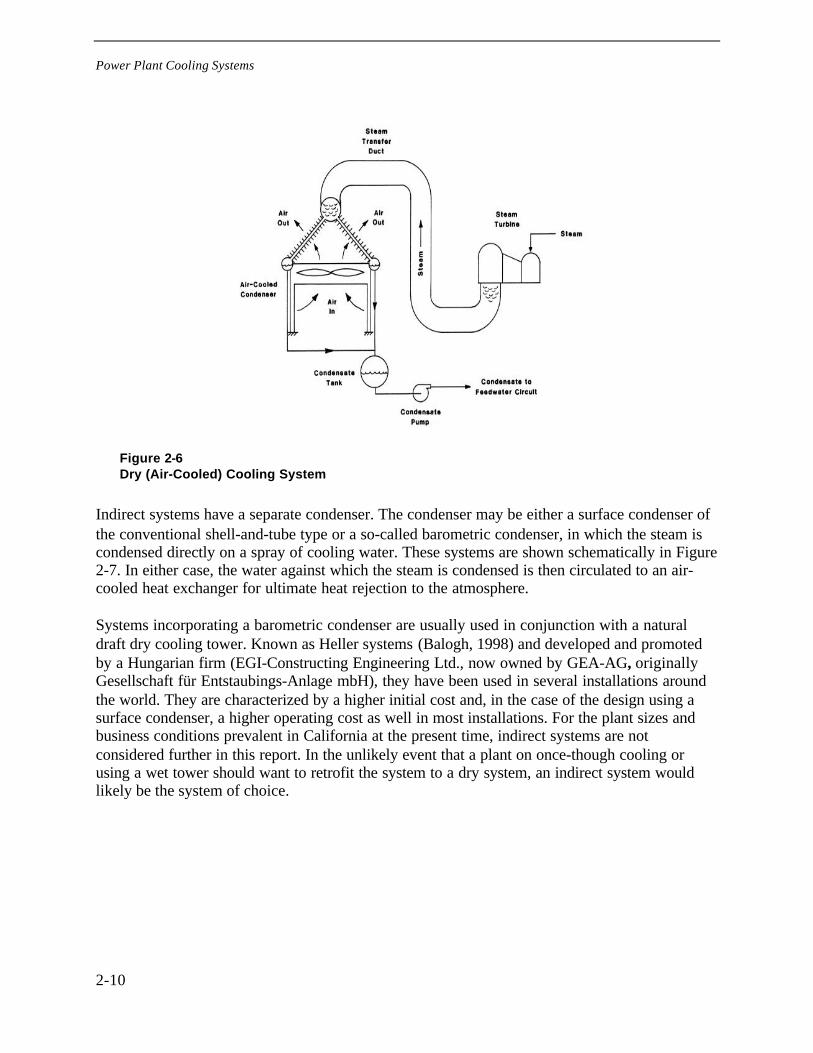
Power Plant Cooling Systems
2-10
Figure 2-6Dry (Air-Cooled) Cooling System
Indirect systems have a separate condenser. The condenser may be either a surface condenser ofthe conventional shell-and-tube type or a so-called barometric condenser, in which the steam iscondensed directly on a spray of cooling water. These systems are shown schematically in Figure2-7. In either case, the water against which the steam is condensed is then circulated to an air-cooled heat exchanger for ultimate heat rejection to the atmosphere.
Systems incorporating a barometric condenser are usually used in conjunction with a naturaldraft dry cooling tower. Known as Heller systems (Balogh, 1998) and developed and promotedby a Hungarian firm (EGI-Constructing Engineering Ltd., now owned by GEA-AG, originallyGesellschaft für Entstaubings-Anlage mbH), they have been used in several installations aroundthe world. They are characterized by a higher initial cost and, in the case of the design using asurface condenser, a higher operating cost as well in most installations. For the plant sizes andbusiness conditions prevalent in California at the present time, indirect systems are notconsidered further in this report. In the unlikely event that a plant on once-though cooling orusing a wet tower should want to retrofit the system to a dry system, an indirect system wouldlikely be the system of choice.
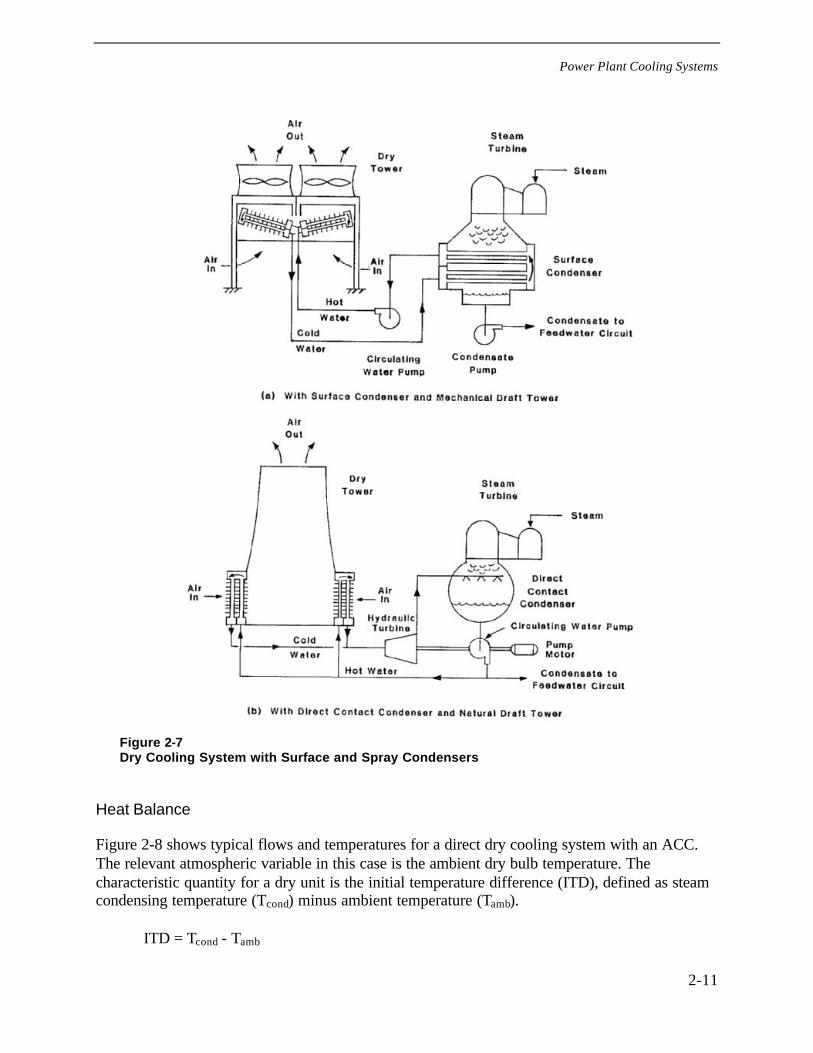
Power Plant Cooling Systems
2-11
Figure 2-7Dry Cooling System with Surface and Spray Condensers
Heat Balance
Figure 2-8 shows typical flows and temperatures for a direct dry cooling system with an ACC.The relevant atmospheric variable in this case is the ambient dry bulb temperature. Thecharacteristic quantity for a dry unit is the initial temperature difference (ITD), defined as steamcondensing temperature (Tcond) minus ambient temperature (Tamb).
ITD = Tcond - Tamb
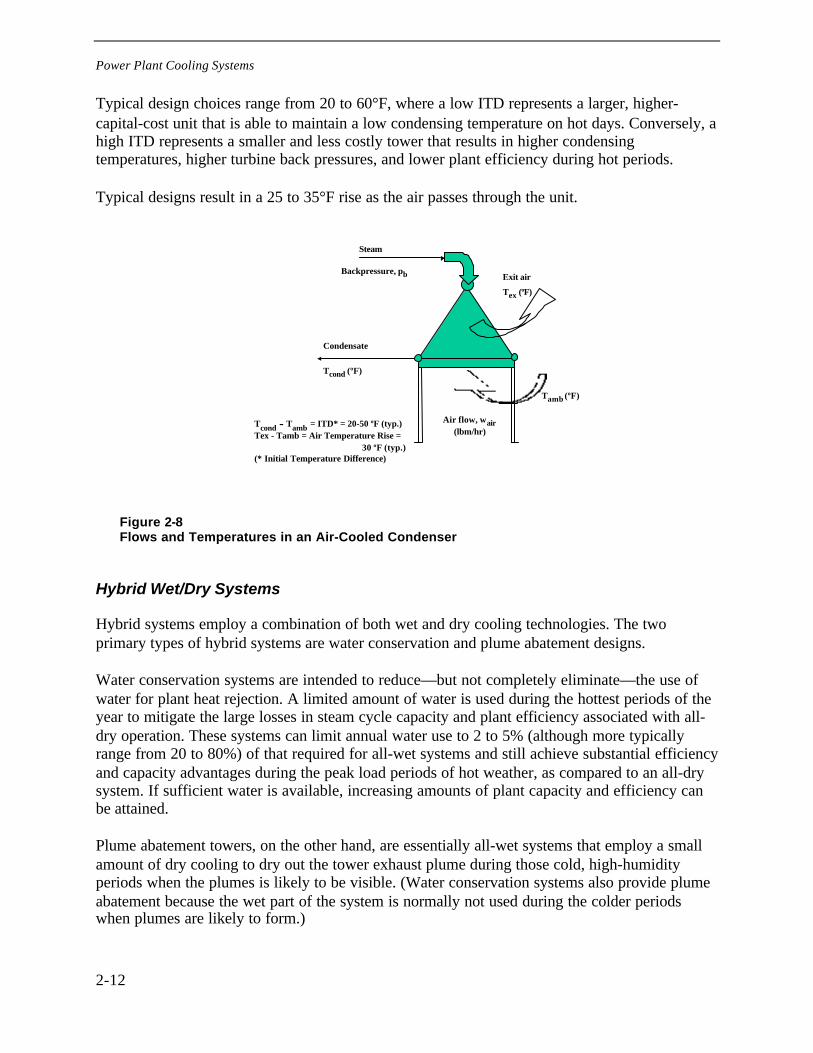
Power Plant Cooling Systems
2-12
Typical design choices range from 20 to 60°F, where a low ITD represents a larger, higher-capital-cost unit that is able to maintain a low condensing temperature on hot days. Conversely, ahigh ITD represents a smaller and less costly tower that results in higher condensingtemperatures, higher turbine back pressures, and lower plant efficiency during hot periods.
Typical designs result in a 25 to 35°F rise as the air passes through the unit.
Air flow, wair(lbm/hr)
Tamb (ºF)
Steam
Backpressure, pb
Condensate
Tcond (ºF)
Exit air
Tex (ºF)
Tcond - Tamb = ITD* = 20-50 ºF (typ.)Tex - Tamb = Air Temperature Rise =
30 ºF (typ.)(* Initial Temperature Difference)
Figure 2-8Flows and Temperatures in an Air-Cooled Condenser
Hybrid Wet/Dry Systems
Hybrid systems employ a combination of both wet and dry cooling technologies. The twoprimary types of hybrid systems are water conservation and plume abatement designs.
Water conservation systems are intended to reduce—but not completely eliminate—the use ofwater for plant heat rejection. A limited amount of water is used during the hottest periods of theyear to mitigate the large losses in steam cycle capacity and plant efficiency associated with all-dry operation. These systems can limit annual water use to 2 to 5% (although more typicallyrange from 20 to 80%) of that required for all-wet systems and still achieve substantial efficiencyand capacity advantages during the peak load periods of hot weather, as compared to an all-drysystem. If sufficient water is available, increasing amounts of plant capacity and efficiency canbe attained.
Plume abatement towers, on the other hand, are essentially all-wet systems that employ a smallamount of dry cooling to dry out the tower exhaust plume during those cold, high-humidityperiods when the plumes is likely to be visible. (Water conservation systems also provide plumeabatement because the wet part of the system is normally not used during the colder periodswhen plumes are likely to form.)
Power Plant Cooling Systems
2-13
Finally, low-capital-cost hybrid approaches have been considered for use during peak loadperiods of hot weather to provide short-term enhancement of ACC performance, steam cyclecapacity, and plant efficiency. Alternatives include using water to cool the ACC inlet air ordeluging the air-cooled surface with water for short periods. Detailed consideration of theseapproaches is beyond the scope of this report.
Numerous design arrangements exist for hybrid systems. These are discussed in detail inMitchell (1989)and Lindahl (1992). In brief, possible tower options include the following:
• Single-structure combined tower or separate wet and dry towers
• Series or parallel airflow paths through the wet and dry systems
• Series or parallel connected cooling water circuits
In addition, a number of arrangements are possible for the steam condenser:
• Common condenser
• Divided water box separating the cooling water flows from the wet and dry towers
• Separate condensers
As noted previously, the dry part of the system can use an air-cooled condenser, a direct contact(barometric) condenser, or a conventional shell-and-tube surface condenser.
Schematics of many of these arrangements are shown in Figures 2-9 through 2-12. Thesesystems differ in capital cost and operating flexibility but have similar thermodynamiccharacteristics. For the purpose of this report, hybrid systems are addressed in a discussion of anevaporative condenser design with the capability for both wet and dry operation.
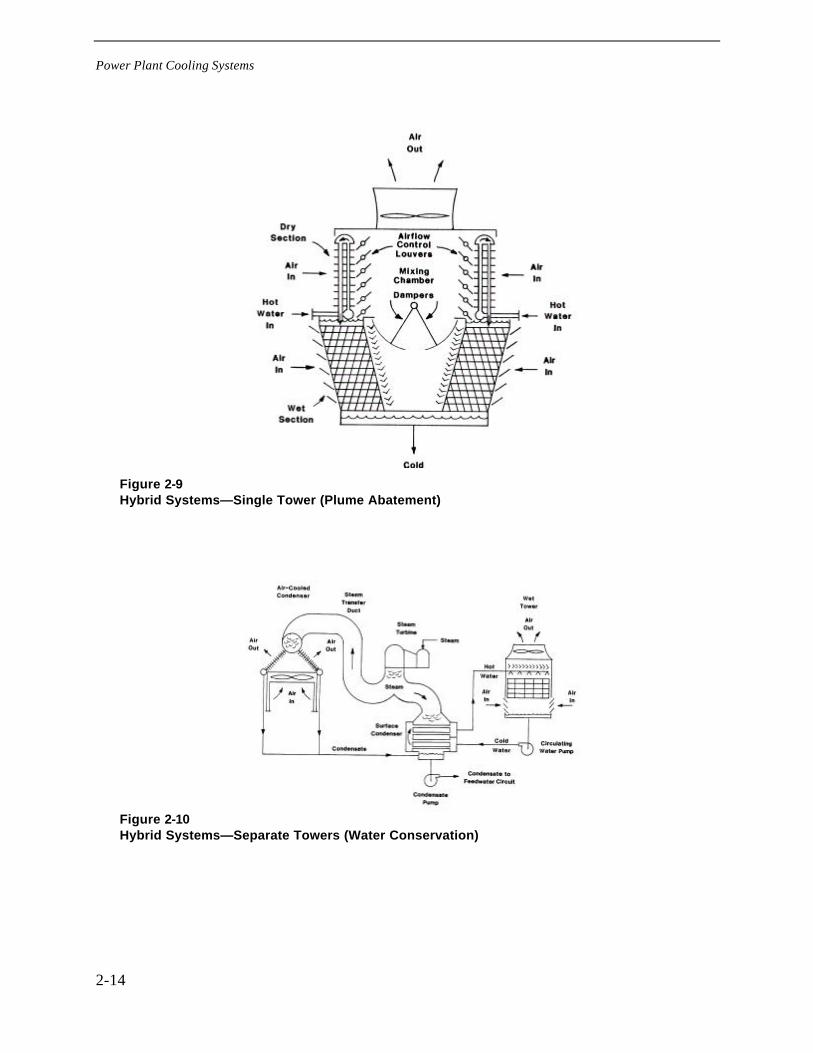
Power Plant Cooling Systems
2-14
Figure 2-9Hybrid Systems—Single Tower (Plume Abatement)
Figure 2-10Hybrid Systems—Separate Towers (Water Conservation)
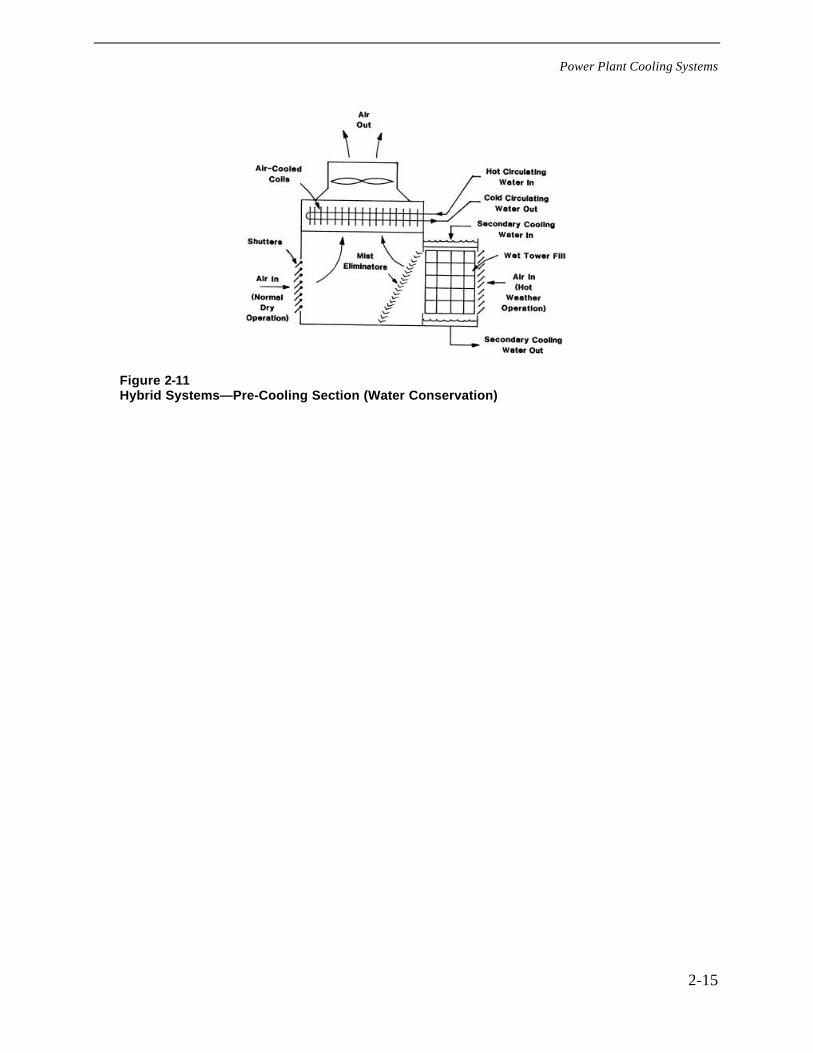
Power Plant Cooling Systems
2-15
Figure 2-11Hybrid Systems—Pre-Cooling Section (Water Conservation)
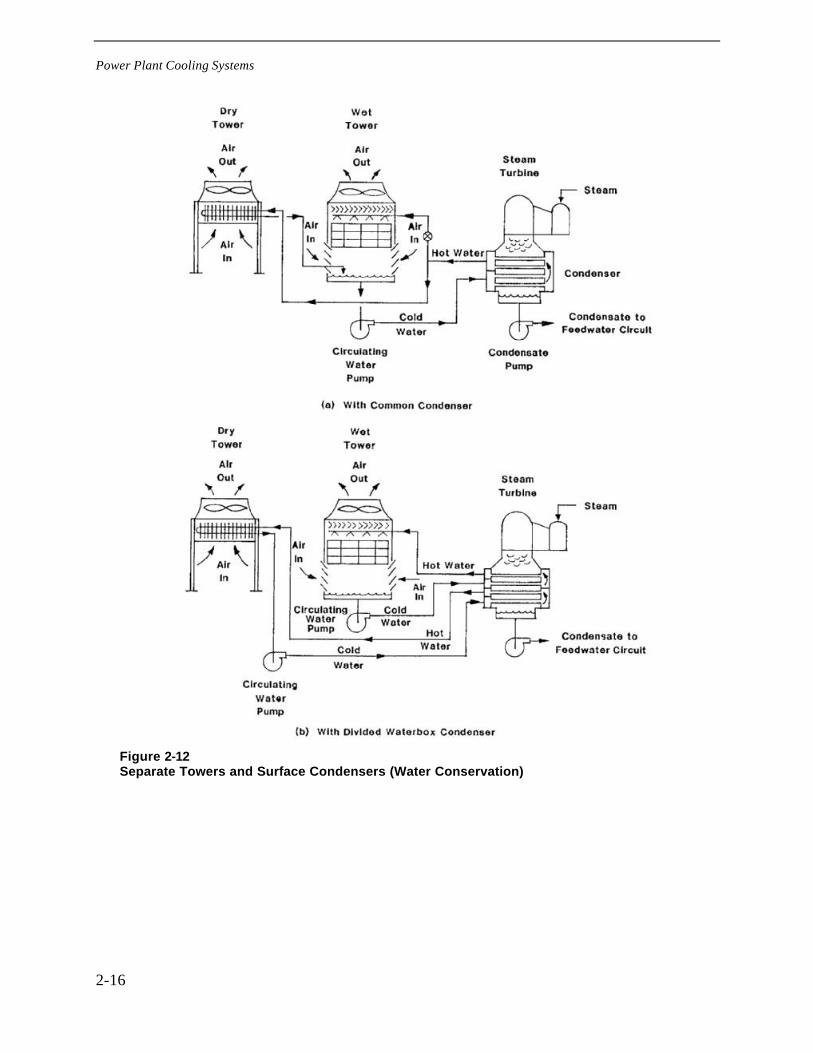
Power Plant Cooling Systems
2-16
Figure 2-12Separate Towers and Surface Condensers (Water Conservation)
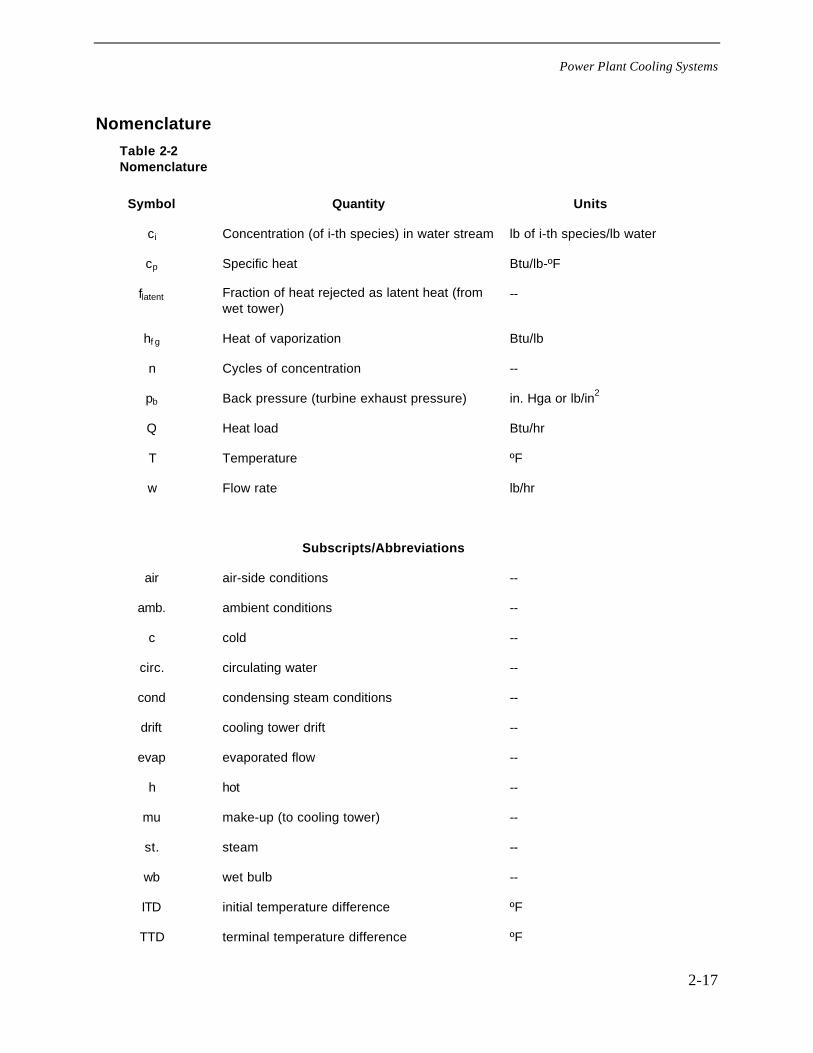
Power Plant Cooling Systems
2-17
Nomenclature
Table 2-2Nomenclature
Symbol Quantity Units
ci Concentration (of i-th species) in water stream lb of i-th species/lb water
cp Specific heat Btu/lb-ºF
flatent Fraction of heat rejected as latent heat (fromwet tower)
--
hf g Heat of vaporization Btu/lb
n Cycles of concentration --
pb Back pressure (turbine exhaust pressure) in. Hga or lb/in2
Q Heat load Btu/hr
T Temperature ºF
w Flow rate lb/hr
Subscripts/Abbreviations
air air-side conditions --
amb. ambient conditions --
c cold --
circ. circulating water --
cond condensing steam conditions --
drift cooling tower drift --
evap evaporated flow --
h hot --
mu make-up (to cooling tower) --
st. steam --
wb wet bulb --
ITD initial temperature difference ºF
TTD terminal temperature difference ºF
Power Plant Cooling Systems
2-18
References
1. Balogh, Andras and Z. Takacs. Developing Indirect Dry Cooling Systems for Modern PowerPlants [Web Page]. 1998. Available at:http://www.nemesis.at/publication/gpi_98_2/articles/33.html.
2. DiFilippo, Michael N. Identification and Use of Degraded Water Sources for Power PlantCooling Water in California. 2001 Mar.
3. Drbal, L. F. et al. Handbook of Power Plant Engineering. Black & VeatchNew York, NY :Chapman & Hall; 1996.
4. Kroeger, D. G. Air-cooled Heat Exchangers and Cooling Towers. Begell House; 1998.
5. Lindahl, Paul and R. W. Jameson. Plume Abatement and Water Conservation with theWet/Dry Cooling Tower. CTI Journal. 1992; 14(2).
6. Mitchell, R. D. Survey of Water-Conserving Heat Rejection Systems. Palo Alto, CA: EPRI;1989 Mar; EPRI GS-6252.
3-1
3 COOLING TECHNOLOGIES: THE STATE OF THE ART
This section presents information that serves to define the state of the art for dry, hybrid wet-dry,and wet cooling tower technologies. The material consists of three parts: first, a survey of theliterature in the form of an annotated bibliography (Appendix A) supplemented in this sectionwith some categorization and brief summaries of the important citations in each category;second, a listing of existing and planned installations around the world (Appendix B),supplemented here with some brief observations on trends in the adoption of water-conservingcooling systems; and third, information gathered during interviews with owner/operators of someexisting plants with dry cooling or hybrid wet/dry systems (Appendix C), supplemented herewith a brief discussion regarding the ability to generalize the experience in the use of thesesystems from these cases.
Literature Survey
Appendix A lists over 125 references on the subject of dry, wet/dry, and wet cooling towertechnologies. The citations are drawn from books, journals, the trade press, conference andworkshop reports and academic theses. The bulk of the material falls into four categories:technical background and description, design and optimization methodology, cost analysis, andoperating experience. Most of the references contain information from more than one of thesecategories.
Many of the citations in this survey are old by technical literature standards. Over half werepublished before 1990 and one-third before 1980. This is particularly true for wet cooling towers,which have been standard fixtures at thermal power plants for over half a century. Much of thematerial, even when published 30 or more years ago, is still relevant and accurate. Some classicalreferences are highlighted for their enduring usefulness. Special attention is given to publicationsof the past 5 years that update subjects undergoing recent changes or reflect changing economic,regulatory, and business conditions in the power industry and its supplier community.
A brief summary of the highlights from the survey follows for the major types of coolingsystems. A few broad subjects of primary importance are identified for each type, as are majorsources of information.
Wet Cooling
The thermodynamics, fluid mechanics, and many of the mechanical design aspects of wetcooling towers have been well established and thoroughly documented in the literature for a longtime. Much of this literature was organized and reviewed by in the Handbook of Heat Transfer

Cooling Technologies: the State of the Art
3-2
Applications (Maulbetsch and Bartz, 1985). General references that summarize thecomputational and design procedures for wet towers include Cooper (2000), Hamilton (2000),and older work by DesJardins (1992), LeFevre (1977), and Feltzin (1991). Data compilations forvarious fill types and tower configurations are available from the Cooling Technology Institute(CTI 1999c), papers by Fulkerson (1999), and other references such as Kelly’s Handbook (Kelly1976) and from vendors. A good introduction to the practical aspects of tower configurations, theadvantages and disadvantages of particular designs, and operation and maintenance issues waspresented in 1973 in POWER (Special Report: “Cooling Towers” 1973), which is still valuableas an introduction to the subject.
Other topics of major interest are performance testing of towers; tower maintenance withparticular emphasis on film fill performance and its deterioration due to fouling and plugging;structural problems including some catastrophic failures; and retrofit to improve or restoreperformance. The main sources of current and archival information on these topics are theJournal of the Cooling Technology Institute, the CTI’s Bibliography of Technical Publications(CTI 1999a) and their website (CTI, 1999b), and a series of EPRI-sponsored workshops(Proceedings: International Cooling-Tower and Spray Pond Symposium, 1990; Proceedings ofthe 9th IAHR Cooling Tower and Spraying Pond Symposium, 1994; Proceedings: Cooling TowerAnd Advanced Cooling Systems Conference, 1995; Tsou, 1997). The EPRI Proceedings, whilepart of the gray literature, can be found on www.epri.com and may still be readily available.
Some more recent material provides descriptive information on the most modern designs,available most easily from vendor sources (e.g., Balogh, 1998; Streng, 2000) and online at themajor vendors’ websites (BDT Engineering; Hamon Cooling Systems; Marley Cooling Tower);on high-performance fill designs (Aull, 2000; Hobson, 1995); and on changing practices incooling tower water treatment (Richardson, 2000; Howarth, 2000; Gill, 1997; DiFilippo, 2001).
Environmental issues of particular current interest are plume visibility, drift control (Missimer,1998; Suptic, 1999), and emissions of controlled air pollutants or pathogens such as Legionella(Adams, 1978; DiFilippo, 2001).
Dry Cooling
The best summary of the field is a comprehensive text by D. G. Kroeger (1998). Over 600 pageslong and containing over 900 references, it is a fully up-to-date reference work on the fieldcontaining all important citations as of 1997.
Dry cooling first emerged as a subject of technological interest in the early 1970s with theconstruction of the first dry cooling towers in the U.S. and Europe. Literature at the timeconsisted of descriptions of these early units (see sections below and Table 3-1) —somewhat asengineering curiosities—plus a body of work on economic comparisons of dry units with wettowers or once-through cooling with the emphasis on developing a methodology for makingappropriate comparisons. Much of this work was sponsored by the U.S. Department of Energy(USDOE), the Atomic Energy Commission (AEC), the Environmental Protection Agency(USEPA) and EPRI. It is documented primarily in the gray report literature (Mitchell, 1989).
Cooling Technologies: the State of the Art
3-3
Interesting work on the development of an indirect system that uses a direct contact barometriccondenser (the so-called Heller system; see Figure 2-7 and accompanying text) was carried out inHungary, widely reported, and implemented at a number of installations in the former USSR andthe Middle East (Balogh, 1998). Major advances resulted from the adoption of dry cooling on avery large scale in South Africa at locations of rich energy resources and virtually no water.Again, trade press articles provided descriptions of these units (Goldschagg, 1999; Von Cleve,1984; Van der Walt et al., 1974; Trage, 1990), but there was little new research literature untilthe 1990s. Then, there was renewed interest in the technology in the U.S. and elsewhere,stimulated by concern over water consumption and plumes from wet cooling towers. At thistime, a number of papers appeared, detailing optimization schemes for selecting the best finnedtube geometries (Bonger, 1995; Buys, 1989b; Buys, 1989a; Ecker, 1978) and revisiting thequestion of how to best compensate for reduced performance during the hottest periods(Conradie, 1991a; Oosthuizen 1995).
There is little usable, quantitative cost information in the open literature. A few referencescontain qualitative comparisons and “typical” costs but give little or no insight into the basis ofthe costs, the breakdown among the many system components, or the sensitivity of the costs toimportant design and environmental factors. Some information is available in the gray literaturesuch as submissions for siting approvals (Ledford, 1999; Miller, 2000) or embedded in variousengineering/economic design packages such as EPRI’s GATE program (EPRI, 2000) orThermoflow (Thermoflow, 1999).
Little material has been published by the CTI over the past several decades. (Their bibliographycontains only three references on dry systems since 1969.) Their recent change of name from theCooling Tower Institute to the Cooling Technology Institute reflects, in part, an awareness of theimportance of dry and hybrid systems. The 2001 Annual CTI Meeting at Corpus Christi, TX,included a one-half day educational session on comparing wet and dry cooling and, predictably,more papers will be forthcoming on the topic in the future. Finally, some general descriptivesystem information is available from vendor websites (Marley Cooling Tower; BDTEngineering; Hamon Cooling Systems; Niagara Blower Company).
Hybrid Wet/Dry Cooling
As was the case for dry cooling, the subject of hybrid wet/dry cooling received some attention ofa “system analysis/cost comparison” nature in the 1970s, with very little research literature sincethat time. Most of the same reports that presented methods and results on comparative costs ofwet and dry systems included material on hybrid systems as well (Mitchell, 1989). Most of thehybrid systems were chosen for purposes of plume abatement rather than for water conservationin the early days of the technology, and this is still largely the case. A notable exception was alarge water conservation tower installed on Unit #4 (550 MWe) of the San Juan Plant in SanJuan, NM, in 1977.
The best treatment of the technology covering the several general design configurations anddescribing the thermodynamics and psychometrics of plume formation and abatement is given inLindahl and Jameson (1993) Almost no cost information is available in the open literature.General technology descriptions can be obtained from vendor information and from their
Cooling Technologies: the State of the Art
3-4
websites (Marley Cooling Tower; DT Engineering; Hamon Cooling Systems; Niagara BlowerCompany).
One variation on the wet/dry theme is the use of some simple wet enhancement methods on drytowers for peak shaving the cooling load on the hottest days. This has been the subject of a fewpapers and academic theses (Conradie, 1991b), but very little hard economic or engineeringinformation is available.
History of Dry Cooling Technology
The first use of dry cooling at power plants was on a few small units in Germany in the 1930s(Kroeger, 1998; Miliaris, 1974). However, the real history of dry cooling on units of substantialsize and its evolution to today’s technology began about 40 years ago with an indirect, naturaldraft system at Rugeley in the U.K. in 1962. Originally, the use of dry cooling was morecommon in Europe, the former USSR, and the Middle East and South Africa than in the U.S.Table 3-1 lists 13 units from around the world installed in the three decades from 1962 to 1993representing many of the important milestones and seminal technology in the field.
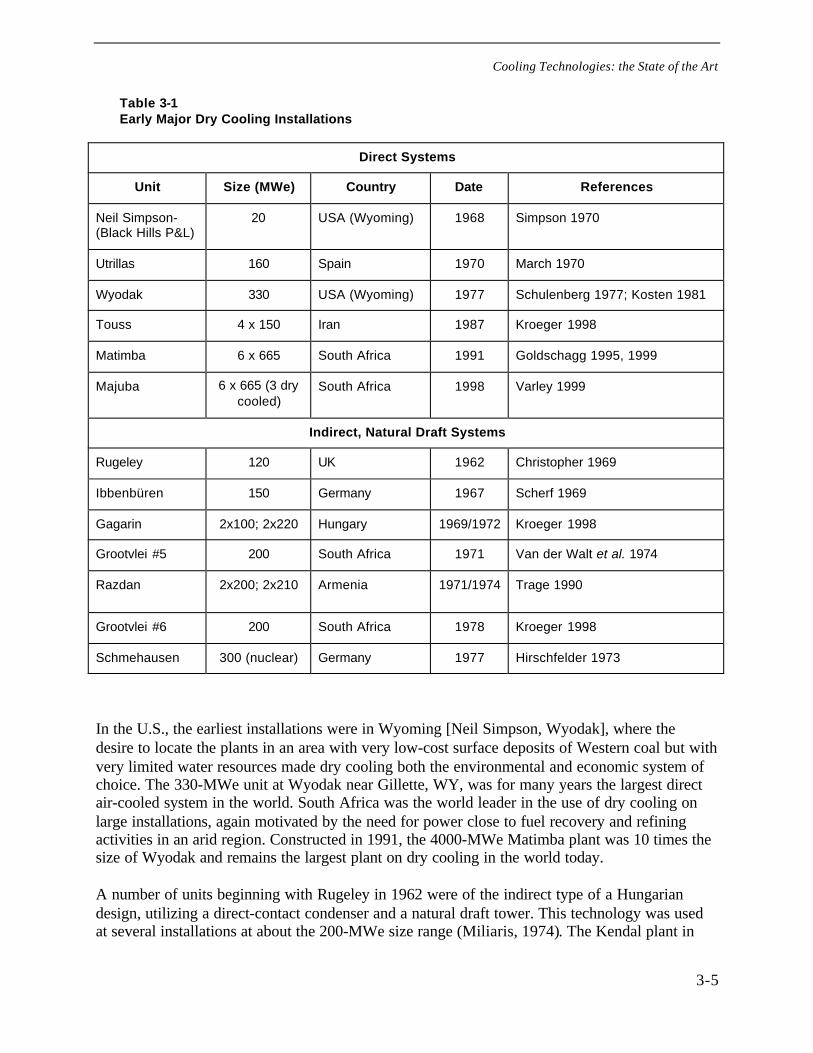
Cooling Technologies: the State of the Art
3-5
Table 3-1Early Major Dry Cooling Installations
Direct Systems
Unit Size (MWe) Country Date References
Neil Simpson-(Black Hills P&L)
20 USA (Wyoming) 1968 Simpson 1970
Utrillas 160 Spain 1970 March 1970
Wyodak 330 USA (Wyoming) 1977 Schulenberg 1977; Kosten 1981
Touss 4 x 150 Iran 1987 Kroeger 1998
Matimba 6 x 665 South Africa 1991 Goldschagg 1995, 1999
Majuba 6 x 665 (3 drycooled)
South Africa 1998 Varley 1999
Indirect, Natural Draft Systems
Rugeley 120 UK 1962 Christopher 1969
Ibbenbüren 150 Germany 1967 Scherf 1969
Gagarin 2x100; 2x220 Hungary 1969/1972 Kroeger 1998
Grootvlei #5 200 South Africa 1971 Van der Walt et al. 1974
Razdan 2x200; 2x210 Armenia 1971/1974 Trage 1990
Grootvlei #6 200 South Africa 1978 Kroeger 1998
Schmehausen 300 (nuclear) Germany 1977 Hirschfelder 1973
In the U.S., the earliest installations were in Wyoming [Neil Simpson, Wyodak], where thedesire to locate the plants in an area with very low-cost surface deposits of Western coal but withvery limited water resources made dry cooling both the environmental and economic system ofchoice. The 330-MWe unit at Wyodak near Gillette, WY, was for many years the largest directair-cooled system in the world. South Africa was the world leader in the use of dry cooling onlarge installations, again motivated by the need for power close to fuel recovery and refiningactivities in an arid region. Constructed in 1991, the 4000-MWe Matimba plant was 10 times thesize of Wyodak and remains the largest plant on dry cooling in the world today.
A number of units beginning with Rugeley in 1962 were of the indirect type of a Hungariandesign, utilizing a direct-contact condenser and a natural draft tower. This technology was usedat several installations at about the 200-MWe size range (Miliaris, 1974). The Kendal plant in
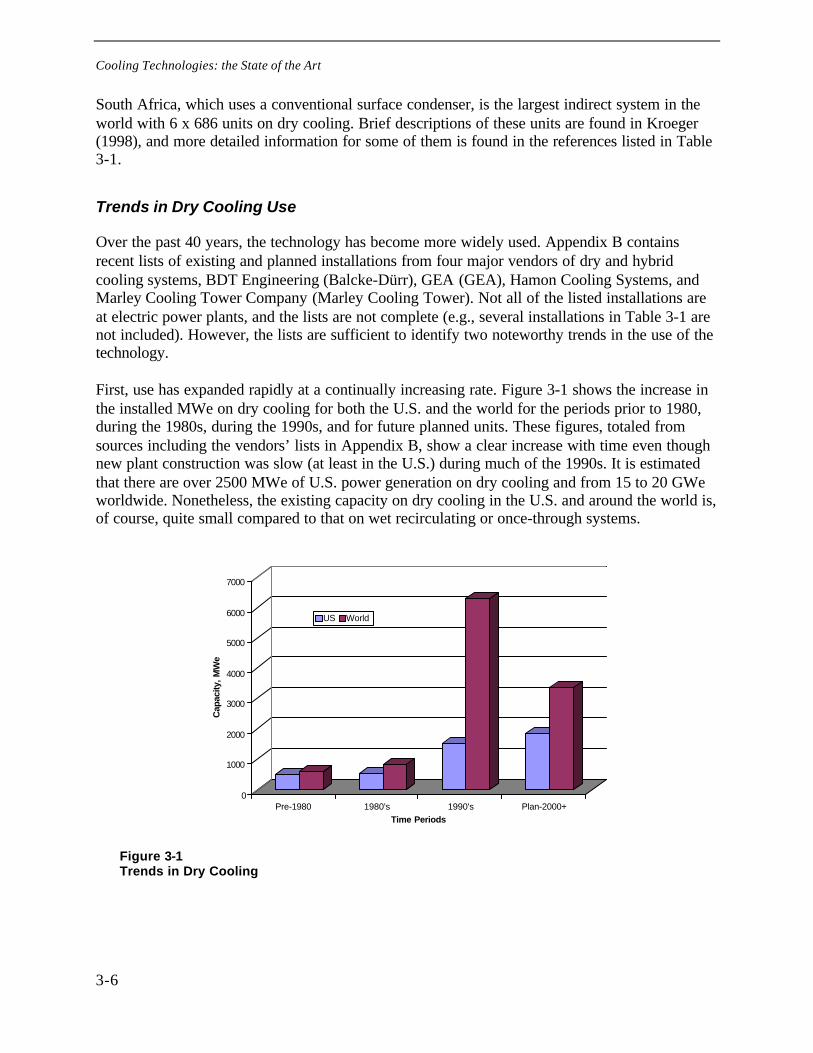
Cooling Technologies: the State of the Art
3-6
South Africa, which uses a conventional surface condenser, is the largest indirect system in theworld with 6 x 686 units on dry cooling. Brief descriptions of these units are found in Kroeger(1998), and more detailed information for some of them is found in the references listed in Table3-1.
Trends in Dry Cooling Use
Over the past 40 years, the technology has become more widely used. Appendix B containsrecent lists of existing and planned installations from four major vendors of dry and hybridcooling systems, BDT Engineering (Balcke-Dürr), GEA (GEA), Hamon Cooling Systems, andMarley Cooling Tower Company (Marley Cooling Tower). Not all of the listed installations areat electric power plants, and the lists are not complete (e.g., several installations in Table 3-1 arenot included). However, the lists are sufficient to identify two noteworthy trends in the use of thetechnology.
First, use has expanded rapidly at a continually increasing rate. Figure 3-1 shows the increase inthe installed MWe on dry cooling for both the U.S. and the world for the periods prior to 1980,during the 1980s, during the 1990s, and for future planned units. These figures, totaled fromsources including the vendors’ lists in Appendix B, show a clear increase with time even thoughnew plant construction was slow (at least in the U.S.) during much of the 1990s. It is estimatedthat there are over 2500 MWe of U.S. power generation on dry cooling and from 15 to 20 GWeworldwide. Nonetheless, the existing capacity on dry cooling in the U.S. and around the world is,of course, quite small compared to that on wet recirculating or once-through systems.
0
1000
2000
3000
4000
5000
6000
7000
Cap
acity
, MW
e
Pre-1980 1980's 1990's Plan-2000+
Time Periods
US World
Figure 3-1Trends in Dry Cooling
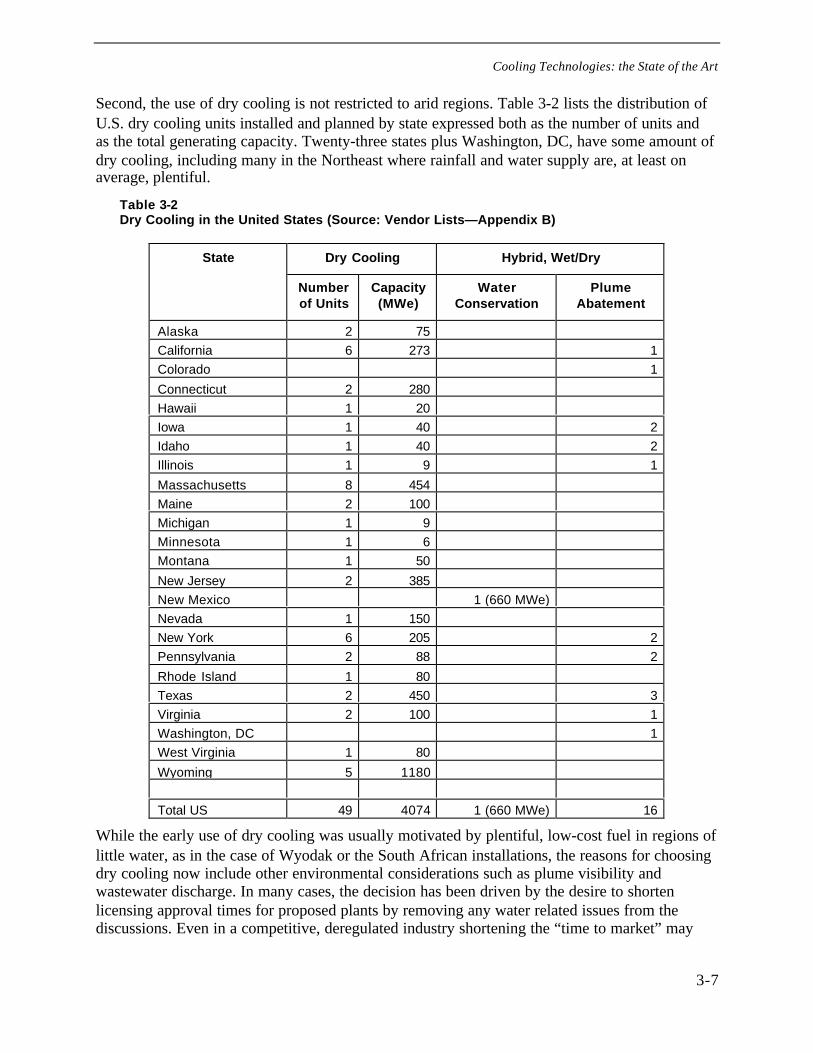
Cooling Technologies: the State of the Art
3-7
Second, the use of dry cooling is not restricted to arid regions. Table 3-2 lists the distribution ofU.S. dry cooling units installed and planned by state expressed both as the number of units andas the total generating capacity. Twenty-three states plus Washington, DC, have some amount ofdry cooling, including many in the Northeast where rainfall and water supply are, at least onaverage, plentiful.
Table 3-2Dry Cooling in the United States (Source: Vendor Lists—Appendix B)
Dry Cooling Hybrid, Wet/DryState
Numberof Units
Capacity(MWe)
WaterConservation
PlumeAbatement
Alaska 2 75
California 6 273 1
Colorado 1
Connecticut 2 280
Hawaii 1 20
Iowa 1 40 2
Idaho 1 40 2
Illinois 1 9 1
Massachusetts 8 454
Maine 2 100
Michigan 1 9
Minnesota 1 6
Montana 1 50
New Jersey 2 385
New Mexico 1 (660 MWe)
Nevada 1 150
New York 6 205 2
Pennsylvania 2 88 2
Rhode Island 1 80
Texas 2 450 3
Virginia 2 100 1
Washington, DC 1
West Virginia 1 80
Wyoming 5 1180
Total US 49 4074 1 (660 MWe) 16
While the early use of dry cooling was usually motivated by plentiful, low-cost fuel in regions oflittle water, as in the case of Wyodak or the South African installations, the reasons for choosingdry cooling now include other environmental considerations such as plume visibility andwastewater discharge. In many cases, the decision has been driven by the desire to shortenlicensing approval times for proposed plants by removing any water related issues from thediscussions. Even in a competitive, deregulated industry shortening the “time to market” may
Cooling Technologies: the State of the Art
3-8
outweigh future reductions in generating efficiency (this view is not universally held; seediscussion below under “Calpine”).
Recent Developments
As noted in Section 1, as early as 1975, California’s State Water Resources Control Boardpromulgated a policy (SWRCB, 1975) mandating the use of waters other than fresh surfacewater for power plant cooling, unless doing so could be shown to be “environmentallyundesirable or economically unsound.”
Recently, the U.S. Environmental Protection Agency in their support document, “Economic andEngineering Analyses of the Proposed §316(b) New Facility Rule” (USEPA, 2000) identifieddry cooling as an “alternative option” which would “impose more stringent compliancerequirements on the electric generating segment of the industry” based on a “zero-intake-flow (ornearly zero, extremely low-flow) requirement commensurate with levels achievable through theuse of dry cooling systems.”
In summer 2000, New York State’s Department of Environmental Conservation required the useof dry cooling at the Athens Generating Station (a 1080-MW gas-fired plant) as the preferredBest Technology Available for “minimizing adverse environmental impact” of a cooling waterintake structure (Cahill, 2000).
Operating Experience
Table 3-3 identifies five plants that use dry or hybrid wet/dry cooling systems at which operatingpersonnel were contacted and interviewed to learn about the operating and maintenanceexperience with the systems. Appendix C contains an outline of the subjects covered in theinterviews and notes from several of the meetings.
In addition, comments were received from Prof. D. G. Kröger, University of Stellenbosch, whoconsults for dry cooling manufacturers and users worldwide. His experience is consistent withthat reported below by the operators. He further notes that there are occasional problems with thedephlegmators (air removal sections) at some operating conditions. These were not mentioned inany of the interviews with U.S. users.
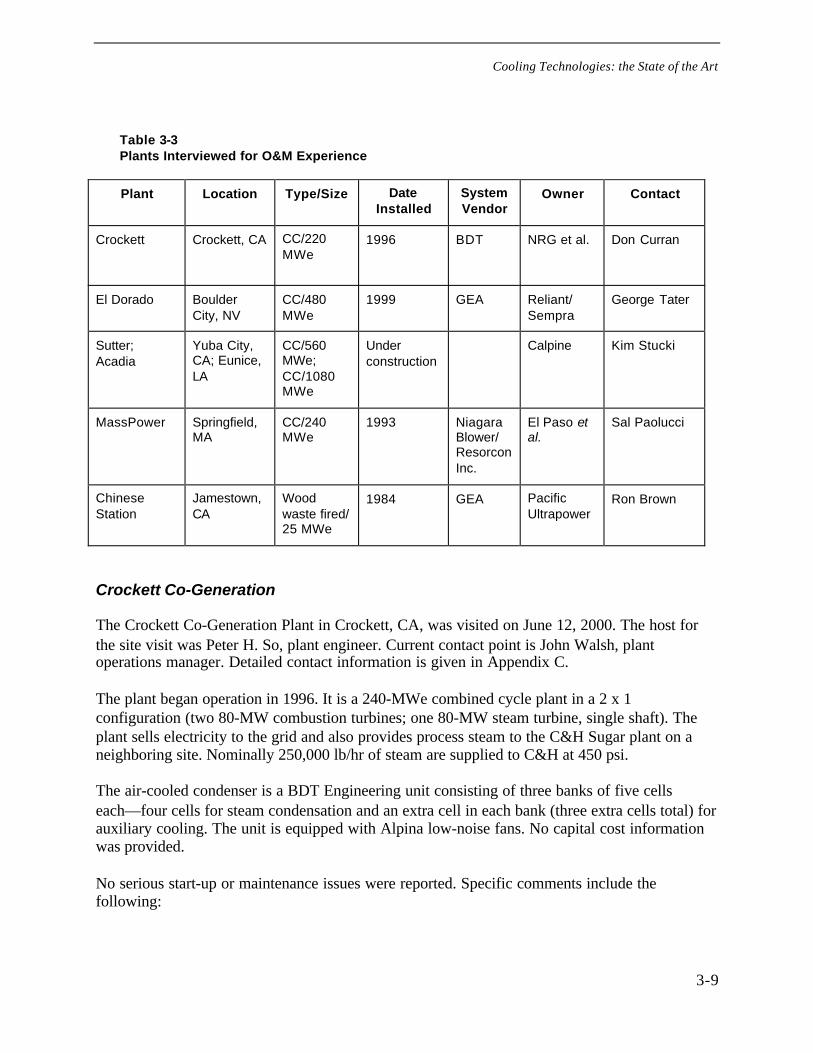
Cooling Technologies: the State of the Art
3-9
Table 3-3Plants Interviewed for O&M Experience
Plant Location Type/Size DateInstalled
SystemVendor
Owner Contact
Crockett Crockett, CA CC/220MWe
1996 BDT NRG et al. Don Curran
El Dorado BoulderCity, NV
CC/480MWe
1999 GEA Reliant/Sempra
George Tater
Sutter;Acadia
Yuba City,CA; Eunice,LA
CC/560MWe;CC/1080MWe
Underconstruction
Calpine Kim Stucki
MassPower Springfield,MA
CC/240MWe
1993 NiagaraBlower/ResorconInc.
El Paso etal.
Sal Paolucci
ChineseStation
Jamestown,CA
Woodwaste fired/25 MWe
1984 GEA PacificUltrapower
Ron Brown
Crockett Co-Generation
The Crockett Co-Generation Plant in Crockett, CA, was visited on June 12, 2000. The host forthe site visit was Peter H. So, plant engineer. Current contact point is John Walsh, plantoperations manager. Detailed contact information is given in Appendix C.
The plant began operation in 1996. It is a 240-MWe combined cycle plant in a 2 x 1configuration (two 80-MW combustion turbines; one 80-MW steam turbine, single shaft). Theplant sells electricity to the grid and also provides process steam to the C&H Sugar plant on aneighboring site. Nominally 250,000 lb/hr of steam are supplied to C&H at 450 psi.
The air-cooled condenser is a BDT Engineering unit consisting of three banks of five cellseach—four cells for steam condensation and an extra cell in each bank (three extra cells total) forauxiliary cooling. The unit is equipped with Alpina low-noise fans. No capital cost informationwas provided.
No serious start-up or maintenance issues were reported. Specific comments include thefollowing:
Cooling Technologies: the State of the Art
3-10
• There have been no air in-leakage problems, and the vacuum systems and de-aerators haveworked well.
• The water chemistry is easy to control, although there are very high make-up rates (completecycle water turnover every 2 or 3 days) because condensate from the sugar plant is either notreturned or has to be discharged because of contamination.
• Cleaning of the finned tube surfaces was last performed 18 months ago. The high-pressurecleaning system works well in removing the “sugar dust” coating from the fins. There wereconflicting reports on the need for and the effectiveness of the cleaning. Some felt that therewas no improvement in performance as a result of the cleaning. Others reported that theautomatic controls had cut the fans back from full to half speed at similar operatingconditions after cleaning.
• No noise problems exist. Limits of 50 dB at the property boundary are easily maintained.
• No corrosion problems have occurred on the condenser surfaces.
• Maintenance costs are not accounted for separately but have not appeared to be excessive.The ACC unit is maintained as part of the normal plant routine by the regular staff.
The performance of the unit and the plant has been satisfactory. No quantitative performancedata were provided (there is no systematic monitoring), and acceptance test results were notavailable. Anecdotal information includes the following:
• A “consensus estimate” by plant personnel indicates that the hottest summer days incur a 3-to 5-MWe reduction of output from the steam side (and a reduction of ~7 to 8 MWe on thecombustion turbine side).
• Fan power is the biggest plant load. There are 15 fans (each 150 hp), which in total consumeabout 2 MW.
• No problems with wind effects have been experienced.
• Freeze protection has not been a problem. (However, cold weather operating controlssometimes act strangely, i.e., fans will turn off and operators don’t know why. This isthought to be a conflict between the BDT operating system and the plant’s Foxboro I&Cpackage, but is not considered a serious problem.)
• The plant manager and engineers would like to explore methods for wet enhancement ofACC performance on the hottest days.
The complete set of meeting notes is provided in Appendix C, along with extensive informationon the air-cooled condenser including the following:
• Schematic of the ACC flow system
• ACC design data
• ACC general arrangement drawings
• ACC process data sheet
• ACC performance summary
Cooling Technologies: the State of the Art
3-11
• ACC performance characteristics (turbine back pressure vs. % heat load for a range ofambient air temperature and various fan settings)
El Dorado
El Dorado Energy’s Boulder City Power Plant was visited on October 28, 2000. The host for thevisit was George Tatar, facility manager. Detailed contact information is available in AppendixC.
The plant began operation in May 2000. It is a gas-fired 540-MWe 2 x1 combined cycle (two180-MW combustion turbines; one 180-MW steam turbine). The ACC is a GEA unit. Auxiliarycooling (lube oil, etc) is provided by a closed-loop fin-fan cooler from BDT Engineering. Thesteam turbine, which is of Westinghouse high back pressure design, operates over a range of 2 to8.5 in. Hga. No capital cost information was provided.
No start-up, maintenance or cleaning problems had yet been encountered on the cooling system.Some unrelated start-up problems with the steam turbine thrust bearing had been experienced.
No performance data or acceptance test data were made available. Performance issues include
• A “dramatic” performance drop-off when ambient temperature exceeds 110°F; and
• A “distinct loss” of cooling during periods of gusting winds.
The reasons given for the choice of dry cooling include
• The “politics” of fresh water use in the Las Vegas area,
• Unavailability of reclaimed municipal water for wet tower make-up,
• Inadequate area on plant property for evaporation ponds to dispose of cooling towerblowdown, and
• An economic advantage for dry cooling when compared to wet cooling with vaporcompression evaporators (VCE) brine concentrators
The facility manager wants to explore the use of spray cooling or some other form of wetenhancement to mitigate the performance deterioration on the hottest days.
Additional information about the plant, including the original meeting notes, is included inAppendix C.
Calpine
On September 18, 2000, a meeting was held at the Calpine offices with Kim N. Stucki, manager,plant engineering. Contact information is in Appendix C.
Cooling Technologies: the State of the Art
3-12
In advance of the meeting, a list of discussion topics (see Appendix C) was prepared focusingprimarily on how cooling systems are compared and on operating issues associated with drycooling systems. In summary, the responses were as follows:
• Dry cooling is never the system of choice on economic grounds.
• Calpine had little operating experience to share since they had no dry-cooled plants inoperation.
Although the Sutter Plant, a 516-MWe 2 x 1 combined-cycle plant in Yuba City, California thatwent on-line in 2001, uses dry cooling, the system was chosen on other than economic grounds.A comparative analysis was carried out for the Acadia Plant (1080-MWe 4 x 2 combined cycle),which is currently under construction near Eunice, Louisiana, and is scheduled to beginoperation in June 2002. A summary of the analysis indicated additional project costs of over $23million for the use of dry cooling and an additional cost of $30 million over the life of the projectin lost revenue from reduced power production attributable to the higher plant heat rate andlower capacity with dry cooling.
Some rules of thumb included in the consideration of dry cooling are provided below:
• Lost capacity for dry cooling equals 16 MWe on an average day and 28 MWe on a hot day,equivalent to 4 to 8% of the plant’s steam-side output.
• Cooling systems are designed and compared at the design back pressure at the 1%temperature (temperature exceeded for 1% [88 hours] of the year).
• Dry cooling saves approximately 80% of makeup water and 85% of wastewater dischargeover a typical year.
• The loss of 1 kW is approximately worth $1500 over the life of a project.
• The capital cost of the dry cooling system is approximately three times that of a wet coolingsystem.
• There is no value in reduced licensing time in the current business climate since licensing isnot the pacing issue: Delivery times on combustion turbines ordered today are more than 3years.
The following anecdotal information on operational issues was provided by Calpine:
• They have no experience with high back pressure turbines.
• Wet enhancement with spray cooling was tried at a wood-burning plant near Sonoma,California, with attendant O&M problems. No details or explanation were available.
• Calpine routinely uses fogging systems to cool gas turbine inlet air. They use de-mineralizedwater and have no problems.
Cooling Technologies: the State of the Art
3-13
MassPower
A telephone interview was held with Sal Paolucci, plant operations manager of MassPower, onMarch 2, 2001. Contact information is provided in Appendix C.
The plant, located in Springfield, MA, is equipped with an evaporative condenser cooling systemprovided by Resorcon, Inc., a subsidiary of Niagara Blower. It is the largest power generationapplication of this technology in the world.
Basic background information on the plant and the cooling system was presented in a 1995 paperat the ASME Industrial Power Conference (Basile, 1995). A brief description of the plant and thecooling system follows.
The plant is a 240-MWe gas-fired co-generation plant, generating power for the grid andsupplying steam to Monsanto’s Indian Orchard plant in Springfield, MA. Operation began in1993. The power train is comprised of two 84-MW gas turbine/generators, a triple pressure heatrecovery boiler, and a 72-MW steam turbine/generator. Evaporative cooling of the gas turbineinlet air is used for enhanced power production at ambient temperatures above 59ºF.
Plant cooling is provided by a wet surface air-cooled steam condenser and an auxiliary watercooler. The condenser consists of five cells condensing 661,000 lb/hr of steam and maintaining aback pressure of 2.8 in. Hga at ambient conditions of 20ºF dry bulb and 19ºF wet bulb. Hotweather specifications are 4.8 in. Hga back pressure at 97ºF dry bulb and 80ºF wet bulb for asteam flow of 582,000 lb/hr. Total power requirements are approximately 900 HP, and make-upwater requirements range from 690 gpm at 7ºF ambient to 1076 gpm at 97ºF/80ºF ambient.
The unit can be operated in a plume abatement mode by isolating the spray water flow to theinterior bundles of each cell with a plume reduction of 75% during “normal ambient conditions.”
Plant operations personnel are quite satisfied with unit performance. Startup and shutdown areeasily accomplished. Hot day operation has not been limited: The turbine alarms at 6 in. Hga andtrips at 7.5 in. Hga. Back pressure on the hottest days is maintained at 4 to 4.5 in. Hga. Therehave been no water treatment problems, and the unit is easily cleaned on-line to maintain cleantubes.
Chinese Station
Chinese Station was visited on March 23, 2001. The plant is equipped with an ACC and aseparate air-cooled auxiliary cooler. The condenser has been outfitted with a performanceenhancement spray system to maintain plant output during hot weather. The visit was hosted byRon Brown, plant operations manager; contact information is provided in Appendix C.
The facility is operated by Constellation Services and owned by Pacific Ultrapower, a companyjointly owned by Baltimore Gas & Electric and Ogden (now Covanta). It is located at EnterpriseDrive, Hatler Industrial Park, Chinese Camp, California (1.5 miles south of the Rte. 108/120 splitapproximately 45 miles east of Modesto).
Cooling Technologies: the State of the Art
3-14
The plant is a 25-MW (gross)/22-MW (net) unit fueled with wood waste derived both fromagriculture and forestry waste and urban wood waste. The fuel has a heat content of ~ 8,000Btu/lb, a moisture content that varies from 20 to 60% depending on the source, and an ashcontent of up to 17%.
The plant has been in operation since 1986. The plant serves two functions: wood waste disposaland electric power generation for purchase by PG&E under a 30-year contract. The waste ispurchased for a nominal charge, which essentially covers the suppliers’ cost of transporting thewaste to the site while enabling them to avoid storage, disposal, or tipping costs elsewhere. Theash is sold to local concrete plants or to agricultural interests for mixing with fertilizer and cattlefeed.
The ACC is a GEA 4-cell unit (3 condensing cells; 1 reflux [or dephlegmator] cell) sized for189,500 lb/hr of turbine exhaust steam with 8.7% moisture. The design point is 8.9 in. Hga at97°F ambient. At temperatures above 90°F (up to summer peak temperatures of 110-115°F),capacity falls as minimum achievable back pressure rises to 10 in. Hga and higher. Turbinealarm is set at 12 in. Hga.
The unit fouls frequently due to the high dust levels from the waste wood fuel piles. Dust screenshave been installed to reduce the blown dust, but cleaning of the finned tube surfaces is requiredas often as once a week. Cleaning is done with a fire hose to wash down the surfaces.
Plume recirculation is a problem on windy days. “Wing-like” structures have been added to thetop of the ACC along the sides to deflect plume recirculation.
The spray system was installed about 5 years ago. The motivation for installing the augmentationsprays was to avoid penalty charges incurred when the contracted-for power level cannot bedelivered. The sprays are located along one side of the condenser at heights of 8 and 10 ft. Spraynozzles are located about every 2 ft along the pipes and supplied with high-pressure water (up to450 psi) that has been treated by reverse osmosis. Additional arrays placed across the towerbetween the fans are used only on the hottest days. Water flow needed to saturate the inlet air atpeak summer temperatures is about 40 gpm. The spray system is capable of 150% overspray or100 gpm; 60 gpm is collected in a basin under the ACC and recycled.
Full spray lowers the back pressure by about 2 in. Hg, resulting in 1 to 1.5 MW additionaloutput. Maximum augmentation is achieved when the finned tube surfaces become wet. This hasnot resulted in any reported corrosion damage. There may have been some scaling or fouling, butthis is difficult to determine in the high-dust environment.
Nozzle fouling has been a problem. In 5 years, nozzles have been replaced twice. A variety ofnozzles are used (BETE, Delavan, and others). Some are the pin impingement type, others theswirl type. It does not appear that complete evaporation is achieved even in the absence ofoverspray.
Cooling Technologies: the State of the Art
3-15
References
1. Basile, F. and G. H. Johnson, "Wet Surface Air Cooled Steam Condensers and Auxiliary WaterCooler at MASSPOWER", PWR-Vol. 27, Proceedings of the Industrial Power Conference, Ed. N. C.Francoviglia, Book No. 100378, 1995.
Special Report: “Cooling Towers”. New York, NY: McGraw-Hill; 1973 Mar.
2. Proceedings: International Cooling-Tower and Spray Pond Symposium Palo Alto, CA:Electric Power Research Institute; 1990 Sep.
3. Proceedings of the 9th IAHR Cooling Tower and Spraying Pond Symposium; Rhode-Saint-Genèse, Belgium. International Association for Hydraulic Research; 1994.
4. Proceedings: Cooling Tower And Advanced Cooling Systems Conference Palo Alto, CA:Electric Power Research Institute; 1995 Feb.
5. Adams, A. Paul and Barbara G. Lewis. Bacterial Aerosols Generated by Cooling Towersof Electrical Generating Plants. Cooling Tower Institute. 1978 Jan; (TP78-11).
6. Design Features and Their Effect on High Performance Fill. Houston, TX: CoolingTechnology Institute; 2000.
7. Balogh, Andres and Z. Takes. Developing Indirect Dry Cooling Systems for ModernPower Plants [Web Page]. 1998. Available at:http://www.nemesis.at/publication/gpi_98_2/articles/33.html .
8. BDT Engineering. Available at: www.balcke-duerr.com.
9. Bonger, R. and R. Chadron. New Developments in Air-cooled Steam Condensing; 1995:Paper 18.
10. Buys, J. D. and D. G. Kroeger. Dimensioning Heat Exchangers for Existing Dry CoolingTowers. Energy Conversion and Management. 1989a; 29(1):63-71.
11. Cost-Optimal Design of Dry Cooling Towers Through Mathematical ProgrammingTechniques. ASME Trans. 1989b May; 111:322-327.
12. Cahill, J. P. Interim Decision In the Matter of an Application for a State PollutantDischarge Elimination System permit by the Athens Generating Co., LP. Albany, NY: State ofNew York, Dept. of Environmental Conservation; 2000 Jun; DEC No. 4-1922-00055/00001.
13. Christopher, P. J. and V. T. Forster. Rugeley Dry Cooling Tower System . Proc. Instn.Mech. Engrs. 1969; 184, Pt. 1(11):197-221.
Cooling Technologies: the State of the Art
3-16
14. Conradie, T. A. and D. G. Kröger. Enhanced Performance of a Dry-Cooled Power Plantthrough Air Precooling; San Diego, CA. 1991a.
15. Enhanced Performance of a Dry-Cooled Power Plant through Air Precooling.International Power Generation Conference, San Diego, CA; 1991b Oct 6-1991b Oct 10; ASMEPaper No. 91-JPGC-Pwr-6.
16. Cooper, John W. Cooling Tower Performance . Cooling Tower Thermal PerformanceEnhancement Seminar; Jackson Hole, Wyoming. Palo Alto, California: EPRI; 2000.
17. CTI. Bibliography of Technical Publications. Houston, TX: Cooling TechnologyInstitute; 1999a; Bulletin PRM-103(99).
18. CTI. Cooling Technology Institute Home Page [Web Page]. 1999b. Available at:http://www.cti.org.
19. Cooling Tower Institute Handbook. Houston, TX: Cooling Technology Institute; 1999c.
20. DesJardins, R. J. Using the EPRI Test Data to Verify a More Accurate Method ofPredicting Cooling Tower Performance. Houston, TX: Cooling Technology Institute; 1992.
21. DiFilippo, Michael N. Identification and Use of Degraded Water Sources for Power PlantCooling Water in California. 2001 Mar.
22. Ecker, J. G. and R. D. Wiebking. Optimal Design of a Dry-Type Natural-Draft CoolingTower by Geometric Programming. Journal of Optimization Theory and Applications. 1978 Oct;26(2):305-323.
23. EPRI. EPRI Home Page [Web Page]. 2000. Available at: http://www.epri.com.
24. Feltzin, A. E. and D. Benton. A More Nearly Exact Representation of Cooling TowerTheory. Houston, TX: Cooling Technology Institute; 1991.
25. Fulkerson, R. D. A Comparison of Crossflow Cooling Tower Splash-Type Fills.Houston, TX: Cooling Technology Institute; 1999.
26. GEA. Available at: http://www.gea-ag.de/english/gea/index.html.
27. Gill, J. S. J. R. Parson and R. C. Gordon. A New Treatment for Calcium CarbonateControl in Alkaline Conditions. Houston, TX: Cooling Technology Institute; 1997.
28. Goldschagg, H. B. et al. Air-Cooled Steam Condenser Performance in the Presence ofCrosswinds Palo Alto, CA: Electric Power Research Institute; 1995.
29. Goldschagg, Hein. Winds of Change at Eskom’s Matimba Plant. 1999 Jan: 43-45.
Cooling Technologies: the State of the Art
3-17
30. Hamilton, Thomas H. Developing the Worth of Colder Water in a Steam TurbineGenerating Station. Cooling Tower Institute; 2000 Jan; CTI TP00-12.
31. Hamon Cooling Systems. Available at: http://www.hamon.com.
32. Hirschfelder, G. Der Trockenkühlturm des 300-MW-THTR-Kernkraftwerkes,Schmehausen-Uentrop: VGB Krasftwekstechnik; 1973; 53, Heft 7.
33. Hobson, E. T. H. Massey and P. Lindahl. NPF Cooling Tower Fill--Its Development andDemonstration. Houston, TX: Cooling Technology Institute; 1995.
34. Howarth, J. and C. Nalepa. First Field Trials of Single-Feed, Liquid Bromine Biocide forCooling Towers. Houston, TX: Cooling Technology Institute; 2000.
35. Kelly, N. W. Kelly’s Handbook of Crossflow Cooling Tower Performance. Kansas City,MO : N. W. Kelly & Associates; 1976.
36. Kosten, G. J. et al. Operating Experience and Performance Testing of the World's LargestAir-cooled Condenser. American Power Conference; Chicago, IL. 1981.
37. Kroeger, D. G. Air-cooled Heat Exchangers and Cooling Towers. New York: BegellHouse; 1998.
38. Ledford, G. A. Testimony on Wet/Dry Cooling for the High Desert Power Project.California Energy Commission : Siting Committee; 1999(Docket No. 97-AFC-1).
39. LeFevre, M. New Technology and Cooling Tower Design Practices. Combustion. 1977May; 28-32.
40. Lindahl, Paul and R. W. Jameson Vol. 14 No. 2 also CTI TP93-01. Plume Abatement andWater Conservation with the Wet/Dry Cooling Tower. CTI Journal. 1993; 14(2).
41. March, F. and F. Schulenberg ca. 1970. GEA-Information: Air cooled condenser for a160 MW steam power station, planning of the plant and experience gained in two years ofoperation. Bochum, Germany: GEA-Kühlturmbau und Luftkondensation, GmbH; 1970.
42. Marley Cooling Tower. Available at: http://www/marleyct.com.
43. Maulbetsch, J. S. and J. A. Bartz. Cooling Towers and Cooling Ponds. Handbook of HeatTransfer: Applications. McGraw-Hill; 1985.
44. Miliaris, E. S. Power Plants with Air-Cooled Condensing Systems. Cambridge,Massachusetts: The MIT Press; 1974.
45. Miller, T. O. and J. E. Luckart. Elk Hills Power, LLC's Opening Brief on Part TwoSubject Areas. California Energy Commission: Siting Committee; 2000(Docket No. 99-AFC-1).
Cooling Technologies: the State of the Art
3-18
46. Missimer, J. R. D. E. Wheeler and K. W. Hennon. The Relationship Between SP andHGBIK Drift Measurement Results--New Data Creates a Need for a Second Look. Houston, TX:Cooling Technology Institute; 1998.
47. Mitchell, R. D. Survey of Water-Conserving Heat Rejection Systems. Palo Alto, CA:Electric Power Research Institute; 1989 Mar; EPRI GS-6252.
48. Niagara Blower Company. Available at: http://www.niagarablower.com/wsac.htm.
49. Oosthuizen, P. C. Performance Characteristics of Hybrid Cooling Towers. University ofStellenbosch: Dept. of Mechanical Engineering; 1995 Sep; ME Thesis.
50. Richardson, J. and M. G Trulear. Recent Advances in High Alkaline Cooling WaterTreatment. Houston, TX: Cooling Technology Institute; 2000.
51. Scherf, O. Die luftgekühlte Kondensationsanlage im 150-MW-Block des Preussag-Kraftwerkes in Ibbenbüren, Energie und Technik. 1969; (7):260-264.
52. Schulenberg, F. Der Luftkondensator für den 356-MW-Block in Wyoming/USA.Sammelband VGB-Konferenz; 1977.
53. Simpson, N. Air-Cooled Condenser Fits Steam Plant to Arid Site. 1970(June 8, 1970).
54. Streng, Andreas. Circular Hybrid Cooling Towers. CTI Journal. 2000.
55. Suptic, D. M. A Non-Metallic Air Cooled Heat Exchanger for Cooling Tower PlumeReduction. Houston, TX: Cooling Technology Institute; 1999.
56. Thermoflow. 1999. Available at: http://www.thermoflow.com.
57. Trage, B. A. J. Ham and Th. C. Vicary. The Natural Draught, Indirect Dry CoolingSystem for the 6 x 686 MWe Kendal Power Station, RSA. Jt. ASME/IEEE Power GenerationConference; Boston, Massachusetts. 1990.
58. Tsou, John J. Jenco and K. Zammit eds. Proceedings: Cooling Tower TechnologyConference; 1997 Jul.
59. Van der Walt et al. The Design and Operation of a Dry Cooling Tower system for a 200MW Turbo-generator at Grootvlei Power Station, South Africa. Proceedings of the 9th WorldEnergy Conference; Detroit, MI. 1974.
60. Varley, J. Eskom’s Majuba: at the peak of its career. 1999 .
61. Von Cleve, H.-H. Die Luftgekùhlte Kondensationsanlage des 4000 MW-KraftwerksMatimba/Südafrika. VGB Kraftwerkstechnik. 1984; 64(4).
4-1
4 CASE STUDY SITE SELECTION
Within California, there are great variations in climate, hydrology, and elevation—all importantconsiderations in the siting of power plants and in the choice of cooling systems. The approachtaken in this project was to select four case study sites that span the range of conditions likely tobe encountered in siting deliberations for new power plants using other than once-through oceancooling for steam-cycle heat rejection.
Figure 4-1 shows the locations of all existing power plants in the state. In addition to numerouscoastal sites, there are large concentrations of plants in the San Francisco Bay Area, the LosAngeles Basin, the Central Valley, and the Delta Region. The many plants in the northern andeastern parts of the state are mostly hydroelectric units. Figure 4-2 indicates the sites of futureplants—approved, expected, and currently in the application process.
The case studies are intended to span the range of important site characteristics for locationslikely to be chosen for future gas-fired plants in the state. This section introduces keycharacteristics and identifies case study sites.
Important Site Characteristics
The comparative performance and cost of wet, dry, and hybrid cooling systems for combined-cycle power plants are determined by a number of characteristics of the site. The most importantare
• Site meteorology,
• Site elevation,
• Water availability,
• Wind conditions,
• Local environmental constraints, and
• Proximity to other activities.
These characteristics are described below.

Case Study Site Selection
4-2
Figure 4-1California Power Plants (Source: CEC website)
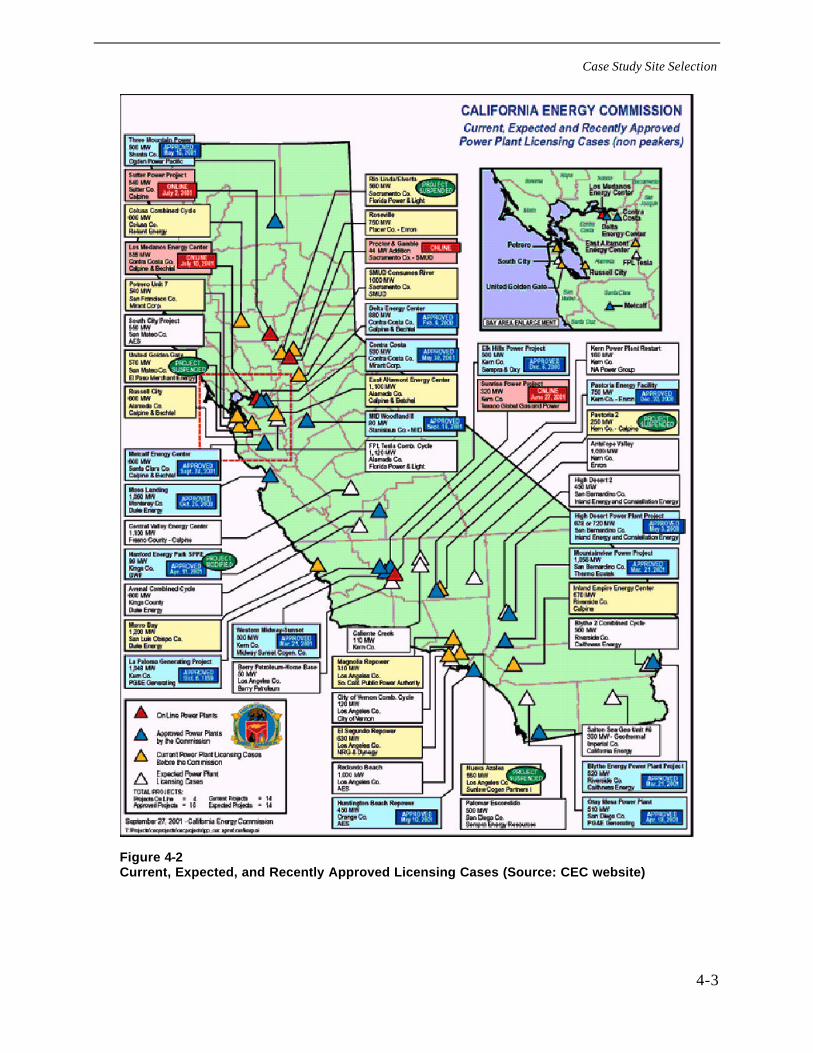
Case Study Site Selection
4-3
Figure 4-2Current, Expected, and Recently Approved Licensing Cases (Source: CEC website)
Case Study Site Selection
4-4
Site Meteorology
The primary determinant of the relative performance and cost of a wet, dry, or hybrid coolingsystem is the meteorology at the plant site. As discussed in Section 2, dry systems are limited bytheir approach to ambient dry bulb temperature and wet systems by their approach to ambientwet bulb temperature. The wet bulb temperature is always (except in the rare instance of 100%relative humidity) less than the dry bulb temperature, often significantly. Therefore, forreasonably designed wet or dry systems, the wet system will nearly always perform better.
Wet system performance increases as wet bulb temperature decreases and hence the technologyis particularly favored by hot, dry conditions. Dry system performance suffers as dry bulbtemperature increases and therefore is favored by cool, but humid conditions. Of particularimportance are extreme high-temperature conditions that are typically coincident with peaksummer loads on the electric power system driven by high air-conditioning demand. At theseconditions, dry cooling can impose a substantial capacity penalty on the system by limiting theachievable back pressure on the steam turbine and hence the available power output.
To illustrate the importance of this effect on the comparative costs of wet and dry systems, siteswere chosen with a range of peak temperatures and relative humidities.
Another element of site meteorology is winter conditions. Under a range of colder conditions, avisible plume can be produced by wet towers and by the wet portions of hybrid towers. Undersome conditions, the plume can be quite voluminous and persistent. These conditions, whenaccompanied by the right wind patterns, can keep the plume at low levels and blow it towardlocal features such as highways and airports, impairing essential visibility. This may requirepreventive measures such as plume abatement capability on the towers or interrupted operationduring some periods with attendant higher cost and lost revenue. The situation is obviouslyhighly site specific.
Under more extreme winter conditions, the potential for freeze-ups exists. Both wet and drytowers are subject to damage from freezing, and the problem for most wet systems has receivedconsiderable attention in the literature (Michell, 1997; Fabre, 1994). The problem can normallybe addressed through prudent operating practice, such as fan control and taking cells out ofservice to increase the heat load on the others. At likely plant sites in California, it is notexpected to be a problem and was not considered in the site selection.
Site Elevation
Site elevation, per se, affects the performance of cooling systems through the effect of reducedair density at higher elevations on fan power requirements. A fixed amount of heat rejection at agiven set of temperatures requires a fixed mass flow of cooling air. At lower densities, anincreased volume flow must be maintained to provide the same mass flow; thus, acorrespondingly higher fan power is consumed. This increase in fan power is unfavorable to drycooling since the technology requires substantially higher air flow than do wet systems for thesame cooling load. While a range of elevations was chosen for illustrative purposes, it should be
Case Study Site Selection
4-5
noted that the difference in fan power with elevation is readily calculable, and the application ofthe appropriate energy cost penalty to the economic analysis is straightforward.
Secondary effects of site elevation result from the fact that higher elevations are less likely toexperience summer temperatures and humidity as high as those encountered at lower elevations.These considerations were discussed explicitly in the previous sections on site meteorology.
Water Availability
Water availability is obviously a crucial factor in the evaluation of the relative costs of wet anddry cooling systems. As will be discussed in Section 5, the cost of water for make-up to a wetcooling tower can be a significant item in cost comparisons at some locations. This is particularlytrue if water must pumped over long distances and big changes in elevation, requiring largecapital investments in water supply facilities and high operating costs for pumping power. Insuch situations, the capital cost ratios of dry to wet systems can be significantly reduced, asindicated in the studies conducted for the Elk Hills plant (Miller, 2000).
However, this consideration is entirely site specific. It is readily accounted for parametrically todetermine what the breakeven cost of water would have to be in order to alter the economicranking of dry vs. wet systems at a particular site with a given meteorology. Therefore, noexplicit use of water availability was made in the case study selection process.
Wind Conditions
Wind can have a serious detrimental effect of cooling tower performance in either wet or drysystems. These effects usually are the result of plume recirculation where hot exhaust air (for drysystems) or hot, moist exhaust air (for wet systems) is blown down near the tower inlet andentrained with the inlet air. This raises the inlet temperature (dry or wet bulb) and degrades towerperformance. In dry towers, where the fan inlet is below the heat exchangers and more exposedto the open atmosphere, it is possible for gusts of wind to disrupt the incoming air flow patternsand partially starve some or all of the fans. For this reason, the consequences of wind-relatedeffects on performance are likely to be more severe for dry systems than for wet.
All these effects can be exacerbated by local topographic features or nearby structures that alterwind patterns by creating vortices, downdrafts, or other flow perturbations. The situation canoften be mitigated or corrected by the construction of wind barriers (Duvenhage, 1996;Goldschagg, 1995).
While important, wind data were not used in the selection of case study sites for two reasons.First, it is difficult to determine the relative effect on wet vs. dry systems without site-specificdetails. Second, the occurrence of wind-related performance degradation is intermittent andseasonal and, hence, difficult to quantify in economic terms. Therefore, it would be impossible togeneralize from any case study other than to suggest that careful attention should be paid to localwind patterns for either system.
Case Study Site Selection
4-6
Local Environmental Constraints
Wet systems in particular require the disposal of sometimes substantial quantities of blowdownin order to maintain suitable water quality in the tower and condenser. Local regulations basedon conditions in surface receiving waters, aquifers, or injection wells may limit disposal options,requiring alternatives such as brine concentration or evaporation to dryness that may have apotentially significant effect on the system cost. Again, these are site-specific considerations thatare difficult to generalize but relatively easy to account for in any particular economiccomparison study. They were not included in the case study selection process.
Proximity to Other Activities
A final consideration is the presence of nearby activities, facilities, or neighborhoods and theconstraints that they may impose on the design and operation of cooling systems. Examplesinclude the proximity of population centers, highways, airports, agricultural operations (sensitivecrops or livestock), and designated scenic areas—any and all of which may require significantsystem modifications to control noise, drift, visible plumes, other visual impact, or otherconsiderations. Plume abatement capability and low-noise fans in particular can add substantiallyto the cost of both wet and dry systems. These items will be identified in the cost discussions ofSection 5 but were not explicitly included in the case study site selections.
Chosen Sites
Four sites were selected based on two primary considerations:
1. They are from locations in California where a significant number of plants are planned and/orare expected to be proposed. Coastal sites were not included on the basis that ocean coolingis likely to be the preferred choice, and this approach is sanctioned by Resolution 75-58.
2. The sites represent a range of the important meteorological conditions discussed in thesection above on “Site Meteorology.”
The chosen sites are as follows:
• A high desert site characterized by conditions at Blythe, California;
• A northern mountain site characterized by conditions at Burney, California (near Redding);
• A Central Valley site characterized by conditions at McKittrick, California (nearBakersfield); and
• A Bay Area/Delta Region site characterized by conditions at Pittsburg, California.
The sites are proximate to locations designated on Figure 4-2 as sites for current or proposedplants in the Blythe, Three Mountain, LaPaloma, and Contra Costa areas (note that the case studysites are hypothetical, and have no relation to these proposed plants). Table 4-1 summarizesimportant site characteristics and meteorological information. Appendix D provides detailedinformation about each site.
Case Study Site Selection
4-7
Plant/steam conditions at each site are as follows:
• Plant type : gas-fired combined cycle; 500 MW in 2 x 1 configuration (typical of currentplant designs in California)
• Steam flow: 1,000,000 lb/hr
• Steam quality: 95%
• Enthalpy : 1057 Btu/lb
• Back pressure : 2.5 in. Hga (Tsat = 109°F)

Case Study Site Selection
4-8
Table 4-1Site Specifications
Characteristic Site 1(Blythe)
Site 2(Three
Mountain)
Site 3(LaPaloma)
Site 4(Contra Costa)
Location
Longitude -114.596 -121.660 -119.622 -121.805
Latitude 33.610 40.833 35.306 38.005
Elevation (ft) 390 967 320 10
Temperature, dry bulb
Tavg 72 62 67 60
Tmax 117 118 106 104
T1% 111 103 103 85
T2% 109 101 101 81
T5% 106 98 99 77
Temperature, wet bulb
Twb avg 63 58 60 56
Twb max 79 77 75 75
Twb 1% 78 70 72 66
Twb 2% 77 69 71 64
Twb 5% 76 67 70 63
Case Study Site Selection
4-9
References
1. Duvenhage, K. C. G. DuToit and D. G. Kröger. Methods to Combat the Influence ofCross Wind on Fan Performance in Forced Draught Air-cooled Heat Exchangers. Proc. of the 1stSouth African Conference on Applied Mechanics (SACAM); Midrand, South Africa. 1996.
2. Fabre, L. Wet Cooling Towers: The Different Antifreeze Systems---ExperienceFeedback. Proceedings of the 9th IAHR Cooling Tower and Spray Pond Symposium; vonKarman Institute Brussels, Belgium. International Association for Hydraulic Research; 1994.
3. Goldschagg, H. B. et al. Air-Cooled Steam Condenser Performance in the Presence ofCrosswinds Palo Alto, CA: Electric Power Research Institute; 1995.
4. Michell, F. L. and D. H. Drew. Cold Weather Operating Guidelines and Experience forNatural Draft Cooling Towers. Proceedings: Cooling Tower Technology Conference; St.Petersburg, FL. Palo Alto, California: EPRI; 1997: pp. 4.1 - 4.10.
5. Miller, T. O. and J. E. Luckart. Elk Hills Power, LLC's Opening Brief on Part TwoSubject Areas. California Energy Commission: Siting Committee; 2000(Docket No. 99-AFC-1).

5-1
5 COMPARATIVE COST ANALYSES
Introduction and Guidelines
In order to make appropriate decisions in choosing between wet, dry, and hybrid coolingsystems, an accurate estimate of the total cost for each alternative is necessary. Comparisons areoften difficult to make, and the findings are impossible to generalize with sufficient precision tobe useful in design or licensing procedures.
This section is intended to provide a set of guidelines for the purpose of evaluating thecompleteness and credibility of cost estimates and of understanding the differences betweenallegedly comparable estimates. At the outset, a methodology will be developed for making faircomparisons. The use of the methodology will be illustrated through four case studiesrepresentative of the likely range of conditions in California. Differences among the resultingcost comparisons will be analyzed in order to understand the influence of site-specific conditionson the relative costs. Finally, a series of parametric studies will be presented to illustrate thesensitivity of the overall cost comparisons to uncertainties in individual cost components or tounusual conditions causing some cost elements to be significantly different from average values.
Two guidelines for comparison are paramount:
1. The estimates being compared must include all costs that are affected by the choice of thecooling systems, particularly the costs associated with the effects of cooling systemcapability on plant heat rate and generation capacity.
2. Comparisons must be made between optimized systems, in which the appropriate choice ofcooling system size and capability balances initial capital cost against the cost ofperformance penalties that an undersized cooling system might impose on the generatingplant.
Cautions and Limitations
The cost information and comparisons presented in this report are based on vendor-supplied datafor four case studies chosen to be representative of sites and conditions in California. Therefore,the results should not be extrapolated or applied to situations that differ substantially from thesesituations. The following specifics should be noted:
Comparative Cost Analyses
5-2
• The plant type and size were the same for all cases, namely, a new, 500-MWe gas-fired,combined-cycle plant. The steam portion of the cycle delivers one-third or about 170 MWe.The results should not be used in applications such as
– Retrofit situations,
– Stand-alone fossil-fired or nuclear steam plants, or
– Steam cycles substantially different in size from 170 MWe.
• The sites were all inland sites with fresh water supply. The results should not be applied toocean sites using salt water for cooling tower make-up.
Methodology
As described in some detail in Section 2, cooling systems are required to condense the steam atthe turbine exhaust and to maintain the design turbine back pressure. For a given ambienttemperature and humidity, the size and effectiveness of the cooling system determines how low acondensing temperature can be maintained for a specified water flow. Figure 5-1 illustrates thequalitative variation in steam turbine performance and steam turbine heat rate with varying backpressure.
Two curves and one data set are displayed:
• A “conventional” turbine designed to operate with once-through or wet recirculating coolingsystems: These turbines are highly efficient at low (1 to 2.5 in. Hga) back pressure, incurlarge heat rate penalties as the back pressure rises, and are usually limited to operation below5 in. Hga.
• A “modified” turbine: While somewhat less efficient at lower back pressures, these designsmaintain their performance better as back pressure rises and can be designed to operate atlevels well above 5 in. Hga. For the subsequent analyses, an upper limit of 8 in. Hga isassumed.
• Points from an operating turbine: Points taken from a heat rate curve for a turbine currentlyinstalled and operating on a gas-fired, combined-cycle plant using an air-cooled condenser(ACC) are plotted in Figure 5-1 and seen to agree well with the “modified” case.
The data have been presented as “heat rate ratio” (HRR), normalized to unity at 2.5 in Hga; thatis,
HRR = (Heat Rate)/(Heat Rate @ 2.5 in. Hga)
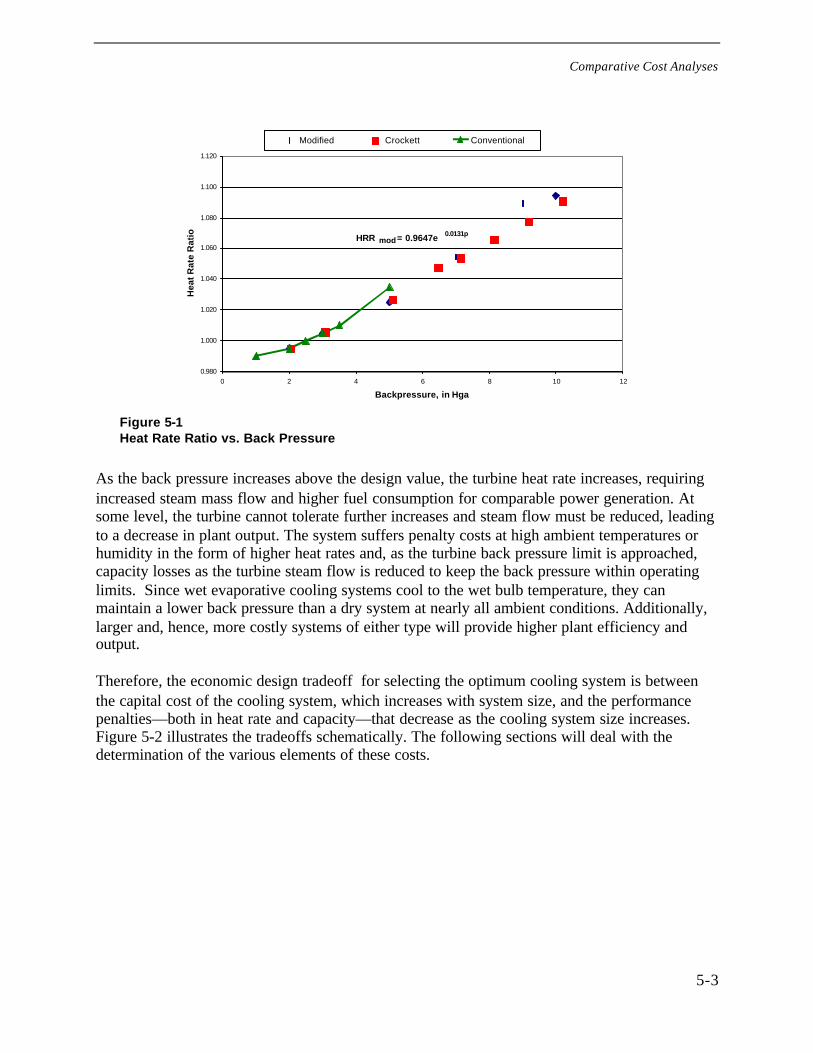
Comparative Cost Analyses
5-3
HRR mod = 0.9647e 0.0131p
0.980
1.000
1.020
1.040
1.060
1.080
1.100
1.120
0 2 4 6 8 10 12
Backpressure, in Hga
Hea
t R
ate
Rat
io
Modified Crockett Conventional
Figure 5-1Heat Rate Ratio vs. Back Pressure
As the back pressure increases above the design value, the turbine heat rate increases, requiringincreased steam mass flow and higher fuel consumption for comparable power generation. Atsome level, the turbine cannot tolerate further increases and steam flow must be reduced, leadingto a decrease in plant output. The system suffers penalty costs at high ambient temperatures orhumidity in the form of higher heat rates and, as the turbine back pressure limit is approached,capacity losses as the turbine steam flow is reduced to keep the back pressure within operatinglimits. Since wet evaporative cooling systems cool to the wet bulb temperature, they canmaintain a lower back pressure than a dry system at nearly all ambient conditions. Additionally,larger and, hence, more costly systems of either type will provide higher plant efficiency andoutput.
Therefore, the economic design tradeoff for selecting the optimum cooling system is betweenthe capital cost of the cooling system, which increases with system size, and the performancepenalties—both in heat rate and capacity—that decrease as the cooling system size increases.Figure 5-2 illustrates the tradeoffs schematically. The following sections will deal with thedetermination of the various elements of these costs.
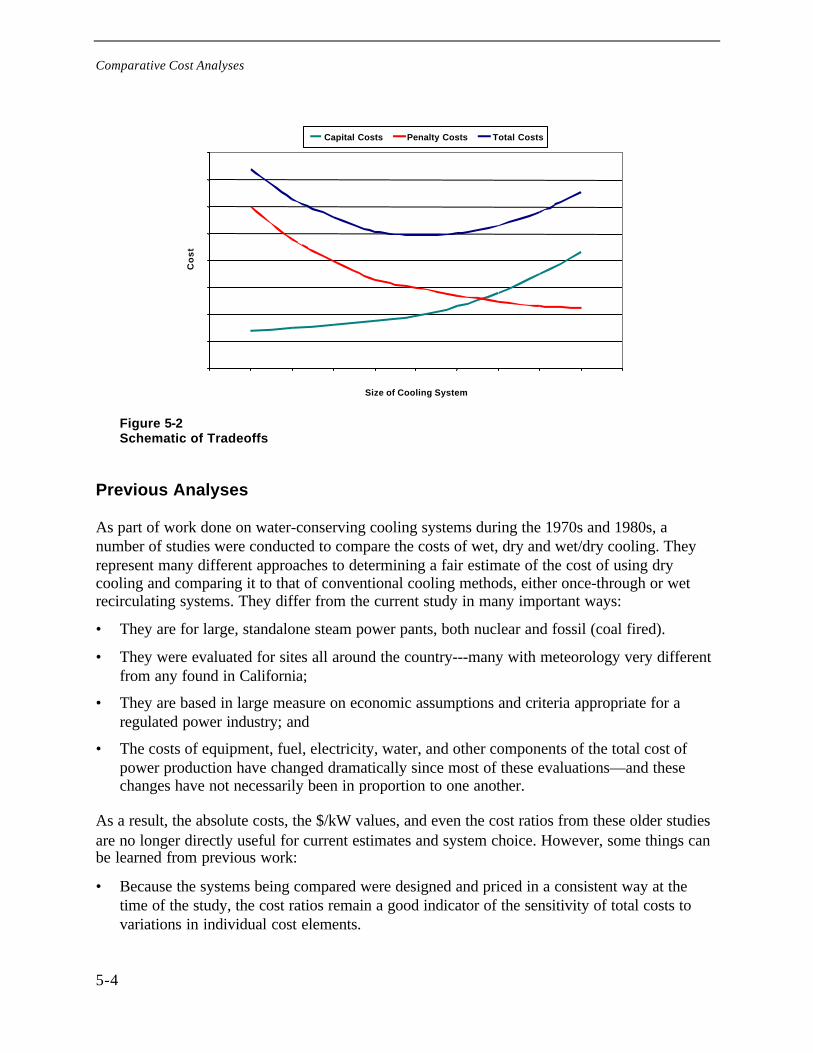
Comparative Cost Analyses
5-4
0
1
2
3
4
5
6
7
8
0 1 2 3 4 5 6 7 8 9 10
Size of Cooling System
Co
st
Capital Costs Penalty Costs Total Costs
Figure 5-2Schematic of Tradeoffs
Previous Analyses
As part of work done on water-conserving cooling systems during the 1970s and 1980s, anumber of studies were conducted to compare the costs of wet, dry and wet/dry cooling. Theyrepresent many different approaches to determining a fair estimate of the cost of using drycooling and comparing it to that of conventional cooling methods, either once-through or wetrecirculating systems. They differ from the current study in many important ways:
• They are for large, standalone steam power pants, both nuclear and fossil (coal fired).
• They were evaluated for sites all around the country---many with meteorology very differentfrom any found in California;
• They are based in large measure on economic assumptions and criteria appropriate for aregulated power industry; and
• The costs of equipment, fuel, electricity, water, and other components of the total cost ofpower production have changed dramatically since most of these evaluations—and thesechanges have not necessarily been in proportion to one another.
As a result, the absolute costs, the $/kW values, and even the cost ratios from these older studiesare no longer directly useful for current estimates and system choice. However, some things canbe learned from previous work:
• Because the systems being compared were designed and priced in a consistent way at thetime of the study, the cost ratios remain a good indicator of the sensitivity of total costs tovariations in individual cost elements.
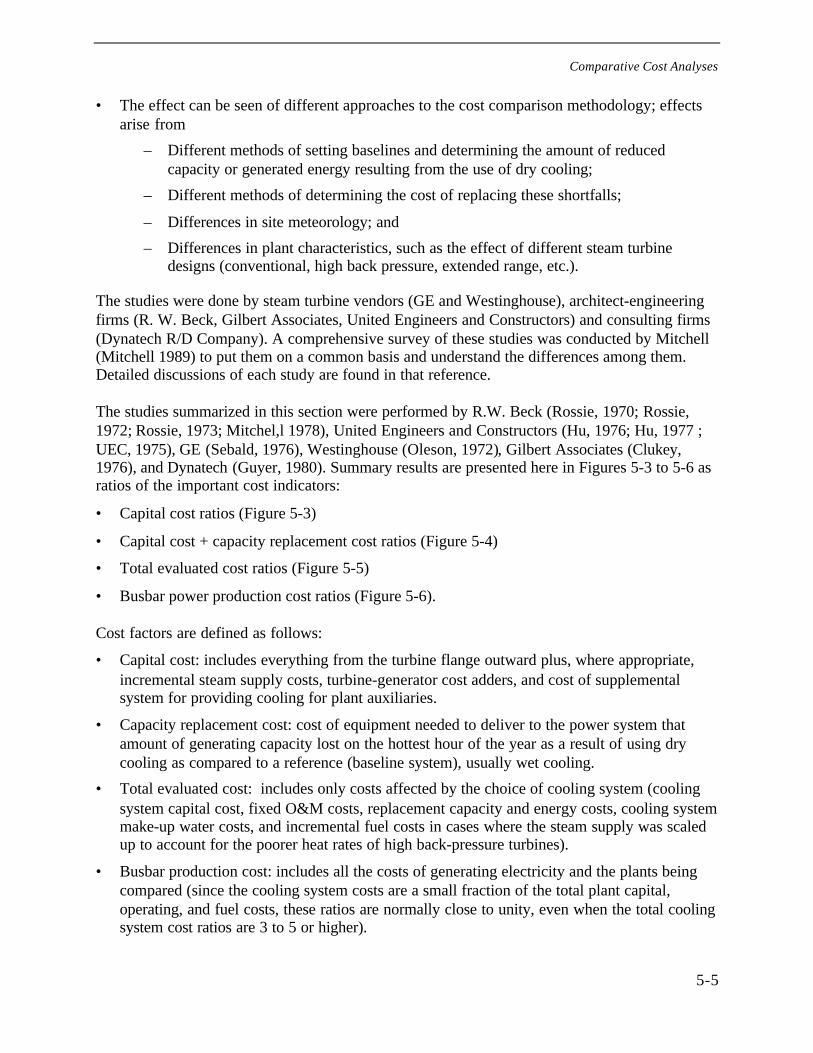
Comparative Cost Analyses
5-5
• The effect can be seen of different approaches to the cost comparison methodology; effectsarise from
– Different methods of setting baselines and determining the amount of reducedcapacity or generated energy resulting from the use of dry cooling;
– Different methods of determining the cost of replacing these shortfalls;
– Differences in site meteorology; and
– Differences in plant characteristics, such as the effect of different steam turbinedesigns (conventional, high back pressure, extended range, etc.).
The studies were done by steam turbine vendors (GE and Westinghouse), architect-engineeringfirms (R. W. Beck, Gilbert Associates, United Engineers and Constructors) and consulting firms(Dynatech R/D Company). A comprehensive survey of these studies was conducted by Mitchell(Mitchell 1989) to put them on a common basis and understand the differences among them.Detailed discussions of each study are found in that reference.
The studies summarized in this section were performed by R.W. Beck (Rossie, 1970; Rossie,1972; Rossie, 1973; Mitchel,l 1978), United Engineers and Constructors (Hu, 1976; Hu, 1977 ;UEC, 1975), GE (Sebald, 1976), Westinghouse (Oleson, 1972), Gilbert Associates (Clukey,1976), and Dynatech (Guyer, 1980). Summary results are presented here in Figures 5-3 to 5-6 asratios of the important cost indicators:
• Capital cost ratios (Figure 5-3)
• Capital cost + capacity replacement cost ratios (Figure 5-4)
• Total evaluated cost ratios (Figure 5-5)
• Busbar power production cost ratios (Figure 5-6).
Cost factors are defined as follows:
• Capital cost: includes everything from the turbine flange outward plus, where appropriate,incremental steam supply costs, turbine-generator cost adders, and cost of supplementalsystem for providing cooling for plant auxiliaries.
• Capacity replacement cost: cost of equipment needed to deliver to the power system thatamount of generating capacity lost on the hottest hour of the year as a result of using drycooling as compared to a reference (baseline system), usually wet cooling.
• Total evaluated cost: includes only costs affected by the choice of cooling system (coolingsystem capital cost, fixed O&M costs, replacement capacity and energy costs, cooling systemmake-up water costs, and incremental fuel costs in cases where the steam supply was scaledup to account for the poorer heat rates of high back-pressure turbines).
• Busbar production cost: includes all the costs of generating electricity and the plants beingcompared (since the cooling system costs are a small fraction of the total plant capital,operating, and fuel costs, these ratios are normally close to unity, even when the total coolingsystem cost ratios are 3 to 5 or higher).
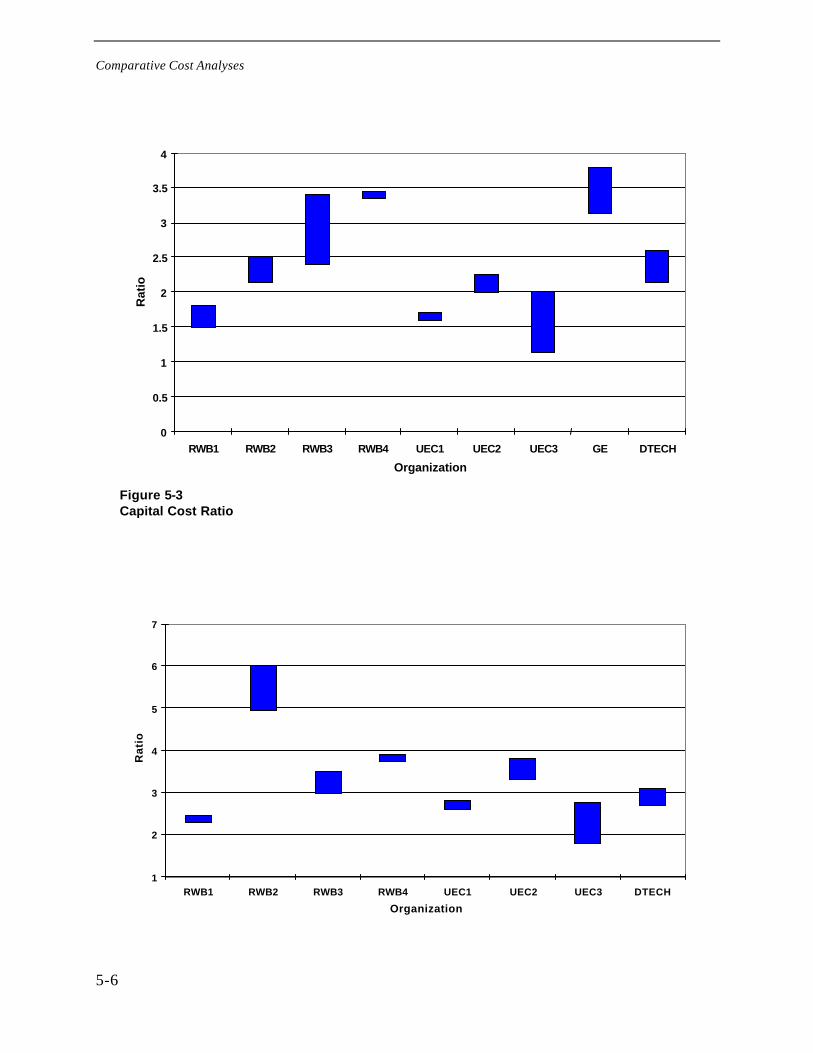
Comparative Cost Analyses
5-6
0
0.5
1
1.5
2
2.5
3
3.5
4
RWB1 RWB2 RWB3 RWB4 UEC1 UEC2 UEC3 GE DTECH
Organization
Rat
io
Figure 5-3Capital Cost Ratio
1
2
3
4
5
6
7
RWB1 RWB2 RWB3 RWB4 UEC1 UEC2 UEC3 DTECH
Organization
Ra
tio
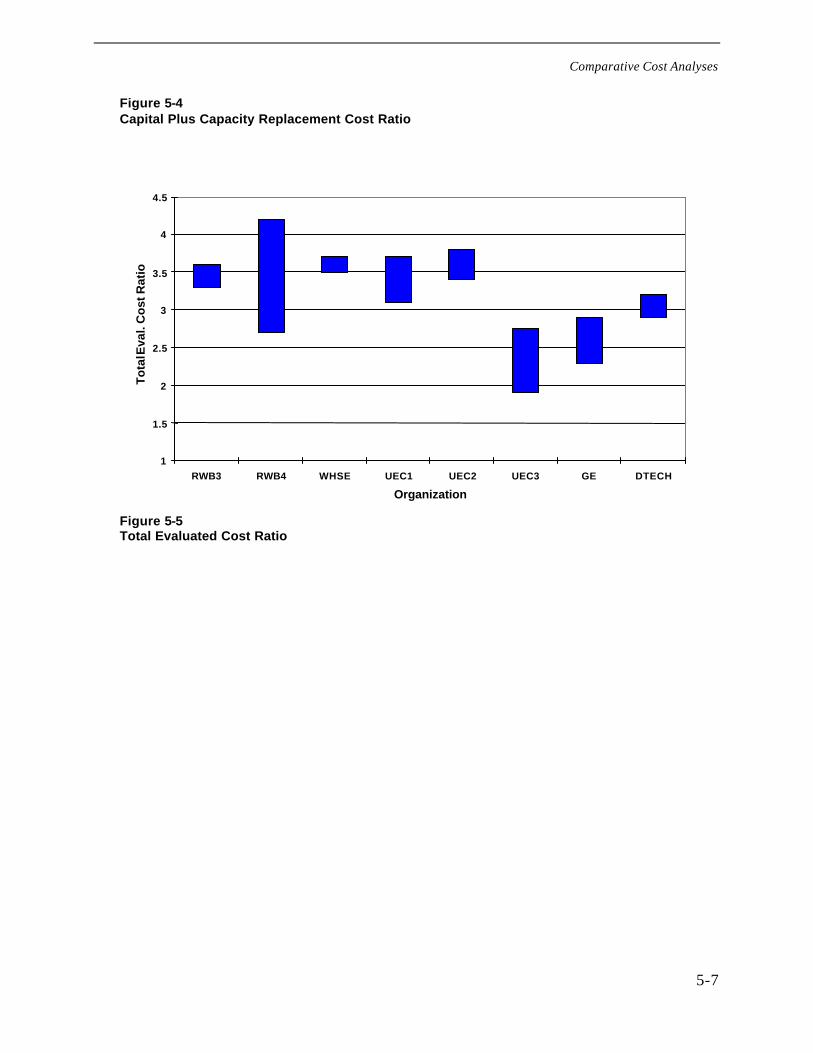
Comparative Cost Analyses
5-7
Figure 5-4Capital Plus Capacity Replacement Cost Ratio
1
1.5
2
2.5
3
3.5
4
4.5
RWB3 RWB4 WHSE UEC1 UEC2 UEC3 GE DTECH
Organization
To
tal E
val.
Co
st R
atio
Figure 5-5Total Evaluated Cost Ratio
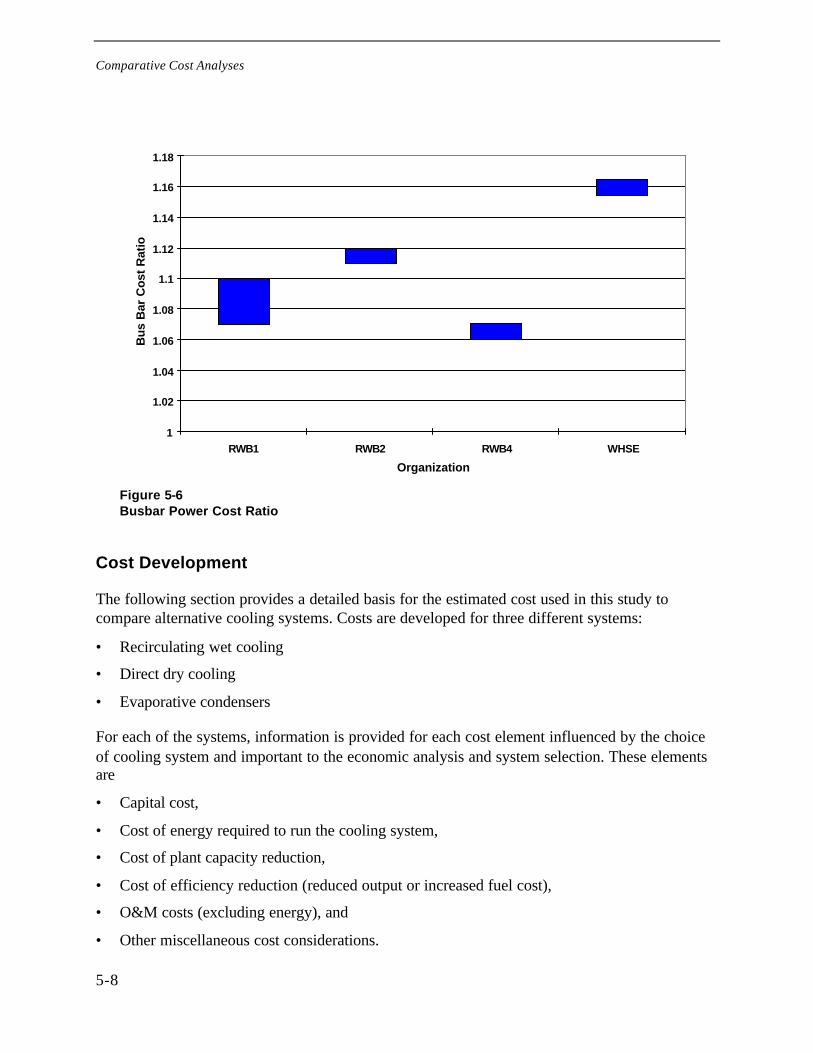
Comparative Cost Analyses
5-8
1
1.02
1.04
1.06
1.08
1.1
1.12
1.14
1.16
1.18
RWB1 RWB2 RWB4 WHSE
Organization
Bu
s B
ar C
ost
Rat
io
Figure 5-6Busbar Power Cost Ratio
Cost Development
The following section provides a detailed basis for the estimated cost used in this study tocompare alternative cooling systems. Costs are developed for three different systems:
• Recirculating wet cooling
• Direct dry cooling
• Evaporative condensers
For each of the systems, information is provided for each cost element influenced by the choiceof cooling system and important to the economic analysis and system selection. These elementsare
• Capital cost,
• Cost of energy required to run the cooling system,
• Cost of plant capacity reduction,
• Cost of efficiency reduction (reduced output or increased fuel cost),
• O&M costs (excluding energy), and
• Other miscellaneous cost considerations.
Comparative Cost Analyses
5-9
The capital cost analysis for this study was based on information assembled from a number ofsources. The primary information was provided by several of the major equipment vendors in theform of budget price estimates for four specified sites, each representative of a Californiameteorology and location. In addition, information was obtained from licensing applicationmaterial supplied by the CEC, energy industry studies, interviews with system owner/operators,and the open literature.
In some cases, the details and sources of the specific information were not for attribution.Therefore, the costs in the following sections are presented as ranges or as qualitative estimates.It is significant, however (as discussed in connection with some of the individual items), thatthere is excellent agreement among most of the estimates. There still may be substantialdifferences among cost estimates for an installation at a particular site. However, the source ofsuch differences, as will be discussed in many of the following sections, is the choice of designpoint and not differences in the estimated cost of a system of a particular size and capability.
The equipment to be included in the cost estimate is everything downstream of the turbine flangeand includes the costs of engineering, site preparation, erection, installation, and testing.Estimates of this kind cannot include the level of detail that is normally used in actual designcalculations. General cost categories of the sort found in engineering “handbooks” are used inthis analysis.
Recirculating Wet Cooling
The two major elements of a recirculating wet cooling system are the cooling tower and theshell-and-tube surface condenser. The system arrangement is shown schematically in Figure 2-3.The cost development for recirculating wet cooling is presented in the following sections:
• Surface condenser costs
• Cooling tower costs
• Capital cost elements
• Example costs
• Alternative designs: low first cost vs. total evaluated cost
• Case studies and cost correlations
Surface Steam Condenser
The steam surface condenser is one of the major cost components of a once-through or closed-cycle wet cooling system. For this study, a range of costs was developed for a conventional shell-and-tube steam condenser to be used in conjunction with a wet cooling tower.
The condenser specifications were taken from the plant operating conditions given in Section 2,specifically,
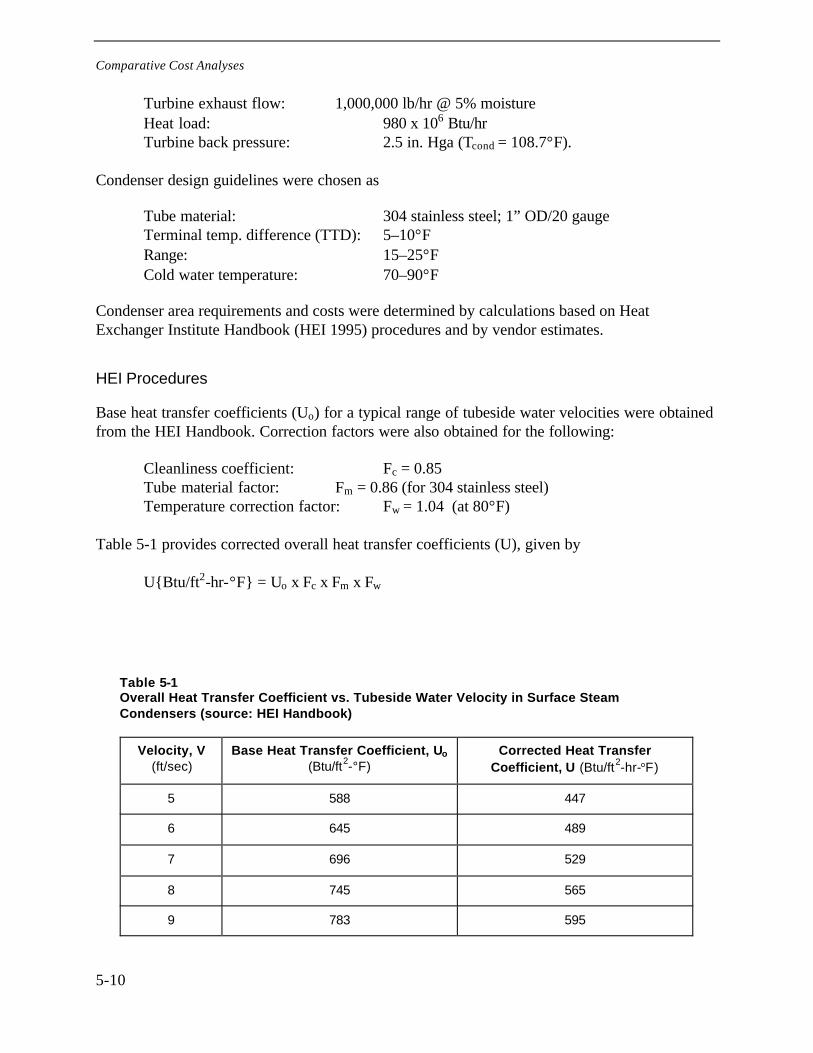
Comparative Cost Analyses
5-10
Turbine exhaust flow: 1,000,000 lb/hr @ 5% moistureHeat load: 980 x 106 Btu/hrTurbine back pressure: 2.5 in. Hga (Tcond = 108.7°F).
Condenser design guidelines were chosen as
Tube material: 304 stainless steel; 1” OD/20 gaugeTerminal temp. difference (TTD): 5–10°FRange: 15–25°FCold water temperature: 70–90°F
Condenser area requirements and costs were determined by calculations based on HeatExchanger Institute Handbook (HEI 1995) procedures and by vendor estimates.
HEI Procedures
Base heat transfer coefficients (Uo) for a typical range of tubeside water velocities were obtainedfrom the HEI Handbook. Correction factors were also obtained for the following:
Cleanliness coefficient: Fc = 0.85Tube material factor: Fm = 0.86 (for 304 stainless steel)Temperature correction factor: Fw = 1.04 (at 80°F)
Table 5-1 provides corrected overall heat transfer coefficients (U), given by
U{Btu/ft2-hr-°F} = Uo x Fc x Fm x Fw
Table 5-1Overall Heat Transfer Coefficient vs. Tubeside Water Velocity in Surface SteamCondensers (source: HEI Handbook)
Velocity, V(ft/sec)
Base Heat Transfer Coefficient, Uo
(Btu/ft2-°F)Corrected Heat Transfer
Coefficient, U (Btu/ft2-hr-°F)
5 588 447
6 645 489
7 696 529
8 745 565
9 783 595
Comparative Cost Analyses
5-11
An example calculation of the required area for a mid-range of expected operating conditions isgiven by
Areq’d = Q/U x ∆Tln mean,
where
∆Tln mean = {(Tcond – T cw in) – (Tcond – T cw ex)}/ln{(Tcond – T cw in)/(Tcond – T cw ex)}
For tube-side water velocity of 8 ft/sec, TTD of 7°F, range of 20°F, and Tcond of 109°F, it followsthat Tcw in = 82°F, Tcw ex = 102°F, ∆Tln mean = 15°F, and Areq’d = 117,075 sq ft.
Supplier Quotes
A major condenser supplier was asked to provide budget price estimates for the specified heatload, condensing temperature, and tube material for five cold water inlet temperatures from 70 to90°F. Vendor-selected design guidelines included the following:
Range = 20°F (if available)TTD = 5°F minimumTube side ∆pmax = 10 psi
All cases resulted in two tube pass designs, divided water box, carbon steel shell, tube supportplates, tube sheets, air cooling shrouds, and water boxes. Tube side velocities ranged from 7.5 to10 ft/sec and the number of tubes from 9000 to 16,000. The prices included an air ejector airremoval package. The prices were quoted “ex-works,” meaning ready for shipping on thesupplier’s loading dock. Shipping, unloading, assembly, and testing are extra to be provided byothers.
The estimated areas and budget prices are shown in Table 5-2. The sample case, based on HEIHandbook (HEI, 1995) procedures, is included in the table for comparison purposes and showsexcellent agreement.
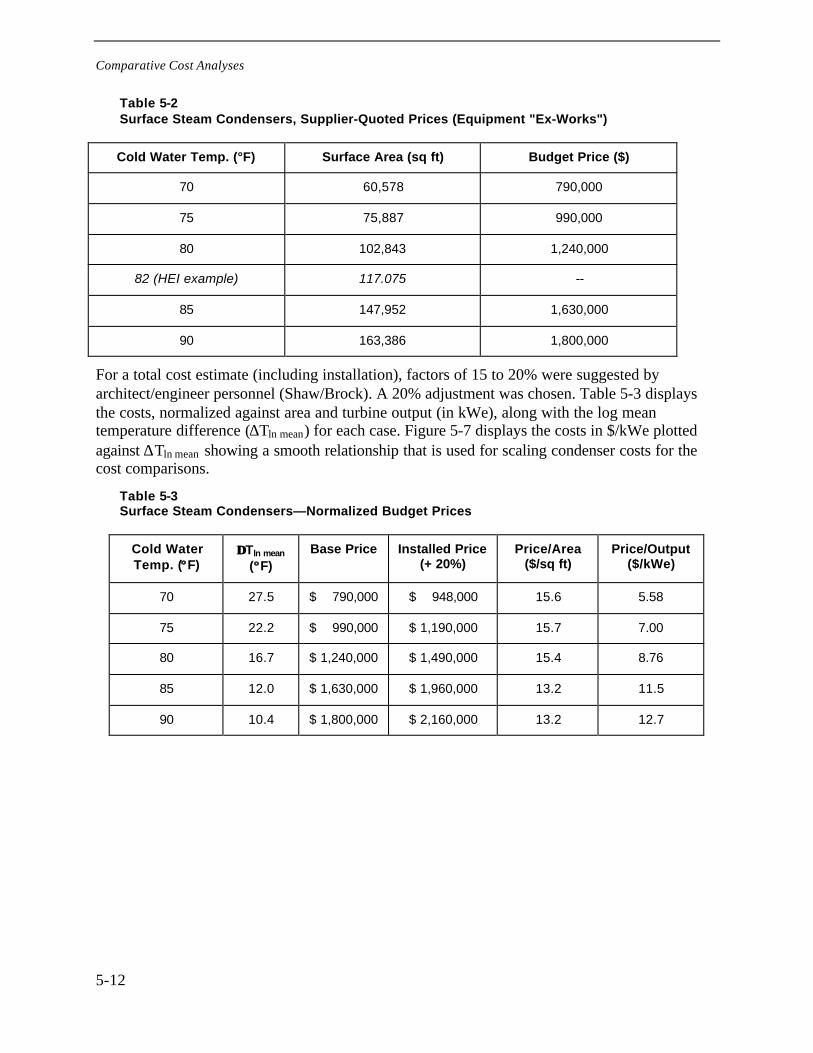
Comparative Cost Analyses
5-12
Table 5-2Surface Steam Condensers, Supplier-Quoted Prices (Equipment "Ex-Works")
Cold Water Temp. (°F) Surface Area (sq ft) Budget Price ($)
70 60,578 790,000
75 75,887 990,000
80 102,843 1,240,000
82 (HEI example) 117.075 --
85 147,952 1,630,000
90 163,386 1,800,000
For a total cost estimate (including installation), factors of 15 to 20% were suggested byarchitect/engineer personnel (Shaw/Brock). A 20% adjustment was chosen. Table 5-3 displaysthe costs, normalized against area and turbine output (in kWe), along with the log meantemperature difference (∆Tln mean) for each case. Figure 5-7 displays the costs in $/kWe plottedagainst ∆Tln mean showing a smooth relationship that is used for scaling condenser costs for thecost comparisons.
Table 5-3Surface Steam Condensers—Normalized Budget Prices
Cold WaterTemp. (°° F)
∆∆Tln mean
(°° F)Base Price Installed Price
(+ 20%)Price/Area
($/sq ft)Price/Output
($/kWe)
70 27.5 $ 790,000 $ 948,000 15.6 5.58
75 22.2 $ 990,000 $ 1,190,000 15.7 7.00
80 16.7 $ 1,240,000 $ 1,490,000 15.4 8.76
85 12.0 $ 1,630,000 $ 1,960,000 13.2 11.5
90 10.4 $ 1,800,000 $ 2,160,000 13.2 12.7

Comparative Cost Analyses
5-13
Condenser Installed Costs
($/kWe) = 91.404(LMTD)-0.8364
0
5
1 0
1 5
0 5 1 0 1 5 2 0 2 5 3 0
L o g M e a n T e m p . D i f f e r e n c e , d e g . F
$/k
We
Figure 5-7Supplier Quote Correlation
Comparison with Published Costs
As a final “sanity check,” a comparison was made with some values found in the technicalliterature and in submissions to licensing hearings. The three sources used were
• Material submitted as part of the Elk Hills (Miller, 2000) licensing hearings,
• Material submitted as part of High Desert Power Project licensing hearings (Ledford, 1999),and
• Hutton (1999), in which wet towers and surface condensers are compared with evaporativecondensers.
Detailed information on the particular design values used in each case is not necessarilyavailable, nor is it always known whether installation, delivery, engineering, or othercontingencies are included. Therefore, these comparisons are simply to determine whether thevalues are in the general range that would be predicted by the correlation used in this study.
Costs given for the 170-MWe (steam) Elk Hills plant (Miller, 2000) and the 240-MWe (steam)High Desert Power Project (Ledford, 1999) are $1.9 and $2.9 million respectively, correspondingto $11/kWe and $12.1/kWe. No information was available to calculate either the log meantemperature difference or the cost per unit area, but the points fall within the range of costsshown in Table 5-3 and Figure 5-7.
The case studies presented by Hutton (1999) range from $8 to $12.5/kWe, corresponding to themiddle to high end of the range shown in Figure 5-7 using a conversion of 1,000,000 lb/hr steamflow being equivalent to 170MWe. However, the cost per square foot in those case studies wasapparently fixed at $25, considerably higher than the values developed above.
Comparative Cost Analyses
5-14
Two differences may account for the lack of agreement. The tube materials in the analysis byHutton (1999) were copper (presumably Cu-Ni or Admiralty, but not specified) rather than 304stainless steel, and the unit sizes ranged from 100,000 to 400,000 lb/hr in steam flow, ascompared to 1,000,000 lb/hr. An informal consultation with the vendor that supplied theestimates in Table 5-2 suggests that these differences might result in “budget prices” in the $15to $20/sq ft range. This translates to an “installed price” range of $18 to $25/sq ft, approachingthat of Hutton (1999).
Wet Cooling Towers
The base system chosen to represent recirculating wet cooling is the mechanical draft, cross-flowwet cooling tower in the traditional in-line arrangement of cells to form a rectangular tower (asshown schematically in Figure 2-4). This choice, while giving up some performance andefficiency advantage to counter-flow designs, has initial cost, maintenance, and operabilityadvantages, certainly in comparison with natural draft or circular mechanical draft designs. Thisis particularly true for the modest sizes required for the steam-cycle portion of combined-cycleplants, typical of the current California market.
The major capital cost elements are characterized in Table 5-4. Table 5-5 provides a typical costbreakdown by cost element for a selected case study example, the Central Valley Site (designedfor 2.5 in. Hga at average seasonal temperature and humidity: Tavg. dry bulb = 67°F; Tavg. wet bulb =60°F).
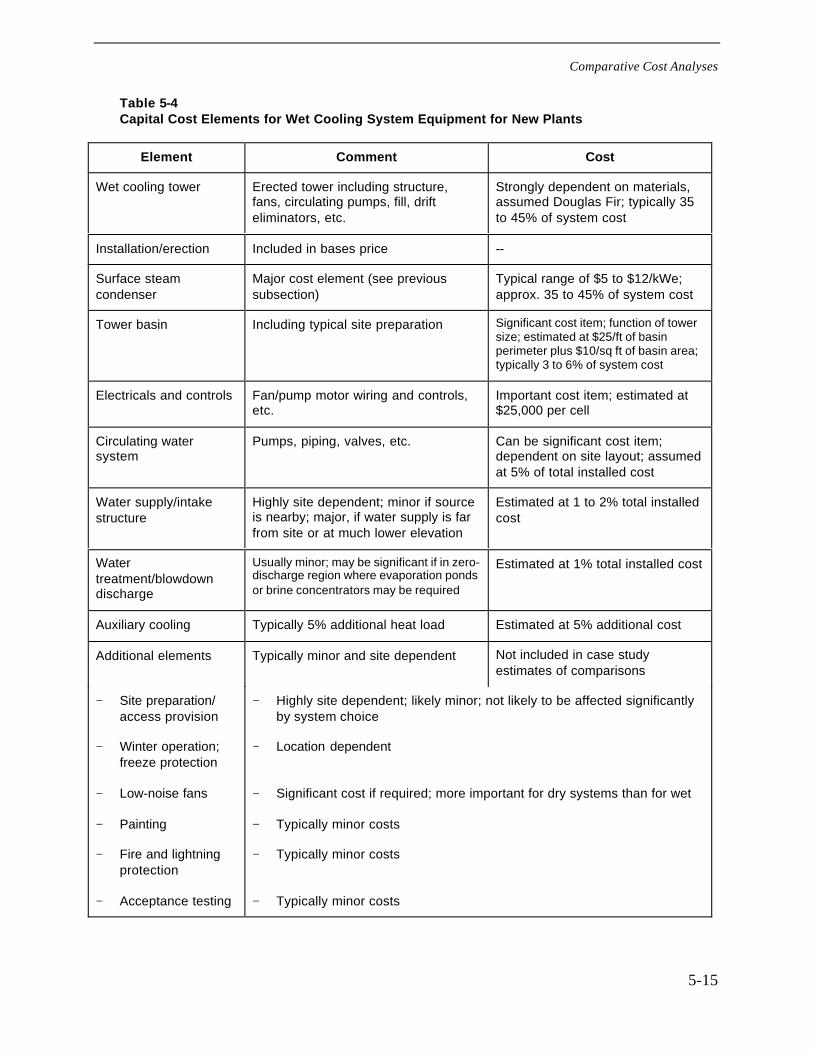
Comparative Cost Analyses
5-15
Table 5-4Capital Cost Elements for Wet Cooling System Equipment for New Plants
Element Comment Cost
Wet cooling tower Erected tower including structure,fans, circulating pumps, fill, drifteliminators, etc.
Strongly dependent on materials,assumed Douglas Fir; typically 35to 45% of system cost
Installation/erection Included in bases price --
Surface steamcondenser
Major cost element (see previoussubsection)
Typical range of $5 to $12/kWe;approx. 35 to 45% of system cost
Tower basin Including typical site preparation Significant cost item; function of towersize; estimated at $25/ft of basinperimeter plus $10/sq ft of basin area;typically 3 to 6% of system cost
Electricals and controls Fan/pump motor wiring and controls,etc.
Important cost item; estimated at$25,000 per cell
Circulating watersystem
Pumps, piping, valves, etc. Can be significant cost item;dependent on site layout; assumedat 5% of total installed cost
Water supply/intakestructure
Highly site dependent; minor if sourceis nearby; major, if water supply is farfrom site or at much lower elevation
Estimated at 1 to 2% total installedcost
Watertreatment/blowdowndischarge
Usually minor; may be significant if in zero-discharge region where evaporation pondsor brine concentrators may be required
Estimated at 1% total installed cost
Auxiliary cooling Typically 5% additional heat load Estimated at 5% additional cost
Additional elements Typically minor and site dependent Not included in case studyestimates of comparisons
− Site preparation/access provision
− Winter operation;freeze protection
− Low-noise fans
− Painting
− Fire and lightningprotection
− Acceptance testing
− Highly site dependent; likely minor; not likely to be affected significantlyby system choice
− Location dependent
− Significant cost if required; more important for dry systems than for wet
− Typically minor costs
− Typically minor costs
− Typically minor costs
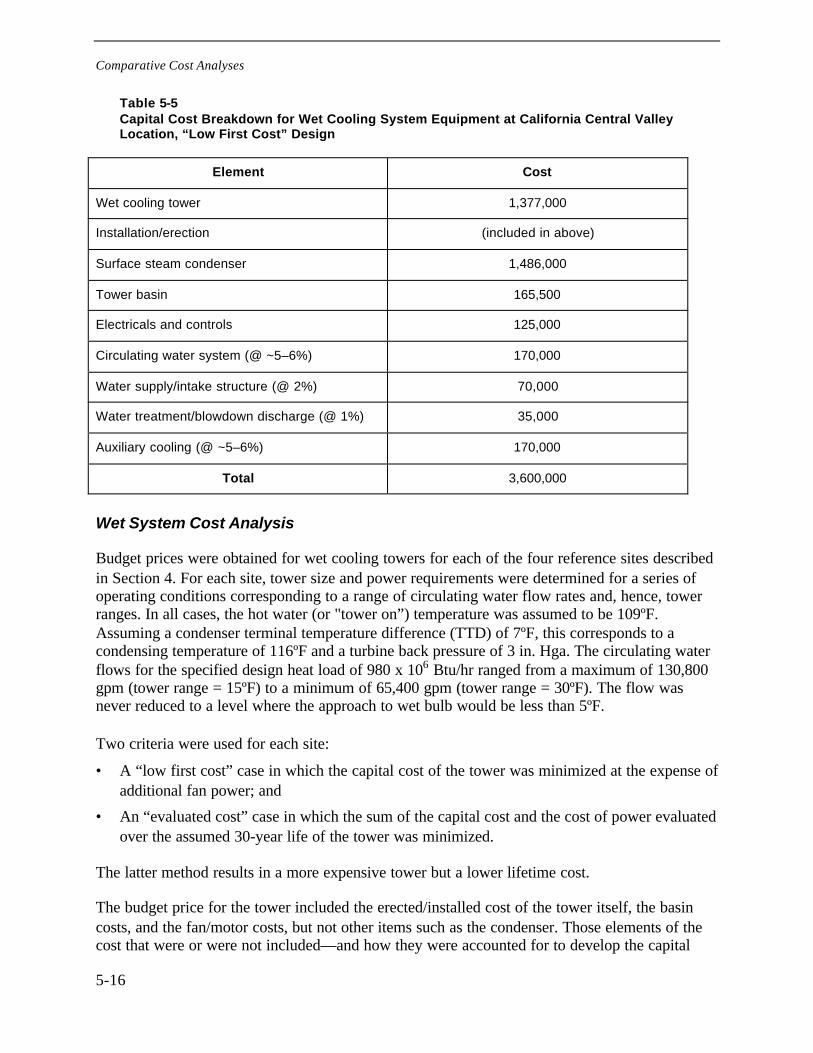
Comparative Cost Analyses
5-16
Table 5-5Capital Cost Breakdown for Wet Cooling System Equipment at California Central ValleyLocation, “Low First Cost” Design
Element Cost
Wet cooling tower 1,377,000
Installation/erection (included in above)
Surface steam condenser 1,486,000
Tower basin 165,500
Electricals and controls 125,000
Circulating water system (@ ~5–6%) 170,000
Water supply/intake structure (@ 2%) 70,000
Water treatment/blowdown discharge (@ 1%) 35,000
Auxiliary cooling (@ ~5–6%) 170,000
Total 3,600,000
Wet System Cost Analysis
Budget prices were obtained for wet cooling towers for each of the four reference sites describedin Section 4. For each site, tower size and power requirements were determined for a series ofoperating conditions corresponding to a range of circulating water flow rates and, hence, towerranges. In all cases, the hot water (or "tower on”) temperature was assumed to be 109ºF.Assuming a condenser terminal temperature difference (TTD) of 7ºF, this corresponds to acondensing temperature of 116ºF and a turbine back pressure of 3 in. Hga. The circulating waterflows for the specified design heat load of 980 x 106 Btu/hr ranged from a maximum of 130,800gpm (tower range = 15ºF) to a minimum of 65,400 gpm (tower range = 30ºF). The flow wasnever reduced to a level where the approach to wet bulb would be less than 5ºF.
Two criteria were used for each site:
• A “low first cost” case in which the capital cost of the tower was minimized at the expense ofadditional fan power; and
• An “evaluated cost” case in which the sum of the capital cost and the cost of power evaluatedover the assumed 30-year life of the tower was minimized.
The latter method results in a more expensive tower but a lower lifetime cost.
The budget price for the tower included the erected/installed cost of the tower itself, the basincosts, and the fan/motor costs, but not other items such as the condenser. Those elements of thecost that were or were not included—and how they were accounted for to develop the capital
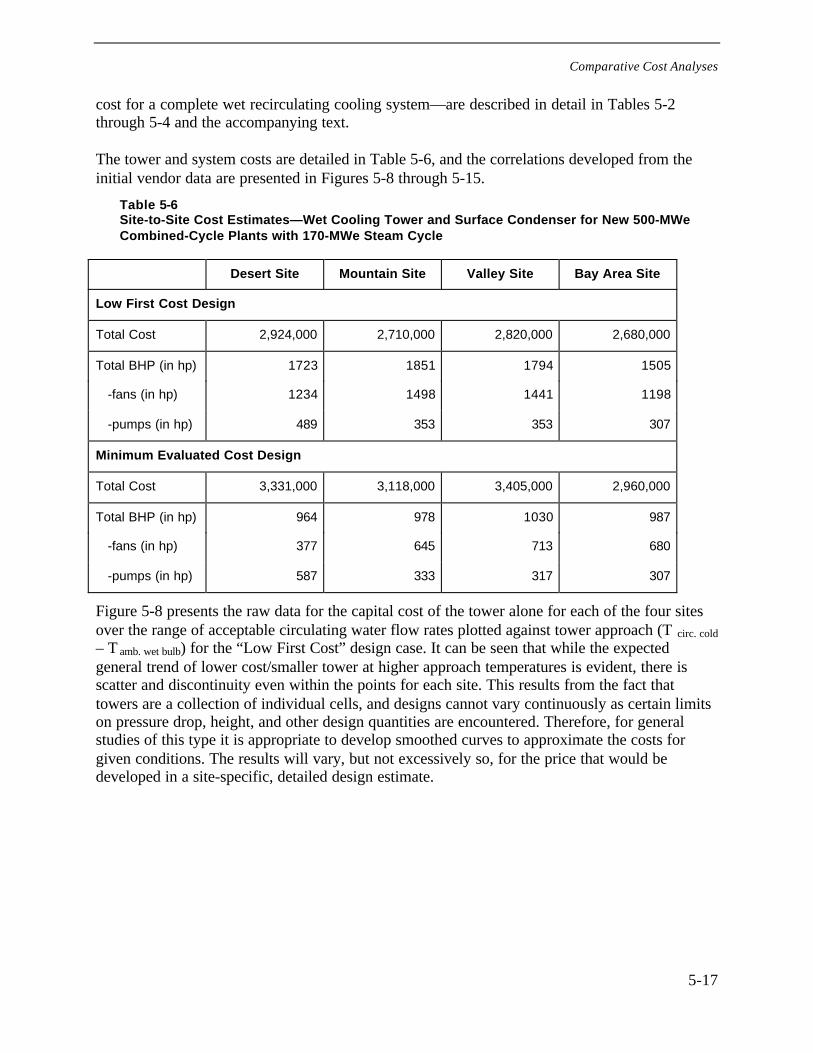
Comparative Cost Analyses
5-17
cost for a complete wet recirculating cooling system—are described in detail in Tables 5-2through 5-4 and the accompanying text.
The tower and system costs are detailed in Table 5-6, and the correlations developed from theinitial vendor data are presented in Figures 5-8 through 5-15.
Table 5-6Site-to-Site Cost Estimates—Wet Cooling Tower and Surface Condenser for New 500-MWeCombined-Cycle Plants with 170-MWe Steam Cycle
Desert Site Mountain Site Valley Site Bay Area Site
Low First Cost Design
Total Cost 2,924,000 2,710,000 2,820,000 2,680,000
Total BHP (in hp) 1723 1851 1794 1505
-fans (in hp) 1234 1498 1441 1198
-pumps (in hp) 489 353 353 307
Minimum Evaluated Cost Design
Total Cost 3,331,000 3,118,000 3,405,000 2,960,000
Total BHP (in hp) 964 978 1030 987
-fans (in hp) 377 645 713 680
-pumps (in hp) 587 333 317 307
Figure 5-8 presents the raw data for the capital cost of the tower alone for each of the four sitesover the range of acceptable circulating water flow rates plotted against tower approach (T circ. cold– T amb. wet bulb) for the “Low First Cost” design case. It can be seen that while the expectedgeneral trend of lower cost/smaller tower at higher approach temperatures is evident, there isscatter and discontinuity even within the points for each site. This results from the fact thattowers are a collection of individual cells, and designs cannot vary continuously as certain limitson pressure drop, height, and other design quantities are encountered. Therefore, for generalstudies of this type it is appropriate to develop smoothed curves to approximate the costs forgiven conditions. The results will vary, but not excessively so, for the price that would bedeveloped in a site-specific, detailed design estimate.
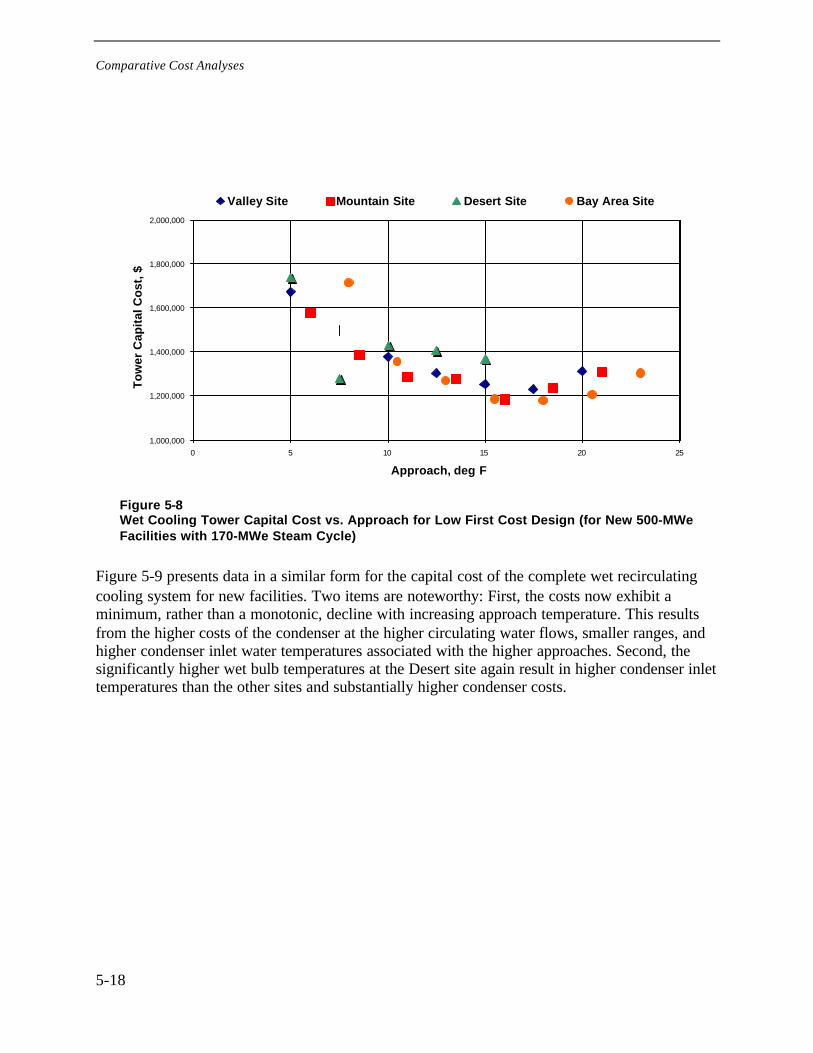
Comparative Cost Analyses
5-18
1,000,000
1,200,000
1,400,000
1,600,000
1,800,000
2,000,000
0 5 10 15 20 25
Approach, deg F
To
wer
Cap
ital
Co
st, $
Valley Site Mountain Site Desert Site Bay Area Site
Figure 5-8Wet Cooling Tower Capital Cost vs. Approach for Low First Cost Design (for New 500-MWeFacilities with 170-MWe Steam Cycle)
Figure 5-9 presents data in a similar form for the capital cost of the complete wet recirculatingcooling system for new facilities. Two items are noteworthy: First, the costs now exhibit aminimum, rather than a monotonic, decline with increasing approach temperature. This resultsfrom the higher costs of the condenser at the higher circulating water flows, smaller ranges, andhigher condenser inlet water temperatures associated with the higher approaches. Second, thesignificantly higher wet bulb temperatures at the Desert site again result in higher condenser inlettemperatures than the other sites and substantially higher condenser costs.
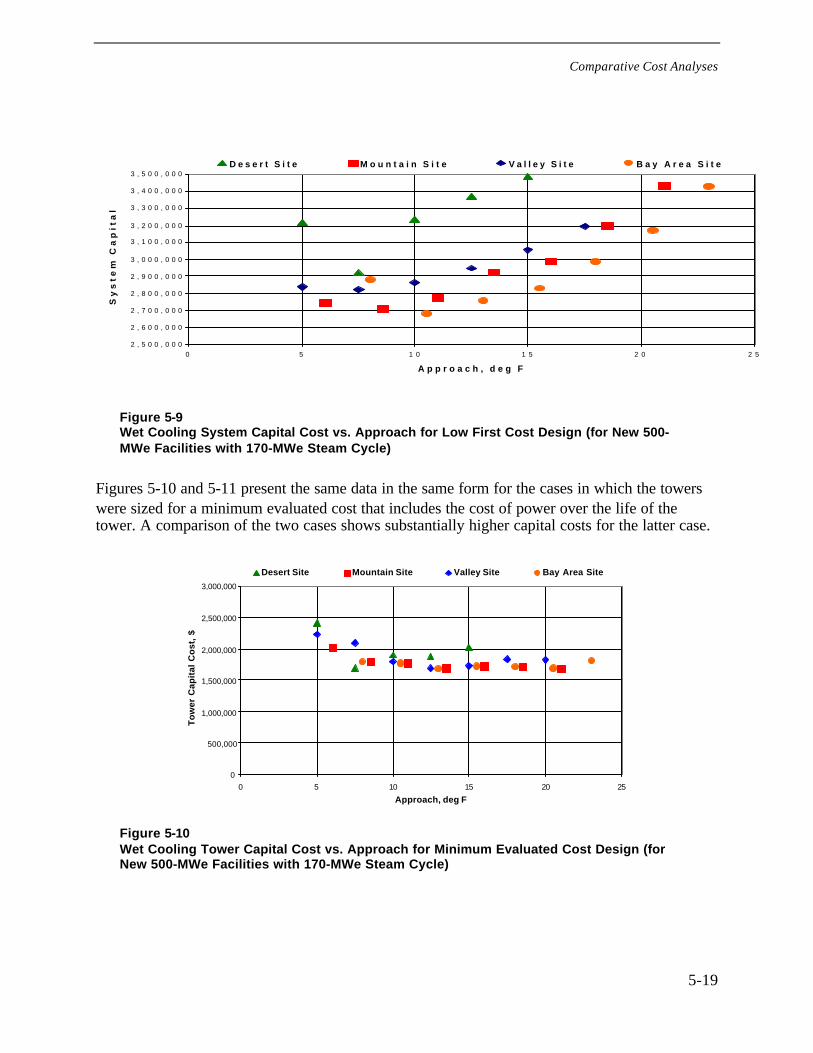
Comparative Cost Analyses
5-19
2 , 5 0 0 , 0 0 0
2 , 6 0 0 , 0 0 0
2 , 7 0 0 , 0 0 0
2 , 8 0 0 , 0 0 0
2 , 9 0 0 , 0 0 0
3 , 0 0 0 , 0 0 0
3 , 1 0 0 , 0 0 0
3 , 2 0 0 , 0 0 0
3 , 3 0 0 , 0 0 0
3 , 4 0 0 , 0 0 0
3 , 5 0 0 , 0 0 0
0 5 1 0 1 5 2 0 2 5
A p p r o a c h , d e g F
Sy
st
em
Ca
pit
al
Co
st
, $ D e s e r t S i t e M o u n t a i n S i t e V a l l e y S i t e B a y A r e a S i t e
Figure 5-9Wet Cooling System Capital Cost vs. Approach for Low First Cost Design (for New 500-MWe Facilities with 170-MWe Steam Cycle)
Figures 5-10 and 5-11 present the same data in the same form for the cases in which the towerswere sized for a minimum evaluated cost that includes the cost of power over the life of thetower. A comparison of the two cases shows substantially higher capital costs for the latter case.
0
500,000
1,000,000
1,500,000
2,000,000
2,500,000
3,000,000
0 5 10 15 20 25
Approach, deg F
To
wer
Cap
ital
Co
st,
$
Desert Site Mountain Site Valley Site Bay Area Site
Figure 5-10Wet Cooling Tower Capital Cost vs. Approach for Minimum Evaluated Cost Design (forNew 500-MWe Facilities with 170-MWe Steam Cycle)
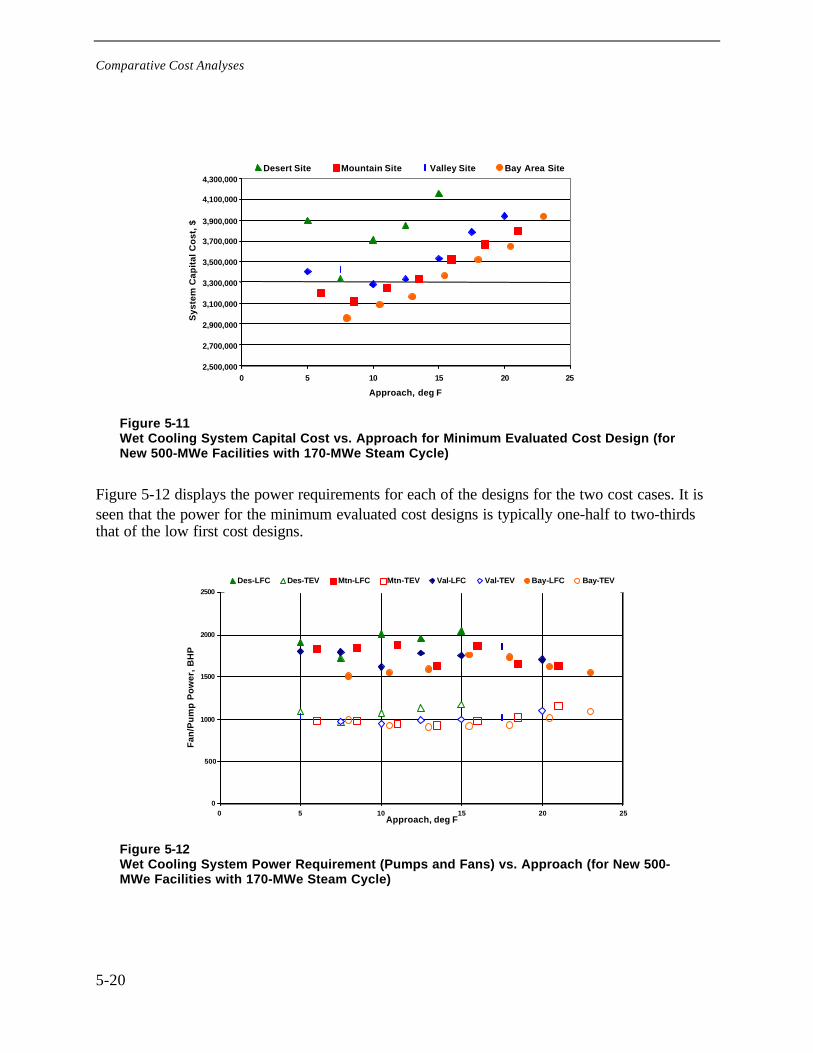
Comparative Cost Analyses
5-20
2,500,000
2,700,000
2,900,000
3,100,000
3,300,000
3,500,000
3,700,000
3,900,000
4,100,000
4,300,000
0 5 10 15 20 25
Approach, deg F
Sys
tem
Cap
ital
Co
st,
$
Desert Site Mountain Site Valley Site Bay Area Site
Figure 5-11Wet Cooling System Capital Cost vs. Approach for Minimum Evaluated Cost Design (forNew 500-MWe Facilities with 170-MWe Steam Cycle)
Figure 5-12 displays the power requirements for each of the designs for the two cost cases. It isseen that the power for the minimum evaluated cost designs is typically one-half to two-thirdsthat of the low first cost designs.
0
500
1000
1500
2000
2500
0 5 10 15 20 25Approach, deg F
Fan
/Pu
mp
Po
wer
, B
HP
Des-LFC Des-TEV Mtn-LFC Mtn-TEV Val-LFC Val-TEV Bay-LFC Bay-TEV
Figure 5-12Wet Cooling System Power Requirement (Pumps and Fans) vs. Approach (for New 500-MWe Facilities with 170-MWe Steam Cycle)

Comparative Cost Analyses
5-21
The cost of the power required to operate the pumps and fans of the cooling system is bornecontinuously for the life of the plant. In order to put these continuing future costs on a commonbasis with the initial capital costs, they have been converted into an “evaluated cost per kW.”The evaluated cost of a future lost kW depends on many factors—the value of the energy itwould have generated, an anticipated escalation or inflation rate, an expected discount rate, and amarginal tax rate and the life of the plant over which the costs are to be borne.
The values chosen for evaluating the cooling system power costs are an energy cost of$60/MWh, a 6.7% discount rate, a 3% escalation, a 50% tax rate, and a 30-year plant life. Theseresult in an evaluated power cost of $3625/kW. These parameters were selected in discussionswith vendors, users, and the CEC as reasonable values for the power industry situation inCalifornia at the present time. All of these values are subject to significant variability and debate,and a complete parametric treatment would be valuable. It is beyond the scope of this study atthis time, however. Therefore, this method for evaluating power costs for comparison andoptimization purposes will be used throughout the study, with energy cost varied in the treatmentof penalty costs.
Figures 5-13 and 5-14 show the actual total evaluated cost of each of the cases, where the powercosts are evaluated as described above.
5,000,000
6,000,000
7,000,000
8,000,000
9,000,000
10,000,000
0 5 10 15 20 25Approach, deg F
To
tal
Eva
luat
ed C
ost
, $
Desert Site Mountain Site Valley Site Bay Area Site
Figure 5-13Wet Cooling System Total Evaluated Cost vs. Approach for Low First Cost Design (for New500-MWe Facilities with 170-MWe Steam Cycle)
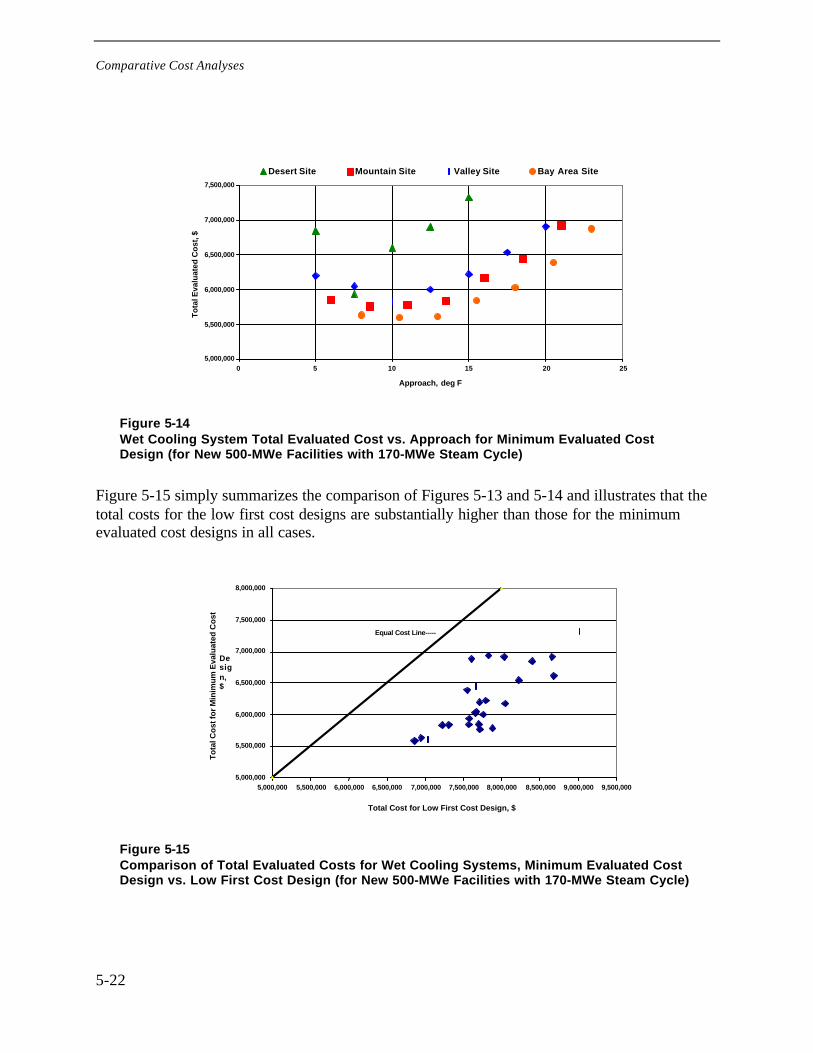
Comparative Cost Analyses
5-22
5,000,000
5,500,000
6,000,000
6,500,000
7,000,000
7,500,000
0 5 10 15 20 25
Approach, deg F
To
tal E
valu
ated
Co
st, $
Desert Site Mountain Site Valley Site Bay Area Site
Figure 5-14Wet Cooling System Total Evaluated Cost vs. Approach for Minimum Evaluated CostDesign (for New 500-MWe Facilities with 170-MWe Steam Cycle)
Figure 5-15 simply summarizes the comparison of Figures 5-13 and 5-14 and illustrates that thetotal costs for the low first cost designs are substantially higher than those for the minimumevaluated cost designs in all cases.
5,000,000
5,500,000
6,000,000
6,500,000
7,000,000
7,500,000
8,000,000
5,000,000 5,500,000 6,000,000 6,500,000 7,000,000 7,500,000 8,000,000 8,500,000 9,000,000 9,500,000
Total Cost for Low First Cost Design, $
To
tal C
ost
for
Min
imu
m E
valu
ated
Co
st
Design,$
Equal Cost Line-----
Figure 5-15Comparison of Total Evaluated Costs for Wet Cooling Systems, Minimum Evaluated CostDesign vs. Low First Cost Design (for New 500-MWe Facilities with 170-MWe Steam Cycle)
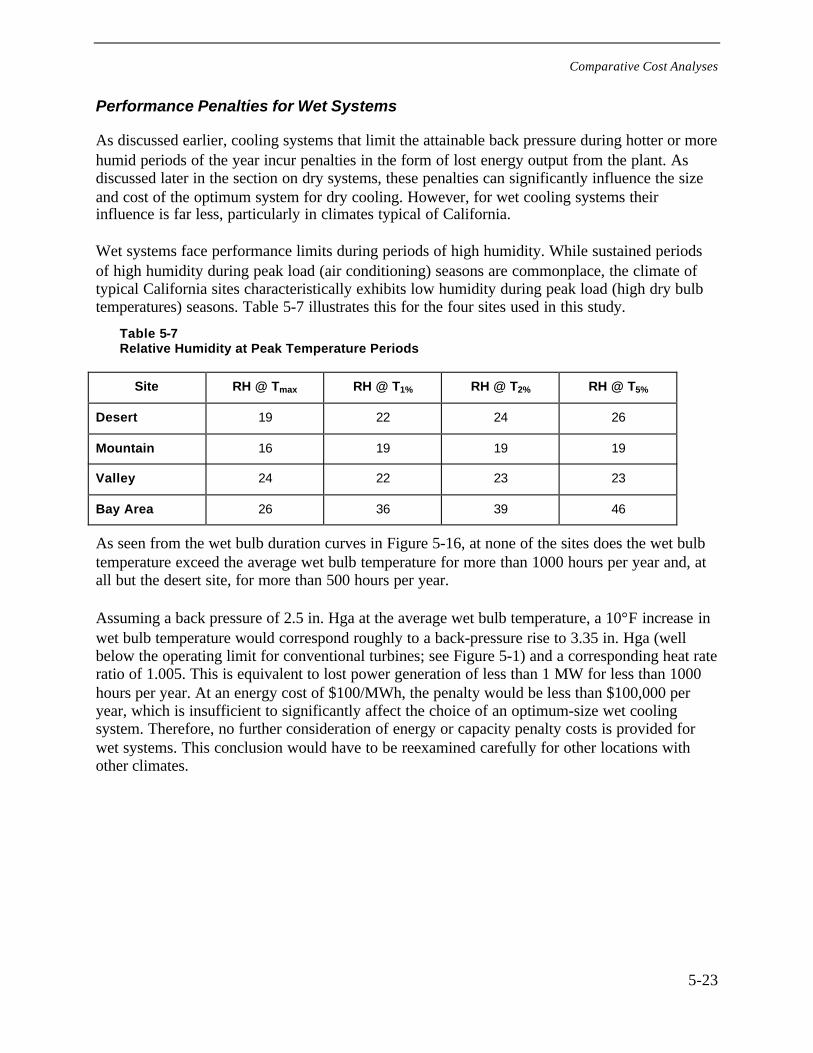
Comparative Cost Analyses
5-23
Performance Penalties for Wet Systems
As discussed earlier, cooling systems that limit the attainable back pressure during hotter or morehumid periods of the year incur penalties in the form of lost energy output from the plant. Asdiscussed later in the section on dry systems, these penalties can significantly influence the sizeand cost of the optimum system for dry cooling. However, for wet cooling systems theirinfluence is far less, particularly in climates typical of California.
Wet systems face performance limits during periods of high humidity. While sustained periodsof high humidity during peak load (air conditioning) seasons are commonplace, the climate oftypical California sites characteristically exhibits low humidity during peak load (high dry bulbtemperatures) seasons. Table 5-7 illustrates this for the four sites used in this study.
Table 5-7Relative Humidity at Peak Temperature Periods
Site RH @ Tmax RH @ T1% RH @ T2% RH @ T5%
Desert 19 22 24 26
Mountain 16 19 19 19
Valley 24 22 23 23
Bay Area 26 36 39 46
As seen from the wet bulb duration curves in Figure 5-16, at none of the sites does the wet bulbtemperature exceed the average wet bulb temperature for more than 1000 hours per year and, atall but the desert site, for more than 500 hours per year.
Assuming a back pressure of 2.5 in. Hga at the average wet bulb temperature, a 10°F increase inwet bulb temperature would correspond roughly to a back-pressure rise to 3.35 in. Hga (wellbelow the operating limit for conventional turbines; see Figure 5-1) and a corresponding heat rateratio of 1.005. This is equivalent to lost power generation of less than 1 MW for less than 1000hours per year. At an energy cost of $100/MWh, the penalty would be less than $100,000 peryear, which is insufficient to significantly affect the choice of an optimum-size wet coolingsystem. Therefore, no further consideration of energy or capacity penalty costs is provided forwet systems. This conclusion would have to be reexamined carefully for other locations withother climates.
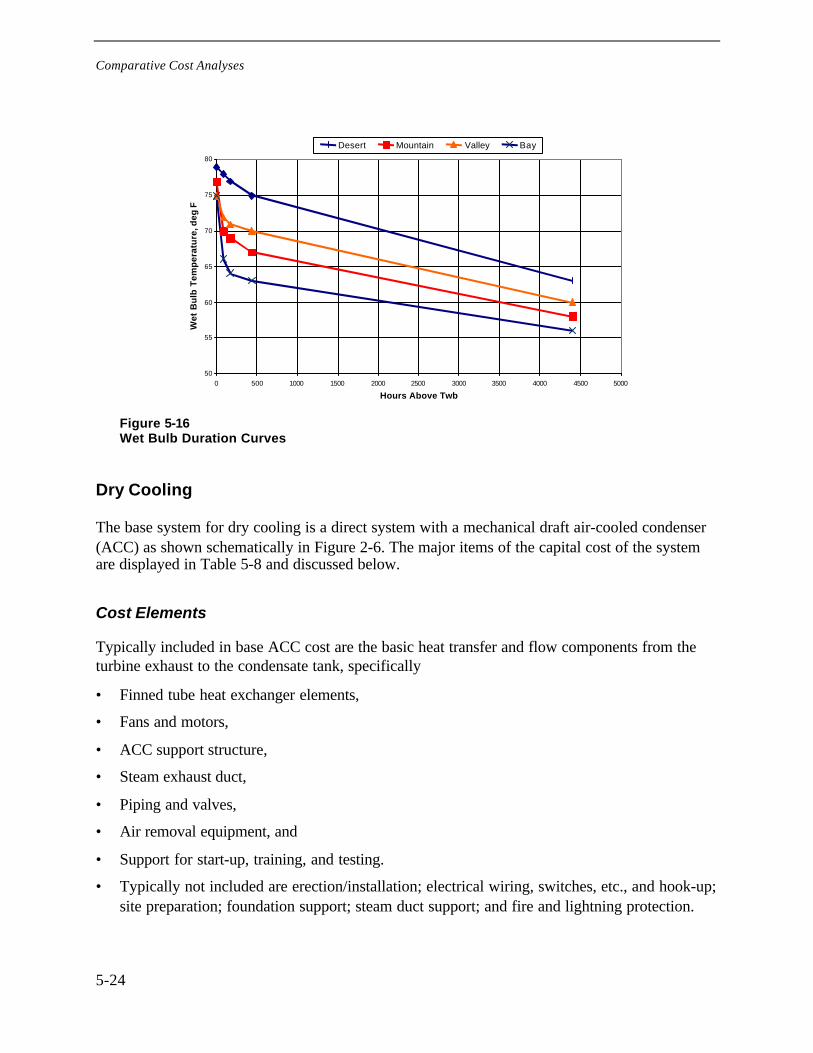
Comparative Cost Analyses
5-24
50
55
60
65
70
75
80
0 500 1000 1500 2000 2500 3000 3500 4000 4500 5000
Hours Above Twb
Wet
Bu
lb T
emp
erat
ure
, deg
F
Desert Mountain Valley Bay
Figure 5-16Wet Bulb Duration Curves
Dry Cooling
The base system for dry cooling is a direct system with a mechanical draft air-cooled condenser(ACC) as shown schematically in Figure 2-6. The major items of the capital cost of the systemare displayed in Table 5-8 and discussed below.
Cost Elements
Typically included in base ACC cost are the basic heat transfer and flow components from theturbine exhaust to the condensate tank, specifically
• Finned tube heat exchanger elements,
• Fans and motors,
• ACC support structure,
• Steam exhaust duct,
• Piping and valves,
• Air removal equipment, and
• Support for start-up, training, and testing.
• Typically not included are erection/installation; electrical wiring, switches, etc., and hook-up;site preparation; foundation support; steam duct support; and fire and lightning protection.
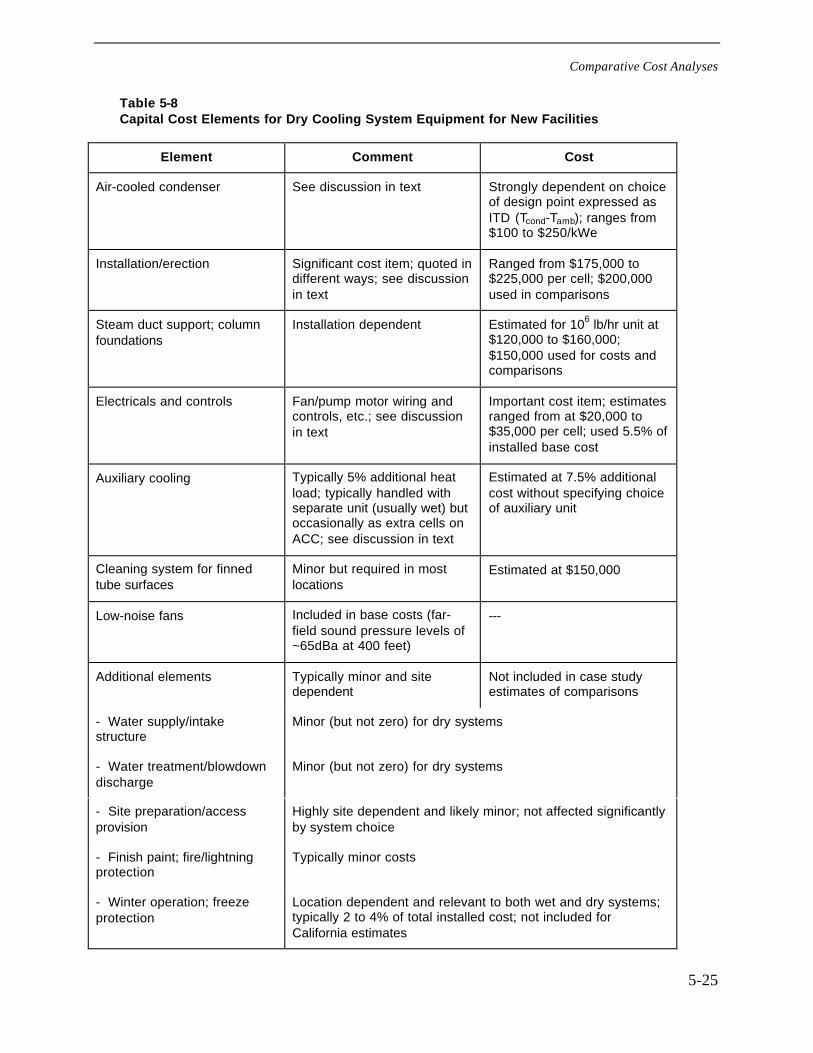
Comparative Cost Analyses
5-25
Table 5-8Capital Cost Elements for Dry Cooling System Equipment for New Facilities
Element Comment Cost
Air-cooled condenser See discussion in text Strongly dependent on choiceof design point expressed asITD (Tcond-Tamb); ranges from$100 to $250/kWe
Installation/erection Significant cost item; quoted indifferent ways; see discussionin text
Ranged from $175,000 to$225,000 per cell; $200,000used in comparisons
Steam duct support; columnfoundations
Installation dependent Estimated for 106 lb/hr unit at$120,000 to $160,000;$150,000 used for costs andcomparisons
Electricals and controls Fan/pump motor wiring andcontrols, etc.; see discussionin text
Important cost item; estimatesranged from at $20,000 to$35,000 per cell; used 5.5% ofinstalled base cost
Auxiliary cooling Typically 5% additional heatload; typically handled withseparate unit (usually wet) butoccasionally as extra cells onACC; see discussion in text
Estimated at 7.5% additionalcost without specifying choiceof auxiliary unit
Cleaning system for finnedtube surfaces
Minor but required in mostlocations
Estimated at $150,000
Low-noise fans Included in base costs (far-field sound pressure levels of~65dBa at 400 feet)
---
Additional elements Typically minor and sitedependent
Not included in case studyestimates of comparisons
- Water supply/intakestructure
Minor (but not zero) for dry systems
- Water treatment/blowdowndischarge
Minor (but not zero) for dry systems
- Site preparation/accessprovision
Highly site dependent and likely minor; not affected significantlyby system choice
- Finish paint; fire/lightningprotection
Typically minor costs
- Winter operation; freezeprotection
Location dependent and relevant to both wet and dry systems;typically 2 to 4% of total installed cost; not included forCalifornia estimates
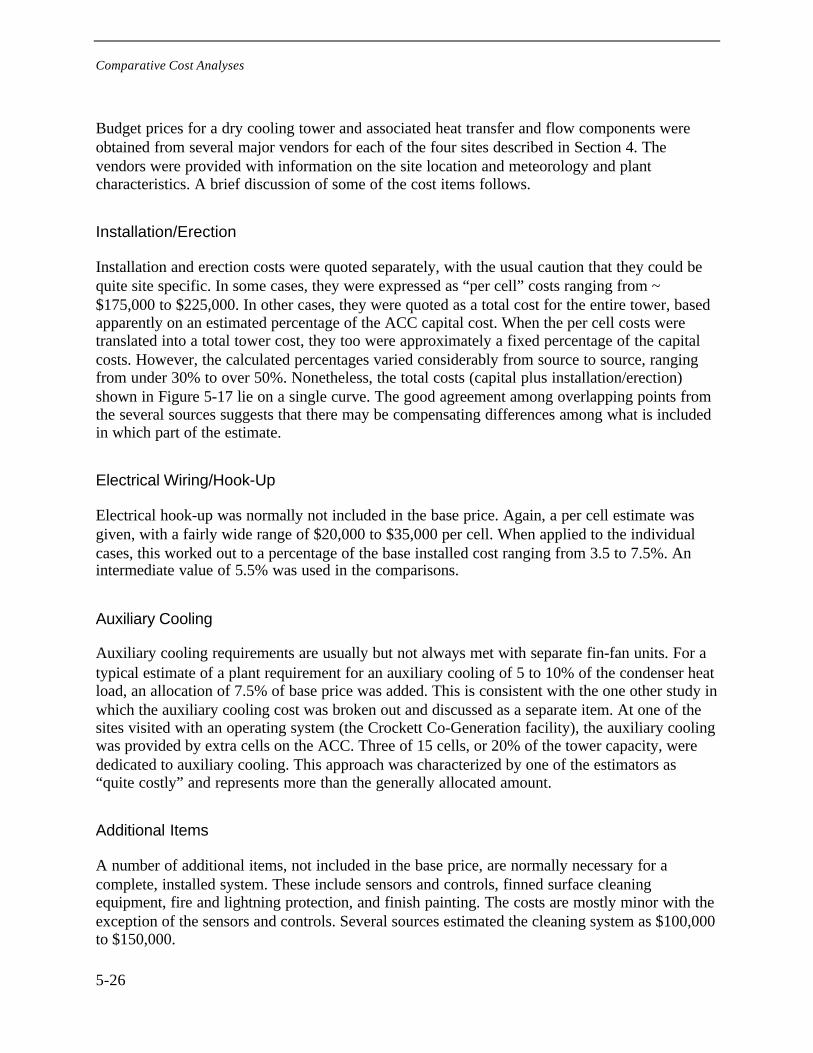
Comparative Cost Analyses
5-26
Budget prices for a dry cooling tower and associated heat transfer and flow components wereobtained from several major vendors for each of the four sites described in Section 4. Thevendors were provided with information on the site location and meteorology and plantcharacteristics. A brief discussion of some of the cost items follows.
Installation/Erection
Installation and erection costs were quoted separately, with the usual caution that they could bequite site specific. In some cases, they were expressed as “per cell” costs ranging from ~$175,000 to $225,000. In other cases, they were quoted as a total cost for the entire tower, basedapparently on an estimated percentage of the ACC capital cost. When the per cell costs weretranslated into a total tower cost, they too were approximately a fixed percentage of the capitalcosts. However, the calculated percentages varied considerably from source to source, rangingfrom under 30% to over 50%. Nonetheless, the total costs (capital plus installation/erection)shown in Figure 5-17 lie on a single curve. The good agreement among overlapping points fromthe several sources suggests that there may be compensating differences among what is includedin which part of the estimate.
Electrical Wiring/Hook-Up
Electrical hook-up was normally not included in the base price. Again, a per cell estimate wasgiven, with a fairly wide range of $20,000 to $35,000 per cell. When applied to the individualcases, this worked out to a percentage of the base installed cost ranging from 3.5 to 7.5%. Anintermediate value of 5.5% was used in the comparisons.
Auxiliary Cooling
Auxiliary cooling requirements are usually but not always met with separate fin-fan units. For atypical estimate of a plant requirement for an auxiliary cooling of 5 to 10% of the condenser heatload, an allocation of 7.5% of base price was added. This is consistent with the one other study inwhich the auxiliary cooling cost was broken out and discussed as a separate item. At one of thesites visited with an operating system (the Crockett Co-Generation facility), the auxiliary coolingwas provided by extra cells on the ACC. Three of 15 cells, or 20% of the tower capacity, werededicated to auxiliary cooling. This approach was characterized by one of the estimators as“quite costly” and represents more than the generally allocated amount.
Additional Items
A number of additional items, not included in the base price, are normally necessary for acomplete, installed system. These include sensors and controls, finned surface cleaningequipment, fire and lightning protection, and finish painting. The costs are mostly minor with theexception of the sensors and controls. Several sources estimated the cleaning system as $100,000to $150,000.
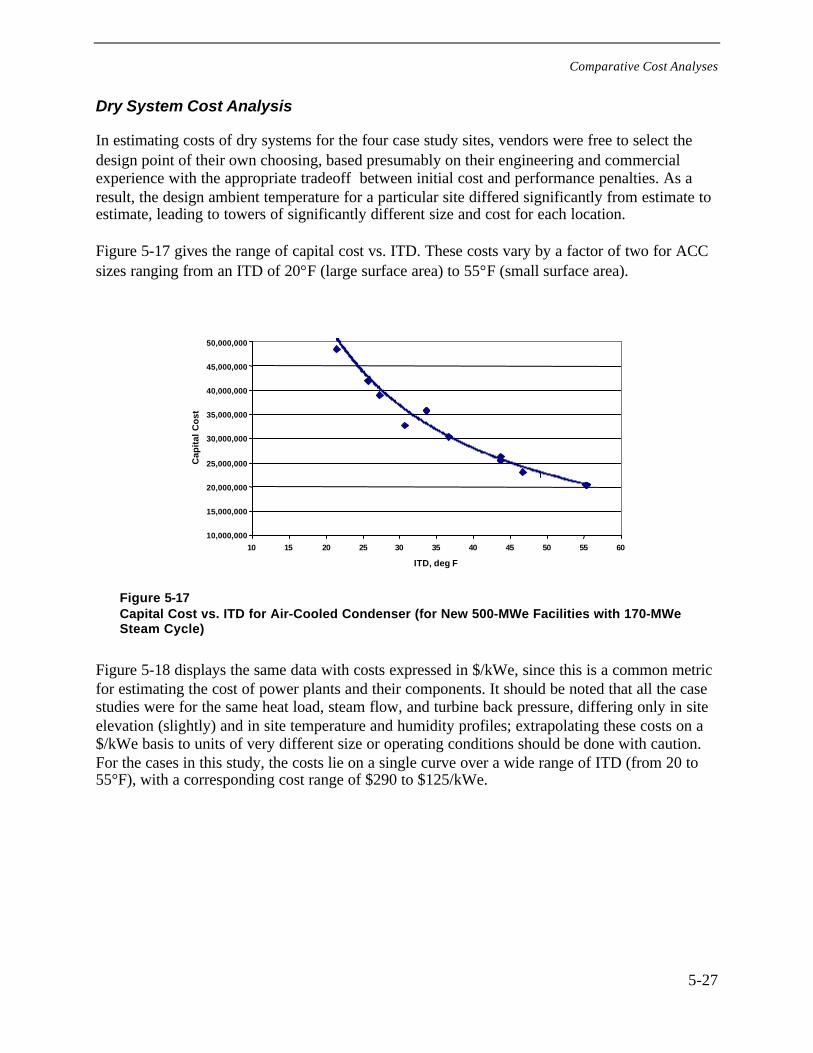
Comparative Cost Analyses
5-27
Dry System Cost Analysis
In estimating costs of dry systems for the four case study sites, vendors were free to select thedesign point of their own choosing, based presumably on their engineering and commercialexperience with the appropriate tradeoff between initial cost and performance penalties. As aresult, the design ambient temperature for a particular site differed significantly from estimate toestimate, leading to towers of significantly different size and cost for each location.
Figure 5-17 gives the range of capital cost vs. ITD. These costs vary by a factor of two for ACCsizes ranging from an ITD of 20°F (large surface area) to 55°F (small surface area).
10,000,000
15,000,000
20,000,000
25,000,000
30,000,000
35,000,000
40,000,000
45,000,000
50,000,000
10 15 20 25 30 35 40 45 50 55 60
ITD, deg F
Cap
ital
Co
st
Figure 5-17Capital Cost vs. ITD for Air-Cooled Condenser (for New 500-MWe Facilities with 170-MWeSteam Cycle)
Figure 5-18 displays the same data with costs expressed in $/kWe, since this is a common metricfor estimating the cost of power plants and their components. It should be noted that all the casestudies were for the same heat load, steam flow, and turbine back pressure, differing only in siteelevation (slightly) and in site temperature and humidity profiles; extrapolating these costs on a$/kWe basis to units of very different size or operating conditions should be done with caution.For the cases in this study, the costs lie on a single curve over a wide range of ITD (from 20 to55°F), with a corresponding cost range of $290 to $125/kWe.
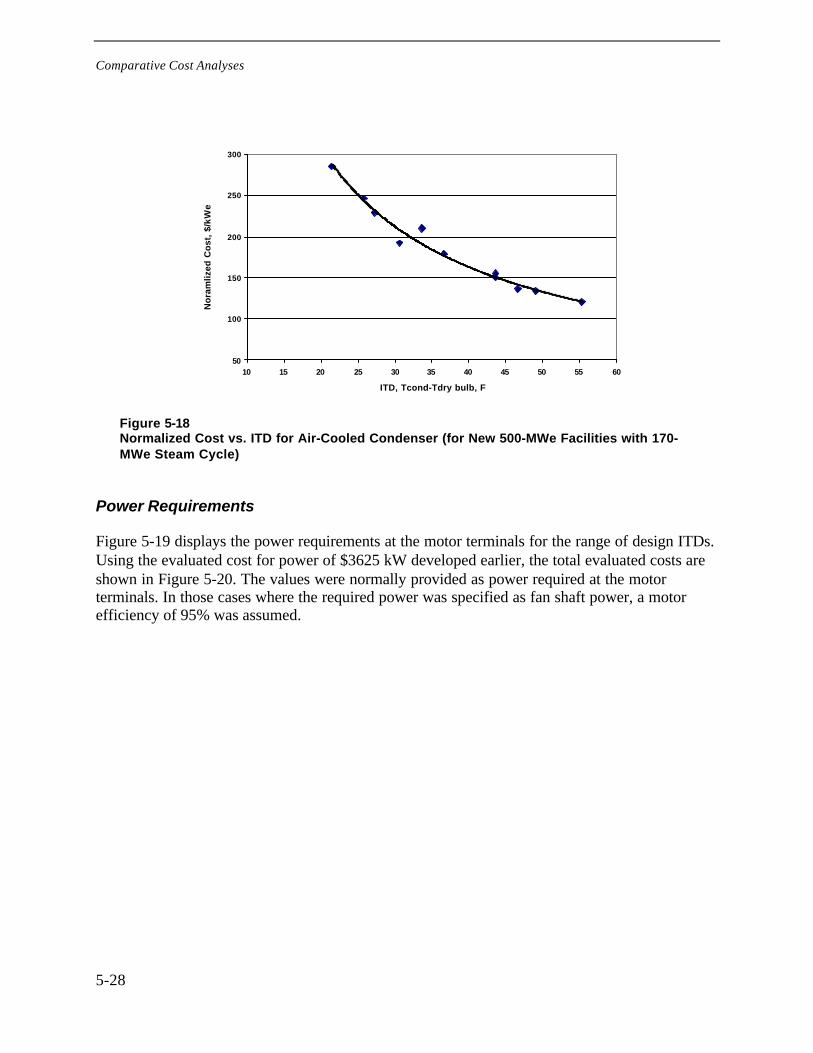
Comparative Cost Analyses
5-28
50
100
150
200
250
300
10 15 20 25 30 35 40 45 50 55 60
ITD, Tcond-Tdry bulb, F
No
ram
lized
Co
st,
$/k
We
Figure 5-18Normalized Cost vs. ITD for Air-Cooled Condenser (for New 500-MWe Facilities with 170-MWe Steam Cycle)
Power Requirements
Figure 5-19 displays the power requirements at the motor terminals for the range of design ITDs.Using the evaluated cost for power of $3625 kW developed earlier, the total evaluated costs areshown in Figure 5-20. The values were normally provided as power required at the motorterminals. In those cases where the required power was specified as fan shaft power, a motorefficiency of 95% was assumed.
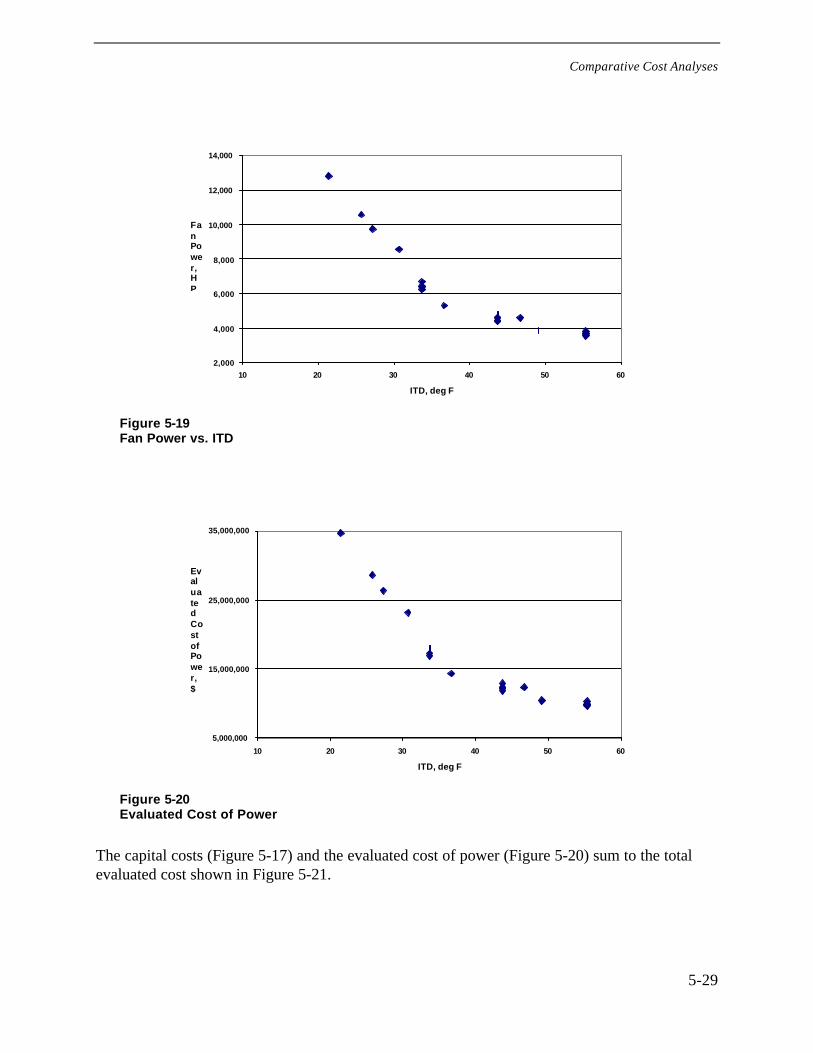
Comparative Cost Analyses
5-29
2,000
4,000
6,000
8,000
10,000
12,000
14,000
10 20 30 40 50 60
ITD, deg F
FanPower,HP
Figure 5-19Fan Power vs. ITD
5,000,000
15,000,000
25,000,000
35,000,000
10 20 30 40 50 60
ITD, deg F
EvaluatedCostofPower,$
Figure 5-20Evaluated Cost of Power
The capital costs (Figure 5-17) and the evaluated cost of power (Figure 5-20) sum to the totalevaluated cost shown in Figure 5-21.
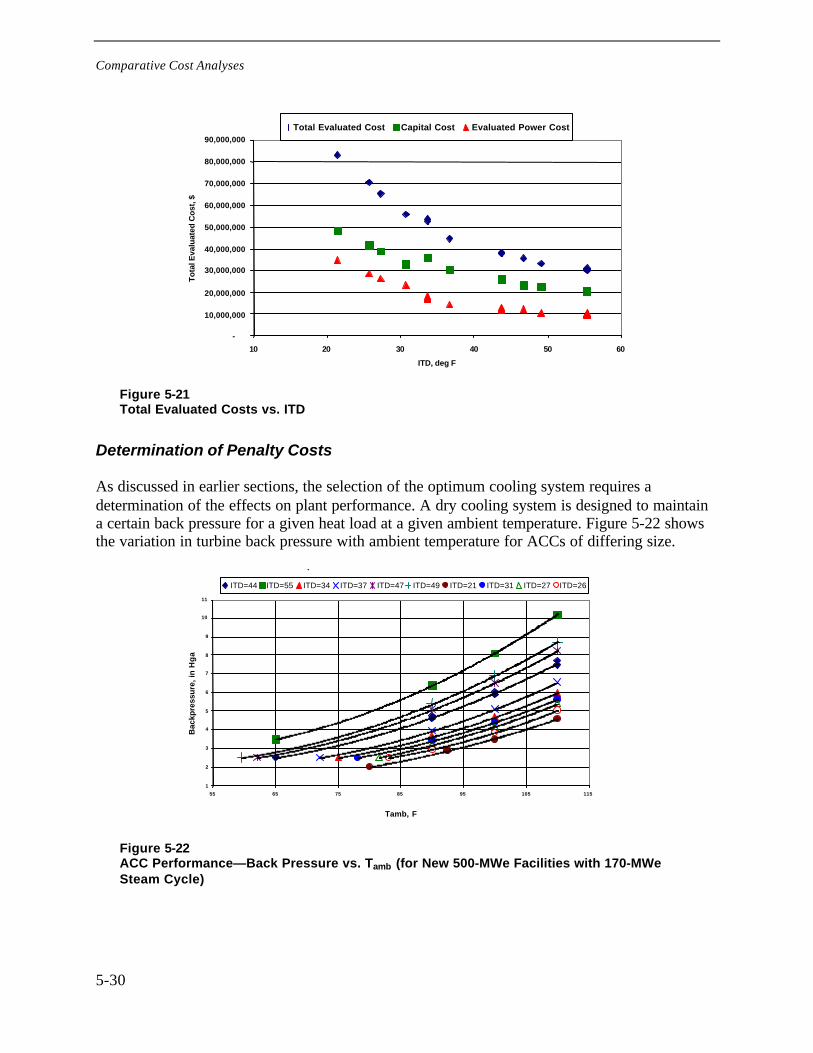
Comparative Cost Analyses
5-30
-
10,000,000
20,000,000
30,000,000
40,000,000
50,000,000
60,000,000
70,000,000
80,000,000
90,000,000
10 20 30 40 50 60
ITD, deg F
To
tal E
valu
ated
Co
st, $
Total Evaluated Cost Capital Cost Evaluated Power Cost
Figure 5-21Total Evaluated Costs vs. ITD
Determination of Penalty Costs
As discussed in earlier sections, the selection of the optimum cooling system requires adetermination of the effects on plant performance. A dry cooling system is designed to maintaina certain back pressure for a given heat load at a given ambient temperature. Figure 5-22 showsthe variation in turbine back pressure with ambient temperature for ACCs of differing size.
(
1
2
3
4
5
6
7
8
9
10
11
55 65 75 85 95 105 115
Tamb, F
Bac
kpre
ssu
re, i
n H
ga
ITD=44 ITD=55 ITD=34 ITD=37 ITD=47 ITD=49 ITD=21 ITD=31 ITD=27 ITD=26
Figure 5-22ACC Performance—Back Pressure vs. Tamb (for New 500-MWe Facilities with 170-MWeSteam Cycle)
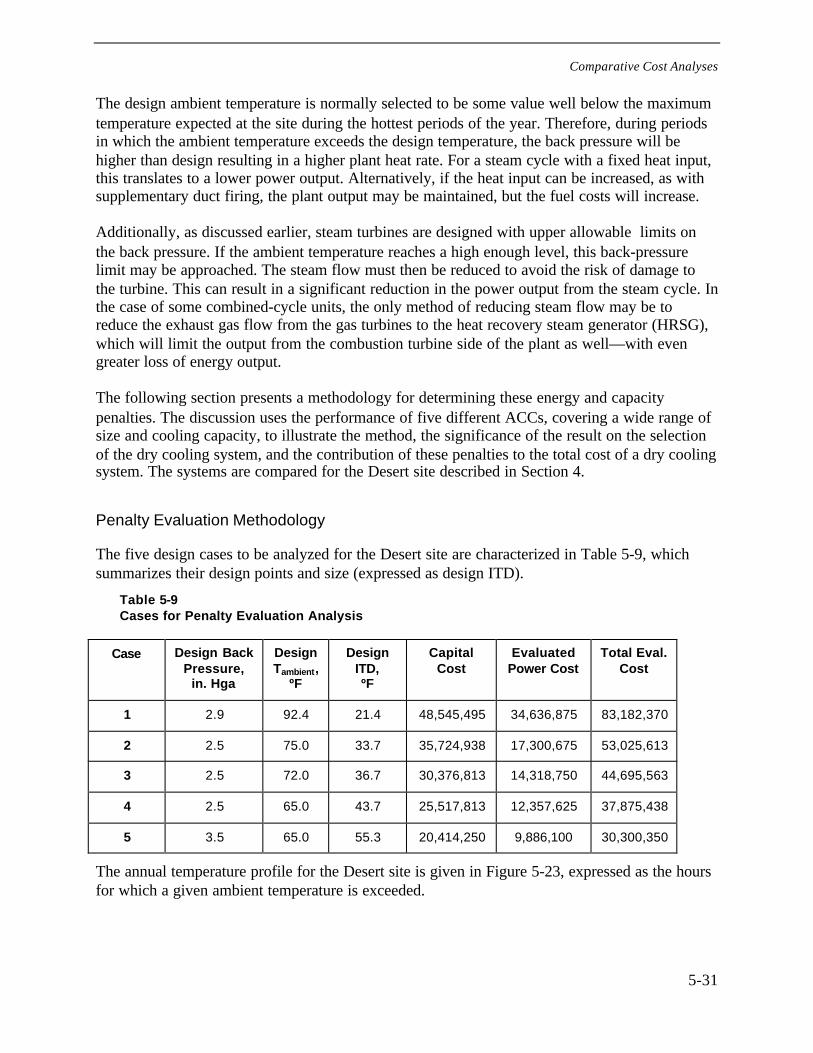
Comparative Cost Analyses
5-31
The design ambient temperature is normally selected to be some value well below the maximumtemperature expected at the site during the hottest periods of the year. Therefore, during periodsin which the ambient temperature exceeds the design temperature, the back pressure will behigher than design resulting in a higher plant heat rate. For a steam cycle with a fixed heat input,this translates to a lower power output. Alternatively, if the heat input can be increased, as withsupplementary duct firing, the plant output may be maintained, but the fuel costs will increase.
Additionally, as discussed earlier, steam turbines are designed with upper allowable limits onthe back pressure. If the ambient temperature reaches a high enough level, this back-pressurelimit may be approached. The steam flow must then be reduced to avoid the risk of damage tothe turbine. This can result in a significant reduction in the power output from the steam cycle. Inthe case of some combined-cycle units, the only method of reducing steam flow may be toreduce the exhaust gas flow from the gas turbines to the heat recovery steam generator (HRSG),which will limit the output from the combustion turbine side of the plant as well—with evengreater loss of energy output.
The following section presents a methodology for determining these energy and capacitypenalties. The discussion uses the performance of five different ACCs, covering a wide range ofsize and cooling capacity, to illustrate the method, the significance of the result on the selectionof the dry cooling system, and the contribution of these penalties to the total cost of a dry coolingsystem. The systems are compared for the Desert site described in Section 4.
Penalty Evaluation Methodology
The five design cases to be analyzed for the Desert site are characterized in Table 5-9, whichsummarizes their design points and size (expressed as design ITD).
Table 5-9Cases for Penalty Evaluation Analysis
Case Design BackPressure,
in. Hga
DesignTambient,
ºF
DesignITD,ºF
CapitalCost
EvaluatedPower Cost
Total Eval.Cost
1 2.9 92.4 21.4 48,545,495 34,636,875 83,182,370
2 2.5 75.0 33.7 35,724,938 17,300,675 53,025,613
3 2.5 72.0 36.7 30,376,813 14,318,750 44,695,563
4 2.5 65.0 43.7 25,517,813 12,357,625 37,875,438
5 3.5 65.0 55.3 20,414,250 9,886,100 30,300,350
The annual temperature profile for the Desert site is given in Figure 5-23, expressed as the hoursfor which a given ambient temperature is exceeded.
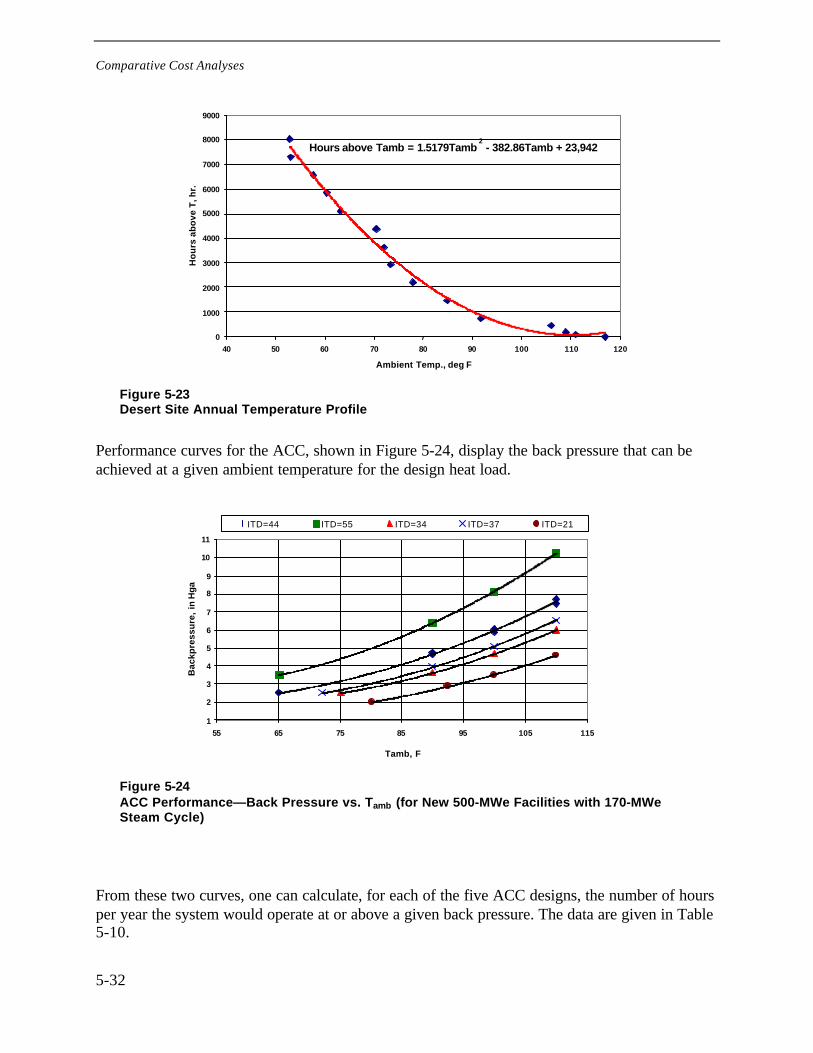
Comparative Cost Analyses
5-32
Hours above Tamb = 1.5179Tamb2 - 382.86Tamb + 23,942
0
1000
2000
3000
4000
5000
6000
7000
8000
9000
40 50 60 70 80 90 100 110 120
Ambient Temp., deg F
Ho
urs
ab
ove
T, h
r.
Figure 5-23Desert Site Annual Temperature Profile
Performance curves for the ACC, shown in Figure 5-24, display the back pressure that can beachieved at a given ambient temperature for the design heat load.
1
2
3
4
5
6
7
8
9
10
11
55 65 75 85 95 105 115
Tamb, F
Bac
kpre
ssu
re,
in H
ga
ITD=44 ITD=55 ITD=34 ITD=37 ITD=21
Figure 5-24ACC Performance—Back Pressure vs. Tamb (for New 500-MWe Facilities with 170-MWeSteam Cycle)
From these two curves, one can calculate, for each of the five ACC designs, the number of hoursper year the system would operate at or above a given back pressure. The data are given in Table5-10.
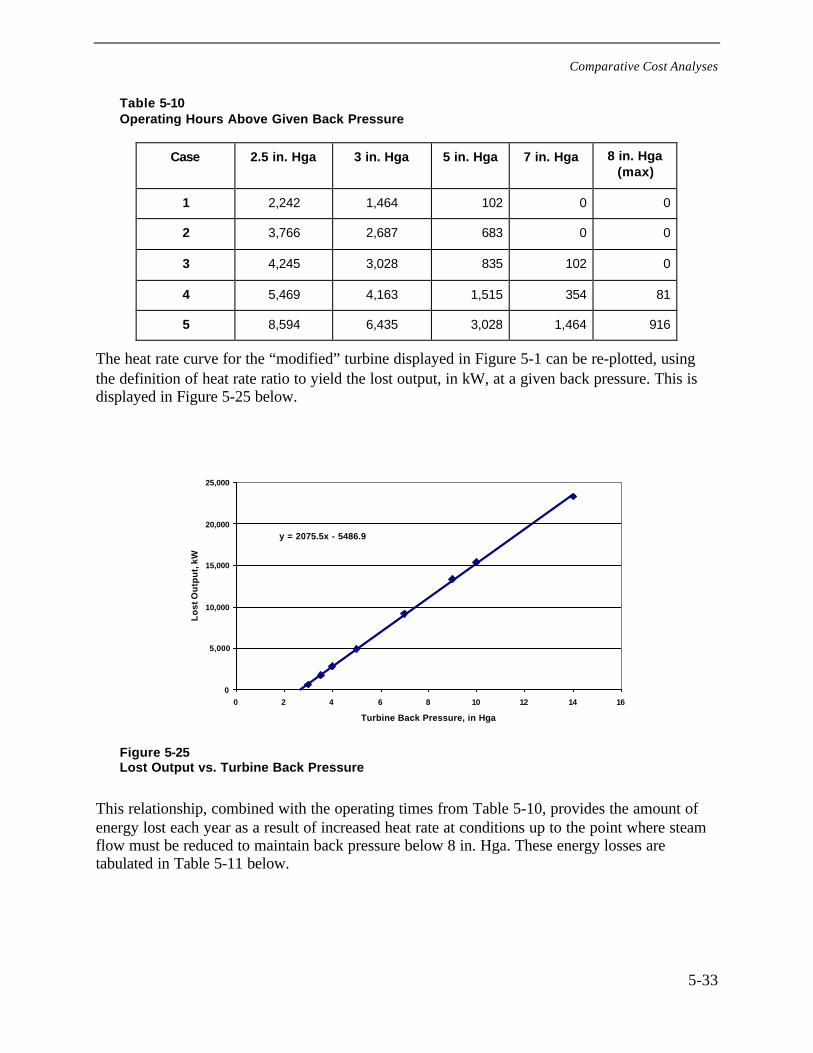
Comparative Cost Analyses
5-33
Table 5-10Operating Hours Above Given Back Pressure
Case 2.5 in. Hga 3 in. Hga 5 in. Hga 7 in. Hga 8 in. Hga(max)
1 2,242 1,464 102 0 0
2 3,766 2,687 683 0 0
3 4,245 3,028 835 102 0
4 5,469 4,163 1,515 354 81
5 8,594 6,435 3,028 1,464 916
The heat rate curve for the “modified” turbine displayed in Figure 5-1 can be re-plotted, usingthe definition of heat rate ratio to yield the lost output, in kW, at a given back pressure. This isdisplayed in Figure 5-25 below.
y = 2075.5x - 5486.9
0
5,000
10,000
15,000
20,000
25,000
0 2 4 6 8 10 12 14 16
Turbine Back Pressure, in Hga
Lo
st O
utp
ut,
kW
Figure 5-25Lost Output vs. Turbine Back Pressure
This relationship, combined with the operating times from Table 5-10, provides the amount ofenergy lost each year as a result of increased heat rate at conditions up to the point where steamflow must be reduced to maintain back pressure below 8 in. Hga. These energy losses aretabulated in Table 5-11 below.
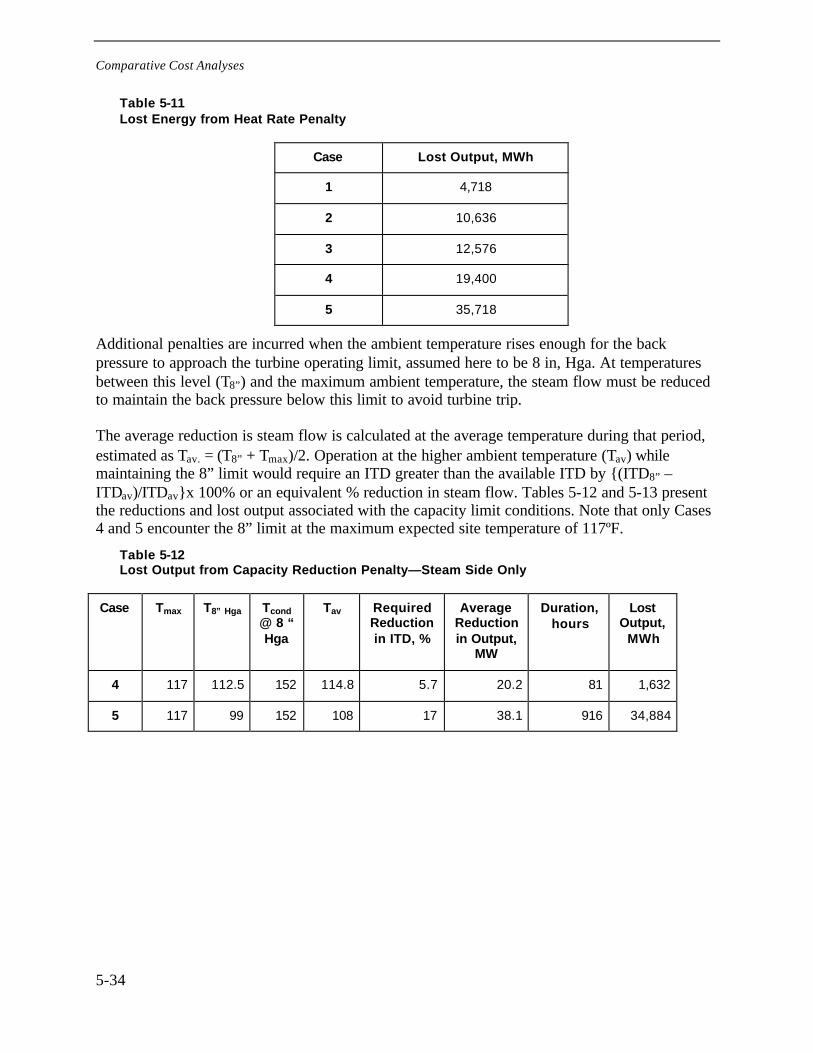
Comparative Cost Analyses
5-34
Table 5-11Lost Energy from Heat Rate Penalty
Case Lost Output, MWh
1 4,718
2 10,636
3 12,576
4 19,400
5 35,718
Additional penalties are incurred when the ambient temperature rises enough for the backpressure to approach the turbine operating limit, assumed here to be 8 in, Hga. At temperaturesbetween this level (T8”) and the maximum ambient temperature, the steam flow must be reducedto maintain the back pressure below this limit to avoid turbine trip.
The average reduction is steam flow is calculated at the average temperature during that period,estimated as Tav. = (T8” + Tmax)/2. Operation at the higher ambient temperature (Tav) whilemaintaining the 8” limit would require an ITD greater than the available ITD by {(ITD8” –ITDav)/ITDav}x 100% or an equivalent % reduction in steam flow. Tables 5-12 and 5-13 presentthe reductions and lost output associated with the capacity limit conditions. Note that only Cases4 and 5 encounter the 8” limit at the maximum expected site temperature of 117ºF.
Table 5-12Lost Output from Capacity Reduction Penalty—Steam Side Only
Case Tmax T8” Hga Tcond@ 8 “Hga
Tav RequiredReductionin ITD, %
AverageReductionin Output,
MW
Duration,hours
LostOutput,
MWh
4 117 112.5 152 114.8 5.7 20.2 81 1,632
5 117 99 152 108 17 38.1 916 34,884
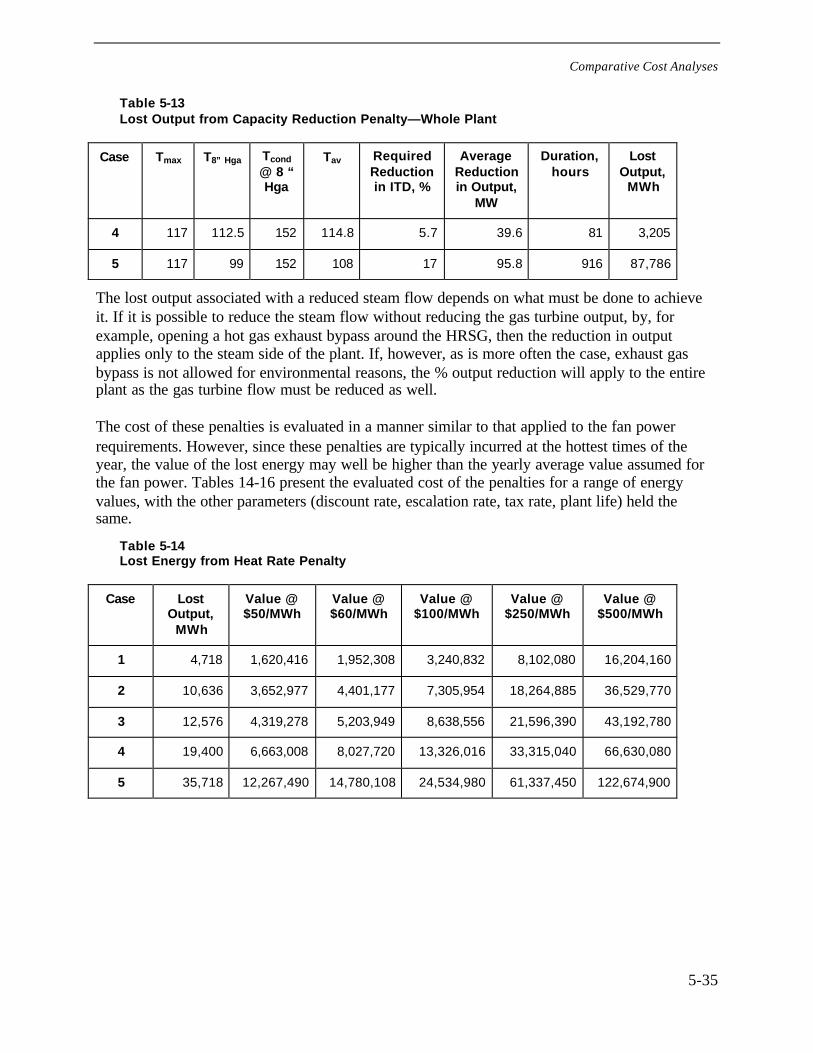
Comparative Cost Analyses
5-35
Table 5-13Lost Output from Capacity Reduction Penalty—Whole Plant
Case Tmax T8” Hga Tcond
@ 8 “Hga
Tav RequiredReductionin ITD, %
AverageReductionin Output,
MW
Duration,hours
LostOutput,
MWh
4 117 112.5 152 114.8 5.7 39.6 81 3,205
5 117 99 152 108 17 95.8 916 87,786
The lost output associated with a reduced steam flow depends on what must be done to achieveit. If it is possible to reduce the steam flow without reducing the gas turbine output, by, forexample, opening a hot gas exhaust bypass around the HRSG, then the reduction in outputapplies only to the steam side of the plant. If, however, as is more often the case, exhaust gasbypass is not allowed for environmental reasons, the % output reduction will apply to the entireplant as the gas turbine flow must be reduced as well.
The cost of these penalties is evaluated in a manner similar to that applied to the fan powerrequirements. However, since these penalties are typically incurred at the hottest times of theyear, the value of the lost energy may well be higher than the yearly average value assumed forthe fan power. Tables 14-16 present the evaluated cost of the penalties for a range of energyvalues, with the other parameters (discount rate, escalation rate, tax rate, plant life) held thesame.
Table 5-14Lost Energy from Heat Rate Penalty
Case LostOutput,
MWh
Value @$50/MWh
Value @$60/MWh
Value @$100/MWh
Value @$250/MWh
Value @$500/MWh
1 4,718 1,620,416 1,952,308 3,240,832 8,102,080 16,204,160
2 10,636 3,652,977 4,401,177 7,305,954 18,264,885 36,529,770
3 12,576 4,319,278 5,203,949 8,638,556 21,596,390 43,192,780
4 19,400 6,663,008 8,027,720 13,326,016 33,315,040 66,630,080
5 35,718 12,267,490 14,780,108 24,534,980 61,337,450 122,674,900
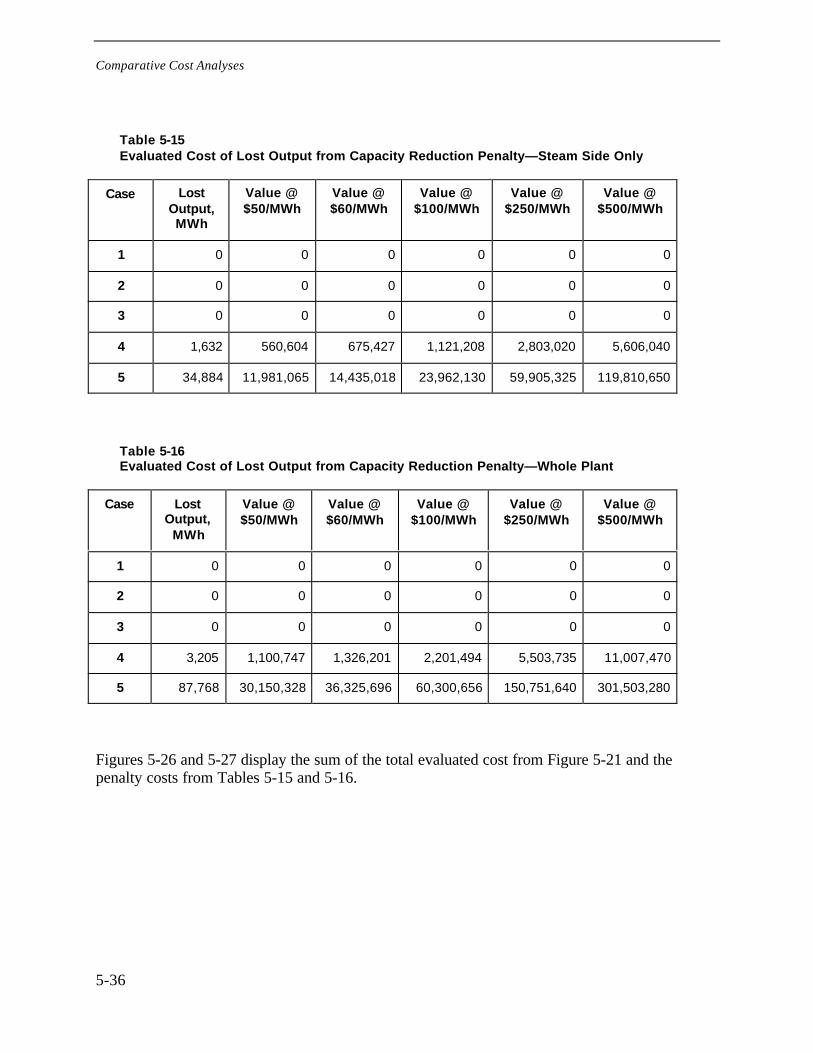
Comparative Cost Analyses
5-36
Table 5-15Evaluated Cost of Lost Output from Capacity Reduction Penalty—Steam Side Only
Case LostOutput,MWh
Value @$50/MWh
Value @$60/MWh
Value @$100/MWh
Value @$250/MWh
Value @$500/MWh
1 0 0 0 0 0 0
2 0 0 0 0 0 0
3 0 0 0 0 0 0
4 1,632 560,604 675,427 1,121,208 2,803,020 5,606,040
5 34,884 11,981,065 14,435,018 23,962,130 59,905,325 119,810,650
Table 5-16Evaluated Cost of Lost Output from Capacity Reduction Penalty—Whole Plant
Case LostOutput,
MWh
Value @$50/MWh
Value @$60/MWh
Value @$100/MWh
Value @$250/MWh
Value @$500/MWh
1 0 0 0 0 0 0
2 0 0 0 0 0 0
3 0 0 0 0 0 0
4 3,205 1,100,747 1,326,201 2,201,494 5,503,735 11,007,470
5 87,768 30,150,328 36,325,696 60,300,656 150,751,640 301,503,280
Figures 5-26 and 5-27 display the sum of the total evaluated cost from Figure 5-21 and thepenalty costs from Tables 5-15 and 5-16.
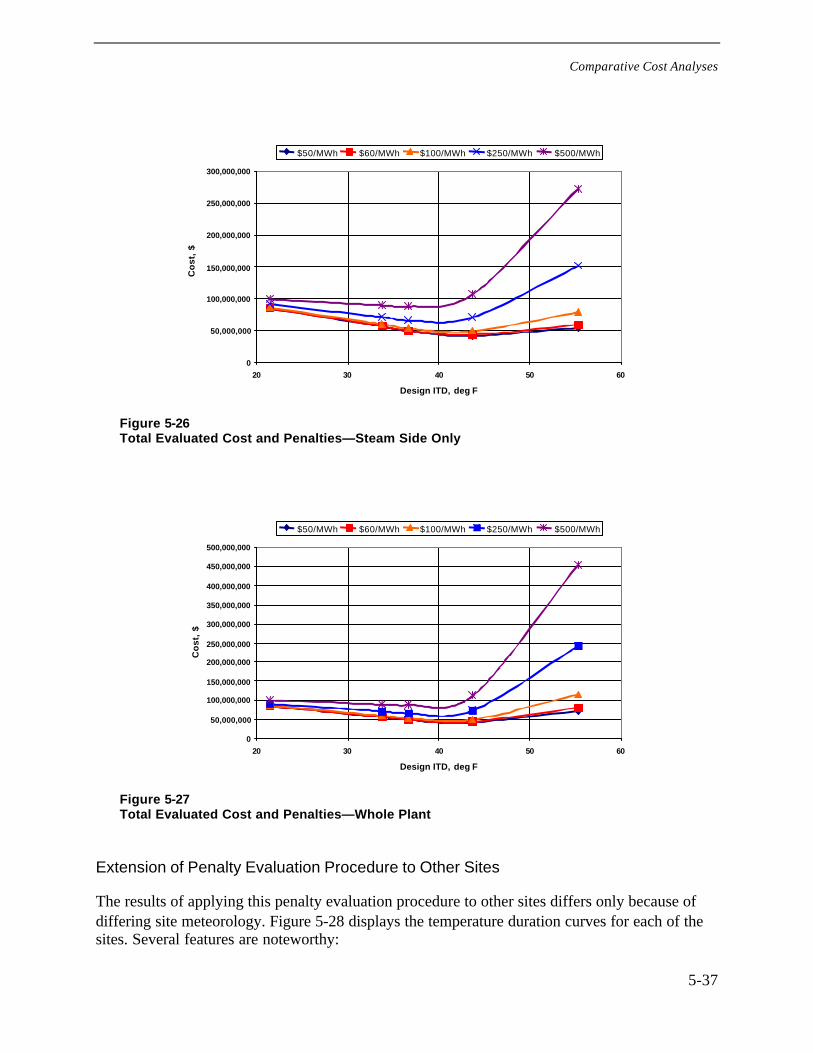
Comparative Cost Analyses
5-37
0
50,000,000
100,000,000
150,000,000
200,000,000
250,000,000
300,000,000
20 30 40 50 60
Design ITD, deg F
Co
st,
$
$50/MWh $60/MWh $100/MWh $250/MWh $500/MWh
Figure 5-26Total Evaluated Cost and Penalties—Steam Side Only
0
50,000,000
100,000,000
150,000,000
200,000,000
250,000,000
300,000,000
350,000,000
400,000,000
450,000,000
500,000,000
20 30 40 50 60
Design ITD, deg F
Co
st,
$
$50/MWh $60/MWh $100/MWh $250/MWh $500/MWh
Figure 5-27Total Evaluated Cost and Penalties—Whole Plant
Extension of Penalty Evaluation Procedure to Other Sites
The results of applying this penalty evaluation procedure to other sites differs only because ofdiffering site meteorology. Figure 5-28 displays the temperature duration curves for each of thesites. Several features are noteworthy:
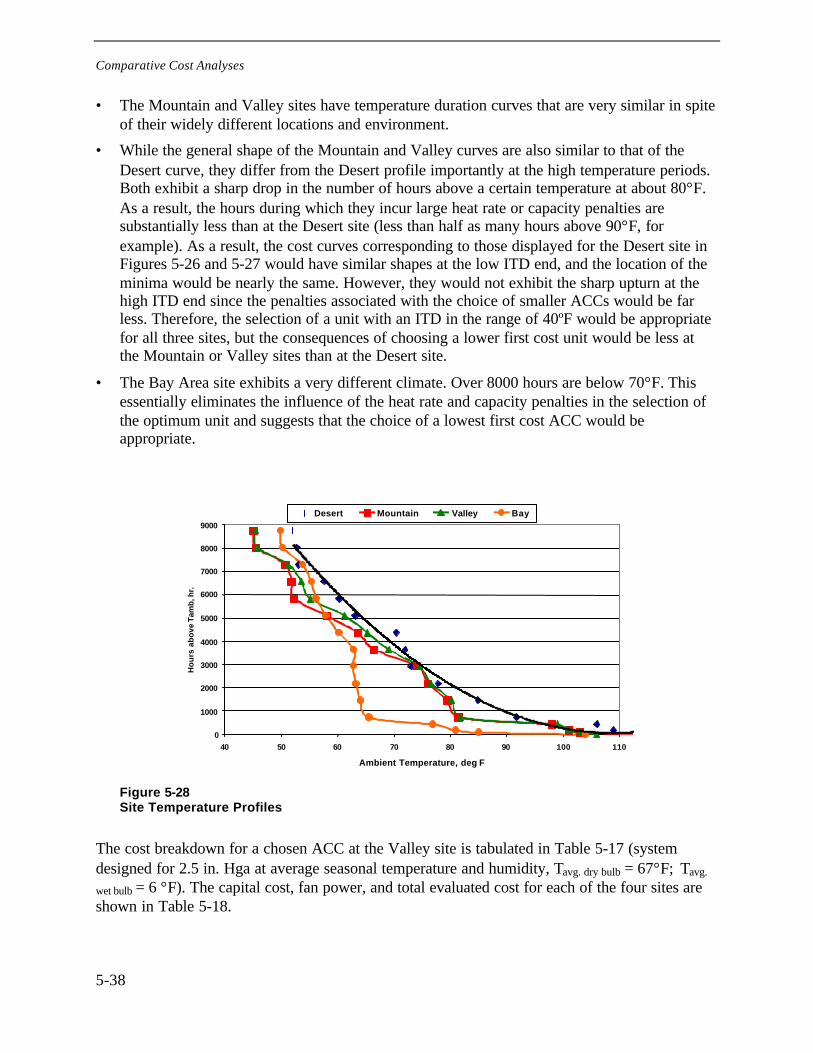
Comparative Cost Analyses
5-38
• The Mountain and Valley sites have temperature duration curves that are very similar in spiteof their widely different locations and environment.
• While the general shape of the Mountain and Valley curves are also similar to that of theDesert curve, they differ from the Desert profile importantly at the high temperature periods.Both exhibit a sharp drop in the number of hours above a certain temperature at about 80°F.As a result, the hours during which they incur large heat rate or capacity penalties aresubstantially less than at the Desert site (less than half as many hours above 90°F, forexample). As a result, the cost curves corresponding to those displayed for the Desert site inFigures 5-26 and 5-27 would have similar shapes at the low ITD end, and the location of theminima would be nearly the same. However, they would not exhibit the sharp upturn at thehigh ITD end since the penalties associated with the choice of smaller ACCs would be farless. Therefore, the selection of a unit with an ITD in the range of 40ºF would be appropriatefor all three sites, but the consequences of choosing a lower first cost unit would be less atthe Mountain or Valley sites than at the Desert site.
• The Bay Area site exhibits a very different climate. Over 8000 hours are below 70°F. Thisessentially eliminates the influence of the heat rate and capacity penalties in the selection ofthe optimum unit and suggests that the choice of a lowest first cost ACC would beappropriate.
0
1000
2000
3000
4000
5000
6000
7000
8000
9000
40 50 60 70 80 90 100 110
Ambient Temperature, deg F
Ho
urs
ab
ove
Tam
b, h
r.
Desert Mountain Valley Bay
Figure 5-28Site Temperature Profiles
The cost breakdown for a chosen ACC at the Valley site is tabulated in Table 5-17 (systemdesigned for 2.5 in. Hga at average seasonal temperature and humidity, Tavg. dry bulb = 67°F; Tavg.
wet bulb = 6 °F). The capital cost, fan power, and total evaluated cost for each of the four sites areshown in Table 5-18.
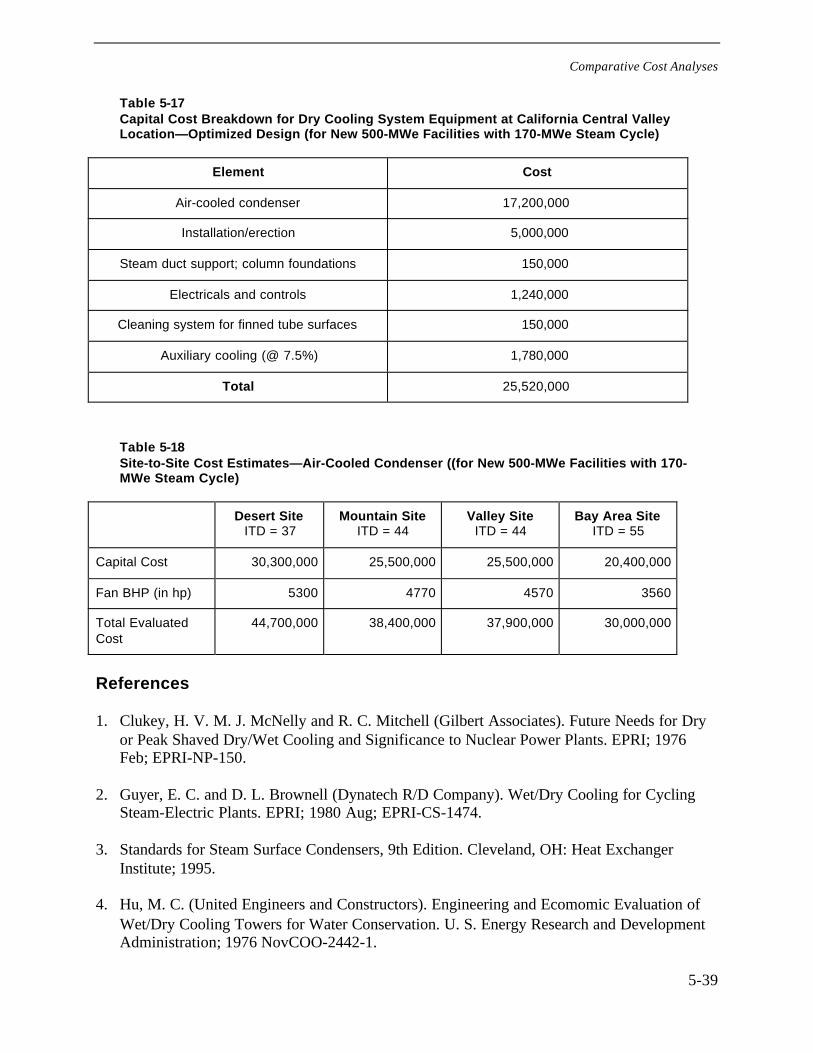
Comparative Cost Analyses
5-39
Table 5-17Capital Cost Breakdown for Dry Cooling System Equipment at California Central ValleyLocation—Optimized Design (for New 500-MWe Facilities with 170-MWe Steam Cycle)
Element Cost
Air-cooled condenser 17,200,000
Installation/erection 5,000,000
Steam duct support; column foundations 150,000
Electricals and controls 1,240,000
Cleaning system for finned tube surfaces 150,000
Auxiliary cooling (@ 7.5%) 1,780,000
Total 25,520,000
Table 5-18Site-to-Site Cost Estimates—Air-Cooled Condenser ((for New 500-MWe Facilities with 170-MWe Steam Cycle)
Desert SiteITD = 37
Mountain SiteITD = 44
Valley SiteITD = 44
Bay Area SiteITD = 55
Capital Cost 30,300,000 25,500,000 25,500,000 20,400,000
Fan BHP (in hp) 5300 4770 4570 3560
Total EvaluatedCost
44,700,000 38,400,000 37,900,000 30,000,000
References
1. Clukey, H. V. M. J. McNelly and R. C. Mitchell (Gilbert Associates). Future Needs for Dryor Peak Shaved Dry/Wet Cooling and Significance to Nuclear Power Plants. EPRI; 1976Feb; EPRI-NP-150.
2. Guyer, E. C. and D. L. Brownell (Dynatech R/D Company). Wet/Dry Cooling for CyclingSteam-Electric Plants. EPRI; 1980 Aug; EPRI-CS-1474.
3. Standards for Steam Surface Condensers, 9th Edition. Cleveland, OH: Heat ExchangerInstitute; 1995.
4. Hu, M. C. (United Engineers and Constructors). Engineering and Ecomomic Evaluation ofWet/Dry Cooling Towers for Water Conservation. U. S. Energy Research and DevelopmentAdministration; 1976 NovCOO-2442-1.
Comparative Cost Analyses
5-40
5. Hu, M. C. and G. A. Englesson (United Engineers and Constructors). A Study of Wey/DryCooling Systems for Fossil Power Plants: Water Conservation and Plume Abatement. U. S.Environmental Protection Agency; 1977 Nov; UE&C-EPA-771130.
6. Hutton, Dave. Improved Power Plant Performance with Evaporative Steam Condensing.1999 Feb; CTI TP99-08.
7. Ledford, G. A. Testimony on Wet/Dry Cooling for the High Desert Power Project. CaliforniaEnergy Commission : Siting Committee; 1999(Docket No. 97-AFC-1).
8. Miller, T. O. and J. E. Luckart. Elk Hills Power, LLC's Opening Brief on Part Two SubjectAreas. California Energy Commission: Siting Committee; 2000(Docket No. 99-AFC-1).
9. Mitchell, R. D. Survey of Water-Conserving Heat Rejection Systems. Palo Alto, CA: ElectricPower Research Institute; 1989 Mar; EPRI GS-6252.
10. Mitchell, R. D. and K. Henwood, R. W. Beck. Cost of Conserving Water in Power PlantCooling; Chicago, IL. ASCE National Convention: ASCE; 1978.
11. Oleson, K. A. et al. Dry Cooling for Large Nuclear Power Plants. Westinghouse PowerGeneration Systems; 1972 Feb; GEN-72-004.
12. Rossie, E. A. Cecil and R. O. Young (R. W. Beck). Cost Comparison of Dry-Type andConventional Cooling Systems for Representative Nuclear Generating Plants. U. S. AtomicEnergy Commission; 1972 Mar; TID-26007.
13. Rossie, J. P. and E. A. Cecil. Research on Dry-Type Cooling Towers for Thermal-ElectricGeneration: Part I. U. S. Environmental Protection Agency; 1970 Nov; Report No.16130EES11/70.
14. Rossie, J. P. R. D. Mitchell and R. O. Young (R. W. Beck). Economics of the Use of SurfaceCondensers with Dry-Type Cooling Systems for Fossil-Fueled and Nuclear GeneratingPlants. U. S. Atomic Energy Commission; 1973 Dec; TID-26514.
15. Sebald, J. E. Site and Design Temperature Related Economics of Nuclear Power Plants withEvaporative and Non-Evaporative Cooling Tower Systems. U. S. Energy Research &Development Administration; 1976 Jan; COO-2392-1.
16. UEC, United Engineers and Constructors. Heat Sink Design and Cost Study for Fossil andNuclear Power Plants. U. S. Atomic Energy Commission; 1975 Dec; WASH-1360.
6-1
6 ENVIRONMENTAL IMPACTS
This section reviews and compares the environmental impacts of wet, dry, and hybrid coolingsystems on new gas-fired, combined-cycle power plants. While the primary focus of this report ison the issue of consumptive water use, there are other environmental impacts from each of thedifferent types of cooling systems. To bound the scope of the discussion, the material in “PowerPlant Cooling Systems: Requirements for Approval” found in the California Code ofRegulations, Title 20, Division 2, Section 5—§2012, Appendix B, is used as a guide(CalCodeRegs). The topics to be covered are listed in Table 6-1.
Regulatory Matters
Discussions of the environmental impacts are often inseparable from discussions of the rules andregulations that control them. It must be assumed that any cooling system selected will bedesigned and operated in such a way as to conform to all relevant environmental regulations. Acomprehensive economic comparison, therefore, would include the costs of the environmentalcontrol systems required for compliance.
However, the regulatory requirements are complex. Power generation facilities, including theircooling systems, have been the object of legislative and regulatory attention at both the federaland state levels for decades. Furthermore, the regulatory philosophy has changed, particularly(but not only) in California. Historically, environmental regulations either invoked quantitativemeasurable limits on specific emitted chemicals or on the parameters of environmental releases,or alternatively, mandated the use of certain technologies, designated as “best available” or thelike. Cost of compliance, while sometimes capped in the case of impacts considered less severe,was reasonably easy to anticipate.
Recent shifts in philosophy focus on the establishment of goals and objectives for particularregions that may vary with present condition and intended use. Effluent limits and technologyrequirements are then set on a case-by-case basis to achieve the local goals and objectives.
A detailed description of the regulatory framework and the statutory basis for environmentalregulations is available in the report from a companion EPRI-CEC project on the use of degradedwater for power plant cooling (DiFilippo 2001). The discussion here is limited to the nature ofthe impacts of the alternative cooling systems.
Environmental Impacts
6-2
Table 6-1Power Plant Cooling Systems: Requirements for Approval (from California Code ofRegulations, Title 20, Div. 2, Chap. 5---§2012, App. B)
Subsection (ofApp. B)
Subject Requirement RelevantCode/Regulation
(g)(14) Water Resources Waste DischargeReq’ts; NPDES;Policy 75-58
(g)(12) Waste Management Cal. Code, title 22,§66261.20 et seq.
(g)(10) Hazardous MaterialsHandling
Cal. Code, title 22,§66261.20 et seq.
Also, Health andSafety Code,Section 25531.
(g)(8)(A) Air Quality Information necessaryfor air pollution controldistrict to completeDetermination ofCompliance
None cited
(g)(4) Noise None cited
(g)(6)(F) Visual Resources Assessment of impact ofvisible plumes
None cited
(g)(9) Pubic Health Health and SafetyCode, Section25294.8
(g)(13) Biological Resources Cal. Code, title 20Sects. 1702 (q) and(v)
(g)(15) Agriculture and Soils Effect of emissions onsurrounding soil-vegetation
None cited
Types of Cooling System Impacts
Impacts of cooling systems include the effects of emissions to all of the environmental media(air, water, land) as well as societal effects including public health and public nuisance. Specificitems to be addressed, following the guidance of Table 6-1, include
• Water resources,
• Waste management (including water discharge),

Environmental Impacts
6-3
• Hazardous materials,
• Air emissions,
• Noise,
• Visual resources,
• Public health,
• Biological impacts, and
• Agriculture and soils.
Water Resources
As discussed in Sections 1 and 2, the primary consumptive use of water in gas-fired, combined-cycle power plants is in evaporative cooling towers for the condensation of turbine exhauststeam. Additional minor uses include the following:
• Steam cycle make-up: This can vary considerably with the operating profile of the plant. Co-generation plants, for example, generate electricity and provide process steam to industrialpartners. In some instances, condensate is not returned to the plant but rather disposed of inthe industrial process or, if returned, is no longer usable due to contamination.
• Auxiliary cooling load: In addition to turbine steam condensation, there are cooling loads ina power plant (e.g., oil cooling, generator hydrogen coolers) that typically amount to about5% of the turbine condenser heat load. If this cooling is also provided with wet evaporativecooling, the evaporation losses are increased correspondingly.
• Hotel load: This refers to plant service water, such as cleaning water, sanitary water, drinkingwater, and air-conditioning condenser loads.
In some cases, modest amounts of water are used for plant performance enhancement:
• Gas turbines: Some combined-cycle units use evaporative or spray cooling on the inlet air ofthe gas turbine units to maintain output on hot days. This consumption rate can range from0.6 to 1.2 gpm/MW of gas turbine capacity during the periods when it is being used (Molis1997).
• ACC: While not commonly used, similar systems for cooling of the inlet air to the air-cooledcondenser can maintain steam cycle capacity on hot days. The usage rates on the steam sidewould be higher than on the gas turbine side since the air flow per MW is higher, and mightrange from 2 to 6 gpm/MW of steam turbine capacity.
Dry Cooling
In comparison to recirculating wet cooling, a dry cooling system reduces the water consumptionby 90 to 95% by
• Eliminating the evaporative cooling tower for the turbine steam condensing load, and
Environmental Impacts
6-4
• Sometimes eliminating the auxiliary cooling load (in some systems, the auxiliary cooling isaccomplished by adding cells to the ACC; in others, a separate fin-fan or evaporative cooleris used, in which case water consumption is still required).
The hotel load remains essentially the same. Water for performance enhancement is unchangedby the choice of cooling system. If inlet air cooling is used on the ACC, the water consumptionrate can be 25% of that for a full wet system during the period that the enhancement is required.On an annual basis, depending on the duration of the hot periods, it is typically a small fraction(1 to 5%) of the annual consumption of a wet cooling system (Kroeger, 1998).
Hybrid System
A hybrid system reduces the water requirements for steam condensation in proportion to thefraction of the load carried by the dry part of the system. If the hybrid system is used primarilyfor plume abatement, it operates as a wet system except for cold periods when plumes wouldform. During those times when the dry system is in use, it would typically carry 25% of the loadwith a corresponding 25% reduction in water use. However, on an annual basis, since the drysystem operates only intermittently, the water consumption would be nearly the same—95 to99% that of a conventional wet cooling system.
Alternatively, a hybrid system intended for water conservation operates dry during the colderseasons, using water only when required to maintain plant efficiency and capacity during the hotperiods when the dry system’s limitations become severe. The water savings relative to an all-wet system can vary widely depending on the economic criteria used in system selection anddesign. The unit at the 500-MW San Juan plant was designed to carry approximately 75% of theheat load on the wet portion at the highest-temperature conditions (Kroeger, 2000). On an annualbasis, design studies estimate water savings ranging from 30 to 98% (Mitchell, 1989).
Waste Management (Including Water Discharge)
Wet cooling systems require the discharge of cooling tower blowdown. The SWRCB hasadopted a State Implementation Policy for implementing the receiving water standards in EPA’sCalifornia Toxics Rule. Under the section on intake water credits, a facility that takes water froman impaired water body may discharge back to that water body if the concentration of thepollutants has not been increased. This offers relief to plants using once-through cooling;however, for plants that use cooling towers, blowdown treatment is required. This may alsorequire consideration of the disposal of solid waste, such as basin sludge or water treatmentsystem sludges from evaporation ponds, brine concentrators, side-stream softeners, or otherblowdown reduction processes.
A detailed discussion of the effects, regulations, and technological options for treatment orreduction of the impact in the case of wet cooling systems is given by (DiFilippo 2001)Obviously, dry systems eliminate blowdown discharge and waste disposal related to blowdowntreatment. Hybrid systems reduce these effects in proportion to the fraction of the condensingload carried by the dry part of the system. The water and wastewater treatment and discharge
Environmental Impacts
6-5
facilities are included as line items in the capital cost of cooling systems but are not major costelements (see Section 5).
Hazardous Materials
The handling of hazardous materials is a worker safety issue, normally regulated under OSHAguidelines. For the operation of a wet cooling system, the most relevant concerns are over watertreatment chemicals and waste streams. Chlorine and bromine compounds for biological foulingcontrol are used and stored on site in large quantities. Scaling and fouling control operationsinvolve specialty chemicals of a wide range of composition, as well as acids and bases (such assulfuric acid, sodium hydroxide, hydrated lime, etc.) for pH control. In comparison to manychemical and petrochemical plant operations, the chemicals used at power plants are not severehazards and can be dealt with through routine hazardous operations (HAZOP) procedures,appropriate worker training, and reasonable plant design and maintenance.
Hybrid towers require the same operations, materials, and precautions as do wet towers inproportionally reduced scales. Dry systems effectively eliminate major water treatmentproblems. However, this is not an issue of sufficient concern to affect the decision betweencooling system types.
Air Emissions
Air-borne emissions from cooling towers are primarily associated with the drift and volatilecompounds stripped from the water by the air flow. Drift consists of the small droplets entrainedby the air passing through the tower as it flows past falling films or droplets of water. Thesmallest droplets are carried out of the tower with the air. Drift eliminators keep these losses tovery low levels, typically less than 0.005% of the circulating water flow rate. For a tower on a500-MWe combined-cycle plant, this corresponds to less than 5 gpm or approximately one-halfthe flow from a hand-held garden hose. However, even this small amount of discharge to theatmosphere invokes air quality control regulations.
Federal Regulations
Airborne emissions from cooling towers are regulated under the Clean Air Act, specifically theprovisions of the National Emissions Standards for Hazardous Air Pollutants (NESHAPS).Listed pollutants under NESHAPS with relevance to wet cooling towers include asbestos (in thecase of older towers using cement-asbestos [CAB] fill), chromium, zinc and zinc oxide, and thetrihalomethanes. Title 40, Section 1, Part 63 (NESHAPS for Source Categories) Subpart Q(NESHAPS for Industrial Process Cooling Towers{IPCT}), Section 63.402 states:
“No owner…shall use chromium-based water treatment chemicals in any affected IPCT.”
Under Part 749, Water Treatment Chemicals; Subpart D, Air-Conditioning and Cooling Systems;§749.68, Hexavalent Chromium-based Water Treatment Chemicals in Cooling Systems,
Environmental Impacts
6-6
chromium-based compounds are prohibited in commerce for “comfort cooling towers” and fornew units of IPCTs (but not for existing IPCTs).
State Regulations
Title 17, Public Health, Division 3, Air Resources, Section 1, Air Resources Board, SubSection7.5, Airborne Toxic Control Measures; §93103, Regulation for Chromate Treated CoolingTowers bans the use of hexavalent chromium containing compounds in cooling tower circulatingwater. For existing towers, especially wood towers, that have used such compounds in the past, aperiod of time is permitted to allow the chemicals to desorb from the tower and be eliminated—so long as the level in the circulating water does not go above 0.15 mg/L (8 mg/L for woodtowers), and tests show a continuous decrease over time.
While the drift amounts are relatively small, the droplets contain all of the impurities containedin the circulating water. Furthermore, as a result of droplet evaporation in the tower, plume, andatmosphere, impurities are often found at significantly higher concentrations in drift. When thedrift droplets evaporate completely, the contaminants remain in the air as fine particulate matter(PM10) and constitute a source of PM10 emissions from these gas-fired, combined-cycle plants.
The magnitude of PM10 emissions from cooling towers is a subject of debate and discussion atthis time. Total drift rates are historically difficult to measure accurately. Modern high-performance drift eliminators are specified to control drift to 0.002% of the circulating waterflow or less. For a 500-MW combined-cycle plant with ~170 MW generation from the steamportion and an assumed circulating water flow of 500 gpm/MW, this corresponds to a total driftrate of 1.7 gpm or about 20,000 lb/day. At a circulating water solids concentration of 10,000mg/L, this corresponds to a potential drift mass of solid particulate of 200 lb/day. Although thereis considerable uncertainty in these estimates, a recent study (DiFilippo, 2001) reports a similarresult of 300 lb/day for a comparably sized plant.
By comparison, estimates developed by the California Air Resources Board and presented at theCEC/EPRI Workshop (EPRI 2000) of PM10 emissions from state-of-the-at gas turbines are0.0001 lb/kWh, amounting to about 800 lb/day from the combustion turbine side of a 500-MWcombined-cycle plant.
In the event that the circulating water contains bacterial or pathogenic species, drift is a potentialtransport pathway from the plant to the surrounding areas. The usual example in this area isLegionella. References include (CTI 2000). This is discussed in somewhat greater length later inthis Section under “Public Health.”
Other air emissions include volatile species that are formed in the cooling tower as a result ofwater treatment processes such as chlorination and then stripped from the water by the coolingair. Trace amounts of volatile organic compounds (VOCs) and particularly trihalomethanes(THMs) have been detected. A complete discussion of this area is found in DiFilippo (2001).
Environmental Impacts
6-7
Second-Order Effects
The primary air emissions from combined-cycle plants are, of course, from the combustion of thegas fuel for the combustion turbines. As noted in earlier sections, the choice of cooling systemcan affect the overall plant heat rate and capacity. Therefore, to meet a given total system load,more fuel must be burned if dry cooling is used—with a corresponding increase in emissions ofNOx, particulate matter, SO2, and CO2 in amounts and proportions that depend on where and inwhat equipment the additional fuel is used.
A detailed treatment of this issue is beyond the scope of this report. However, on a system-widebasis, one can estimate that if 10% of system generation were to be equipped with dry coolingand each of those units incurred an annual average 10% performance penalty, neither of which islikely, the effect on overall system heat rate would be, to first order, only about 1%—with acorrespondingly small impact on state-wide air emissions. On the other hand, a case-by-caseanalysis of these emissions would be needed to determine what the local environmental impactof each cooling option would be.
Noise
The effect of noise on residences, hospitals, libraries, schools, places of worship, and otherneighboring places must be considered both during construction and operation. While noregulatory limits were found, the “Information Requirements” (CalCodeRegs) specifically defineareas where a “potential of 5db (A) or more over existing background levels” might occur asaffected areas. In addition, noise levels within the project site boundary and their impact onworkers at the site must be considered.
The primary noise from cooling facilities is fan noise and “fill” noise caused by the flow of waterdown over the tower fill. Dry cooling would eliminate the “fill” noise perhaps at the expense ofsomewhat more fan noise since the quantity of air flowing through a dry tower is greater thanthat through a wet tower of the same capacity.
In the case of the Crockett Co-Generation Plant (see Appendix C), the plant is located on theoutskirts of the town of Crockett in a mixed commercial/residential area with private homeslocated across the street to the south. On the northern boundary are the Carquinez Straits of theSan Francisco Bay, a recreational and commercial boating area. Site-specific noise limits of 50dB at the nearest residence and at a distance of 300 ft into the Bay were imposed and met with nodifficulty through the use of Alpina low-noise fans.
In cases where ultralow-noise fans are required, the cost can be substantial (see Section 5).Recent discussions with one vendor suggest a 10% premium on the base cost of the ACC. Inanother study, noise control was estimated to account for an $8 million cost differential on a 750-MW combined-cycle plant, amounting to nearly 20% of the ACC capital cost (Micheletti2001;UWAG 2000).
Environmental Impacts
6-8
Visual Resources
An assessment of the visual impact of a project is required, including a description of thedimensions, color, and material of each major visible component. Specific reference is made tolight, glare, and visible plumes.
Of the several cooling systems, once-through cooling is the least visually intrusive, but is a likelysystem of choice only for coastal locations. Cooling towers are among the larger components atgas-fired, combined-cycle plants.
Large hyperbolic natural draft towers, such as were used at the Rancho Seco Nuclear Plant, arethe largest structures, but these are also unlikely choices for the cooling system sizes needed forthe steam portion of a typical 500-MWe combined-cycle plant. Mechanical draft wet towers anddry towers are more generally comparable in overall configuration. Dry towers are larger,typically with a ground area or footprint twice that of a wet tower of the same capacity. They arealso typically taller because of the large ground clearance needed to deliver air to the fans.However, in some cases, the absence of a large holding basin, which requires that wet towers bebuilt on grade, can allow creative location of an air-cooled condenser. This was the case atCrockett, where the ACC is placed on top of the turbine building to accommodate a tight site andto blend into the site less obtrusively.
On cold days, wet towers can produce a large visible plume as the warm saturated air leaving thetower mixes with the cold ambient air and the water vapor condenses. In some locations, theseplumes may obscure visibility, creating dangerous conditions on roadways, or may lead to localicing on neighboring roads or structures.
Obviously, a dry tower never produces a visible plume. Hybrid wet/dry towers are oftendesigned specifically for plume abatement. In these designs, dry warm air from the dry portion ofthe tower, when mixed with the saturated air from the wet portion, results in an unsaturatedmixture that will not lead to condensation of water vapor when mixed with ambient air.
Public Health
The most frequently cited public health issue in the context of cooling towers is the possibility ofLegionnaire’s Disease, so-called because of an outbreak at an American Legion convention inPhiladelphia in 1976, attributed to pathogens (Legionella pneumophilia) in the cooling tower forthe HVAC system in the hotel. While the frequency of occurrence of Legionnaire’s Disease issmall (approximately 1400 cases reported to the Center for Disease Control annually) and thenumber of these attributable to cooling towers (at power plants or anywhere else) is even fewer,the question has been investigated extensively in the U.S. and abroad. An extensive discussion ofthe transmission pathways, monitoring methods, and control procedures is given by DiFilippo(2001) in the context of the use of degraded or recycled water in wet cooling towers. Morecomplete treatments are found in the CTI and ASHRAE literature and references therein.
While the consequences of exposure can be very severe and even fatal—particularly to at-riskpopulations (elderly, smokers, individuals with chronic respiratory problems or with suppressed
Environmental Impacts
6-9
immune systems)—the evidence of harm is sparse and largely anecdotal. Cooling towers are acommon element of our industrial, commercial, and residential scenes in high-density populationareas in all climates. No compelling epidemiology has established a significant threat.
Reasonable monitoring and control procedures should be followed, but it is unlikely that thechoice of cooling system would be significantly influenced by public health concerns.
It should be noted that Legionnaire’s Disease should also be viewed in the context of workersafety and health. This has been addressed in OSHA guidelines, and the topic is reviewed byDiFilippo (2001).
Biological Impacts
The biological impacts usually considered in relationship to cooling systems are entrainment andimpingement losses. These result from aquatic life—from fish to microorganisms—being drawninto the cooling system (entrainment) or onto the intake screen (impingement) along with thecooling water. These effects, which have long been recognized and regulated under Section316(b) of the Clean Water Act (EPA 2000), were usually considered in connection with once-through cooling systems. In once-through cooling, intake requirements of 500 gpm/MW canresult in high withdrawals from the source water body even for modest-size plants.
The use of wet recirculating systems reduces the withdrawal rates to perhaps 2.5 to 3% of thosein once-through systems. In recirculating evaporative systems, however, the entrained organismshave no chance of survival, and the water is not returned to the source water body. In the case ofthe smallest water bodies with low in-stream flows, it may be possible that even this reducedamount could have an important biological impact.
The use of dry systems will result in another 20-fold reduction in withdrawal rates. However, incomparison to once-through cooling, the further reduction over what wet recirculating systemsachieve is small—from 2.5 to 3% down to perhaps 0.1%.
The EPA has recently proposed (EPA 2000) that power plants requiring NPDES permits andoperating cooling water intake structures (CWIS) that withdraw more than 2 million gpd mustconsider alternative technologies to determine the Best Available Technology for the site. To putthis in perspective, 2 million gpd is the withdrawal required for 3 MW on once-through coolingor approximately 100 MW on wet cooling towers. Therefore, a 500-MW combined-cycle plantwith one-third of its capacity (~170 MW) from the steam cycle that uses wet cooling towerswould withdraw over 3 million gpd and would, therefore, be required to consider the BestAvailable Technology for water intake.
In the support document issued as part of the Notice of Proposed Rulemaking, EPA introduceddry cooling as one the “Alternative Regulatory Options” (EPA 2000). In summer 2000, NewYork State’s Department of Environmental Conservation required the use of dry cooling at theAthens Generating Station (a 1080-MW gas-fired plant) as the preferred Best AvailableTechnology for “minimizing adverse environmental impact” of a cooling water intake structure(Cahill, 2000).
Environmental Impacts
6-10
The question has been posed as to whether dry cooling may also have a biological impact in theform of “atmospheric entrainment” losses in which insects, or even birds, may be drawn into thelarge air stream passing through an ACC. There is no research or information on this questioncurrently available, but further investigation may be warranted in the future.
Agriculture and Soils
Deleterious impacts of power plant cooling systems on surrounding agriculture have not been anissue except in a few special circumstances. One notable study was conducted in the mid-1970sat the Potomac Electric Power Company’s Chalk Point Station in Maryland. In that case, thetowers were run on brackish make-up water with a circulating water salinity comparable to seawater (35,000 ppm TDS); the towers were hyperbolic natural draft towers with a plume exitplane elevation of about 400 feet; and the plant was located in a tobacco-growing region with aspecialty crop of leaves intended for use as the outer wrappers of cigars. High-salinity dropletdeposition on the leaves could create small, discolored spots, making a leaf unusable without inany way affecting the health of the plant or the quality of the soil. Even under these conditions,the risk was eventually determined to be negligibly small, and the plant and towers continued tooperate with no special controls and no adverse impact on the region’s agricultural activity.
Summary
On balance, the environmental effects of dry and wet/dry systems are reduced in comparison towet systems, but case-by-case analyses should be conducted to identify important site-specificeffects for any system chosen.
The most important environmental effects of wet systems arise from water consumption, waterand waste discharge, intake losses (entrainment or impingement), drift, and visible plumes. Theuse of dry cooling essentially eliminates all of these effects; wet/dry systems can be operated toeliminate the visible plume and to reduce the other effects by an amount proportional to thereduction in water consumption relative to all-wet systems.
In some other cases, the effects of dry cooling are greater than for wet systems. Specifically, drycooling towers are physically larger and hence create a correspondingly greater visual impactthan wet towers; the reduced plant efficiency which occurs during certain hotter periods of theyear from the use of dry cooling results in higher fuel consumption and correspondingly higherair emissions from the combustion processes in the plant; and the noise from air-cooled systemsis comparable to or greater than that from wet towers unless special provisions for low-noise fansare made. In addition, dry systems entrain more air than wet systems, creating the possibility ofan increased “atmospheric entrainment” impact.
References
1. Cahill, J. P. Interim Decision In the Matter of an Application for a State PollutantDischarge Elimination System Permit by the Athens Generating Co., LP. Albany, NY: State ofNew York, Dept. of Environmental Conservation; 2000 Jun; DEC No. 4-1922-00055/00001.
Environmental Impacts
6-11
2. CalCodeRegs. Information Requirements for an Application. Sacramento, CA:California Code of Regulations, Division 2, Section 5, Article 6, §2012, Appendix B.
3. CTI. Best Protocol for Control of Legionella [Web Page]. 2000 Feb. Available at:http://www.cti.org/legion.html.
4. DiFilippo, Michael N. Identification and Use of Degraded Water Sources for PowerPlant Cooling Water in California. 2001 Mar.
5. EPA. Economic and Engineering Analyses of the Proposed 316(b) New Facility Rule.Washington, DC: U. S. Environmental Protection Agency; 2000 Aug; EPA-821-R-00-019.
6. EPRIMaulbetsch, J. S. CEC/EPRI Workshop: Environmental Impacts of New Generationin California; San Diego, CA. Palo Alto, CA: EPRI; 2000 Dec.
7. Kroeger, D. G. Air-cooled Heat Exchangers and Cooling Towers. Begell House; 1998.
8. Micheletti, W. C. and J. M. Burns. Understanding Wet and Dry Cooling Systems. 2001International Water Conference; Pittsburg, PA. 2001: Paper 01-38.
9. Molis, S. J. and P. Levine (Fern Engineering, Inc.). Inlet Air Spray Cooler for GasTurbine Power Augmentation: Plans, Specifications and Test Results. Palo Alto, CA: EPRI;1997 May; TR108057.
10. UWAG. Michelettti, W. C. and J. M. Burns. Comparison of Wet and Dry CoolingSystems for Combined Cycle Power Plants. Washington, DC: Utility Water Act Group(UWAG); 2000 Nov 4.


7-1
7 CURRENT RESEARCH AND DEVELOPMENT
As noted in Section 3, in spite of renewed interest in dry cooling as a technology, there has beenrelatively little published in the research literature in recent years. It can be assumed thatdevelopment work of the product improvement variety has been, and is, under way at majorvendor facilities but is not yet published in the open literature.
The limited amount of published work falls in four categories:
• Heat exchanger design (including fan development for noise reduction)
• Performance enhancement
• System design
• Analytical methods
Some of the work cited in these categories is old by research definitions of “current” R&D but isincluded here either because it has yet to be exploited and may still be relevant or because it wasthe basis for current and presumably still evolving designs.
A summary of “the latest worldwide technology in environmentally designed cooling towers,”including some attention to dry and wet/dry technologies, was presented a few years ago (Mirskyet al., 1992).
Heat Exchanger Design
The primary objective of heat exchanger design work on the finned tube coils for air-cooledcondensers has been to reduce the air-side pressure drop while maintaining heat transfereffectiveness. The major advance in this area has been through modification of the tubegeometry from circular to elliptical to flattened shapes that permit the use of a single tube row.This eliminates the losses associated with flow transitions from row to row encountered in eitherin-line or staggered arrangements of round tubes. This approach, actively promoted by Hamon(Bonger and R. Chandron, 1995), was summarized in a 1999 article in Modern Power Systems(Staff report, 1998) stating the following advantages:
• Freeze-proof operation (due to uniform steam flow distribution)
• Increased power generation during winter operation (without risk of freezing)
• Lower fan power consumption
• Increased thermal efficiency
Current research and development
7-2
Detailed performance calculations for these exchangers using single row, flattened tubes areavailable in Sections 5 and 8 of Kroeger’s text (Kroeger, 1998).
It is noted in the Modern Power Systems article (Staff report, 1998) that the use of this design innatural draft units is promising. While this is of little interest to the California situation, it mayexpand advances in the design more widely.
Work also continues on the development of ultralow-noise fans. Some developments have beenreported in EPRI workshops in St. Petersburg, FL (van der Spek and P. J. M. Nelissen, 1995),and in Jackson, WY (van der Spek, 2000), at which 15-db reductions in a retrofitted mechanicaldraft wet cooling tower were reported.
Performance Enhancement
It has long been recognized that the major performance and cost issue with dry cooling has beenthe limitation on performance during the hottest days of the year, where the use of dry coolingcan limit plant output and decrease plant efficiency. While it is possible to mitigate this effect byselecting a larger air-cooled unit to begin with, this comes with a considerable increase in theinitial cost (see Section 5). Furthermore, the achievable condensing temperature is still limited bythe ambient dry bulb no matter what the size. At a design ITD of 20°F (probably an upperpractical limit on unit size) in areas where the 1% dry bulb can approach or exceed 120°F, anITD of 20°F would result in a steam condensing temperature above 140°F and a back pressure inexcess of 6 in. Hga. Therefore, the researched enhancement schemes have focused on the use ofa limited amount of water during the hottest hours. There are a variety of approaches available:
• Wet helper towers
• Swamp coolers in ACC inlet areas
• Deluge cooling of finned tube surfaces
• Spray injection in several configurations
Analyses performed about 10 years ago (Conradie and D. G. Kröger, 1991) illustrated thatsubstantial performance enhancements could be achieved with a limited use of water, as shownin Figure 7-1 excerpted from Kroeger’s text (Kroeger, 1998).
Recently, a spray enhancement project involving laboratory and single-cell testing has beencarried out (Maulbetsch and M. N. DiFilippo, 2001). Some full-scale applications exist on smallplants such as Chinese Camp (see Appendix C) and Mammoth Lakes Geothermal Plant. Systemanalyses have been conducted recently at the National Renewable Energy Laboratory (NREL) onfour approaches to hot-day performance enhancement for a small dry-cooled geothermal plant(C. Kutscher, NREL, personal communication). The four approaches were spray cooling, delugecooling, wet packing (Munters fill) at the inlet, and a hybrid system combining spray coolingwith wet inlet packing. The results suggesting slightly better “rates of return for the spray and thehybrid system” are tentative and unpublished at this time.
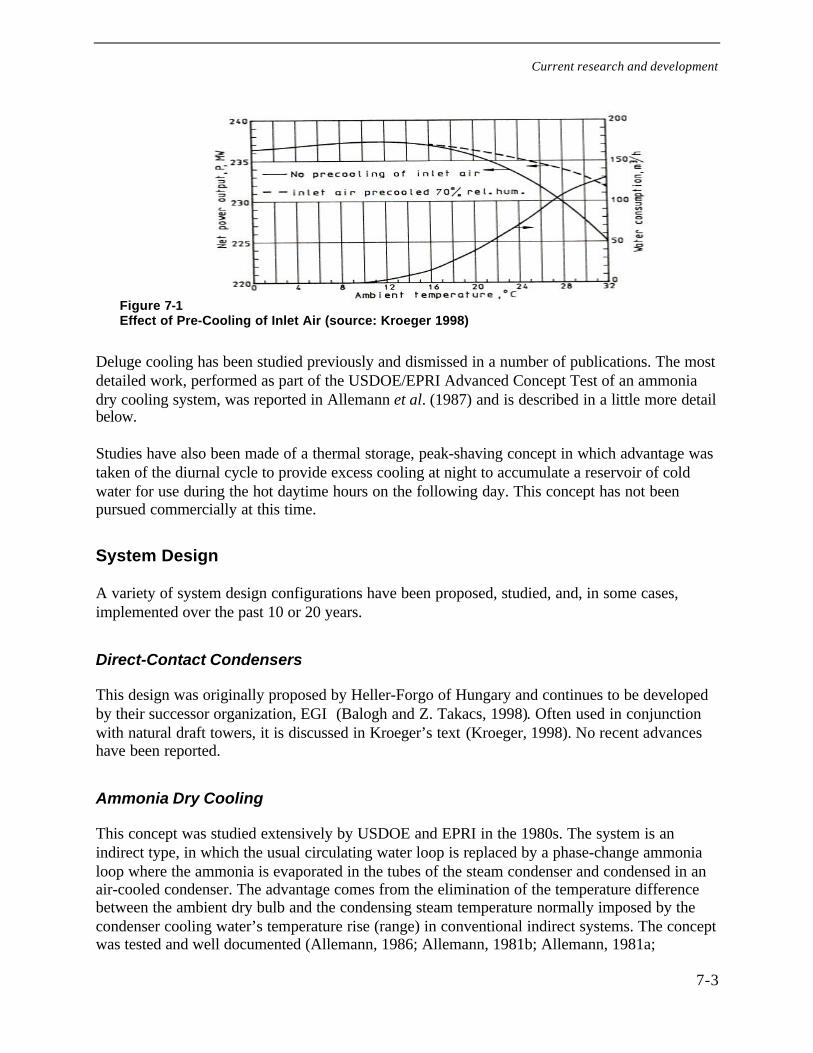
Current research and development
7-3
Figure 7-1Effect of Pre-Cooling of Inlet Air (source: Kroeger 1998)
Deluge cooling has been studied previously and dismissed in a number of publications. The mostdetailed work, performed as part of the USDOE/EPRI Advanced Concept Test of an ammoniadry cooling system, was reported in Allemann et al. (1987) and is described in a little more detailbelow.
Studies have also been made of a thermal storage, peak-shaving concept in which advantage wastaken of the diurnal cycle to provide excess cooling at night to accumulate a reservoir of coldwater for use during the hot daytime hours on the following day. This concept has not beenpursued commercially at this time.
System Design
A variety of system design configurations have been proposed, studied, and, in some cases,implemented over the past 10 or 20 years.
Direct-Contact Condensers
This design was originally proposed by Heller-Forgo of Hungary and continues to be developedby their successor organization, EGI (Balogh and Z. Takacs, 1998). Often used in conjunctionwith natural draft towers, it is discussed in Kroeger’s text (Kroeger, 1998). No recent advanceshave been reported.
Ammonia Dry Cooling
This concept was studied extensively by USDOE and EPRI in the 1980s. The system is anindirect type, in which the usual circulating water loop is replaced by a phase-change ammonialoop where the ammonia is evaporated in the tubes of the steam condenser and condensed in anair-cooled condenser. The advantage comes from the elimination of the temperature differencebetween the ambient dry bulb and the condensing steam temperature normally imposed by thecondenser cooling water’s temperature rise (range) in conventional indirect systems. The conceptwas tested and well documented (Allemann, 1986; Allemann, 1981b; Allemann, 1981a;
Current research and development
7-4
Allemann and others, 1987), with the participation of several major equipment vendors(Baltimore Air Coil, The Trane Company, Curtiss-Wright, CB&I, and Union Carbide). To date,the concept has not been pursued commercially but may bear reexamination in light of increasinginterest in economical dry cooling.
Evaporative Condensers
The use of an evaporative condenser that can be run in a dry mode during colder periods hasbeen used in a number of industrial HVAC and process cooling applications and in at least onepower plant (see MassPower, Appendix C). It is discussed at length in Section 8.
NWD
A single reference (Miura and O. Gotoh, 1998) is made to what is described as a “novel wet/drytower” for plume abatement with no separate finned tube dry section. It works by interrupting thewater flow to a section of the fill during cold, plume-forming periods. In that regard, it has somesimilarities to the evaporative condenser (see above). There is no information given on cost orperformance.
Analytical Methods
There is some activity on computational procedures for system optimization and for determiningwind effects. This includes work on the following:
• System optimization on a nonlinear constrained problem using a sequential quadraticprogramming method (Conradie et al., 1998)
• Optimization by geometric programming (Ecker and R. D. Wiebking, 1978)
• Computational fluid dynamics (Eldredge, 1995)
• Generalized optimization techniques (Kintner-Meyer and A. F. Emery, 1994)
• Computer-aided optimization (Li and W. Sadiq, 1985)
Progress in these areas will accrue to the benefit of future cooling system designs.
Summary
There is little current research and development work being reported in the open literature on dryor wet/dry cooling systems for power plants. A few important exceptions include improved heatexchanger geometries for finned tube bundles in air-cooled condensers (Bonger, and R.Chandron 1995; Staff report, 1998; Kroeger, 1998); enhancement of air-cooled condenserperformance with the use of limited water (Maulbetsch and M. N. DiFilippo, 2001; Balogh andZ. Takacs, 1998); the use of evaporative condensers (Hutton, 1999; Niagara Blower Company);and optimization techniques (Conradie and others, 1998)
Current research and development
7-5
References
1. Allemann, R. T. Development of an Advanced Concept of Dry/Wet Cooling of PowerGenerating Plants. Palo Alto, CA: Electric Power Research Institute; 1981a Feb; EPRI CS-1668.
2. Advanced Concepts Test (ACT) Facility Summary Safety Report. Palo Alto, CA:Electric Power Research Institute; 1981b Jul; EPRI CS-1915.
3. Allemann, R. T.; B. M. Johnson, and E. V. Werry. Wet-Dry Cooling Demonstration: ATransfer of Technology. Palo Alto, CA: Electric Power Research Institute; 1987 Jan; EPRI CS-5016.
4. Allemann, R. T. et al. Wet-Dry Cooling Demonstration: Test Results. Palo Alto, CA:Electric Power Research Institute; 1986 May; EPRI CS-4321.
5. Balogh, Andras and Z. Takacs. Developing Indirect Dry Cooling Systems for ModernPower Plants [Web Page]. 1998. Available at:http://www.nemesis.at/publication/gpi_98_2/articles/33.html .
6. Bonger, R. and R. Chandron. New Developments in Air-cooled Steam CondensingPaloAlto, CA: EPRI; 1995: Paper 18.
7. Conradie, A. E.; J. D. Buys, and D. G. Kröger. Performance Optimization of Dry-CoolingSystems for Power Plants through SQP Methods. Applied Thermal Engineering. 1998; 18(1-2):25-45.
8. Conradie, T. A. and D. G. Kröger. Enhanced Performance of a Dry-Cooled Power Plantthrough Air Precooling. International Power Generation Conference, San Diego, CA; 1991 Oct6-1991 Oct 10; ASME Paper No. 91-JPGC-Pwr-6.
9. Ecker, J. G. and R. D. Wiebking. Optimal Design of a Dry-Type Natural-Draft CoolingTower by Geometric Programming. Journal of Optimization Theory and Applications. 1978 Oct;26(2):305-323.
10. Eldredge, T. V. Cooling Tower Modeling with Computational Fluid DynamicsPalo Alto,CA: Electric Power Research Institute; 1995.
11. Hutton, David. Improved Power Plant Performance with Evaporative Steam Condensing.1999 Feb; CTI TP99-08.
12. Kintner-Meyer, Michael and A. F. Emery. Cost-Optimal Analysis of Cooling Towers.ASHRAE Annual Meeting; Orlando, Florida. ASHRAE; 1994: pp. 92 -- 101.
13. Kroeger, D. G. Air-cooled Heat Exchangers and Cooling Towers. New York: BegellHouse; 1998.
Current research and development
7-6
14. Li, K. W. and W. Sadiq. Computer-Aided Optimization of Cooling Systems. Computersin Engineering Conference No. 3: ASME International; 1985: pp. 165-171.
15. Maulbetsch, J. S. and M. N. DiFilippo. Spray Cooling Enhacement of Air-CooledCondensers, Madadnia, J and H. Koosha. Proceedings of XIIth International Conference onCooling Towers; Sydney, Australia. International Association of Hydraulic Research; 2001.
16. Mirsky, G.; K. Bryant, and J-P. Libert. The Latest Worldwide Technology inEnvironmentally Designed Cooling Towers. CTI Journal. 1992; 13(2).
17. Miura, Toshio and O. Gotoh. The New Wet/Dry Cooling Tower without Finned TubeDry Section (NWD). 1998.
18. Niagara Blower Company. Available at: http://www.niagarablower.com/wsac.htm.
19. Staff report. Single row condensers build on success. 1998 Jul: 43.
20. van der Spek, H. F. The Mechanical Retrofit of a Large Cooling Tower. Cooling TowerConference; Jackson, WY. 2000.
21. van der Spek, H. F. and P. J. M. Nelissen. Advanced Low Noise Cooling FansPalo Alto,CA: Electric Power Research Institute; 1995 Feb.
8-1
8 EMERGING TECHNOLOGIES
The literature search revealed only one technology that qualifies as an “emerging” technology,i.e., one in an advanced stage of development with the potential to be seriously considered as analternative water-conserving technology for power plant cooling in the near future, say, withinthe next 5 years. This technology, based on the evaporative condenser concept, is described inthe following section. The cost and performance information is presented in the same format thatwas used in Section 5 for the wet and dry cooling systems.
Hybrid Cooling Systems: Evaporative Condenser
An alternative cooling technology, widely used in the chemical process and HVAC industriesand recently considered for power plant applications, is the evaporative condenser or wet surfaceair cooler (WSAC). Detailed descriptions of the technology are found in the CTI literature(Hutton, 1999) and on vendor websites and in brochures (Niagara Blower Company).Fundamental treatments of the thermodynamics and heat transfer mechanisms in the process arefound in standard texts and handbooks (see references in Hutton, 1999).
A unit by Resorcon (Niagara Blower, Inc.) has been operating at MassPower, a 240-MWe plantin Springfield, MA, since 1993. A description of their operating experience, based on a telephoneinterview with the plant superintendent, is included in Section 3.
A brief description of the technology follows for convenience of reference. Figure 8-1 provides aschematic view of the equipment. The process fluid, in this case condensing steam, flowsthrough horizontal tubes arranged in bundles. Air flow is induced downward across the tubebundles, turned 180° through mist eliminators and the fan, and then discharged verticallyupward. Water is circulated from a collection basin and sprayed onto the top of the tube bundles.It then flows downward, co-current with the air, and returns to the basin. Heat is transferred fromthe condensing steam through the tube walls to the falling liquid film. It is then rejected to the airstream as both sensible and latent heat, as is the case in a conventional wet cooling tower.
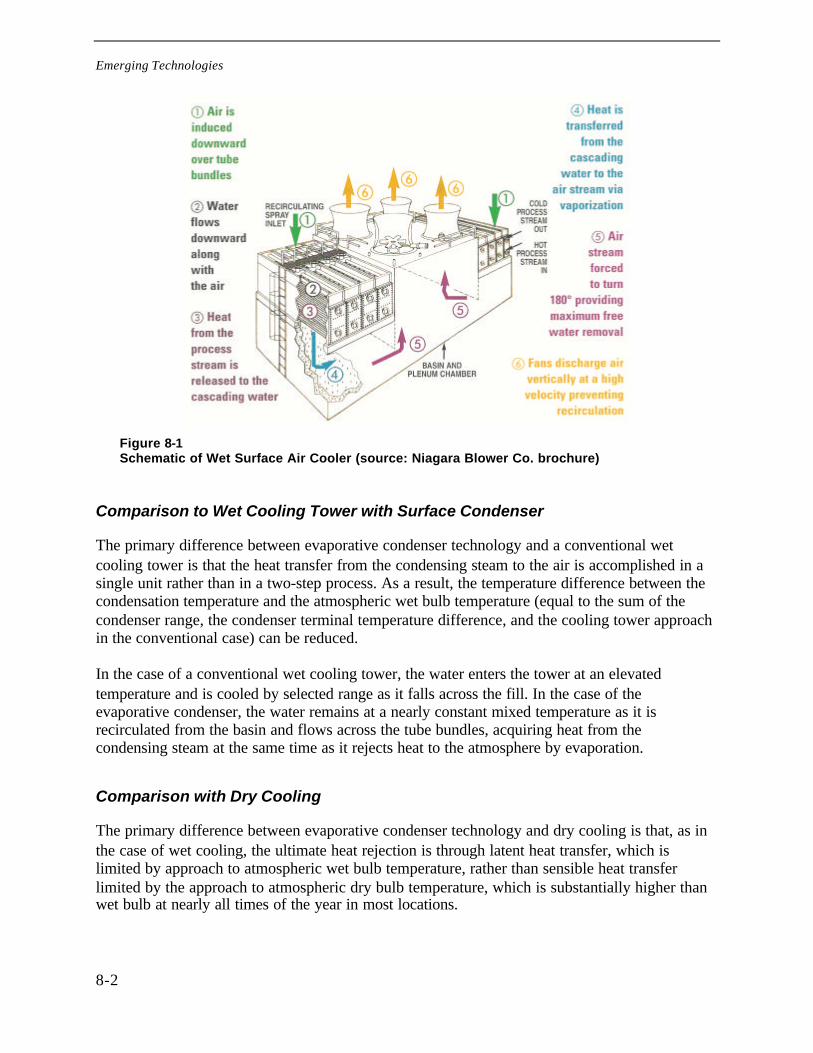
Emerging Technologies
8-2
Figure 8-1Schematic of Wet Surface Air Cooler (source: Niagara Blower Co. brochure)
Comparison to Wet Cooling Tower with Surface Condenser
The primary difference between evaporative condenser technology and a conventional wetcooling tower is that the heat transfer from the condensing steam to the air is accomplished in asingle unit rather than in a two-step process. As a result, the temperature difference between thecondensation temperature and the atmospheric wet bulb temperature (equal to the sum of thecondenser range, the condenser terminal temperature difference, and the cooling tower approachin the conventional case) can be reduced.
In the case of a conventional wet cooling tower, the water enters the tower at an elevatedtemperature and is cooled by selected range as it falls across the fill. In the case of theevaporative condenser, the water remains at a nearly constant mixed temperature as it isrecirculated from the basin and flows across the tube bundles, acquiring heat from thecondensing steam at the same time as it rejects heat to the atmosphere by evaporation.
Comparison with Dry Cooling
The primary difference between evaporative condenser technology and dry cooling is that, as inthe case of wet cooling, the ultimate heat rejection is through latent heat transfer, which islimited by approach to atmospheric wet bulb temperature, rather than sensible heat transferlimited by the approach to atmospheric dry bulb temperature, which is substantially higher thanwet bulb at nearly all times of the year in most locations.
Emerging Technologies
8-3
Water Use Considerations
The equipment is normally designed to operate in an “all wet” mode, where water conservationis not a limiting factor and full advantage can be taken of evaporation of the recirculating waterto provide maximum cooling.
If water conservation is an objective, the unit can be designed for perhaps 50% waterconsumption on an annual basis. Full water use would be used during the hotter hours, but waterflow could be reduced or turned off to some of the tube bundles during colder periods. Waterconservation below 50% consumption is not feasible for this technology since the tubes are notfinned, and the performance of a dry bundle is limited. Therefore, extended use in the dry modewould require an uneconomically large unit.
Capital Cost Elements
The system chosen to represent the evaporative condenser technology is the WSAC of the typeused at MassPower. A water-conserving version of this technology, known as WSDAC (wetsurface/dry air cooler), is also available for water-constrained applications.
The major elements of the capital cost are displayed in Table 8-1.

Emerging Technologies
8-4
Table 8-1Capital Cost Elements for Evaporative Condenser Equipment (for New 500-MWe Combined-Cycle Plants with 170-MWe Steam Cycle)
Element Comment Cost
Base unit—evaporativecondenser
Fabricated unit including tubebundles, headers, fans, sprays,mist eliminator, piping, andconnections
Consistently represents 2/3 (65–70%) of the total installed cost; forfull wet operation: ~$70/cell; forwet/dry operation: ~$85/cell
Recirculating spray pumps Including drive motors Significant cost element: 4– 6% oftotal installed cost; lower end ofrange for wet/dry systems
Concrete (plenum and basin) Including typical sitepreparation and installation
Significant cost element: 14–16%(plenum = 5–6%; basin = 8–10%);high end of range for all-wet systems
Steam duct Includes support structure;varies with site layout
Significant cost element: typically 7–8% of total installed cost
Condensate collection andreturn
Circulating water system(pumps, piping, valves, etc.)
Typically 2–3% of total installed cost
Electricals and controls Wiring and hook-up; base priceincludes instrumentation
Typically 1–2% of total installed cost
Walkways and ladders — About 1.5% of total installed cost
Steam ejector — Minor; approximately $60k
Installation Requires crane, anchoring tofoundation, piping connections
Typically 1.5–2% of total installedcost
Auxiliary cooling Separate unit or additional cellon condenser
Typically 5% additional heat loadand ~5–6% additional cost; seeTable 8-4
Other elements Typically minor; may besignificant at specific sites
Not included in case study estimatesor comparisons
- Water supply/intake structure Location dependent; significant only if water source is far from site or ata much lower elevation
- Water treatment/blowdowndischarge
Usually minor; may be significant if in zero-discharge region
- Site preparation/accessprovision
Highly site dependent; likely minor; not likely to be affected significantlyby system choice
- Painting, fire and lightningprotection, acceptance testing
Minor costs
- Delivery and unloading Entirely site and location dependent; typically minor
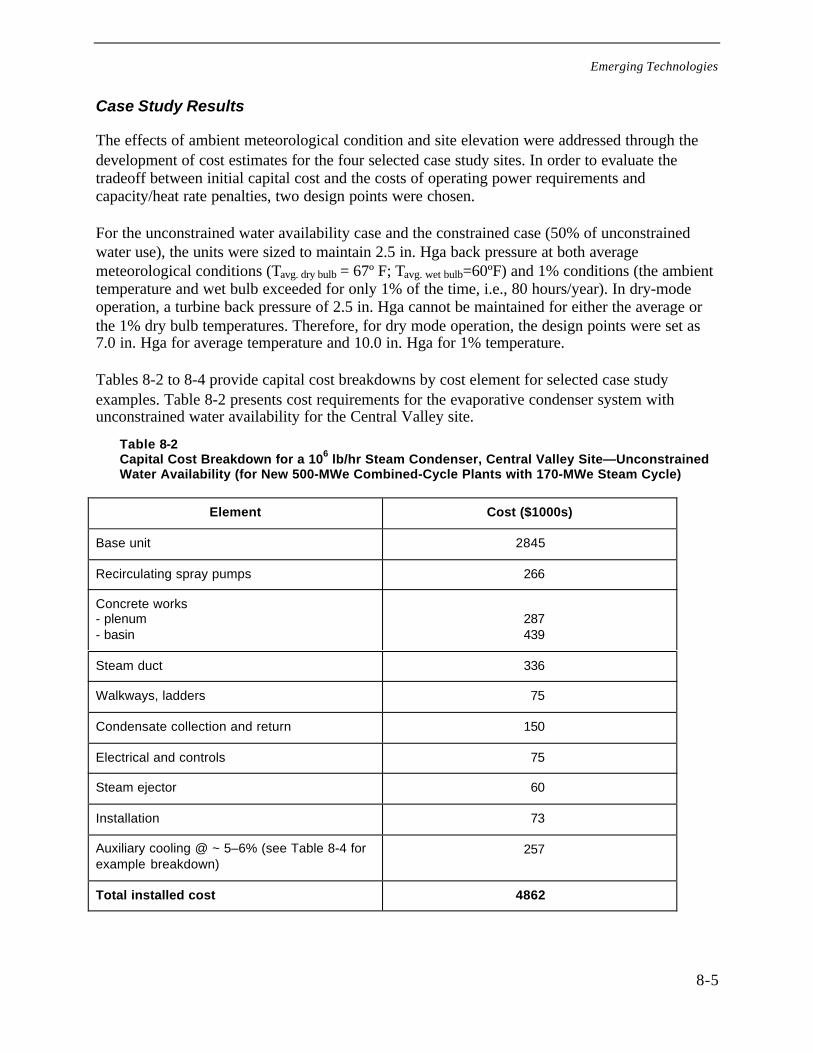
Emerging Technologies
8-5
Case Study Results
The effects of ambient meteorological condition and site elevation were addressed through thedevelopment of cost estimates for the four selected case study sites. In order to evaluate thetradeoff between initial capital cost and the costs of operating power requirements andcapacity/heat rate penalties, two design points were chosen.
For the unconstrained water availability case and the constrained case (50% of unconstrainedwater use), the units were sized to maintain 2.5 in. Hga back pressure at both averagemeteorological conditions (Tavg. dry bulb = 67º F; Tavg. wet bulb=60ºF) and 1% conditions (the ambienttemperature and wet bulb exceeded for only 1% of the time, i.e., 80 hours/year). In dry-modeoperation, a turbine back pressure of 2.5 in. Hga cannot be maintained for either the average orthe 1% dry bulb temperatures. Therefore, for dry mode operation, the design points were set as7.0 in. Hga for average temperature and 10.0 in. Hga for 1% temperature.
Tables 8-2 to 8-4 provide capital cost breakdowns by cost element for selected case studyexamples. Table 8-2 presents cost requirements for the evaporative condenser system withunconstrained water availability for the Central Valley site.
Table 8-2Capital Cost Breakdown for a 106 lb/hr Steam Condenser, Central Valley Site—UnconstrainedWater Availability (for New 500-MWe Combined-Cycle Plants with 170-MWe Steam Cycle)
Element Cost ($1000s)
Base unit 2845
Recirculating spray pumps 266
Concrete works- plenum- basin
287439
Steam duct 336
Walkways, ladders 75
Condensate collection and return 150
Electrical and controls 75
Steam ejector 60
Installation 73
Auxiliary cooling @ ~ 5–6% (see Table 8-4 forexample breakdown)
257
Total installed cost 4862
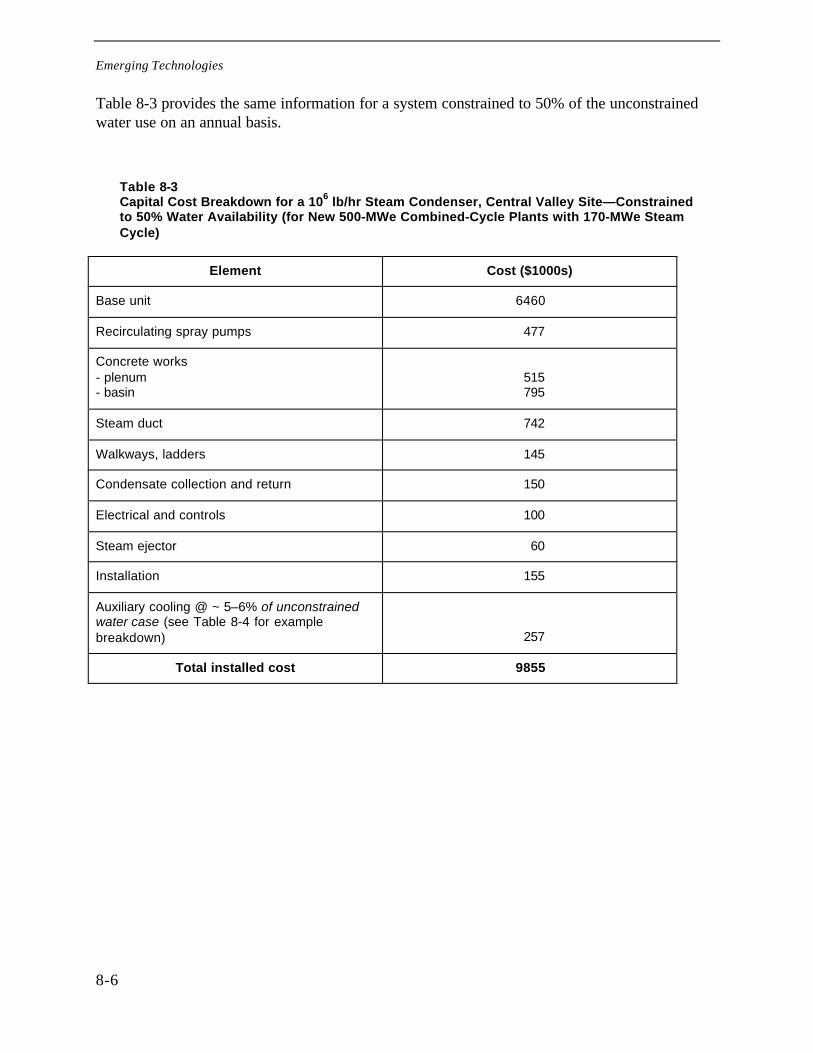
Emerging Technologies
8-6
Table 8-3 provides the same information for a system constrained to 50% of the unconstrainedwater use on an annual basis.
Table 8-3Capital Cost Breakdown for a 106 lb/hr Steam Condenser, Central Valley Site—Constrainedto 50% Water Availability (for New 500-MWe Combined-Cycle Plants with 170-MWe SteamCycle)
Element Cost ($1000s)
Base unit 6460
Recirculating spray pumps 477
Concrete works- plenum- basin
515795
Steam duct 742
Walkways, ladders 145
Condensate collection and return 150
Electrical and controls 100
Steam ejector 60
Installation 155
Auxiliary cooling @ ~ 5–6% of unconstrainedwater case (see Table 8-4 for examplebreakdown) 257
Total installed cost 9855
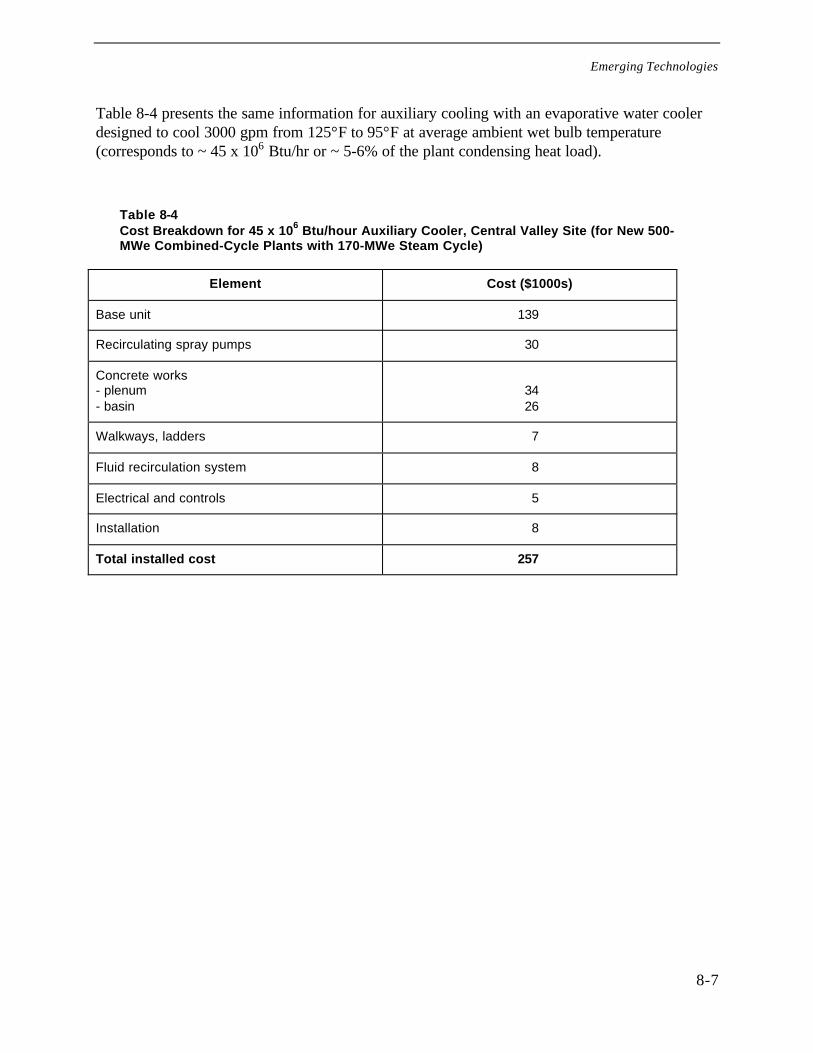
Emerging Technologies
8-7
Table 8-4 presents the same information for auxiliary cooling with an evaporative water coolerdesigned to cool 3000 gpm from 125°F to 95°F at average ambient wet bulb temperature(corresponds to ~ 45 x 106 Btu/hr or ~ 5-6% of the plant condensing heat load).
Table 8-4Cost Breakdown for 45 x 106 Btu/hour Auxiliary Cooler, Central Valley Site (for New 500-MWe Combined-Cycle Plants with 170-MWe Steam Cycle)
Element Cost ($1000s)
Base unit 139
Recirculating spray pumps 30
Concrete works- plenum- basin
3426
Walkways, ladders 7
Fluid recirculation system 8
Electrical and controls 5
Installation 8
Total installed cost 257
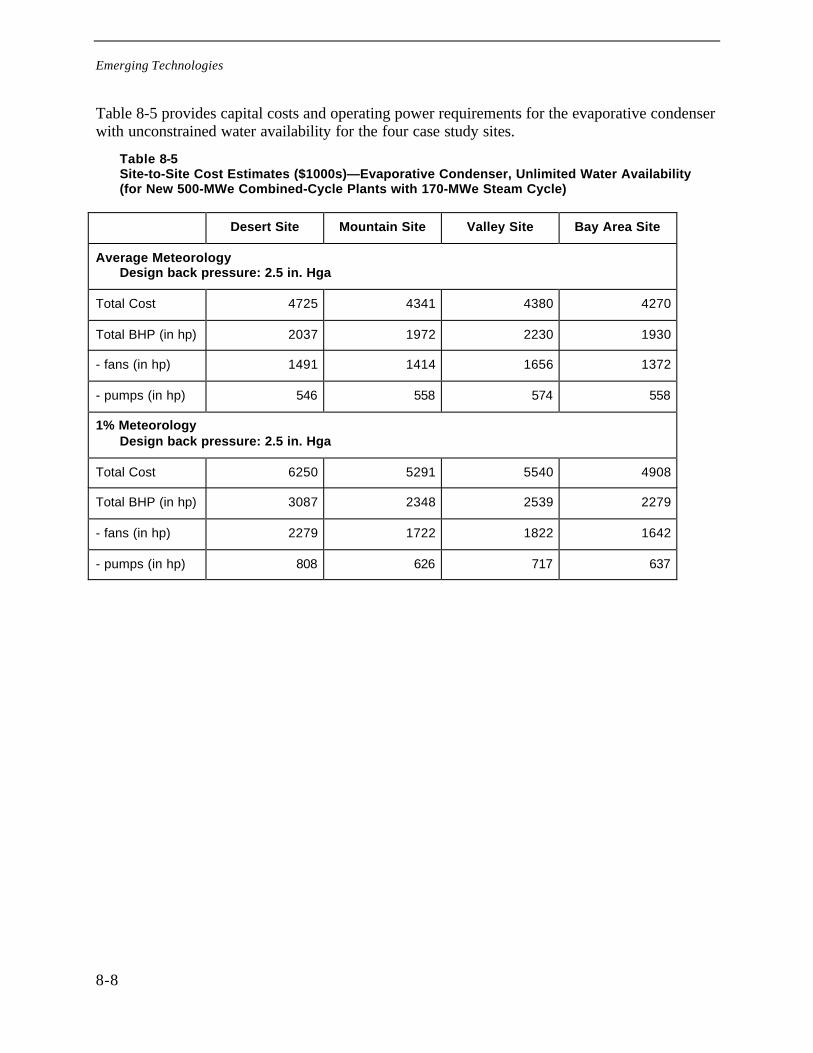
Emerging Technologies
8-8
Table 8-5 provides capital costs and operating power requirements for the evaporative condenserwith unconstrained water availability for the four case study sites.
Table 8-5Site-to-Site Cost Estimates ($1000s)—Evaporative Condenser, Unlimited Water Availability(for New 500-MWe Combined-Cycle Plants with 170-MWe Steam Cycle)
Desert Site Mountain Site Valley Site Bay Area Site
Average MeteorologyDesign back pressure: 2.5 in. Hga
Total Cost 4725 4341 4380 4270
Total BHP (in hp) 2037 1972 2230 1930
- fans (in hp) 1491 1414 1656 1372
- pumps (in hp) 546 558 574 558
1% MeteorologyDesign back pressure: 2.5 in. Hga
Total Cost 6250 5291 5540 4908
Total BHP (in hp) 3087 2348 2539 2279
- fans (in hp) 2279 1722 1822 1642
- pumps (in hp) 808 626 717 637
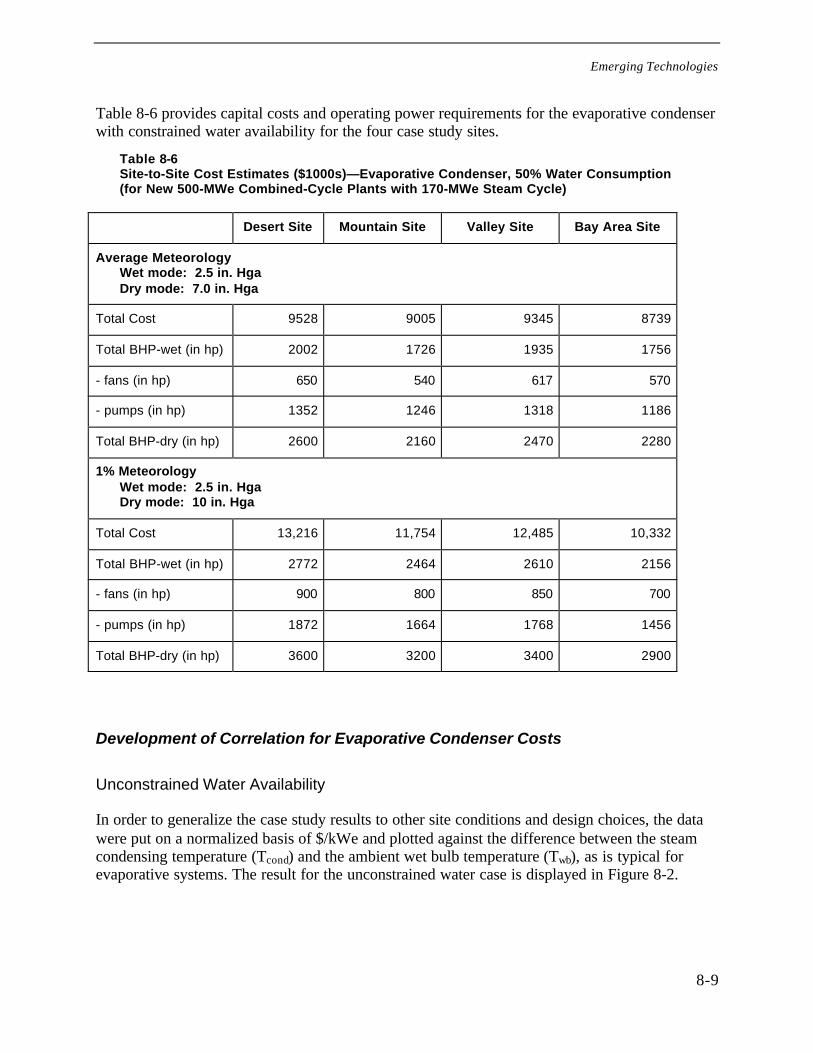
Emerging Technologies
8-9
Table 8-6 provides capital costs and operating power requirements for the evaporative condenserwith constrained water availability for the four case study sites.
Table 8-6Site-to-Site Cost Estimates ($1000s)—Evaporative Condenser, 50% Water Consumption(for New 500-MWe Combined-Cycle Plants with 170-MWe Steam Cycle)
Desert Site Mountain Site Valley Site Bay Area Site
Average MeteorologyWet mode: 2.5 in. HgaDry mode: 7.0 in. Hga
Total Cost 9528 9005 9345 8739
Total BHP-wet (in hp) 2002 1726 1935 1756
- fans (in hp) 650 540 617 570
- pumps (in hp) 1352 1246 1318 1186
Total BHP-dry (in hp) 2600 2160 2470 2280
1% MeteorologyWet mode: 2.5 in. HgaDry mode: 10 in. Hga
Total Cost 13,216 11,754 12,485 10,332
Total BHP-wet (in hp) 2772 2464 2610 2156
- fans (in hp) 900 800 850 700
- pumps (in hp) 1872 1664 1768 1456
Total BHP-dry (in hp) 3600 3200 3400 2900
Development of Correlation for Evaporative Condenser Costs
Unconstrained Water Availability
In order to generalize the case study results to other site conditions and design choices, the datawere put on a normalized basis of $/kWe and plotted against the difference between the steamcondensing temperature (Tcond) and the ambient wet bulb temperature (Twb), as is typical forevaporative systems. The result for the unconstrained water case is displayed in Figure 8-2.
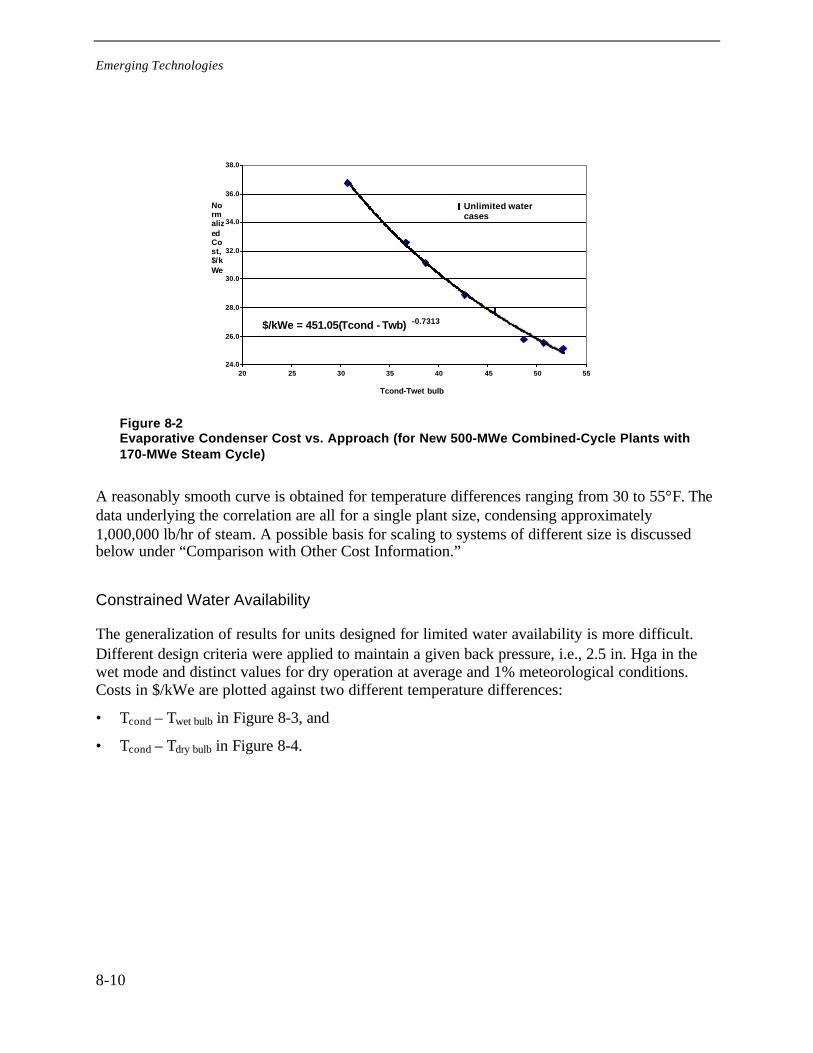
Emerging Technologies
8-10
$/kWe = 451.05(Tcond - Twb) -0.7313
24.0
26.0
28.0
30.0
32.0
34.0
36.0
38.0
20 25 30 35 40 45 50 55
Tcond-Twet bulb
NormalizedCost,$/kWe
Unlimited watercases
Figure 8-2Evaporative Condenser Cost vs. Approach (for New 500-MWe Combined-Cycle Plants with170-MWe Steam Cycle)
A reasonably smooth curve is obtained for temperature differences ranging from 30 to 55°F. Thedata underlying the correlation are all for a single plant size, condensing approximately1,000,000 lb/hr of steam. A possible basis for scaling to systems of different size is discussedbelow under “Comparison with Other Cost Information.”
Constrained Water Availability
The generalization of results for units designed for limited water availability is more difficult.Different design criteria were applied to maintain a given back pressure, i.e., 2.5 in. Hga in thewet mode and distinct values for dry operation at average and 1% meteorological conditions.Costs in $/kWe are plotted against two different temperature differences:
• Tcond – Twet bulb in Figure 8-3, and
• Tcond – Tdry bulb in Figure 8-4.
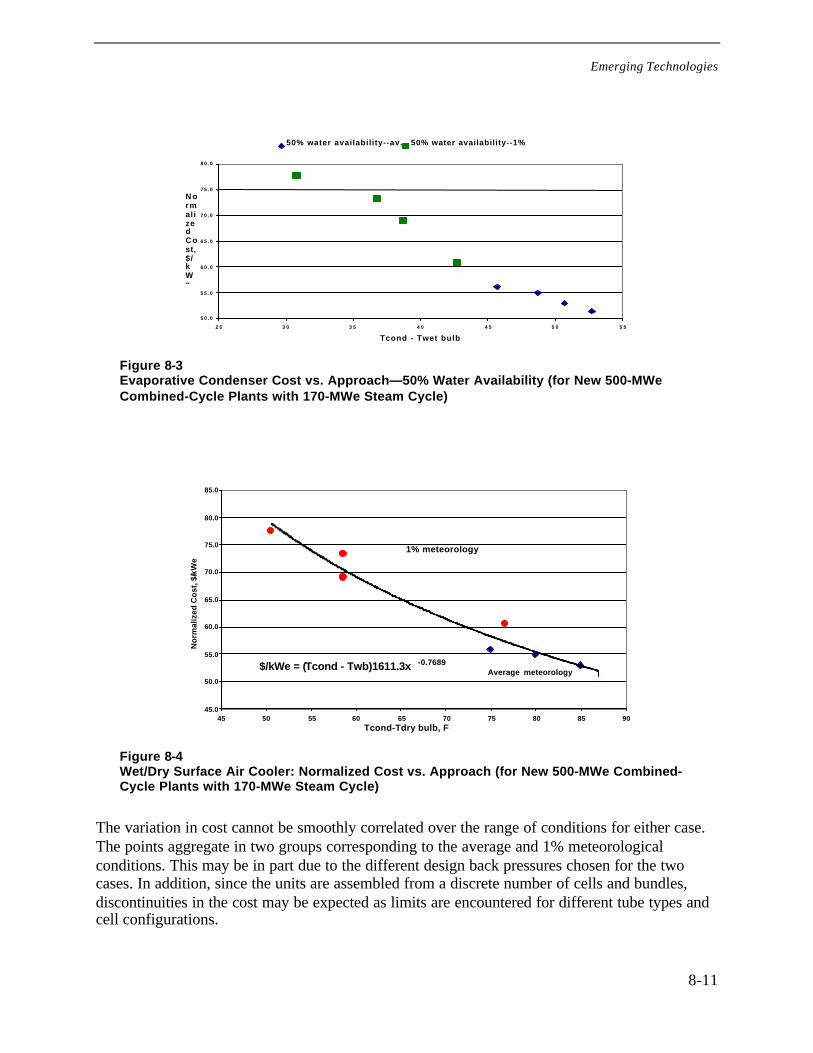
Emerging Technologies
8-11
5 0 . 0
5 5 . 0
6 0 . 0
6 5 . 0
7 0 . 0
7 5 . 0
8 0 . 0
2 5 3 0 3 5 4 0 4 5 5 0 5 5
Tcond - Twet bulb
N ormalizedC ost,$/kWe
50% water availability--av. 50% water availability--1%
Figure 8-3Evaporative Condenser Cost vs. Approach—50% Water Availability (for New 500-MWeCombined-Cycle Plants with 170-MWe Steam Cycle)
$/kWe = (Tcond - Twb)1611.3x -0.7689
45.0
50.0
55.0
60.0
65.0
70.0
75.0
80.0
85.0
45 50 55 60 65 70 75 80 85 90Tcond-Tdry bulb, F
No
rmal
ized
Co
st, $
/kW
e
Average meteorology
1% meteorology
Figure 8-4Wet/Dry Surface Air Cooler: Normalized Cost vs. Approach (for New 500-MWe Combined-Cycle Plants with 170-MWe Steam Cycle)
The variation in cost cannot be smoothly correlated over the range of conditions for either case.The points aggregate in two groups corresponding to the average and 1% meteorologicalconditions. This may be in part due to the different design back pressures chosen for the twocases. In addition, since the units are assembled from a discrete number of cells and bundles,discontinuities in the cost may be expected as limits are encountered for different tube types andcell configurations.
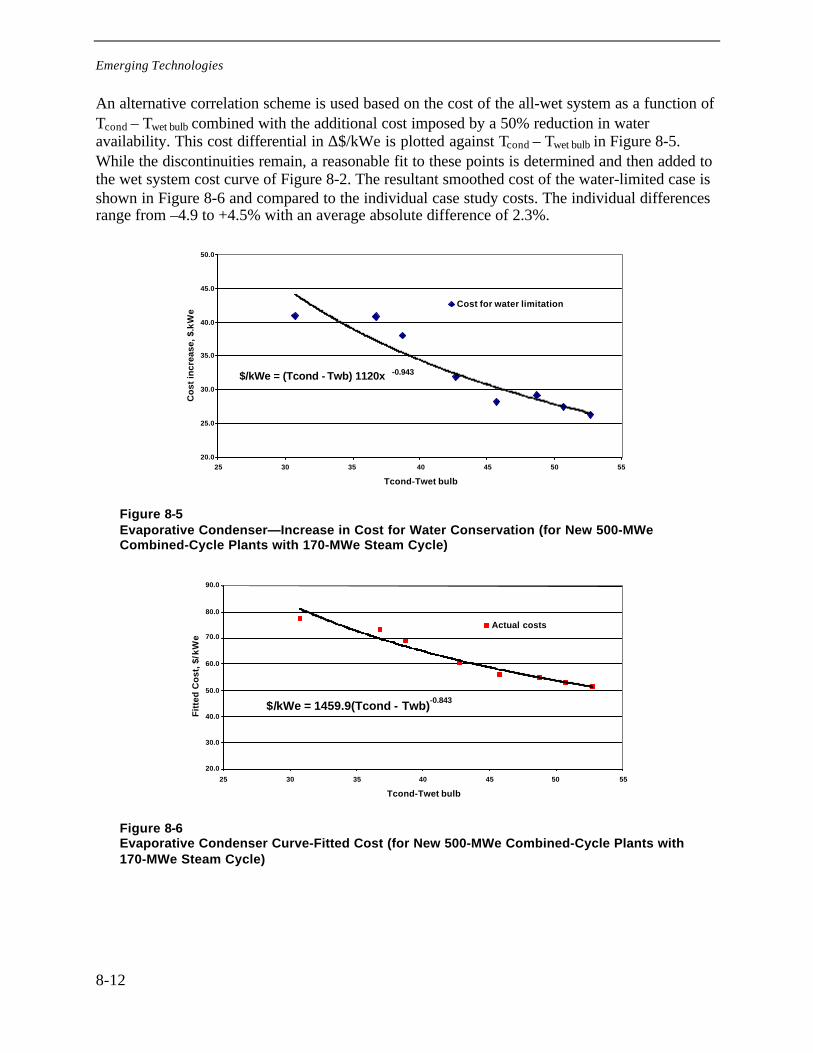
Emerging Technologies
8-12
An alternative correlation scheme is used based on the cost of the all-wet system as a function ofTcond – Twet bulb combined with the additional cost imposed by a 50% reduction in wateravailability. This cost differential in ∆$/kWe is plotted against Tcond – Twet bulb in Figure 8-5.While the discontinuities remain, a reasonable fit to these points is determined and then added tothe wet system cost curve of Figure 8-2. The resultant smoothed cost of the water-limited case isshown in Figure 8-6 and compared to the individual case study costs. The individual differencesrange from –4.9 to +4.5% with an average absolute difference of 2.3%.
$/kWe = (Tcond - Twb) 1120x -0.943
20.0
25.0
30.0
35.0
40.0
45.0
50.0
25 30 35 40 45 50 55
Tcond-Twet bulb
Co
st in
crea
se, $
.kW
e
Cost for water limitation
Figure 8-5Evaporative Condenser—Increase in Cost for Water Conservation (for New 500-MWeCombined-Cycle Plants with 170-MWe Steam Cycle)
$/kWe = 1459.9(Tcond - Twb)-0.843
20.0
30.0
40.0
50.0
60.0
70.0
80.0
90.0
25 30 35 40 45 50 55
Tcond-Twet bulb
Fit
ted
Co
st, $
/kW
e
Actual costs
Figure 8-6Evaporative Condenser Curve-Fitted Cost (for New 500-MWe Combined-Cycle Plants with170-MWe Steam Cycle)
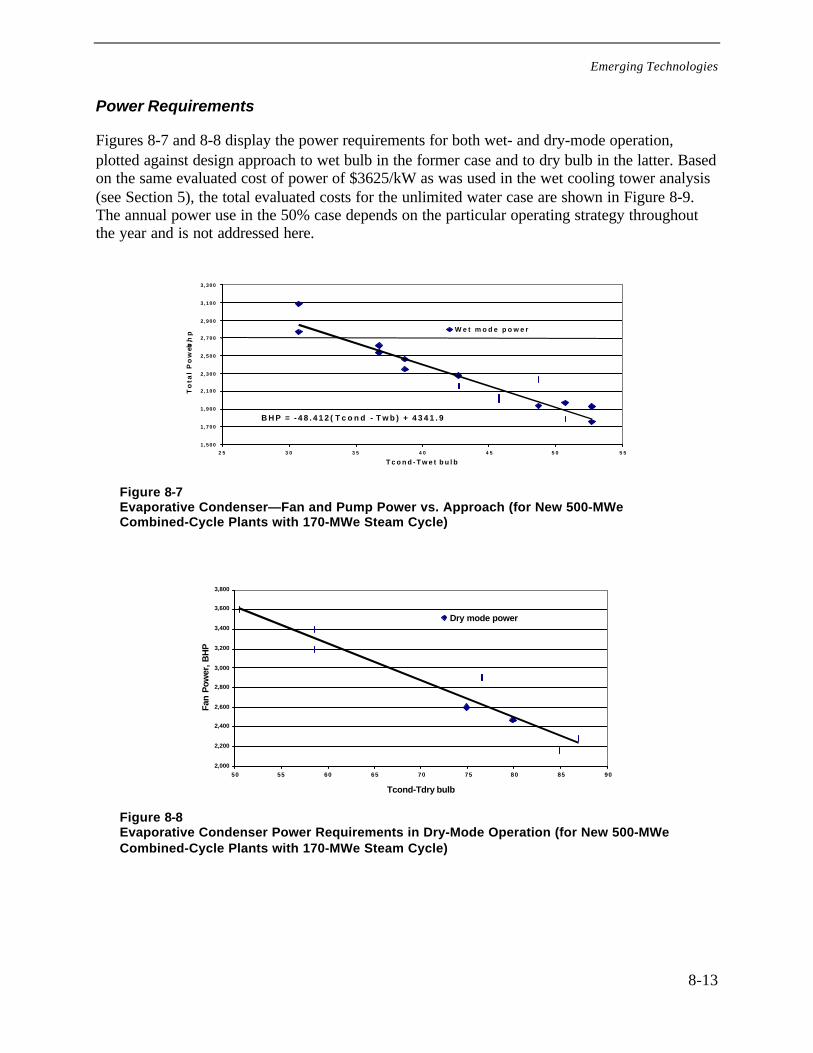
Emerging Technologies
8-13
Power Requirements
Figures 8-7 and 8-8 display the power requirements for both wet- and dry-mode operation,plotted against design approach to wet bulb in the former case and to dry bulb in the latter. Basedon the same evaluated cost of power of $3625/kW as was used in the wet cooling tower analysis(see Section 5), the total evaluated costs for the unlimited water case are shown in Figure 8-9.The annual power use in the 50% case depends on the particular operating strategy throughoutthe year and is not addressed here.
B H P = - 4 8 . 4 1 2 ( T c o n d - T w b ) + 4 3 4 1 . 9
1 , 5 0 0
1 , 7 0 0
1 , 9 0 0
2 , 1 0 0
2 , 3 0 0
2 , 5 0 0
2 , 7 0 0
2 , 9 0 0
3 , 1 0 0
3 , 3 0 0
2 5 3 0 3 5 4 0 4 5 5 0 5 5
T c o n d - T w e t b u l b
To
tal
Po
we
r,
bh
p W e t m o d e p o w e r
Figure 8-7Evaporative Condenser—Fan and Pump Power vs. Approach (for New 500-MWeCombined-Cycle Plants with 170-MWe Steam Cycle)
2,000
2,200
2,400
2,600
2,800
3,000
3,200
3,400
3,600
3,800
50 55 60 65 70 75 80 85 90
Tcond-Tdry bulb
Fan
Pow
er, B
HP
Dry mode power
Figure 8-8Evaporative Condenser Power Requirements in Dry-Mode Operation (for New 500-MWeCombined-Cycle Plants with 170-MWe Steam Cycle)
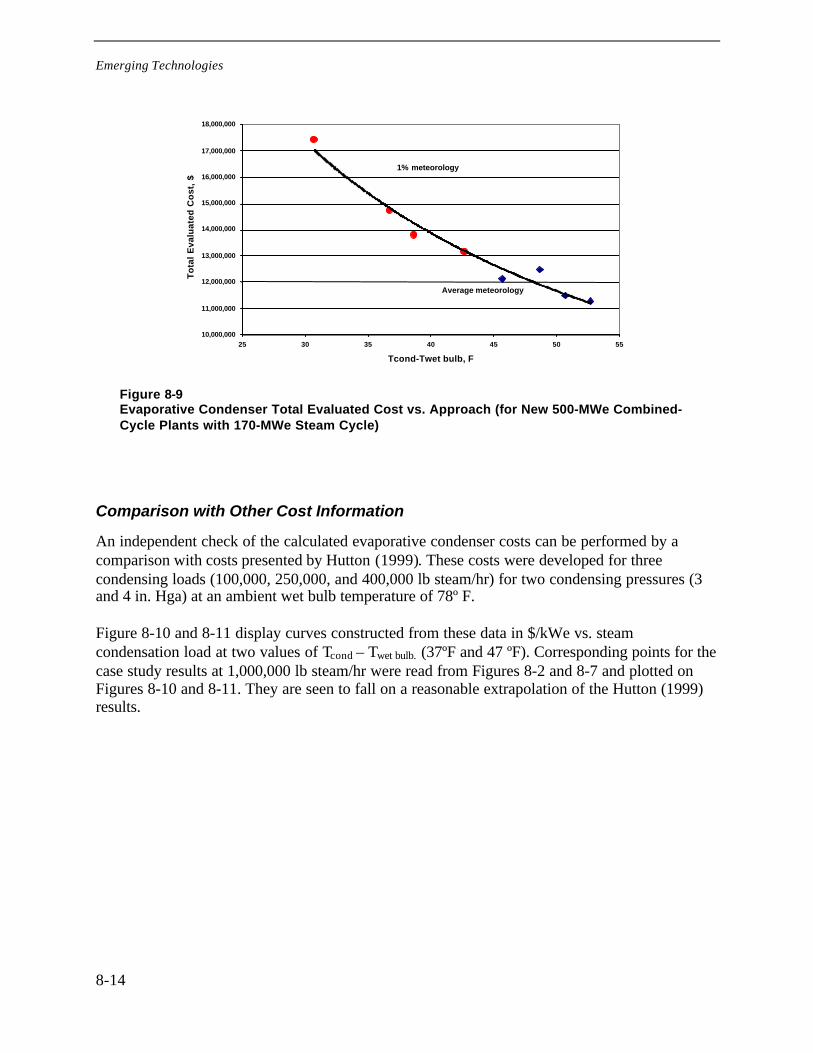
Emerging Technologies
8-14
10,000,000
11,000,000
12,000,000
13,000,000
14,000,000
15,000,000
16,000,000
17,000,000
18,000,000
25 30 35 40 45 50 55
Tcond-Twet bulb, F
To
tal
Eva
luat
ed C
ost
, $
1% meteorology
Average meteorology
Figure 8-9Evaporative Condenser Total Evaluated Cost vs. Approach (for New 500-MWe Combined-Cycle Plants with 170-MWe Steam Cycle)
Comparison with Other Cost Information
An independent check of the calculated evaporative condenser costs can be performed by acomparison with costs presented by Hutton (1999). These costs were developed for threecondensing loads (100,000, 250,000, and 400,000 lb steam/hr) for two condensing pressures (3and 4 in. Hga) at an ambient wet bulb temperature of 78º F.
Figure 8-10 and 8-11 display curves constructed from these data in $/kWe vs. steamcondensation load at two values of Tcond – Twet bulb. (37ºF and 47 ºF). Corresponding points for thecase study results at 1,000,000 lb steam/hr were read from Figures 8-2 and 8-7 and plotted onFigures 8-10 and 8-11. They are seen to fall on a reasonable extrapolation of the Hutton (1999)results.
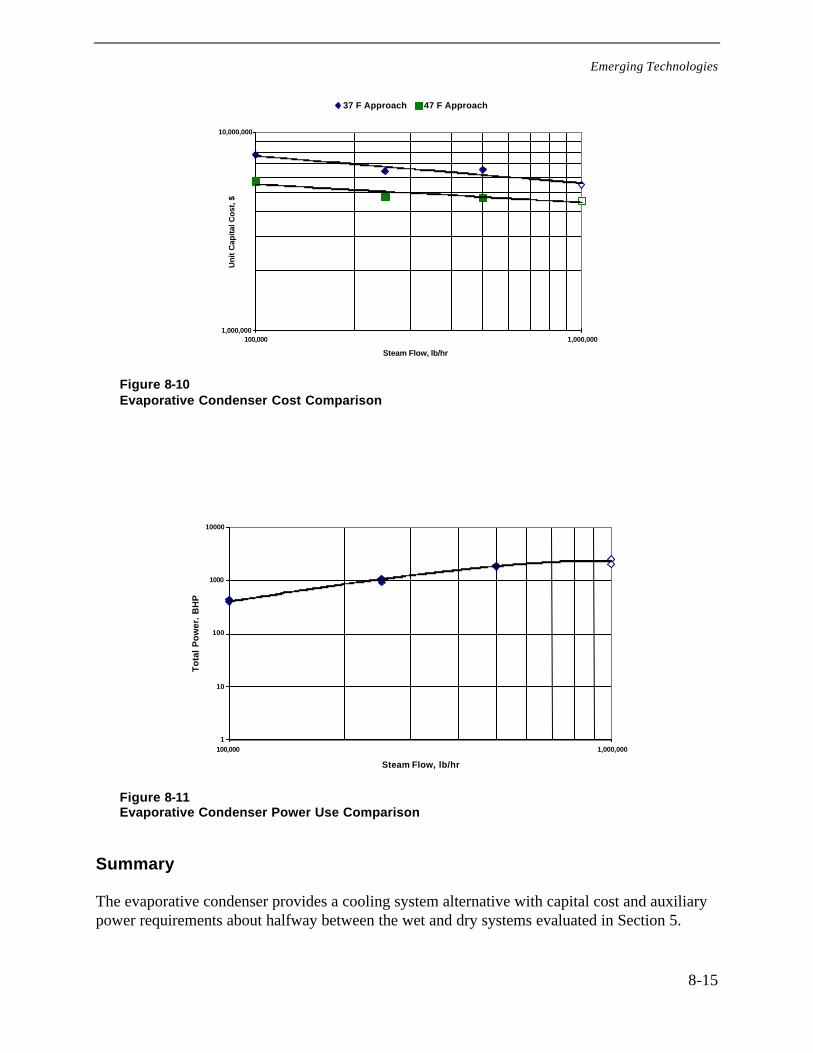
Emerging Technologies
8-15
1,000,000
10,000,000
100,000 1,000,000
Steam Flow, lb/hr
Un
it C
apita
l Co
st, $
37 F Approach 47 F Approach
Figure 8-10Evaporative Condenser Cost Comparison
1
10
100
1000
10000
100,000 1,000,000
Steam Flow, lb/hr
To
tal
Po
wer
. B
HP
Figure 8-11Evaporative Condenser Power Use Comparison
Summary
The evaporative condenser provides a cooling system alternative with capital cost and auxiliarypower requirements about halfway between the wet and dry systems evaluated in Section 5.
Emerging Technologies
8-16
Evaporative condenser designs can be developed both for conditions of unlimited wateravailability and for conditions where some water use constraints exist.
The system is not an economical choice for conditions where water availability is severelylimited. Maximum achievable water conservation is about one-half that of a wet cooling system.
For unlimited water availability, where the evaporative condenser would compete with wetcooling towers, the estimated costs for the four case study sites range from 1.5 to 2 times thosefor wet cooling tower surface condensers presented in Section 5. In addition, evaporativecondensers have higher auxiliary power requirements.
Evaporative condenser designs provide some ancillary benefits, however, including the ability tooperate in a plume abatement mode during colder periods, the ability to operate with lower-quality water without scaling or corrosion, and improved characteristics in freezing conditions.These qualities led to its choice in the MassPower application described in Section 3.
If water conservation (up to 50%) is desired, the cost of the unit approximately doubles and thepower requirements increase by approximately 20 to 30%. The unit also incurs substantialefficiency and capacity penalties while operating in the dry mode. Economical designs, in theseestimates, are sized for 7 in. Hga back pressure at average meteorological conditions and 10 in.Hga back pressure if sized for 1% meteorology (temperature level exceeded for only 80 hoursper year). The costs and power requirements are well below those for an all-dry system, but only50% of the annual water savings can be realized and, during periods of wet operation, thewithdrawal rates are the same as for wet cooling systems.
References
1. Hutton, Dave. Improved Power Plant Performance with Evaporative Steam Condensing.1999 Feb; CTI TP99-08.
2. Niagara Blower Company. Available at: http://www.niagarablower.com/wsac.htm.
9-1
9 SUMMARY AND CONCLUSIONS
This report documents the results of a study of alternative cooling systems for electric powergenerating plants. The people and businesses of California require increasing amounts of bothenergy and water. On occasion, the use of water for power plant cooling can conflict with thewater needs of the residential, commercial, industrial, and agricultural sectors and withenvironmental requirements to maintain adequate in-stream flows. This has resulted in increasinginterest in California and elsewhere in the use of dry or hybrid wet/dry cooling systems.
This study examined alternative cooling systems and compared them in several dimensions:
• Water consumption
• Plant performance
• Cost
• Operations and maintenance (O&M)
• Environmental effects
In addition, current R&D and technology development efforts were surveyed to assess theprospects for significant changes in the comparative attributes of the alternative systems in thenear term.
Results of the study indicate that while dry and wet/dry systems undeniably reduce waterrequirements at power plants, they do so at some cost—both capital costs for the cooling systemcomponents themselves and associated “penalty” costs resulting from higher auxiliary energyrequirements to operate the systems, reduced plant efficiency, occasionally limited plant output,and perhaps additional operating and maintenance requirements. Additionally, while the drysystems reduce or eliminate many of the environmental effects of wet cooling, some effects doexist, and others have been postulated.
The following paragraphs summarize the results and conclusions of this study in specific areas.
Water Consumption
Dry cooling reduces the amount of water used in a power plant by eliminating the consumptionof water through evaporation in a wet cooling tower. In order to understand the significance ofthe reduction, it is necessary to distinguish between cooling system water consumption and totalplant water consumption, which includes many uses that exist regardless of which coolingsystem is employed (see Table 1-1 and the accompanying text).
Summary and Conclusions
9-2
For plants equipped with wet recirculating cooling systems (wet towers) for steam condensation,the evaporation of water in the cooling tower is the largest single water use in the plant,accounting for approximately two-thirds of total water consumption at a gas-fired combined-cycle plant (and perhaps 95% at a stand-alone thermal steam plant). The following comparisonsare based on combined-cycle plants, with two-thirds of plant output from the combustionturbines and one-third from the steam turbine.
For the cooling system alone (including condensation of steam turbine exhaust plus auxiliarycooling estimated at 5% of the condensing heat load), dry cooling affords a 95% reduction inwater use from, typically, 250 gallons per MWh of plant output to perhaps 10 gallons/MWh.
For the entire plant, additional water use—primarily for emissions control and turbine inletcooling where used—is estimated at approximately 100 gallons per MWh (plant output),representing the mid-range of values surveyed and reported by the California EnergyCommission (CEC, 2001a). This results in plant water use of 350 gallons per MWh with wetcooling and 110 gallons per MWh with dry cooling, an overall reduction of approximately 70%.
Plant Performance
In essentially all situations, the use of water as the cooling medium is the cheapest way toprovide cooling at power plants. Furthermore, wet cooling always results in higher annual plantoutput and in more efficient plant performance during most of the year. The relevant questionsare how much more expensive and how great is the effect on plant output and efficiency. Theperformance issues fall in three categories.
Operating Power Requirements
The energy required to operate cooling system fans and pumps is energy that must be generatedbut that cannot be exported or sold by the plant. The cost of this reduced output is incurred forthe life of the plant. It is normally expressed as the present worth of a kilowatt that could produceenergy at a projected price per MWh for the assumed plant life. This value can be traded offagainst the capital cost of the cooling system (which can normally be reduced through theexpenditure of higher amounts of fan and pump power).
For wet systems in this analysis, the present worth of the power was approximately equal to thecapital cost of the cooling system for an optimized system and approximately 160% of thecapital cost for a “low first cost” system.
For dry systems, the operating power for a given heat load is much greater—by a factor of 4 to6—than that for an optimized wet system.
Efficiency Penalties
The ability of a cooling system, wet or dry, to reject heat to the environment is affected byambient conditions—ambient wet bulb temperature for wet cooling towers and ambient dry bulb
Summary and Conclusions
9-3
temperature for dry systems. As these temperatures rise, the turbine back pressure also rises, witha resultant reduction in turbine efficiency. Plant output can sometimes be maintained byincreasing the steam flow to the turbine if the steam supply system has additional capacity.Alternatively, in the case of a fixed steam supply, the plant output will decrease.
Capacity Penalties
If ambient temperatures rise sufficiently high, the achievable back pressure may exceed themaximum allowable back pressure specified for the turbine. In this case, steam flow must bereduced to protect the turbine, and plant output will be limited at that level.
Cost
The performance and cost issues are inextricably related. The initial choice of a larger, highercapacity and, hence, more expensive cooling system will result in higher plant capacity and moreefficient operation for the life of the plant. This is true for all cooling systems, wet as well as dry.
In general, a proper cost comparison among alternative cooling systems must be made betweenoptimized selections at a particular site. An optimized system would normally be defined as onethat minimizes the sum of all costs---initial capital cost, operating energy cost, efficiency penaltycost, and capacity penalty cost---for the life of the plant. The magnitudes of these cost elementsare dependent on many variables. Some of the most important include the operatingcharacteristics of the plant generating components, the meteorology at the plant site, the presentand projected costs of fuel, the present and projected price of power, and the projected demandprofiles for the plant. The choice of the optimum or preferred design also depends on the relativeimportance assigned to present vs. future costs, which depends strongly on the economicobjectives and business plans of the plant owner. Therefore, the “optimum system” or the“system of choice” might range from a system of lowest first cost to one of lowest total lifetimecost projected for a 30-year or longer lifetime.
To illustrate the methodology for determining the various cost elements and for selecting an“optimum” system based on a range of criteria, case studies were conducted at four sites typicalof conditions in California. In each case the cooling system was sized to condense the turbineexhaust steam from the steam portion of a nominal 500-MW gas-fired combined-cycle planttypical of what is currently being proposed and built in California.
Initial capital costs for wet and dry cooling systems that could provide suitable cooling for thefour case study sites vary greatly, ranging from $2.7 to $4.1 million for wet systems and from$18 to $47 million for dry systems. Figure 9-1 displays the initial capital costs for wet and drycooling systems of both “lowest first cost” and “optimized” designs for each of the four sites.
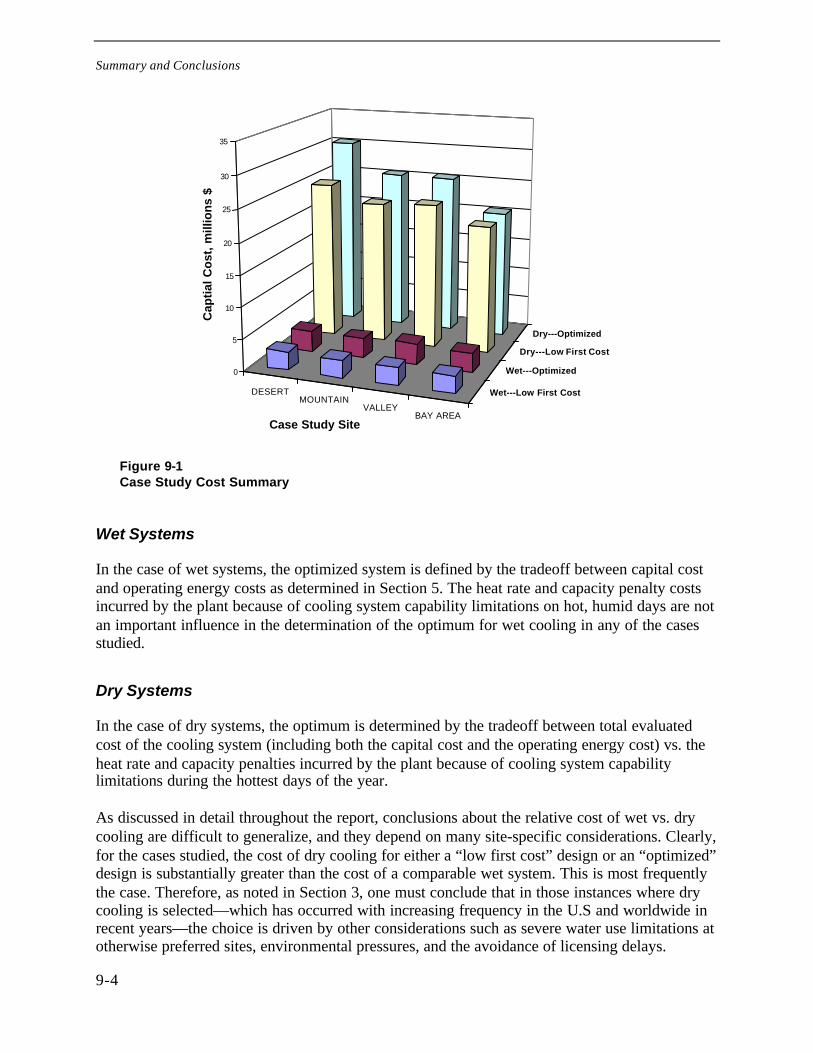
Summary and Conclusions
9-4
DESERTMOUNTAIN
VALLEYBAY AREA
Wet---Low First Cost
Wet---Optimized
Dry---Low First Cost
Dry---Optimized
0
5
10
15
20
25
30
35
Cap
tial
Co
st, m
illio
ns
$
Case Study Site
Figure 9-1Case Study Cost Summary
Wet Systems
In the case of wet systems, the optimized system is defined by the tradeoff between capital costand operating energy costs as determined in Section 5. The heat rate and capacity penalty costsincurred by the plant because of cooling system capability limitations on hot, humid days are notan important influence in the determination of the optimum for wet cooling in any of the casesstudied.
Dry Systems
In the case of dry systems, the optimum is determined by the tradeoff between total evaluatedcost of the cooling system (including both the capital cost and the operating energy cost) vs. theheat rate and capacity penalties incurred by the plant because of cooling system capabilitylimitations during the hottest days of the year.
As discussed in detail throughout the report, conclusions about the relative cost of wet vs. drycooling are difficult to generalize, and they depend on many site-specific considerations. Clearly,for the cases studied, the cost of dry cooling for either a “low first cost” design or an “optimized”design is substantially greater than the cost of a comparable wet system. This is most frequentlythe case. Therefore, as noted in Section 3, one must conclude that in those instances where drycooling is selected—which has occurred with increasing frequency in the U.S and worldwide inrecent years—the choice is driven by other considerations such as severe water use limitations atotherwise preferred sites, environmental pressures, and the avoidance of licensing delays.
Summary and Conclusions
9-5
Operations and Maintenance
Comparisons of O&M requirements were based not on detailed analyses or surveys but rather oninformation obtained during interviews and discussions with staff at operating plants equippedwith dry or hybrid systems, all of whom had had previous experience at other plants using wetcooling towers. In each case, the water-conserving system was described as basically trouble freeand easy to operate. No additional staff was required, nor was any unusual amount of staff timeallocated to the cooling system beyond occasional scheduled cleaning of the finned tubesurfaces—and this could be performed with the unit on line.
Therefore, no additional costs were assigned to dry or wet/dry systems for extra O&Mrequirements.
Environmental Effects
The comparison of environmental impacts associated with the alternative cooling systemsexamined nine areas, including the effect on water resources addressed above. The other eightareas are
• Waste management, including water discharge;
• Hazardous materials;
• Air emissions;
• Noise;
• Visual resources;
• Public health;
• Biological resources; and
• Agriculture and soils.
In many of these areas, the effects are proportional to the water use and the associatedwithdrawal, evaporation, blowdown, drift, and plume production. This is the case for impacts onwaste management, water discharge, hazardous materials, public health, and agriculture andsoils. In these cases, the use of dry cooling eliminates the effects entirely, and hybrid systemsreduce them in proportion to the reduction in water use, which is a function of cooling systemoperating profile.
The other areas are discussed further below.
Air Emissions
Dry systems eliminate effects associated with drift and volatile components stripped from thewater in wet towers. Hybrid systems do so in proportion to their water use.
Summary and Conclusions
9-6
However, the use of dry systems imposes penalties on plant efficiency and capacity, whichrequires that additional fuel be burned at the plant or elsewhere on the system to produce thesame net power generation. This leads to an increase in the emissions associated with thecombustion process. While this is a second-order effect on a state- or system-wide basis, it be ameasurable effect in the vicinity of the plant and should be considered on a case-by-case basis.
Noise
The noise from wet systems comes from both the water falling through the tower fill and the fansand air motion. In the case of dry systems, the water noise is obviously eliminated, but the fanand air noise may be increased since the quantity of air moved through the system is greater.
The importance of this effect is site specific, but, in locations where noise abatement isnecessary, the use of special low-noise fans may be required. For so-called “ultralow- noise fans”the increase in cost is estimated at approximately 10%. Similar noise abatement may be requiredfor the wet towers in some cases.
Visual Resources
Dry and wet/dry systems effectively eliminate the occurrence of visual plumes. However, theyrequire physically larger, taller structures than wet cooling and, as such, can be a more obviouselement at a plant site. The importance of this feature is also site specific.
Biological Impacts
The primary focus in this area is on entrainment and impingement losses regulated under Section316(b) of the Clean Water Act. Dry and wet/dry systems obviously reduce this impact inproportion to the reduction in total plant water use, estimated above as approximately 70%.
A postulated effect of dry cooling is so-called “atmospheric entrainment,” where insects andeven small birds may be entrained with the inlet air stream. To date, no research or informationis available on the importance of this issue.
Current R&D
There is little current R&D work being reported in the open literature on dry or wet/dry coolingsystems for power plants. A few important exceptions include improved heat exchangergeometries for finned tube bundles in air-cooled condensers (Bonger, 1995; Staff report, 1998;Kroeger, 1998); enhancement of air-cooled condenser performance with the use of limited water(Maulbetsch, 2001; Balogh, 1998); the use of evaporative condensers (Hutton, 1999; NiagaraBlower Company); and optimization techniques (Conradie, 1998).
Summary and Conclusions
9-7
Emerging Technologies
The evaporative condenser provides a cooling system alternative with capital cost and auxiliarypower requirements about halfway between the wet and dry systems evaluated in Section 5.Design choices are available both for conditions of unlimited water availability and forconditions where some water use constraints exist.
The system is not an economical choice for conditions where water availability is severelylimited; maximum achievable water conservation is about one-half that of a wet cooling system.In water-conserving applications, the cost of the unit approximately doubles, and the powerrequirements increase by approximately 20 to 30%. The unit also incurs substantial efficiencyand capacity penalties while operating in the dry mode. The costs and power requirements arewell below those for an all-dry system but only 50% of the annual water savings can be realizedand, during periods of wet operation, the withdrawal rates are the same as for wet coolingsystems.
For cases of unlimited water availability, where the evaporative condenser would compete withwet cooling towers, the estimated cost for the four case study sites ranges from 1.5 to 2 timesthose for wet cooling tower surface condenser presented in Section 5. Evaporative condensersalso have higher auxiliary power requirements. They provide some ancillary benefits, however,including the ability to operate in a plume abatement mode during colder periods, the ability tooperate with lower-quality water without scaling or corrosion, and improved characteristics infreezing conditions. These qualities led to its choice in the MassPower application as describedin Section 3.
References
California Energy Commission (CEC, 2001a), Environmental Performance Report ofCalifornia’s Electric Generation Facilities, P700-01-001, July, 2001
Bonger, R. and R. Chandron. New Developments in Air-cooled Steam CondensingPalo Alto,CA: EPRI; 1995: Paper 18.
Staff report. Single row condensers build on success. 1998 Jul: 43.
Kroeger, D. G. Air-cooled Heat Exchangers and Cooling Towers. New York: Begell House;1998.
Maulbetsch, J. S. and M. N. DiFilippo. Spray Cooling Enhacement of Air-Cooled Condensers,Madadnia, J and H. Koosha. Proceedings of XIIth International Conference on Cooling Towers;Sydney, Australia. International Association of Hydraulic Research; 2001.
Balogh, Andras and Z. Takacs. Developing Indirect Dry Cooling Systems for Modern PowerPlants [Web Page]. 1998. Available at:http://www.nemesis.at/publication/gpi_98_2/articles/33.html .

Summary and Conclusions
9-8
Hutton, David. Improved Power Plant Performance with Evaporative Steam Condensing. 1999Feb; CTI TP99-08.
Niagara Blower Company. Available at: http://www.niagarablower.com/wsac.htm.
Conradie, A. E.; J. D. Buys, and D. G. Kröger. Performance Optimization of Dry-CoolingSystems for Power Plants through SQP Methods. Applied Thermal Engineering. 1998; 18(1-2):25-45.
A-1
Appendix A ANNOTATED BIBLIOGRAPHY OF COOLING SYSTEM LITERATURE
Adams, A.P. and B. G. Lewis. Bacterial Aerosols Generated by Cooling Towers of ElectricalGenerating Plants. Cooling Tower Institute (1978).Notes: One of the earliest studies of the possibility of infectious air-borne discharge fromcooling towers using contaminated make-up water. A listing of pathogenic and opportunisticmicrobes existing in sewage is given along with some test results of aerosolized bacteria(particles per cubic meter) as a function of the number of bacteria in the circulating water. Nofirm conclusions were drawn other than to suggest the use of good disinfection methods incooling tower water treatment with particular attention to chlorine dioxide. 16 references.
Adams, S. and J. Stevens. Strategies for Improved Cooling Tower Economy. Cooling TowerInstitute (1991).Notes: Provides an analysis, for mechanical draft wet cooling towers of (1) how the choice ofdesign point (maximum wet-bulb temperature at which cold water temperature can bedelivered) and (2) effect of variable fan operation on annual tower energy consumption. Thepoint is demonstrated with simple, largely qualitative examples with no recommendationsabout how to trade off lost capacity on hot days against capital cost savings from smallertowers. No references are given.
Allemann, R. T. et al. Wet-Dry Cooling Demonstration: Test Results. 86. Palo Alto, CA, ElectricPower Research Institute.Notes: Summary report on over 10 years work (EPRI and USDOE) on an Advanced DryCooling System using a phase-change ammonia transport loop between the plant condenserand an air-cooled tower with both supplementary deluge cooling and a capacative system forshaving heat rejection peaks during daily hot periods. Extensive performance data is providedas well as comparison with (calculated) conventional dry cooling system performance. No costdata are provided. Extensive references.
Allemann, R. T. Advanced Concepts Test (ACT) Facility Summary Safety Report. 81. Palo Alto,CA, Electric Power Research Institute.Notes: Safety analysis and operational safety report for the EPRI/USDOE Advanced ConceptTest facility. The emphasis was on the risks associated with the use and handling of ammoniaas the heat transport fluid between the surface condenser and the air-cooled condenser. Theanalysis concluded that all applicable safety codes and standards for the operation of thesystem were met and that it should be reliable for a power generation application.
Allemann, R. T. Development of an Advanced Concept of Dry/Wet Cooling of PowerGenerating Plants. 81. Palo Alto, CA, Electric Power Research Institute.
Annotated Bibliography of Cooling System Literature
A-2
Notes: Description of the tests conducted at the EPRI/USDOE Advanced Concept Test facility.This report was one of a series of reports to document the ammonia phase change dry coolingsystem and to make the knowledge available to utility planners. This report presents theoverview of the facility design and the various technical support studies including componenttesting and material selection. It also outlines the operational acceptance tests and operatortraining that was planned prior to initiating the test work. 30 references.
Allemann, R. T., B. M. Johnson, and E. V. Werry. Wet-Dry Cooling Demonstration: A Transferof Technology. 87. Palo Alto, CA, Electric Power Research Institute.Notes: Final report on the four year project to develop and demonstrate the ammonia phase-change dry cooling system at Pacific Gas and Electric Company’s Kern station. Test resultsare presented on the performance of the system in three operating modes: two combining dryand evaporative cooling and one combining dry and capacitive cooling. The test programincluded both passive and active performance tests, system response to normal systemtransients and system recovery from unusual system conditions. 42 references.
Air-Cooled Heat Exchangers: A Guide to Performance Evaluation. Unknown. American Instituteof Chemical Engineers.Notes: Report of the Air-Cooled heat Exchanger Subcommittee of the American Institute ofChemical Engineers. The document is intended to specify test methods for conducting andinterpreting field performance tests of air-cooled heat exchangers with ambient air on theoutside tube surface and process stream on the inside. It does not set performancespecifications or discuss deviations from manufacturer’s predicted performance. 26references.
Air Cooled Heat Exchangers. 91. American Society of Mechanical Engineers.
Armstrong, C. H. and R. S. Schermerhorn. Economics of Dry Cooling Towers Applied toCombined-Cycle Power Plants. 73. American Society of Mechanical Engineers.Notes: One of the first treatments of the cost of dry cooling when used on combined cycleplants. A case study for an 85MWe unfired combined cycle plant was presented. The costswere shown to be highly dependent on the relationship of unit capability vs. ambienttemperature. The possibility that the adoption of dry cooling would significantly accelerate theproject schedule due to a reduction in the time required to complete the environmental reviewand to shorter construction times enabled by shop construction of the tower was noted as animportant economic advantage. No references.
Aschner, F.S. Planning Fundamentals of Thermal Power Plants. John Wiley & Sons, New York,NY (Unknown).Notes: Review of design fundamentals for condensers on condensing power plants. Thismaterial is one part of a full textbook on the planning and design of steam power plants. Thissection covers both surface condensers and barometric condensers (of the Forgo-Heller type)and air cooled condensers. No cost information is provided. No references.
Baker, D. Cooling Tower Performance. Chemical Publishing Company, New York, NY, (1984).Notes: Textbook on cooling towers. (Only the Table of Contents has been looked at.)
Annotated Bibliography of Cooling System Literature
A-3
Coverage appears to be restricted to wet cooling towers. It is unclear whether cost informationis included although there is a Section on Specifications and Bid Analysis. A completetreatment of the theory and calculational methods is provided.
Balogh, Andras and Z. Takacs. Developing Indirect Dry Cooling Systems for Modern PowerPlants. 98.Notes: Description of the Heller-type indirect dry cooling systems placed on the Web by EGIContracting/Engineering Co. Ltd., a Hungarian company now a division of GEA, whichbuilds and installs these systems. Reasonably detailed but qualitative information is providedon the design and operation of the system and comparison to conventional wet tower and air-cooled condensers. No cost information is provided. No references.
Bartz, J. A. Dry cooling of power plants: a mature technology? Power Engineering . 88.Notes: Review and brief description of some existing dry cooling tower installations in SouthAfrica and other foreign countries and a qualitative projection of future U.S. requirements forthe technology. Gives a short description of the ammonia phase change system which wasbeing developed by EPRI and USDOE at that time and a short discussion of performanceissues with conventional wet cooling. No references.
Beck, A. and M. Schaal. Water Requirements of an Inland Nuclear Power Station: Engineeringand Economic Aspects. Desalination 40, 19-24 (1982).Notes: Cost comparison of alternative cooling systems for a 950 MWe nuclear power plant inIsrael. Costs were estimated for four cases: wet cooling with fresh water; wet cooling with seawater make-up; wet/dry cooling and dry cooling. It was concluded that it was more economicalto desalt sea water for make-up to a wet tower than to use dry cooling. The most economicalalternative was to design a wet tower with the capability of accepting sea water as make-up. 4references.
Bonger, R. and R. Chandron. New Developments in Air-cooled Steam Condensing. EPRI TR-104867, Paper 18. 95. Palo Alto, CA, EPRI.Notes: Review of dry cooling systems and a more detailed treatment of natural draft air-cooledcondensers and the single row condenser (SRC) using a elliptical tube which was just beingintroduced at that time. Economic comparison criteria were simplified but clearly stated anddetailed designs for the compared cases were presented. Direct dry cooling systems were foundto be substantially cheaper than indirect systems and natural draft systems cheaper thanmechanical draft for the direct cases. The elliptical tube, single row condenser was shown tohave significant performance advantages. No references.
Bukowski, Joe. Taking the Heat off Industrial Processes. Consulting-Specifying Engineer , 46-50. 95.Notes: An elementary, introductory article of heat rejection alternatives, primarily forindustrial applications. Identifies a few rules-of-thumb and general guidelines for initialchoices of preferred systems for particular applications and environments. No quantitativeinformation for comparing systems.
Annotated Bibliography of Cooling System Literature
A-4
Burger, Robert. Cooling Towers, the Overlooked Energy Conservation Profit Center. EPRI TR-104867. 94.Notes: Addresses the question of how much improved cooling system performance is worth.Three case studies, two for power generation plants, are presented. The cost savingsassociated with a given temperature reduction in the cold water return temperature are given.Methods for improving the performance of existing towers are given including a review of anadvanced fill to replace conventional wood packing. 7 references.
Burns, J. M. et al. The Impacts of Retrofitting Cooling Towers at a Large Power Station. EPRITR-104867 . 94.Notes: Presents a cost evaluation of retrofitting the PSE&G’s Salem Station from a once-through cooling system to recirculating, wet cooling towers. A dry cooling alternative isconsidered briefly but rejected on qualitative conclusions about cost and lack of experience.Cost estimates are provided but with very little information about the source of theinformation. A good summary of the several cost categories that must be considered is given. 3references.
Buys, J.D. and D. G. Kroeger. Cost-Optimal Design of Dry Cooling Towers ThroughMathematical Programming Techniques. ASME Trans. 111, 322-327 (1989).Notes: Presents a highly mathematical treatment of the cost optimization of a natural-draftdry-cooling tower. Casts the problem as a generalized, non-linear constrained mathematicalminimization problem and uses published numerical methods to accomplish the solution.Worked example is instructive. The cost functions are introduced (without derivation) but anextensive reference list may provide the basis for the algorithms. Useful only if computationalpackages are to be developed. 17 references.
Buys, J.D. and D. G. Kroeger. Dimensioning Heat Exchangers for Existing Dry Cooling Towers.Energy Conversion and Management 29, 63-71 (1989).Notes: Develops a method for determining the optimum design of a finned tube bundle to beinstalled in an existing tower for which heat exchanger retrofit is desired. Example is providedfor a natural draft tower and a detailed numerical case is worked through. The objectivefunction to be minimized is the cost at a given cooling load. Sensitivity studies to illustrate theeffect of varying certain independent parameters are given. 13 references.
Carroll, George, D. F. Dyer, and G. Maples. Comparison of Phased Cooling Systems withConventional Cooling Systems---Performance and Economics. 77.Notes: Investigated the effect of including cold water storage with conventional coolingsystem. Little relevance to the evaluation of wet vs. dry systems. No copy available.
Choi, M. and L. R. Glicksman. Computer Optimization of Dry and Wet/Dry Cooling TowerSystems for Large Fossil and Nuclear Power Plants . 79. Cambridge, MA, MassachusettsInstitute of Technology.Notes: Program for optimization of dry cooling for power plants. The objective function to beminimized is the total evaluated cost of the cooling system. Cases were run for both fossil andnuclear plants. Lost capacity was replaced with gas turbines. The use of both conventionaland high back pressure turbines was considered. The result was found to be most sensitive to
Annotated Bibliography of Cooling System Literature
A-5
the choice made for replacing lost capacity. The use of a separate wet tower to handle some ofthe cooling duty on the hottest days was also examined and found to be a big economicadvantage even if only a small amount of water was available. 37 references.
Christopher, P.J. and V. T. Forster. Rugeley Dry Cooling Tower System . Proc. Instn. Mech.Engrs. 184, Pt. 1, 197-221 (1969).Notes: A detailed description of one of the first large scale dry cooling systems---a naturaldraft, barometric condenser (Heller system) at the Rugeley Power Station in the U.K. Fulldescriptions of the design, materials selection, and operating data are provided. Operation andmaintenance experience is reviewed with particular attention to corrosion issues. An extensivediscussion and authors’ replies are attached expanding somewhat on the question of whetherthe tower was properly optimized. (It appears that the tower was perhaps oversized toeconomically optimized.) Very little cost information is included. 2 references.
Conradie, A.E. and D. G. Kröger. Performance Evaluation of Dry-Cooling Systems for PowerPlant Applications. Applied Thermal Engineering 16, 219-232 (1996).Notes: A performance model for dry cooling systems. A detailed model is formulated of therelevant mass, momentum and energy balance equations and engineering design relations fordry cooling systems in power plant applications. Worked examples for both natural and forceddraft cases are given. The model gives both capital and operating costs over the life of theplant. It can be used to conduct sensitivity analyses to determine savings associated with smallchanges in many design choices. 31 references.
Conradie, A.E., J. D. Buys, and D. G. Kröger. Performance Optimization of Dry-CoolingSystems for Power Plants through SQP Methods. Applied Thermal Engineering 18, 25-45(1998).Notes: A dry cooling system optimization method (see also Ecker and Wiebking, 1978)formulated as a non-linear constrained problem using the Sequential Quadratic Programming(SQP) method. The objective function to be minimized is the ratio of total system cost to plantoutput. A detailed cost estimating methodology is included. Examples for both a natural andforced draft system are given. The emphasis is on the development and description of themethodology rather than the results so there is little quantitative discussion of costs. 36references.
Conradie, T. A. and D. G. Kröger. Enhanced Performance of a Dry-Cooled Power Plant throughAir Precooling. ASME Paper No. 91-JPGC-Pwr-6 Presented at the International PowerGeneration Conference. 91.Notes: Study of the use of spray enhancement cooling to reduce capacity loss at dry cooledplants on hot days. Thermodynamic calculations of the effect of adiabatic pre-cooling of towerinlet air by water injection into the air stream is presented. Po0lynomial curve fits are given torelate plant output to tower cold water return temperature. A worked example is given for apower pant and annual water consumption and annual power output is calculated for a rangeof ambient temperatures. No attention is given to the design of the spray enhancement systemor to potential operating problems for the tower. It is assumed throughout that the finned tubesurfaces remain dry. 5 references.
Annotated Bibliography of Cooling System Literature
A-6
Conradie, T. A. and D. G. Kröger. Enhanced Performance of a Dry-Cooled Power Plant throughAir Precooling. 91. International Power Generation Conference, San Diego, CA.Notes: Study of the use of spray enhancement cooling to reduce capacity loss at dry cooledplants on hot days. Thermodynamic calculations of the effect of adiabatic pre-cooling of towerinlet air by water injection into the air stream is presented. Po0lynomial curve fits are given torelate plant output to tower cold water return temperature. A worked example is given for apower pant and annual water consumption and annual power output is calculated for a rangeof ambient temperatures. No attention is given to the design of the spray enhancement systemor to potential operating problems for the tower. It is assumed throughout that the finned tubesurfaces remain dry. 5 references.
Cooper, George P. and J. W. Cooper, Jr. Watts Bar Nuclear Unit 1 Cooling Tower ThermalPerformance Upgrade: A Value ADD Engineering Approach” . EPRI TR-104867. 94.Notes: Summary of a TVA upgrade of a natural draft wet cooling tower at the Watts Barnuclear power plant. Modifications to the tower’s fill system and the spray nozzles resulted animprovement in tower performance from 88% (12% shortfall) to 106% of design capabilityand an effective increase of 6 MWe in the capability of the plant. The cost of the upgrade ofabout $1.5 million as recovered in one year of operation. 4 references.
Cuchens, J. W. and R. J. VanSickle. Crossflow Cooling Tower Performance Upgrade. EPRI TR-104867. 94.Notes: Review of several upgrade possibilities to improve the performance of mechanical draft,cross-flow wet cooling towers. The several possibilities considered ranged from the installationof auxiliary towers, adding cells to the existing tower, refurbishing towers with new fill andconverting from cross-flow to counter-flow. The benefit to cost ratio was found to besignificantly better (~ x4.) for the auxiliary tower option than for any of the others (~ x1. Tox2.). 2 references.
Curcio, John et al. Advanced Dry Cooling Tower Concept. 75. Cambridge, MA, EnergyLaboratory, Massachusetts Institute of Technology.Notes: No information available.
Ecker, J.G. and R. D. Wiebking. Optimal Design of a Dry-Type Natural-Draft Cooling Tower byGeometric Programming. Journal of Optimization Theory and Applications 26, 305-323 (1978).Notes: An optimization program for designing natural draft dry towers. The emphasis is on themathematical formulation of a constrained optimizations problem. The objective function tobe minimized is the total (operating plus fixed) annual cost with specified performanceconstraints. The design goes to the level of finned tube bank details (tube size and spacing, finheight, spacing and thickness). There are two worked examples. The cost numbers are chosenwithout derivation or justification but merely to enable an example calculation. 18 references.
Eldredge, T. V. Cooling Tower Modeling with Computational Fluid Dynamics. EPRI TR-104867. 95. Palo Alto, CA, Electric Power Research Institute.Notes: Presents a computational fluid dynamics (CFD) approach to calculating cooling towerperformance and how it is affected by meteorological conditions, tower geometry, water flowrate, flow maldistribution, fill plugging and other three dimensional effects. The results are
Annotated Bibliography of Cooling System Literature
A-7
compared to measurements of cold water temperature on two natural draft cooling towers.The effect on tower performance of injecting scrubbed flue gas into the tower chimney is alsoinvestigated. 15 references.
EPRI. Proceedings: Cooling Tower And Advanced Cooling Systems Conference. EPRI TR-104867. 95. Palo Alto, CA, Electric Power Research Institute.
EPRI. Proceedings: International Cooling-Tower and Spray Pond Symposium. EPRI GS-6976.90. Palo Alto, CA, Electric Power Research Institute.Notes: Papers from the 1990 IAHR/EPRI meeting on cooling towers and spray ponds. Thevolume contains 60 papers, mostly on wet cooling systems but 7 on dry and hybrid coolingtowers. (Summaries of important papers related to dry cooling are provided under the entriesfor the individual papers: Tesche; Bodas (2); Alt; Leitz; Bergmann and Csaba; Mozes)
Dinelli, G. and B. Bellagamba. Proceedings: International Cooling-Tower Conference. EPRI GS-6317. 89. Palo Alto, CA, Electric Power Research Institute .Notes: Contains 28 papers on several aspects of cooling tower technology: modeling of coolingsystem performance and design; operating experience; new cooling concepts; optimizationcriteria and methods; environmental impact; and summary of a round table discussion onoptimization methods, design and acceptance testing and materials selection and maintenance.Primary emphasis of the meeting was on wet cooling. Eight papers on dry or wet/dry systems.(Summaries of the important papers related to dry systems given under the entries for theindividual papers.) {du Preez and Kroger; Bodas; Szentgyorgyi and Salamon; Olsha and West;Palfalvi; Szabo and Szentgyorgyi; Fischer and Sommer; Fleury and Bellot)
EPRI. TAGTM Technical Assessment Guide. 91. Palo Alto, CA, Electric Power ResearchInstitute.Notes: .A set of up-to-date economic factors and cost assessment methodologies. The methodsprovide a means for comparing capital investment evaluations in a consistent manner. Anumber of example cases are worked out. No specific cases include cooling systemcomparisons but the general information on utility economics is useful in developingappropriate energy replacement penalty costs. No references except in footnotes.
Fay, H. P. and T. R. Litton. Save Water, Stop Plume with Parallel Condensing. EPRI TR-104867. 94. Palo Alto, CA, Electric Power Research Institute.Notes: Reviews the installation of the first two wet/dry parallel condensing systems incommercial operation---one for water conservation, the other for plume abatement. Fullsystem descriptions and performance information vs. ambient dry-bulb temperature are given.No cost information is provided. No references.
Fricke, H. D. and A. M. Czikk. Performance of a Steam Condenser for Dry Cooling. EPRI CS-4016. 85. Palo alto, CA, Electric Power Research Institute.Notes: {See above citation}.
Annotated Bibliography of Cooling System Literature
A-8
Fricke, H. D. et al. Advanced Dry-Cooling Demonstration: Summary. 86. Palo Alto, CA,ElectricPower Research Institute.Notes: {See above citation}.
Fricke, H. D., K. McElroy, and D. J. Webster. Heat Transfer Characteristics of a Dry andWet/Dry Advanced Condenser of Cooling Towers”. 82. Palo Alto, CA, Electric Power ResearchInstitute.Notes: One of three (along with the next two citations) documenting various aspects of thedesign, operation and test results of the ammonia phase-change advanced dry cooing systemdeveloped by EPRI and USDOE in the late 1970’s and early 1980’s. summary information isprovided in {REFERNCE}.
Fryer, B. C. A Review and Assessment of Engineering Economic Studies of Dry CooledElectrical Generating Plants. 76. Richland, WA, Battelle Pacific Northwest Laboratories.Notes: .Review of the several engineering economic studies of the comparative costs of dry andwet cooling conducted in the early 1970’s. At the time, there was no widely agreed uponapproach to conducting proper cost comparisons. Also it was not clear that the dry towerdesigns had been optimized. Finally, since the energy and capacity replacement penaltieswhich were calculated under the methods used at that time accounted for as much as two-thirds of the cost of the systems, the need for a consistent means of evaluating these penaltieswas emphasized. It is not clear that the methods used during that era of a fully regulatedpower business are useful in a deregulated era. 31 references.
Ortega, F. M. Layton. 95.Notes: Provides comparative cost estimates of an all-dry air-cooled condenser and a parallelwet/dry system designed for water conservation (nominally 50% of the water consumption of awet cooling tower). Estimates are for “typical” U.S. site and include installation costs. Anindication of cost vs. size for air-cooled condensers is given by comparing three differentturbine exhaust pressures (4., 6. And 8. In Hg) for a given design dry bulb temperature (90F).Costs ranged from $13.2 to 8. Million (including installation) for a 600MM Btu/hr heat duty.No references.
Goldschagg, H. B. et al. Air-Cooled Steam Condenser Performance in the Presence ofCrosswinds. EPRI TR-104867. 95. Palo Alto, CA, Electric Power Research Institute.Notes: Analysis and correction of wind-related performance problems at ESKOM’s Matimbapower station. A computational procedure for determining the flow field and its effect on fanperformance during windy conditions is presented. The results of a proposed solution, basedon the analysis, in preventing turbine trips and providing significant performanceimprovement is given. 16 references.
Goldschagg, Hein. Winds of Change at Eskom’s Matimba Plant. Modern Power Systems , 43-45.99.Notes: Review of dry cooling at ESKOM’s (South Africa) Matimba Plant (6 x 665 Mwe on air-cooled condensers). Site conditions and physical descriptions of the towers are given as are theoperating procedures. Discussion focuses on wind-related problems. Certain wind directionsunexpectedly resulted in serious performance losses and frequent turbine trips for high back
Annotated Bibliography of Cooling System Literature
A-9
pressure. Analysis and eventual solution of the problem through modifications to theconfiguration of the turbine hall and the ACC windwalls is reviewed. Highlights a need forflow modeling in advance of construction. No references provided.
Guyer, E. C. and D. L. Brownell. Wet/Dry Cooling for Cycling Steam-Electric Power Plants. 80.Notes: A computational procedure for incorporating utility capacity supply and energyproduction economics into the design criteria and operational strategy of wet/dry coolingsystems. Conclusions were that there was little difference between the optimum designs forbase-load and cycling plants, particularly if relatively little water was available for cooling (<250 acre-feet per year). 16 references.
Guyer, E. C. and J. A. Bartz. Dry cooling moves into the mainstream. Power Engineering . 91.Notes: A brief review of the state-of-the-art of dry cooling. At the time (~1990) the use of drycooling was increasing in the U.S. A list of recent installations is provided. Some of theinstallations are described and a summary of the basic types of dry cooling systems is given. 8references.
Guyer, E. C. Dry Cooling: Perspectives on Future Needs. 91.Notes: Survey of needs for and utility attitudes toward dry cooling. A review of theenvironmental regulations and the then current expectations for water supply and potentialshortages is given. The status of existing dry cooling systems in use at the time is provided. Anhistorical survey of installations in the U.S. showed a significant increase in the late 1980’s upto the date of the report. An extensive review of the literature at the time is given 72references.
Hamilton, Thomas H. Developing the Worth of Colder Water in a Steam Turbine GeneratingStation. 2000. Cooling Tower Institute.Notes: Presents a systematic calculation procedure for evaluating the lost energy penaltiesassociated with reduced tower performance. Examples are for wet cooling towers at steam-electric plants but the methodology applies to dry systems. Extension to combined-cycle plantsis non-trivial but straight-forward. The computational scheme is detailed and laborious in thisage of computerized computational tools but serves to illustrate the elements of thecomparison procedure well. A useful starting point for an approach to the wet-drycomparisons. No references.
Hauser, L. G. et al. An Advanced Optimization Technique for Turbine, Condenser, CoolingSystem Combinations. Proc. of American Power Conference. Vol. 33, p. 427-448. 71.Notes: Thorough description of the methodology for selecting the optimum cooling system andcomparing optimized designs of the different classes of cooling system. Typical curves ofpresent worth evaluation vs. cooling system performance are provided. The effect of variousturbine heat rate characteristics are presented and explained. 4 references.
Hendrickson, Paul L. An Overview of Economic, Legal and Water Availability FactorsAffecting the Demand for Dry and Wet/Dry Cooling for Thermal Power Plants. 77. BattelleNorthwest Laboratories.Notes: No copy available.
Annotated Bibliography of Cooling System Literature
A-10
Hirschfelder, G. Der Trockenkühlturm des 300-MW-THTR-Kernkraftwerkes, Schmehausen-Uentrop. 73. VGB Krasftwekstechnik.Notes: Review of the design, operation and economics of the natural draft dry cooling tower atSchmehausen in Germany. This was a unique design which was never replicated. The towerno longer exists but is an interesting case study of an innovative design. The tower structureconsisted of a central column from which three rings were suspended. A cable network wasattached to the rings and aluminum plates were attached to the cable network to provide thetower shell. No references (In German.)
Hoffmann, J. E. and D. G. Kroeger . The Response of a Large Natural Draft Dry-Cooling Towerto Ambient Temperature Stratification. EPRI TR-104867. 94. Palo Alto, CA, Electric PowerResearch Institute.Notes: Detailed analysis and computational scheme for performance of natural draft drycooling systems in the presence of a thermal inversion. Comparisons with data are given.Relevant only for natural draft systems---not for combined cycle plants in California. 20references.
Horsak, Randy D. Heat Rejection from Geothermal Power Plants. 79. Palo Alto, CA, ElectricPower Research Institute.Notes: Cost and performance comparisons of wet and dry systems for geothermal plantapplications. Little relevance to the combined cycle plant case.
Hu, M. C. Engineering and Economic Evaluation of Wet/Dry Cooling Towers for WaterConservation”. November, 1976. Washington, DC, U. S. Department of Energy.Notes: No copy available.
Hutton, David. Improved Power Plant Performance with Evaporative Steam Condensing. 99.Notes: Presentation of the use of evaporative condensers (units where the evaporative coolingtakes place directly on the outer surface of the condenser tubes). The system has been appliedin a few instances in small installations and may be applicable to 5 to 100 MWe units. Costsavings of around 10% in comparison to condenser/cooling tower systems are claimed. 6references.
Hutton, David and C. W. Carlson. Fiberglass Closed-Circuit Cooling Towers: DesignConsiderations for Power Industry Applications. 94.Notes: Discussion of the use of fiberglass for structural component of wet cooling towers. Abrief review of the types of power plant cooling systems is given. The benefits of the choice offiberglass for tower construction along with the implications of this choice for tower structuraldesign are presented. Some practical observations based on experience with industrial processapplications is given. Benefits are in low cost, low maintenance and ease of construction. Noreferences.
Proceedings of the 9th IAHR Cooling Tower and Spraying Pond Symposium. 94. InternationalAssociation for Hydraulic Research.Notes: Sessions were held on effects on local environment; cooling tower operation; coolingtower modeling; components; design and performance. The primary emphasis of the meeting
Annotated Bibliography of Cooling System Literature
A-11
is on wet cooling towers and spray systems. Eight papers deal with dry or wet-dry systems.Summaries of the more relevant papers are given in the individual citations (Leitz; Tesche;Tesche et al.; Cinski; van der Spek; Kroger; Nemeth; Ludvig; Bouton and Monjoie; Nagel;Schrey) (37 papers)
Iovino, G et al. Optimal Sizing of Natural Draft, Dry Cooling Towers for ENEL CombinedCycle Power Plants.Notes: An optimization method for natural draft dry cooling towers of combined cycle powerplants (See also Ecker and Wiebking, 1978 and Conradie, Buys and Kröger, 1998). The casestudy is for an indirect, dry system and the objective function to be minimized is the cost ofenergy. Sensitivity studies on the effect of differing meteorological conditions and costassumptions are given. A good treatment of the effect of turbine heat rate characteristics andtower approach is given. 2 references.
Junge, Erik. Innovations in Cooling Tower Design. 2000.Notes: Marketing article to promote a proposed design and new tower configuration developedby TowerTech. The article highlights three problems with wet towers: high maintenanceproblems with fans; failure of water distribution system and the buildup of sludges (sometimeshazardous) in the tower basin. The proposed design includes a rotary spray nozzle to obtainbetter coverage of the fill and the replacement of the basin with perimeter troughs, and theplacement of the fans at the bottom of the tower for easier access and a drier environment.The description is extremely brief and, in all likelihood, is not a feasible approach. Noreferences.
Kast, G. A. and S. D. Adams. Kakkonda geothermal plant uses hybrid cooling. Modern PowerSystems . 95.Notes: Description of a wet/dry tower designed for plume abatement purposes at a 30MWegeothermal plant in Kakkonda, Japan. Heat rejection is 100% to the wet tower in the summerand 20%/80% dry wet in winter months. 14 ft. high fan stacks were used to promote plumemixing and plume rise for environmental reasons. Apparently a barometric, direct contactcondenser was used, since it is claimed that the circulating water is “partially geothermalcondensate.” No cost information is provided. No references.
Kintner-Meyer, Michael and A. F. Emery. Cost-Optimal Analysis of Cooling Towers. ASHRAEAnnual Meeting. pp. 92 -- 101. 94. ASHRAE.Notes: Optimization procedure for cooling tower design is presented. The objective function tobe optimized is the combined capital and operating cost. The application is for refrigerationsystems so the operating penalties, which include the effect on chiller coefficient ofperformance are qualitatively different from power generation applications. The paper gives agood example of optimization methods for cooling tower costs against range and approach butno insight into source of cost information or into the effect of actual tower or fill designvariables. Reference has limited value for the wet vs. dry cost comparisons of this report. 12references.
Kooy, R. J., R. J. Laverman, and J. L. Seale. Performance of a Capacative Cooling System forDry Cooling. 86. Palo Alto, CA, Electric Power Research Institute.
Annotated Bibliography of Cooling System Literature
A-12
Notes: Description of design and performance of the thermal storage components of theadvanced phase-change ammonia dry cooling system developed and tested by EPRI andUSDOE. No copy currently available.
Kosten, H. and R. Wyndrum. Wet, Dry and Hybrid Systems--A Comparison of ThermalPerformance. EPRI TR-104867. 95. Palo Alto,CA, Electric Power Research Institute.Notes: Describes the choices available for condensing and cooling systems for thecondensation of turbine exhaust steam. The paper describes the major types of system andtheir operating characteristics, operating and maintenance costs and other selectionconsiderations. Life cycle cost analyses are discussed. Problem check lists for wet, dry andwet/dry systems are given. Simplified cost comparisons are included. An excellent introductorysurvey of the subject. No references.
Kroeger, D.G. Air-cooled Heat Exchangers and Cooling Towers. Begell House, New York(1998).Notes: Comprehensive text on the design and performance of dry cooling systems. The text isover 600 pages long. The 10 Sections and 3 appendices give a detailed treatment of the fluidflow, heat transfer and thermodynamic theory of cooling systems complete with detailedworked examples. Descriptions of operating plants using dry cooling, the effects of differentmeteorological conditions and methods for selection of optimum systems are presented. Theseveral hundred references catalog the up-to-date literature of the field as of 1998.(Information to obtain the book is available at the Begell House, Inc. website;http://wwwbegellhouse.com/heat_exchangers/aircooled.html)
LaRonge, Thomas M. Bugs and Bugaboos of Cooling System Components. 2000. CoolingTechnology Institute.Notes: Review of cooling tower problems associated with water quality control. Emphasis is onmicrobial induced corrosion problems and methods for ameliorating and correcting suchproblems. A brief review of mechanical failures and their cause is presented. Largelyqualitative discussion based on author’s considerable experience in cooling tower watertreatment and maintenance. 1 reference.
LeFevre, M.R. New Technology and Cooling Tower Design Practices. Combustion 28-32(1977).Notes: General discussion of various types of cooling towers. Discussion is limited to wetsystems and includes mechanical and natural draft towers, round mechanical draft towers andfan-assisted, natural-draft towers. A brief review of where in the U.S. the various designschoices are preferred (as of 1977). No references.
Li, K. W. and W. Sadiq. Computer-Aided Optimization of Cooling Systems. Computers inEngineering Conference No. 3. pp. 165-171. 85. ASME International.Notes: A relatively simplified optimization method for power plant cooling systems. Presents acase study for a mechanical draft wet cooling tower on a 670 MWe plant. The effect of varyingapproach and condenser terminal temperature difference is illustrated. No detailedoptimization of tower design variables is attempted. No cost information is included. 4references.
Annotated Bibliography of Cooling System Literature
A-13
Lindahl, P. and R. W. Jameson. Plume Abatement and Water Conservation with the Wet/DryCooling Tower. CTI Journal 14, (1993).Notes: One of the classic references on hybrid wet/dry cooling towers for both plumeabatement and water conservation. Excellent descriptions of the configuration andthermodynamic operating principles of the several tower types are given. Attention is given tothe selection of the design point for real applications. No cost information is included. Noreferences.
March, F. and F. Schulenberg. GEA-Information: Air cooled condenser for a 160 MW steampower station, planning of the plant and experience gained in two years of operation. 70.Bochum, Germany, GEA-Kühlturmbau und Luftkondensation, GmbH.Notes: Review of two years operating experience on the air-cooled condenser at the 160 MWepower plant in Utrillas, Spain. The performance data confirmed the design calculations anddemonstrated a reserve capacity of about 8%. No serious operating problems were noted.Annual cleaning with compressed air blowing during operation was sufficient to maintainperformance. No efficiency loss was observed as a result of windy conditions. No costinformation is provided. No references.
Mathews, R.T. Air cooling in chemical plants. Chemical Engineering Progress 55, 68-72 (1959).Notes: An old reference which analyzes the use of air-cooled heat exchangers in the chemicalprocess industry. Contains a detailed set of considerations and criteria for deciding when aircooling is potentially a preferred choice. Some discussion of design temperature selectionbased on site meteorology. Suggested design temperature is the “2% temperature”. (Thetemperature that is exceeded for 175 hours per year.) Many of the considerations areappropriate for power plant applications, although the economic evaluation discussion is quitelimited. No references.
Maze, R.W. Air vs. Water Cooling. The Oil and Gas Journal 74-78 (1974).Notes: Comparison of air and water cooled heat exchangers for petrochemical applications.Typical values for temperature differences and comparative costs are provided. Attention isgiven to problems related to cold weather operation. Cost information would be difficult totranslate for power plant applications. 3 references.
McHale, C.E.e.al. New Developments in Dry Cooling of Power Plants. Combustion 28-36(1990).Notes: Description of the advanced phase-change dry cooling system developed and tested byEPRI and the USDOE in the 1980’s. The system was an indirect dry cooling system with asurface condenser and an ammonia loop between the condenser and the dry tower, thuseliminating the condenser range from the temperature difference between the ambient drybulb and the steam condensing temperature. Comparisons are provided with other coolingsystem designs and the costs and incentives for the use of dry cooling are reviewed. 18references.
Merchant Power on the Go Power Engineering ( July, 2000).
Annotated Bibliography of Cooling System Literature
A-14
Michell, F.L. and D. H. Drew. On-Line Performance Monitoring of the 1300 MW Natural DraftCooling Towers on American Electric Power’s General James M. Gavin Plant. CTI Journal(1997).Notes: Discussion of the methods for monitoring very large, natural draft cooling towers andthe problems with the equipment for making the measurements. Measurements of ambienttemperatures and wet bulbs, circulating water flow rates and data averaging procedures arediscussed. The paper is of limited value for the issues of cooling system selection for combinedcycle plants in California but does emphasize the difficulties of determining actual coolingperformance being realized from an operating cooling tower. 2 references.
Miliaris, E.S. Power Plants with Air-Cooled Condensing Systems. The MIT Press, Cambridge,Massachusetts ( 1974).Notes: Textbook consisting of 14 Sections and 4 appendices 234 pages long. It is organized bycooling system type and includes direct and indirect systems, barometric and surfacecondensers, detailed descriptions of heat transfer and fluid flow computational procedures forfinned tube heat exchangers, and extensive treatments of the thermodynamic optimizationmethods for application to power plants. Additional Sections deal with the system planningaspects of system selection by utility companies. Detailed information on plants in existence atthe time is provided. A treatment of determining the loss of plant capability and increasedcooling system load at increased back pressure included. Extensive references are given ineach Section; total for the book is several hundred.
Mirsky, G. and J. Bauthier. Cooling Towers: New Developments for New Requirements. EPRITR-104867. 94. Palo Alto. CA, Electric Power Research Institute.Notes: Addresses the design of cooling towers for combined cycle power plants. The discussionis organized around three sets of requirements: water use and pollution, noise and visibility.Particular attention is given to determining the cooling tower requirements for the special caseof a combined cycle power plant where the steam part of the cycle accounts for only about 1/3of the plant output but for which the cycle efficiency may be fairly poor compared to stand-alone steam plants. Order of magnitude cost comparisons are provided based on the authors’corporate experience. No sources are provided. 4 references.
Mirsky, G., K. Bryant, and J-P. Libert. The Latest Worldwide Technology in EnvironmentallyDesigned Cooling Towers. CTI Journal 13, (1992).Notes: Reviews some advanced approaches to improving the environmental characteristics forcooling towers at power plants. Specific topics include low noise designs; injection of scrubbedflue gas into tower air stream; low drift designs; new EPA testing methods; thermalperformance; asbestos removal and replacement; water conservation; zero discharge towers;and plume abatement or elimination. Order of magnitude cost estimates are given for some ofthese approaches.
Missimer, J.R. and D. Wheeler. Characterization of Drift Rates and Drift Droplet Distribution forMechanical Draft Cooling Towers. (1997).Notes: Discusses drift measurement methods and presents data on drift rates and drift dropletsize distribution obtained from 57 drift tests made over the previous 23 years. The results aregrouped by tower type and by drift eliminator. Results from different sampling methods
Annotated Bibliography of Cooling System Literature
A-15
(isokinetic sampling and sensitive paper sampling) are compared. A distinction is madebetween mechanically generated drift and droplets condensed in the tower exhaust stream. 14references.
Mitchell, R. D. Survey of Water-Conserving Heat Rejection Systems. 89. Palo Alto, CA, ElectricPower Research Institute.Notes: Summary of all economic comparison studies of wet, dry and wet/dry systems availableat the time of the report. A clear comparison of the important assumptions made in each studyand the effect that the choice of assumptions has on the cost comparisons is provided. Veryconcise descriptions of the appropriate methodology for determining all the important costelements and in obtaining optimized systems for purposes of comparison are given. This is themost comprehensive treatment of the comparison methodology that has appeared in the openliterature to date. 63 references.
Miura, T. and O. Gotoh. The New Wet/Dry Cooling Tower without Finned Tube Dry Section(NWD). (1998).Notes: Presents a new design concept (called “NWD” for “novel wet/dry tower) for plumeabatement with no separate finned tube dry section. The approach uses a combined wet/dry fillwith a section to which the water flow can be interrupted. The wet/dry passages consist of 15to 25% of the total fill area. Performance test results on a single mechanical draft, cross-flowcell are reported. Satisfactory plume abatement was documented, but no information on costor on relative cooling capability when operated in the plume abatement mode is available. Noreferences
Wet/dry cooling tower eliminates plume at Teesside. Modern Power Systems , 57-60. 95.Notes: Presents a description of the retrofit of a fan-assisted hyperbolic cooling tower in theU.K. with a parallel path wet/dry tower for plume abatement. The plant is a combined-cycle1725 MWe plant operated in conjunction with a chemical complex to which it supplies steam.A full description of the supplementary cooling tower is given including some overall costestimates. The unit was not yet in operation at the time of the paper so no performance orO&M information is available. No references.
Monjoie, M.a.J.-P.L. Testing Procedures for Wet/Dry Plume Abatement Cooling Towers. CTIJournal (1994).Notes: Procedures for testing of wet/dry plume abatement towers are presented. Fulldiscussion of the measurements to be made, the equipment to be used, calibration techniquesare given. The thermodynamics and fluid flow of plume abatement are reviewed, and thecalculations required to verify performance are laid out in detail. Criteria for fulfilling theplume performance guarantee are clearly stated: thermal guarantee is fulfilled; the averagemaximum humidity is lower than expected; no local air state exceeds the maximum humidityguarantee value by more than 7%. No references.
Mukherjee, R. Effectively Design Air-Cooled Heat Exchangers. Chemical Engineering Progress26-46 (1997).Notes: Detailed discussion of design methods for air-cooled heat exchangers. Applications arefor the chemical process industry but much of the material applies equally well. No
Annotated Bibliography of Cooling System Literature
A-16
optimization is considered, but each of the design decisions (tubes, headers, fins, fans, etc) arediscussed in detail. No cost information is provided. 17 references plus 7 suggestions for“Further Reading.”
Murphy, D. Cooling towers used for free cooling. ASHRAE Journal 16 ( June, 1995).Notes: Deals with chilled water systems which reject heat to a cooling tower. It is recognizedthat in some climates, there are days when the cooling tower alone can provide cold water atsufficiently low temperature to meet the chilled water needs of the building or process.Configurations are suggested to implement this approach as an energy saving method. No costor performance data is given. No relevance to the comparison of wet vs. dry systems.
Naegelen, R. J., J. L. Seale, and M. Husain. Detailed Design for Incorporating Chicago Bridge &Iron (CBI) Capacitive Cooling System in the ACT Facility in Bakersfield, California---Vol. 1:Executive Summary. 82. Palo Alto, CA, Electric Power Research Institute.Notes: Description of the thermal storage component of the advanced concept testfacility(ACT) built and operated by EPRI and USDOE to test an indirect dry cooling systemusing phase-change ammonia as the intermediate heat transport loop. This first volumereviews the concept of thermal storage in this application and estimates the performance andcost benefits to be obtained.No copy available.
Naegelen, R. J., J. L. Seale, and M. Husain. Detailed Design for Incorporating Chicago Bridge &Iron (CBI) Capacitive Cooling System in the ACT Facility in Bakersfield, California---Vol. 2.82. Palo Alto, CA, Electric Power Research Institute.Notes: Description of the thermal storage component of the advanced concept testfacility(ACT) built and operated by EPRI and USDOE to test an indirect dry cooling systemusing phase-change ammonia as the intermediate heat transport loop. This second volumepresents the description of the equipment, its operation at the test facility and the test results.No copy available.
Norton, C.H. and K. W. Rowland. Design, Operation and Water Treatment of a Wet FinnedTube Exchanger Cooling Tower. CTI Journal (1989).Notes: Presents a description of a “wet” finned tube heat exchanger cooling tower forcompressed gas cooling by Southern California Gas Company. The units consists of fiberglassfill over which recirculated water is passed and through which inlet air can be directed duringhot periods. The precooling of the air increases the capacity of the finned tube dry section.Annual water consumption is reduced significantly (55% to 86%) relative to conventional wetcooling. Water treatment procedures for scaling control are discussed. No references.
O’Boyle, Paul. Be cool, be flexible. Modern Power Systems , 53. 99.Notes: Describes a business arrangement where cooling water supply is “outsourced” to acompany (Global Water Technologies) who install or upgrade cooling towers at their cost andcontract to deliver a certain amount of water at a specified temperature for the contract term.No performance or cost information is provided. No references.
Oosthuizen, P. C. Performance Characteristics of Hybrid Cooling Towers. ME Thesis. 95.University of Stellenbosch, Dept. of Mechanical Engineering.
Annotated Bibliography of Cooling System Literature
A-17
Notes: Theoretical and experimental study of the performance of wet/dry cooling towers inhybrid and separate configurations. A computer program is developed which predicts thethermal performance of both parallel and series path water flow rectangular hybrid towers.Example calculations are provided. Experimental data on one cooling tower fill was obtainedand the computational procedure for generating the heat transfer and pressure dropcharacteristics from the experimental data is given. Particular attention is given to thethermodynamics of plume prediction models and the psychometrics governing the formationof visible plumes are discussed. Calculations of inlet recirculation and a method for estimatingthe extent of ineffective fill area is provided. 97 references.
Special Report: Cooling Towers. Power Magazine . 73.Notes: Excellent comprehensive special report on cooling towers; major sections on naturaland mechanical draft wet towers and on dry towers. Good systems descriptions are providedalong with discussions of design, operation and maintenance issues. Some typicalperformance data is given but no detailed design or cost information. Although the report in27 years old, much of the information is still relevant although there are big differences inmaterials, water treatment methods and the economics which dictate the cost of alternatesystems. For example, the emphasis on natural draft hyperbolic towers is no longer justifiedand the dry system designs have progressed considerably since the writing of the report. Noreferences.
Quigley, K. and Karl Wilber. Development of Cooling Tower Performance Impacts of Utilityand Process Plants. CTI Journal (1991).Notes: Presents methods for determining the performance penalties and their contribution tototal evaluated costs for cooling towers. Five cases, three of which are for power plants, arepresented. Results are presented in the form $/°F for estimating the cost of tower performanceshortfall. 9 references.
Rose, J. C., D. J. Wilson, and G. H. Cowan. Air-Cooled Heat Exchanger PerformanceSpecification. 73. Harwell, UK, Atomic Energy Research Establishment.Notes: Detailed specifications for design, specification and location of air-cooled heatexchangers. The report covers considerations of unit location, specification of ambient designtemperatures, fan and plenum configuration, fan and drive selection, thermal performanceguarantees, noise level guarantees and air-flow measurement for performance tests. Noreferences.
Smith, E. C. and M. W. Larinoff. Power Plant Siting, Performance and Economics with DryCooling Tower Systems. Proc. of American Power Conference. 32, p. 544-578. 70.Notes: Excellent summary of performance and economics of dry cooling tower systems. Adetailed methodology is set forth for accounting for all aspects of the cost of dry cooling. Theoptimization studies suggested that lowest total owning and operating costs with dry coolingtower systems occur with turbine exhaust temperatures in the range of 8” Hg and above. Theauthors recommended that turbine manufacturers could contribute to the field by offeringhigh back pressure turbines which were not available at that time. 16 references.
Annotated Bibliography of Cooling System Literature
A-18
Smith, James O. and M. Muder. Commonwealth Edison (COMED) Byron Generating StationUnit 1 Crossflow to Counterflow Conversion. EPRI TR-104867. 94. Palo Alto, CA, ElectricPower Research Institute.Notes: Presents the results of a cross-flow to counter flow conversion of two hyperboliccooling towers at Commonwealth Edison’s Byron Nuclear plant. The conversion wasmotivated by a deterioration in tower performance due to ice damage from winter operations.The paper is of limited value for the issue of cooling system choice for combined-cycle plantsin California but does contain some information of the cost of reduced performance. Noreferences.
Spilko, J. Dry cooling enhances Syria’s Teshrin plant operation. Power Engineering , 40-41. 94.Notes: Description of the design, performance and operation of the 200 MWe gas-fired plantat Teshrin, Syria. The system includes delugeable fin-fan coolers to assist in making peak loadon the hottest days. A natural draft design was chosen to reduce plant auxiliary powerrequirements and to improve the plant net heat rate. No cost or quantitative performanceinformation is given. No maintenance problems were reported. Annual cleaning with a water-wash system maintains performance and is done by the normal plant maintenance crew.
Staff report. Parallel combined cycle at Altback/Deizisau HKW 2. Modern Power Systems . 95.Notes: Brief description of a hybrid 20%dry/80% wet cooling tower chosen primarily forplume abatement. No cost or performance information is provided. No references.
Staff report. Single row condensers build on success. Modern Power Systems , 43. 98.Notes: Brief discussion of the use of single row condensers in air-cooled condenserapplications. Some specific application (Sutton Bridge combined cycle plant in the UK(780MWe); the Ogden-Huntington waste-to-energy plant in the US; the Herdersbrugcombined cycle plant in Bruges, Belgium) are identified. The extension of the use of SRC tonatural draft towers is proposed and reference is made to a Hamon paper at the Power Genmeeting in Milan, Italy in 1998. 1 reference.
Streng, A. Circular Hybrid Cooling Towers. CTI Journal (2000).Notes: Describes circular hybrid towers as a preferred alternative to conventional(rectangular) cell type towers primarily because the problem of plume recirculation is reduced.Field data on recirculation and its effect on inlet wet-bulb temperature is provided.Performance comparisons between circular and cell-type towers over a year’s range ofambient conditions is given. References to field tests and operating reports (primarily German)are given. Little relevance to wet vs. dry comparisons.
Streng, A. Combined Wet/Dry Cooling Towers of Cell-Type Construction. Journal of EnergyEngineering 124, 104 (1998).Notes: State-of-the-art of technical developments in wet/dry cooling towers. The emphasis ison plume abatement and not water conservation. Detailed treatments of the tower design andthe thermodynamics of plume abatement are provided. Some attention is given to selection ofmaterials of construction. No cost or thermal performance information is provided. 9references.
Annotated Bibliography of Cooling System Literature
A-19
Surface, M.O. System designs for dry cooling towers. Power Engineering 42-50 (1977).Notes: General review of dry cooling tower designs and their applications. The paper providesa good overview of the several types of dry cooling system---direct, indirect more or lessconventional design along with some concepts that were being proposed in the late 1070’s---plastic surfaces, rotating disk surfaces, and the ammonia phase change system. The tradeoffswith the use of high back-pressure turbines are discussed. A cost analysis is provided of therange of options from all-dry systems with and without high-back pressure turbines, wet/drysystems with make-up water requirements ranging from 1% to 40% of wet tower, and amechanical draft wet cooling tower. No references.
Swanekamp, R. Profit from latest experience with air-cooled condensers. POWER 78 (1994).Notes: Excellent review of operating issues with air-cooled condensers at several power plants.Anecdotal descriptions of loss of capacity during hot weather periods, freeze-up problems inwinter, recirculation problems during windy conditions and requirements for tube bankcleaning are given. Identifies operating plants in California (Camarillo Plant in Venturacounty), Virginia (Doswell plant), Montana (Rosebud plant in Colstrip, MT) and New Jersey(Sayreville co-gen plant) and Hawaii (Maalaea Unit 15). No references.
Thiel, F. and D. Clute. A landmark for private power in Mexico. 27-29 (1998).Notes: Description of a 700 MWe combined cycle plant (Samalayuca II) in Mexico. This is thefirst large-scale private power project in the country. This reference is included only because itis mentioned that an air-cooled condenser was chosen for water conservation reasons. Noinformation about the cooling system is provided. No references.
Trage, B., A. J. Ham, and Th. C. Vicary. The Natural Draught, Indirect Dry Cooling System forthe 6 x 686 MWe Kendal Power Station, RSA. Jt. ASME/IEEE Power Generation Conference.90-JPGC/Pwr-25. 90.Notes: Detailed description of the unit is provided. It is noted that the choice of an indirectsystem, while not expected to be economically preferred, was made in order to provide large-scale comparative performance and operating data to the 6 x 665 MWe plant that had justbeen constructed with a direct dry cooling system at Matimba. Information on the net outputof the unit during the year at different ambient temperatures is given. Some attention is givento the effect of wind on tower performance with comparisons to towers at other sites includinga tower in Armenia (Razdan Power Station) and in Germany (Schmehausen). No economicinformation is provided. No references.
Tsatsaronis, G. and A. Valero. Thermodynamics meets economics. Mechanical Engineering 84-86 (1989).Notes: An exergy analysis of power conversion systems to identify sources of thermodynamicinefficiencies. Simple optimization methods are given. No specific mention is made of powerplant cooling systems although the methodology is applicable. No quantitative costinformation or any worked examples are provided. No references.
Tsou, John J. Jenco and K. Zammit eds. Proceedings: Cooling Tower Technology Conference.EPRI TR-108483. 97.Notes: Contains 22 papers on several aspects of cooling tower technology: performance
Annotated Bibliography of Cooling System Literature
A-20
improvement; design innovations; fouling and corrosion prevention; and operation andmaintenance. Primary emphasis of the meeting was on wet cooling with only three papers ondry or wet/dry systems. (Summaries of the important papers related to dry systems given underthe entries for the individual papers.) {Goldschagg et al., Hoffmann and Kroeger, Mirsky andBauthier}.
van der Spek, H. F. and P. J. M. Nelissen. Advanced Low Noise Cooling Fans. EPRI TR-104867. 95. Palo Alto, CA, Electric Power Research Institute.Notes: Describes a research program to develop and test low noise fans for cooling towerapplication. Good description of testing procedures. Analyses and data are presented relatingnoise reduction to fan power reduction. Good description is provided of the sources of noiseand the general approach used to reduce it. 2 references.
Varley, J. Eskom’s Majuba: at the peak of its career. Modern Power Systems . 1999 .Notes: Description of the Majuba Power Station in South Africa, a 4100 MWe plant with sixunits, three of which use air-cooled condensers. The difference between the units on wetcooling towers and those on air-cooled condensers is an increase in capacity from 660 MWe to715 MWe. Complete qualitative description of the plant is given but no performance or costinformation is provided. No references.
Von Cleve, H-H. Comparison of Different Combinations of Wet and Dry Cooling Towers.ASME Winter Annual Meeting. ASME Paper No. 75-WA/Pwr-10. 75. New York, NY, ASME,International.Notes: Review of the use of combined or hybrid wet and dry systems for either waterconservation or plume abatement. The combination of wet cooling towers with direct aircooled condensers is the usual system of choice for meeting water consumption or maximumturbine back pressure constraints. For plume abatement a combined wet/dry tower is required.The effect of design objectives, site characteristics and water availability on the system choiceis discussed. No references.
Wheeler, K. R. et al. Deposition and Corrosion Phenomena on Aluminum Surfaces UnderDeluged Dry Cooling Tower Conditions. 81. Palo Alto, CA, Electric Power Research Institute.Notes: Description of the deluge enhancement feature of the EPRI/USDOE AdvancedConcept Test facility. The design of the equipment and details of the tests are given along withdata from the tests. No copy is currently available.
Willa, J.L. Evolution of the Water Cooling Tower. CTI Journal (1991).Notes: History of wet cooling towers and their evolution to power plant size units. Particularattention is paid to the changes in materials of construction over time. Comparison of theadvantages and disadvantages of cross-flow vs. counter-flow units is given. No references.
Willa, James L. How to Improve the Thermal Performance of Cooling Towers. CTI-EPRICooling Tower Conference. 2000. Palo Alto, CA, Electric Power Research Institute.Notes: An excellent survey of common operating and maintenance problem found in wetcooling towers and methods for addressing them. Estimates of performance improvement to begained from these fixes are given. No quantitative cost information is given. 2 references.
Annotated Bibliography of Cooling System Literature
A-21
Zaloudek, F. R., L. J. Brown, and R. T. Allemann. Advanced Concepts Test Facility---Measurements and Suggested Test Plan. 80. Palo Alto, CA, Electric Power Research Institute.Notes: Description of the tests conducted at the EPRI/USDOE Advanced Concept Test facility.This report was one of a series of reports to document the ammonia phase change dry coolingsystem and to make the knowledge available to utility planners. This report presents the teststrategy, the determination of the required measurement accuracy, the specification of theinstrumentation and the statistical treatment of the results. 5 references.
BDT Engineering.
GEA.
Hamon Cooling Systems.
Marley Cooling Tower.
Niagara Blower Company.
Aull, Rich and Tim Krell. Design Features and Their Effect on High Performance Fill. 2000.Houston, TX, Cooling Technology Institute.
Hobson, E., T. H. Massey, and P. Lindahl. NPF Cooling Tower Fill--Its Development andDemonstration. 95. Houston, TX, Cooling Technology Institute.
Richardson, J. and M. G Trulear. Recent Advances in High Alkaline Cooling Water Treatment.2000. Houston, TX, Cooling Technology Institute.
Howarth, J. and C. Nalepa. First Field Trials of Single-Feed, Liquid Bromie Biocide for CoolingTowrs. 2000. Houston, TX, Cooling Technology Institute.
Gill, J. S., J. R. Parson, and R. C. Gordon. A New Treatment for Calcium Carbonoate Control inAlkaline Conditions. 97. Houston, TX, Cooling Technology Institute.
Suptic, D. M. A Non-Metallic Air Cooled Heat Exchanger for Cooling Tower Plume Reduction.99. Houston, TX, Cooling Technology Institute.
Missimer, J. R., D. E. Wheeler, and K. W. Hennon. The Relationship Between SP and HGBIKDrift Measurement Results--New Data Creates a Need for a Second Look. 98. Houston, TX,Cooling Technology Institute.
Randall, J. D. et al. Cooling Tower Plume Abatement at Chicago's O'Hare Airport. 98. Houston,TX, Cooling Technology Institute.
Feltzin, A. E. and D. Benton. A More Nearly Exact Representation of Cooling Tower Theory.91. Houston, TX, Cooling Technology Institute.
Annotated Bibliography of Cooling System Literature
A-22
DesJardins, R. J. Using the EPRI Test Data to Verify a More Accurate Method of PredictingCooling Tower Performance. 92. Houston, TX, Cooling Technology Institute.
LeFevre, M. R. Eliminating the Merkel Theory Approximations--Caan It Replace the EmpiricalTemperature Correction Factor. 84. Houston, TX, Cooling Technology Institute.
LeFevre, M. R. Influence of Air and Water Tepeature on Fill Characteristics Curve. 85. Houston,TX, Cooling Technology Institute.
Fulkerson, R. D. A Comparison of Crossflow Cooling Tower Splash-Type Fills. 99. Houston,TX, Cooling Technology Institute.
Fulkerson, R. D. Comparative Evaluation of of Counterflow Cooing Tower Fills. 88. Houston,TX, Cooling Technology Institute.
Mirsky. G. R. and M. Monjoie. Film Fill: Recent Research and Application Data. 90. Houston,TX, Cooling Technology Institute.
Schulenberg, F. Der Luftkondensator für den 356-MW-Block in Wyoming/USA. 77.Sammelband VGB-Konferenz.
Van der Walt et al. The Design and Operation of a Dry Cooling Tower system for a 200 MWTurbo-genrator at Grootvlei Power Station, South Africa. Proceedings of the 9th World EnergyConference. 74.
Kosten, G. J. et al. Operating Experience and Peformance Testing of the World's Largest Air-cooled Condenser. American Power Conference. 81.
Von Cleve, H.-H. Die Luftgekühlte Kondensationsanlage des 4000 MW-KraftwerksMatimba/Südafrika. VGB Kraftwerkstechnik 64, (1984).
Scherf, O. Die luftgekühlte Kondesationsanlage im 150-MW-Block des Preussag-Kraftwerkes inIbbenbüren, Energie und Technik. 260-264 (1969).
Simpson, N. Air-Cooled Condenser Fits Steam Plant to Arid Site. Electrical World (June 8,1970). 70.
van der Spek, H. F. The Mechanical Retrofit of a Large Cooling Tower. Cooling TowerConference. 2000.
Maulbetsch, J. S. and M. N. DiFilippo. Spray Cooling Enhacement of Air-Cooled Condensers.Madadnia, J and H. Koosha. Proceedings of XIIth International Conference on Cooling Towers.2001. International Association of Hydraulic Research.
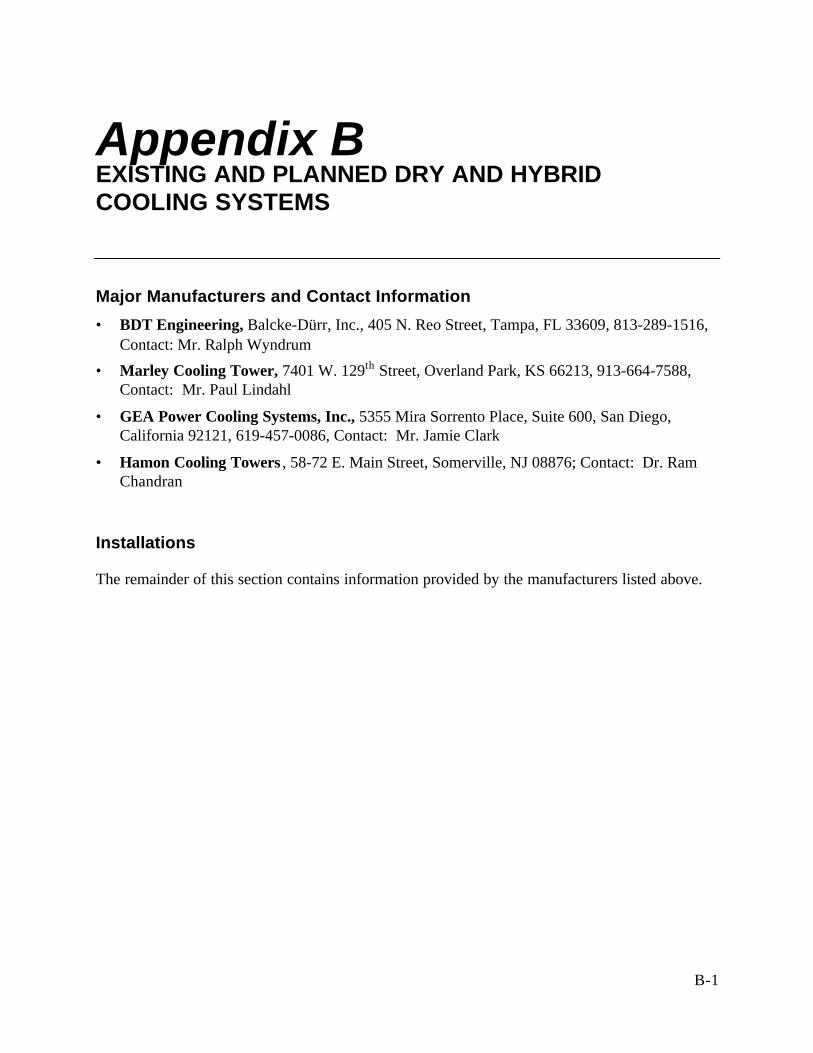
B-1
Appendix B EXISTING AND PLANNED DRY AND HYBRIDCOOLING SYSTEMS
Major Manufacturers and Contact Information
• BDT Engineering, Balcke-Dürr, Inc., 405 N. Reo Street, Tampa, FL 33609, 813-289-1516,Contact: Mr. Ralph Wyndrum
• Marley Cooling Tower, 7401 W. 129th Street, Overland Park, KS 66213, 913-664-7588,Contact: Mr. Paul Lindahl
• GEA Power Cooling Systems, Inc., 5355 Mira Sorrento Place, Suite 600, San Diego,California 92121, 619-457-0086, Contact: Mr. Jamie Clark
• Hamon Cooling Towers , 58-72 E. Main Street, Somerville, NJ 08876; Contact: Dr. RamChandran
Installations
The remainder of this section contains information provided by the manufacturers listed above.
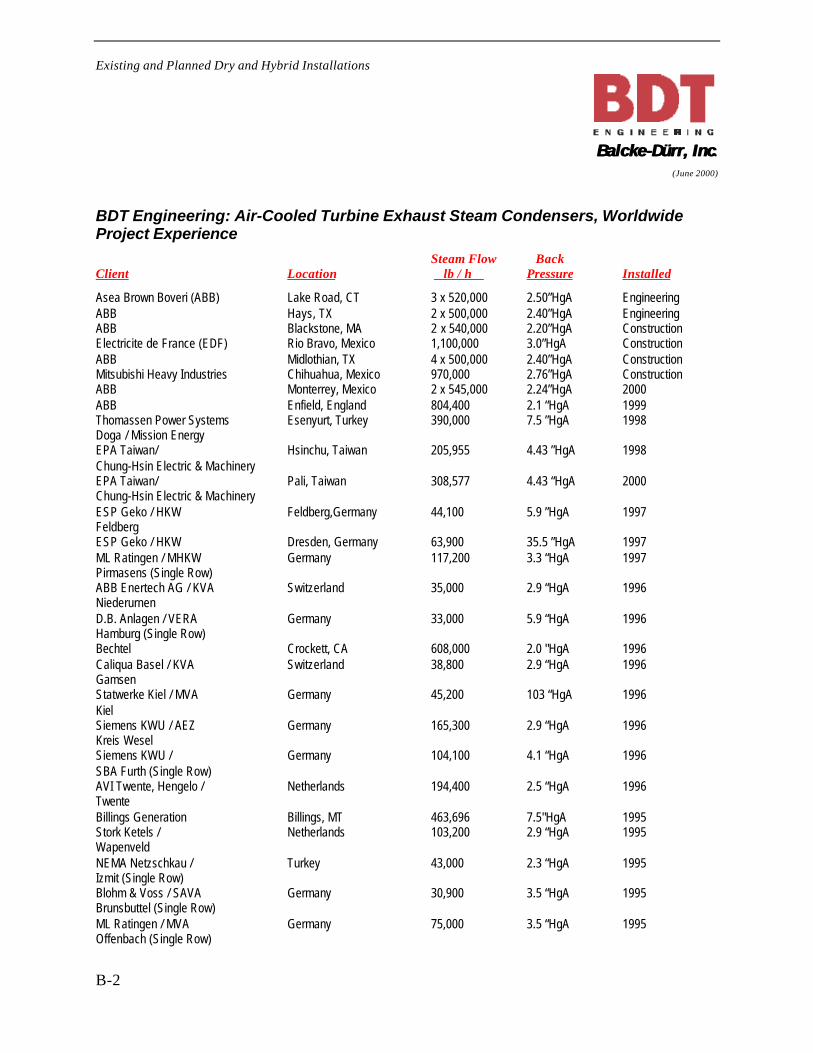
Existing and Planned Dry and Hybrid Installations
B-2
Balcke-Dürr, IncBalcke-Dürr, Inc.(June 2000)
BDT Engineering: Air-Cooled Turbine Exhaust Steam Condensers, WorldwideProject Experience
Steam Flow BackClient Location lb / h Pressure Installed
Asea Brown Boveri (ABB) Lake Road, CT 3 x 520,000 2.50”HgA EngineeringABB Hays, TX 2 x 500,000 2.40”HgA EngineeringABB Blackstone, MA 2 x 540,000 2.20”HgA ConstructionElectricite de France (EDF) Rio Bravo, Mexico 1,100,000 3.0”HgA ConstructionABB Midlothian, TX 4 x 500,000 2.40”HgA ConstructionMitsubishi Heavy Industries Chihuahua, Mexico 970,000 2.76”HgA ConstructionABB Monterrey, Mexico 2 x 545,000 2.24”HgA 2000ABB Enfield, England 804,400 2.1 “HgA 1999Thomassen Power Systems Esenyurt, Turkey 390,000 7.5 ”HgA 1998Doga / Mission EnergyEPA Taiwan/ Hsinchu, Taiwan 205,955 4.43 ”HgA 1998Chung-Hsin Electric & MachineryEPA Taiwan/ Pali, Taiwan 308,577 4.43 “HgA 2000Chung-Hsin Electric & MachineryESP Geko / HKW Feldberg,Germany 44,100 5.9 ”HgA 1997FeldbergESP Geko / HKW Dresden, Germany 63,900 35.5 ”HgA 1997ML Ratingen / MHKW Germany 117,200 3.3 “HgA 1997Pirmasens (Single Row)ABB Enertech AG / KVA Switzerland 35,000 2.9 “HgA 1996NiederurnenD.B. Anlagen / VERA Germany 33,000 5.9 “HgA 1996Hamburg (Single Row)Bechtel Crockett, CA 608,000 2.0 "HgA 1996Caliqua Basel / KVA Switzerland 38,800 2.9 “HgA 1996GamsenStatwerke Kiel / MVA Germany 45,200 103 “HgA 1996KielSiemens KWU / AEZ Germany 165,300 2.9 “HgA 1996Kreis WeselSiemens KWU / Germany 104,100 4.1 “HgA 1996SBA Furth (Single Row)AVI Twente, Hengelo / Netherlands 194,400 2.5 “HgA 1996TwenteBillings Generation Billings, MT 463,696 7.5"HgA 1995Stork Ketels / Netherlands 103,200 2.9 “HgA 1995WapenveldNEMA Netzschkau / Turkey 43,000 2.3 “HgA 1995Izmit (Single Row)Blohm & Voss / SAVA Germany 30,900 3.5 “HgA 1995Brunsbuttel (Single Row)ML Ratingen / MVA Germany 75,000 3.5 “HgA 1995Offenbach (Single Row)
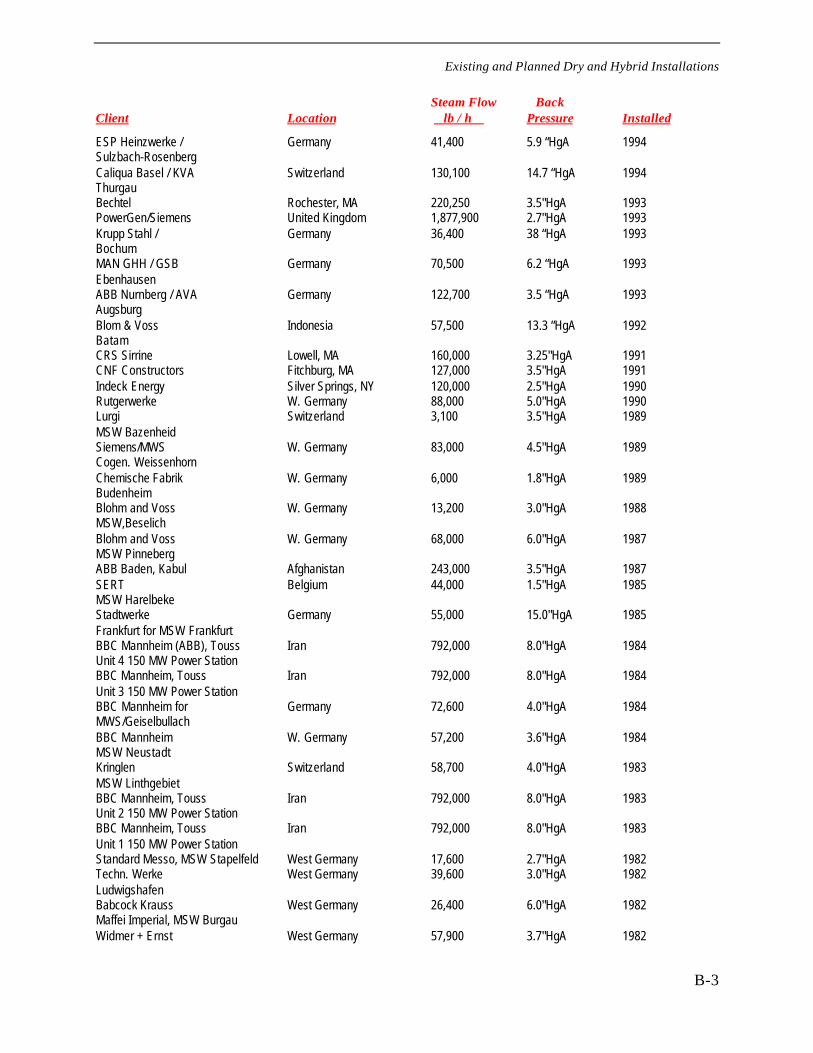
Existing and Planned Dry and Hybrid Installations
B-3
Steam Flow BackClient Location lb / h Pressure Installed
ESP Heinzwerke / Germany 41,400 5.9 “HgA 1994Sulzbach-RosenbergCaliqua Basel / KVA Switzerland 130,100 14.7 “HgA 1994ThurgauBechtel Rochester, MA 220,250 3.5"HgA 1993PowerGen/Siemens United Kingdom 1,877,900 2.7"HgA 1993Krupp Stahl / Germany 36,400 38 “HgA 1993BochumMAN GHH / GSB Germany 70,500 6.2 “HgA 1993EbenhausenABB Nurnberg / AVA Germany 122,700 3.5 “HgA 1993AugsburgBlom & Voss Indonesia 57,500 13.3 “HgA 1992BatamCRS Sirrine Lowell, MA 160,000 3.25"HgA 1991CNF Constructors Fitchburg, MA 127,000 3.5"HgA 1991Indeck Energy Silver Springs, NY 120,000 2.5"HgA 1990Rutgerwerke W. Germany 88,000 5.0"HgA 1990Lurgi Switzerland 3,100 3.5"HgA 1989MSW BazenheidSiemens/MWS W. Germany 83,000 4.5"HgA 1989Cogen. WeissenhornChemische Fabrik W. Germany 6,000 1.8"HgA 1989BudenheimBlohm and Voss W. Germany 13,200 3.0"HgA 1988MSW,BeselichBlohm and Voss W. Germany 68,000 6.0"HgA 1987MSW PinnebergABB Baden, Kabul Afghanistan 243,000 3.5"HgA 1987SERT Belgium 44,000 1.5"HgA 1985MSW HarelbekeStadtwerke Germany 55,000 15.0"HgA 1985Frankfurt for MSW FrankfurtBBC Mannheim (ABB), Touss Iran 792,000 8.0"HgA 1984Unit 4 150 MW Power StationBBC Mannheim, Touss Iran 792,000 8.0"HgA 1984Unit 3 150 MW Power StationBBC Mannheim for Germany 72,600 4.0"HgA 1984MWS/GeiselbullachBBC Mannheim W. Germany 57,200 3.6"HgA 1984MSW NeustadtKringlen Switzerland 58,700 4.0"HgA 1983MSW LinthgebietBBC Mannheim, Touss Iran 792,000 8.0"HgA 1983Unit 2 150 MW Power StationBBC Mannheim, Touss Iran 792,000 8.0"HgA 1983Unit 1 150 MW Power StationStandard Messo, MSW Stapelfeld West Germany 17,600 2.7"HgA 1982Techn. Werke West Germany 39,600 3.0"HgA 1982LudwigshafenBabcock Krauss West Germany 26,400 6.0"HgA 1982Maffei Imperial, MSW BurgauWidmer + Ernst West Germany 57,900 3.7"HgA 1982
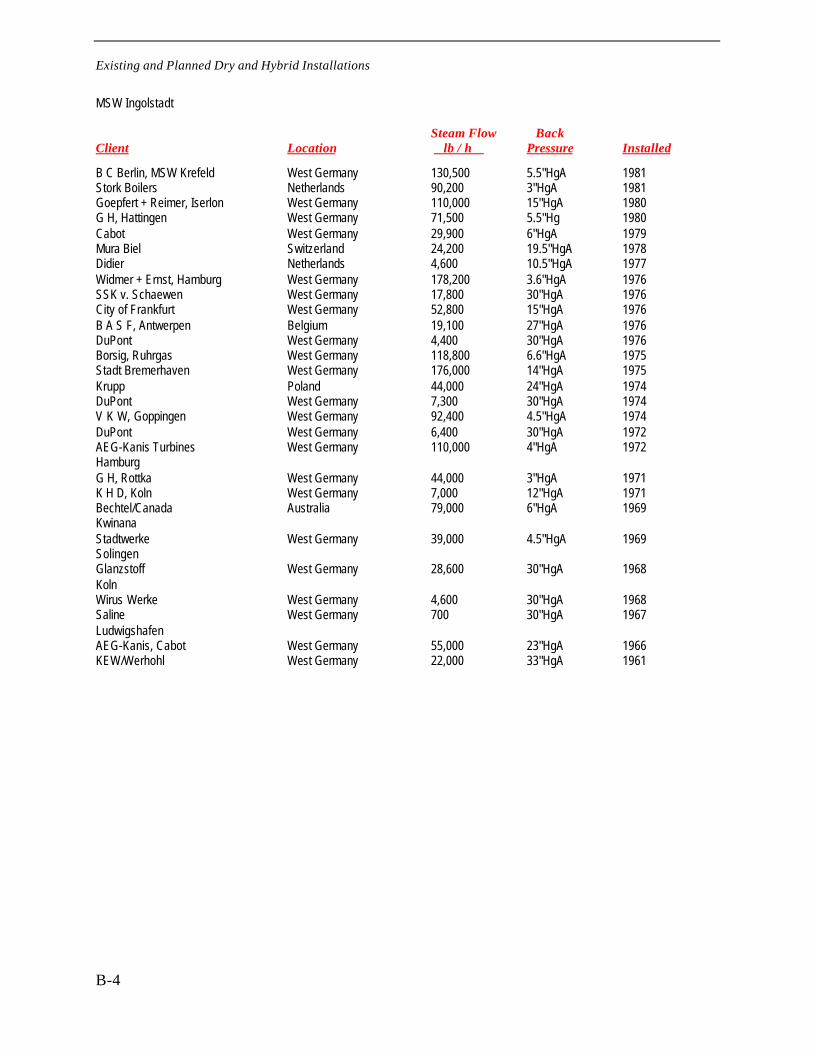
Existing and Planned Dry and Hybrid Installations
B-4
MSW Ingolstadt
Steam Flow BackClient Location lb / h Pressure Installed
B C Berlin, MSW Krefeld West Germany 130,500 5.5"HgA 1981Stork Boilers Netherlands 90,200 3"HgA 1981Goepfert + Reimer, Iserlon West Germany 110,000 15"HgA 1980G H, Hattingen West Germany 71,500 5.5"Hg 1980Cabot West Germany 29,900 6"HgA 1979Mura Biel Switzerland 24,200 19.5"HgA 1978Didier Netherlands 4,600 10.5"HgA 1977Widmer + Ernst, Hamburg West Germany 178,200 3.6"HgA 1976SSK v. Schaewen West Germany 17,800 30"HgA 1976City of Frankfurt West Germany 52,800 15"HgA 1976B A S F, Antwerpen Belgium 19,100 27"HgA 1976DuPont West Germany 4,400 30"HgA 1976Borsig, Ruhrgas West Germany 118,800 6.6"HgA 1975Stadt Bremerhaven West Germany 176,000 14"HgA 1975Krupp Poland 44,000 24"HgA 1974DuPont West Germany 7,300 30"HgA 1974V K W, Goppingen West Germany 92,400 4.5"HgA 1974DuPont West Germany 6,400 30"HgA 1972AEG-Kanis Turbines West Germany 110,000 4"HgA 1972HamburgG H, Rottka West Germany 44,000 3"HgA 1971K H D, Koln West Germany 7,000 12"HgA 1971Bechtel/Canada Australia 79,000 6"HgA 1969KwinanaStadtwerke West Germany 39,000 4.5"HgA 1969SolingenGlanzstoff West Germany 28,600 30"HgA 1968KolnWirus Werke West Germany 4,600 30"HgA 1968Saline West Germany 700 30"HgA 1967LudwigshafenAEG-Kanis, Cabot West Germany 55,000 23"HgA 1966KEW/Werhohl West Germany 22,000 33"HgA 1961
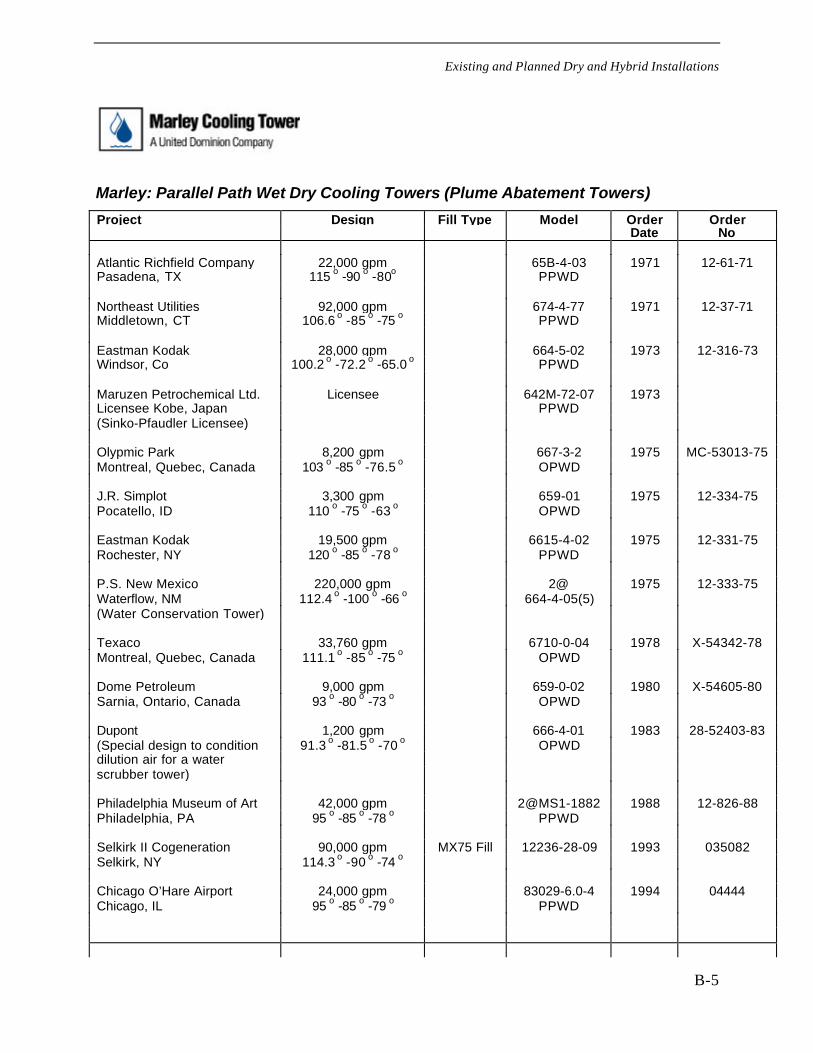
Existing and Planned Dry and Hybrid Installations
B-5
Marley: Parallel Path Wet Dry Cooling Towers (Plume Abatement Towers)
Project Design Fill Type Model Order OrderDate No
Atlantic Richfield Company 22,000 gpm 65B-4-03 1971 12-61-71Pasadena, TX 115 o -90 o -80o PPWD
Northeast Utilities 92,000 gpm 674-4-77 1971 12-37-71Middletown, CT 106.6 o -85 o -75 o PPWD
Eastman Kodak 28,000 gpm 664-5-02 1973 12-316-73Windsor, Co 100.2 o -72.2 o -65.0 o PPWD
Maruzen Petrochemical Ltd. Licensee 642M-72-07 1973Licensee Kobe, Japan PPWD(Sinko-Pfaudler Licensee)
Olypmic Park 8,200 gpm 667-3-2 1975 MC-53013-75Montreal, Quebec, Canada 103 o -85 o -76.5 o OPWD
J.R. Simplot 3,300 gpm 659-01 1975 12-334-75Pocatello, ID 110 o -75 o -63 o OPWD
Eastman Kodak 19,500 gpm 6615-4-02 1975 12-331-75Rochester, NY 120 o -85 o -78 o PPWD
P.S. New Mexico 220,000 gpm 2@ 1975 12-333-75Waterflow, NM 112.4 o -100 o -66 o 664-4-05(5)(Water Conservation Tower)
Texaco 33,760 gpm 6710-0-04 1978 X-54342-78Montreal, Quebec, Canada 111.1 o -85 o -75 o OPWD
Dome Petroleum 9,000 gpm 659-0-02 1980 X-54605-80Sarnia, Ontario, Canada 93 o -80 o -73 o OPWD
Dupont 1,200 gpm 666-4-01 1983 28-52403-83(Special design to condition 91.3 o -81.5 o -70 o OPWDdilution air for a waterscrubber tower)
Philadelphia Museum of Art 42,000 gpm 2@MS1-1882 1988 12-826-88Philadelphia, PA 95 o -85 o -78 o PPWD
Selkirk II Cogeneration 90,000 gpm MX75 Fill 12236-28-09 1993 035082Selkirk, NY 114.3 o -90 o -74 o
Chicago O’Hare Airport 24,000 gpm 83029-6.0-4 1994 04444Chicago, IL 95 o -85 o -79 o PPWD
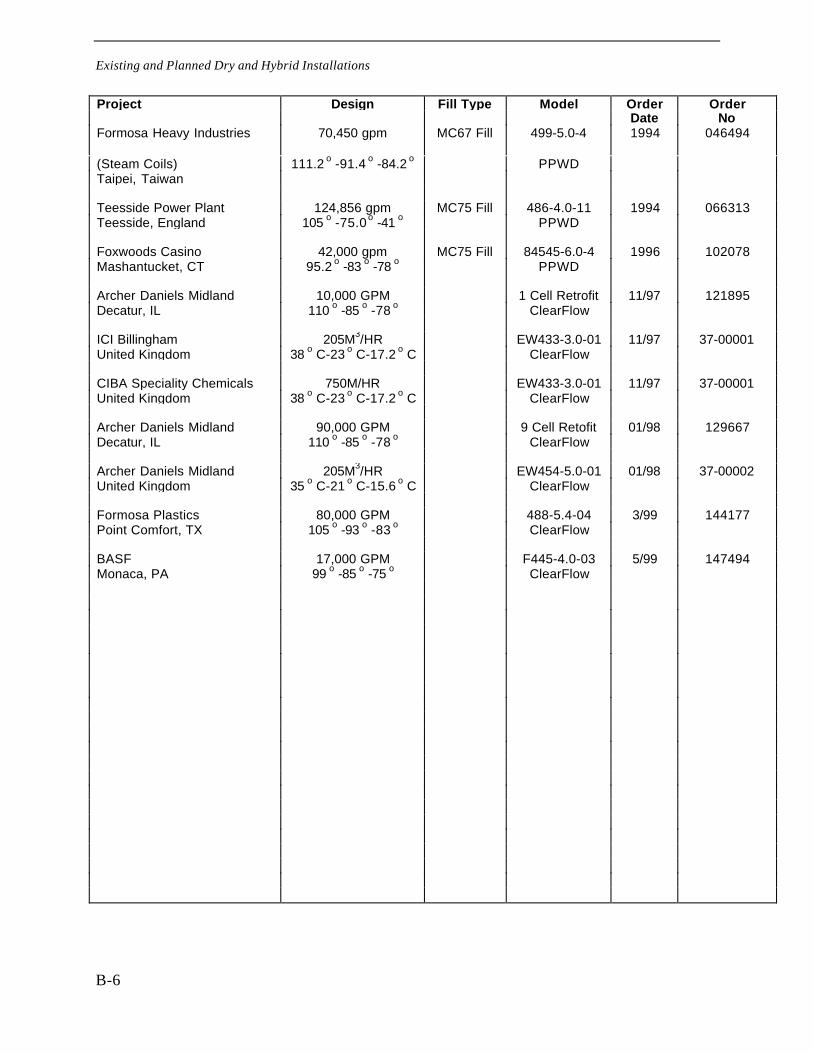
Existing and Planned Dry and Hybrid Installations
B-6
Project Design Fill Type Model Order OrderDate No
Formosa Heavy Industries 70,450 gpm MC67 Fill 499-5.0-4 1994 046494
(Steam Coils) 111.2 o -91.4 o -84.2 o PPWDTaipei, Taiwan
Teesside Power Plant 124,856 gpm MC75 Fill 486-4.0-11 1994 066313Teesside, England 105 o -75.0 o -41 o PPWD
Foxwoods Casino 42,000 gpm MC75 Fill 84545-6.0-4 1996 102078Mashantucket, CT 95.2 o -83 o -78 o PPWD
Archer Daniels Midland 10,000 GPM 1 Cell Retrofit 11/97 121895Decatur, IL 110 o -85 o -78 o ClearFlow
ICI Billingham 205M3/HR EW433-3.0-01 11/97 37-00001United Kingdom 38 o C-23 o C-17.2 o C ClearFlow
CIBA Speciality Chemicals 750M/HR EW433-3.0-01 11/97 37-00001United Kingdom 38 o C-23 o C-17.2 o C ClearFlow
Archer Daniels Midland 90,000 GPM 9 Cell Retofit 01/98 129667Decatur, IL 110 o -85 o -78 o ClearFlow
Archer Daniels Midland 205M3/HR EW454-5.0-01 01/98 37-00002United Kingdom 35 o C-21 o C-15.6 o C ClearFlow
Formosa Plastics 80,000 GPM 488-5.4-04 3/99 144177Point Comfort, TX 105 o -93 o -83 o ClearFlow
BASF 17,000 GPM F445-4.0-03 5/99 147494Monaca, PA 99 o -85 o -75 o ClearFlow
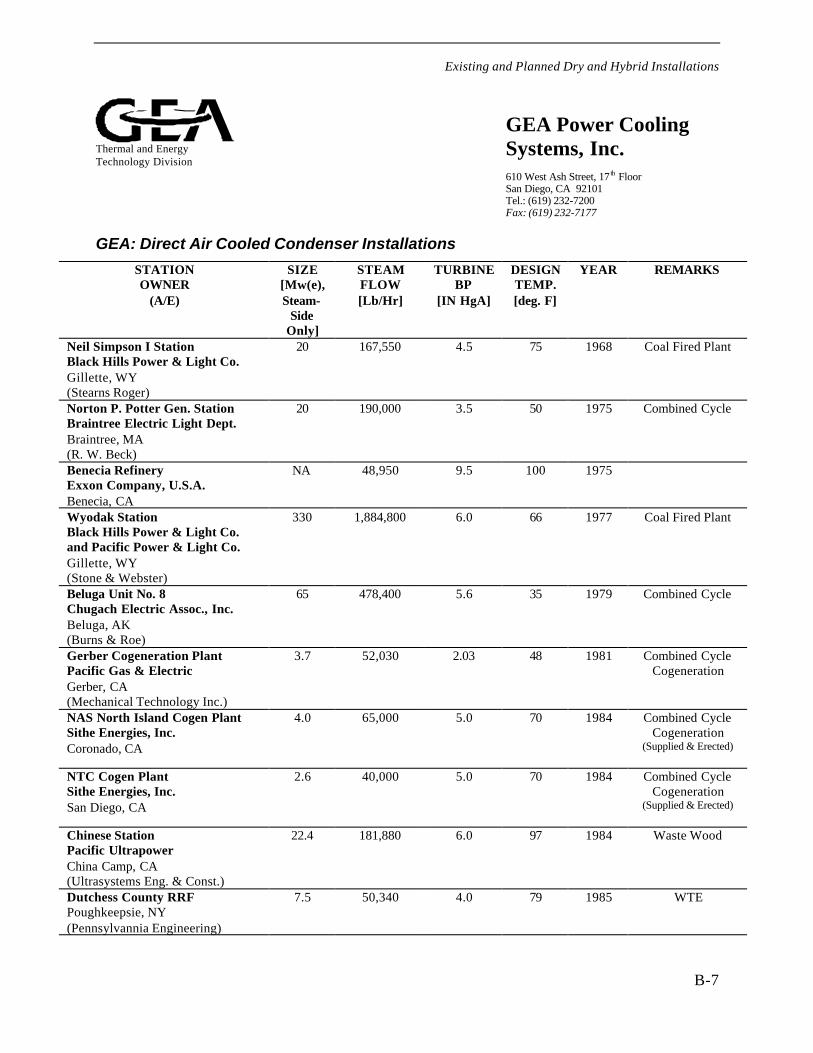
Existing and Planned Dry and Hybrid Installations
B-7
Thermal and EnergyTechnology Division
GEA: Direct Air Cooled Condenser Installations
STATIONOWNER
(A/E)
SIZE[Mw(e),Steam-
SideOnly]
STEAMFLOW[Lb/Hr]
TURBINEBP
[IN HgA]
DESIGNTEMP.[deg. F]
YEAR REMARKS
Neil Simpson I StationBlack Hills Power & Light Co.Gillette, WY(Stearns Roger)
20 167,550 4.5 75 1968 Coal Fired Plant
Norton P. Potter Gen. StationBraintree Electric Light Dept.Braintree, MA(R. W. Beck)
20 190,000 3.5 50 1975 Combined Cycle
Benecia RefineryExxon Company, U.S.A.Benecia, CA
NA 48,950 9.5 100 1975
Wyodak StationBlack Hills Power & Light Co.and Pacific Power & Light Co.Gillette, WY(Stone & Webster)
330 1,884,800 6.0 66 1977 Coal Fired Plant
Beluga Unit No. 8Chugach Electric Assoc., Inc.Beluga, AK(Burns & Roe)
65 478,400 5.6 35 1979 Combined Cycle
Gerber Cogeneration PlantPacific Gas & ElectricGerber, CA(Mechanical Technology Inc.)
3.7 52,030 2.03 48 1981 Combined CycleCogeneration
NAS North Island Cogen PlantSithe Energies, Inc.Coronado, CA
4.0 65,000 5.0 70 1984 Combined CycleCogeneration
(Supplied & Erected)
NTC Cogen PlantSithe Energies, Inc.San Diego, CA
2.6 40,000 5.0 70 1984 Combined CycleCogeneration
(Supplied & Erected)
Chinese StationPacific UltrapowerChina Camp, CA(Ultrasystems Eng. & Const.)
22.4 181,880 6.0 97 1984 Waste Wood
Dutchess County RRFPoughkeepsie, NY(Pennsylvannia Engineering)
7.5 50,340 4.0 79 1985 WTE
GEA Power CoolingSystems, Inc.610 West Ash Street, 17 th FloorSan Diego, CA 92101Tel.: (619) 232-7200Fax: (619) 232-7177
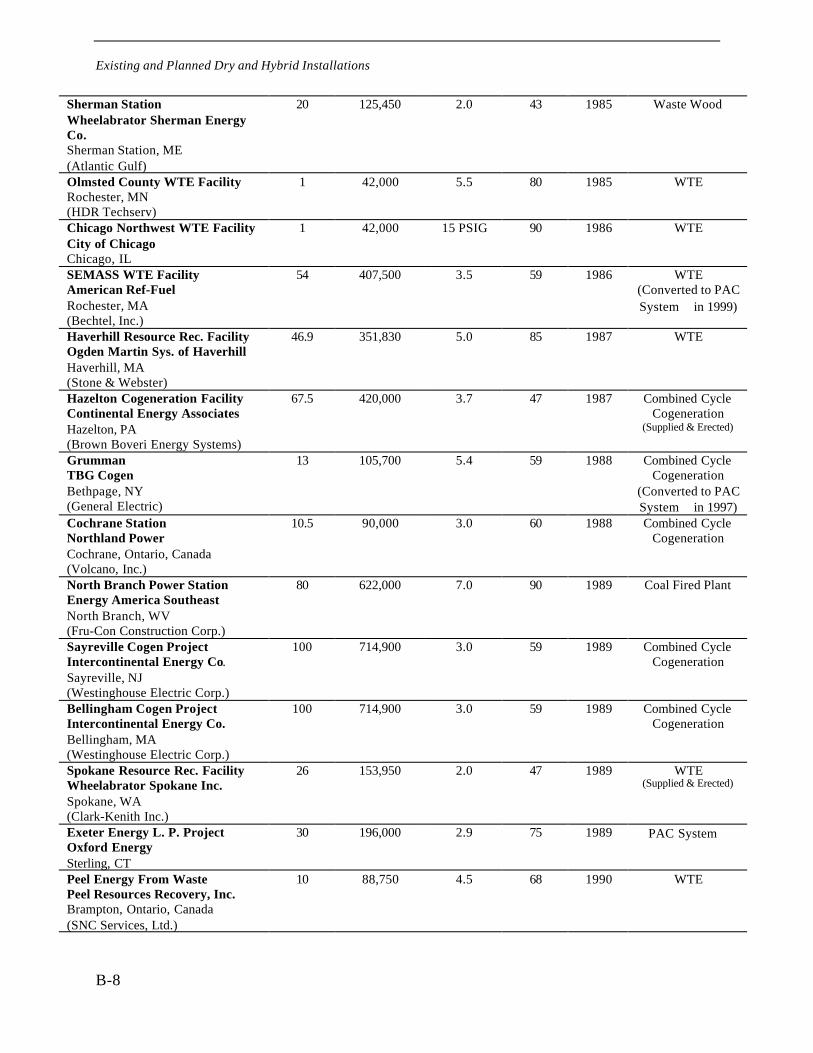
Existing and Planned Dry and Hybrid Installations
B-8
Sherman StationWheelabrator Sherman EnergyCo.Sherman Station, ME(Atlantic Gulf)
20 125,450 2.0 43 1985 Waste Wood
Olmsted County WTE FacilityRochester, MN(HDR Techserv)
1 42,000 5.5 80 1985 WTE
Chicago Northwest WTE FacilityCity of ChicagoChicago, IL
1 42,000 15 PSIG 90 1986 WTE
SEMASS WTE FacilityAmerican Ref-FuelRochester, MA(Bechtel, Inc.)
54 407,500 3.5 59 1986 WTE(Converted to PACSystem in 1999)
Haverhill Resource Rec. FacilityOgden Martin Sys. of HaverhillHaverhill, MA(Stone & Webster)
46.9 351,830 5.0 85 1987 WTE
Hazelton Cogeneration FacilityContinental Energy AssociatesHazelton, PA(Brown Boveri Energy Systems)
67.5 420,000 3.7 47 1987 Combined CycleCogeneration
(Supplied & Erected)
GrummanTBG CogenBethpage, NY(General Electric)
13 105,700 5.4 59 1988 Combined CycleCogeneration
(Converted to PACSystem in 1997)
Cochrane StationNorthland PowerCochrane, Ontario, Canada(Volcano, Inc.)
10.5 90,000 3.0 60 1988 Combined CycleCogeneration
North Branch Power StationEnergy America SoutheastNorth Branch, WV(Fru-Con Construction Corp.)
80 622,000 7.0 90 1989 Coal Fired Plant
Sayreville Cogen ProjectIntercontinental Energy Co.Sayreville, NJ(Westinghouse Electric Corp.)
100 714,900 3.0 59 1989 Combined CycleCogeneration
Bellingham Cogen ProjectIntercontinental Energy Co.Bellingham, MA(Westinghouse Electric Corp.)
100 714,900 3.0 59 1989 Combined CycleCogeneration
Spokane Resource Rec. FacilityWheelabrator Spokane Inc.Spokane, WA(Clark-Kenith Inc.)
26 153,950 2.0 47 1989 WTE(Supplied & Erected)
Exeter Energy L. P. ProjectOxford EnergySterling, CT
30 196,000 2.9 75 1989 PAC System
Peel Energy From WastePeel Resources Recovery, Inc.Brampton, Ontario, Canada(SNC Services, Ltd.)
10 88,750 4.5 68 1990 WTE
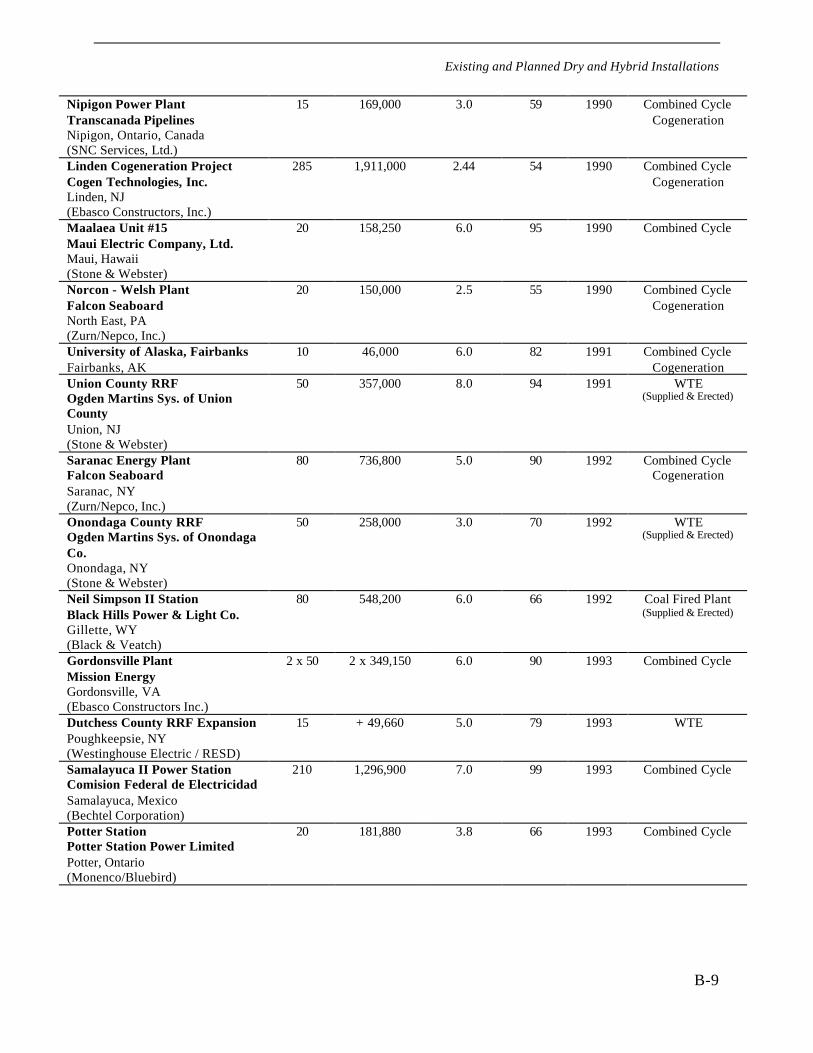
Existing and Planned Dry and Hybrid Installations
B-9
Nipigon Power PlantTranscanada PipelinesNipigon, Ontario, Canada(SNC Services, Ltd.)
15 169,000 3.0 59 1990 Combined CycleCogeneration
Linden Cogeneration ProjectCogen Technologies, Inc.Linden, NJ(Ebasco Constructors, Inc.)
285 1,911,000 2.44 54 1990 Combined CycleCogeneration
Maalaea Unit #15Maui Electric Company, Ltd.Maui, Hawaii(Stone & Webster)
20 158,250 6.0 95 1990 Combined Cycle
Norcon - Welsh PlantFalcon SeaboardNorth East, PA(Zurn/Nepco, Inc.)
20 150,000 2.5 55 1990 Combined CycleCogeneration
University of Alaska, FairbanksFairbanks, AK
10 46,000 6.0 82 1991 Combined CycleCogeneration
Union County RRFOgden Martins Sys. of UnionCountyUnion, NJ(Stone & Webster)
50 357,000 8.0 94 1991 WTE(Supplied & Erected)
Saranac Energy PlantFalcon SeaboardSaranac, NY(Zurn/Nepco, Inc.)
80 736,800 5.0 90 1992 Combined CycleCogeneration
Onondaga County RRFOgden Martins Sys. of OnondagaCo.Onondaga, NY(Stone & Webster)
50 258,000 3.0 70 1992 WTE(Supplied & Erected)
Neil Simpson II StationBlack Hills Power & Light Co.Gillette, WY(Black & Veatch)
80 548,200 6.0 66 1992 Coal Fired Plant(Supplied & Erected)
Gordonsville PlantMission EnergyGordonsville, VA(Ebasco Constructors Inc.)
2 x 50 2 x 349,150 6.0 90 1993 Combined Cycle
Dutchess County RRF ExpansionPoughkeepsie, NY(Westinghouse Electric / RESD)
15 + 49,660 5.0 79 1993 WTE
Samalayuca II Power StationComision Federal de ElectricidadSamalayuca, Mexico(Bechtel Corporation)
210 1,296,900 7.0 99 1993 Combined Cycle
Potter StationPotter Station Power LimitedPotter, Ontario(Monenco/Bluebird)
20 181,880 3.8 66 1993 Combined Cycle
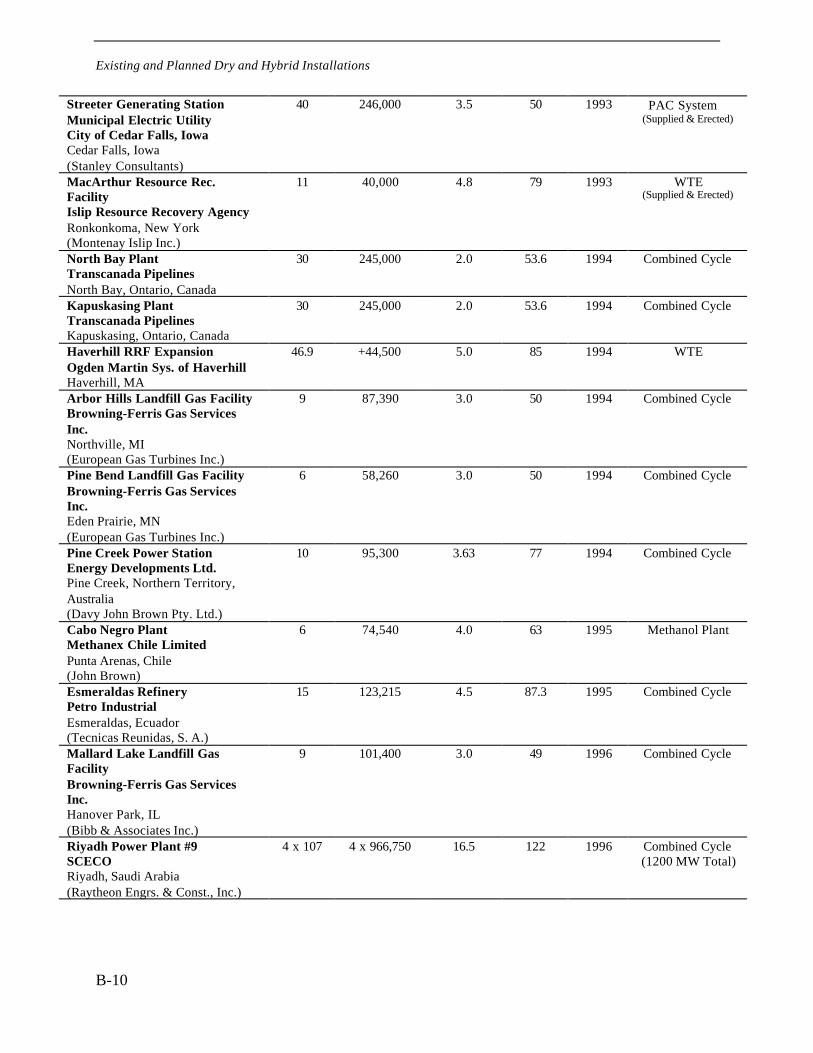
Existing and Planned Dry and Hybrid Installations
B-10
Streeter Generating StationMunicipal Electric UtilityCity of Cedar Falls, IowaCedar Falls, Iowa(Stanley Consultants)
40 246,000 3.5 50 1993 PAC System(Supplied & Erected)
MacArthur Resource Rec.FacilityIslip Resource Recovery AgencyRonkonkoma, New York(Montenay Islip Inc.)
11 40,000 4.8 79 1993 WTE(Supplied & Erected)
North Bay PlantTranscanada PipelinesNorth Bay, Ontario, Canada
30 245,000 2.0 53.6 1994 Combined Cycle
Kapuskasing PlantTranscanada PipelinesKapuskasing, Ontario, Canada
30 245,000 2.0 53.6 1994 Combined Cycle
Haverhill RRF ExpansionOgden Martin Sys. of HaverhillHaverhill, MA
46.9 +44,500 5.0 85 1994 WTE
Arbor Hills Landfill Gas FacilityBrowning-Ferris Gas ServicesInc.Northville, MI(European Gas Turbines Inc.)
9 87,390 3.0 50 1994 Combined Cycle
Pine Bend Landfill Gas FacilityBrowning-Ferris Gas ServicesInc.Eden Prairie, MN(European Gas Turbines Inc.)
6 58,260 3.0 50 1994 Combined Cycle
Pine Creek Power StationEnergy Developments Ltd.Pine Creek, Northern Territory,Australia(Davy John Brown Pty. Ltd.)
10 95,300 3.63 77 1994 Combined Cycle
Cabo Negro PlantMethanex Chile LimitedPunta Arenas, Chile(John Brown)
6 74,540 4.0 63 1995 Methanol Plant
Esmeraldas RefineryPetro IndustrialEsmeraldas, Ecuador(Tecnicas Reunidas, S. A.)
15 123,215 4.5 87.3 1995 Combined Cycle
Mallard Lake Landfill GasFacilityBrowning-Ferris Gas ServicesInc.Hanover Park, IL(Bibb & Associates Inc.)
9 101,400 3.0 49 1996 Combined Cycle
Riyadh Power Plant #9SCECORiyadh, Saudi Arabia(Raytheon Engrs. & Const., Inc.)
4 x 10⁷ 4 x 966,750 16.5 122 1996 Combined Cycle(1200 MW Total)
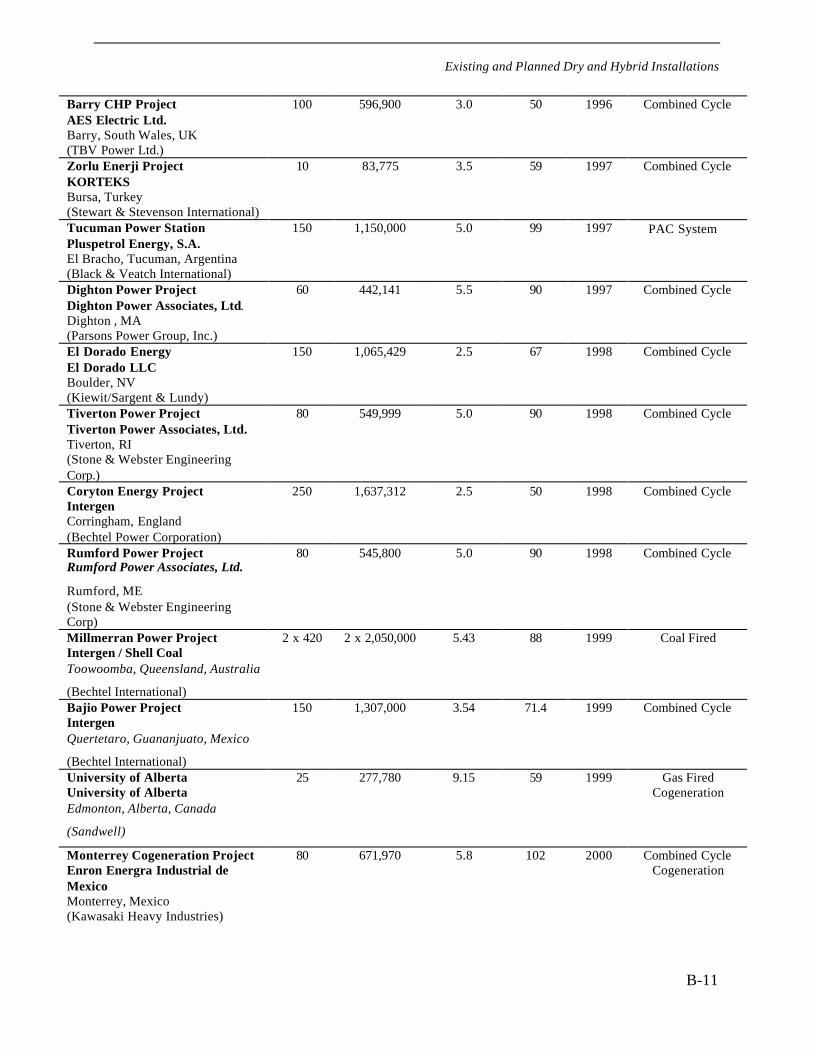
Existing and Planned Dry and Hybrid Installations
B-11
Barry CHP ProjectAES Electric Ltd.Barry, South Wales, UK(TBV Power Ltd.)
100 596,900 3.0 50 1996 Combined Cycle
Zorlu Enerji ProjectKORTEKSBursa, Turkey(Stewart & Stevenson International)
10 83,775 3.5 59 1997 Combined Cycle
Tucuman Power StationPluspetrol Energy, S.A.El Bracho, Tucuman, Argentina(Black & Veatch International)
150 1,150,000 5.0 99 1997 PAC System
Dighton Power ProjectDighton Power Associates, Ltd.Dighton , MA(Parsons Power Group, Inc.)
60 442,141 5.5 90 1997 Combined Cycle
El Dorado EnergyEl Dorado LLCBoulder, NV(Kiewit/Sargent & Lundy)
150 1,065,429 2.5 67 1998 Combined Cycle
Tiverton Power ProjectTiverton Power Associates, Ltd.Tiverton, RI(Stone & Webster EngineeringCorp.)
80 549,999 5.0 90 1998 Combined Cycle
Coryton Energy ProjectIntergenCorringham, England(Bechtel Power Corporation)
250 1,637,312 2.5 50 1998 Combined Cycle
Rumford Power ProjectRumford Power Associates, Ltd.
Rumford, ME(Stone & Webster EngineeringCorp)
80 545,800 5.0 90 1998 Combined Cycle
Millmerran Power ProjectIntergen / Shell CoalToowoomba, Queensland, Australia
(Bechtel International)
2 x 420 2 x 2,050,000 5.43 88 1999 Coal Fired
Bajio Power ProjectIntergenQuertetaro, Guananjuato, Mexico
(Bechtel International)
150 1,307,000 3.54 71.4 1999 Combined Cycle
University of AlbertaUniversity of AlbertaEdmonton, Alberta, Canada
(Sandwell)
25 277,780 9.15 59 1999 Gas FiredCogeneration
Monterrey Cogeneration ProjectEnron Energra Industrial deMexicoMonterrey, Mexico(Kawasaki Heavy Industries)
80 671,970 5.8 102 2000 Combined CycleCogeneration

Existing and Planned Dry and Hybrid Installations
B-12
Gelugor Power StationTenaga Nasional Berhad (TNB)Penang, Malaysia
(Kawasaki Heavy Industry)
120 946,600 6.8 89.6 2000 Combine CycleCogeneration
Front Range Power ProjectFountain, Colorado
(TIC/UE Front Range JV)
150 1,266,477 3.57 80 2000 Combine Cycle
Goldendale Energy ProjectGoldendale Energy Inc.Goldendale, Washington
(NEPCO)
110 678,000 4.5 90 2000 Combine CyclePAC System
Athens Power StationPG & E GeneratingAthens, New York
(Bechtel Power)
3 x 120 3 x 749,183 5 90 2000 Combined Cycle
Moapa Energy FacilityDuke Energy Moapa, LLCClark County, Nevada
(Duke/Fluor Daniel)
2 x 200 2 x 1,718,790 6.25 103 2001 Combined Cycle(1200 MW Total)
Wygen 1, Unit 3 Power ProjectBlack Hills Generation, Inc.Gillette, Wyoming(Babcock & Wilcox)
80 548,200 6.0 66 2001 Coal Fired Plant
Hunterstown Power ProjectReliant EnergyHunterstown, Pennsylvania
(Black & Veatch)
350 1,690,000 4.6 90 2001 Combined Cycle(890 MW Total)
Low Noise(51 dBA @ 400 ft)
Choctaw County Power ProjectReliant EnergyFrench Camp, Mississippi(Black & Veatch)
350 1,690,000 4.6 90 2001 Combined Cycle(890 MW Total)
Otay Mesa Energy CenterCalpineSan Diego, California(Duke/Fluor Daniel)
277 1,501,332 3.47 74 2001 Combined Cycle
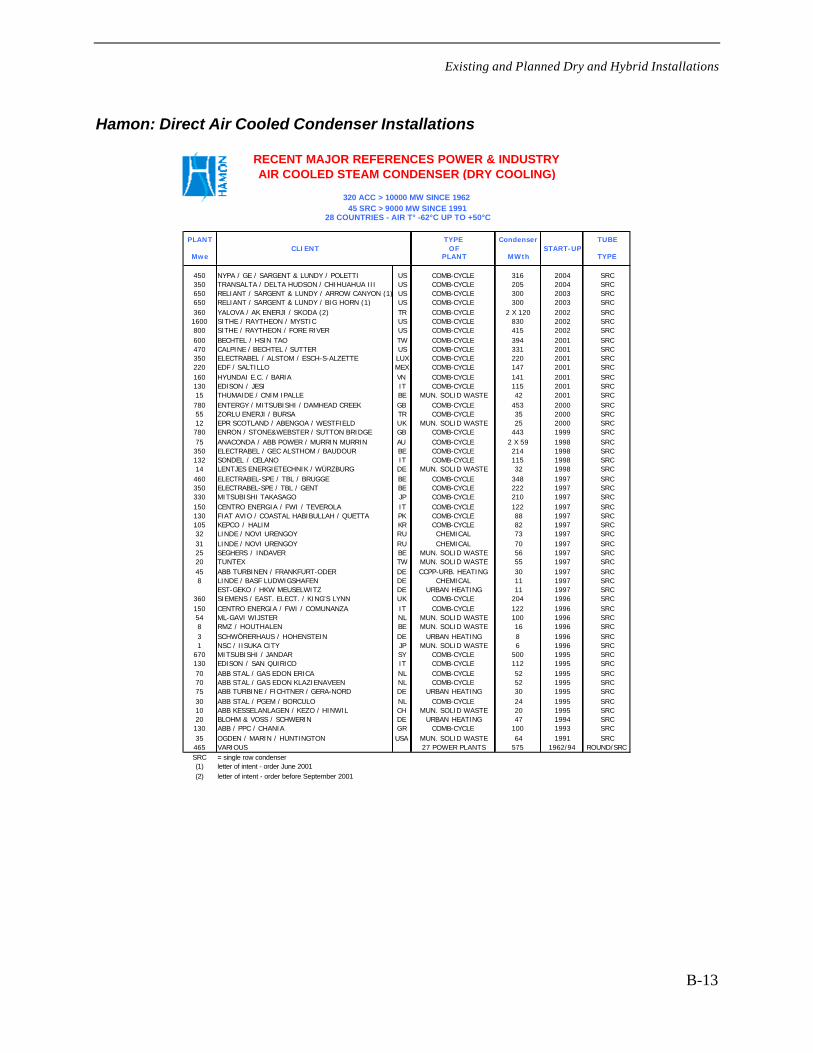
Existing and Planned Dry and Hybrid Installations
B-13
Hamon: Direct Air Cooled Condenser Installations
PLANT TYPE Condenser TUBECLIENT OF START-UP
Mwe PLANT MWth TYPE
450 NYPA / GE / SARGENT & LUNDY / POLETTI US COMB-CYCLE 316 2004 SRC350 TRANSALTA / DELTA HUDSON / CHIHUAHUA III US COMB-CYCLE 205 2004 SRC650 RELIANT / SARGENT & LUNDY / ARROW CANYON (1) US COMB-CYCLE 300 2003 SRC650 RELIANT / SARGENT & LUNDY / BIG HORN (1) US COMB-CYCLE 300 2003 SRC360 YALOVA / AK ENERJI / SKODA (2) TR COMB-CYCLE 2 X 120 2002 SRC1600 SITHE / RAYTHEON / MYSTIC US COMB-CYCLE 830 2002 SRC800 SITHE / RAYTHEON / FORE RIVER US COMB-CYCLE 415 2002 SRC600 BECHTEL / HSIN TAO TW COMB-CYCLE 394 2001 SRC470 CALPINE / BECHTEL / SUTTER US COMB-CYCLE 331 2001 SRC350 ELECTRABEL / ALSTOM / ESCH-S-ALZETTE LUX COMB-CYCLE 220 2001 SRC220 EDF / SALTILLO MEX COMB-CYCLE 147 2001 SRC160 HYUNDAI E.C. / BARIA VN COMB-CYCLE 141 2001 SRC130 EDISON / JESI IT COMB-CYCLE 115 2001 SRC15 THUMAIDE / CNIM IPALLE BE MUN. SOLID WASTE 42 2001 SRC780 ENTERGY / MITSUBISHI / DAMHEAD CREEK GB COMB-CYCLE 453 2000 SRC55 ZORLU ENERJI / BURSA TR COMB-CYCLE 35 2000 SRC12 EPR SCOTLAND / ABENGOA / WESTFIELD UK MUN. SOLID WASTE 25 2000 SRC780 ENRON / STONE&WEBSTER / SUTTON BRIDGE GB COMB-CYCLE 443 1999 SRC75 ANACONDA / ABB POWER / MURRIN MURRIN AU COMB-CYCLE 2 X 59 1998 SRC350 ELECTRABEL / GEC ALSTHOM / BAUDOUR BE COMB-CYCLE 214 1998 SRC132 SONDEL / CELANO IT COMB-CYCLE 115 1998 SRC14 LENTJES ENERGIETECHNIK / WÜRZBURG DE MUN. SOLID WASTE 32 1998 SRC460 ELECTRABEL-SPE / TBL / BRUGGE BE COMB-CYCLE 348 1997 SRC350 ELECTRABEL-SPE / TBL / GENT BE COMB-CYCLE 222 1997 SRC330 MITSUBISHI TAKASAGO JP COMB-CYCLE 210 1997 SRC150 CENTRO ENERGIA / FWI / TEVEROLA IT COMB-CYCLE 122 1997 SRC130 FIAT AVIO / COASTAL HABIBULLAH / QUETTA PK COMB-CYCLE 88 1997 SRC105 KEPCO / HALIM KR COMB-CYCLE 82 1997 SRC32 LINDE / NOVI URENGOY RU CHEMICAL 73 1997 SRC31 LINDE / NOVI URENGOY RU CHEMICAL 70 1997 SRC25 SEGHERS / INDAVER BE MUN. SOLID WASTE 56 1997 SRC20 TUNTEX TW MUN. SOLID WASTE 55 1997 SRC45 ABB TURBINEN / FRANKFURT-ODER DE CCPP-URB. HEATING 30 1997 SRC8 LINDE / BASF LUDWIGSHAFEN DE CHEMICAL 11 1997 SRC
EST-GEKO / HKW MEUSELWITZ DE URBAN HEATING 11 1997 SRC360 SIEMENS / EAST. ELECT. / KING'S LYNN UK COMB-CYCLE 204 1996 SRC150 CENTRO ENERGIA / FWI / COMUNANZA IT COMB-CYCLE 122 1996 SRC54 ML-GAVI WIJSTER NL MUN. SOLID WASTE 100 1996 SRC8 RMZ / HOUTHALEN BE MUN. SOLID WASTE 16 1996 SRC3 SCHWÖRERHAUS / HOHENSTEIN DE URBAN HEATING 8 1996 SRC1 NSC / IISUKA CITY JP MUN. SOLID WASTE 6 1996 SRC
670 MITSUBISHI / JANDAR SY COMB-CYCLE 500 1995 SRC130 EDISON / SAN QUIRICO IT COMB-CYCLE 112 1995 SRC70 ABB STAL / GAS EDON ERICA NL COMB-CYCLE 52 1995 SRC70 ABB STAL / GAS EDON KLAZIENAVEEN NL COMB-CYCLE 52 1995 SRC75 ABB TURBINE / FICHTNER / GERA-NORD DE URBAN HEATING 30 1995 SRC30 ABB STAL / PGEM / BORCULO NL COMB-CYCLE 24 1995 SRC10 ABB KESSELANLAGEN / KEZO / HINWIL CH MUN. SOLID WASTE 20 1995 SRC20 BLOHM & VOSS / SCHWERIN DE URBAN HEATING 47 1994 SRC130 ABB / PPC / CHANIA GR COMB-CYCLE 100 1993 SRC35 OGDEN / MARIN / HUNTINGTON USA MUN. SOLID WASTE 64 1991 SRC465 VARIOUS 27 POWER PLANTS 575 1962/94 ROUND/SRCSRC = single row condenser(1) letter of intent - order June 2001
(2) letter of intent - order before September 2001
28 COUNTRIES - AIR T° -62°C UP TO +50°C
RECENT MAJOR REFERENCES POWER & INDUSTRYAIR COOLED STEAM CONDENSER (DRY COOLING)
320 ACC > 10000 MW SINCE 196245 SRC > 9000 MW SINCE 1991
C-1
Appendix C MATERIALS FROM DRY COOLING SYSTEMOWNER/OPERATORS
Interview Meetings
• Crockett Co-Generation Plant, ESOCO Crockett, Inc., 550 Loring Avenue, Crockett, CA,94525, (510) 787-4100 (main).
• El Dorado Energy, El Dorado Energy LLC, 701 Eldorado Valley Drive, P.O. Box 62470,Boulder City, NV 89006-2470, 702-568-8206 (main), 702-568-8213 (fax),
• Calpine , 620 Coolidge Drive, Suite 200, Folsom, CA 95630, 916-608-3800 (main), 916-985-5655 (fax)
Crockett Co-Generation Plant
Site Visit Report (June 12, 2000)
Personnel: Peter H. So (host), Plant Engineer, 510-787-4105, 510-787-4150 (FAX),[email protected]
Owners: NRG Energy (owns 138.4 of 240Mw) and others. Subsidiary of Northern States PowerCompany, 1221 Nicollet Mall, Suite 700, Minneapolis, MN, 55403-2445, 612-373-5300 (main),800-241-4674 (toll free), 612-373-5312 (fax).
Constructor: Bechtel Power Company
Plant description:
• Gas-fired co-generation units
• 240 Mwe (~2/3 gas turbines; 1/3 steam turbine)
• Turbine Generator: General Electric (Frame 7H turbines)
• Heat Recovery Steam Generator: Vogt
• Plant went commercial in 1996.
• Provides steam to C&H Sugar on neighboring site:
• 450 psi steam to 3 auxiliary boilers (50 – 350 kph; nominal 250 kph)
Materials from Interviews with Dry Cooling System Operators
C-2
• Approx. 2/3 of condensate returned; discarded if it contains detectable TOC; otherwise,polished and reused
• Electric to PG&E
• Gas/steam turbines on single shaft.
• Can augment HRSG with 20 Mw duct burner
• Steam augmentation to gas turbines of ~20 Mw.
Air-cooled condenser: (See attached sketch and spec. sheet end of section)
Balcke-Duerr, 405 N. Reo Street, Suite 300, Tampa, FL 33609, 813-289-1516 (main). Contact:Ralph Wyndrum, 813-342-4916 (direct), 813-342-7916 (fax).
ACC Model No.: 120-9310-8810-2---4-TR
Dry cooling was chosen for two primary reasons:
1. space considerations (plant on 2 ½ acre site)
2. regulatory schedule (estimated 5 years to get permit to use Bay water)
A general description of the system includes:
• 15 cells; 12 for steam condesaton/3 for plant water cooling (lube oil/bearings/etc)
• Cells in three parallel banks of 5 cells (4 for condenser) each. One cell in each bank in refluxconfiguration for non-condensable removal. (See sketch 1.)
• All heat exchanger, fan and other descriptive information in attached spec. sheet.
Operating issues include:
• Unit runs well
• No problems with wind effects on performance
• Freeze protection has not been a problem but the cold weather operating controls sometimesact strangely; i.e., fans will turn off and operators don’t know why. Apparent conflictbetween Balcke-Duerr operating system and the plant Foxboro I&C package---not a seriousproblem.
• No air in-leakage problems; vacuum systems/de-aerators work well.
• Water chemistry not difficult to control (HRSG at pH = 9 with amine treatment).
• High make-up rates because of condensate not being returned by C&H or having to bediscarded.
• Results in complete turnover of cycle water every 2 or 3 days.
Materials from Interviews with Dry Cooling System Operators
C-3
Air-side cleaning issues include:
• Frequency—manufacturer’s recommendation “at least annually”; last cleaning interval was18 months.
• We got somewhat conflicting stories about the need for and effect of cleaning. The maincontaminant is sugar dust from loading/unloading activities at C&H. It coats the fins andbiological activity creates a tough black layer.
• So felt that the fouling was not obvious and there was no particular change in appearance as aresult of cleaning. Others said an adherent black layer came off leaving the tubes a light gray.
• So felt there was no particular improvement in performance as a result of the cleaning.Others reported that the automatic controls had cut some of the fans back from full to halfspeed at similar conditions after cleaning.
• Wash water is discharged to straits.
There is no systematic monitoring of the ACC performance. Since the gas turbines and the steamturbines are on a single shaft, there is no way to know how the two parts contribute to the output.However, Crockett does keep data records of ambient temperature, steam flow and cold watertemperature leaving the ACC. It would seem to be possible to extract at least averageperformance information over some period of time and generate cleanliness factors for the unit.
The general estimate was that very hot days cost the company 3 to 5 Mw on the steam side at “7or 8” on the gas turbine side.
Noise is not much of a problem. Limits are < 50db at the nearest residence and at 300 yards intothe Bay. There is apparently no trouble in maintaining these levels. The noise on the fan deckwas not excessive—comfortable to walk around.
Corrosion issues include:
• No known corrosion problems on the tubes or fins, at the fin-tube contacts points or at thetube header connections. The use de-mineralized water to wash and do not use externalsprays for hot weather performance enhancement.
• Crockett is considering installing sprays (talking with MeeSpray Humidification Division(See “Other Contacts”) and recognize that there might be corrosion/scaling problems if notoperated properly. There are examples of spray enhanced units locally (Shell Martinez andTOSCO) See “Other Contacts.”
Worker safety issues include:
• Some problems with knowing when particular fans are locked out or just “off”.
• Gear box oil is awkward to change, requires workers to hang through the fan blades.
• Can get too hot on discharge side of exchangers—must limit working time to approximately15 minutes.
Materials from Interviews with Dry Cooling System Operators
C-4
Costs issues include:
• No information on capital costs.
• Operating costs (15 fans each 150 Hp; draws about 2 Mw, biggest power requirement at theplant).
• Maintenance costs are not separately accounted for by units. They have a sponsorshipprogram where individual technicians/operator “adopt” a particular component and becomethe “plant expert” on it.
The plant is run with 26 employees. Each shift has 2 operators and 1 supervisor per shift (3 x 4 =12). The day shift has 2 mechanical and 3 I/C technicians (2 + 3 = 5).
Other contacts include:
Jan Polawachek,Foster-Wheeler, TOSCO (air-cooled process cooler with spray enhancement).
Janet Opio,air-cooled unit.
David J. Ayres, Manger, Utilities Department, Martinez Refining Co., Division of EquilonEnterprises, LLC, P.O. Box 711, Martinez, CA 94553-0071, 925-313-3378 (direct), 925-313-3059 (fax), [email protected].
Tae H. Lee, Sales, Mee Industries (spray enhancement for gas turbine inlets and air-cooledequipment), 204 West Pomona Avenue, Monrovia, CA 91016, 626-359-4550 (direct), 626-359-4660 (fax), [email protected].
Humidification Division, 1651 Katy Lane, Fort Mill, SC 29715, 803-547-2380 (main), 803-547-2379 (fax), www.meefog.thomasregister.com.
System Description: Crockett Co-generation Project, Air-Cooled Condenser
1.0 The Air-Cooled Condenser System
1.1 Function of an Air-Cooled Condenser
The Air-Cooled Condenser (ACC) serves to condense steam from the steamturbine exhaust and/or the steam turbine bypass system. As the name implies,ambient air is used as the cooling medium. The exhaust steam is condensed withinthe finned bundles by the heat transfer with the air passing over the externalsurface of the finned tube bundles. The air absorbs the steam's latent heat ofcondensation and is heated in the process. The steam is condensed and is thenreturned to the ACC condensate tank to be re-used as boiler feedwater .
1.2 General Description
Materials from Interviews with Dry Cooling System Operators
C-5
Turbine exhaust or bypass steam is supplied to the condensing elements throughdual 96"0 exhaust steam duct and three(3) 75"0 distribution manifolds. Each 96"0steam duct and the 96"0 riser distribution manifold includes a drain pot to removeany condensate developed in the ducting during start-up and normal operation.
The finned tube elements are arranged in a triple-roof configuration. Each roofconsists of four(4) ACC modules. Each module contains one(l) fan and ten(10)finned-tube bundles. The complete ACC unit consists of 120 (12 x 10) finned-tube bundles. Each finned-tube bundle consists of200, single pass, CS-HDG ovalfinned tubes. The tubes are arranged in three parallel rows between tubesheets/headers.
The finned-tube bundles are arranged in two roofs and assembled on a 341-6"high steel support structure. The ACC is located on the roof of the turbinebuilding. The turbine exhaust steam duct exits the turbine from dual side exhausts,is routed to the ACC riser manifold and divides into three(3) duct risers outside ofthe turbine building.
The steam distribution manifolds at the apex of the tube bundles directs the steamto finned-tube bundles in the nine(9) condenser modules. The nine(9) condensermodules function as parallel flow condensers. The steam and condensate flowdownward, in the same direction.
The remaining steam flows from the bottom of the condenser modules to thethree(3) reflux modules where it is condensed in a counter-flow mode. Counter-flow, or Reflux, condensation consists of upward flowing steam and downwardflowing condensate. The counter-flow mechanism permits the warm steam to bein contact with the condensate, thus minimizing sub-cooling and the risk offreezing. Figure 1 on the following page illustrates the arrangement of the parallelflow and counter flow modules.
Condensate from the ACC is collected in the 18"0 condensate collection headersand is gravity drained to the ACC condensate hotwell tank.
Non-condensibles are removed from the ACC at the top of the reflux modules andare evacuated by the Steam Jet Air Ejector System (SJAE). The evacuationsystem consists of one single-stage hogging (start-up) ejector and 2 x 100% two-stage steam holding ( operating) ejectors. Motive steam is utilized to operate theSJAE system.
Cooling air is delivered through the finned tube bundles by ultra-low noise, forceddraft axial fans located at the base of the ACC bundle delta. The fans are drivenby two-speed electric motors and parallel shaft gearboxes.
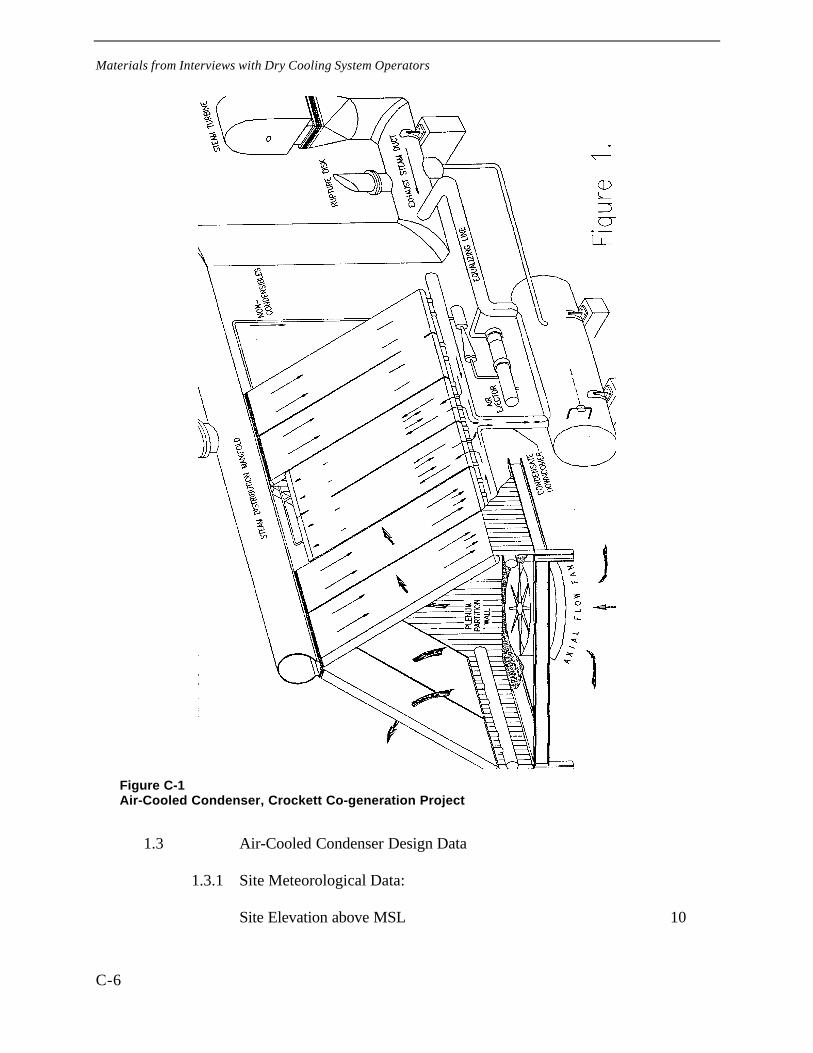
Materials from Interviews with Dry Cooling System Operators
C-6
Figure C-1Air-Cooled Condenser, Crockett Co-generation Project
1.3 Air-Cooled Condenser Design Data
1.3.1 Site Meteorological Data:
Site Elevation above MSL 10
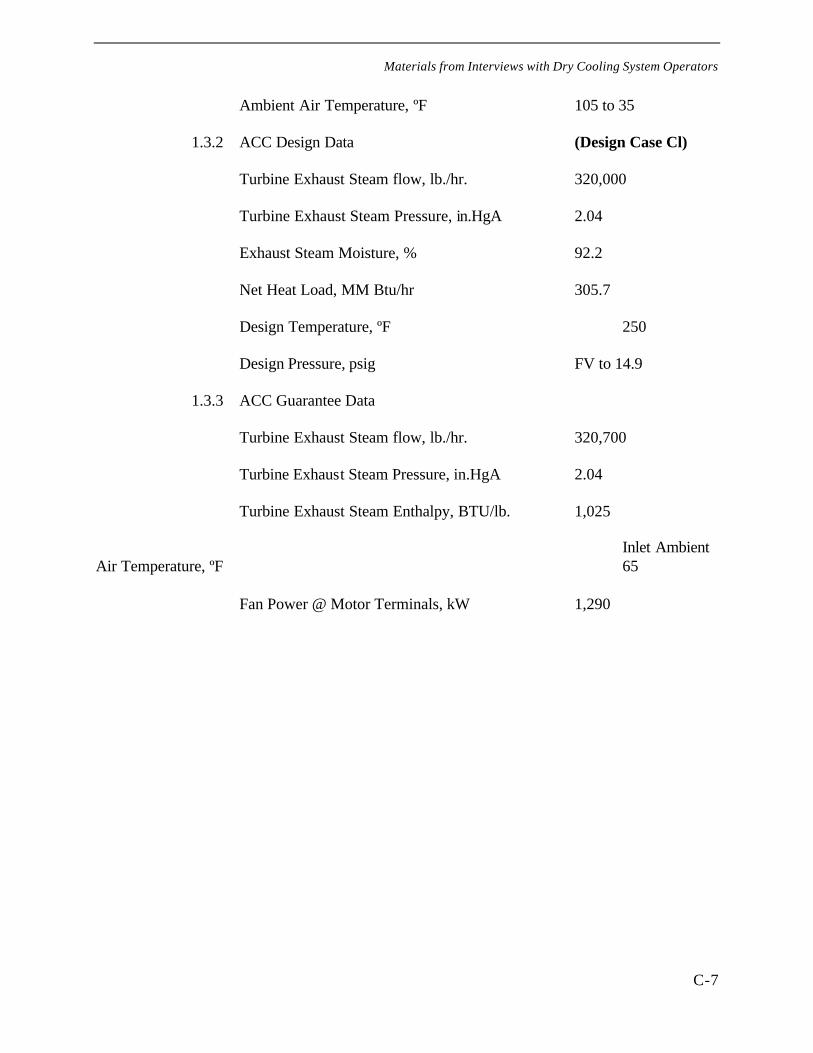
Materials from Interviews with Dry Cooling System Operators
C-7
Ambient Air Temperature, ºF 105 to 35
1.3.2 ACC Design Data (Design Case Cl)
Turbine Exhaust Steam flow, lb./hr. 320,000
Turbine Exhaust Steam Pressure, in.HgA 2.04
Exhaust Steam Moisture, % 92.2
Net Heat Load, MM Btu/hr 305.7
Design Temperature, ºF 250
Design Pressure, psig FV to 14.9
1.3.3 ACC Guarantee Data
Turbine Exhaust Steam flow, lb./hr. 320,700
Turbine Exhaust Steam Pressure, in.HgA 2.04
Turbine Exhaust Steam Enthalpy, BTU/lb. 1,025
Inlet AmbientAir Temperature, ºF 65
Fan Power @ Motor Terminals, kW 1,290
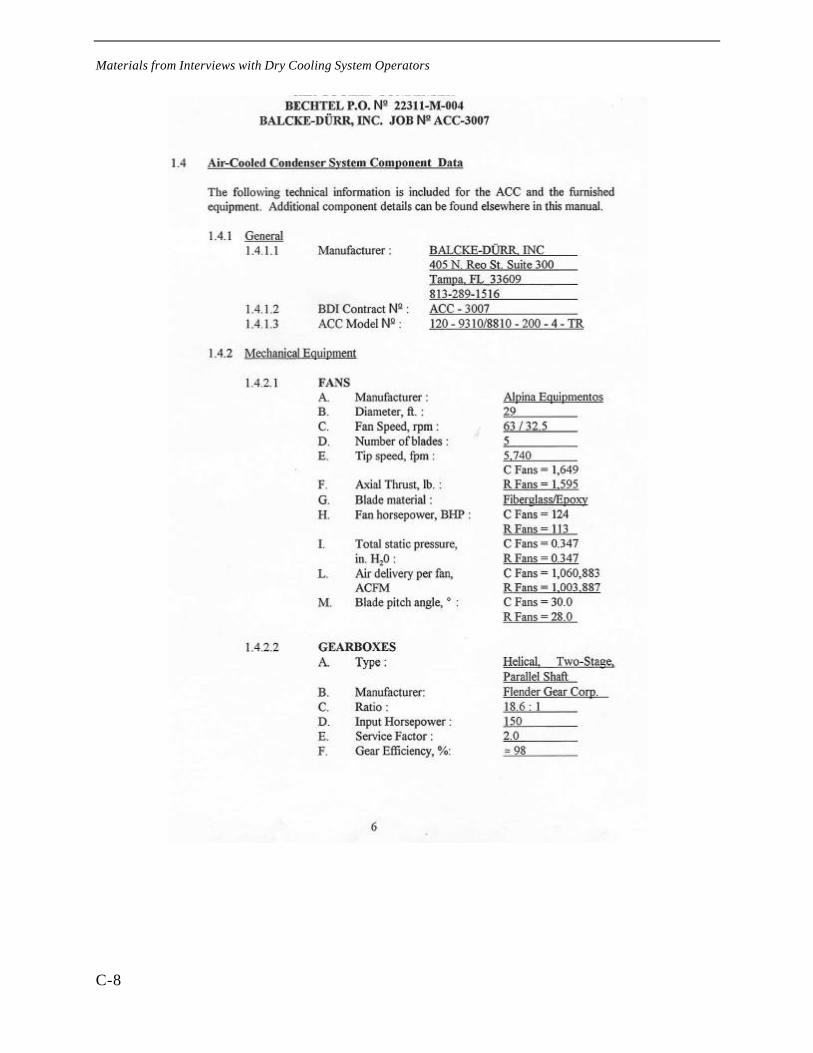
Materials from Interviews with Dry Cooling System Operators
C-8
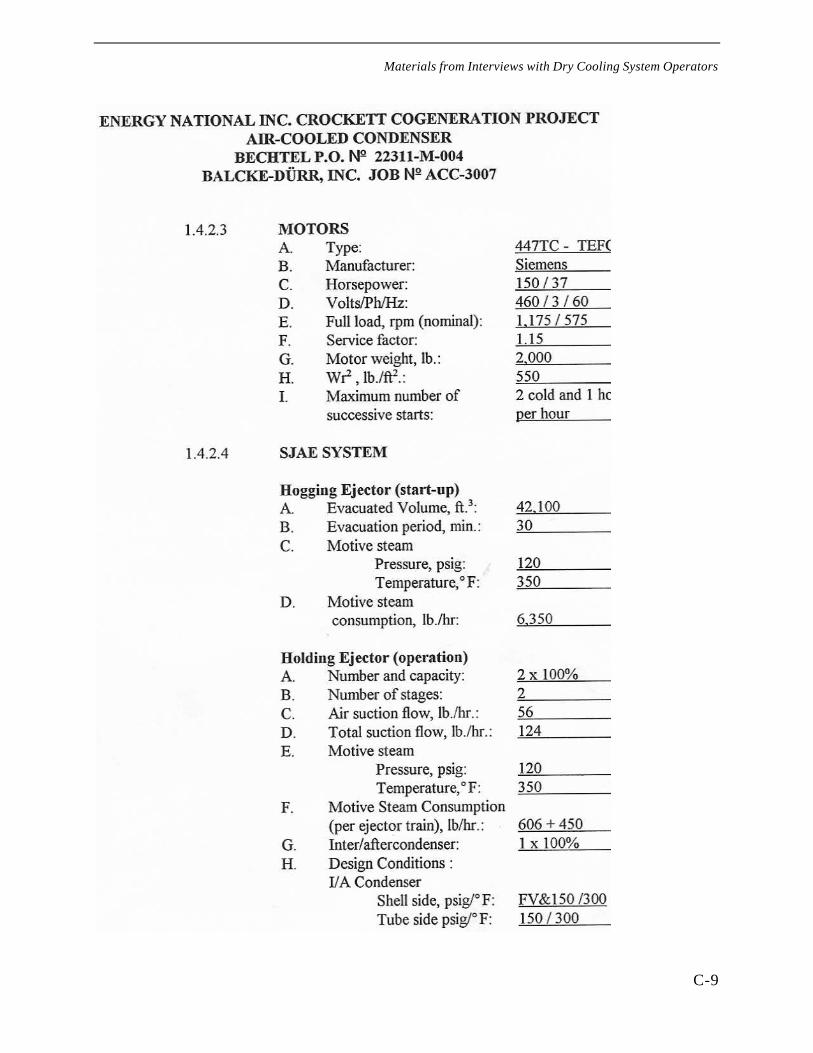
Materials from Interviews with Dry Cooling System Operators
C-9
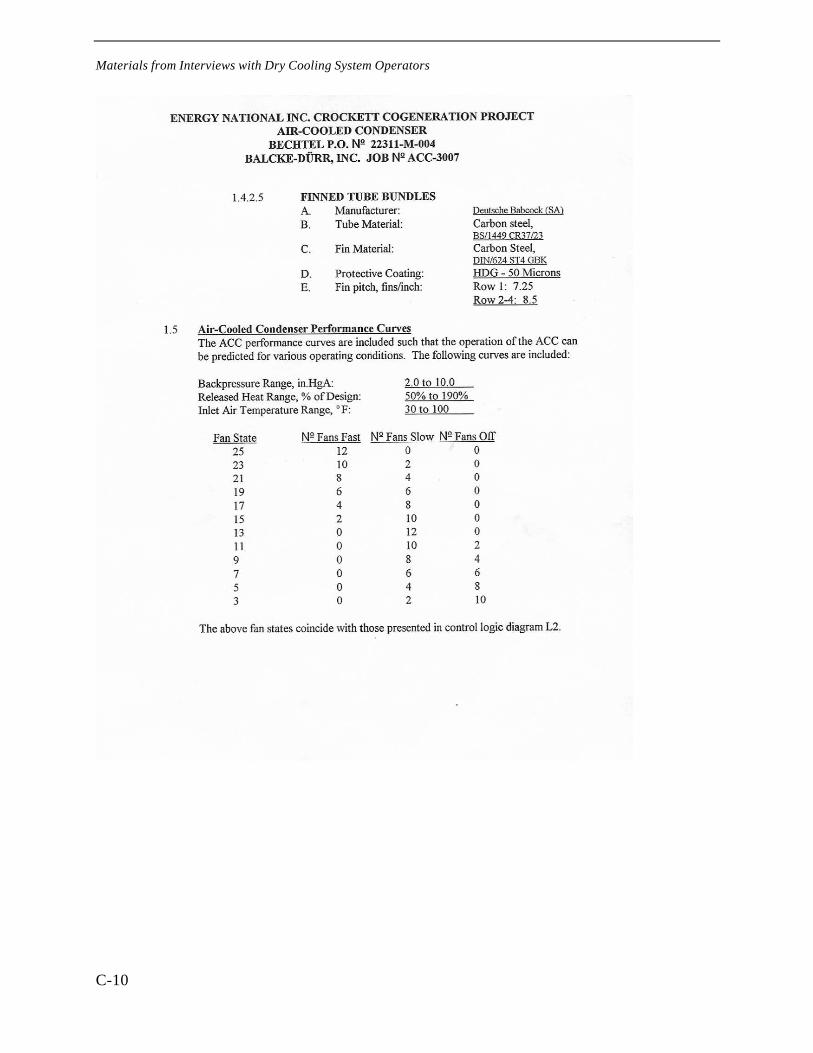
Materials from Interviews with Dry Cooling System Operators
C-10
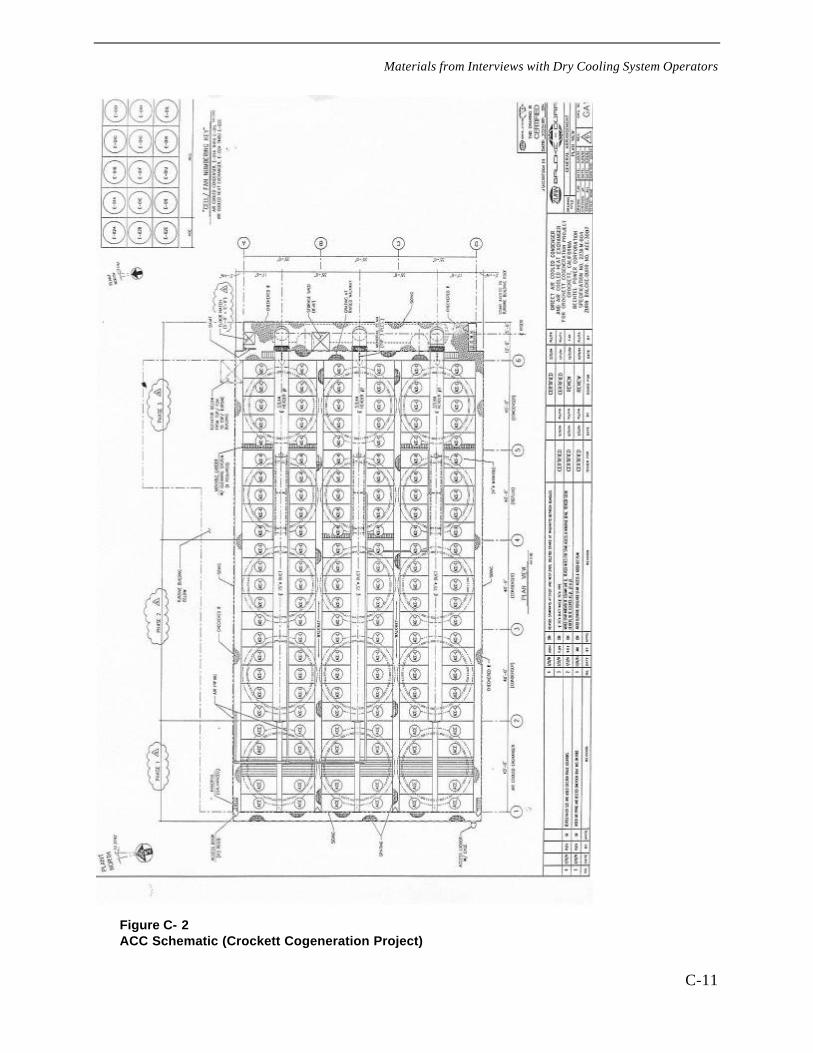
Materials from Interviews with Dry Cooling System Operators
C-11
Figure C- 2ACC Schematic (Crockett Cogeneration Project)
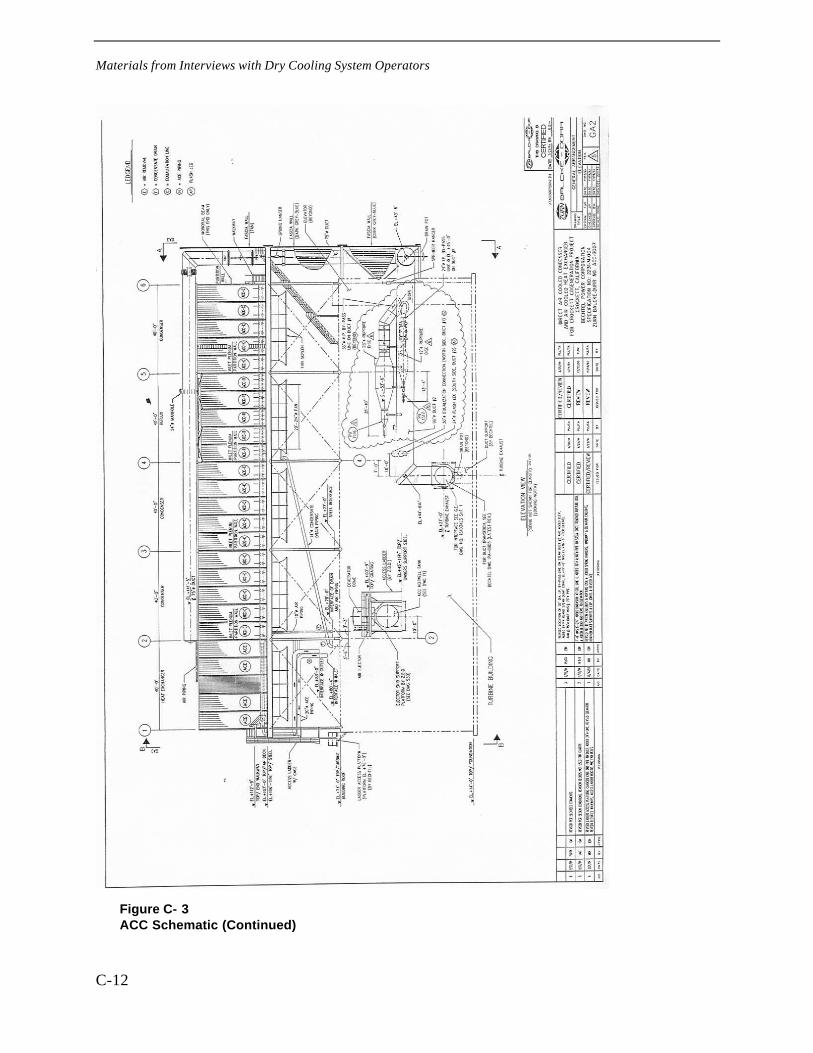
Materials from Interviews with Dry Cooling System Operators
C-12
Figure C- 3ACC Schematic (Continued)
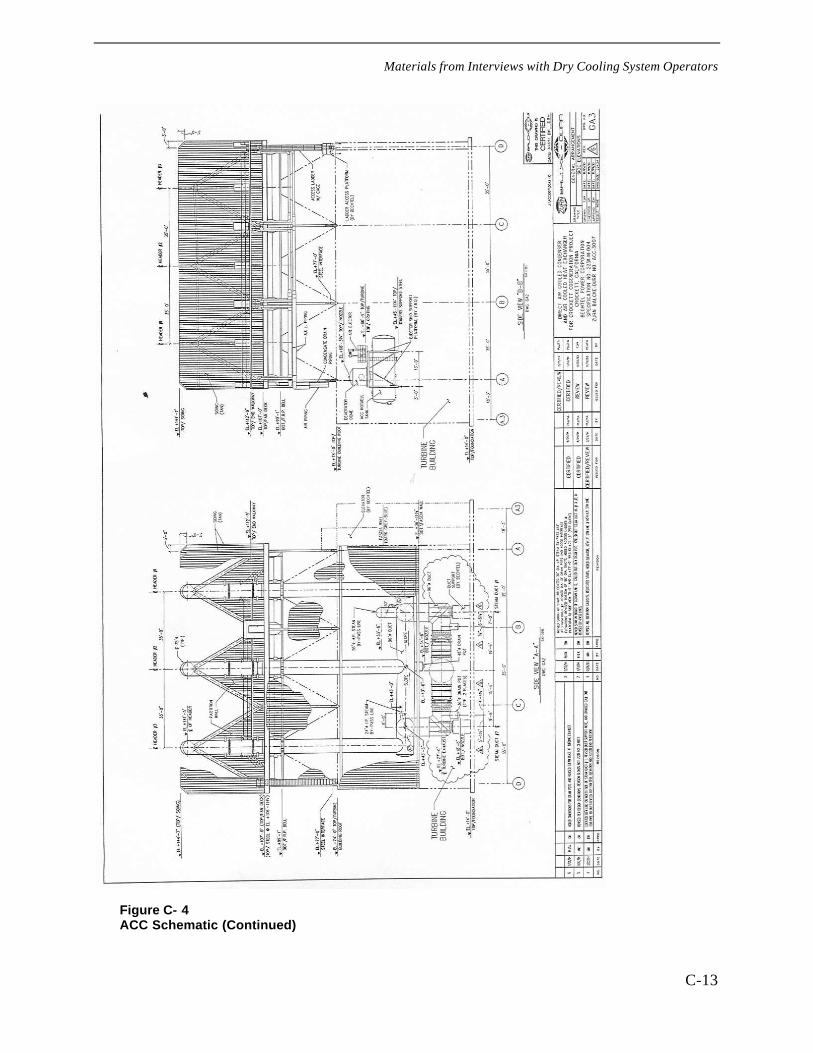
Materials from Interviews with Dry Cooling System Operators
C-13
Figure C- 4ACC Schematic (Continued)
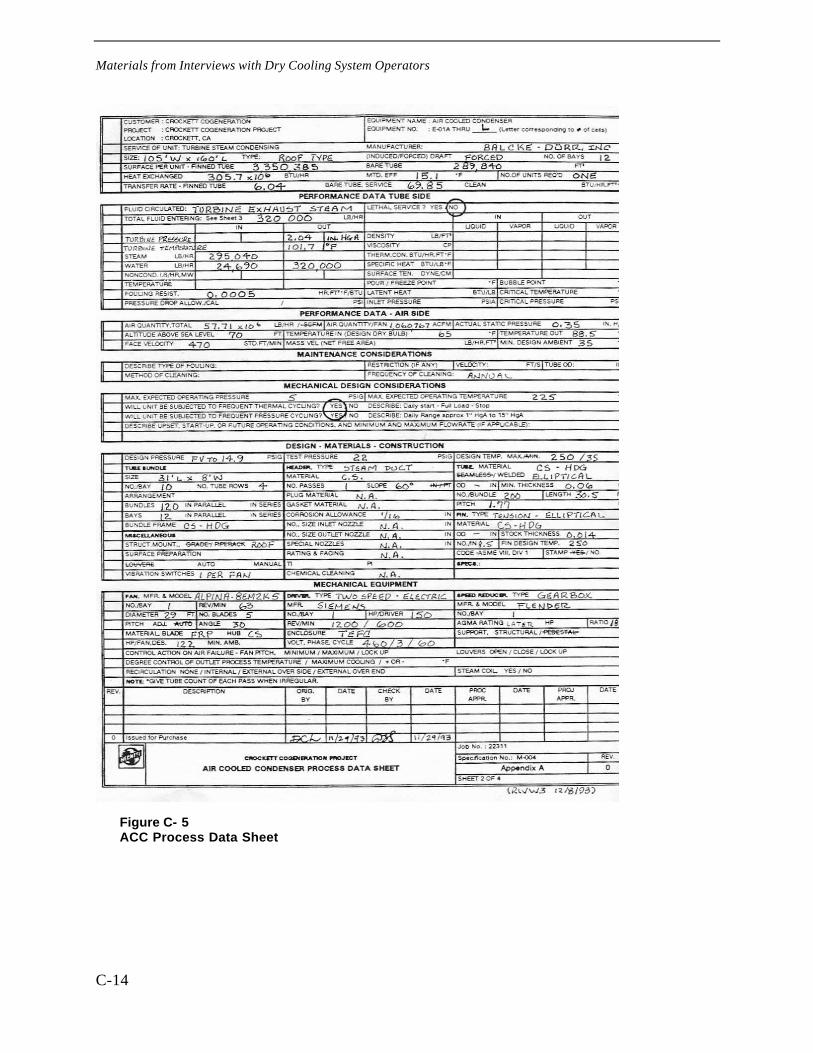
Materials from Interviews with Dry Cooling System Operators
C-14
Figure C- 5ACC Process Data Sheet
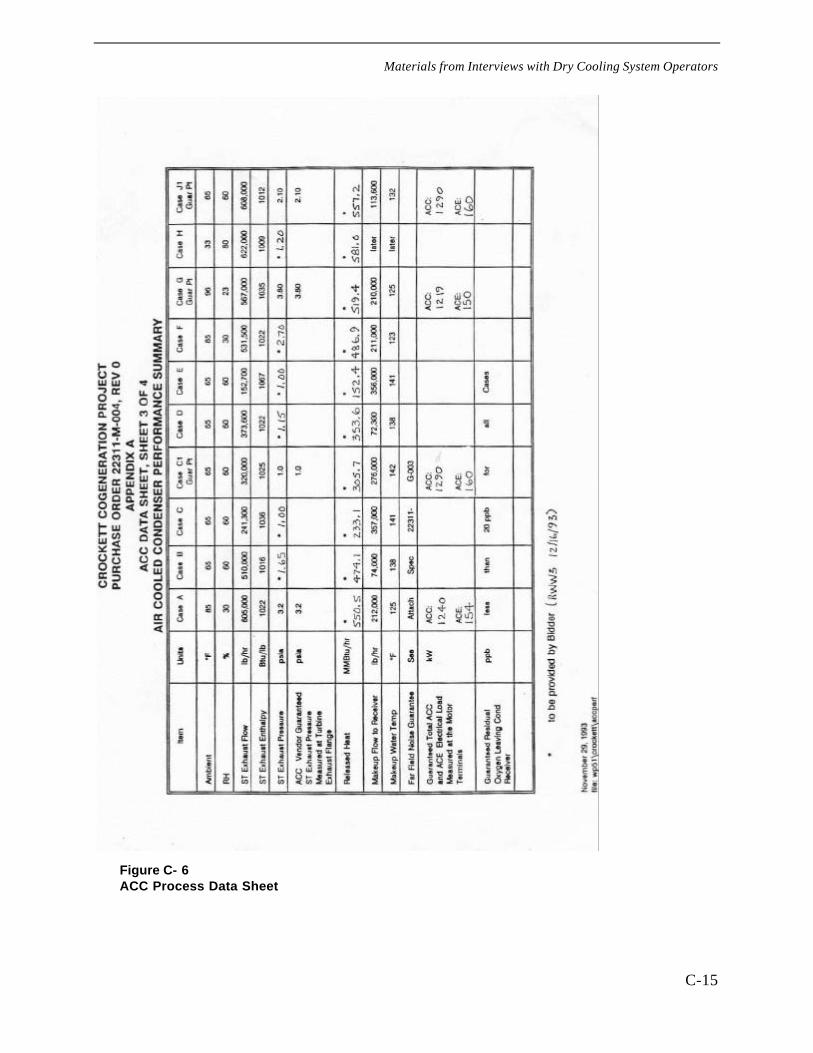
Materials from Interviews with Dry Cooling System Operators
C-15
Figure C- 6ACC Process Data Sheet
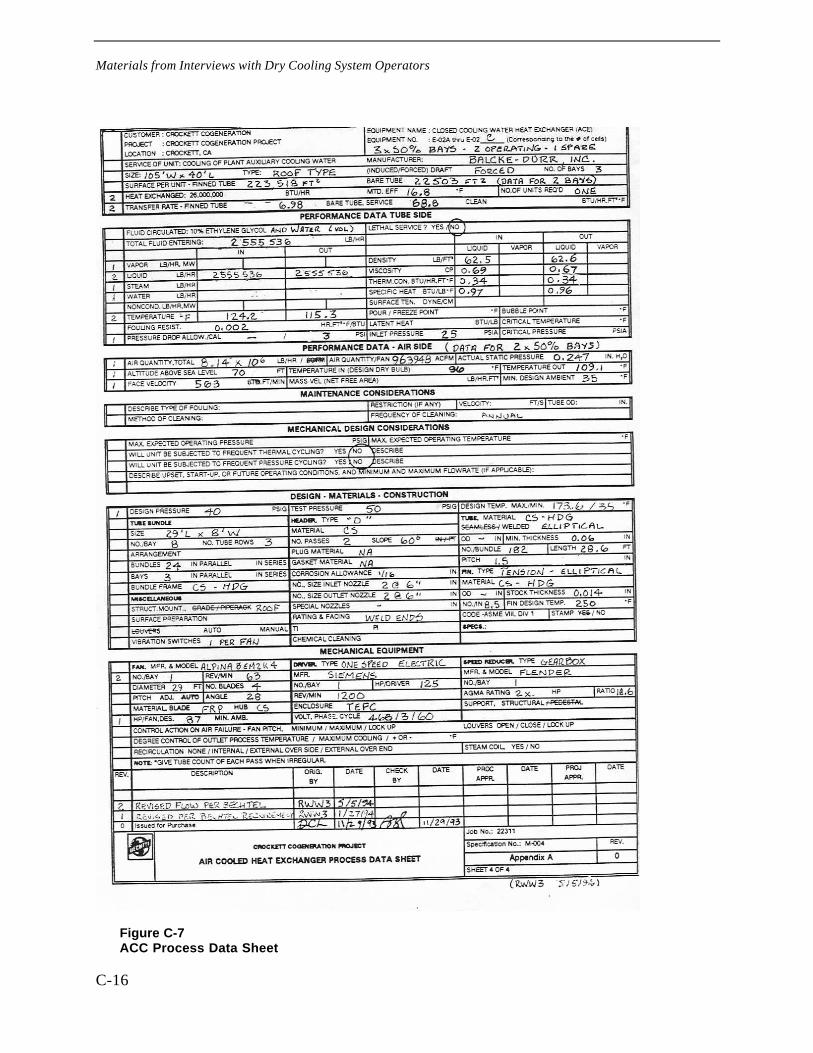
Materials from Interviews with Dry Cooling System Operators
C-16
Figure C-7ACC Process Data Sheet
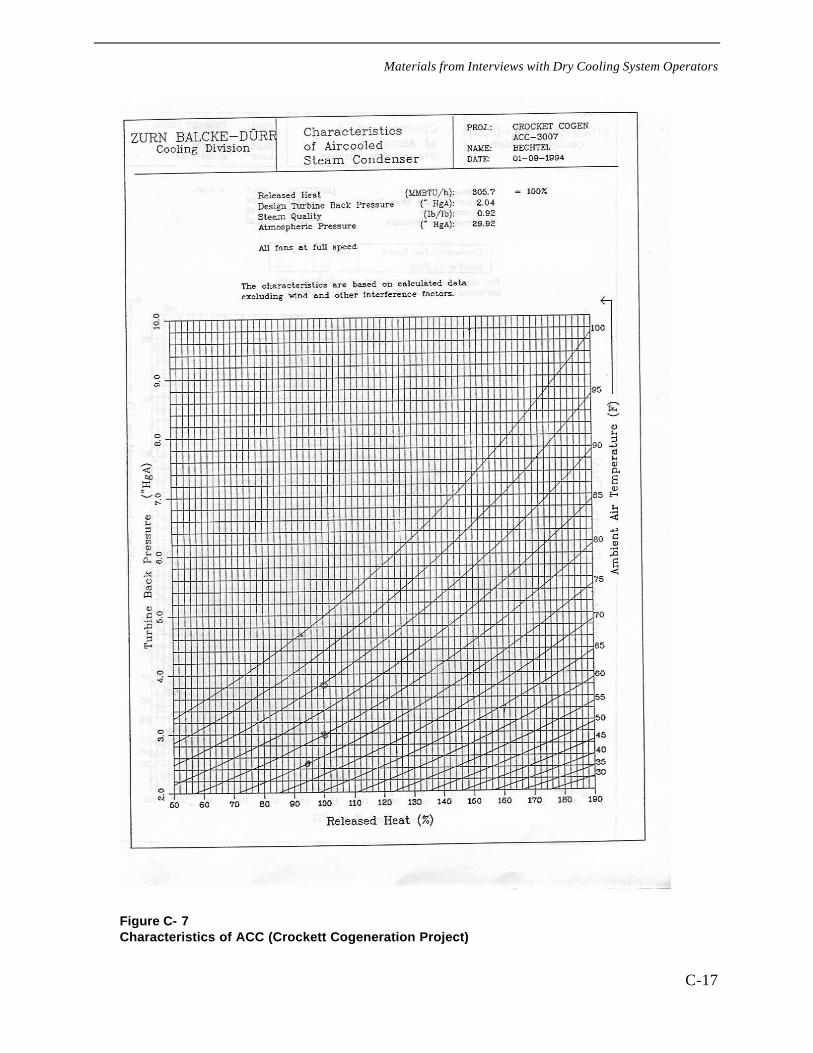
Materials from Interviews with Dry Cooling System Operators
C-17
Figure C- 7Characteristics of ACC (Crockett Cogeneration Project)
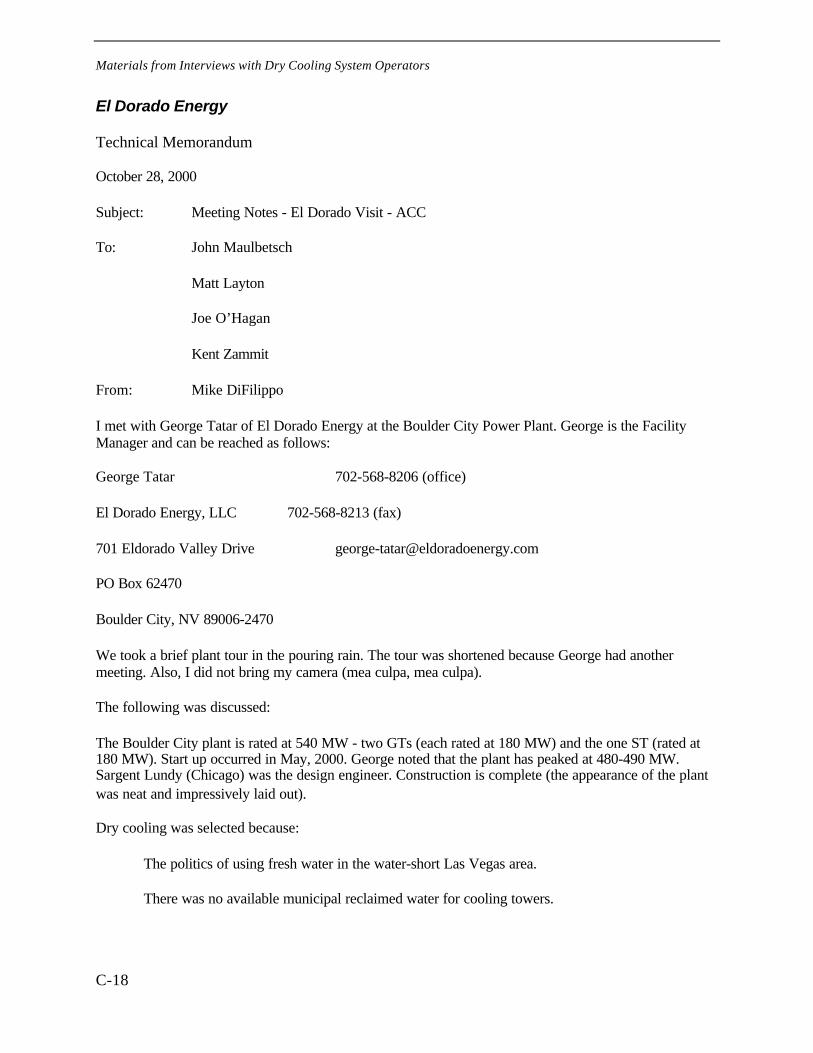
Materials from Interviews with Dry Cooling System Operators
C-18
El Dorado Energy
Technical Memorandum
October 28, 2000
Subject: Meeting Notes - El Dorado Visit - ACC
To: John Maulbetsch
Matt Layton
Joe O’Hagan
Kent Zammit
From: Mike DiFilippo
I met with George Tatar of El Dorado Energy at the Boulder City Power Plant. George is the FacilityManager and can be reached as follows:
George Tatar 702-568-8206 (office)
El Dorado Energy, LLC 702-568-8213 (fax)
701 Eldorado Valley Drive [email protected]
PO Box 62470
Boulder City, NV 89006-2470
We took a brief plant tour in the pouring rain. The tour was shortened because George had anothermeeting. Also, I did not bring my camera (mea culpa, mea culpa).
The following was discussed:
The Boulder City plant is rated at 540 MW - two GTs (each rated at 180 MW) and the one ST (rated at180 MW). Start up occurred in May, 2000. George noted that the plant has peaked at 480-490 MW.Sargent Lundy (Chicago) was the design engineer. Construction is complete (the appearance of the plantwas neat and impressively laid out).
Dry cooling was selected because:
The politics of using fresh water in the water-short Las Vegas area.
There was no available municipal reclaimed water for cooling towers.
Materials from Interviews with Dry Cooling System Operators
C-19
The property boundaries of the plant will not accommodate evaporation ponds for cooling towerblowdown. [Note the evaporation rate is equivalent to the Blythe area.]
El Dorado looked at cooling towers with VCE (brine concentrators) versus ACC, and based ontheir analysis, dry cooling was more economic. Also, the ACC support structure was designed for Zone 2seismic making it less costly.
The Westinghouse steam turbine was a first of its kind:
It can operate at back pressures of 2 to 8.5 inches.
Initially, the turbine had problems with its thrust bearing (I hate when that happens), but theproblem has been repaired. The problem was not related to the ACC.
There are now seven of these turbines on order, in manufacture or installed.
The following information was gathered on the ACC:
GEA supplied the ACC.
The ACC is only used for steam condensation. There is a separate closed-loop fin-fan cooler(supplied by Balke Durr) used only for auxiliary cooling.
The ACC has 5 banks with six fan bays.
The fans are huge - 34 feet diameter (maybe 36 feet - George was not sure). Each multiple-speedfan requires 200 HP for a total of 6,000 HP (4.5 MW). When I visited the plant it was 60-65 F and all fanswere in service and spinning slowly.
The plant has been on line for 6 months and there are no signs of corrosion. The fins are probablycarbon steel (George was not sure). Like almost all power plants, El Dorado is using a specialty chemicalprovider to monitor and control steam chemistry.
El Dorado did not buy the cleaning apparatus (we saw at Crockett). They have not had problemswith sand/dust in the fin crevices (as yet) even though they experience notable gusting in their area.
There is a distinct loss of cooling during periods with gusting winds. Evidently, during theseperiods, some fans are starved of air flow (that’s GEA analysis of the situation).
He had no idea of the cost of the ACC.
George is actually thinking of ways to pre-cool air to the ACC to enhance overall power plantperformance during the hottest days of the years. When ambient air temperature exceed 110 F, plantperformance drops dramatically. We discussed the following:
One idea George is thinking of is to install evaporative coolers around the open areas of the ACC.The coolers would cool some of the air drawn into the fans.
Materials from Interviews with Dry Cooling System Operators
C-20
He has looked at Mee Fog and another fogging system (I didn’t get the name), but thought theapproach was too expensive. I’m not sure how he evaluated it.
George, really wants to look at pre-cooling alternatives. As I was leaving, he said would be interested in acollaborative effort to evaluate pre-cooling. Let’s plan discuss this early next week. I think he would tryto sell the idea of some sort of shared expense to his management. Also, this ties into one of the TC’swe’ve been discussing.
Description: El Dorado Energy
(Boulder City, NV) - El Dorado Energy, a 480-megawatt power plant jointly owned by ReliantEnergy and Sempra Energy, has begun commercial operation, selling electricity into thewholesale power markets of Nevada, California and the southwestern United States (photos).
The $280 million natural gas-fired power generating plant, located near Boulder City, Nev.,about 40 miles southeast of Las Vegas, is designed to provide reliable, safe and cost-effectivepower to support the growing economies of the region.
“We're pleased to begin commercial operations,” said George Tatar, El Dorado facility manager.“Testing and initial start-up operations were conducted for the last several weeks to scrutinizeand fine-tune all operational and environmental systems for safety, reliability andcommerciality.”
The new plant, under construction since April, 1998, is capable of generating enough energy toserve nearly a half-million households.
“One of the nation’s first large-scale merchant power plants, El Dorado Energy is perfectlypositioned to sell competitively priced energy into three of the nation’s fastest growing markets,southern Nevada, Arizona and Southern California,” said Darcel Hulse, president of SempraEnergy Resources, the power generation unit of Sempra Energy. “In addition, this generationwill help support Sempra Energy’s retail-focused growth strategy.”
“This is an important step for Reliant Energy in our strategy to compete in the major powermarkets in the western United States and across the country by building an asset-backed, energytrading and marketing organization,” said Joe Bob Perkins, president and chief operating officerof Reliant Energy's Wholesale Group.
The state-of-the-art plant complex employs advanced, combined-cycle gas turbine andphotovoltaic technology, making it one of the most efficient and environmentally friendly powergenerating facilities in the United States. The plant features a water-saving, air-cooled condenserin lieu of a traditional, “wet-cooled” water system. Also, the facility is equipped with a 100-kilowatt solar field, comprised of 256 panels that track the sun’s path through the Nevada sky.With its photovoltaic technology, El Dorado Energy is well-positioned to become a prototype forother such facilities.

Materials from Interviews with Dry Cooling System Operators
C-21
Boulder City benefits from profit-sharing incentives, a 20-year land lease that generates$800,000 in revenue per year and a power-purchase agreement. According to Boulder CityMayor Bob Ferraro, the revenue the city receives will help ensure the preservation of the uniquequality of life that the historic town has maintained since Hoover Dam was built.
“El Dorado Energy’s partners – Sempra Energy and Reliant Energy – have lived up to theirpromises to be good corporate citizens," Ferraro said. "The land-lease agreement has producedsubstantial revenue for Boulder City, which has been particularly beneficial given our previousbudgetary situation. The companies have fulfilled their commitment to this community byfunding an aggressive tree-planting effort, providing funds to pave Boulder City alleys andgenerously supporting a multitude of Boulder City community organizations and events.
"Reliant Energy (NYSE: REI), based in Houston, Texas, is an international energy services andenergy delivery company with $15.3 billion in annual revenue and assets totaling more than $26billion. The company has a wholesale energy trading and marketing business that ranks amongthe top five in the U.S. in combined electricity and natural gas volumes and has a presence inmost of the major power regions of the U.S. It also has power generation and wholesale tradingand marketing operations in western Europe.
Sempra Energy Resources acquires and develops power plants for the competitive market, aswell as natural gas storage, production and transportation assets. Sempra Energy Resources is asubsidiary of Sempra Energy (NYSE: SRE), a San Diego-based Fortune 500 energy servicesholding company, with 12,000 employees, revenues of nearly $5.5 billion and more than 9million customers in the United States, Europe, Canada, Mexico and South America. (SempraEnergy Resources and El Dorado Energy are not the same companies as the utilities,SDG&E/SoCalGas, and are not regulated by the California Public Utilities Commission.)
Materials from Interviews with Dry Cooling System Operators
C-22
Figure C- 8El Dorado Energy Center
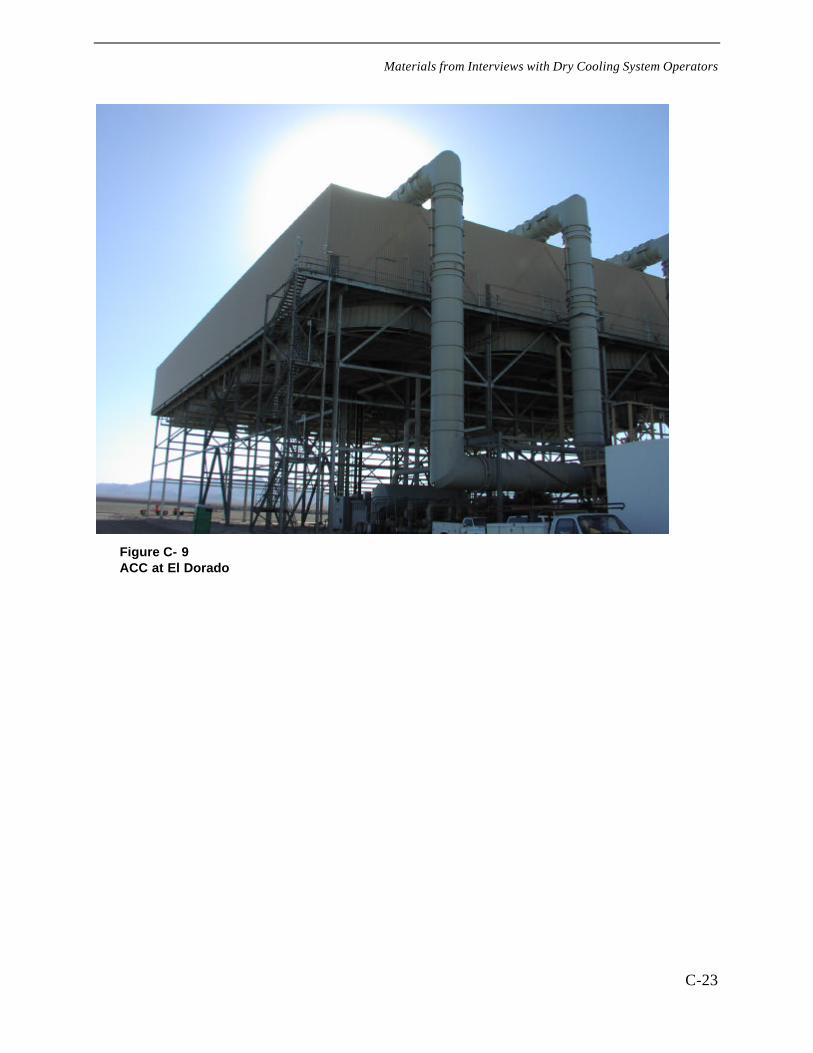
Materials from Interviews with Dry Cooling System Operators
C-23
Figure C- 9ACC at El Dorado

Materials from Interviews with Dry Cooling System Operators
C-24
Calpine
September 18, 2000.
(Monday, 2:30 PM)
Kim StuckiCalpine620 Coolidge DriveFolsom, CA916-608-3839
Topics for discussion
General:
• What are the factors which influence the choice of cooling system for your power projects?
• Assume: Gas-fired, combined cycle (~ 500MWe) power plant at an inland Californialocation.
Capital cost comparisons:---Cost of system from turbine flange to ultimate discharge----
• How is the comparison done?• Is there a systematic optimization to select the design points for comparison?• If so, how are the “penalty” costs evaluated
• capacity shortfall on hottest periods• efficiency penalties during rest of year• lost revenues or contractual penalties for capacity replacement (or failure to deliver)
• If no optimization, how are comparative design points selected?• Average temperature over year?• Design back-pressure at 1 or 2 ½% exceeded dry bulb (wet-bulb)?
Approaches to mitigating hot day penalties:
• What is the effect of ambient dry bulb on plant output and efficiency?• On gas turbines• On steam side
• Use of high back-pressure turbines• Any experience• Cost/reliability• Efficiency penalties during rest of year
• Use of inlet sprays• On gas turbines• On air cooled condensers
• Other wet/dry systems• Indirect dry cooling• Heller system
Other considerations:
• Licensing issues• Reduced licensing time (what is it worth to get on-line “six months sooner”.
Materials from Interviews with Dry Cooling System Operators
C-25
• Drift/plume• Noise• Site placement/footprint
Use of recycled/reclaimed or lower quality water
• Water quality criteria• Treatment costs• Cost of water• Other licensing issues
• Drift/plume issues• Worker health/safety issues• Reliability of supply
Operating experience:
• With dry cooling• Cycle chemistry problems• Tower (finned tube heat exchanger maintenance)• Fouling/corrosion• Cleaning frequency• Use in regions other than hot/dry (Northeast---Massachusetts, Long Island, etc)
• With recycled water (Delta and Pittsburg/Los Medanos)• Supply problems• Maintenance issues (any plants currently operating?)
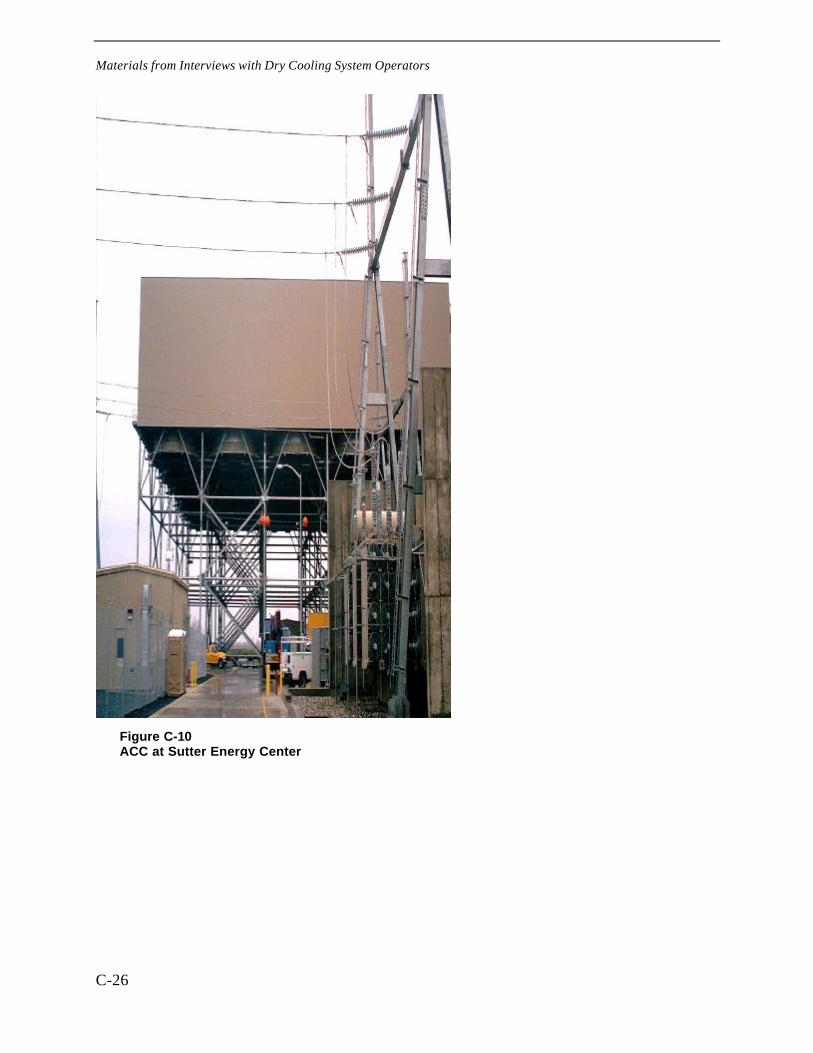
Materials from Interviews with Dry Cooling System Operators
C-26
Figure C-10ACC at Sutter Energy Center

Materials from Interviews with Dry Cooling System Operators
C-27
Chinese Station: Contact Information
Ron BrownMaintenance ManagerPacific-Ultrapower Chinese Station8755 Enterprise DriveJamestown, CA 95327
209-984-4660
209-984-3398 (FAX)
MassPower: Contact Information
Sal PaolucciPlant Operations ManagerMASSPOWERSpringfield, MA
413-731-6611, ext. 3021
D-1
Appendix D CASE STUDY SITE CHARACTERISTICS
Site characteristics are presented for Desert, Mountain, Valley, and Bay Area sites. State bulband dry bulb data are presented in Table D-1.
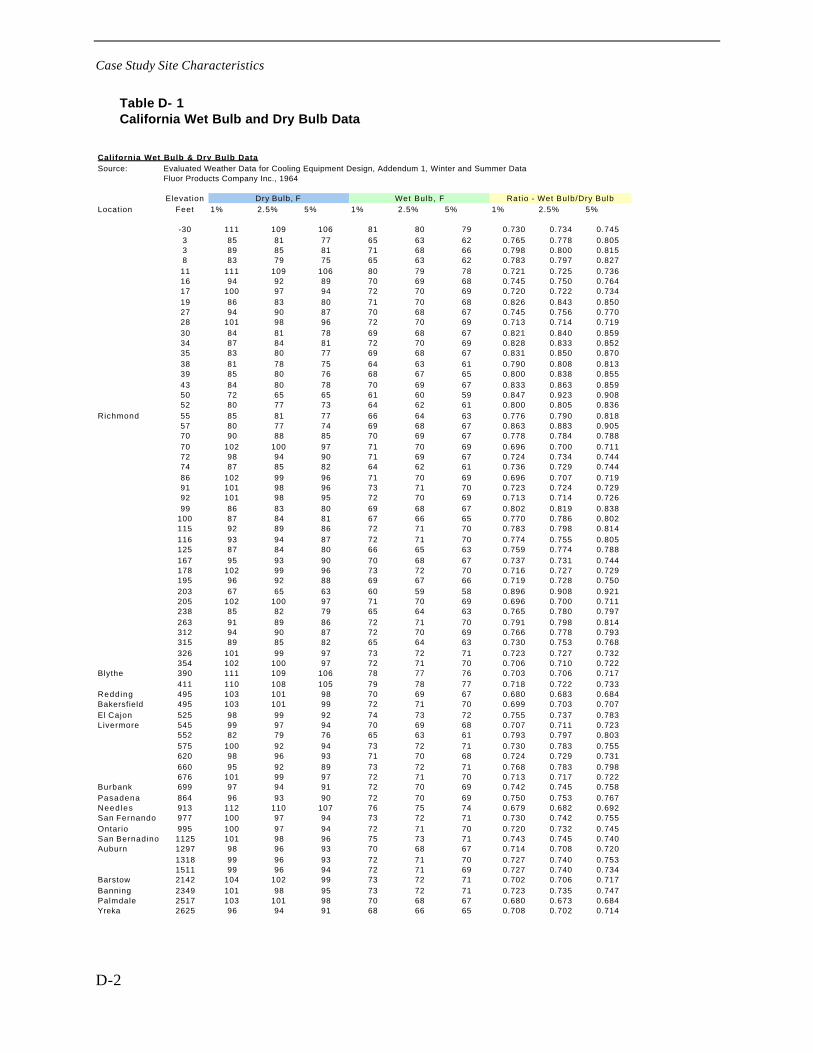
Case Study Site Characteristics
D-2
Table D- 1California Wet Bulb and Dry Bulb Data
California Wet Bulb & Dry Bulb DataSource: Evaluated Weather Data for Cooling Equipment Design, Addendum 1, Winter and Summer Data
Fluor Products Company Inc., 1964
Elevation Dry Bulb, F Wet Bulb, F Ratio - Wet Bulb/Dry BulbLocation Feet 1% 2.5% 5% 1% 2.5% 5% 1% 2.5% 5%
-30 111 109 106 81 80 79 0.730 0.734 0.7453 85 81 77 65 63 62 0.765 0.778 0.8053 89 85 81 71 68 66 0.798 0.800 0.8158 83 79 75 65 63 62 0.783 0.797 0.82711 111 109 106 80 79 78 0.721 0.725 0.73616 94 92 89 70 69 68 0.745 0.750 0.76417 100 97 94 72 70 69 0.720 0.722 0.73419 86 83 80 71 70 68 0.826 0.843 0.85027 94 90 87 70 68 67 0.745 0.756 0.77028 101 98 96 72 70 69 0.713 0.714 0.71930 84 81 78 69 68 67 0.821 0.840 0.85934 87 84 81 72 70 69 0.828 0.833 0.85235 83 80 77 69 68 67 0.831 0.850 0.87038 81 78 75 64 63 61 0.790 0.808 0.81339 85 80 76 68 67 65 0.800 0.838 0.85543 84 80 78 70 69 67 0.833 0.863 0.85950 72 65 65 61 60 59 0.847 0.923 0.90852 80 77 73 64 62 61 0.800 0.805 0.836
Richmond 55 85 81 77 66 64 63 0.776 0.790 0.81857 80 77 74 69 68 67 0.863 0.883 0.90570 90 88 85 70 69 67 0.778 0.784 0.78870 102 100 97 71 70 69 0.696 0.700 0.71172 98 94 90 71 69 67 0.724 0.734 0.74474 87 85 82 64 62 61 0.736 0.729 0.74486 102 99 96 71 70 69 0.696 0.707 0.71991 101 98 96 73 71 70 0.723 0.724 0.72992 101 98 95 72 70 69 0.713 0.714 0.72699 86 83 80 69 68 67 0.802 0.819 0.838
100 87 84 81 67 66 65 0.770 0.786 0.802115 92 89 86 72 71 70 0.783 0.798 0.814116 93 94 87 72 71 70 0.774 0.755 0.805125 87 84 80 66 65 63 0.759 0.774 0.788167 95 93 90 70 68 67 0.737 0.731 0.744178 102 99 96 73 72 70 0.716 0.727 0.729195 96 92 88 69 67 66 0.719 0.728 0.750203 67 65 63 60 59 58 0.896 0.908 0.921205 102 100 97 71 70 69 0.696 0.700 0.711238 85 82 79 65 64 63 0.765 0.780 0.797263 91 89 86 72 71 70 0.791 0.798 0.814312 94 90 87 72 70 69 0.766 0.778 0.793315 89 85 82 65 64 63 0.730 0.753 0.768326 101 99 97 73 72 71 0.723 0.727 0.732354 102 100 97 72 71 70 0.706 0.710 0.722
Blythe 390 111 109 106 78 77 76 0.703 0.706 0.717411 110 108 105 79 78 77 0.718 0.722 0.733
Redding 495 103 101 98 70 69 67 0.680 0.683 0.684Bakersfield 495 103 101 99 72 71 70 0.699 0.703 0.707El Cajon 525 98 99 92 74 73 72 0.755 0.737 0.783Livermore 545 99 97 94 70 69 68 0.707 0.711 0.723
552 82 79 76 65 63 61 0.793 0.797 0.803575 100 92 94 73 72 71 0.730 0.783 0.755620 98 96 93 71 70 68 0.724 0.729 0.731660 95 92 89 73 72 71 0.768 0.783 0.798676 101 99 97 72 71 70 0.713 0.717 0.722
Burbank 699 97 94 91 72 70 69 0.742 0.745 0.758Pasadena 864 96 93 90 72 70 69 0.750 0.753 0.767Need les 913 112 110 107 76 75 74 0.679 0.682 0.692San Fernando 977 100 97 94 73 72 71 0.730 0.742 0.755Ontario 995 100 97 94 72 71 70 0.720 0.732 0.745San Bernadino 1125 101 98 96 75 73 71 0.743 0.745 0.740Auburn 1297 98 96 93 70 68 67 0.714 0.708 0.720
1318 99 96 93 72 71 70 0.727 0.740 0.7531511 99 96 94 72 71 69 0.727 0.740 0.734
Barstow 2142 104 102 99 73 72 71 0.702 0.706 0.717Banning 2349 101 98 95 73 72 71 0.723 0.735 0.747Palmdale 2517 103 101 98 70 68 67 0.680 0.673 0.684Yreka 2625 96 94 91 68 66 65 0.708 0.702 0.714
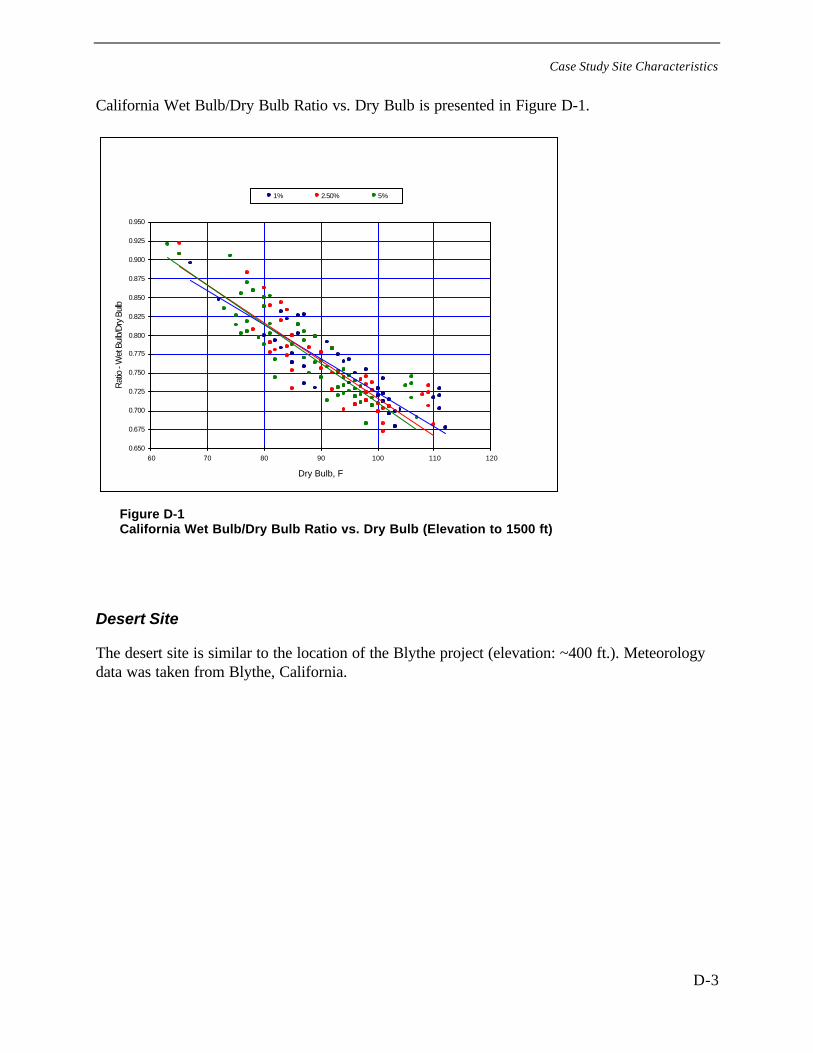
Case Study Site Characteristics
D-3
California Wet Bulb/Dry Bulb Ratio vs. Dry Bulb is presented in Figure D-1.
0.650
0.675
0.700
0.725
0.750
0.775
0.800
0.825
0.850
0.875
0.900
0.925
0.950
60 70 80 90 100 110 120
Dry Bulb, F
Rat
io -
Wet
Bul
b/D
ry B
ulb
1% 2.50% 5%
Figure D-1California Wet Bulb/Dry Bulb Ratio vs. Dry Bulb (Elevation to 1500 ft)
Desert Site
The desert site is similar to the location of the Blythe project (elevation: ~400 ft.). Meteorologydata was taken from Blythe, California.
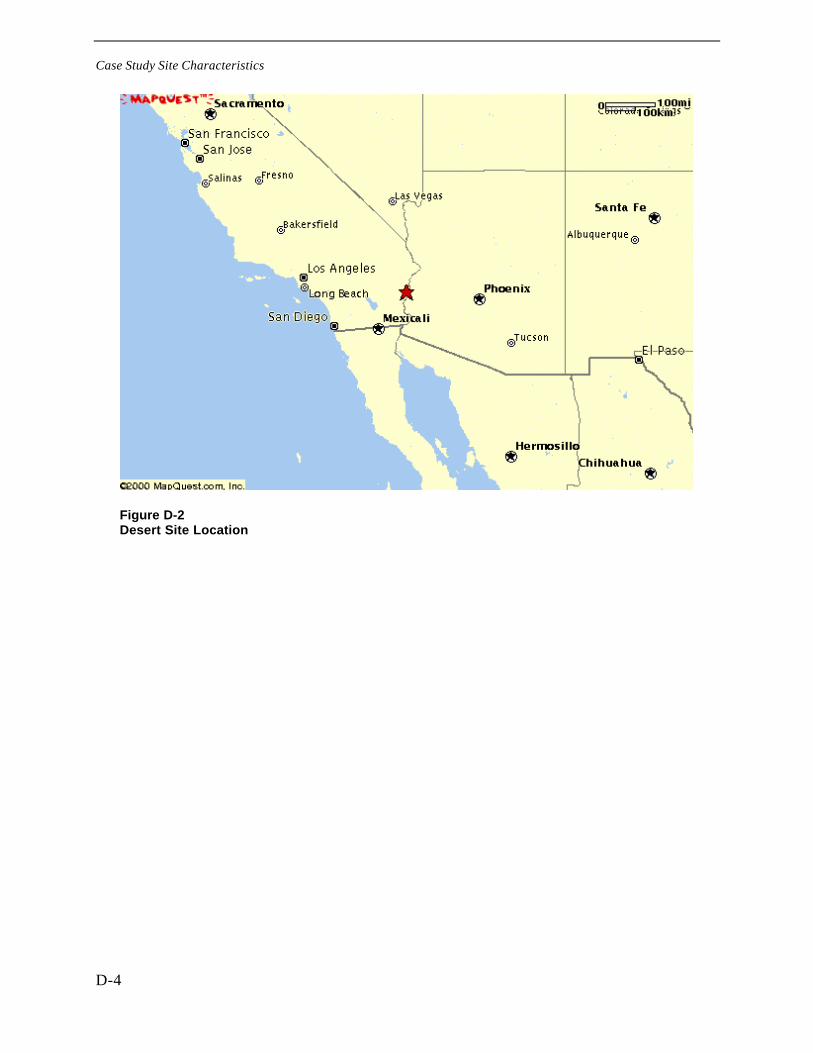
Case Study Site Characteristics
D-4
Figure D-2Desert Site Location
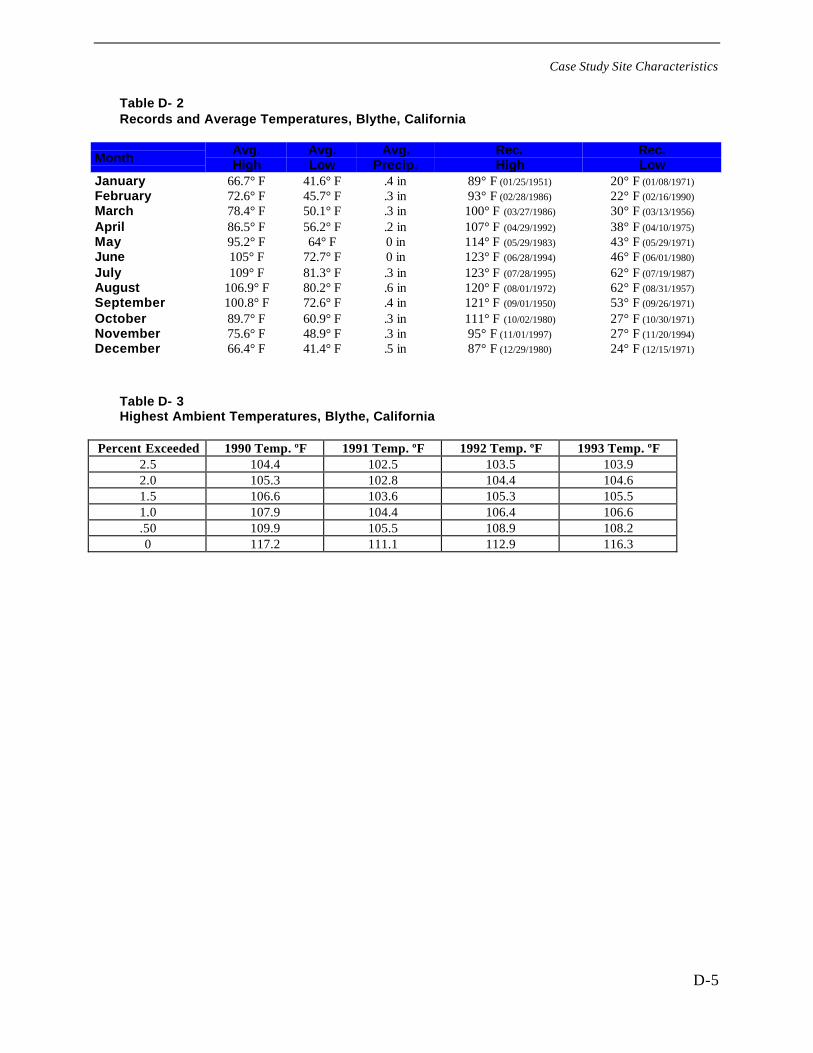
Case Study Site Characteristics
D-5
Table D- 2Records and Average Temperatures, Blythe, California
MonthAvg.High
Avg.Low
Avg.Precip.
Rec.High
Rec.Low
January 66.7° F 41.6° F .4 in 89° F (01/25/1951) 20° F (01/08/1971)
February 72.6° F 45.7° F .3 in 93° F (02/28/1986) 22° F (02/16/1990)
March 78.4° F 50.1° F .3 in 100° F (03/27/1986) 30° F (03/13/1956)
April 86.5° F 56.2° F .2 in 107° F (04/29/1992) 38° F (04/10/1975)
May 95.2° F 64° F 0 in 114° F (05/29/1983) 43° F (05/29/1971)
June 105° F 72.7° F 0 in 123° F (06/28/1994) 46° F (06/01/1980)
July 109° F 81.3° F .3 in 123° F (07/28/1995) 62° F (07/19/1987)
August 106.9° F 80.2° F .6 in 120° F (08/01/1972) 62° F (08/31/1957)
September 100.8° F 72.6° F .4 in 121° F (09/01/1950) 53° F (09/26/1971)
October 89.7° F 60.9° F .3 in 111° F (10/02/1980) 27° F (10/30/1971)
November 75.6° F 48.9° F .3 in 95° F (11/01/1997) 27° F (11/20/1994)
December 66.4° F 41.4° F .5 in 87° F (12/29/1980) 24° F (12/15/1971)
Table D- 3Highest Ambient Temperatures, Blythe, California
Percent Exceeded 1990 Temp. ºF 1991 Temp. ºF 1992 Temp. ºF 1993 Temp. ºF2.5 104.4 102.5 103.5 103.92.0 105.3 102.8 104.4 104.61.5 106.6 103.6 105.3 105.51.0 107.9 104.4 106.4 106.6.50 109.9 105.5 108.9 108.20 117.2 111.1 112.9 116.3
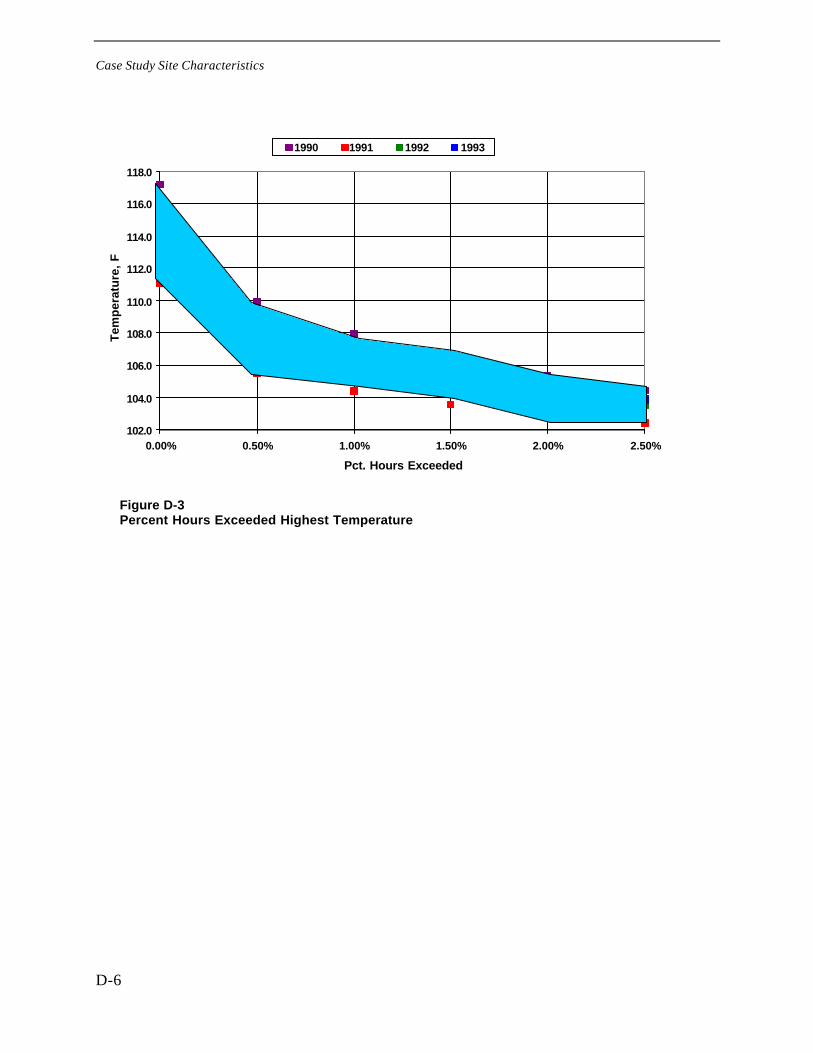
Case Study Site Characteristics
D-6
102.0
104.0
106.0
108.0
110.0
112.0
114.0
116.0
118.0
0.00% 0.50% 1.00% 1.50% 2.00% 2.50%
Pct. Hours Exceeded
Tem
per
atu
re,
F
1990 1991 1992 1993
Figure D-3Percent Hours Exceeded Highest Temperature
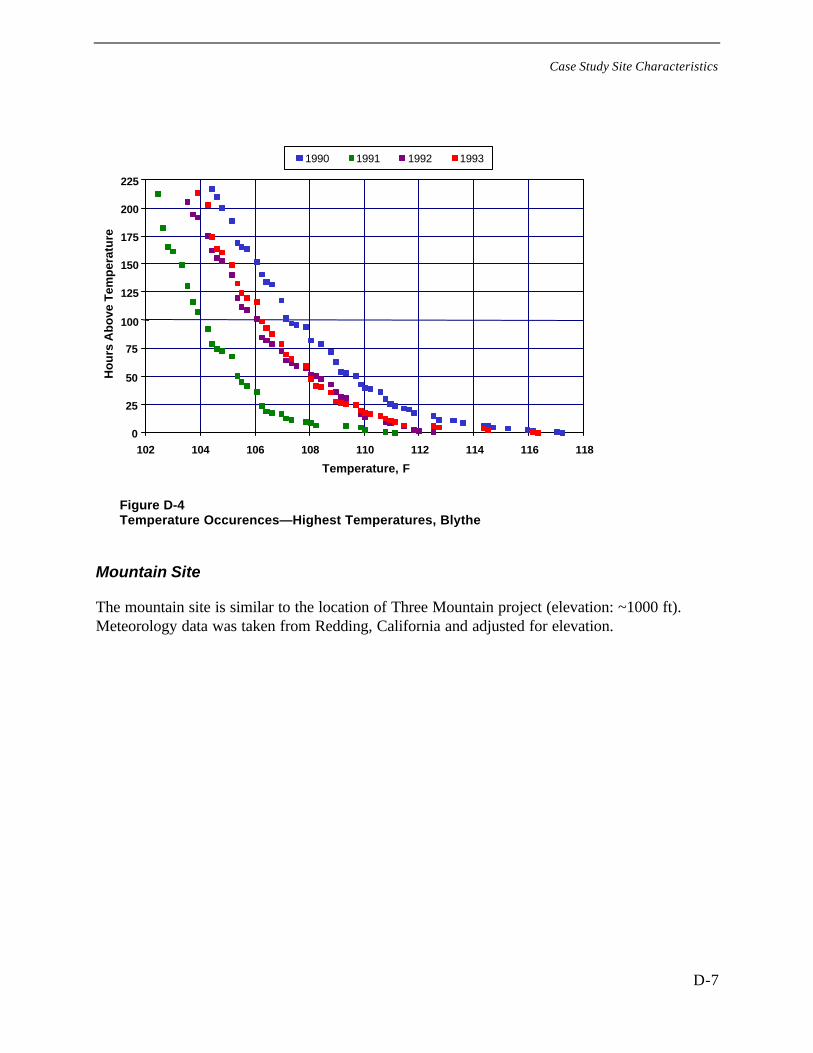
Case Study Site Characteristics
D-7
0
25
50
75
100
125
150
175
200
225
102 104 106 108 110 112 114 116 118
Temperature, F
Ho
urs
Ab
ove
Tem
per
atu
re
1990 1991 1992 1993
Figure D-4Temperature Occurences—Highest Temperatures, Blythe
Mountain Site
The mountain site is similar to the location of Three Mountain project (elevation: ~1000 ft).Meteorology data was taken from Redding, California and adjusted for elevation.
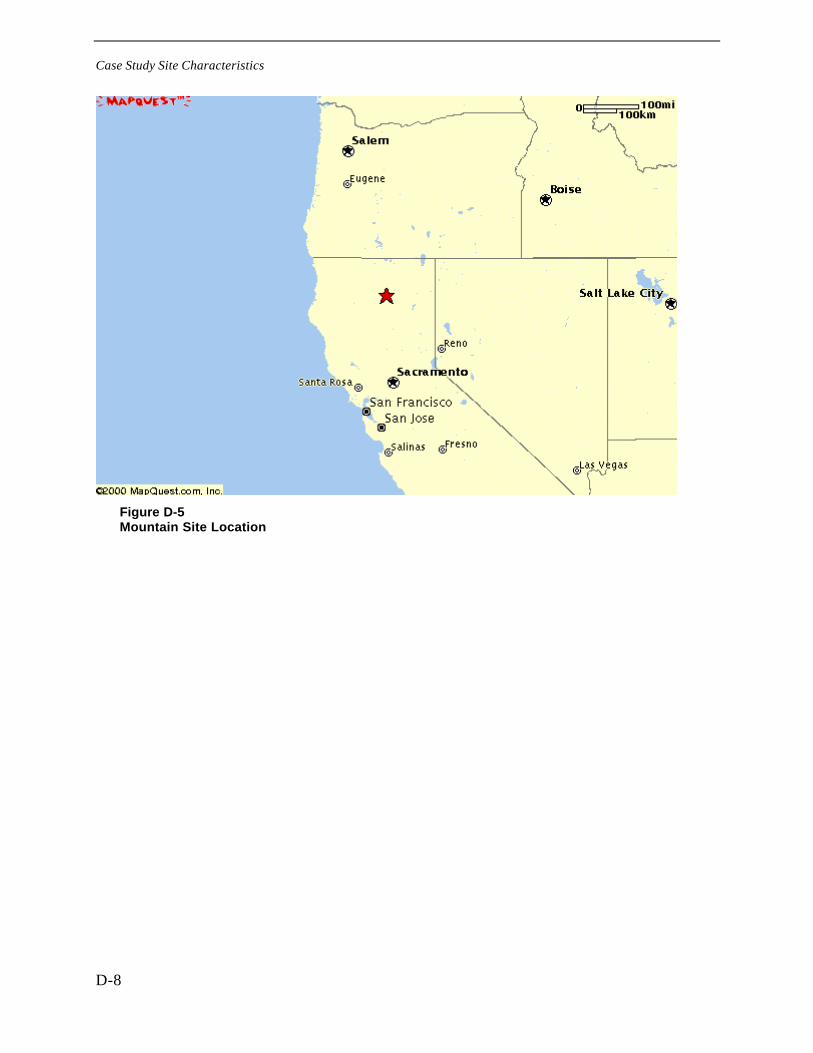
Case Study Site Characteristics
D-8
Figure D-5Mountain Site Location
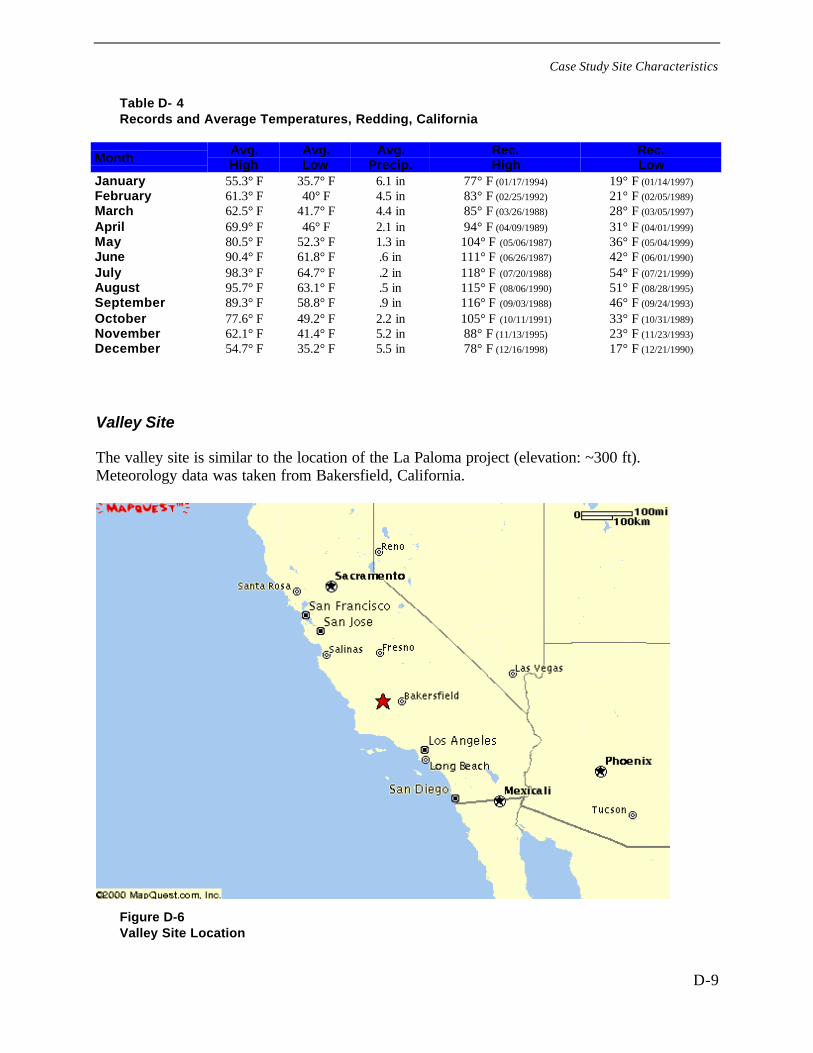
Case Study Site Characteristics
D-9
Table D- 4Records and Average Temperatures, Redding, California
MonthAvg.High
Avg.Low
Avg.Precip.
Rec.High
Rec.Low
January 55.3° F 35.7° F 6.1 in 77° F (01/17/1994) 19° F (01/14/1997)
February 61.3° F 40° F 4.5 in 83° F (02/25/1992) 21° F (02/05/1989)
March 62.5° F 41.7° F 4.4 in 85° F (03/26/1988) 28° F (03/05/1997)
April 69.9° F 46° F 2.1 in 94° F (04/09/1989) 31° F (04/01/1999)
May 80.5° F 52.3° F 1.3 in 104° F (05/06/1987) 36° F (05/04/1999)
June 90.4° F 61.8° F .6 in 111° F (06/26/1987) 42° F (06/01/1990)
July 98.3° F 64.7° F .2 in 118° F (07/20/1988) 54° F (07/21/1999)
August 95.7° F 63.1° F .5 in 115° F (08/06/1990) 51° F (08/28/1995)
September 89.3° F 58.8° F .9 in 116° F (09/03/1988) 46° F (09/24/1993)
October 77.6° F 49.2° F 2.2 in 105° F (10/11/1991) 33° F (10/31/1989)
November 62.1° F 41.4° F 5.2 in 88° F (11/13/1995) 23° F (11/23/1993)
December 54.7° F 35.2° F 5.5 in 78° F (12/16/1998) 17° F (12/21/1990)
Valley Site
The valley site is similar to the location of the La Paloma project (elevation: ~300 ft).Meteorology data was taken from Bakersfield, California.
Figure D-6Valley Site Location
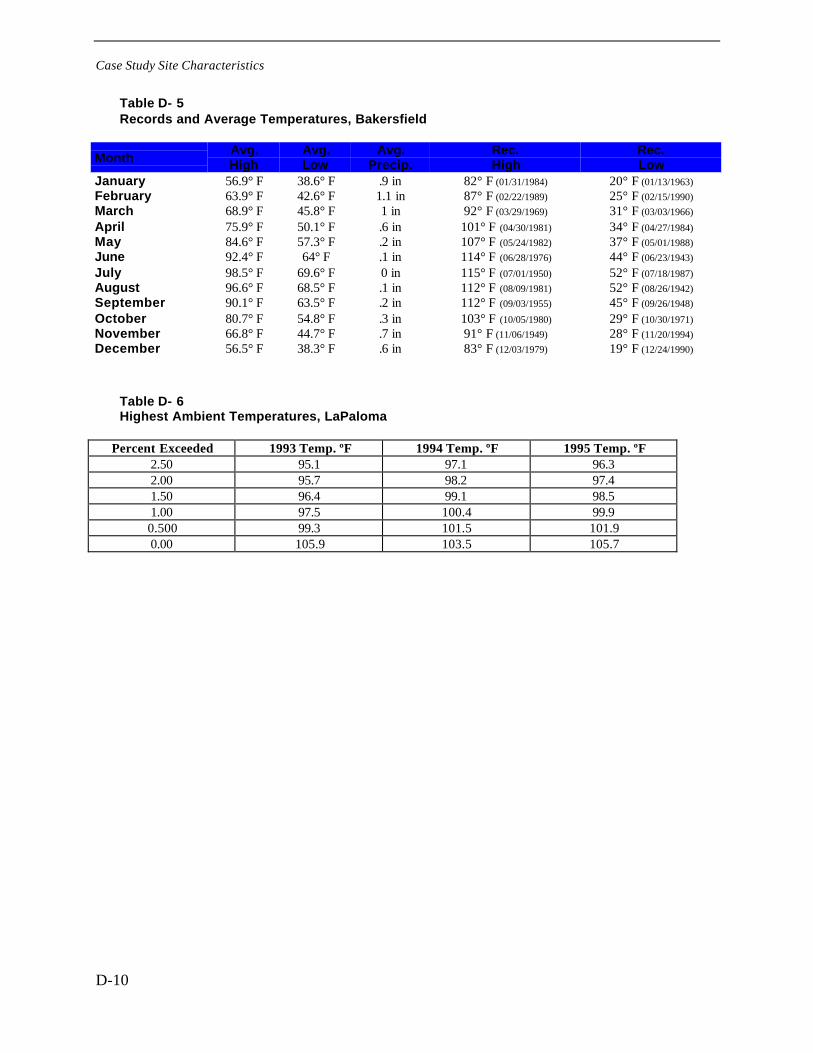
Case Study Site Characteristics
D-10
Table D- 5Records and Average Temperatures, Bakersfield
MonthAvg.High
Avg.Low
Avg.Precip.
Rec.High
Rec.Low
January 56.9° F 38.6° F .9 in 82° F (01/31/1984) 20° F (01/13/1963)
February 63.9° F 42.6° F 1.1 in 87° F (02/22/1989) 25° F (02/15/1990)
March 68.9° F 45.8° F 1 in 92° F (03/29/1969) 31° F (03/03/1966)
April 75.9° F 50.1° F .6 in 101° F (04/30/1981) 34° F (04/27/1984)
May 84.6° F 57.3° F .2 in 107° F (05/24/1982) 37° F (05/01/1988)
June 92.4° F 64° F .1 in 114° F (06/28/1976) 44° F (06/23/1943)
July 98.5° F 69.6° F 0 in 115° F (07/01/1950) 52° F (07/18/1987)
August 96.6° F 68.5° F .1 in 112° F (08/09/1981) 52° F (08/26/1942)
September 90.1° F 63.5° F .2 in 112° F (09/03/1955) 45° F (09/26/1948)
October 80.7° F 54.8° F .3 in 103° F (10/05/1980) 29° F (10/30/1971)
November 66.8° F 44.7° F .7 in 91° F (11/06/1949) 28° F (11/20/1994)
December 56.5° F 38.3° F .6 in 83° F (12/03/1979) 19° F (12/24/1990)
Table D- 6Highest Ambient Temperatures, LaPaloma
Percent Exceeded 1993 Temp. ºF 1994 Temp. ºF 1995 Temp. ºF2.50 95.1 97.1 96.32.00 95.7 98.2 97.41.50 96.4 99.1 98.51.00 97.5 100.4 99.90.500 99.3 101.5 101.90.00 105.9 103.5 105.7
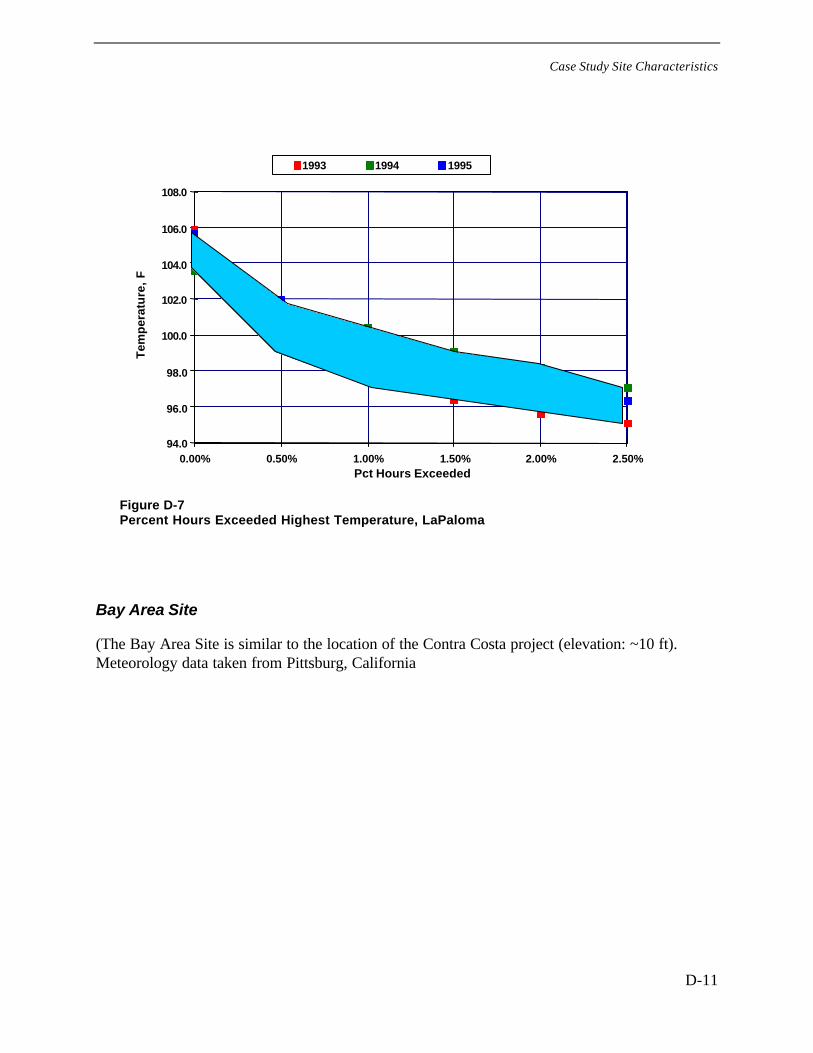
Case Study Site Characteristics
D-11
94.0
96.0
98.0
100.0
102.0
104.0
106.0
108.0
0.00% 0.50% 1.00% 1.50% 2.00% 2.50%Pct Hours Exceeded
Tem
per
atu
re,
F
1993 1994 1995
Figure D-7Percent Hours Exceeded Highest Temperature, LaPaloma
Bay Area Site
(The Bay Area Site is similar to the location of the Contra Costa project (elevation: ~10 ft).Meteorology data taken from Pittsburg, California
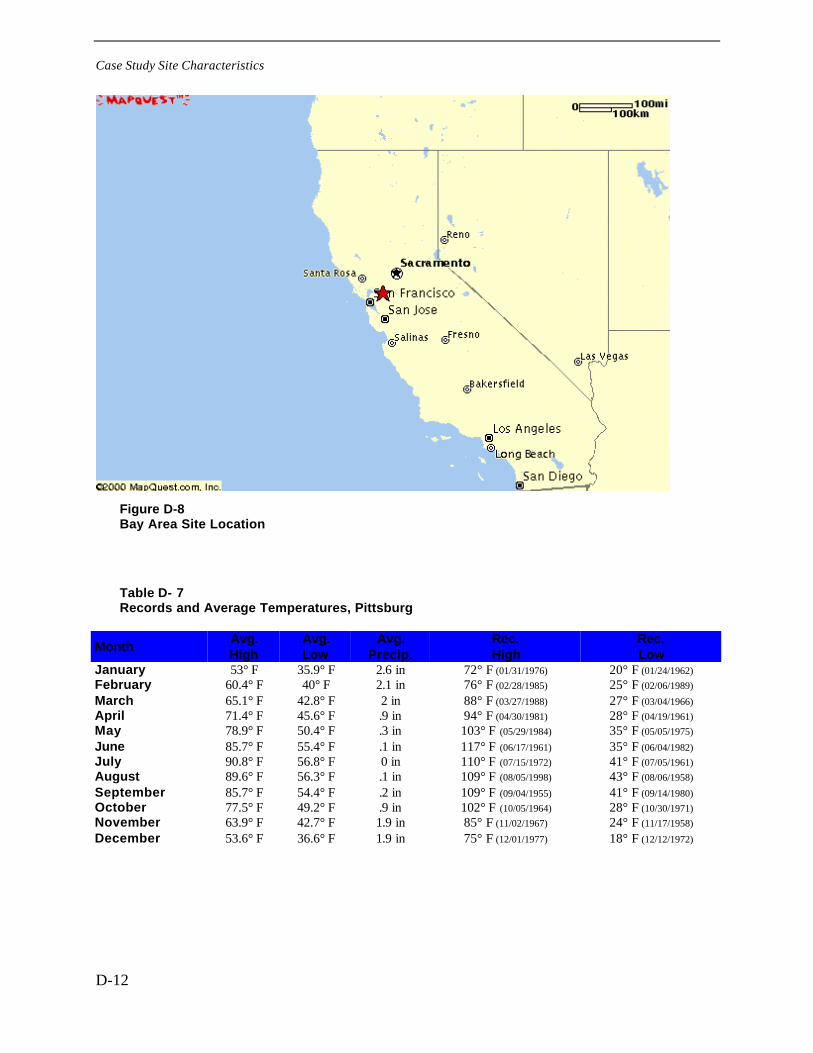
Case Study Site Characteristics
D-12
Figure D-8Bay Area Site Location
Table D- 7Records and Average Temperatures, Pittsburg
MonthAvg.High
Avg.Low
Avg.Precip.
Rec.High
Rec.Low
January 53° F 35.9° F 2.6 in 72° F (01/31/1976) 20° F (01/24/1962)
February 60.4° F 40° F 2.1 in 76° F (02/28/1985) 25° F (02/06/1989)
March 65.1° F 42.8° F 2 in 88° F (03/27/1988) 27° F (03/04/1966)
April 71.4° F 45.6° F .9 in 94° F (04/30/1981) 28° F (04/19/1961)
May 78.9° F 50.4° F .3 in 103° F (05/29/1984) 35° F (05/05/1975)
June 85.7° F 55.4° F .1 in 117° F (06/17/1961) 35° F (06/04/1982)
July 90.8° F 56.8° F 0 in 110° F (07/15/1972) 41° F (07/05/1961)
August 89.6° F 56.3° F .1 in 109° F (08/05/1998) 43° F (08/06/1958)
September 85.7° F 54.4° F .2 in 109° F (09/04/1955) 41° F (09/14/1980)
October 77.5° F 49.2° F .9 in 102° F (10/05/1964) 28° F (10/30/1971)
November 63.9° F 42.7° F 1.9 in 85° F (11/02/1967) 24° F (11/17/1958)
December 53.6° F 36.6° F 1.9 in 75° F (12/01/1977) 18° F (12/12/1972)
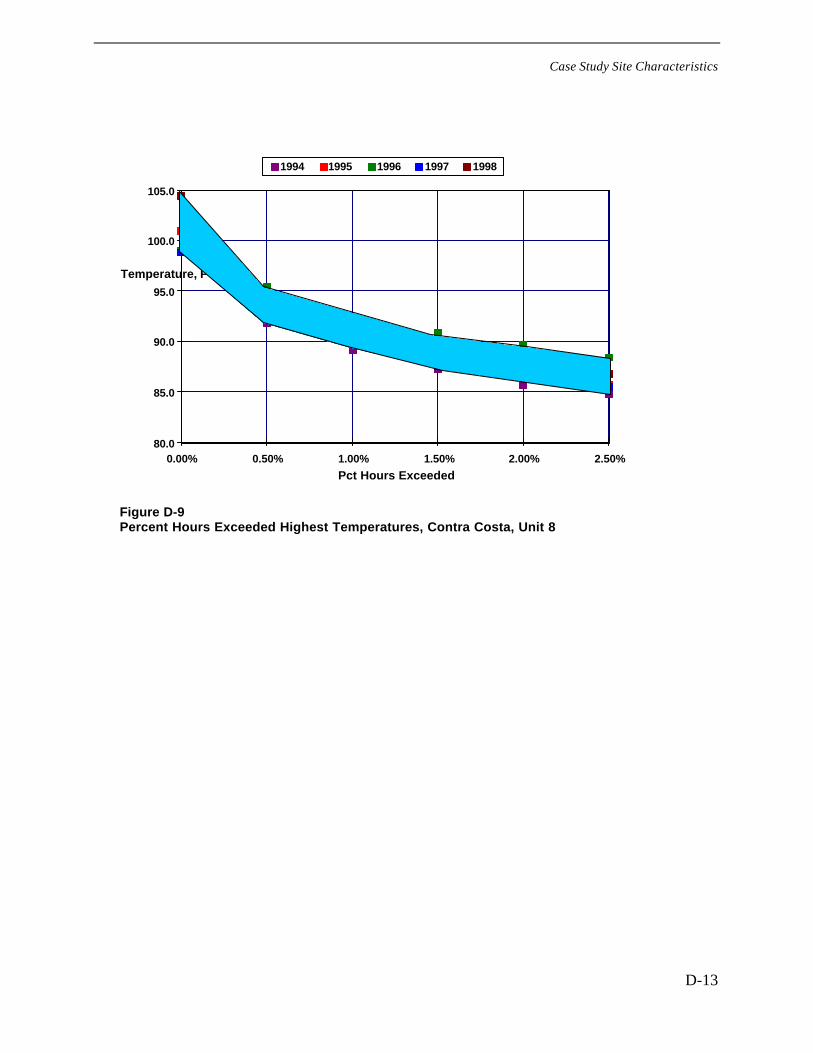
Case Study Site Characteristics
D-13
Figure D-9Percent Hours Exceeded Highest Temperatures, Contra Costa, Unit 8
80.0
85.0
90.0
95.0
100.0
105.0
0.00% 0.50% 1.00% 1.50% 2.00% 2.50%
Pct Hours Exceeded
Temperature, F
1994 1995 1996 1997 1998