comparison between various models of solar spectral irradiance and experimental data
TRANSCRIPT

Comparison between various models of solar spectralirradiance and experimental data
V. E. Cachorro, A. M. de Frutos, and J. L. Casanova
Three models of spectral direct irradiance of the sun at the ground are compared with experimental spectralmeasurements. Satisfactory agreement is obtained although their behavior is quite different mainly in theabsorption bands. The turbidity parameters required by the model are obtained from the measured dataand the water vapor by simultaneous radiosondage.
1. Introduction
Measurements were made to determine the directnormal solar spectral irradiance in the 400-1000-nmrange, at ground surface, on 12 and 13 June 1984.These spectral data were performed in the Centro deinvestigacion de la Baja Atmosfera (CIBA), a rural lo-cation (latitude = 41°,49',16"; longitude = 4°,57',53"W) very close to the village of La Mudarra, in Valla-dolid, Spain. A description of the spectroradiometerand its calibration was presented elsewhere1'2 and anextensive presentation of the solar spectral data sets wasalso shown.3
The aim of this paper is to analyze the different at-mospheric models which appear in the bibliography,because a large comparison between predicted andmeasured data in real atmosphere is necessary. Thisanalysis will show the limitations of these models todetermine different atmospheric parameters and alsoto predict the solar spectral irradiance in several at-mospheric conditions (turbidity, water vapor, etc).
At this time a large variety of solar spectra have beenpublished in the form of either measured data by Birdet al.,4 and those appearing in their references, ormodeled data. In the literature there are simple modelsto compute the direct solar spectral irradiance at groundlevel with the Lambert-Beer-Bouguer law, assuming theatmosphere is a single homogeneous layer. Othermodels, normally used to compute longwave radiation,are also used to model solar radiation (LOWTRAN5 6,
All authors are with Universidad de Valladolid, 47071-Valladolid,Spain; A. M. de Frutos is in the Departamento de Optica, the otherauthors are in the Departamento de Fisica Fundamental.
Received 25 March 1985.0003-6935/85/193249-05$02.00/0.© 1985 Optical Society of America.
SOLTRAN, BRITE, and FLASH 7 ' 8 ). These later codes aremore rigorous than the simple models in calculating theattenuation of direct radiation by aerosol scattering andin computing the scattered (diffuse) portion of the totalradiation. The aerosol models of these codes representaverage conditions and are not a representation of theatmospheric aerosol turbidity which allows a simpleformula, such as that of Angstrom. 9 Also these codesassume the atmosphere to be divided into a certainnumber of isothermal layers; this assumption is notnecessarily an improvement with respect to the simplemodels because the total precipitable water vapor alongthe ray path can be introduced into the transmittancefunction in the same way as in the earlier accuratecodes.
II. Description of the Models
This section describes the three different atmosphericmodels which have been analyzed to compute the the-oretical data. The simple models are those of Leckner 10
and Bird"1 and Koepke and Quenzel12 and Moskalen-ko13 (K-Q-M). The transmittance function of Mos-kalenko and the modified absorption coefficients givenby the first two authors12 are used in this later model.
The three models are based on the Lambert-Beer-Bouguer law, which can be applied to a homogeneouslayer of thickness x in the form
F(X) = DFo(X) exp[--y(X)XM], (1)
where D is the earth-sun correction factor; Fo(X) isextraterrestrial atmospheric irradiance given byFroelich and Werhli14 (we have used this extra irra-diance due to its high accuracy, nearly 1-2%)15; x is thegeometrical thickness of the layer or the absorberamount (it depends on the coefficient units); and M isthe pressure corrected air mass M = mP/Po, where Po= 1013 mbar, P is the measured surface pressure inmillibars, and m is the relative air mass. For 0 < 600 (0is the solar zenith angle) the air mass has been calcu-
1 October 1985 / Vol. 24, No. 19 / APPLIED OPTICS 3249

lated through m = secO. For 800 > > 60° the earthcurvature' 6 has been taken into account. Here -y(X) isthe atmospheric attenuation coefficient at wavelengthX. This expression applies strictly to only monochro-matic radiation; this is especially true in spectral regionswhere rapid changes in the transmittance occur due tomolecular absorption. However, in regions wheretransmittance varies slowly with wavelength, this ex-pression can be used for low resolution calculations.The atmospheric attentuation coefficient can be sub-divided into aerosol and molecular scattering contri-butions:
y(X) = oU(X) + Um(X) + Ka(X) + Km(X), (2)
where o-(X) represents a scattering coefficient (subscripta refers to aerosols and m refers to molecules), and K(X)is an absorption coefficient.
The total optical depth is defined as r(X) = y(X)X,and usually it is separated in the following way:
r(X) = ra(X) + TR(X) + Tma(X), (3)
where -r = aerosol optical depth (turbidity). Here TR
is the Rayleigh scattering optical depth and Tma is themolecular absorption optical depth, which can also beseparated into various absorptions due to the contri-butions of the diverse atmospheric absorbing gases.The various absorbing gases present several bands indifferent spectral regions and the overlapping of thesebands is the usual situation for most cases. Further-more, it is not always possible to express the transmit-tance function of the absorbing gases in the form of anexponential whose optical depth is the product of anattenuation coefficient by the absorbing gas amount [asin Eqs. (1) and (2)]. The transmittance function isusually determined as a semiempirical function; for thisreason, formula (1) is expressed in the form of a productof the transmittance functions of the diverse absorbingor scattering elements:
F(X) = DFO(X)TR(X)Ta(A)TO2 (\)To 3 (\)THO(X), (4)
TR (X) is the Rayleigh scattering transmittance given17
by
TR(A) = exp(-0.008735X- 4 .0 8 M). (5)
The attenuation by aerosols is given by the Angstromformula 9 :
Ta (X) = exp(-flX-aM). (6)
In our case (400-1000-nm range of measurements)three important absorbing elements exist. The ozone(Chapuis band), whose transmittance function is
To3 (,) = exp(-Co 3 G\)lM), (7)
where is the integrated ozone content in the verticaland C(X) is the absorption coefficient obtained byVigroux.18 Bird's and Leckner's tables of these coef-ficients show a little difference. For our calculationsa value of 1 0.31 cm was chosen. These later equationsare used for the three models considered.
The expression for the transmittance of mixed gases(mainly oxygen in our case) is equal in the three models
but the coefficients are different in Leckner's and Bird's(K-Q-M's coefficients are set equal to Bird's):
To2 (X) = exp{- 1.41Co2 (X)M]O .I[1.0 + 118.3Co,(X)M]0.451 (8)
The main difference between the three models con-sidered is due to the water vapor transmittance functionand the different absorption coefficients CH2o(X)-Therefore we have Leckner transmittance function:
TH 2O(X) = exp I- 0.3CH2 o(X)0.795wM 1[1.0 + 25.25CH2 O(X)0.795wM] I45J
Bird function:
(9)
THO(X) = exp (_0.3285CHO(X)[W + (1-42 -w)0.5]M ;(0I 2 ) exp [1.0 + 20.07CH 2o(X)M]0 45 J 1
K-Q-M function:
TH2O(X) = exp[-CH 2 o(X)(W WM. (11)
where w is the total amount of water vapor in the ver-tical, Pe is the effective pressure calculated accordingto the Curtis-Godson approximation,16 and n and m areparameters which depend on the wavelength; in thisspectral range they are constants.
As can be seen, Bird's water vapor transmittancefunction is a variation of Leckner's function. In theoriginal paper by Bird,'1 the functions for Rayleighscattering and absorption by ozone are different fromthe equations used above, but the differences betweenthese functions for irradiance calculation can be ne-glected.'9
I11. Comparison Modeled-Experimental Data
The minimum parameters required to characterizethe atmosphere for the optical modeling and spectralmeasurements are turbidity and total precipitable watervapor. To compare these modeled data, it is necessaryto know these parameters at the time of the spectralmeasurements. The total precipitable water vaporamount has been determined by simultaneous radio-sondage. The most common way to determine theturbidity is Angstr6m's method,20 sun-photometermethod,21 and others,22 23 obtaining the a and 3 pa-rameters and using the Angstr6m equation to model theextinction of aerosols. A discussion about the a and 3determination, its dependence on the wavelength, itscapability to define the atmospheric turbidity and tomodel the attenuation of solar radiation can be seen inan earlier paper.2 4 The paper by Guzzi et al.25 uses thisprocedure to compare experimental and theoreticalspectral data. The disagreement is large in the visibleand near-infrared regions (600-800 nm), and these au-thors attribute the observed differences to incorrectaerosol extinction parameterization. They have chosento compute those parameters at two wavelengths, 680and 800 nm, of their own experimental spectra. In theearlier referenced paper2 4 the cause of this disagreementcan be found; the dependence on wavelength of the aand ,B parameters and its determination at two concretewavelengths yield very different values of these pa-rameters, which depend on the two chosen wavelengths.We have chosen the most appropriate method, ac-
3250 APPLIED OPTICS / Vol. 24, No. 19 / 1 October 1985

a_ -0.10
P- 0.30
. - Pit A.' -- r-' - - %-n* I
Ln ( wavelength (nm))
Fig. 1. One of the linear fits Ln-Ln of aerosol optical thickness vswavelength.
4)
C4'
I.,
.0-
wavelength(nn) 100
I.53.
a
4)
Cla
110
4'
1.25
I.N
.75
25
C. S.4. 5. 6. 7. 8.
wavelength (nn)* 100
Fig. 2. Comparison between experimental and Leckner modeled
data: (a) spectral transmittance, (b) spectral irradiance.
cording to the Angstrom deduction formula, to obtainthe a and 3 parameters. So the plot of natural loga-rithms Ln-Ln of the aerosol optical depth vs thewavelength in the 450-670 nm range allows one to de-termine these turbidity parameters. Its values are verydifferent from those obtained at two different individualwavelengths. 21 One of these plots can be seen in Fig.1. The experimental spectral irradiance data includethe circumsolar radiation, which has not been elimi-nated from these data because its values are of the same
I .e
-Ia
N .
-
An.
o .75C
H
.25
B."Is.4. 5. 6. 7. 8.
wavelength (n.) *100
Fig. 3. Comparison between experimental and Bird modeled data:(a) spectral transmittance, (b) spectral irradiance.
order as the experimental errors. The adjusted tur-bidity parameters contain this information.
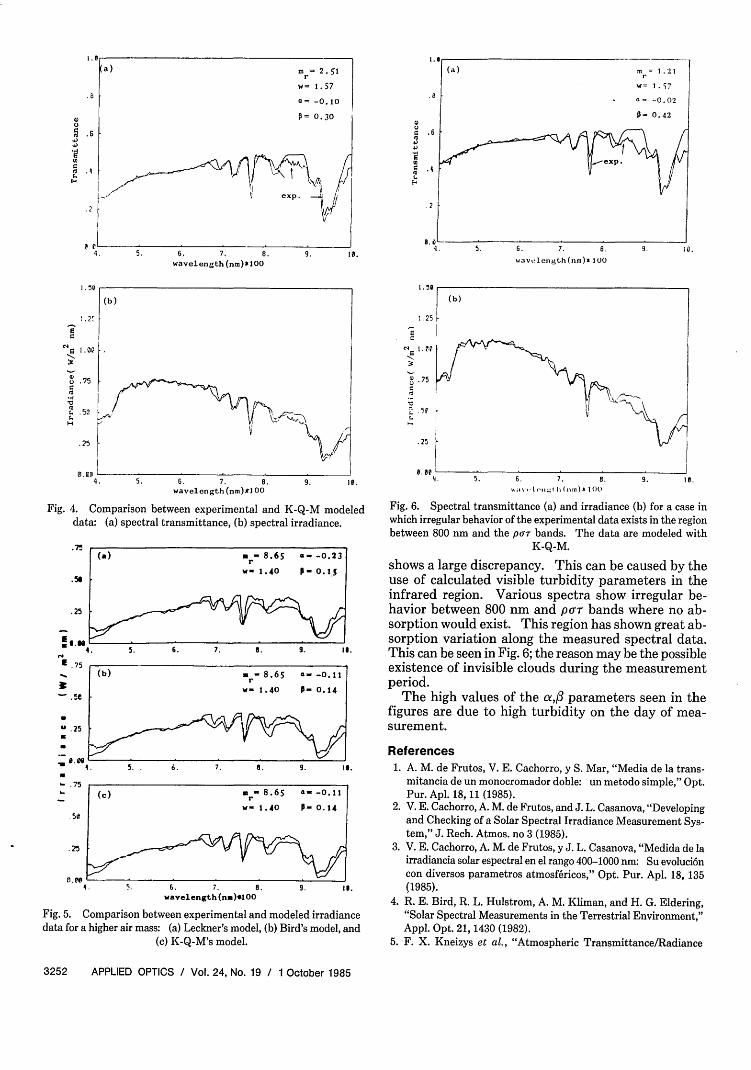
Figures 2-4 show the modeled and experimentaltransmittance (a) and irradiance (b), for Leckner, Bird,and K-Q-M models, respectively. The relevant pa-rameters are shown in each figure and their spectralresolution is 9 nm. As is clear from the figures, Leck-ner's model is the roughest. In all three models, thevisible range is satisfactorily modeled. The first bandof oxygen (680 nm) appears accurately modeled inLeckner's and also the 0.8-gtm band of water vapor.The discrepancies in Bird's and K-Q-M's in the oxygenband are merely a question of the limited number ofwavelengths of these models. From all our experi-mental data we have observed that the 0.8-gum band isovervalued in the two later models. Perhaps this isbecause the absorption coefficients12 have been ob-tained for very high air masses, and this band becomesdeeper when this parameter increases. The secondband of oxygen (762 nm) is infravalued in all cases.K-Q-M's model describes the a and puT bands of watervapor more accurately and satisfactorily than do theother models. Finally, the disagreements are moresignificant in the transmittance than in the irra-diance.
Figure 5 shows the behavior of the three modelsconsidered for a higher air mass. As is clear, the figure
1 October 1985 / Vol. 24, No. 19 / APPLIED OPTICS 3251
e.g
4)
+4
-1.c
0o
I' -1.58L
2.
.
0C .54+4
+4
9.
.2
Ln(450) Ln(670)S.
-
2 5
I
+4
0
Ez
.4
k
a=.
m = 2. 51
w= 1.57= -0. 10
P= 0.30
exp. I Z
5. 6. 7. 8.wavelength (nm)*100
Sa
.,Ur
C
C
H
75
9. se.
25
4. 5. 6. 7. 8. 9. I .wavelength (nm)Al 00
Fig. 4. Comparison between experimental and K-Q-M modeleddata: (a) spectral transmittance, (b) spectral irradiance.
.75
5.
.25
E 75
.5e
U .25
= .75
.25
1. Op
4. 5. . 6. 7.
(c) rW.
I /_ z SI. 5. 6. 7,
wavelength (nm)1 04
Fig. 5. Comparison between experimental adata for a higher air mass: (a) Leckner's modf
(c) K-Q-M's model.
1.
I)
C
C
0-
wavlengh(m) 1 0
4)
'. .75C
.:
S. e4. 5. 6. 7. 8. 9. 45.
h. - 4g 1(lm I 00
Fig. 6. Spectral transmittance (a) and irradiance (b) for a case inwhich irregular behavior of the experimental data exists in the regionbetween 800 nm and the PUT bands. The data are modeled with
K-Q-M.
shows a large discrepancy. This can be caused by theuse of calculated visible turbidity parameters in theinfrared region. Various spectra show irregular be-havior between 800 nm and pT bands where no ab-sorption would exist. This region has shown great ab-sorption variation along the measured spectral data.This can be seen in Fig. 6; the reason may be the possibleexistence of invisible clouds during the measurementperiod.
The high values of the a,fl parameters seen in thefigures are due to high turbidity on the day of mea-surement.
References8. 9. i. 1. A. M. de Frutos, V. E. Cachorro, y S. Mar, "Media de la trans-
mitancia de un monocromador doble: un metodo simple," Opt.8.65 -0.11 Pur. Apl. 18, 11 (1985).
1.40 P o. 14 2. V. E. Cachorro, A. M. de Frutos, and J. L. Casanova, "Developingand Checking of a Solar Spectral Irradiance Measurement Sys-tem," J. Rech. Atmos. no 3 (1985).
3. V. E. Cachorro, A. M. de Frutos, y J. L. Casanova, "Medida de lairradiancia solar espectral en el rango 400-1000 nm: Su evoluci6ncon diversos parametros atmosf6ricos," Opt. Pur. Apl. 18, 135
8. 9. Is. (1985).>° 4. R. E. Bird, R. L. Hulstrom, A. M. Kliman, and H. G. Eldering,and modeled irradiance "Solar Spectral Measurements in the Terrestrial Environment,"1, (b) Bird's model, and Appl. Opt. 21, 1430 (1982).
5. F. X. Kneizys et al., "Atmospheric Transmittance/Radiance
3252 APPLIED OPTICS / Vol. 24, No. 19 / 1 October 1985
() * - 8.65 _ -0.23w= 1.40 p- 0.15
4. 5. 6. 7. 8. 9. II
(b) a -8.65 a -0.11
w-1.40 P- 0.14
_, 'I
(a)
.b
.6

Computer Code LOWTRAN5," AFGL-TR-80-0067 (AFGL, Bed-ford, Mass., 1980).
6. D. C. Robertson, L. S. Bernstein, R. Haimes, J. Wunderlich, andL. Vega, "5-cm'1 Band Model Option to LowTRAN5," Appl. Opt.20, 3218 (1981).
7. R. E. Bird, "Terrestrial Solar Spectral Modeling," Sol. Cells 7,107 (1982).
8. R. E. Bird, R. L. Hulstrom, and L. J. Lewis, "Terrestrial SolarSpectral Data Sets," Sol. Energy 30, 563 (1983).
9. A. Angstrom, "On the Atmospheric Transmission of Sun Ra-diation II," Geogr. Ann. H 12, 130 (1930); "On the AtmosphericTransmission of Sun Radiatioin and on Dust in the Air," Geogr.Ann. H. 11, 156 (1929).
10. B. Leckner, "The Spectral Distribution of Solar Radiation at theEarth's Surface-Elements of a Model," Sol. Energy 29, 143(1978).
11. R. E. Bird, "A Simple Solar Spectral Model for Direct Normaland Diffuse Horizontal Irradiance," Sol. Energy 32, 461 (1984).
12. P. Koepke and H. Quenzel, "Water Vapor: Spectral Transmissionat Wavelengths Between 0.7 m and 1 /im," Appl. Opt. 17, 2114(1978).
13. N. I. Moskalenko, "The Spectral Transmission Function in theBands of Water Vapor, 03, N2 0, and N2 Atmospheric Compo-nents," Izv. Acad. Sci. USSR Atmos. Ocean Phys. 5, 1179(1969).
14. C. Froelich and C. Wehrli, World Radiation Center; privatecommunication.
15. C. Froelich, "Data on Total and Spectral Solar Irradiance:Comments," Appl. Opt. 22, 3928 (1983).
16. K. Y. Kondratyev, Radiation in the Atmosphere (Academic, NewYork, 1969).
17. R. Penndorf, "Tables of the Refractive Index for Standard Airand the Rayleigh Scattering Coefficient for the Spectral RegionBetween 0.2 and 20.OA and Their Application to AtmosphericOptics," J. Opt. Soc. Am. 47, 176 (1957).
18. E. Vigroux, "Contribution a l'etude experimentale de l'absorptionde l'oxone," Ann. Phys. 8, 709 (1953).
19. A. K. Das and M. Iqbal, "Modifications to an Algorithm toCompute Diffuse Solar Spectral Radiation Under Clear Skies,"Rev. Int. d'Heliotechnique (COMPLES) 2 sem., 2 (1984).
20. A. Angstr6m, "The Parameters of Atmospheric Turbidity," Tellus16, 64 (1964).
21. F. E. Volz, "Economical Multispectral Sun Photometer forMeasurements of Aerosol Extinction from 0.44 Am to 1.6 Am andPrecipitable Water," Appl. Opt. 13, 1732 (1974).
22. M. A. Box and A. Deepak, "Atmospheric Scattering Correctionsto Solar Radiometry," Appl. Opt. 18, 1941 (1979).
23. A. Pons and A. Corrons, "Solar Irradiance Spectrum at Madrid,"Atmos. Environ. 16, 2237 (1982).
24. V. E. Cachorro, A. M. de Frutos, and J. L. Casanova, Determi-nation of the Turbidity Parameters: Results and Discussion,"Atmos. Environ., submitted.
25. R. Guzzi, G. Lo Vecchio, R. Rizzi, and G. Scalibrin, "ExperimentalValidation of a Spectral Direct Solar Radiation Model," Sol.Energy 31, 359 (1983).
Of Optics continued from page 3226
participation of undergraduates in scientific research at suchliberal arts colleges as Carleton, Franklin and Marshall,Mount Holyoke, Oberlin, Reed, Swarthmore and Williams.Altogether, forty-eight leading undergraduate colleges of thissort were identified and the presidents of most of themgathered last week at Oberlin to discuss the implications ofthe report. Two main explanations emerged as to why suchcolleges have done so well in science.
Unlike the major research universities, these schools es-sentially have no graduate students so the professors have onlythe undergraduates to call upon. Secondly, unlike the sit-uation at less distinguished small colleges, there is more re-search being done at the elite small colleges as an adjunct toteaching. The teacher-scholar is often held up as an academicideal and the elite private colleges that concentrate on un-dergraduate education seem to have provided an atmospherefor many such persons to thrive.
The report prepared by researchers at Oberlin on behalf ofthe forty-eight leading liberal arts colleges showed that almost60% of the science faculty members at the institutions pub-lished one or more articles in professional journals in the lastfive years. Furthermore, it revealed that an average offorty-five students per institution were actively engaged asresearch assistants in faculty projects each year. Ultimately,one-third of all the journal articles published by the sciencefaculty bore the names of students as co-authors.
Teaching and research appear to reinforce each other atsuch institutions and the students are often the beneficiaries."These institutions have a strong relationship betweenhigh-quality teaching and faculty research," said S. FrederickStarr, president of Oberlin. "The statistics suggest that theresearch by faculty members in science is an essential elementin their successful teaching."
Prestige for some professors at large research universitiesis derived from seeing as few undergraduates as possible, butprofessors at the small selective private colleges are seldomreleased from teaching or given lighter assignments in orderto pursue their research. "Not only do our faculty membersinstruct in the techniques of research, but they also teachheavy loads," said Neal B. Abraham, a physics professor atOberlin. "They invest in students as apprentices and wefirmly believe that our students are better and more soughtafter because they have had research experience."
Such activities add up to a situation in which the basicsciences-biology, chemistry, physics and mathematics-arestronger at the highly selective liberal arts colleges than eventhe presidents were certain of. "We had faith that what wewere doing was right, but up until now we didn't have the ev-idence," said James L. Powell, president of Franklin andMarshall College in Lancaster, Pa. Twenty-four percent ofthe baccalaureates granted by the forty-eight colleges are inthe basic sciences, in contrast to 7.7% in all of higher educa-tion. Many of the students go on for doctorates in the sci-ences. Grinnell College in Iowa, which graduates fewer than300 students a year, sometimes confers more baccalaureatesin chemistry than the University of Iowa or any of the otherlarger universities in the state, according to George A. Drake,president of Grinnell.
The smaller scale on which scientists must carry out theirinvestigations at liberal arts colleges is obvious when theircampuses are compared with such lavishly equipped researchcenters as Columbia or Cornell or Yale. Sometimes, though,smallness can be an advantage, as was the case recently atSwarthmore in Pennsylvania when an important piece of joint
continued on page 3304
1 October 1985 / Vol. 24, No. 19 / APPLIED OPTICS 3253