comparing ac induction with permanent magnet motors · pdf filecomparing ac induction with...
TRANSCRIPT
© Copyright 2013 to the present, Parker Hannifin Corporation Page 1
Parker Hannifin 2013
Comparing AC Induction with Permanent Magnet motors in hybrid vehicles and the impact on the value proposition
Jay W. Schultz and Steve Huard, PhD. EMN Division – Automation Group
5500 Business Park Drive Rohnert Park, CA 94928
Keywords: (hybrid vehicles, EV, HEV, drivetrain, powertrain, electric motors, PMAC, drive cycle)
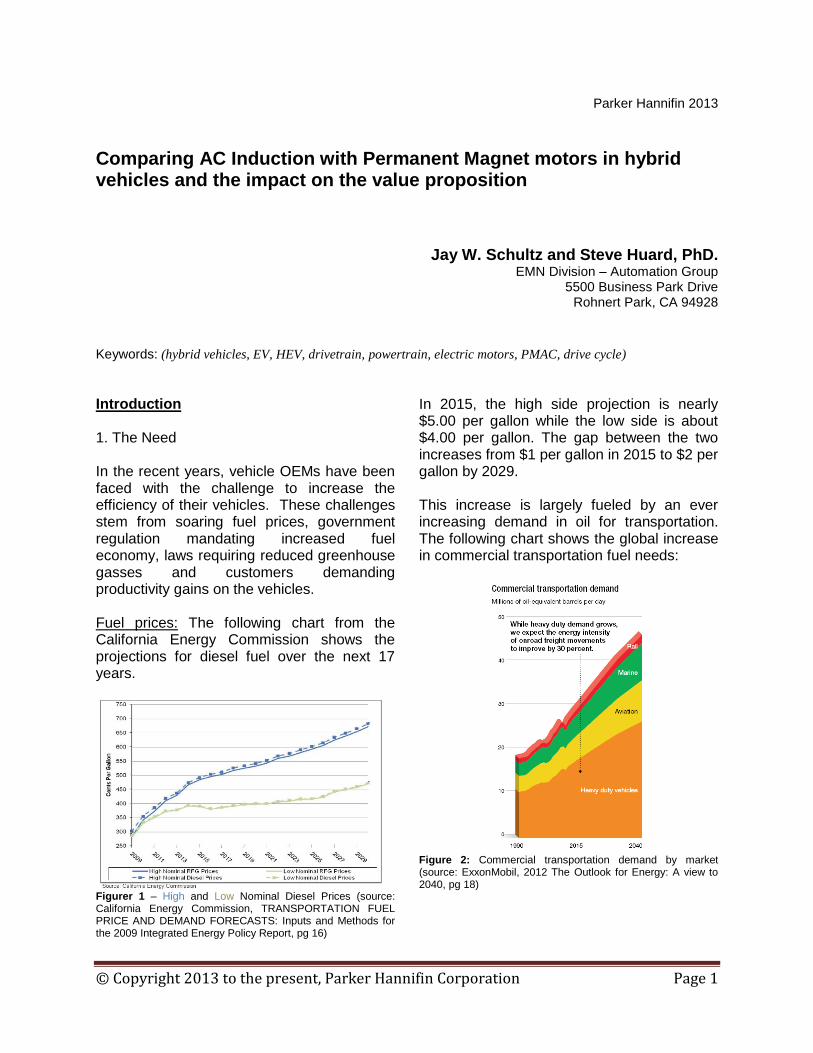
Introduction 1. The Need In the recent years, vehicle OEMs have been faced with the challenge to increase the efficiency of their vehicles. These challenges stem from soaring fuel prices, government regulation mandating increased fuel economy, laws requiring reduced greenhouse gasses and customers demanding productivity gains on the vehicles. Fuel prices: The following chart from the California Energy Commission shows the projections for diesel fuel over the next 17 years.
Figurer 1 – High and Low Nominal Diesel Prices (source: California Energy Commission, TRANSPORTATION FUEL PRICE AND DEMAND FORECASTS: Inputs and Methods for the 2009 Integrated Energy Policy Report, pg 16)
In 2015, the high side projection is nearly $5.00 per gallon while the low side is about $4.00 per gallon. The gap between the two increases from $1 per gallon in 2015 to $2 per gallon by 2029. This increase is largely fueled by an ever increasing demand in oil for transportation. The following chart shows the global increase in commercial transportation fuel needs:
Figure 2: Commercial transportation demand by market (source: ExxonMobil, 2012 The Outlook for Energy: A view to 2040, pg 18)

© Copyright 2013 to the present, Parker Hannifin Corporation Page 2
With the global demand increasing and rising costs of diesel fuel a real probability, OEMs are forced to plan for vehicle platforms that can offer their customers relief from these rising costs. Government Regulations: In addition to the economic impact of rising fuels, the federal government and local governments are imposing strict regulations for vehicle manufactures. These regulations are primarily focused on reducing greenhouse gasses, anti-idling laws and higher efficiency. Productivity: At the same time as OEMs are reducing fuel consumption and meeting government regulations, they are able to use some of these requirements to improve the productivity or performance of the vehicles. Depending on the OEM and specific vehicle, these might include: improved system response, more controllable, optimized power distribution and safety. 2. Increasing Efficiency Vehicle efficiency can be increased in differing ways: Operator behavior, components specified and advanced technologies, such as hybrids. Operator Behavior: This is likely the most cost effective and immediately available way to impact fuel costs and vehicle efficiency. But is, perhaps, one of the most challenging to effectively implement. The fleets must invest time and training to ensure operators understand how their behavior can impact costs. Once done, ensuring that operators meet the metrics is difficult. Components Specified: Vehicle OEMs can dig into their existing design and optimize the components a bit more effectively. Understanding the efficiency over the range of operation from pumps to engines and even much smaller, less significant, components
can impact the overall efficiency of the vehicle. Suppliers see this need and are designing and manufacturing more efficient building blocks for the many different applications on vehicles. Advanced Technologies: Another way to improve efficiency is to utilize alternative, or advanced, technologies and radically challenge the way vehicle control has been done. Engine manufactures are focusing on incorporating new technology into their diesel products. Natural gas engines have become a viable solution for clean operation. Hybrid vehicles are also starting to emerge on a number of differing platforms – from cars, trucks, and work boats to construction equipment and agricultural vehicles. The hybrid technology used in the powertrain comes in two forms, hydraulic and electric. 3. The HEV – Hybrid Electric Vehicle HEVs are most recognized on the streets in passenger cars such as the Prius. However, similar adaptations of this technology have migrated into many other vehicles. Powertrain: The Prius incorporates hybrid electric technology in the powertrain. The electric traction system delivers power to the wheels helping to propel the car when the engine is least efficient. This is typically during acceleration. This same concept can be used by OEMs building vehicles in a number of other markets. This can help achieve the efficiency and emissions standards they are facing in the coming years. Hydraulic Implements: Many vehicles such as work trucks and construction equipment require hydraulics to operate the implements. On a vehicle, the power to run these implements is typically generated by an
© Copyright 2013 to the present, Parker Hannifin Corporation Page 3
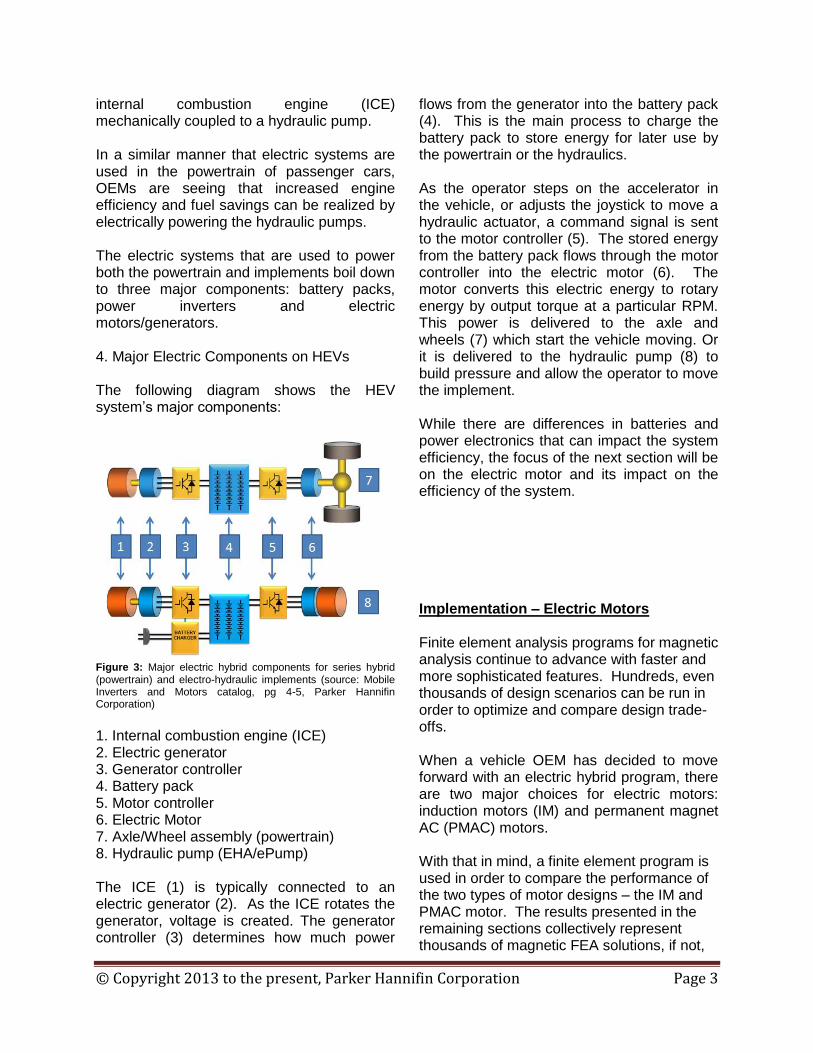
internal combustion engine (ICE) mechanically coupled to a hydraulic pump. In a similar manner that electric systems are used in the powertrain of passenger cars, OEMs are seeing that increased engine efficiency and fuel savings can be realized by electrically powering the hydraulic pumps. The electric systems that are used to power both the powertrain and implements boil down to three major components: battery packs, power inverters and electric motors/generators. 4. Major Electric Components on HEVs The following diagram shows the HEV system’s major components:
Figure 3: Major electric hybrid components for series hybrid (powertrain) and electro-hydraulic implements (source: Mobile Inverters and Motors catalog, pg 4-5, Parker Hannifin Corporation)
1. Internal combustion engine (ICE) 2. Electric generator 3. Generator controller 4. Battery pack 5. Motor controller 6. Electric Motor 7. Axle/Wheel assembly (powertrain) 8. Hydraulic pump (EHA/ePump) The ICE (1) is typically connected to an electric generator (2). As the ICE rotates the generator, voltage is created. The generator controller (3) determines how much power
flows from the generator into the battery pack (4). This is the main process to charge the battery pack to store energy for later use by the powertrain or the hydraulics. As the operator steps on the accelerator in the vehicle, or adjusts the joystick to move a hydraulic actuator, a command signal is sent to the motor controller (5). The stored energy from the battery pack flows through the motor controller into the electric motor (6). The motor converts this electric energy to rotary energy by output torque at a particular RPM. This power is delivered to the axle and wheels (7) which start the vehicle moving. Or it is delivered to the hydraulic pump (8) to build pressure and allow the operator to move the implement. While there are differences in batteries and power electronics that can impact the system efficiency, the focus of the next section will be on the electric motor and its impact on the efficiency of the system. Implementation – Electric Motors Finite element analysis programs for magnetic analysis continue to advance with faster and more sophisticated features. Hundreds, even thousands of design scenarios can be run in order to optimize and compare design trade-offs. When a vehicle OEM has decided to move forward with an electric hybrid program, there are two major choices for electric motors: induction motors (IM) and permanent magnet AC (PMAC) motors. With that in mind, a finite element program is used in order to compare the performance of the two types of motor designs – the IM and PMAC motor. The results presented in the remaining sections collectively represent thousands of magnetic FEA solutions, if not,
© Copyright 2013 to the present, Parker Hannifin Corporation Page 4
tens of thousands of FEA solutions to accurately compare the two major options. For illustration purposes, design criteria must be chosen to accurately compare motors. The specifications for the designs were based off of real world vehicle needs. The vehicle required that a motor must produce at least 600 N*m of torque and 100 kW of power on an intermittent basis. The motor also needed to deliver 300 N*m of torque and 60 kW of power on a continuous basis. Maximum continuous speed of 5000 RPM was needed to reach highway speeds. Also, the motor would need to use the same power output source of 600 VDC, 200 Amps RMS continuous and 400 Amps RMS intermittent. The motor would be water cooled. The requirements are summarized in the following table:
Table 1: High level customer specifications for a vehicle-duty electric motor
For both the IM and PMAC motors, a finite element model was created. They both use similar materials. Each motor was optimized for maximum efficiency, conformance to the design requirements in Table 1, and maximum power density. The comparison in this paper attempts to level the playing field as much as possible between the two motor types. No comparison will ever be completely fair given that these two technologies are clearly very different. 1. Induction motors Construction: Induction motors are likely the most common type of motor used across
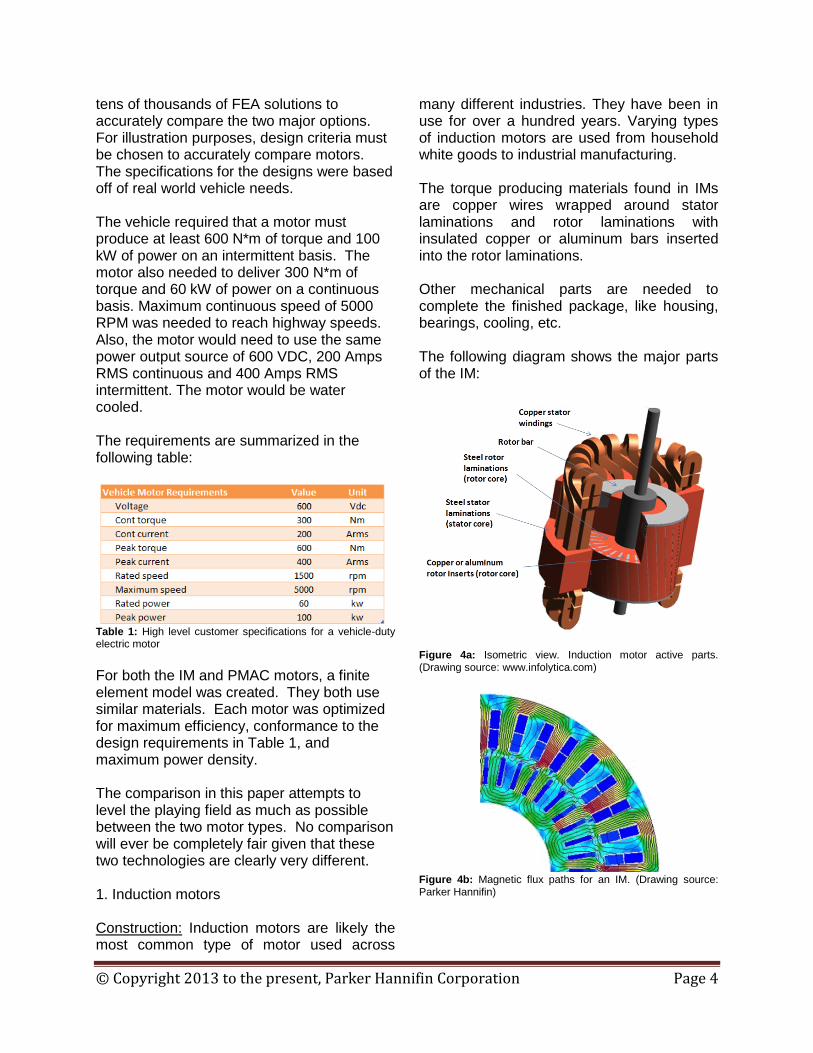
many different industries. They have been in use for over a hundred years. Varying types of induction motors are used from household white goods to industrial manufacturing. The torque producing materials found in IMs are copper wires wrapped around stator laminations and rotor laminations with insulated copper or aluminum bars inserted into the rotor laminations. Other mechanical parts are needed to complete the finished package, like housing, bearings, cooling, etc. The following diagram shows the major parts of the IM:
Figure 4a: Isometric view. Induction motor active parts. (Drawing source: www.infolytica.com)
Figure 4b: Magnetic flux paths for an IM. (Drawing source: Parker Hannifin)
© Copyright 2013 to the present, Parker Hannifin Corporation Page 5
The following figure shows the fully housed active materials in a cutaway:
Figure 5: Induction motor full assembly, cutaway, industrial (source: Infolytica Corporation)
Operation: Induction motors work on the principle that a voltage entering the motor windings creates current flow that produces a magnetic field. This field flows through the rotor at the same point. As the motor controller switches the voltage from one winding to the next winding, this magnetic field also changes location. As the voltage continues to flow around the diameter of the motor, the magnetic field also changes location and the rotor follows. See Figure 6:
Figure 6: Typical winding pattern for a 3-phase, vehicle duty induction motor (source: Infolytica Corporation).
Size: Induction motors vary widely in size – as the power output is very scalable. They can range from fractional horsepower to thousands of horsepower. Recall from Table 1 the specifications for the vehicle. The voltage is a characteristic of the battery pack while the current listed is the
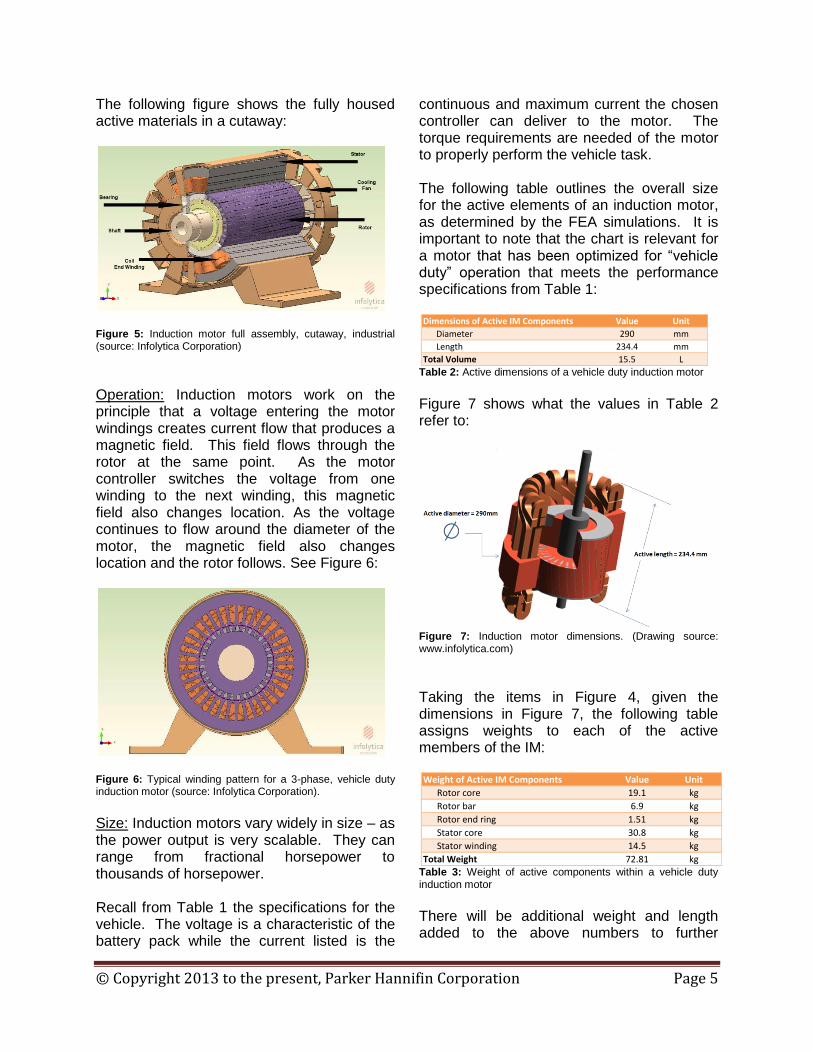
continuous and maximum current the chosen controller can deliver to the motor. The torque requirements are needed of the motor to properly perform the vehicle task. The following table outlines the overall size for the active elements of an induction motor, as determined by the FEA simulations. It is important to note that the chart is relevant for a motor that has been optimized for “vehicle duty” operation that meets the performance specifications from Table 1:
Table 2: Active dimensions of a vehicle duty induction motor
Figure 7 shows what the values in Table 2 refer to:
Figure 7: Induction motor dimensions. (Drawing source: www.infolytica.com)
Taking the items in Figure 4, given the dimensions in Figure 7, the following table assigns weights to each of the active members of the IM:
Table 3: Weight of active components within a vehicle duty induction motor
There will be additional weight and length added to the above numbers to further
Dimensions of Active IM Components Value Unit
Diameter 290 mm
Length 234.4 mm
Total Volume 15.5 L
Weight of Active IM Components Value Unit
Rotor core 19.1 kg
Rotor bar 6.9 kg
Rotor end ring 1.51 kg
Stator core 30.8 kg
Stator winding 14.5 kg
Total Weight 72.81 kg
© Copyright 2013 to the present, Parker Hannifin Corporation Page 6
increase the total weight. The values shown are only looking at the active parts and don’t include housing, bearings, etc. Performance and Efficiency: The constraints of the induction motor FEA simulation were set to run the motor at its maximum efficiency at all torque-speed points. This resulted in the induction motor being run at its maximum voltage condition. Doing this had the effect of putting the induction motor in the best light with respect to the comparison to the PMAC motor outlined in a later section1. The following chart shows the intermittent (red line) and continuous (blue line) output torque for the FEA generated induction motor:
Figure 8: Intermittent and continuous torque output of FEA optimized vehicle-duty IM motor. (Graph source: Parker Hannifin)
The next chart shows the intermittent and peak power output of the same motor:
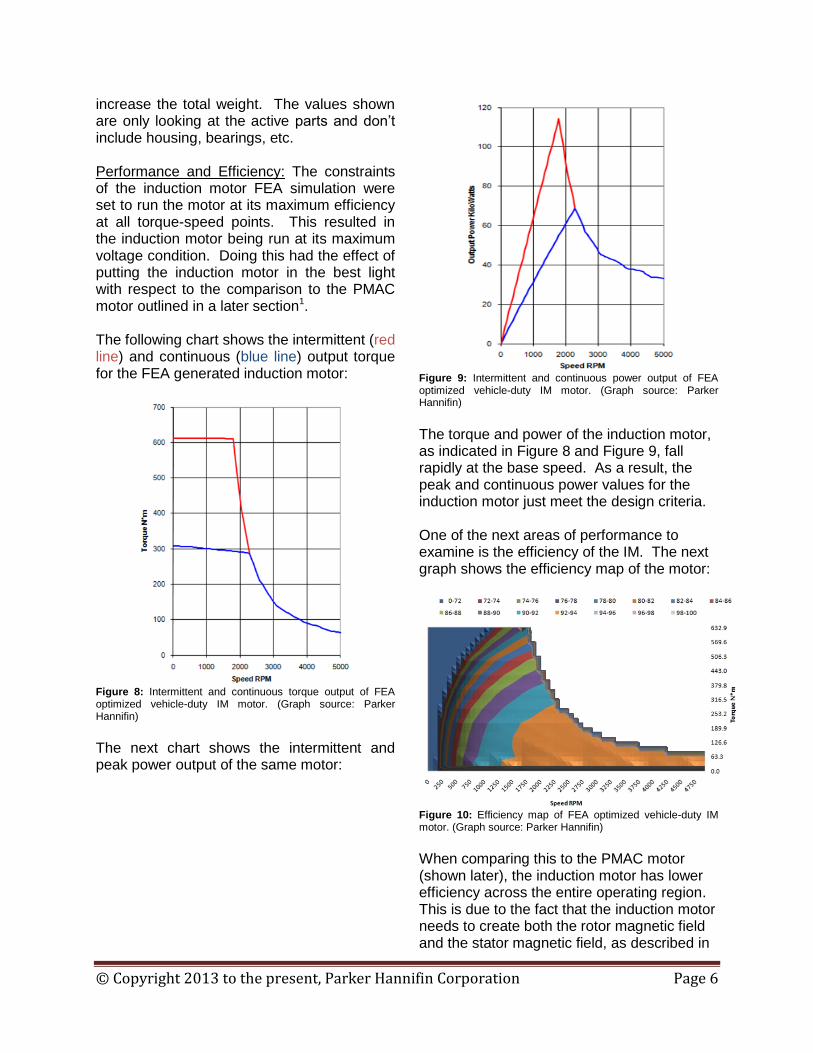
Figure 9: Intermittent and continuous power output of FEA optimized vehicle-duty IM motor. (Graph source: Parker Hannifin)
The torque and power of the induction motor, as indicated in Figure 8 and Figure 9, fall rapidly at the base speed. As a result, the peak and continuous power values for the induction motor just meet the design criteria. One of the next areas of performance to examine is the efficiency of the IM. The next graph shows the efficiency map of the motor:
Figure 10: Efficiency map of FEA optimized vehicle-duty IM motor. (Graph source: Parker Hannifin)
When comparing this to the PMAC motor (shown later), the induction motor has lower efficiency across the entire operating region. This is due to the fact that the induction motor needs to create both the rotor magnetic field and the stator magnetic field, as described in

© Copyright 2013 to the present, Parker Hannifin Corporation Page 7
the Operation section. Both magnetic fields are created from the circulation of current through copper; this means there are I2R losses – that is the current squared multiplied by the resistance. This loss is present on both the rotor and the stator in order to produce a magnetic field. The IM only has copper bars on the rotor and as a result, the motor can produce low torque values at high speed with very high efficiency. This is clearly seen in the figure. At high speed and low torque both the stator field and the rotor field can be very small, and hence, the magnetic losses are very low. Cost: The cost of the induction motor is perhaps the strongest benefit. Traditional IM motors are readily available and have large global usage. Vehicle rated motors are not as available and have some higher costs due to more strenuous testing and environmental requirements. The active materials, however, remain the same between the two. The following table outlines the cost of the active materials of the IM as a percentage what a comparable PMAC motor might cost (discussed later). It is assumed that the PMAC motor equals 100%:
Table 4: Cost of active components within a vehicle duty induction motor relative to a comparable performing PMAC motor.
Table 4 shows that the costs of the active components of the IM motor sum to about 26% less than the equivalent PMAC motor. The primary reason for the lower cost is due to copper bars on the rotor instead of magnets. 2. Permanent Magnet Motors
Construction: Permanent magnet (PM) motors have not been around nearly as long as IMs. There are a couple variations of PM motors – brushed DC and brushless AC. Brushed DC motors are readily available and have been built for a long time. They are found in everything from small toys to industrial equipment. DC motors have copper windings on the rotor and magnets in the stator. They are not a typical choice for vehicle applications – though they are found. Brushless PMAC motors are built with copper windings wrapped around individual laminations. These copper wire assemblies make up the diameter of the stator. The following diagram shows the active components of a brushless PMAC motor:
Figure 11a: Internal permanent magnet motor active parts. (Drawing source: Infolytical Corporation)
Figure 11b: Magnetic flux paths for a PMAC motor. (Drawing source: Parker Hannifin)
There are many different configurations of the rotor for PMAC motors. But, one can see that the magnets are positioned within the rotor core (laminations) in a similar manner as the IM. The advantage is that the magnet has its own permanent magnetic field and does not
© Copyright 2013 to the present, Parker Hannifin Corporation Page 8
require any additional current to generate the field. This characteristic is the reason for many of the PMAC advantages. Figure 12 shows the entire motor assembly for a PMAC motor.
Figure 12: Brushless PMAC motor full assembly, cutaway (Drawing source: Infolytica Corporation).
Operation: Brushless PMAC motors work on a similar principle as the IM, however, there is an energy savings because the magnets have a permanent field at the rotor, where IMs require the electronics to push additional energy into the copper bars of the rotor to generate the field. The motor controller is connected to the motor and pumps voltage and current into the copper windings. As the voltage and current change in the windings, so also are the north and south poles. They switched from one stator “tooth” to the other, and the rotor is attracted to the moving magnetic stator field. This causes the torque and rotation of the PMAC motor. Size: The brushless PMAC motor is very compact due to the magnets in the rotor. The reduction of both mass and volume is an attractive feature when space is a premium. Recall from Table 1 the specifications for the vehicle. The following table outlines the overall size for the active components of a PMAC motor that meets the vehicle requirements.
Table 5: Active dimensions of vehicle duty PMAC motor.
The next table sums the entire weight of the active materials in the PMAC motor:
Table 6: Total weight of active components within a vehicle duty PMAC motor
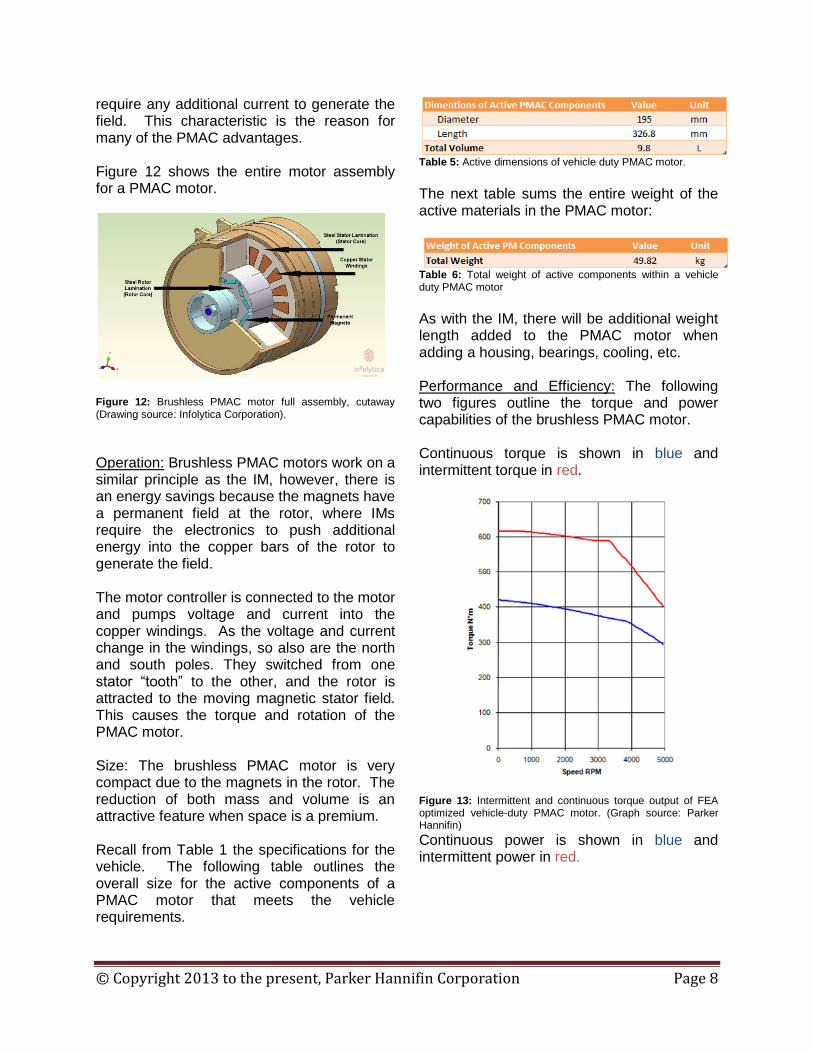
As with the IM, there will be additional weight length added to the PMAC motor when adding a housing, bearings, cooling, etc. Performance and Efficiency: The following two figures outline the torque and power capabilities of the brushless PMAC motor. Continuous torque is shown in blue and intermittent torque in red.
Figure 13: Intermittent and continuous torque output of FEA optimized vehicle-duty PMAC motor. (Graph source: Parker Hannifin)
Continuous power is shown in blue and intermittent power in red.
© Copyright 2013 to the present, Parker Hannifin Corporation Page 9
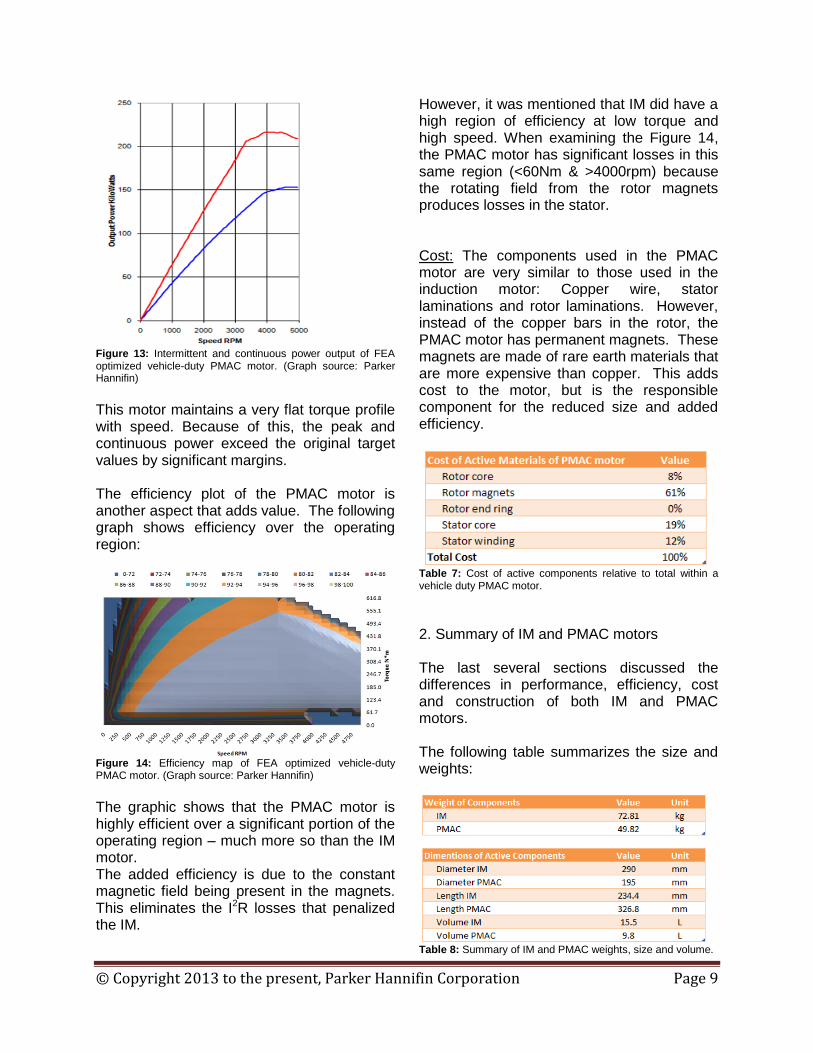
Figure 13: Intermittent and continuous power output of FEA optimized vehicle-duty PMAC motor. (Graph source: Parker Hannifin)
This motor maintains a very flat torque profile with speed. Because of this, the peak and continuous power exceed the original target values by significant margins. The efficiency plot of the PMAC motor is another aspect that adds value. The following graph shows efficiency over the operating region:
Figure 14: Efficiency map of FEA optimized vehicle-duty PMAC motor. (Graph source: Parker Hannifin)
The graphic shows that the PMAC motor is highly efficient over a significant portion of the operating region – much more so than the IM motor. The added efficiency is due to the constant magnetic field being present in the magnets. This eliminates the I2R losses that penalized the IM.
However, it was mentioned that IM did have a high region of efficiency at low torque and high speed. When examining the Figure 14, the PMAC motor has significant losses in this same region (<60Nm & >4000rpm) because the rotating field from the rotor magnets produces losses in the stator. Cost: The components used in the PMAC motor are very similar to those used in the induction motor: Copper wire, stator laminations and rotor laminations. However, instead of the copper bars in the rotor, the PMAC motor has permanent magnets. These magnets are made of rare earth materials that are more expensive than copper. This adds cost to the motor, but is the responsible component for the reduced size and added efficiency.
Table 7: Cost of active components relative to total within a vehicle duty PMAC motor.
2. Summary of IM and PMAC motors The last several sections discussed the differences in performance, efficiency, cost and construction of both IM and PMAC motors. The following table summarizes the size and weights:
Table 8: Summary of IM and PMAC weights, size and volume.
© Copyright 2013 to the present, Parker Hannifin Corporation Page 10
The IM is a bit shorter, but is significantly heavier and it consumes nearly twice the volume of the PMAC. The following table summarizes the performance:
Table 9: Summary of IM and PMAC performance relative to the specification.
Finally, the cost comparison between the IM and the PMAC:
Table 10: Summary of IM and PMAC cost
At first glance, we notice the following:
1. IM takes up more space than PMAC 2. PMAC is lighter than IM 3. Both IM and PMAC meet performance 4. Maximum efficiency is very close 5. IM costs 26% less
If the size of the motor itself was not a concern, both motors on the surface seem to meet the specifications. But, the Induction Motor costs less. Initial conclusion: Induction motor wins due to cost. However, what happens when each of these motors are placed into the drive cycle of the vehicle? Value-in-use: The Drive Cycle 1. Importance of the operation cycles The previous section explained the differences of the induction motor and the PMAC motor. On the surface, it looked as
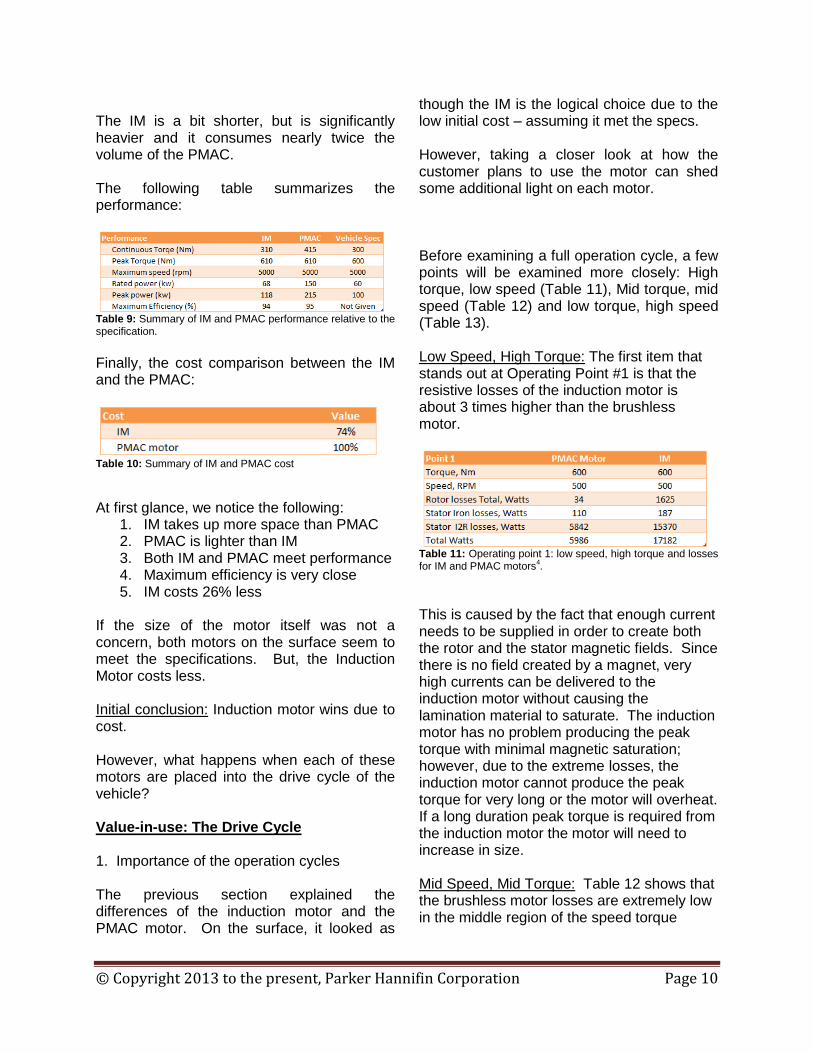
though the IM is the logical choice due to the low initial cost – assuming it met the specs. However, taking a closer look at how the customer plans to use the motor can shed some additional light on each motor. Before examining a full operation cycle, a few points will be examined more closely: High torque, low speed (Table 11), Mid torque, mid speed (Table 12) and low torque, high speed (Table 13). Low Speed, High Torque: The first item that stands out at Operating Point #1 is that the resistive losses of the induction motor is about 3 times higher than the brushless motor.
Table 11: Operating point 1: low speed, high torque and losses for IM and PMAC motors
4.
This is caused by the fact that enough current needs to be supplied in order to create both the rotor and the stator magnetic fields. Since there is no field created by a magnet, very high currents can be delivered to the induction motor without causing the lamination material to saturate. The induction motor has no problem producing the peak torque with minimal magnetic saturation; however, due to the extreme losses, the induction motor cannot produce the peak torque for very long or the motor will overheat. If a long duration peak torque is required from the induction motor the motor will need to increase in size. Mid Speed, Mid Torque: Table 12 shows that the brushless motor losses are extremely low in the middle region of the speed torque
© Copyright 2013 to the present, Parker Hannifin Corporation Page 11
curve. This contributes to the motor’s very high efficiency.
Table 12: Operating point 2: Mid speed, mid torque and losses for IM and PMAC motors
4.
This point improves the IM’s efficiency quite substantially. Still, the IM has twice as many losses as the PMAC – and losses mean additional heat that needs to be delivered to the cooling system. High Speed, Low Torque: Table 13 shows where the induction motor shines.
Table 13: Operating point 3: High speed, low torque and losses for IM and PMAC motors
4
At low values of torque and high values of speed the induction motor outperforms the PMAC motor. The very low flux density in both the stator and the rotor will keep the total losses to a minimum at this point. There is one more noteworthy take away from these operating points: rotor losses. The induction motor has significantly higher rotor losses than the PMAC motor – almost 50 times larger in Point #1. Most of these losses from the induction rotor are derived from the resistive losses (I2R) in the copper bars. Little can be done to reduce these losses. The PMAC motor, however, can be designed to have ultra low rotor losses and thus be more efficient at more operating points. These three operation points show that where the motor is operated can significantly impact the losses in the motor and consequently the
heat that must be dissipated by the cooling system. If the vehicle has a battery powering the motor, the losses are an expense that must be examined. These losses directly impact how long the motor can run given a fixed amount of energy in a battery pack. Drive Cycle: Next, the IM and PMAC motor FEA models were used to simulate the performance of a full electric vehicle. The magnetic FEA tool was used to determine the torque produced by the motor and the magnetic losses experienced by each motor at each point in time. Interpolation between FEA solutions was performed between torque and speed operating points that were close to each other in order to reduce the calculation time. Three different drive cycles were examined: “City”, “Rural”, and “Highway”. These three different drive cycles were based on data collected from three real life driving scenarios. The drive cycles are set such that either the IM or PMAC motor can execute the cycle. Also the vehicle is simulated with a single-speed fixed ratio transmission. Table 14 outlines the vehicle data used:
Table 14: Vehicle data for a Class 2 or 3 delivery van
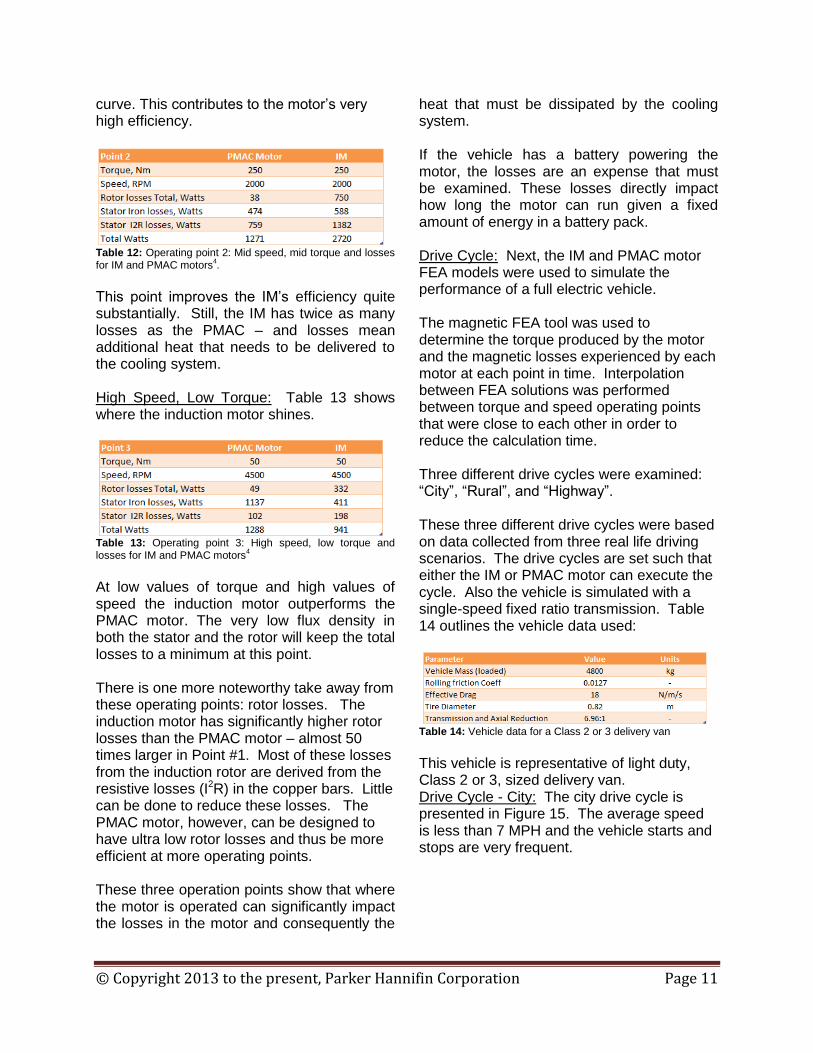
This vehicle is representative of light duty, Class 2 or 3, sized delivery van. Drive Cycle - City: The city drive cycle is presented in Figure 15. The average speed is less than 7 MPH and the vehicle starts and stops are very frequent.
© Copyright 2013 to the present, Parker Hannifin Corporation Page 12
Figure 15: City drive cycle. (Graph source: Parker Hannifin)
This is typical of city driving in moderate traffic. For city diving simulations, this 440 second segment is repeated for a duration of one hour. Table 15 contains the result of running the drive cycle for both motor technologies.
Table 15: Losses and battery energy used on 1hr drive using the city cycle data
It was assumed that all kinetic energy of the vehicle was captured and sent to the battery during every speed reduction, minus the motor losses and mechanical losses during regeneration. The values in the table are kW*hr of energy used for every hour of driving. In general, the Induction motor losses consumed 34.6% of the total battery energy, whereas the PMAC motor consumed only 17.3% of the battery energy. The total energy used for the one hour city drive was 27.8% less for the PMAC motor. Or stated another way, the PMAC motor would be able to propel the vehicle ~27% further than the same vehicle on same route with an IM. The biggest detriment to the induction motor is the very high resistive losses in the motor
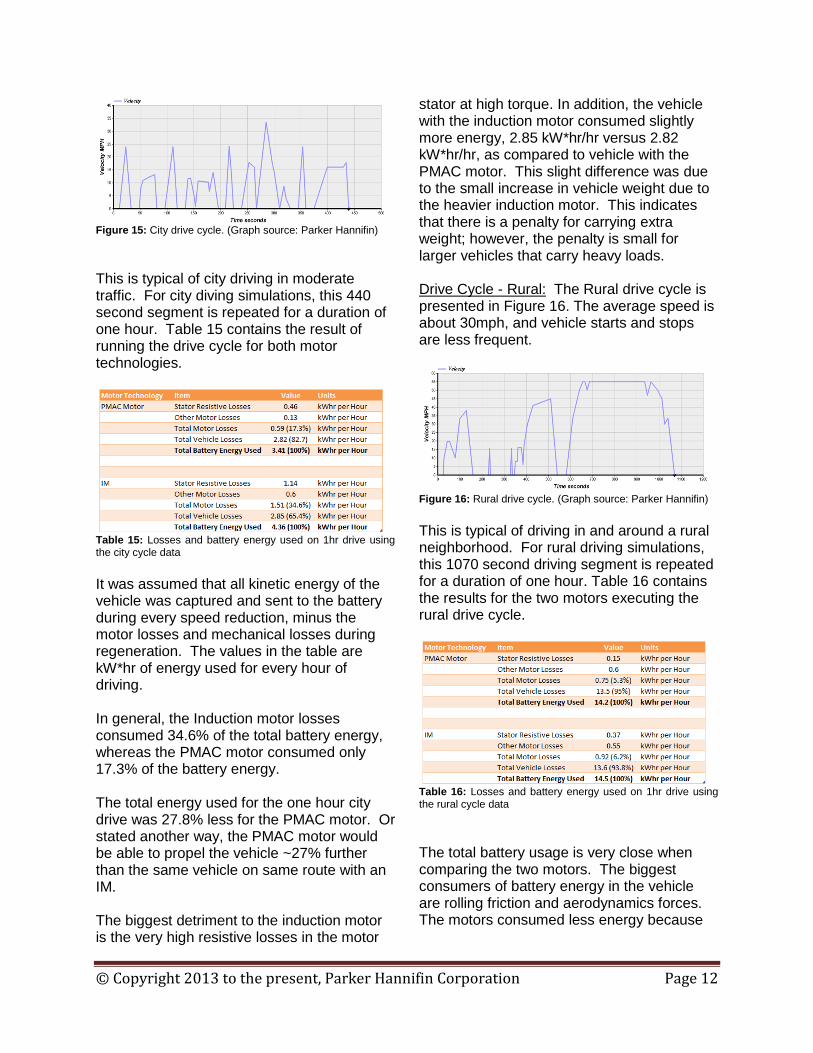
stator at high torque. In addition, the vehicle with the induction motor consumed slightly more energy, 2.85 kW*hr/hr versus 2.82 kW*hr/hr, as compared to vehicle with the PMAC motor. This slight difference was due to the small increase in vehicle weight due to the heavier induction motor. This indicates that there is a penalty for carrying extra weight; however, the penalty is small for larger vehicles that carry heavy loads. Drive Cycle - Rural: The Rural drive cycle is presented in Figure 16. The average speed is about 30mph, and vehicle starts and stops are less frequent.
Figure 16: Rural drive cycle. (Graph source: Parker Hannifin)
This is typical of driving in and around a rural neighborhood. For rural driving simulations, this 1070 second driving segment is repeated for a duration of one hour. Table 16 contains the results for the two motors executing the rural drive cycle.
Table 16: Losses and battery energy used on 1hr drive using the rural cycle data
The total battery usage is very close when comparing the two motors. The biggest consumers of battery energy in the vehicle are rolling friction and aerodynamics forces. The motors consumed less energy because
© Copyright 2013 to the present, Parker Hannifin Corporation Page 13
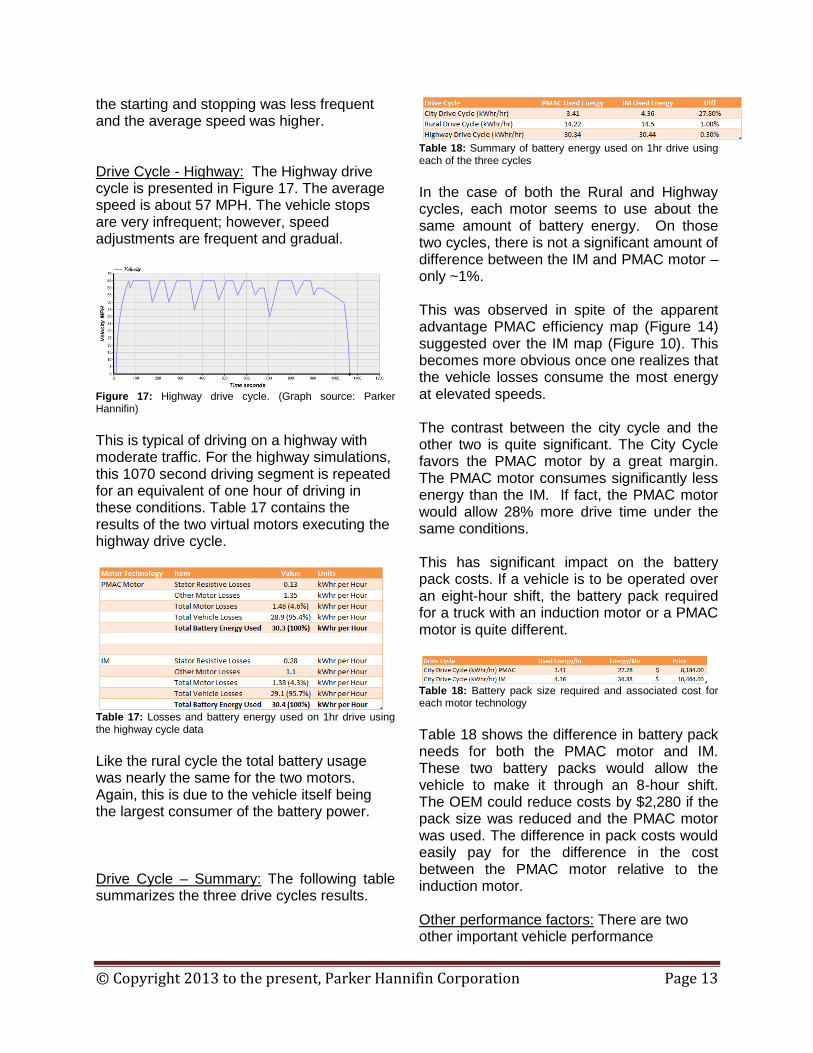
the starting and stopping was less frequent and the average speed was higher. Drive Cycle - Highway: The Highway drive cycle is presented in Figure 17. The average speed is about 57 MPH. The vehicle stops are very infrequent; however, speed adjustments are frequent and gradual.
Figure 17: Highway drive cycle. (Graph source: Parker Hannifin)
This is typical of driving on a highway with moderate traffic. For the highway simulations, this 1070 second driving segment is repeated for an equivalent of one hour of driving in these conditions. Table 17 contains the results of the two virtual motors executing the highway drive cycle.
Table 17: Losses and battery energy used on 1hr drive using the highway cycle data Like the rural cycle the total battery usage was nearly the same for the two motors. Again, this is due to the vehicle itself being the largest consumer of the battery power. Drive Cycle – Summary: The following table summarizes the three drive cycles results.
Table 18: Summary of battery energy used on 1hr drive using each of the three cycles
In the case of both the Rural and Highway cycles, each motor seems to use about the same amount of battery energy. On those two cycles, there is not a significant amount of difference between the IM and PMAC motor – only ~1%. This was observed in spite of the apparent advantage PMAC efficiency map (Figure 14) suggested over the IM map (Figure 10). This becomes more obvious once one realizes that the vehicle losses consume the most energy at elevated speeds. The contrast between the city cycle and the other two is quite significant. The City Cycle favors the PMAC motor by a great margin. The PMAC motor consumes significantly less energy than the IM. If fact, the PMAC motor would allow 28% more drive time under the same conditions. This has significant impact on the battery pack costs. If a vehicle is to be operated over an eight-hour shift, the battery pack required for a truck with an induction motor or a PMAC motor is quite different.
Table 18: Battery pack size required and associated cost for each motor technology
Table 18 shows the difference in battery pack needs for both the PMAC motor and IM. These two battery packs would allow the vehicle to make it through an 8-hour shift. The OEM could reduce costs by $2,280 if the pack size was reduced and the PMAC motor was used. The difference in pack costs would easily pay for the difference in the cost between the PMAC motor relative to the induction motor. Other performance factors: There are two other important vehicle performance
© Copyright 2013 to the present, Parker Hannifin Corporation Page 14
characteristics that need observance, namely the hill climb and the acceleration time to 65 mph. Table 19 contains the results of a simulation of the two motors driving the vehicle up a sustained 7% grade (4 degrees).
Table 19: Vehicle performance ascending a 7% grade.
The PMAC motor was able to move the vehicle at the full speed of 65 MPH on the 7% grade. The simulation indicated that the water cooled stator of the brushless motor would stabilize at 129 oC, indicating that the motor would not over heat. The induction motor was only able to obtain 32 mph, due to a power limit, that was caused by the motor voltage reaching 600 VDC. The induction motor also reached a stable stator temperature of 146 oC. The lack of top speed in the hill climb would have a substantial effect on drive appeal. There are changes that could be made to the induction motor that could improve the performance of the induction motor in the hill climb simulation; however, the changes would either be at the expense of motor weight, efficiency, or peak torque.
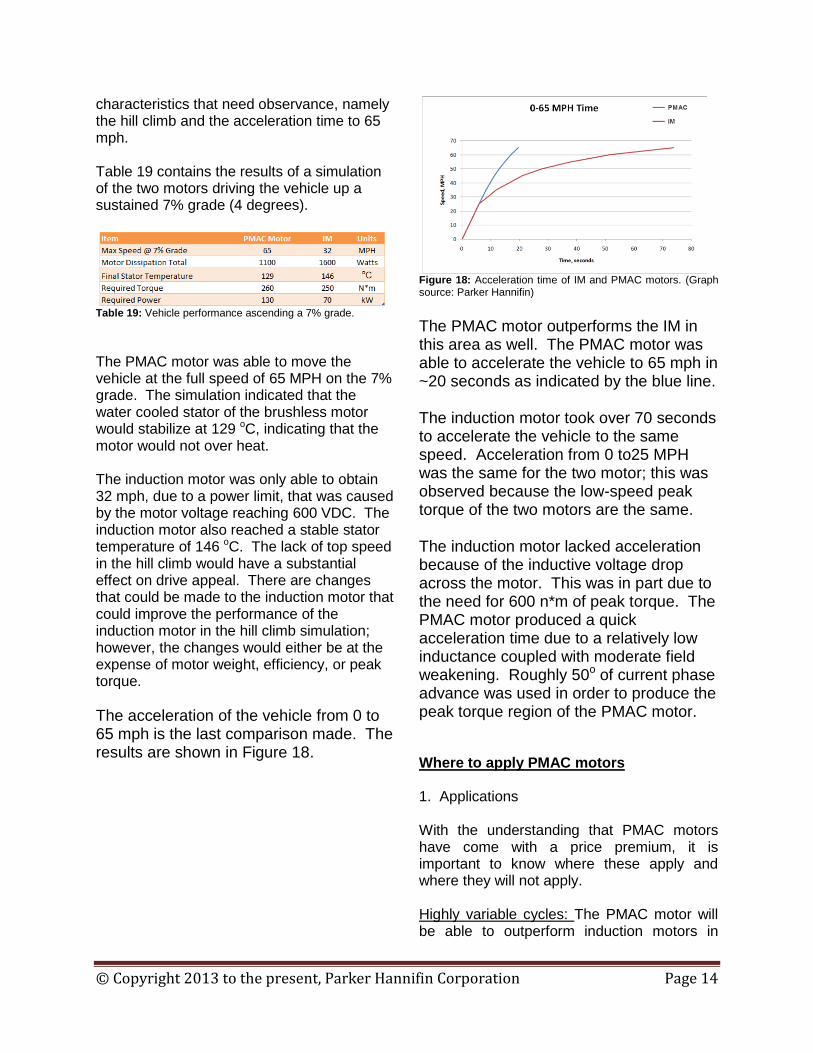
The acceleration of the vehicle from 0 to 65 mph is the last comparison made. The results are shown in Figure 18.
Figure 18: Acceleration time of IM and PMAC motors. (Graph source: Parker Hannifin)
The PMAC motor outperforms the IM in this area as well. The PMAC motor was able to accelerate the vehicle to 65 mph in ~20 seconds as indicated by the blue line. The induction motor took over 70 seconds to accelerate the vehicle to the same speed. Acceleration from 0 to25 MPH was the same for the two motor; this was observed because the low-speed peak torque of the two motors are the same. The induction motor lacked acceleration because of the inductive voltage drop across the motor. This was in part due to the need for 600 n*m of peak torque. The PMAC motor produced a quick acceleration time due to a relatively low inductance coupled with moderate field weakening. Roughly 50o of current phase advance was used in order to produce the peak torque region of the PMAC motor. Where to apply PMAC motors 1. Applications With the understanding that PMAC motors have come with a price premium, it is important to know where these apply and where they will not apply. Highly variable cycles: The PMAC motor will be able to outperform induction motors in
© Copyright 2013 to the present, Parker Hannifin Corporation Page 15
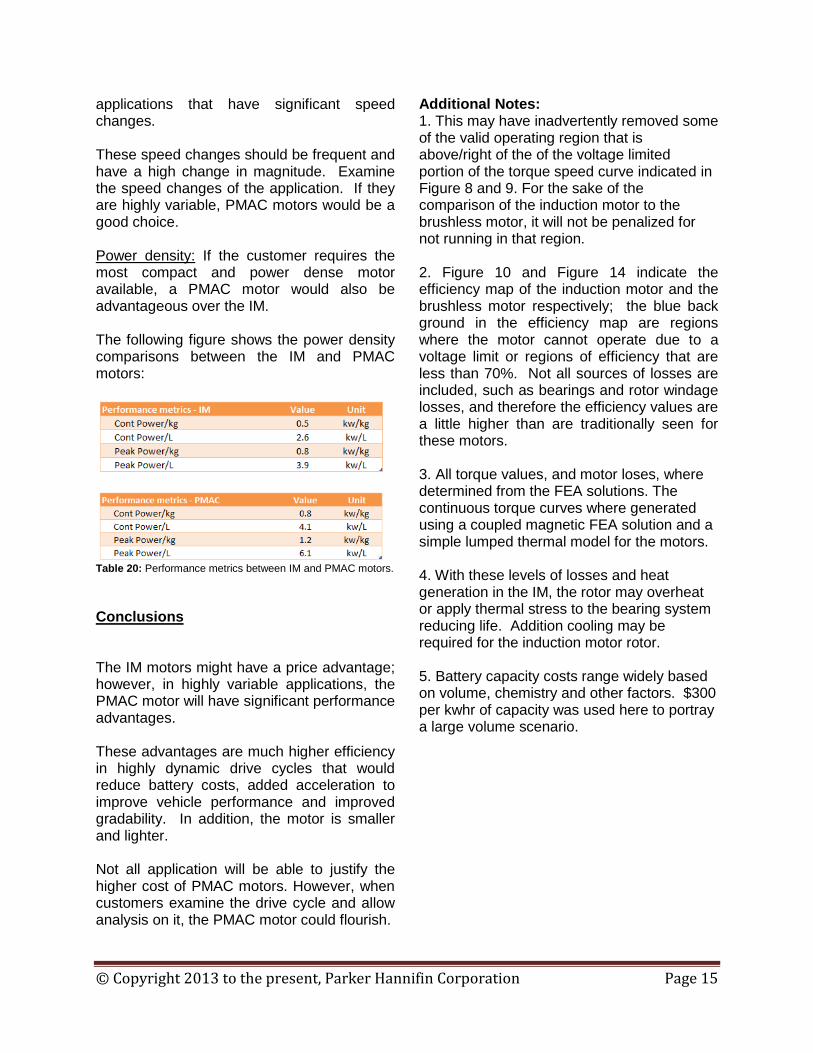
applications that have significant speed changes. These speed changes should be frequent and have a high change in magnitude. Examine the speed changes of the application. If they are highly variable, PMAC motors would be a good choice. Power density: If the customer requires the most compact and power dense motor available, a PMAC motor would also be advantageous over the IM. The following figure shows the power density comparisons between the IM and PMAC motors:
Table 20: Performance metrics between IM and PMAC motors.
Conclusions The IM motors might have a price advantage; however, in highly variable applications, the PMAC motor will have significant performance advantages. These advantages are much higher efficiency in highly dynamic drive cycles that would reduce battery costs, added acceleration to improve vehicle performance and improved gradability. In addition, the motor is smaller and lighter. Not all application will be able to justify the higher cost of PMAC motors. However, when customers examine the drive cycle and allow analysis on it, the PMAC motor could flourish.
Additional Notes: 1. This may have inadvertently removed some of the valid operating region that is above/right of the of the voltage limited portion of the torque speed curve indicated in Figure 8 and 9. For the sake of the comparison of the induction motor to the brushless motor, it will not be penalized for not running in that region. 2. Figure 10 and Figure 14 indicate the efficiency map of the induction motor and the brushless motor respectively; the blue back ground in the efficiency map are regions where the motor cannot operate due to a voltage limit or regions of efficiency that are less than 70%. Not all sources of losses are included, such as bearings and rotor windage losses, and therefore the efficiency values are a little higher than are traditionally seen for these motors. 3. All torque values, and motor loses, where determined from the FEA solutions. The continuous torque curves where generated using a coupled magnetic FEA solution and a simple lumped thermal model for the motors. 4. With these levels of losses and heat generation in the IM, the rotor may overheat or apply thermal stress to the bearing system reducing life. Addition cooling may be required for the induction motor rotor. 5. Battery capacity costs range widely based on volume, chemistry and other factors. $300 per kwhr of capacity was used here to portray a large volume scenario.