comparative study on market share of coca-cola and pepsico
TRANSCRIPT
Summer Training Report
On
“Comparative Study on Market Share of Coca-Cola and Pepsico
With Special Reference to Retailers of Amritsar city”
Submitted To
Punjab Technical University, Jalandhar.
In Partial Fulfilment of the Requirements for the Award of
Degree of Master of Business Administration
Supervised by: Submitted by: Shelly Harish Kalia
(Assistant Professor) Univ. Roll no. 90342233630
GLOBAL INSTITUTE OF MANAGEMENT AND
EMERGING TECHNOLOGIES, AMRITSAR
(2009 – 2011)
2
CERTIFICATE
This is to certify that the project report titled “Comparative study On Market Share
Of Coca-cola and Pepsico with special reference to retailers of Amritsar City”
being submitted by Mr. Harish kalia to the faculty of Global Institute of Management
And Emerging Technologies, Amritsar for the award of the degree of MBA is bonafide
piece of research work carried out by him under my guidance. This project report has
not been submitted in part or in full to any other university or institution for the award
of a degree. The project report is fit to be considered for the award of MBA degree.
Date: Shelly
(Assistant Professor)
3
DECLARATION
It is certified that the project titled “Comparative study on Market Share of Coca-
cola and Pepsico with special reference to retailers of Amritsar city” submitted by
me is entirely my own and all ideas and references have been duly acknowledged.
Date: Harish Kalia
Univ. Roll no. 90342233630
4
ACKNOWLEDGEMENT
The work on this project has given me immense knowledge and exposure to the
upcoming trends in the beverage industry. After 9 months of gaining knowledge at
Global Institute, I am able to provide better justice to my project. The work on this
project is being definitely conducted by me but the project work bears the imprints of
the roles of many people, without whose valuable inputs, guidelines and suggestion
this report would not have seen the light of day.
First of all I would like to thank my project guide Ms. Shelly who kindled my path
towards the completion of research project I offer appreciation to my parents and all
my friends for their ever-willing cooperation and moral support.
Coca cola is an ideal company for me and the project would be incomplete without
mentioning the indispensable support and cooperation given to me by the official staff
of Coca cola depot in providing my relevant and worthwhile information. The time
spent with them while gaining primary information will always be memorable to me
as it is duty to thank them profusely because of their indispensable inputs without
which my project report would hold no meaning.
And at last but not the least, I thank the Almighty who is always with me.
- Harish kalia
5
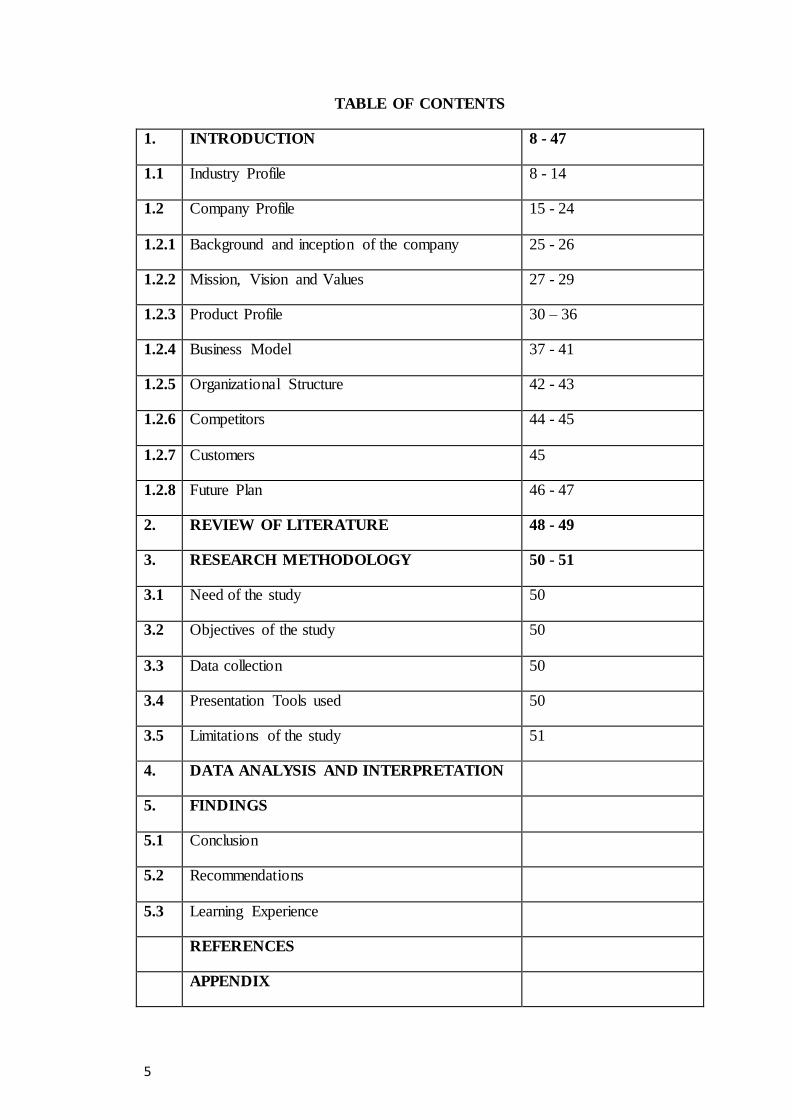
TABLE OF CONTENTS
1. INTRODUCTION 8 - 47
1.1 Industry Profile 8 - 14
1.2 Company Profile 15 - 24
1.2.1 Background and inception of the company 25 - 26
1.2.2 Mission, Vision and Values 27 - 29
1.2.3 Product Profile 30 – 36
1.2.4 Business Model 37 - 41
1.2.5 Organizational Structure 42 - 43
1.2.6 Competitors 44 - 45
1.2.7 Customers 45
1.2.8 Future Plan 46 - 47
2. REVIEW OF LITERATURE 48 - 49
3. RESEARCH METHODOLOGY 50 - 51
3.1 Need of the study 50
3.2 Objectives of the study 50
3.3 Data collection 50
3.4 Presentation Tools used 50
3.5 Limitations of the study 51
4. DATA ANALYSIS AND INTERPRETATION
5. FINDINGS
5.1 Conclusion
5.2 Recommendations
5.3 Learning Experience
REFERENCES
APPENDIX
6
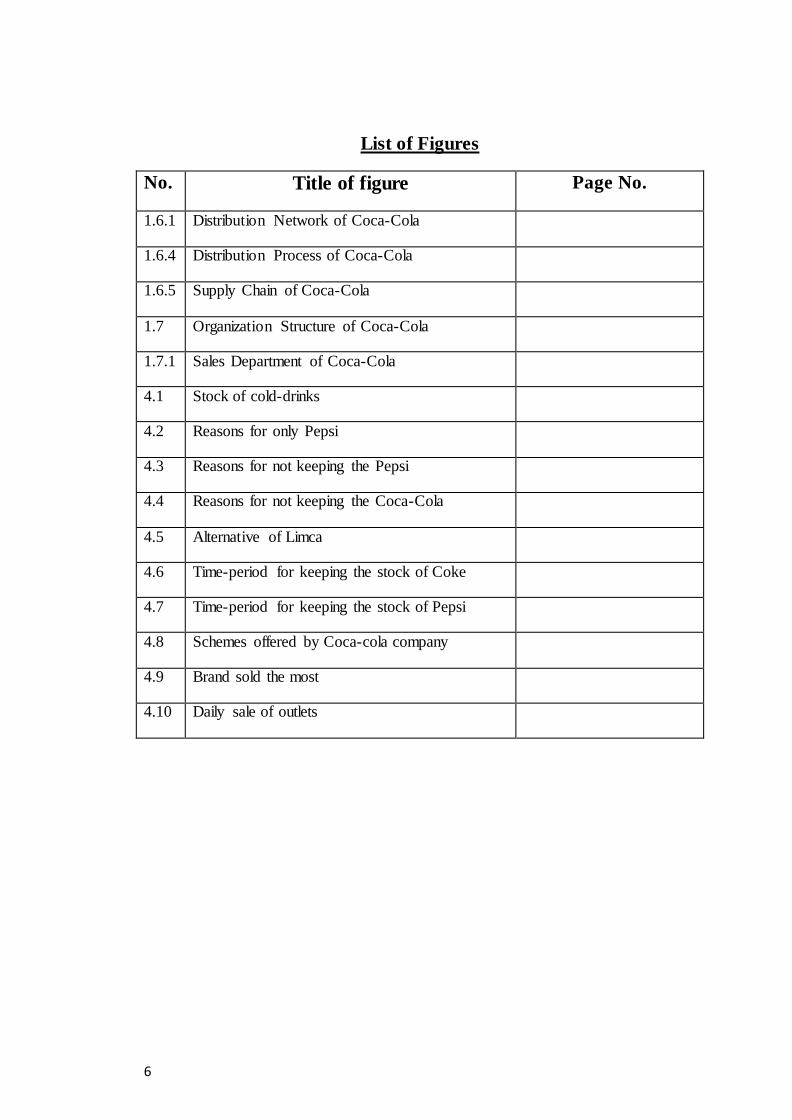
List of Figures
No. Title of figure Page No.
1.6.1 Distribution Network of Coca-Cola
1.6.4 Distribution Process of Coca-Cola
1.6.5 Supply Chain of Coca-Cola
1.7 Organization Structure of Coca-Cola
1.7.1 Sales Department of Coca-Cola
4.1 Stock of cold-drinks
4.2 Reasons for only Pepsi
4.3 Reasons for not keeping the Pepsi
4.4 Reasons for not keeping the Coca-Cola
4.5 Alternative of Limca
4.6 Time-period for keeping the stock of Coke
4.7 Time-period for keeping the stock of Pepsi
4.8 Schemes offered by Coca-cola company
4.9 Brand sold the most
4.10 Daily sale of outlets
7
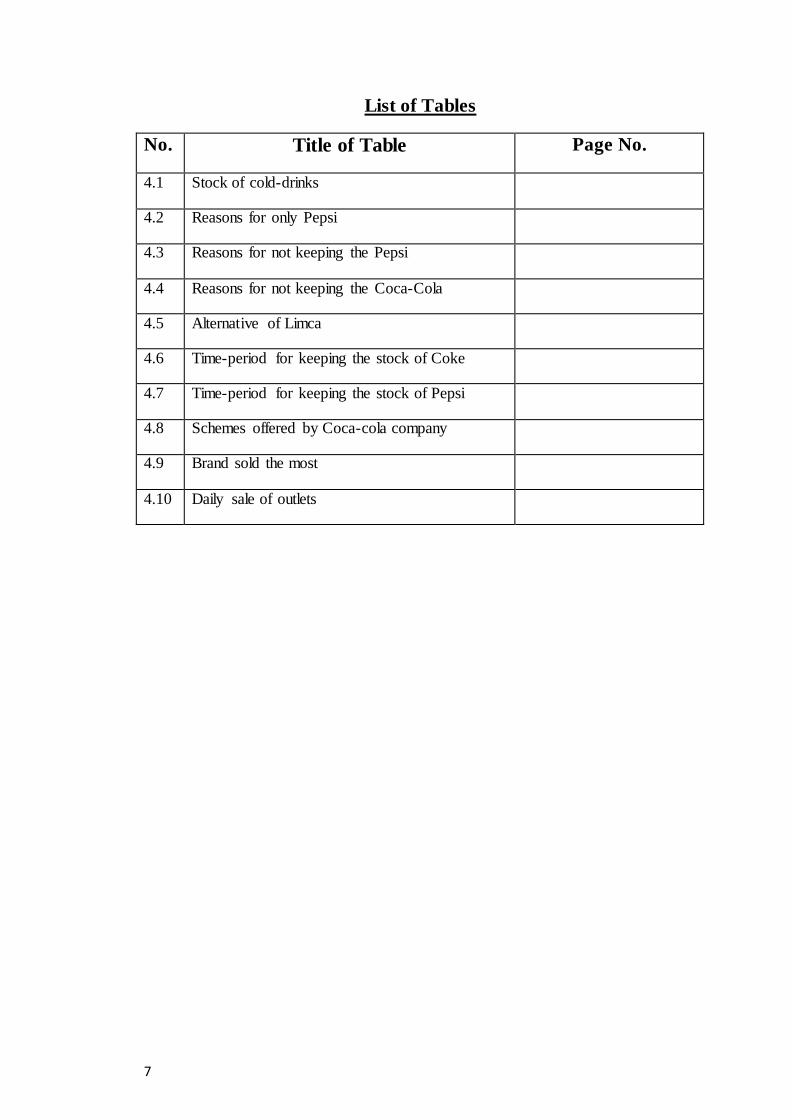
List of Tables
No. Title of Table Page No.
4.1 Stock of cold-drinks
4.2 Reasons for only Pepsi
4.3 Reasons for not keeping the Pepsi
4.4 Reasons for not keeping the Coca-Cola
4.5 Alternative of Limca
4.6 Time-period for keeping the stock of Coke
4.7 Time-period for keeping the stock of Pepsi
4.8 Schemes offered by Coca-cola company
4.9 Brand sold the most
4.10 Daily sale of outlets
8
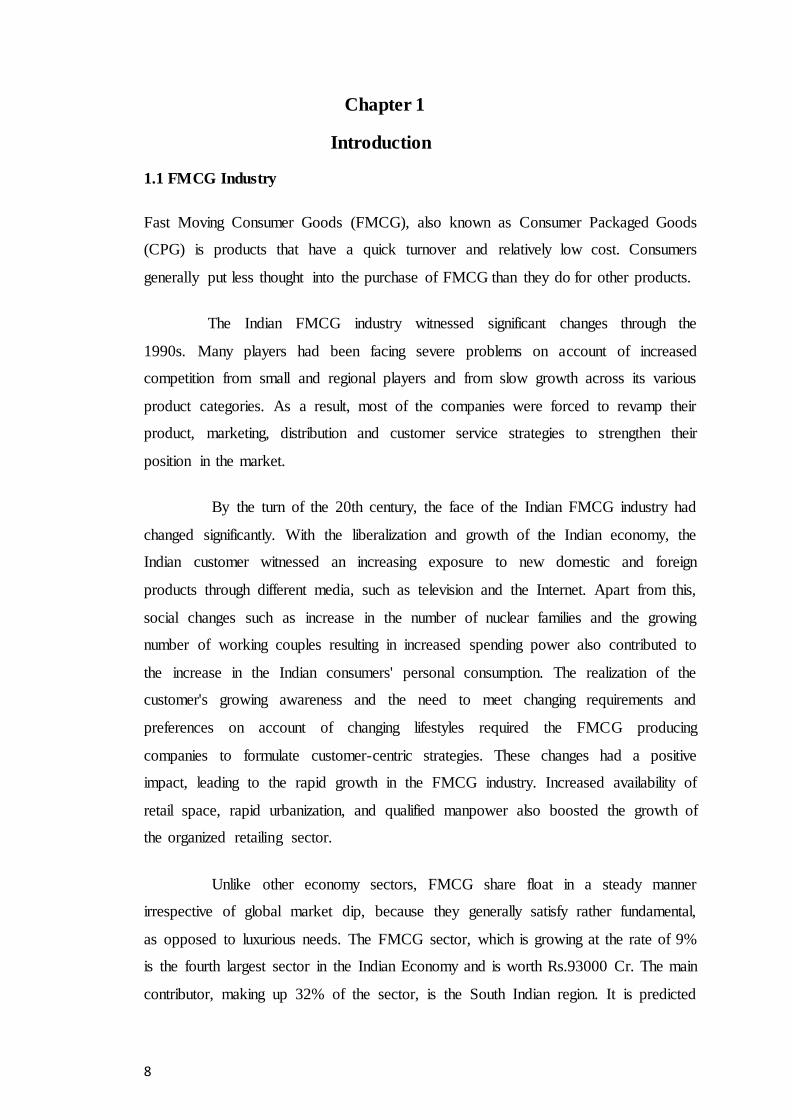
Chapter 1
Introduction
1.1 FMCG Industry
Fast Moving Consumer Goods (FMCG), also known as Consumer Packaged Goods
(CPG) is products that have a quick turnover and relatively low cost. Consumers
generally put less thought into the purchase of FMCG than they do for other products.
The Indian FMCG industry witnessed significant changes through the
1990s. Many players had been facing severe problems on account of increased
competition from small and regional players and from slow growth across its various
product categories. As a result, most of the companies were forced to revamp their
product, marketing, distribution and customer service strategies to strengthen their
position in the market.
By the turn of the 20th century, the face of the Indian FMCG industry had
changed significantly. With the liberalization and growth of the Indian economy, the
Indian customer witnessed an increasing exposure to new domestic and foreign
products through different media, such as television and the Internet. Apart from this,
social changes such as increase in the number of nuclear families and the growing
number of working couples resulting in increased spending power also contributed to
the increase in the Indian consumers' personal consumption. The realization of the
customer's growing awareness and the need to meet changing requirements and
preferences on account of changing lifestyles required the FMCG producing
companies to formulate customer-centric strategies. These changes had a positive
impact, leading to the rapid growth in the FMCG industry. Increased availability of
retail space, rapid urbanization, and qualified manpower also boosted the growth of
the organized retailing sector.
Unlike other economy sectors, FMCG share float in a steady manner
irrespective of global market dip, because they generally satisfy rather fundamental,
as opposed to luxurious needs. The FMCG sector, which is growing at the rate of 9%
is the fourth largest sector in the Indian Economy and is worth Rs.93000 Cr. The main
contributor, making up 32% of the sector, is the South Indian region. It is predicted
9
that in the year 2010, the FMCG sector will be worth Rs.143000 Cr. The sector being
one of the biggest sectors of the Indian Economy provides up to 4 million jobs.
The FMCG sector consists of the following categories:
Personal Care- Oral care, Hair care, Wash (Soaps), Cosmetics and Toiletries,
Deodorants and Perfumes, Paper products (Tissues, Diapers, Sanitary
products) and Shoe care; the major players being; Hindustan Lever Limited,
Godrej Soaps, Colgate, Marico, Dabur and Procter and Gamble.
Household Care- Fabric wash (Laundry soaps and synthetic detergents),
Household cleaners (Dish/Utensil/Floor/Toilet cleaners), Air fresheners,
Insecticides and Mosquito repellents, Metal polish and Furniture polish; the
major players being; Hindustan Lever Limited, Nirma and Ricket Colman.
Branded and Packaged foods and beverages- Health beverages, Soft drinks,
Staples/Cereals, Bakery products (Biscuits, Breads, Cakes), Snack foods,
Chocolates, Ice-creams, Tea, Coffee, Processed fruits, Processed vegetables,
Processed meat, Branded flour, Bottled water, Branded rice, Branded sugar,
Juices; the major players being; Hindustan Lever Limited, Nestle, Coca-Cola,
Cadbury, Pepsi and Dabur
Spirits and Tobacco; the major players being; ITC, Godfrey, Philips and UB
1.1.1 BEVERAGE
Any type of liquid specifically prepared for human consumption.
Beverages in addition to basic need form part of the culture of human
society. Different types of beverages are as follow:
Water
Despite the fact that most beverages, including juice, soft drinks, and
carbonated drinks, have some form of water in them; water itself is often
not classified as a beverage, and the word beverage has been recurrently
defined as not referring to water but the bottled water that is processed
10
through proper filtration and purification comes under the beverage
category.
ALCOHOLIC BEVERAGES
An alcoholic beverage is a drink containing ethanol, commonly known
as alcohol, although in chemistry the definition of an alcohol includes
many other compounds. Ethanol (alcohol) is a psychoactive drug that
has a depressant effect.
ALCOHOLIC BEVERAGES are divided into three general classes:
1. Beers: The two main types of beer are ale and lager; each type has a
distinct production processes. Mass-produced beer is typically aged for
only a week or two after its fermentation and has an alcohol content of
4%–6% ABV. Other kinds of beer may be fermented and aged for
several months.
2. Wines: Wine involves a longer (complete) fermentation process and a
long aging process (months or years) that results in an alcohol content
of 9%–16% ABV. Sparkling wine can be made by adding a small
amount of sugar before bottling, which causes a secondary fermentation
to occur in the bottle.
3. Spirits: Unsweetened, distilled, alcoholic beverages that have an
alcohol content of at least 20% ABV are called spirits. Spirits are
produced by distillation of a fermented product; this process
concentrates the alcohol and eliminates some of the congeners.
NON-ALCOHOL BEVERAGES
A non-alcoholic beverage is a beverage that contains no
alcohol. Non-alcoholic mixed drinks (including punches, "virgin
cocktails", or "mock tails") are often consumed by children; people
whom wishing to enjoy flavourful drinks without alcohol. Non-alcoholic
beverages contain no more than .5 percent alcohol by volume. It also
includes drinks that have undergone an alcohol removal process such as
non-alcoholic beers and de-alcoholised wines.
11
- Non-alcoholic variants:
Low Alcohol Beer
- Non-Alcoholic Wines
Sparkling Ciders
SOFT DRINKS
A soft drink is a beverage that does not contain alcohol. The name "soft
drink" specifies a lack of alcohol by way of contrast to the term "hard
drink". The term "drink", while nominally neutral, sometimes carries
connotations of alcoholic content. Beverages like colas, flavoured water,
sparkling water, iced tea, lemonade, squash, and fruit punch are among
the most common types of soft drinks. Many carbonated soft drinks are
optionally available in versions sweetened with sugars or with non-
caloric sweeteners.
HOT BEVERAGES
- Coffee-based beverages : Cappuccino, Coffee Espresso, Café au lait,
Frappe, Flavoured coffees (mocha etc)
- Hot chocolate : It is a heated beverage that typically consists of shaved
chocolate or cocoa powder, heated milk or water, and sugar.
- Hot cider : It is an alcoholic beverage usually made from the fermented
juice of apples, although pears are also used. In the United
Kingdom, pear cider, which has no apple content, is known as Perry.
- Tea : based beverages: Tea, Green Tea, Flavoured Tea, Pearl Milk Tea
- Herbal teas : An herbal tea, tisane, or ptisan is an herbal infusion made
from anything other than the leaves of the tea bush (Camellia sinensis).
Originated from both China and Middle East
OTHERS
Some substances may either be called food or drink, or
accordingly be eaten with a spoon or drunk, depending on solid
ingredients in it and on how thick it is, and on preference:
- Soups: Soup is a food that is made by combining ingredients such as meat
and vegetables in stock or hot/boiling water, until the flavour is extracted,
12
forming a broth.
- Yoghurt: yoghurt is a dairy product produced by bacterial fermentation
of milk. Fermentation of the milk sugar produces lactic acid, which acts
on milk protein to give yoghurt its texture and its characteristic tang. Soy
yoghurt, a dairy yoghurt alternative, is made from soymilk.
- Buttermilk: It is a fermented dairy product produced from cows' milk
with a characteristically sour taste. The product is made in one of two
ways. Originally, buttermilk was the liquid left over from churning butter
from cream. In India, buttermilk, widely known as "chaas" is known to be
the liquid leftover after extracting butter from churned curd.
SOFT DRINKS INDUSTRY IN INDIA
Soft drinks can trace their history back to the mineral water found in
natural springs. Bathing in natural springs has long been considered a healthy thing to
do; and mineral water was said to have curative powers. Scientists soon discovered
that gas carbonium or carbon dioxide was behind the bubbles in natural mineral water.
The first marketed soft drinks (non-carbonated) appeared in the 17th
century. They were made from water and lemon juice sweetened with honey. In 1676,
the Compagnie de Limonadiers of Paris were granted a monopoly for the sale of
lemonade soft drinks. Vendors would carry tanks of lemonade on their backs and
dispensed cups of the soft drink to thirsty Parisians.
Euromonitor International's Soft Drinks in India market report offers a
comprehensive guide to the size and shape of the market at a national level. It
provides the latest retail sales data, allowing you to identify the sectors driving
growth. It identifies the leading companies, the leading brands and offers strategic
analysis of key factors influencing the market - be they new product developments,
packaging innovations, economic/lifestyle influences, distribution or pricing issues.
Forecasts illustrate how the market is set to change. Buy online to access strategic
market analysis and an interactive statistical database of volume and value market
sizes including on-trade and off-trade, company and brand shares, distribution and
pricing data.
13
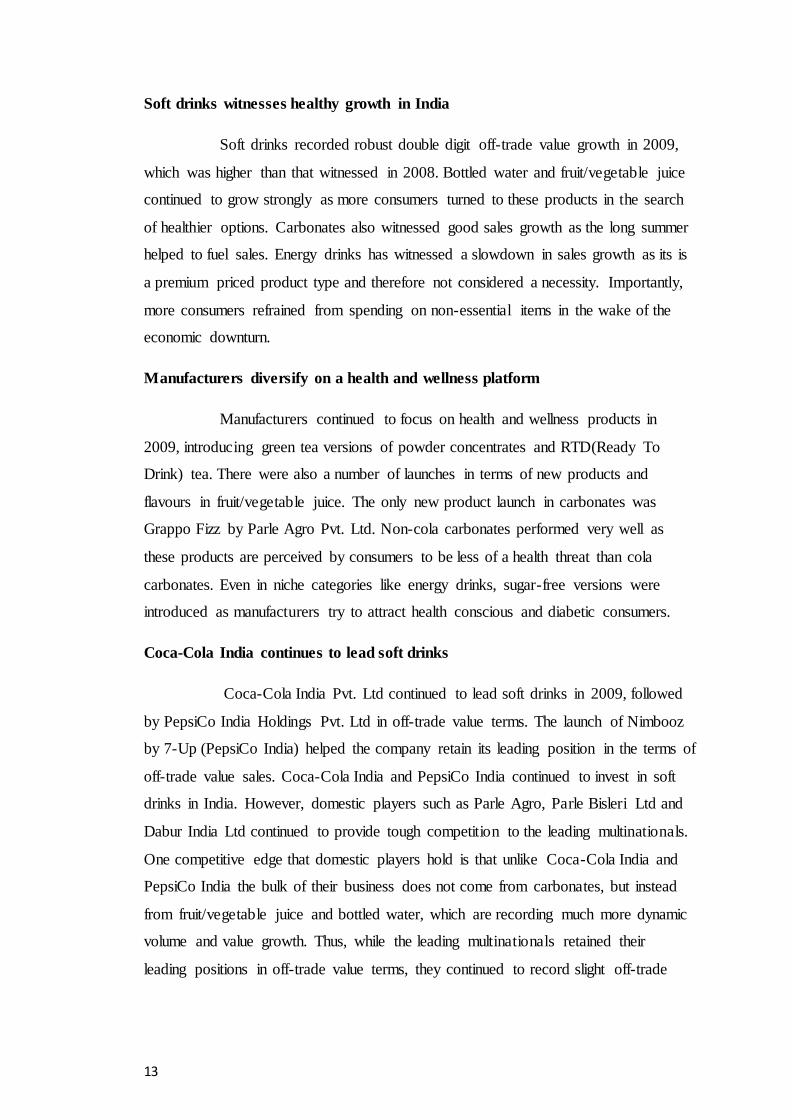
Soft drinks witnesses healthy growth in India
Soft drinks recorded robust double digit off-trade value growth in 2009,
which was higher than that witnessed in 2008. Bottled water and fruit/vegetable juice
continued to grow strongly as more consumers turned to these products in the search
of healthier options. Carbonates also witnessed good sales growth as the long summer
helped to fuel sales. Energy drinks has witnessed a slowdown in sales growth as its is
a premium priced product type and therefore not considered a necessity. Importantly,
more consumers refrained from spending on non-essential items in the wake of the
economic downturn.
Manufacturers diversify on a health and wellness platform
Manufacturers continued to focus on health and wellness products in
2009, introducing green tea versions of powder concentrates and RTD(Ready To
Drink) tea. There were also a number of launches in terms of new products and
flavours in fruit/vegetable juice. The only new product launch in carbonates was
Grappo Fizz by Parle Agro Pvt. Ltd. Non-cola carbonates performed very well as
these products are perceived by consumers to be less of a health threat than cola
carbonates. Even in niche categories like energy drinks, sugar-free versions were
introduced as manufacturers try to attract health conscious and diabetic consumers.
Coca-Cola India continues to lead soft drinks
Coca-Cola India Pvt. Ltd continued to lead soft drinks in 2009, followed
by PepsiCo India Holdings Pvt. Ltd in off-trade value terms. The launch of Nimbooz
by 7-Up (PepsiCo India) helped the company retain its leading position in the terms of
off-trade value sales. Coca-Cola India and PepsiCo India continued to invest in soft
drinks in India. However, domestic players such as Parle Agro, Parle Bisleri Ltd and
Dabur India Ltd continued to provide tough competition to the leading multinationals.
One competitive edge that domestic players hold is that unlike Coca-Cola India and
PepsiCo India the bulk of their business does not come from carbonates, but instead
from fruit/vegetable juice and bottled water, which are recording much more dynamic
volume and value growth. Thus, while the leading multinationals retained their
leading positions in off-trade value terms, they continued to record slight off-trade
14
value share reductions in 2009, while these leading domestic players grew their
shares.
Marginal slowdown in supermarkets/hypermarkets
The growth in supermarkets/hypermarkets boosted the soft drinks
industry over much of the review period. However, due to the economic downturn,
the off-trade volume share of supermarkets/hypermarkets decreased in 2009. This in
turn affected some of the more niche and premium product types like energy drinks
and reconstituted 100% juice which enjoyed high visibility through this distribution
channels. However, this trend is not expected to continue as the economy recovers
since consumers will revert to their previous shopping patterns.
Soft drinks is expected to record healthy sales growth in the forecast period
Soft drinks is expected to witness a healthy double-digit total volume
CAGR growth over the forecast period. As consumer awareness and understanding of
the variety of soft drinks increases and as manufacturers continue to be innovative,
soft drinks is expected to perform well. Products on the health and wellness platform
and niche categories can expect to see good sales growth in the forecast period.
15
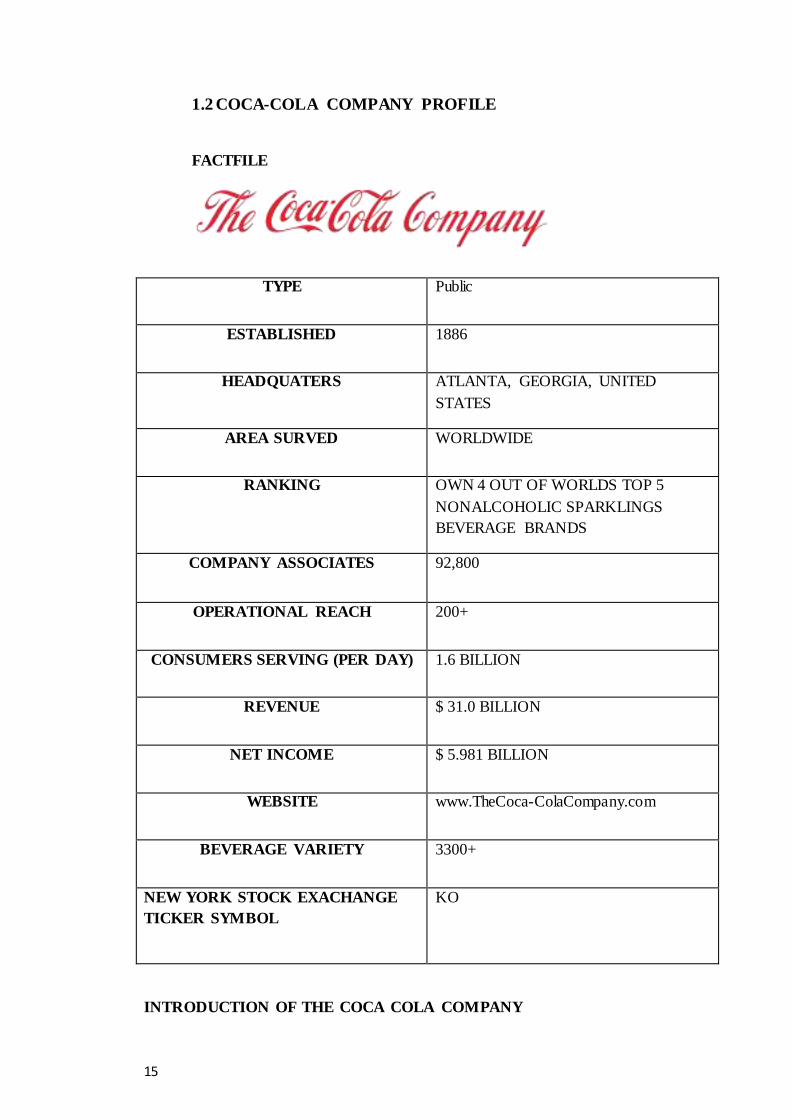
1.2 COCA-COLA COMPANY PROFILE
FACTFILE
TYPE Public
ESTABLISHED 1886
HEADQUATERS ATLANTA, GEORGIA, UNITED
STATES
AREA SURVED WORLDWIDE
RANKING OWN 4 OUT OF WORLDS TOP 5
NONALCOHOLIC SPARKLINGS
BEVERAGE BRANDS
COMPANY ASSOCIATES 92,800
OPERATIONAL REACH 200+
CONSUMERS SERVING (PER DAY) 1.6 BILLION
REVENUE $ 31.0 BILLION
NET INCOME $ 5.981 BILLION
WEBSITE www.TheCoca-ColaCompany.com
BEVERAGE VARIETY 3300+
NEW YORK STOCK EXACHANGE
TICKER SYMBOL
KO
INTRODUCTION OF THE COCA COLA COMPANY
16
Coca-Cola touches the lives of millions of people each and everyday
from special occasion to exceptional moments in everyday life, Coca-Cola is there.
The brand has become very special part of people’s life.
There is much in our world to celebrate, refresh, strengthen and protect.
The Coca-Cola Company is a vibrant network of people, in over 200 countries,
putting citizenship into action. Through their actions as local citizens, they strive
everyday to refresh the marketplace, protect the environment and strengthen over
communities.
The Coca-Cola company is on a journey, it is a bold journey, inspired by
their simple desire for sustainable growth of fueled by deep conviction that
collectively can create anything the company desires.
World of coca cola encompasses the rich history and process of the
refreshing beverage that was created here in ATLANTA over 110 years ago. While
coca cola was first served at a small pharmacy soda foundation near underground
Atlanta, soft drink is now being purchased in over 200 countries across the globe. In
fact, it is now severed nearly 1 billion times a day. You might say that when the world
wants refreshment the world turns to Coca-Cola.
World of Coca-Cola capture all the excitement of this world famous
product, not only through its exhibits, but also through its unique architecture style.
Visitors pass under an enormous three-dimensional Coca-Cola globe suspended 18
feet over the entrance, then step in to a three story sky lit atrium from there visitors
move at their own pace through an easy to follow series of fun and fascinating exhibit
galleries.
At the late 1930s Barnes soda jerk will demonstrate how an early Coca-
Cola was prepared. Move ahead into the International Video Lounge and the “Taste of
the world” an international sampler of cold soft drinks distributed by the Coca-Cola
company but not available in U.S.
BELIEFS OF THE COMPANY
17
They're paying attention to what the world wants to drink.
They're proud to say that we market four of the top-five soft drinks in the
world and rank No. 1 in sales of carbonated soft drinks globally. Did you know that
globally we also rank No. 1 in juice and juice drinks, No. 2 in sports drinks and No. 3
in bottled water?
They believe in creating beverages for life.
In the past two years, Coca-cola have expanded our portfolio of beverages
that provide vitamins, nutrients and other beneficial ingredients. Coca-cola now have
more than 400 brands that include nearly 2,400 beverage products.
They believe in preserving and protecting water resources.
18
Protecting and improving access to and the availability of water remains
one of our long-term goals. They partner with many organizations, governments and
local communities to develop and implement sustainable water initiatives around the
world.
They are committed to supporting our communities.
The Coca-Cola system (the Company and our bottling partners) has a
comprehensive HIV/AIDS health care program in Africa, covering nearly 60,000
employees, their spouses and their children. Coca-cola have also reached millions of
people in Africa through our HIV/AIDS community awareness programs
They are a part of local businesses around the world.
19
The Coca-Cola system's customers are the grocers, retailers, street vendors
and store owners who sell our products to our consumers. They have millions of these
partners in the more than 200 countries where we operate.
They have room to grow profitably.
Approximately 50 billion times a day, someone drinks a beverage. Coca-
cola’s beverages are enjoyed more than 1.3 billion of those times. That means there
are over 48 billion beverage choices to capture.
HISTORY OF THE COMPANY
In May, 1886, Coca Cola was invented by Doctor John Pemberton a
pharmacist from Atlanta, Georgia. John Pemberton concocted the Coca Cola formula
in a three legged brass kettle in his backyard. The name was a suggestion given by
John Pemberton's bookkeeper Frank Robinson.
20
John Stith Pemberton
Born January 8, 1831
Georgia
Died August 16, 1888 (aged 57)
Resting place Linwood Cemetery in Columbus, Georgia
Nationality United States
Occupation Druggist
Known for Coca-Cola
The first Coca-Cola recipe was invented in a drugstore in Columbus,
Georgia by John Pemberton, originally as a coca wine called Pemberton’s French
Wine Cola in 1885.He may have been inspired by the formidable success of Vin
Mariani, a European coca wine.
In 1886, when Atlanta and Fulton County passed prohibition legislation,
Pemberton responded by developing Coca-Cola, essentially a non-alcoholic version of
French Wine Cola. The first sales were at Jacob's Pharmacy in Atlanta, Georgia, on
May 8, 1886. It was initially sold as a patent medicine for five cents a glass at soda
fountains, which were popular in the United States at the time due to the belief that
carbonated water was good for the health. Pemberton claimed Coca-Cola cured many
21
diseases, including morphine addiction, dyspepsia, neurasthenia, headache, and
impotence. Pemberton ran the first advertisement for the beverage on May 29 of the
same year in the Atlanta journal.
By 1888, three versions of Coca-Cola—sold by three separate
businesses—were on the market. Asa Griggs Candler acquired a stake in Pemberton's
company in 1887 and incorporated it as the Coca Cola Company in 1888. The same
year, while suffering from an ongoing addiction to morphine, Pemberton sold the
rights a second time to four more businessmen: J.C. Mayfield, A.O. Murphey, C.O.
Mullahy and E.H. Bloodworth. Meanwhile, Pemberton's alcoholic son Charley
Pemberton began selling his own version of the product.
John Pemberton declared that the name "Coca-Cola" belonged to
Charley, but the other two manufacturers could continue to use the formula. So, in the
summer of 1888, Candler sold his beverage under the names Yum Yum and Koke.
After both failed to catch on, Candler set out to establish a legal claim to Coca-Cola in
late 1888, in order to force his two competitors out of the business. Candler purchased
exclusive rights to the formula from John Pemberton, Margaret Dozier and Woolfolk
Walker. However, in 1914, Dozier came forward to claim her signature on the bill of
sale had been forged, and subsequent analysis has indicated John Pemberton's
signature was most likely a forgery as well.
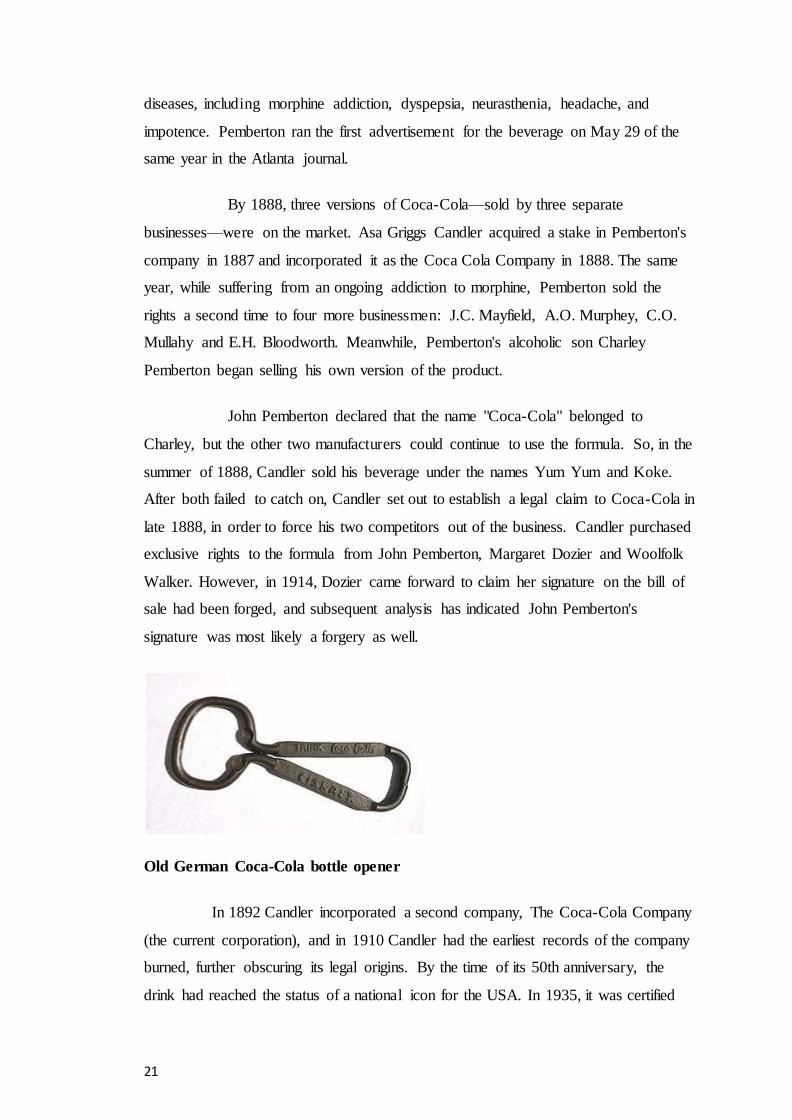
Old German Coca-Cola bottle opener
In 1892 Candler incorporated a second company, The Coca-Cola Company
(the current corporation), and in 1910 Candler had the earliest records of the company
burned, further obscuring its legal origins. By the time of its 50th anniversary, the
drink had reached the status of a national icon for the USA. In 1935, it was certified
22
kosher by Rabbi Tobia Geffen, after the company made minor changes in the sourcing
of some ingredients.
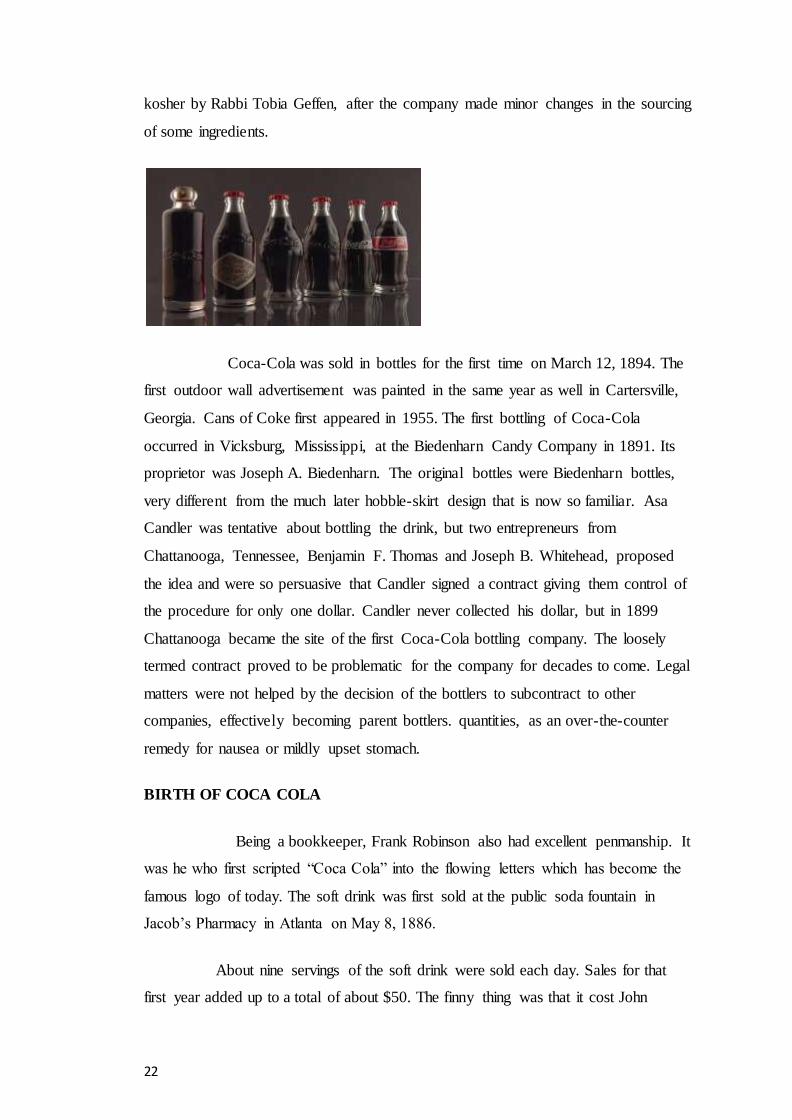
Coca-Cola was sold in bottles for the first time on March 12, 1894. The
first outdoor wall advertisement was painted in the same year as well in Cartersville,
Georgia. Cans of Coke first appeared in 1955. The first bottling of Coca-Cola
occurred in Vicksburg, Mississippi, at the Biedenharn Candy Company in 1891. Its
proprietor was Joseph A. Biedenharn. The original bottles were Biedenharn bottles,
very different from the much later hobble-skirt design that is now so familiar. Asa
Candler was tentative about bottling the drink, but two entrepreneurs from
Chattanooga, Tennessee, Benjamin F. Thomas and Joseph B. Whitehead, proposed
the idea and were so persuasive that Candler signed a contract giving them control of
the procedure for only one dollar. Candler never collected his dollar, but in 1899
Chattanooga became the site of the first Coca-Cola bottling company. The loosely
termed contract proved to be problematic for the company for decades to come. Legal
matters were not helped by the decision of the bottlers to subcontract to other
companies, effectively becoming parent bottlers. quantities, as an over-the-counter
remedy for nausea or mildly upset stomach.
BIRTH OF COCA COLA
Being a bookkeeper, Frank Robinson also had excellent penmanship. It
was he who first scripted “Coca Cola” into the flowing letters which has become the
famous logo of today. The soft drink was first sold at the public soda fountain in
Jacob’s Pharmacy in Atlanta on May 8, 1886.
About nine servings of the soft drink were sold each day. Sales for that
first year added up to a total of about $50. The finny thing was that it cost John
23
Pemberton over $70 in expenses, so the first year of sales were a loss. Until 1905, the
soft drink, marketed as a tonic, contained extracts of cocaine as well as the caffeine
rich kola nut.
ASA CANDLER
In 1887, another Atlanta pharmacist and business, Asa Candler bought the
formula for Coca Cola from inventor John Pemberton for $2,300. by the late 1890s,
Coca Cola was one of America’s most popular fountain drinks, largely due to
Candler’s aggressive marketing of the product. With Asa Candler, now at the helm,
the Coca Cola Company increased syrup sales by over 4000% between 1890 and
1900.
Advertising was an important factor in John Pemberton and Asa Candler’s
success and by the turn of the century, the drink was sold across the United States and
Canada. Around the same time, the company began selling syrup to independent
bottling companies licensed to sell the drink. Even today, the US soft drink industry is
organized on this principle.
DEATH OF SODA FOUNTAIN / RISE OF BOTTLING INDUSTRY
Until the 1960s, both small town and big city dwellers enjoyed
carbonated beverages at the local soda fountain or ice cream saloon. Often housed in
the drug store, the soda fountain counter served as a meeting place for people of all
ages. Often combined with lunch counters, the soda fountain declined in popularity as
commercial ice cream, bottled soft drinks, and fast food restaurants became popular.
COCA-COLA IN 21st CENTURY
On February 7, 2005, the Coca-Cola Company announced that in the
second quarter of 2005 they planned to launch a Diet Coke product sweetened with
the artificial sweetener sucralose ("Splenda"), the same sweetener currently used in
Pepsi One. On March 21, 2005, it announced another diet product, "Coca-Cola Zero",
sweetened partly with a blend of aspartame and acesulfame potassium. Recently
Coca-Cola has begun to sell a new "healthy soda": Diet Coke with vitamins B6, B12,
Magnesium, Niacin, and Zinc, marketed as "Diet Coke Plus."
24
On July 5, 2005, it was revealed that Coca-Cola would resume
operations in Iraq for the first time since the Arab League boycotted the company in
1968.
In April 2007, in Canada, the name "Coca-Cola Classic" was changed
back to "Coca-Cola." The word "Classic" was truncated because "New Coke" was no
longer in production, eliminating the need to differentiate between the two. The
formula remained unchanged.
In January 2009, Coca-Cola stopped printing the word "Classic" on the
labels of 16-ounce bottles sold in parts of the southeastern United States. The change
is part of a larger strategy to rejuvenate the product's image.
THE MEN WHO MADE COCA-COLA
1885 John Pemberton created coca cola
1886 Frank Robinson arrived and instantly devoted all his time to manufacture
and promote the drink.
1887 Asa Candler buys the rights of the secret Coca Cola formula and along with
Charlie Pemberton and wool folk walker files for the incorporation of the
Coca Cola Company
1903 Sam Dabbs takes charge of sales.
1909 Harold Hirsh assumes charge of the legal affairs.
1910 Earl Dean designs and produces the unique “hobble skirt” bottle.
1916 Horward Candler takes over as president.
1917 Archie Lee revolutionizes the Coca-Cola advertising.
1923 Robert Woodruff becomes the president.
1939 Arhur Acklin assumes charge as president
1954 Frank Harrold brings Coca Cola in India.
1955 Bill Robinson is appointed president.
1972 Roberto Goizueta is appointed president.
1994 Dough Lvester is appointed president
1999 Bouglas Daft is appointed president.
1.2.1 BACKGROUND OF COCA-COLA
25
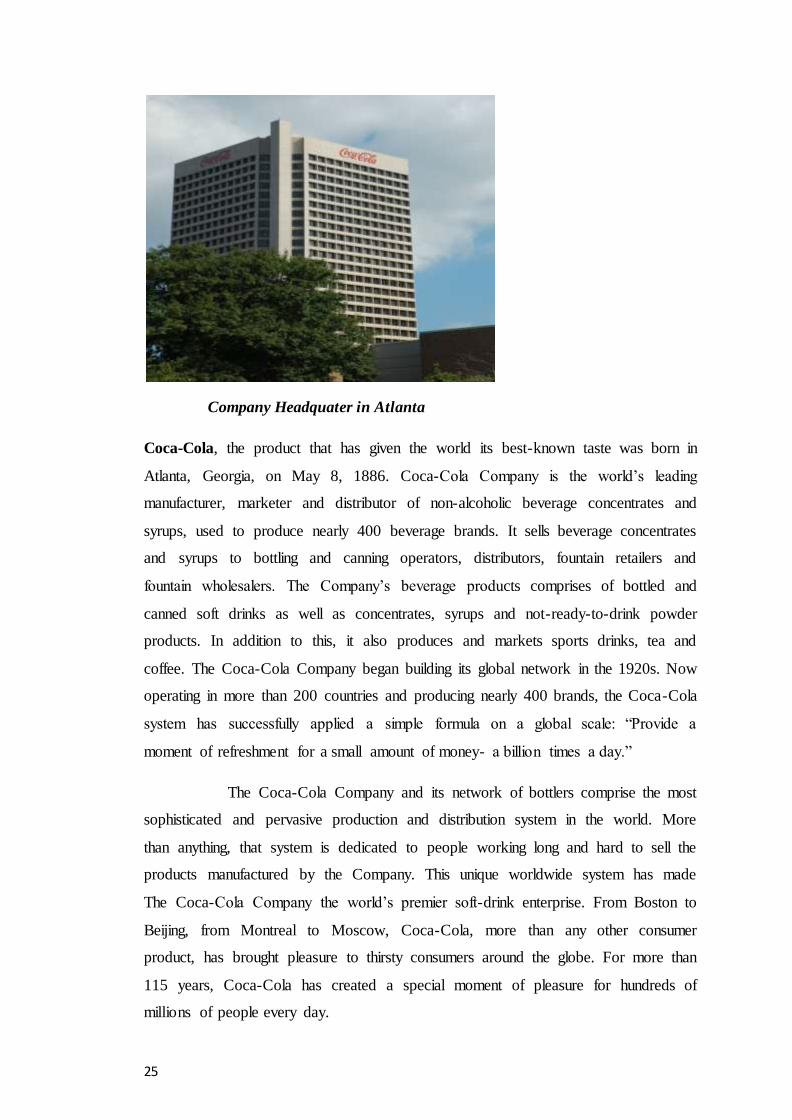
Company Headquater in Atlanta
Coca-Cola, the product that has given the world its best-known taste was born in
Atlanta, Georgia, on May 8, 1886. Coca-Cola Company is the world’s leading
manufacturer, marketer and distributor of non-alcoholic beverage concentrates and
syrups, used to produce nearly 400 beverage brands. It sells beverage concentrates
and syrups to bottling and canning operators, distributors, fountain retailers and
fountain wholesalers. The Company’s beverage products comprises of bottled and
canned soft drinks as well as concentrates, syrups and not-ready-to-drink powder
products. In addition to this, it also produces and markets sports drinks, tea and
coffee. The Coca-Cola Company began building its global network in the 1920s. Now
operating in more than 200 countries and producing nearly 400 brands, the Coca-Cola
system has successfully applied a simple formula on a global scale: “Provide a
moment of refreshment for a small amount of money- a billion times a day.”
The Coca-Cola Company and its network of bottlers comprise the most
sophisticated and pervasive production and distribution system in the world. More
than anything, that system is dedicated to people working long and hard to sell the
products manufactured by the Company. This unique worldwide system has made
The Coca-Cola Company the world’s premier soft-drink enterprise. From Boston to
Beijing, from Montreal to Moscow, Coca-Cola, more than any other consumer
product, has brought pleasure to thirsty consumers around the globe. For more than
115 years, Coca-Cola has created a special moment of pleasure for hundreds of
millions of people every day.
26
The Company aims at increasing shareowner value over time. It
accomplishes this by working with its business partners to deliver satisfaction and
value to consumers through a worldwide system of superior brands and services, thus
increasing brand equity on a global basis. They aim at managing their business well
with people who are strongly committed to the Company values and culture and
providing an appropriately controlled environment, to meet business goals and
objectives. The associates of this Company jointly take responsibility to ensure
compliance with the framework of policies and protect the Company’s assets and
resources whilst limiting business risks.
The biz.system of coca-cola in India directly employs approximately 6,000
people, and indirectly creates employment for many more related industries throw our
wash procurement, supply and distribution system.
There are 2 operations in INDIA
1) COBO: -
Company owns bottling operation.
Company owns bottle.
Comes under HCCBPL. (Hindustan Coca- Cola Beverages Private
Limited).
Contribute 65% in INDIA.
2) FOBO: -
Franchise owns bottling operations.
13 franchise bottlers across INDIA.
Contribute 35% in INDIA.
1.2.2 MISSION, VISION AND VALUE OF COCA-COLA
27
Mission, vision and values outline who we are, what we seek to achieve, and how we
want to achieve it. They provide a clear direction for our Company and help ensure
that we are all working toward the same goals.
1.2.2.1 MISSION
Mission declares our purpose as a company. It serves as the standard against which
we weigh our actions and decisions. It is the foundation of our Manifesto.
To refresh the world in body, mind and spirit.
To inspire moments of optimism through our brands and our actions.
To create value and make a difference everywhere we engage.
1.2.2.2 Vision
Our vision guides every aspect of our business by describing what we need to
accomplish in order to continue achieving sustainable growth.
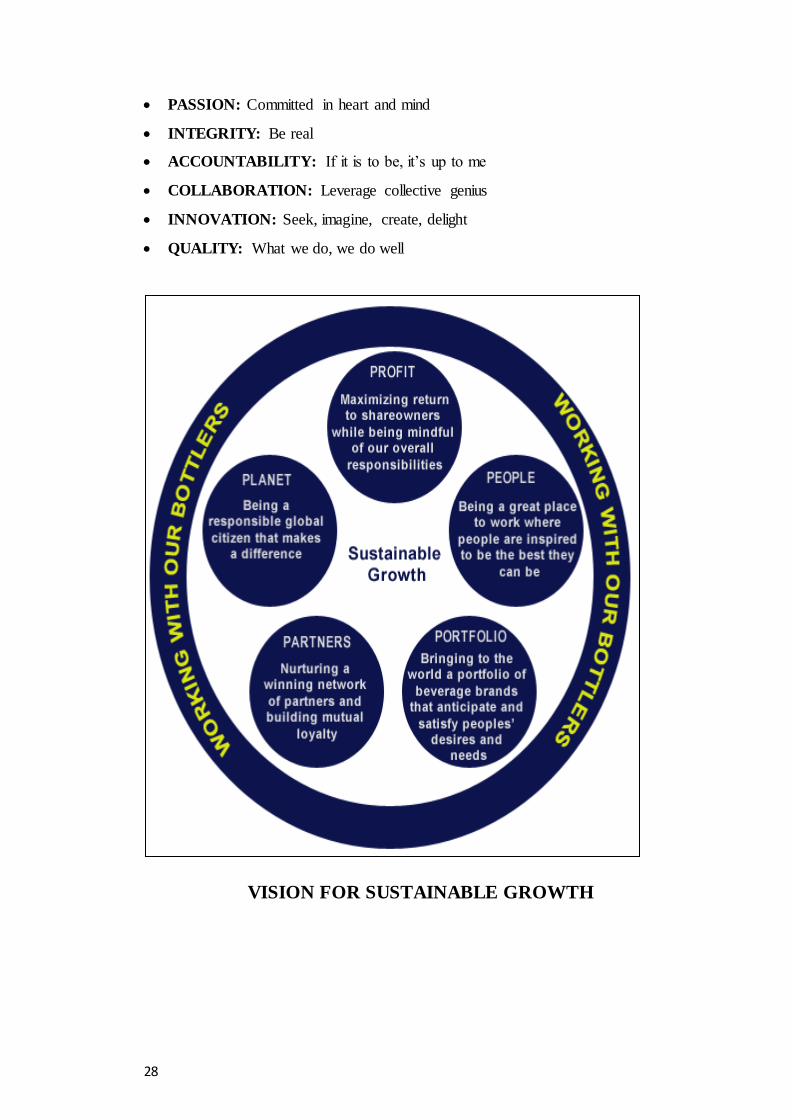
People: Being a great place to work where people are inspired to be the best they can
be.
Portfolio: Bringing to the world a portfolio of quality beverage brands that anticipate
and satisfy people's desires and needs.
Partners: Nurturing a winning network of customers and suppliers, together we
create mutual, enduring value.
Planet: Being a responsible citizen that makes a difference by helping build and
support sustainable communities.
Profit: Maximizing long-term return to shareowners while being mindful of our
overall responsibilities.
1.2.2.3 VALUES
Coca-Cola is guided by shared values that both the employees as individuals and the
Company will live by; the values being:
LEADERSHIP: The courage to shape a better future
28
PASSION: Committed in heart and mind
INTEGRITY: Be real
ACCOUNTABILITY: If it is to be, it’s up to me
COLLABORATION: Leverage collective genius
INNOVATION: Seek, imagine, create, delight
QUALITY: What we do, we do well
VISION FOR SUSTAINABLE GROWTH
29
COMMITMENT TO SUSTAINABILITY – 2007/2008
HIGHLIGHTS:
Respecting People – We offered more than 1,600 training classes to Company
associates.
Protecting the environment- We achieved a 2% improvement in water use
efficiency in 2007 as compared to 2006
Supporting Communities – In 2007, The Coca-Cola Company and The Coca-
Cola Foundation made charitable contributions of $99 million to community
initiatives worldwide.
Offering Safe, Quality Products – We launched more than 150 low and no-
calorie products in 2008, as well as more than 200 juice and juice drink
products.
2008 FINANCIAL HIGHLIGHTS:
Our portfolio includes 13 billion dollar brands.
Unit case volume grew 5% to 23.7 billion unit cases worldwide
Net operating revenues grew 11% to $31.9 billion.
More than 70% of our net operating revenues and more than 75% of our unit
case volume were generated outside of North America.
30
1.2.3 PRODUCT PROFILE
The world's favourite drink. The world's most valuable brand. The most recognizable
word across the world after OK. Coca-Cola has a truly remarkable heritage. From a
humble beginning in 1886, it is now the flagship brand of the largest manufacturer,
marketer and distributor of non-alcoholic beverages in the world.
In India, Coca-Cola was the leading soft-drink till 1977 when govt.
policies necessitated its departure. Coca-Cola made its return to the country in 1993
and made significant investments to ensure that the beverage is available to more and
more people, even in the remote and inaccessible parts of the nation.
Coca-Cola returned to India in 1993 and over the past ten years has
captured the imagination of the nation, building strong associations with cricket, the
thriving cinema industry, music etc. Coca-Cola has been very strongly associated with
cricket, sponsoring the World Cup in 1996 and various other tournaments, including
the Coca-Cola Cup in Sharjaha in the late nineties. Coca-Cola's advertising campaigns
Jo Chaho Ho Jaye and Life ho to Aisi were very popular and had entered the youth's
vocabulary. In 2002, Coca Cola launched the campaign
"Thanda Matlab Coca-Cola" which sky-rocketed the brand to make it
India's favourite soft-drink brand. In 2003, Coke was available for just Rs. 5 across
31
the country and this pricing initiative together with improved distribution ensured that
all brands in the portfolio grew leaps and bounds. Coca-Cola had signed on various
celebrities including movie stars such as Karishma Kapoor, cricketers such as Srinath,
Sourav Ganguly, southern celebrities like Vijay in the past and today. Its brand
ambassadors are Aamir Khan and Hrithik Roshan.
Glass PET Can
200ml, 300ml 350ml, 500ml, 1.25L, 2L, 2.25L,
330ml
Thums Up is a leading carbonated soft drink and most trusted brand in India.
Originally introduced in 1977, Thums Up was acquired by The Coca-Cola Company in 1993.
32
Thums Up is known for its strong, fizzy taste and its confident, mature and uniquely
masculine attitude. This brand clearly seeks to separate the men from the boys.
Glass PET Can
200ml, 300ml 350ml, 500ml, 1.25L, 2L, 2.25L, 330ml
“Lime ‘n’ Lemoni” Limca, Derived from “nimbu” + “jaisa”.. Hence “lime sa”.
Limca has been lived up to its promise refreshment and has been the original thirst
choice of millions of consumers for over 3-decades.
Born in 1971 has remained unchallenged as the No.1
Sparkling Drink in the cloudy lemon segment.
Glass PET Can
200ml, 300ml 350ml, 500ml, 1.25L, 2L, 2.25L, 330ml
33
Fanta - The orange drink of The Coca-Cola Company is seen as one of the favourite
drinks since 1940's. Fanta entered the Indian market in the year 1993.
Over the Years Fanta has occupied a strong market place and is identified
as "The Fun Catalyst".
Perceived as a fun youth brand, Fanta stands for its vibrant colour;
tempting taste and tingling bubbles taste that not just up lifts feelings but also helps
free spirit thus encouraging one to indulge in the moment. This positive imagery is
associated with happy, cheerful and special times with friends.
Glass PET Can
200ml, 300ml 350ml, 500ml, 1.25L, 2L, 2.25L, 330ml
Worldwide sprite is ranked as the No. 4 soft drink and is sold in more than 190
countries.
34
In India, Sprite was launched in year 1999 and today it grown to be one of the fastest
growing soft drinks, leading the clear lime category and India’s no. 2 brand in 2009.
Today Sprite is perceived as youth icon, why? With a strong appeal to the
youth, Sprite has stood for a straight forward and honest attitude. Its clear crisp
refreshing taste encourages the today’s youth to trust their instincts, influence them to
be true to who they are and to obey their thirst.
Glass PET Can
200ml, 300ml 350ml, 500ml, 1.25L, 2L, 2.25L, 330ml
Maaza was launched in 1976. Here was a drink that offered the same real taste of
fruit juices and was available throughout the year.
In 1993, Maaza was acquired by Coca-Cola India. Maaza currently
dominates the fruit category.
Over the year, brand Maaza has become synonymous with Mango. This has
been the result of such successful campaigns like ‘Taaza Mango, Maaza Mango” and
“Botal Mein Aam, Maaza hai Naam” consumers regard Maaza as wholesome, natural,
fun drink which delivers the real experience of fruit.
Glass Tetra Mobile Pet
200ml, 250ml 200ml 250ml, 600ml 1.2l
35
MINUTE MAID PULPY ORANGE
The brand launched in its internationally successful Minute Maid Pulpy Orange “
avatar is a naturally refreshing juice drink which offers an Unmatched taste
experience to consumers due to the presence of real ‘orange pulp” This innovative
consumer proposition is best explained by The brand tagline “Refreshing orange,
surprisingly pulpy”. Minute Maid Pulpy Orange has been made available in two PET
pack-sizes on the go1.25 litter bottle, priced at Rs.20 and 50 respectively.
MOBILE Pet
250ml,400ml 1.l
36
Water a thirst quencher that refreshes, a life giving force that washes all the toxins
away. A ritual purifier that cleanses, purifies, transforms. Water, the most basic need
of life, the very sustenance of life, a celebration of life itself.
The importance of water can never be understated Particularly in a nation
such as India where water governs the lives of the millions, be it as part of everyday
rituals or as the monsoon which gives life to the sub-continent.
Kinley water understands the importance and value of this life giving
force. Kinley water thus promises water that is as pure as it is meant to be. Water you
can trust to be truly safe and pure.
Kinley water comes with the assurance of Safety from the Coca-Cola
Company. That is why we introduced Kinley with reverse- osmosis along with the
latest technology to ensure the purity of our product. That’s why we go through
rigorous testing procedures at each and every location where Kinley is produced.
Because we believe that right to pure, Safe drinking water is fundamental.
A universal need that cannot be left to chance.
1.2.4 BUSINESS MODEL OF COCA-COLA
37
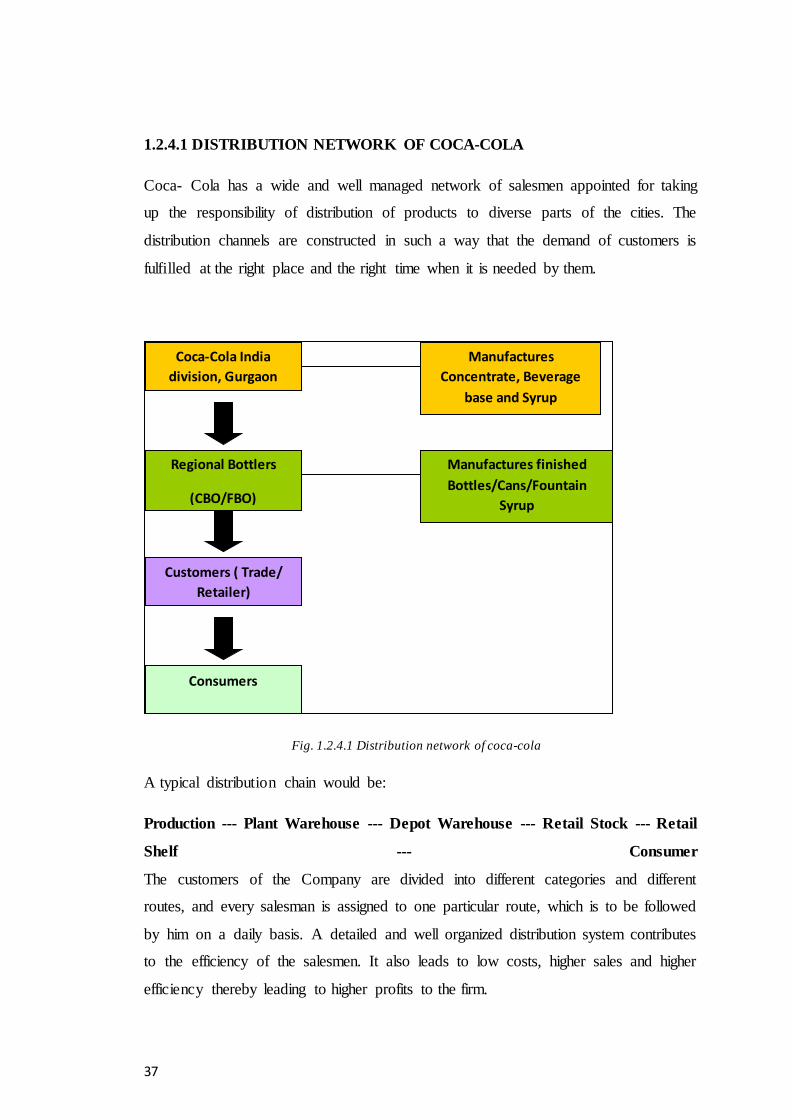
1.2.4.1 DISTRIBUTION NETWORK OF COCA-COLA
Coca- Cola has a wide and well managed network of salesmen appointed for taking
up the responsibility of distribution of products to diverse parts of the cities. The
distribution channels are constructed in such a way that the demand of customers is
fulfilled at the right place and the right time when it is needed by them.
Fig. 1.2.4.1 Distribution network of coca-cola
A typical distribution chain would be:
Production --- Plant Warehouse --- Depot Warehouse --- Retail Stock --- Retail
Shelf --- Consumer
The customers of the Company are divided into different categories and different
routes, and every salesman is assigned to one particular route, which is to be followed
by him on a daily basis. A detailed and well organized distribution system contributes
to the efficiency of the salesmen. It also leads to low costs, higher sales and higher
efficiency thereby leading to higher profits to the firm.
Coca-Cola India
division, Gurgaon
Regional Bottlers
(CBO/FBO)
COBO/FOBO
Customers ( Trade/
Retailer)
Manufactures
Concentrate, Beverage
base and Syrup
Manufactures finished
Bottles/Cans/Fountain
Syrup
Consumers
38
1.2.4.2 DISTRIBUTION ROUTES
The various routes formulated for distribution of products are as follows:
Key Accounts and Discount route: The customers in this category
collectively contribute a large chunk of the total sales of the Company. It
basically consists of organizations that buy large quantities of a product in one
single transaction. The Company provides goods to these customers on credit,
payments being made by them after a certain period of time i.e. either a month
of half a month.
Examples: Clubs, fine dine restaurants, hotels, Corporate houses etc.
Future Consumption: This route consists of outlets of Coca-Cola products,
wherein a considerable amount of stock is kept in order to use for future
consumption. The stock does not exhaust within a day or two, instead as and
when required stocks are stacked up by them so as to avoid shortage or non-
availability of the product.
Examples: Departmental stores, Super markets etc.
Immediate Consumption: The outlets in this route are those which require
stocks on a daily basis. The stocks of products in these outlets are not stored
for future use instead, are exhausted on the same day and might run a little
into the next day i.e. the products are consumed at a fast pace.
Examples: Small sized bars and restaurants, educational institutions etc.
General: Under this route, all the outlets that come in a particular area or an
area along with its neighbouring areas are catered to. The consumption
period is not taken into consideration in this particular route.
1.2.4.3 DISTRIBUTION SYSTEM
39
Direct distribution: In direct distribution, the bottling unit or the bottler
partner has direct control over the activities of sales, delivery, and
merchandising and local account management at the store level.
Indirect distribution: In indirect distribution, an organization which
is not part of the Coca-Cola system has control on one or more of the
distribution elements (Sales, delivery, merchandising and local account
management)
Merchandising: Merchandising means communication with the
consumer at the point of purchase to convey product benefit, value and
Quality. Sales people and delivery personnel both have this
responsibility. In certain locations special teams who go into business
locations to specifically merchandise our products.
DEPARTMENTS INVOLVED IN THE DISTRIBUTION PROCESS
The Distribution process mainly consists of three departments:
Distribution Department: It appoints distributors and establishes a
distribution network, processes approved sale orders and prepares invoices,
arranges logistics and ship products, co-ordinates with distributors for
collections and monitors distribution stocks and their set-up.
Finance Department: It checks credit limits and approves sales orders in
compliance with the credit policy followed by the firm, records collections
from distributors, periodically reconciles outstanding balances from
distributors, obtains balance confirmation from distributors and follows up
outstanding balances.
Shipping or Warehousing Department: It dispatches goods as per approved
by order, ensures that stocks are dispatched on a FIFO basis, ensures physical
control over load out area and updates warehouse stock records in a timely
manner.
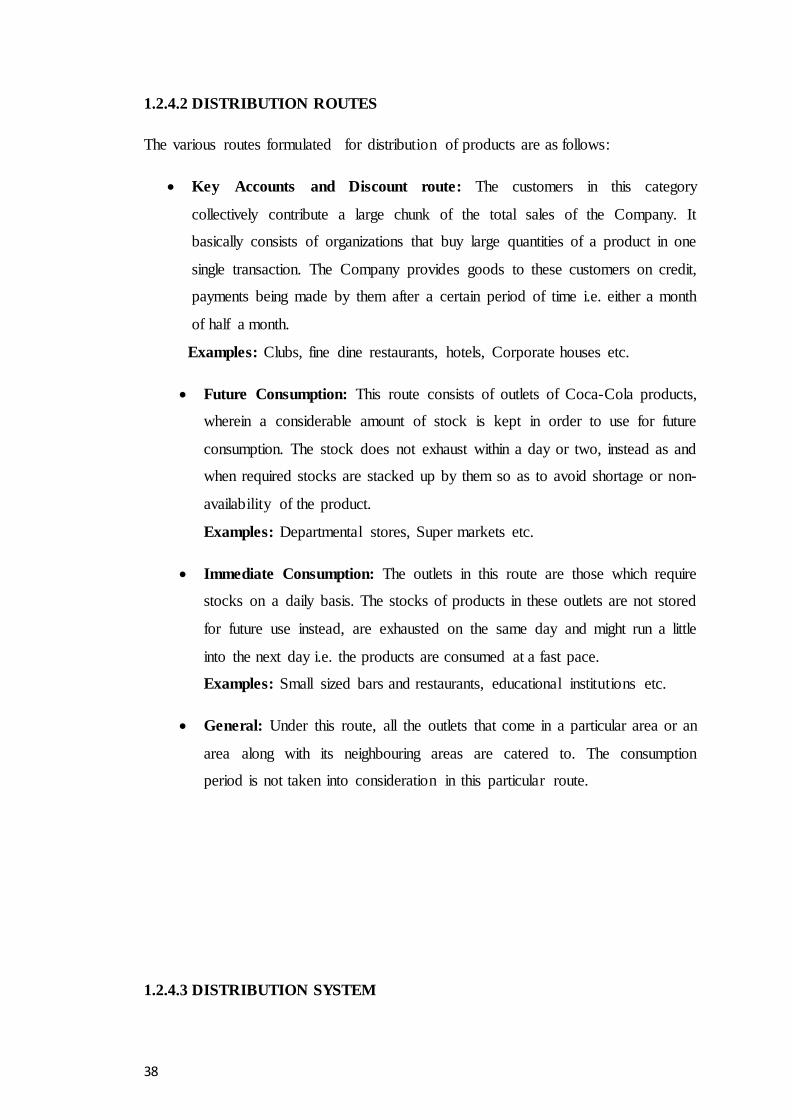
1.2.4.4 DISTRIBUTION PROCESS OF COCA-COLA

40
WBPL has a very wide and well managed distribution system in which
salesmen have a full responsibility to distribute the product to different and diverse
part of the Amritsar City. The distribution system is well structured in such a way that
it will fulfill the demands of retailers and customer at the right time and at the right
place.
The typical distribution system of WBPL is:
Fig. 1.2.4.4 Distribution process of coca-cola
PRODUCTION
PLANT
WARE HOUSE
CUSTOMER
DEPOT
WARE HOUSE
RETAIL
STOCK
RETAIL
SHELF
41
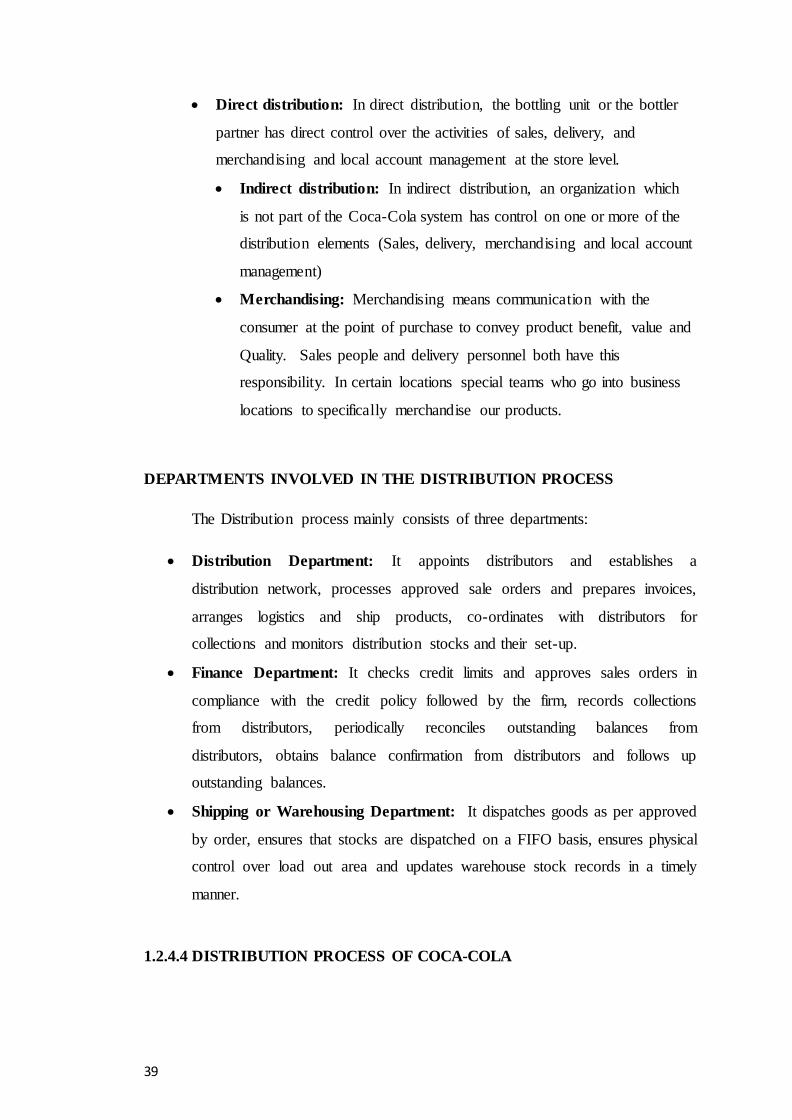
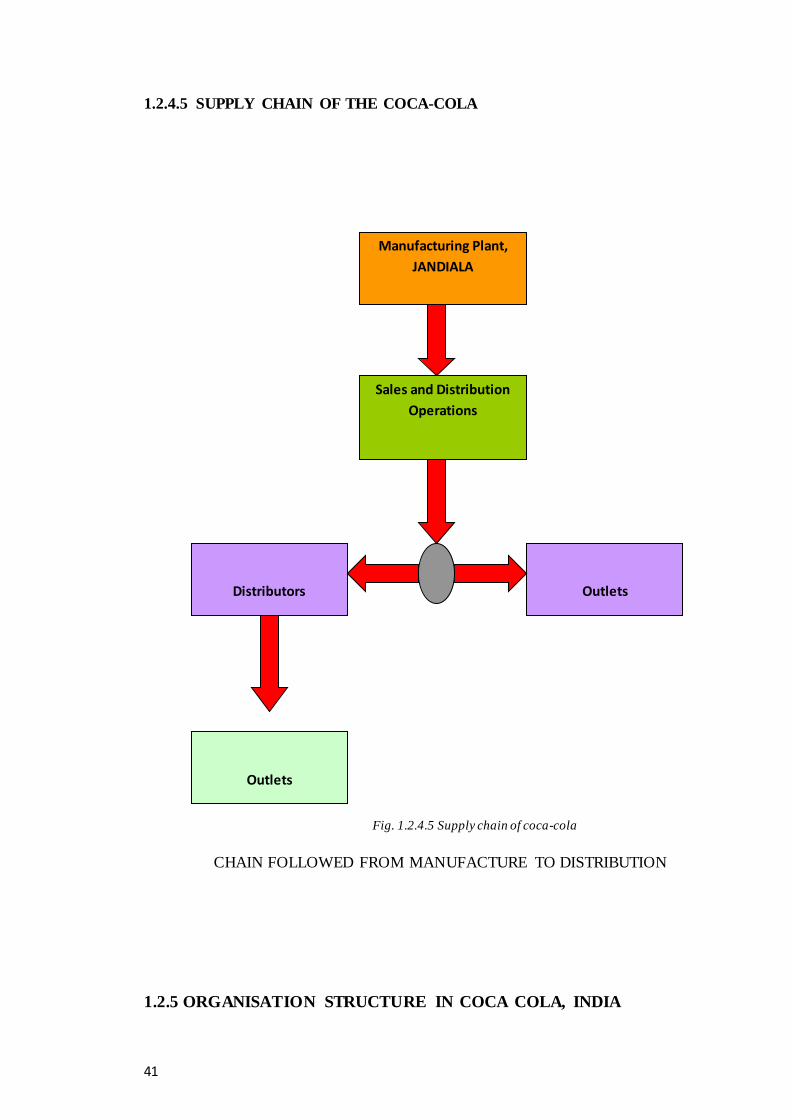
1.2.4.5 SUPPLY CHAIN OF THE COCA-COLA
Fig. 1.2.4.5 Supply chain of coca-cola
CHAIN FOLLOWED FROM MANUFACTURE TO DISTRIBUTION
1.2.5 ORGANISATION STRUCTURE IN COCA COLA, INDIA
Manufacturing Plant,
JANDIALA
Sales and Distribution
Operations
Distributors
Outlets
Outlets
42
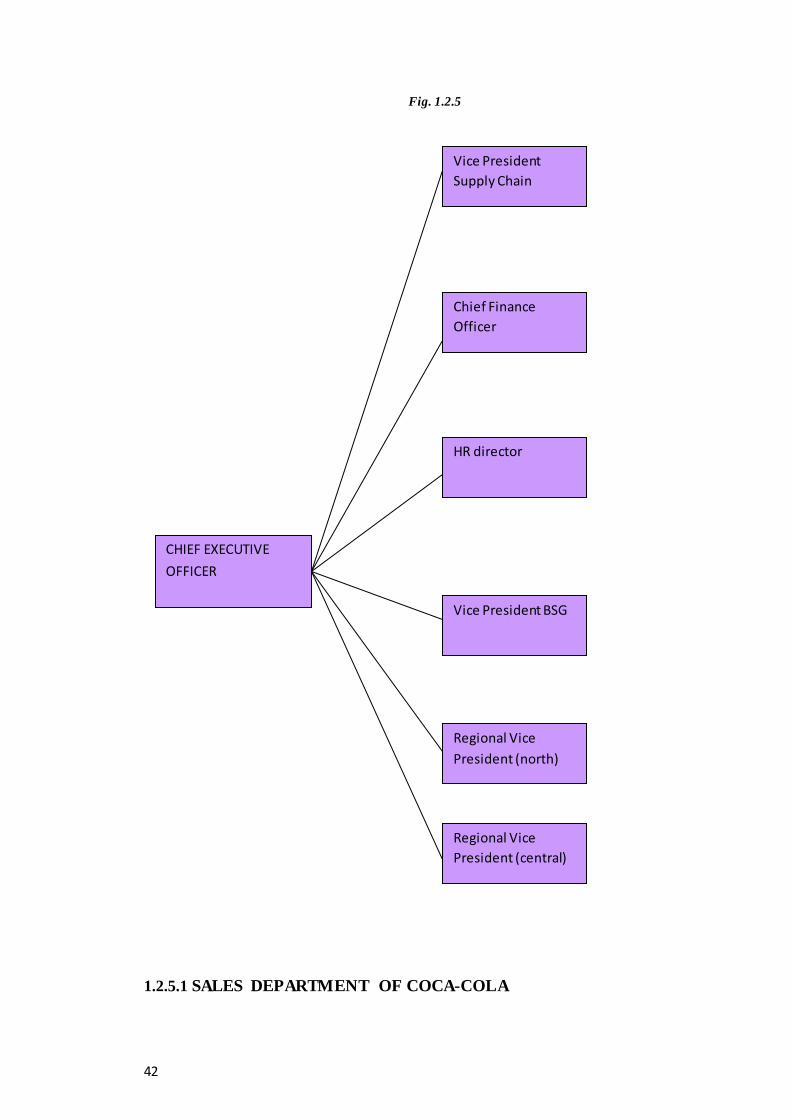
Fig. 1.2.5
1.2.5.1 SALES DEPARTMENT OF COCA-COLA
CHIEF EXECUTIVE
OFFICER
Vice President
Supply Chain
Chief Finance
Officer
HR director
Vice President BSG
Regional Vice
President (north)
Regional Vice
President (central)
43
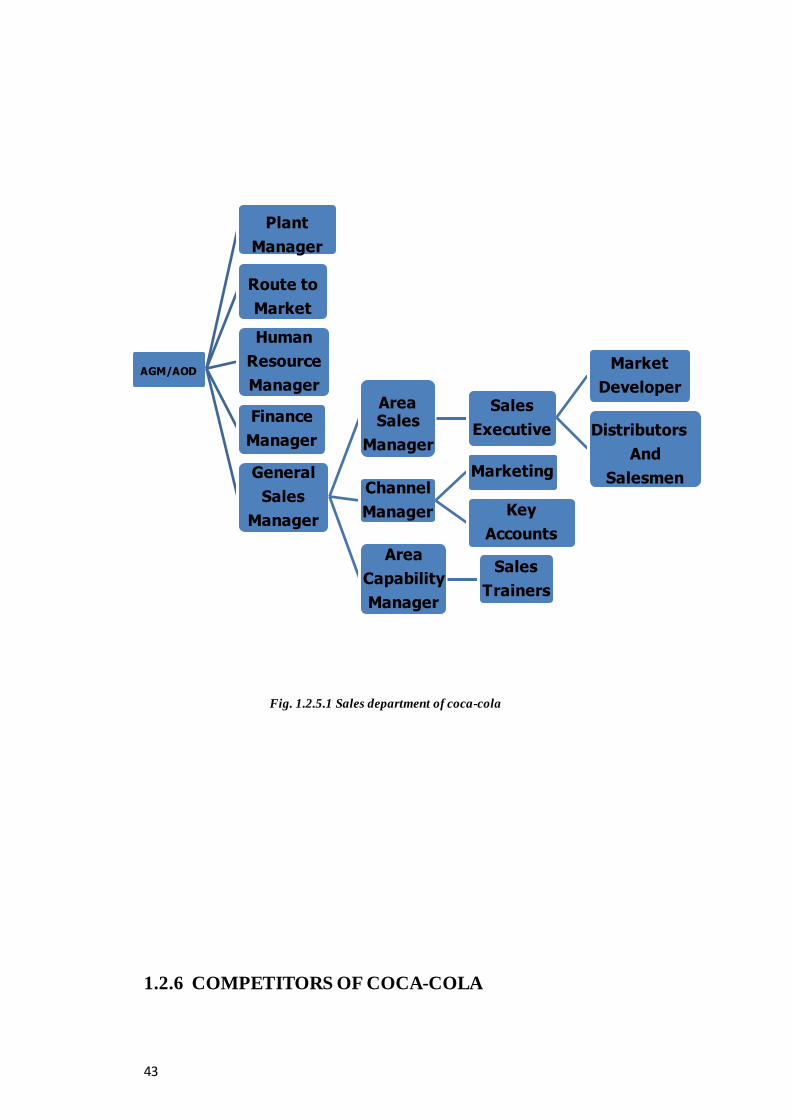
Fig. 1.2.5.1 Sales department of coca-cola
1.2.6 COMPETITORS OF COCA-COLA
AGM/AOD
Plant
Manager
Route to
Market
Human
Resource
Manager
Finance
Manager
General
Sales
Manager
Area Sales
Manager
Sales
Executive
Market
Developer
Distributors
And
SalesmenChannel
Manager
Marketing
Key
Accounts
Area
Capability
Manager
Sales
Trainers
44
The competitors to the products of the company mainly lie in the non-alcoholic
beverage industry consisting of juices and soft drinks.
The key competitors in the industry are as follows:
:
45
PEPSICO: The PepsiCo challenge, to keep up with archrival, the Coca-Cola
Company never ends for the World's # 2, carbonated soft-drink maker. The
company's soft drinks include Pepsi, Mirinda, 7up Mountain Dew, and Slice.
Cola is not the company's only beverage; PepsiCo sells Tropicana orange juice
brands, Gatorade sports drink, and Aquafina water.
PepsiCo also sells Dole juices and Lipton ready-to-drink tea. PepsiCo and
Coca-Cola hold together, a market share of 95% out of which 60.8% is held by
Coca-Cola and the rest belongs to Pepsi.
DABUR: Dabur in India, is one of the most trusted brands as it has been
operating ever since times and people have laid all their trust in the Company
and the products of the Company. Apart from food products, Dabur has
introduced into the market Real Juice which is packaged fresh fruit juice. These
products give a strong competition to Maaza and the latest product Minute
Maid Pulpy Orange.
1.2.7 CUSTOMER
As Coca Cola has a wide range of products. Its customer also varies according to taste
and preference. Coca cola is also available in can of 330ml which targets the upper
income class and their sale is also confined in those particular places.
Coca cola is available in cola, lemon, orange and juice flavour,
accordingly customers have choice for. Among the products of Coca-Cola Thumps-up
has been leading the way with 45% of market share and Sprite is enjoying second
number.
Coca Cola Company has wide range of customers that falls under the
distribution channels of marketing. Customers may be CNF, distributor, retailers to
final customers, which are households.
46
1.2.8 FUTURE PLAN
2020 Vision: A Roadmap for Winning Together With Our Bottling Partners
Current and anticipated global changes present us with a unique opportunity to
significantly strengthen our business for the long term, which is why the system has
contributed to the evolution of 2020
Vision: Our Roadmap for Winning Together with Our Bottling Partners.
This one-page action plan – produced based on collective input from bottlers,
associates and other key stakeholders – builds on the foundation of the Manifesto and
turns it into clear priorities and actions for the entire Coca-Cola system.
Specifically, our 2020 Vision expands the scope of the Manifesto to include our
bottling partners and establish a core set of common strategies; adds a “sixth P” to
stress the importance of making Productivity part of everything we do; incorporates
new strategies to better address the external forces that will shape our business over
the coming decade; and sharpens our focus on execution by getting very clear on the
priority actions we must take.
Here’s a high-level overview of the Roadmap:
It all starts with our Mission to Refresh the World; Inspire Moments of
Optimism and Happiness; and Create Value and Make a Difference . This
Mission is enduring and hasn't fundamentally changed; instead, we’ve
simplified it to make it more memorable. We also have called out “happiness,”
47
which is part of our heritage and fundamental to our new global marketing
campaign for brand Coca-Cola.
While our Mission articulates what we want to achieve, five baseline
behaviours of the Roadmap capture how we’ll get there – Live Our Values;
Focus on the Market; Work Smart; Act Like Owners; and Be the Brand.
Our Vision encompasses our 5 Ps and their interrelationships, while adding an
equally important sixth P – Productivity – to emphasize the significant
opportunities that exist to drive efficiency to reinvest back into our brands and
business.
Our Manifesto Goals have been broadened, based on input from our bottlers,
to reflect a system-wide perspective; extended through 2020 to ensure we
always take a long-term view; and linked to specific metrics to measure our
progress.
Finally, our System Priorities are the heart of the 2020 Vision roadmap – the
business areas we need to fix, emphasize or do differently to meet both our
near-term and long-term objectives. These priorities are connected to each of
our 6 Ps.
This shortlist of actions is not intended to be all-inclusive; other very important work
remains to be done. Simply put, the Roadmap captures the “keys to the game” – the
overarching strategies that are essential for winning.
48
CHAPTER 2
REVIEW OF LITERATURE
Parry (1993) studied that in the first quarter of 1993, Coca-Cola's share of mass-
merchandise soft-drink sales fell 6.6 percent, while private-label soft-drinks shares in
the same channel rose 16.8 percent. Much of this increase reflected the success of the
Cott Corporation, which had achieved a 10 percent share in the mass-merchandise
channel by selling private-label and store-brand soft drinks to Wal-Mart and other
U.S. retailers. In a March 1993 interview, Cott CEO Gerald Pencer stated: "We make
a product that is at least as good as, if not better than, Coke or Pepsi." He expected
Cott's sales to double in the next year. Coca-Cola executives must decide how to
respond to Cott's initiatives.
Bommer et al. (2001) argued that competition in the beverage industry is increasing on
all fronts (advertising, price, product proliferation, service, etc.). As a result,
distributors need to understand what is important to retailers and assess how they and
their competitors are meeting those needs in the supply chain. In this paper a
performance system is proposed to assess the distributor-retailer interface based on
the integration of a number of concepts including customer service, relationship
exchanges, competitive benchmarking, order winners (consumer preference
perceptions), and portfolio analysis.Various performance matrices are constructed
which indicate the importance level and service effectiveness for categories of service
provided to retailers. These importance/ performance matrices provide a basis for
distributors to develop marketing strategies for categories of retailers, as well as for
individual retailers.
Bruner (2001) examined the implications of the merger announcement between
Pepsico and the Quaker Oats company, for the rivalry between Coca-cola Co. and
PepsiCo, and for value creation by each firm. Because the merger would allow
PepsiCo to control Gatorade, which held an 83% share in the sports drink market,
49
PepsiCo would further strengthen its already-wide lead over Coca-cola Co. in the
noncarbonated drinks segment. Would Coca-colas historically stellar performance in
terms of value creation be threatened by the merger? The case asks students to
estimate EVA TM (Economic Value Added) from 2001 to 2003, and provides income
statement and balance sheet forecasts to aid in this task. Students also need to
determine each companys weighted average cost of capital (WACC) in order to
estimate EVA. The primary objective of this case is to introduce students to the
concepts and calculation of WACC and EVA.
Matthew Hartogh (2002) documented that in its core competency, the Coca-
Company has only one serious competitor, the PepsiCo Company, maker of Pepsi-
Cola. Current market share of the two companies in the United States stands at 43.7%
for Coca-Cola against 31.6% for PepsiCo. British firm Cadbury Schweppes comes in
third in the American market with its 7UP and Dr. Pepper brands but does not have a
head to head cola competitor for Coca-Cola. Supermarket "private label" cola brands
are a substitute beverage for the big two but in terms of dollar sales, they do not cut
greatly into their market share. According to the Beverage Digest 2001 survey, the top
4 brands continue to be Coke Classic, with a U.S. market share of 19.9%, Pepsi-Cola,
with 13.2%, followed by Diet Coke with 8.8% and Mountain Dew (a PepsiCo
product) with 6.9%.
50
CHAPTER 3
RESEARCH METHODOLOGY
3.1 NEED OF THE STUDY
The main scope of the study is to find out those outlets who have kept the
stock of only Pepsi so that company try to break those monopolies.
To increase the market share of Coca-cola company.
3.2 OBJECTIVES OF THE STUDY
To study the reasons responsible for preference towards Pepsico products.
To study the preferred brands of Pepsi and Coca-Cola.
To study the daily sales trends of Pepsi and Coca-Cola.
3.3 DATA SOURCES
The project study is based on primary data which has been collected through
questionnaires.
3.4 SAMPLING DESIGN:
3.4.1 POPULATION :
All outlets which are come under RED( Right Execution Daily) in
Amritsar city.
3.4.2 SAMPLING UNIT:
The sampling unit is owner of the retail outlet in Amritsar city.
3.4.3 SAMPLE SIZE:
Size of sample in research is 120 outlets of Amritsar city.
3.4.4 SAMPLING TECHNIQUES:
Sampling technique which has been used is random sampling.
51
3.5 LIMITATIONS
Although all efforts have been taken to make the results of survey as accurate as
possible but the survey suffers from the following limitations:
1) The time period of study was only for two month so it was not possible to
cover all the areas and go into the depth of the problem and make analysis.
2) The area of survey was Amritsar and it was concentrated on urban area
only.
3) Some of the respondents were not supportive. It may be because either
training was carried on in the peak season, so they didn’t have enough time
to answer or they were not forthcoming.
Chapter 4
DATA ANALYSIS AND INTERPRETATION
Data analysis is based upon the survey that I had conducted during my training time
through visiting 120 outlets.
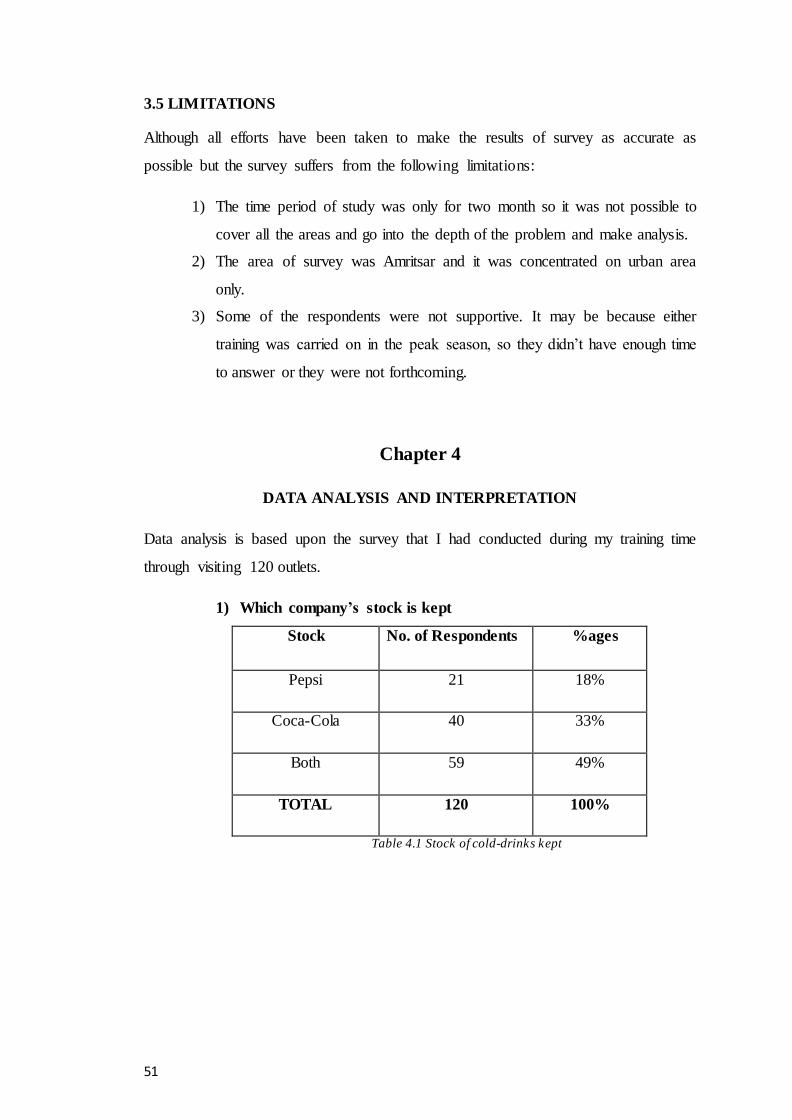
1) Which company’s stock is kept
Stock No. of Respondents %ages
Pepsi 21 18%
Coca-Cola 40 33%
Both 59 49%
TOTAL 120 100%
Table 4.1 Stock of cold-drinks kept
52
Fig. 4.1 Stock of cold-drinks kept
Interpretation:
In the above question, It is found that out of 120 outlets, monopoly
outlets of Pepsi are 21(18%), and monopoly outlets of coca-cola are
40(33%) and 59(49%) are those outlets who kept the stock of both the
companies (Pepsi and Coca-Cola).
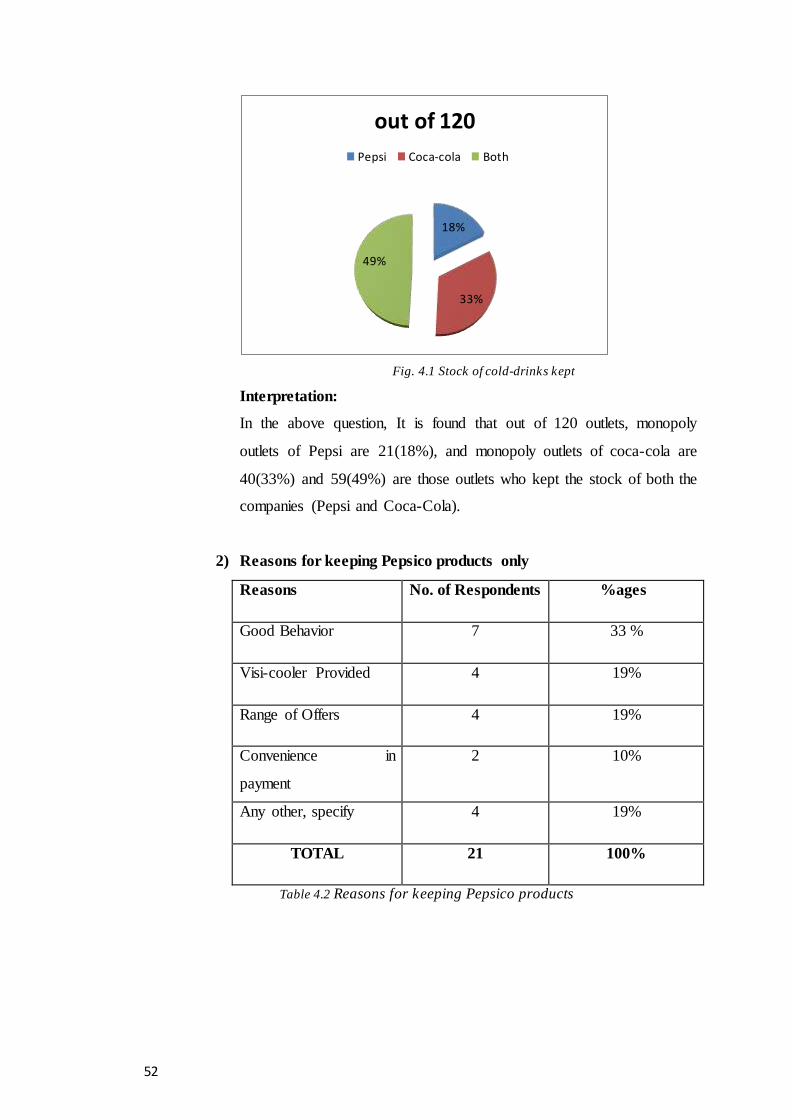
2) Reasons for keeping Pepsico products only
Reasons No. of Respondents %ages
Good Behavior 7 33 %
Visi-cooler Provided 4 19%
Range of Offers 4 19%
Convenience in
payment
2 10%
Any other, specify 4 19%
TOTAL 21 100%
Table 4.2 Reasons for keeping Pepsico products
18%
33%
49%
out of 120
Pepsi Coca-cola Both
53
Fig. 4.2 Reasons for keeping Pepsico products
Interpretation:
With the help of the above question, It’s tried to find out the reason
that why 21 respondents have kept the stock of only Pepsi and found
that out of 21,
i. 7(33%) respondents have said they are happy with the Good-
behaviour of the salesmen of pepsi.
ii. 4(19%) respondents said that Pepsi provided us Visi-cooler.
iii. 4(19%) respondents said that they give us good Schemes/offers.
iv. 2(10%) respondents has created the issue of payment.
v. And the rest of 4(19%) respondents have given some other
reasons like :
(a) There shop is near the Pepsi Depot.
(b) Some said No reason.
3) Reasons for not keeping Pepsico products
Reasons No. of
Respondents
%ages
Delivery Problem 8 20 %
Less Demand 22 55 %
Lack of schemes 5 12 %
33%
19%19%
10%
19%
Out of 21
Good behavior
Visi-cooler Provided
Range of Offers
Convenience in
Payment
Any other, specify
54
Any other, specify 5 13 %
TOTAL 40 100%
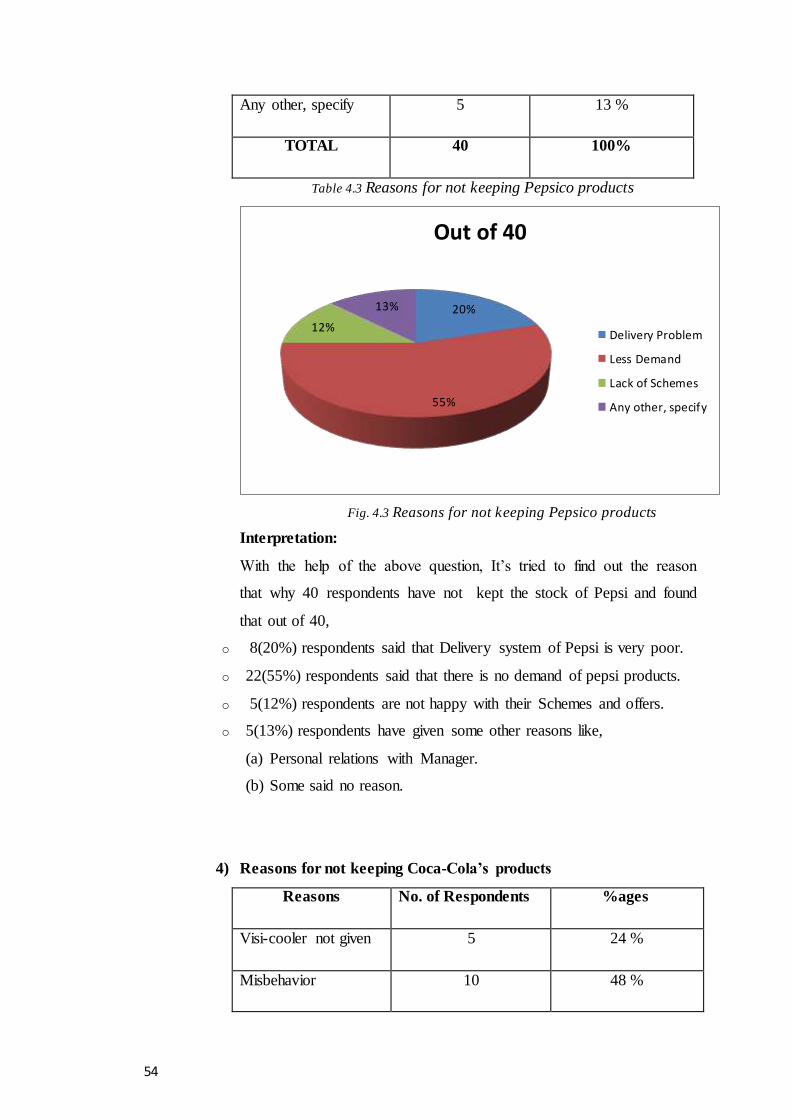
Table 4.3 Reasons for not keeping Pepsico products
Fig. 4.3 Reasons for not keeping Pepsico products
Interpretation:
With the help of the above question, It’s tried to find out the reason
that why 40 respondents have not kept the stock of Pepsi and found
that out of 40,
o 8(20%) respondents said that Delivery system of Pepsi is very poor.
o 22(55%) respondents said that there is no demand of pepsi products.
o 5(12%) respondents are not happy with their Schemes and offers.
o 5(13%) respondents have given some other reasons like,
(a) Personal relations with Manager.
(b) Some said no reason.
4) Reasons for not keeping Coca-Cola’s products
Reasons No. of Respondents %ages
Visi-cooler not given 5 24 %
Misbehavior 10 48 %
20%
55%
12%
13%
Out of 40
Delivery Problem
Less Demand
Lack of Schemes
Any other, specify
55
Payment problem 2 9 %
Any other, specify 4 19 %
TOTAL 21 100%
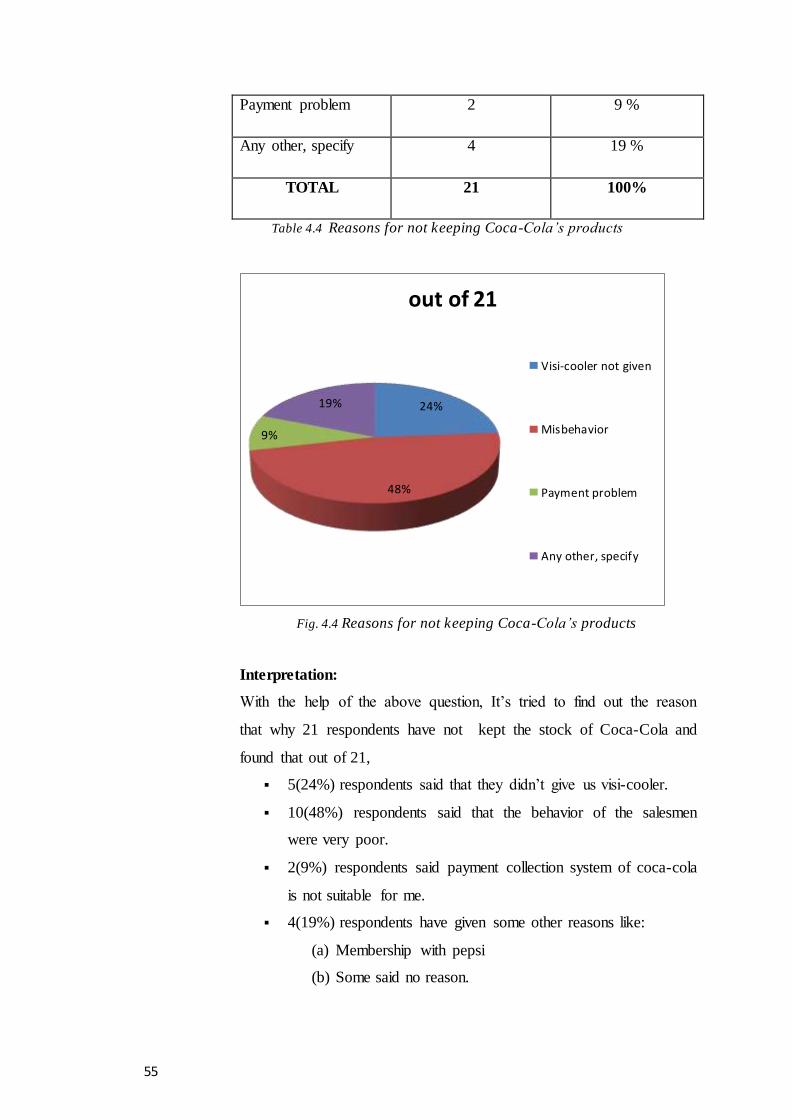
Table 4.4 Reasons for not keeping Coca-Cola’s products
Fig. 4.4 Reasons for not keeping Coca-Cola’s products
Interpretation:
With the help of the above question, It’s tried to find out the reason
that why 21 respondents have not kept the stock of Coca-Cola and
found that out of 21,
5(24%) respondents said that they didn’t give us visi-cooler.
10(48%) respondents said that the behavior of the salesmen
were very poor.
2(9%) respondents said payment collection system of coca-cola
is not suitable for me.
4(19%) respondents have given some other reasons like:
(a) Membership with pepsi
(b) Some said no reason.
24%
48%
9%
19%
out of 21
Visi-cooler not given
Misbehavior
Payment problem
Any other, specify
56
5) Alternative of LIMCA
Pepsi = 21
Mountain Dew = 5
No = 16
Fig. 4.5.1
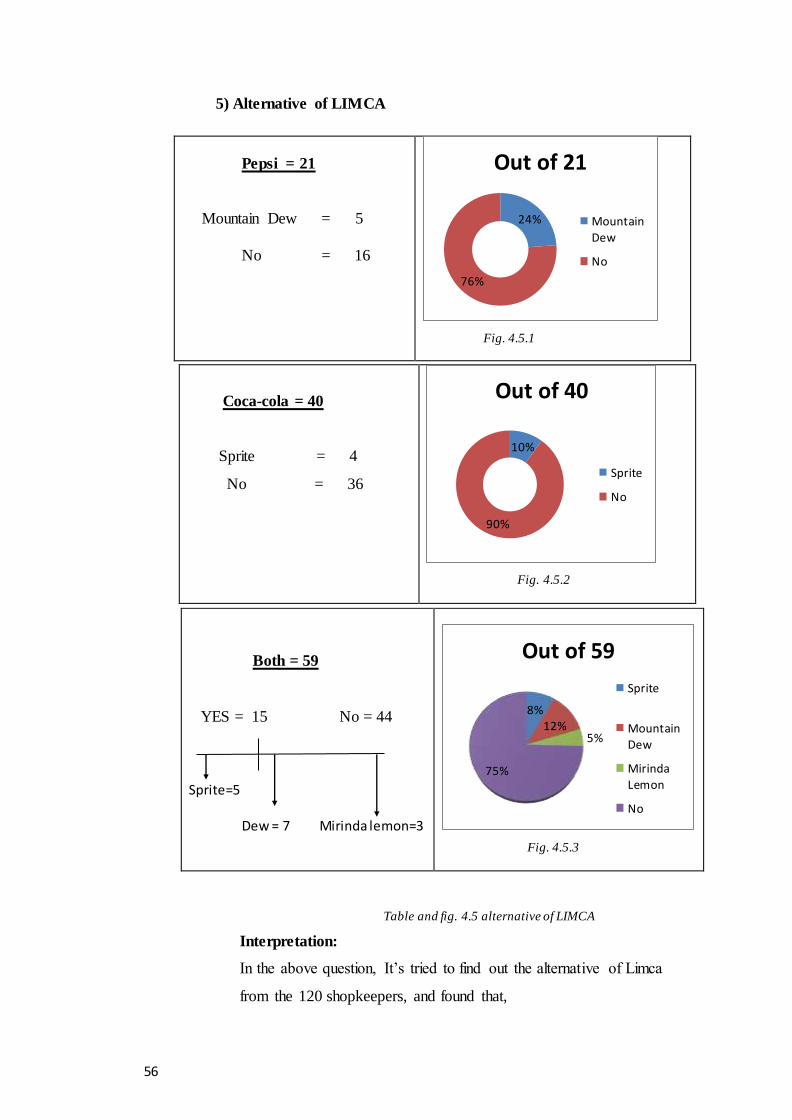
Table and fig. 4.5 alternative of LIMCA
Interpretation:
In the above question, It’s tried to find out the alternative of Limca
from the 120 shopkeepers, and found that,
24%
76%
Out of 21
Mountain
Dew
No
Coca-cola = 40
Sprite = 4
No = 36
Fig. 4.5.2
Both = 59
YES = 15 No = 44
Sprite=5 Dew = 7 Mirinda lemon=3
Fig. 4.5.3
10%
90%
Out of 40
Sprite
No
8%12%
5%
75%
Out of 59
Sprite
Mountain
Dew
Mirinda
Lemon
No
57
(a) Out of Pepsi monopolies (21),
5(24%) have said ‘Yes’, ‘ Mountain Dew’ is alternative
of Limca.
16(76%) have said, there is no any alternative of Limca.
(b) Out of Coca-Cola monopolies (40),
(i) 4(10%) have said ‘Yes’, ‘Sprite’ is the alternative of Limca.
(ii) 36(90%) have said, there is no any alternative of Limca.
(c) Out of Both (59),
(i) 15 have said ‘Yes’, out of 15, 5(8%) said ‘Sprite’ and
7(12%) said ‘Dew’.
(ii) 44(75%) said there is no any alternative of Limca.
6) Length of time for keeping the stock of Coca-cola
Interval(yrs) Coca-cola Both
No. of Respondents %age No. of Respondents %age
0 - 5 9 22% 14 24%
5 - 10 12 30% 21 35%
10 - 15 15 38% 11 19%
Above 15 4 10% 13 22%
TOTAL 40 100% 59 100%
Fig. 4.6.1
Fig. 4.6.2
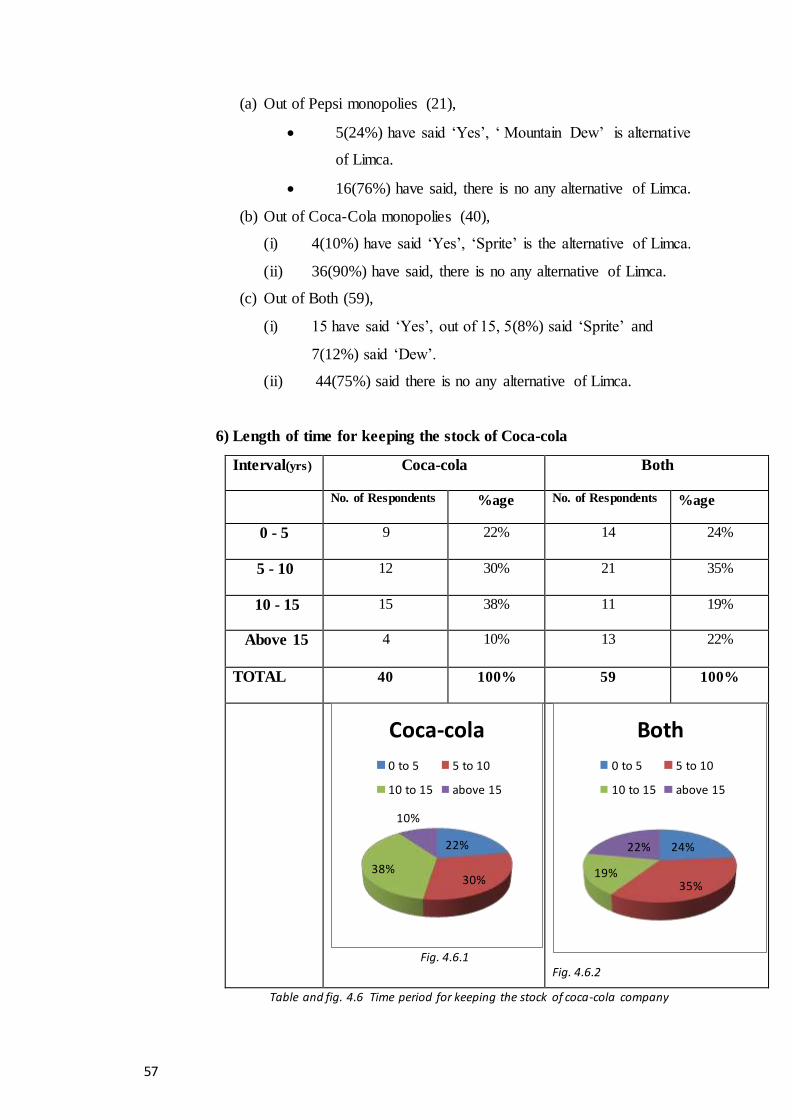
Table and fig. 4.6 Time period for keeping the stock of coca-cola company
22%
30%38%
10%
Coca-cola
0 to 5 5 to 10
10 to 15 above 15
24%
35%19%
22%
Both
0 to 5 5 to 10
10 to 15 above 15
58
Interpretation:
(a) Under 5 years, 9(22%) are those respondents who have
kept the stock of only Coca-cola and 14(24%) are those
who have kept both(Pepsi and coke) .
(b) Under 5 – 10 years, 12(30%) are those respondents who
have kept the stock of only Coca-cola and 21(35%) are
those who have kept both.
(c) Under 10 - 15 years, 15(38%) are those respondents who
have kept the stock of only Coca-cola and 11(19%) are
those who have kept both.
(d) Above 15 years, 4(10%) are those respondents who have
kept the stock of only Coca-cola and 13(22%) are those
who have kept both.
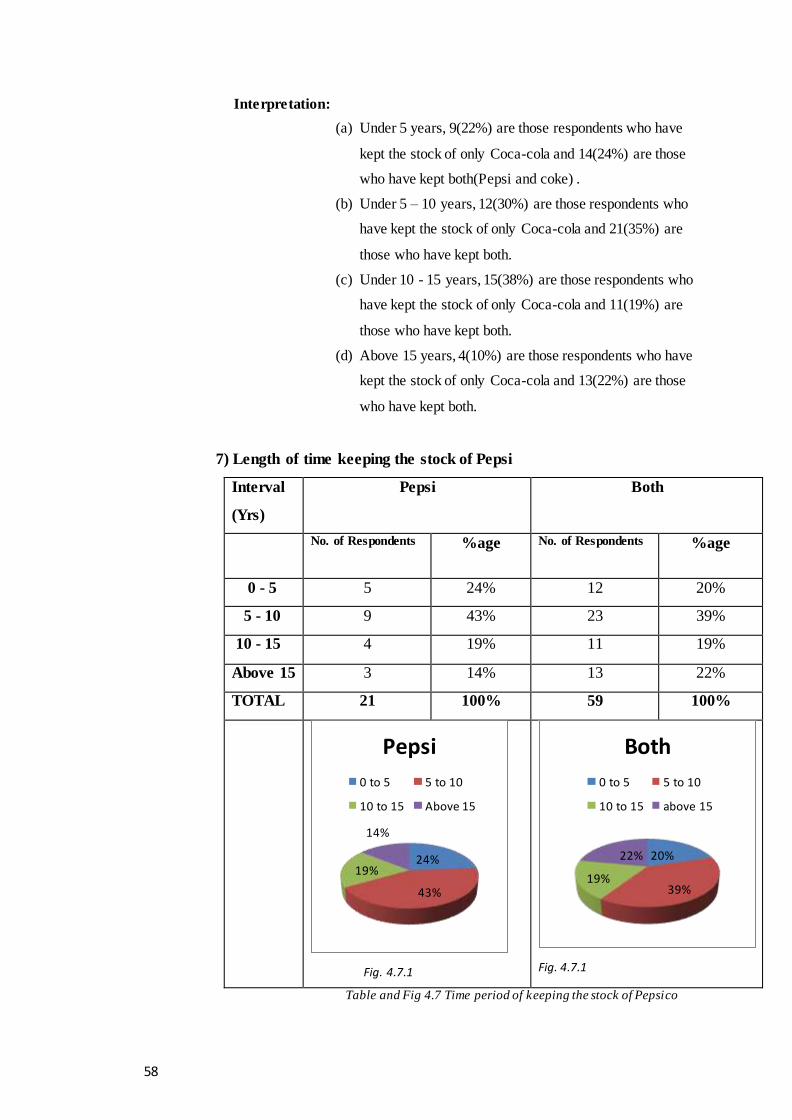
7) Length of time keeping the stock of Pepsi
Interval
(Yrs)
Pepsi Both
No. of Respondents %age No. of Respondents %age
0 - 5 5 24% 12 20%
5 - 10 9 43% 23 39%
10 - 15 4 19% 11 19%
Above 15 3 14% 13 22%
TOTAL 21 100% 59 100%
Fig. 4.7.1
Fig. 4.7.1
Table and Fig 4.7 Time period of keeping the stock of Pepsico
24%
43%
19%
14%
Pepsi
0 to 5 5 to 10
10 to 15 Above 15
20%
39%19%
22%
Both
0 to 5 5 to 10
10 to 15 above 15
59
Interpretation:
(a) Under 5 years, 5(24%) are those respondents who have
kept the stock of only Pepsi and 12(20%) are those who
have kept both(Pepsi and coke) .
(b) Under 5 – 10 years, 9(43%) are those respondents who
have kept the stock of only Pepsi and 23(39%) are those
who have kept both.
(c) Under 10 - 15 years, 4(19%) are those respondents who
have kept the stock of only Pepsi and 11(19%) are those
who have kept both.
(d) Above 15 years, 3(14%) are those respondents who have
kept the stock of only Pepsi and 13(22%) are those who
have kept both.
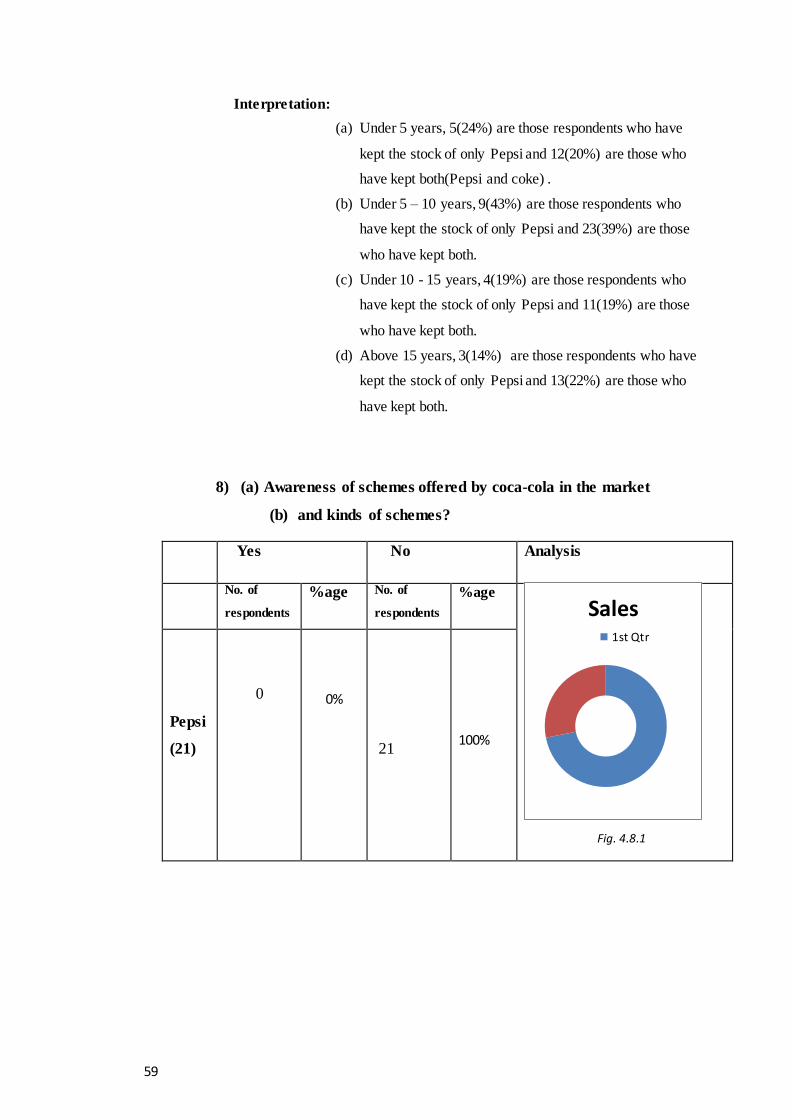
8) (a) Awareness of schemes offered by coca-cola in the market
(b) and kinds of schemes?
Yes No Analysis
No. of
respondents
%age No. of
respondents
%age
Fig. 4.8.1
Pepsi
(21)
0
0%
21
100%
Sales1st Qtr
60
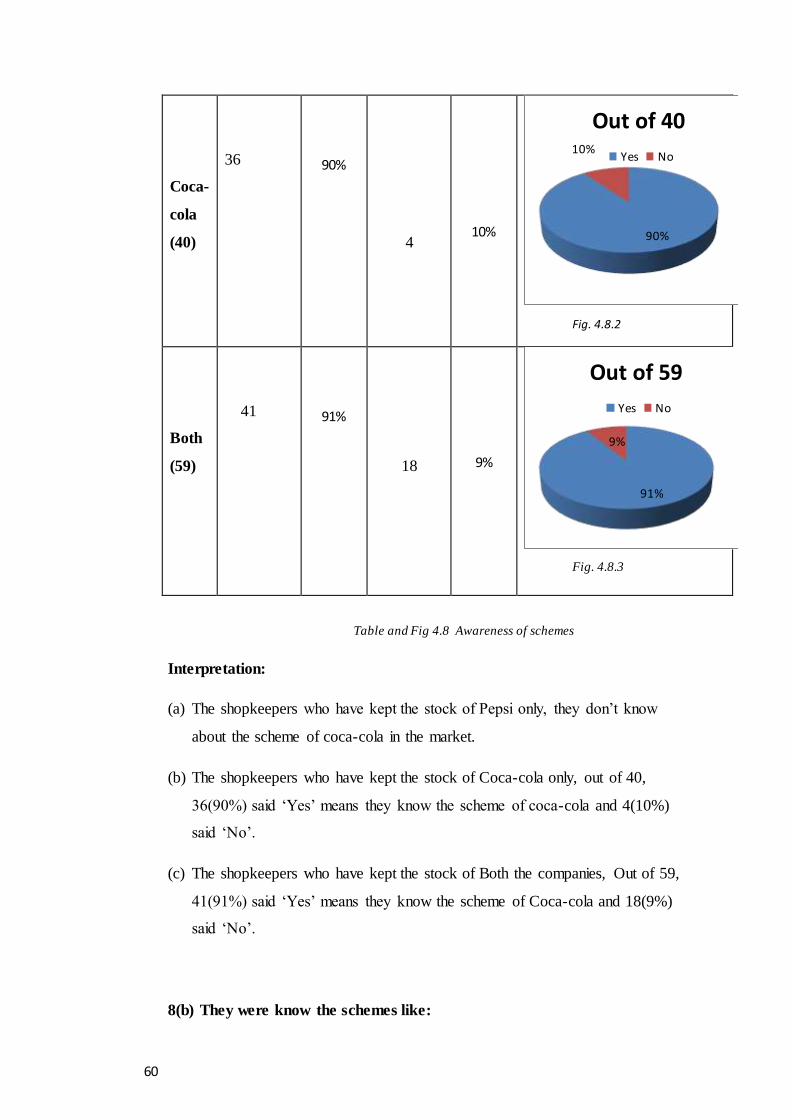
Table and Fig 4.8 Awareness of schemes
Interpretation:
(a) The shopkeepers who have kept the stock of Pepsi only, they don’t know
about the scheme of coca-cola in the market.
(b) The shopkeepers who have kept the stock of Coca-cola only, out of 40,
36(90%) said ‘Yes’ means they know the scheme of coca-cola and 4(10%)
said ‘No’.
(c) The shopkeepers who have kept the stock of Both the companies, Out of 59,
41(91%) said ‘Yes’ means they know the scheme of Coca-cola and 18(9%)
said ‘No’.
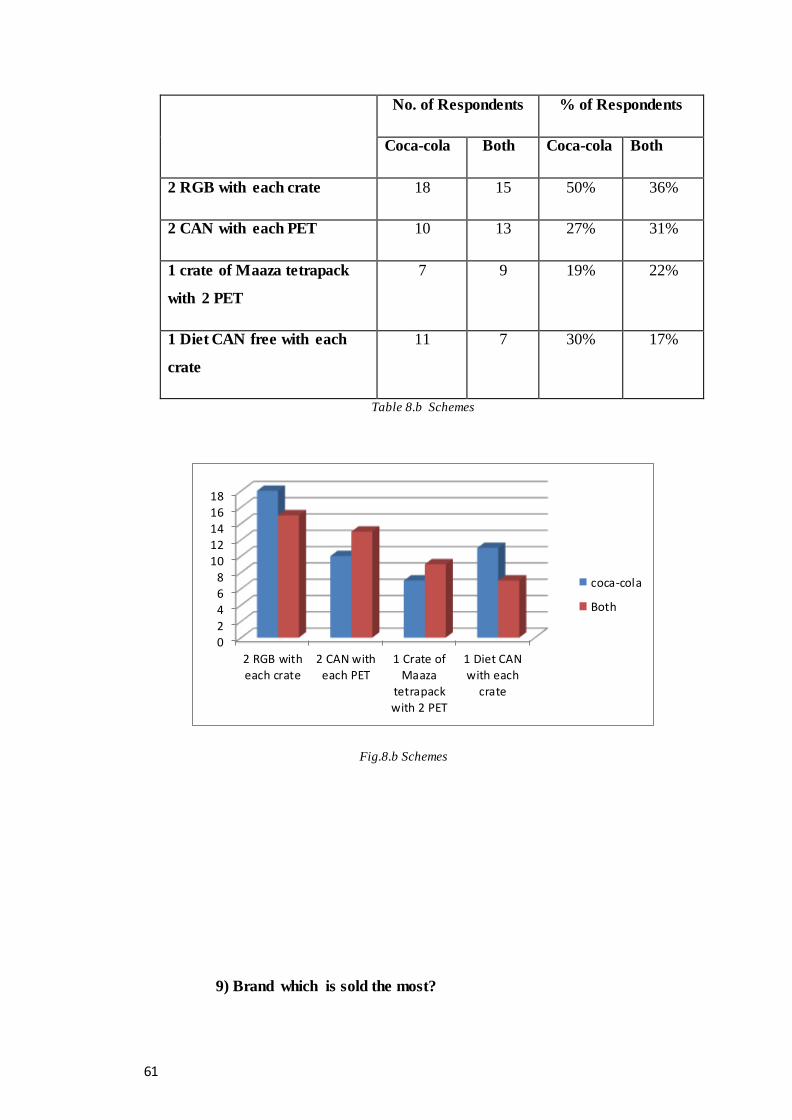
8(b) They were know the schemes like:
Coca-
cola
(40)
36
90%
4
10%
Fig. 4.8.2
Both
(59)
41
91%
18
9%
Fig. 4.8.3
90%
10%
Out of 40
Yes No
91%
9%
Out of 59
Yes No
61
No. of Respondents % of Respondents
Coca-cola Both Coca-cola Both
2 RGB with each crate 18 15 50% 36%
2 CAN with each PET 10 13 27% 31%
1 crate of Maaza tetrapack
with 2 PET
7 9 19% 22%
1 Diet CAN free with each
crate
11 7 30% 17%
Table 8.b Schemes
Fig.8.b Schemes
9) Brand which is sold the most?
0
2
4
6
8
10
12
14
16
18
2 RGB with
each crate
2 CAN with
each PET
1 Crate of
Maaza
tetrapack
with 2 PET
1 Diet CAN
with each
crate
coca-cola
Both
62
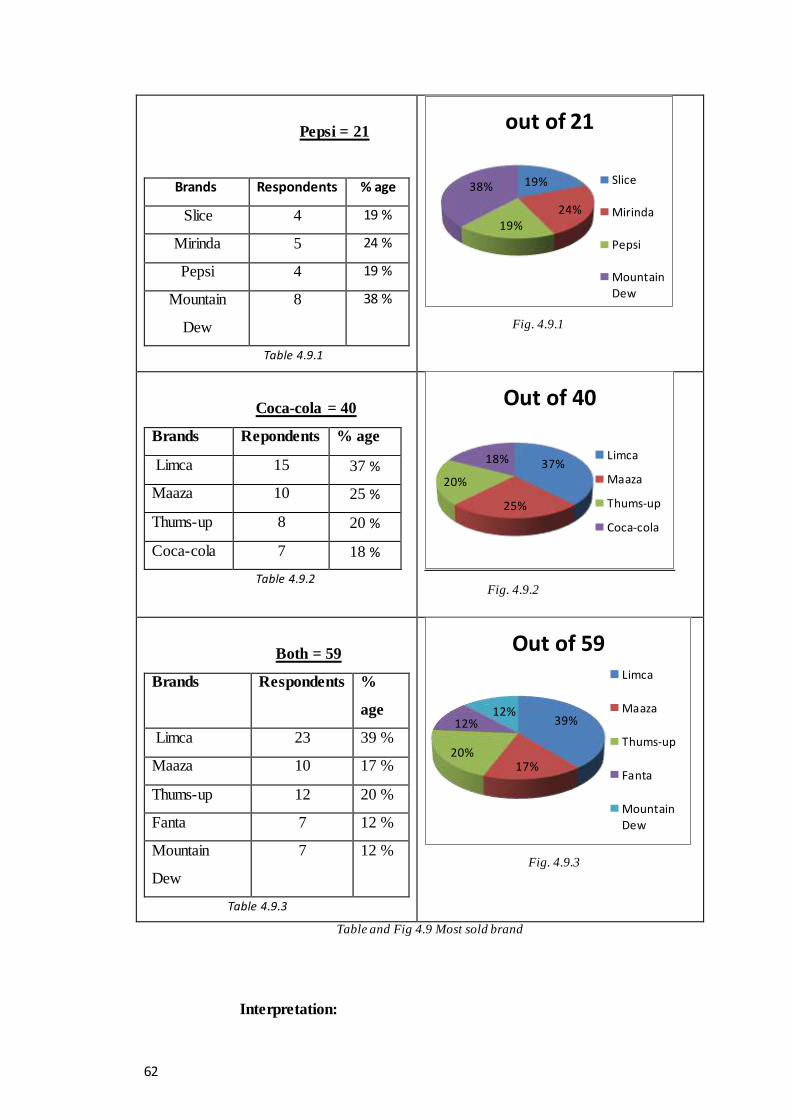
Pepsi = 21
Brands Respondents % age
Slice 4 19 %
Mirinda 5 24 %
Pepsi 4 19 %
Mountain
Dew
8 38 %
Table 4.9.1
Fig. 4.9.1
Coca-cola = 40
Brands Repondents % age
Limca 15 37 %
Maaza 10 25 %
Thums-up 8 20 %
Coca-cola 7 18 %
Table 4.9.2
Fig. 4.9.2
Both = 59
Brands Respondents %
age
Limca 23 39 %
Maaza 10 17 %
Thums-up 12 20 %
Fanta 7 12 %
Mountain
Dew
7 12 %
Table 4.9.3
Fig. 4.9.3
Table and Fig 4.9 Most sold brand
Interpretation:
19%
24%19%
38%
out of 21
Slice
Mirinda
Pepsi
Mountain
Dew
37%
25%
20%
18%
Out of 40
Limca
Maaza
Thums-up
Coca-cola
39%
17%20%
12%12%
Out of 59Limca
Maaza
Thums-up
Fanta
Mountain
Dew
63
In the above question, It’s tried to find that out of 120 shopkeepers
which brand they are selling most, and found that,
o Out of Pepsi monopolies (21),
8(38%) said Mountain dew,
5(24%) said Mirinda and
Pepsi and Slice 4(19%) – 4(19%) each.
o Out of Coca-cola monopolies (40),
15(37%) said Limca.
10(25%) said Maaza,
8(20%) said Thums-up, and
7(18%) said Coke.
o Out of both (59),
23(39%) said Limca,
10(17%) said Maaza,
12(20%) said Thums-up,
Fanta and Mountain Dew 7(12%) – 7(12%) each.
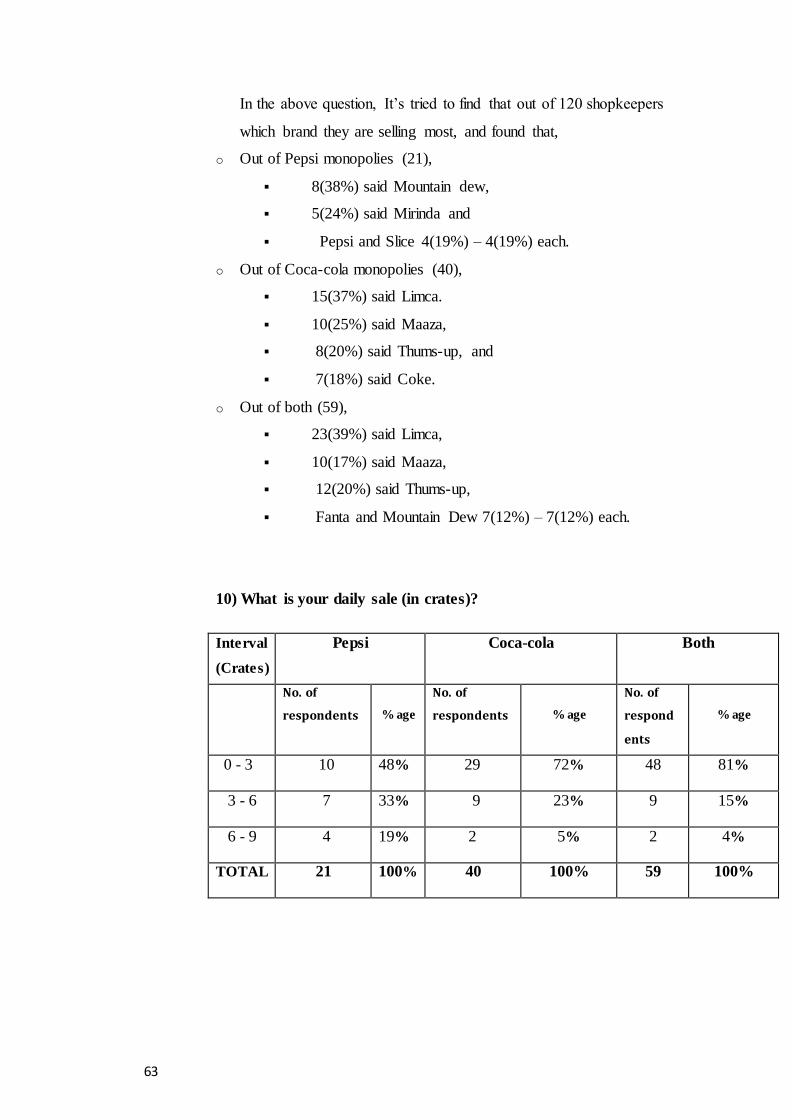
10) What is your daily sale (in crates)?
Interval
(Crates)
Pepsi Coca-cola Both
No. of
respondents
% age
No. of
respondents
% age
No. of
respond
ents
% age
0 - 3 10 48% 29 72% 48 81%
3 - 6 7 33% 9 23% 9 15%
6 - 9 4 19% 2 5% 2 4%
TOTAL 21 100% 40 100% 59 100%
64
T
a
b
l
e
a
n
d
F
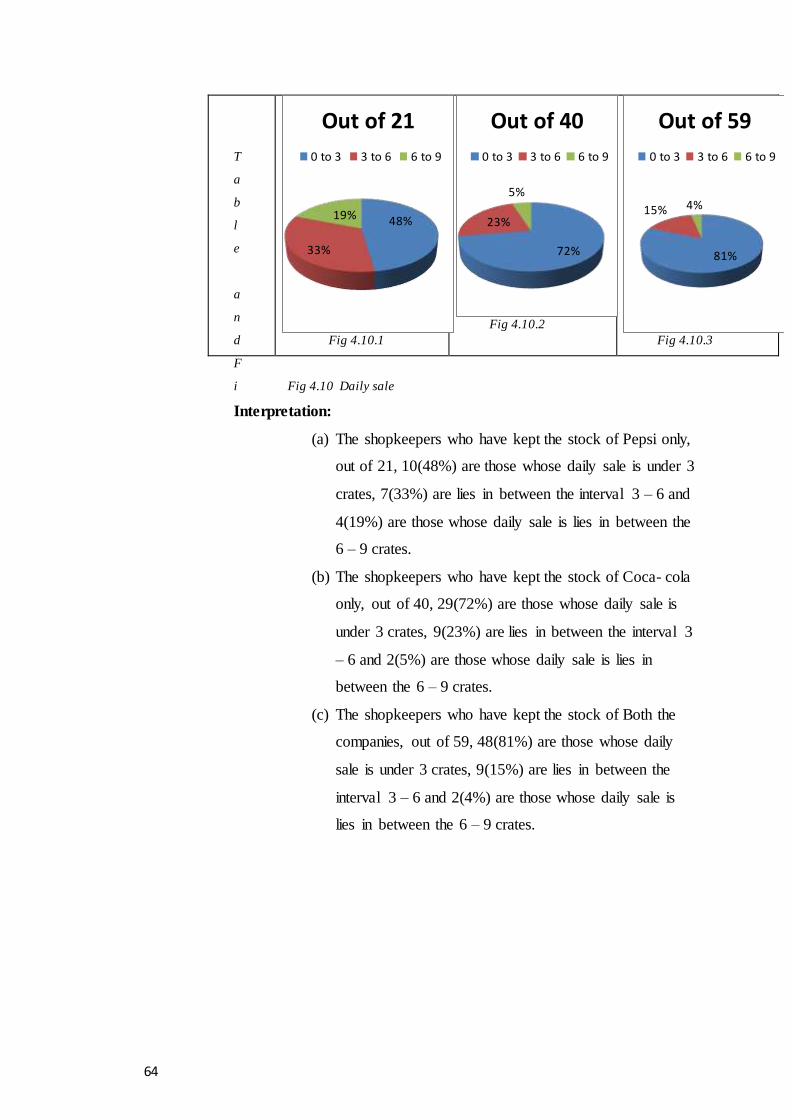
i Fig 4.10 Daily sale
Interpretation:
(a) The shopkeepers who have kept the stock of Pepsi only,
out of 21, 10(48%) are those whose daily sale is under 3
crates, 7(33%) are lies in between the interval 3 – 6 and
4(19%) are those whose daily sale is lies in between the
6 – 9 crates.
(b) The shopkeepers who have kept the stock of Coca- cola
only, out of 40, 29(72%) are those whose daily sale is
under 3 crates, 9(23%) are lies in between the interval 3
– 6 and 2(5%) are those whose daily sale is lies in
between the 6 – 9 crates.
(c) The shopkeepers who have kept the stock of Both the
companies, out of 59, 48(81%) are those whose daily
sale is under 3 crates, 9(15%) are lies in between the
interval 3 – 6 and 2(4%) are those whose daily sale is
lies in between the 6 – 9 crates.
Fig 4.10.1 Fig 4.10.2
Fig 4.10.3
48%
33%
19%
Out of 21
0 to 3 3 to 6 6 to 9
72%
23%
5%
Out of 40
0 to 3 3 to 6 6 to 9
81%
15% 4%
Out of 59
0 to 3 3 to 6 6 to 9
65
Chapter 5
FINDING
1. Maximum respondents have kept the stock of both Pepsico and Coca-cola,
followed by respondents keeping stock of only Coca-cola.
2. Maximum respondents have given the reason of good behavior for keeping
the stock of Pepsico only, followed by visi-cooler provided and range of offer
on the second place.
3. Maximum respondents have given the reason of less demand for not keeping
the stock of Pepsico only, followed by delivery problem and lack of schemes.
4. Maximum respondents have given the reason of Misbehavior of the
salespersons for not keeping the stock of Coca-cola only, followed by visi-
cooler not given.
5. Maximum respondents have said that there is no any major alternative of
LIMCA present in the market.
6. Maximum respondents have kept the stock of Coca-cola from more than 5
years and less than 15 years.
7. Maximum respondents have kept the stock of Pepsico from more than 5 years
and less than 10 years.
8. Maximum respondents know the schemes of Coca-cola which are currently
running in the market.
9. Most selling brand of Coca-cola company is LIMCA and most selling brand of
Pepsico company is MOUNTAIN DEW.
10. Maximum respondents have said that their daily sale is less than 3 crates.
66
5.1 Conclusion:
This project is playing a very important role for the company. With the help
of this project, Company found that the market share of Coca-cola is much better than
its major competitor Pepsico. in the Amritsar city. There are some outlets who have
kept only Pepsico. products (monopoly) and the reasons behind the company were
found, and gave those reasons to the company. After known their reasons, company
made contact with those retailers and break Pepsi monopoly by providing them better
schemes. With this, sale of the company has been increased. Definitely when sales
increase then profits also increases. With the help of this project company has
increased its sale in Amritsar region.
With the help of this project, company found the most selling brand of
Pepsico. company is their Mountain Dew, people are preferring Mountain Dew than
Sprite and Coca-cola company’s most selling brand is Limca. And Company found
that there is no any alternative/substitute of Limca in the market.
With the help of this project, company found that, sale of Coca-cola’s
product is increasing day by day.
5.2 RECOMMENDATIONS
1) Behavior: Behavior of sales man matters a lot while making a sale. I found in
my research that the behavior of the salesmen are not good with outlets
owners. So, there is need of proper classes to the salespersons in which it is
teach that how they behave with outlets owners or to improve the
communication level.
According to me they should follow the following procedure:
a) Preparation: First of all, they should check the stock in the van, bill
book or order book, or any necessary thing e.t.c. before leaving from
depot.
b) Greet the customer: Second, they should greet the customer before
making a sale. With this, customers will feel good.
c) Check Visi-Cooler: Third, they should check the visi-cooler of the
outlet with the permission of the owner and notice some points like:
(i) On (Cooling)
(ii) Purity
(iii) Brand order
67
(iv) Availability of products
d) Tell them Scheme: Fourth, they should tell the daily scheme to the
customers.
e) Take an order: Fifth, take order from the customers.
(f) Collect Payment: Sixth, after providing the stock to customer then
collect the total payment.
(g) Administration: Seventh, Cut the proper bill.
2) REGULAR VISIT TO CUSTOMERS: Salesmen should try to visit each
and every store daily. If any customer is not giving them an order then, ask the
reason.
3) FOCUS ON RED -: RED (Right Execution Daily) theory says that If we are
gaining in RED score our MARKET SHARE will automatically increase.
Sales team should focus on RED. They should be liable for execution as per
red norms.
4) REVIEW OF SALES TEAM: - There should be timely review of sales team.
Timely training should be given to them as competition is increasing day by
day. DGM(Deputy General Manager) and ASM(Area Sales Manager) should
timely motivate them and teach them how to get extra sales.
5) INCENTIVES: - According to management Incentive is the best tool to
motivate the employees. Here incentive is related to sales. If sales increases
company profit will also increases. To enjoy the more profits, Company
should plan some handsome incentive for sales man and supervisors. We are
talking about sales men and supervisor only because they are the only person
who knows the shop keepers, their weakness and strength. If Company plan
handsome incentive for them they are motivated to perform better as in return
they will be rewarded for their superior performance.
6) FOCUS BRAND: - In market share report the company will show how their
brands are doing in markets. The company will know which brand is gaining
or which brand is losing. The DGM should make an action plan for the losing
brand. The focus on losing brand should be more as comparative to others. If 2
or more brands are losing then focus is on week basis like- A brand in first
week and B brand in second week and similarly others.
68
7) LEAKAGE AND BREAKAGE: - Leakage and breakage should be out from
trucks daily in peak season and weekly in other seasons. As if they are in the
trucks they are blocking the space and sales.
8) TRUCKS OUT TIME: - In a soft drink business the shopkeeper will buy the
product from that truck only which comes first to them. So for this all trucks
should be out from depot at 8:30 am at the max. The strategy should be that if
competitor trucks reach at a market at 9 am company truck should reach at
8:40 am. This will helps in increasing sales.
9) SUGGESTIONS and COMPLAINTS: Company should be implementing
the customers’ suggestions and complaints about products, service policies,
price changes, advertising companies etc.
5.3 LEARNING EXPERIENCE
The first thing that I came to know is how to work in the market i.e. the way of
doing things in the market..
I also came to know the working of the Coca Cola Company i.e. how the
company manages its affairs.
I also learn the working of Marketing managers and sales person in the
market.
I have also learned some practical work at outlets like to set the brand order in
the visi-cooler, complete the activation element etc.
I also learned from my study that how they break the competitors monopoly.
69
References
Kotler,N., Keller K., “Marketing Management”, Prentice Hall of India pvt. Ltd., 2007,
New delhi.
Malhotra ,N., “Marketing Research”, Pearson Education, Fifth Edition, 2008, New
delhi.
Bommer, M., O’Neil B. And Treat, S.,”Strategic Assessment of the supply chain
interface: a beverage industry case study” International Journal of Physical
Distribution and logistics management, Volume 31, Number 1, 2001, pp. 11-25(15).
”http://www.ingentaconnect.com/content/mcb/005/2001/00000031/00000001/art0000
1?crawler=true”.
Bruner, R.F., “Coke Vs. Pepsi, 2001 (V. 4.1)”, Darden Case No. UVA-F-1340.
Available at SSRN: http://ssrn.com/abstract=909706”.
Hartogh, M., “It's Still the Real Thing: A Profile of the Coca Cola Company” (May 1,
2002), Available at SSRN: http://ssrn.com/abstract=1030577”.
Parry, M.E., “Cott versus Coca-Cola, 1993: The Private Label Challenge”, Darden
Case No. UVA-M-0585. Available at SSRN: http://ssrn.com/abstract=1420566”.
Websites:
http://www.coca-colaindia.com/quality/quality_awards.aspx
http://www.thecocacolacompany.com/presscenter/presskit_cce_press_release.html
http://www.thecocacolacompany.com/brands/brandlist.html
http://www.solarnavigator.net/sponsorship/coca_cola.htm
http://www.linkedin.com/companies/the-coca-cola-company
70
Questionnaire
1) Of which company do you keep the stock of cold-drinks?
Coca-cola Pepsi Both
2) If only PEPSI then why?
Supply Agreement
Offers/discounts Demand
Any other ____________________________
3) If you don’t keep the PEPSI then why?
Miscommunication of offers Misbehavior
Delivery Scheme
Any other __________________________________
4) If you don’t keep the Coca-cola then why?
Miscommunication of offers Misbehavior
Delivery Scheme
Any other _________________________________
5) Which brand do you sell the most?
____________________________
6) Is there any alternative/substitute of LIMCA?
Yes No
If yes, then which one __________________
7) For how long are you keeping the stock of Coca -cola?
_____________________________
8) For how long are you keeping the stock of PEPSI?
_____________________________
9) Do you know the scheme of coca-cola in the market?
Yes No
(a) If yes, then which schemes?
________________________________
10) What is your daily sale (in crates)?
_________________________________
71
Market ___________________________________ Shop _______________________________
Mob _________________________________ Date _______________