company’s ex parte
TRANSCRIPT

August 31, 2020 Lisa Felice Executive Secretary Michigan Public Service Commission 7109 West Saginaw Highway Lansing, MI 48917
RE: In the matter, on the Commission's own motion, regarding the regulatory reviews, revisions, determinations, and/or approvals necessary for DTE Electric Company to fully comply with Public Act 295 of 2008
MPSC Case No: U-20851 Dear Ms. Felice: Attached for electronic filing in the above referenced matter is DTE Electric Company’s Ex Parte Application and Affidavits of David B. Harwood, Patrick D. Kauffman, Thomas W. Lacey, Marcus J. Rivard, and Sherri L. Wisniewski. Also attached is the Proof of Service. Very truly yours, Lauren D. Donofrio LDD/erb Enclosure c: Service List
DTE Electric Company One Energy Plaza, 1635 WCB Detroit, MI 48226-1279
Lauren D. Donofrio (313) 235-4017 [email protected]

1
STATE OF MICHIGAN
BEFORE THE MICHIGAN PUBLIC SERVICE COMMISSION
In the matter of DTE ELECTRIC COMPANY’S ) application for the regulatory reviews, revisions, ) determinations, and/or approvals necessary for ) Case No. U-20851 to fully comply with Public Act 295 of 2008 )
DTE ELECTRIC’S APPLICATION FOR EX PARTE APPROVAL OF AUGUST 2020 AMENDED RENEWABLE ENERGY PLAN
DTE Electric Company (“DTE Electric” or the “Company”) files this Application pursuant
to 2008 PA 295, as amended by 2016 PA 342, MCL 460.1001 et seq., the Rules of Practice and
Procedure Before the Commission (R 460.17101 et seq.), and the Michigan Administrative
Procedures Act (MCL 24.201 et seq.). DTE Electric requests that the Michigan Public Service
Commission (“Commission”) approve the Company’s August 2020 Amended Renewable Energy
Plan (“August 2020 REP” or “August 2020 Plan”) prepared in accordance with Public Act 295 of
2008 as amended by Public Act 342 of 2016, MCL 460.1001 et seq. In support of the relief
requested in this Application, DTE Electric states as follows:
1. DTE Electric is a corporation organized and existing under and by virtue of the
laws of the State of Michigan, with its principal office at One Energy Plaza, Detroit, Michigan
48226. DTE Electric is a wholly-owned subsidiary of DTE Energy Company supplying retail
electric service to customers located in Southeast Michigan. The Company is a public utility and
Electric Provider (as defined under MCL 460.1005(a)(i)) with more than 1,000,000 retail
customers in Michigan and is therefore subject to the jurisdiction of the Commission per various

2
provisions of Public Act 419 of 1919, as amended, MCL 460.51 et seq.; Public Act 3 of 1939, as
amended MCL 460.1 et seq.; and 2008 PA 295.
2. DTE Electric presently serves its jurisdictional metered retail electric customers
under the rates and charges contained in the Company’s Commission-approved tariffs.
3. This Application is filed in accordance with the Clean, Renewable, and Efficient
Energy Act, 2008 PA 295, as amended by 2016 PA 342, MCL 460.1001 et seq.
4. The Company’s affidavits and attachments filed contemporaneously with this
Application are incorporated in this Application by reference.
5. This August 2020 REP makes certain changes to the Amended REP approved by
the Commission in its July 9, 2020 order in Case No. U-18232. These changes are limited to
including in the REP the Voluntary Green Pricing (VGP) program build plan as set forth in the
contemporaneously-filed VGP review in Case No. U-20713. Unless specifically changed by the
Affidavits accompanying this August 2020 Amended REP, all other aspects of the Plan remain the
same. Consistent with 2008 PA 295, as amended, the Company’s Renewable Energy Plan: a)
achieves compliance with MCL 460.1028; b) continues to utilize a 1-year historical weather-
normalized retail sales in the calculation of its renewable energy credit portfolio; c) includes the
expected incremental cost of compliance over the Plan period; d) describes the Company’s bidding
process; e) makes no changes to the non-volumetric revenue recovery mechanism for the recovery
of the incremental cost of compliance in the Company’s customer rates; f) continues the
mechanism which would allow the Company to maintain an accumulation of reserve funds in
advance of expenditure and maintain a regulatory liability that accrues interest at the Company’s
average short-term borrowing rate during the appropriate period; and h) meets the location
3
requirements of MCL 460.1029. The Company’s evidentiary presentation also describes how the
August 2020 Amended Plan is reasonable and prudent.
6. The Company also requests the Commission to approve transfer prices proposed in
Case No. U-18242 for DTE Electric Renewable Energy Contracts and DTE Electric-owned
Renewable Energy Systems for purposes of recovery through DTE Electric’s power supply cost
recovery process consistent with MCL 460.1047.
7. The revenue recovery mechanism surcharges which are currently set to $0.00 for
all customer classes will remain $0.00.
8. The Renewable Energy Credits associated with DTE Electric’s voluntary
renewable energy programs were not used to demonstrate compliance with MCL 460.1028.
9. The approvals and assurances requested in this Application will not result in any
modification of the revenue recovery mechanism, as such, the Commission may approve the
August 2020 Amended REP without a contested case hearing pursuant to MCL 460.1022(4).
Moreover, the approvals and assurances requested in this Application will not result in “an
alteration or amendment in rates or rate schedules” and “will not result in an increase in the cost
of service to customers” because the surcharge will remain at zero. Therefore, per MCL 460.6a(1),
the relief requested in this Application “may be authorized and approved without notice or
hearing.” (MCL 460.6a(1)). Neither will there be any increase in DTE Electric’s rates for electric
service resulting from the requested approvals and assurances. Thus, approval of this
Application without notice or hearing is lawful and appropriate.
10. As discussed in this Application and in the Affidavits and attachments thereto, DTE
Electric’s August 2020 Amended Renewable Energy Plan is reasonable and prudent and satisfies
the requirements of 2008 PA 295, as amended.

4
WHEREFORE, for the reasons state above, DTE Electric requests that the Commission:
A. Determine that the Company’s August 2020 Amended Renewable Energy Plan is
reasonable and prudent, and is consistent with all applicable provisions of 2008 PA 295, as
amended;
B. Enter an Order approving the revenue recovery mechanism surcharge of
$0.00/meter for all customer classes and allowing the Company to maintain a regulatory liability
throughout the Plan period through the application of transfer prices as requested in this filing.
C. Authorize the necessary accounting authority to effectuate the Company’s
Renewable Energy Plan; and
D. Grant DTE Electric such further additional relief as the Commission may deem
appropriate.
DTE ELECTRIC COMPANY Legal Department
By:_______________________________________
Lauren D. Donofrio (P66026) Paula M. Johnson-Bacon (P55862) Attorneys for DTE Electric Company
One Energy Plaza, 1635 WCB Detroit, Michigan 48226 (313) 235-4017
Dated: August 31, 2020

1
STATE OF MICHIGAN
BEFORE THE MICHIGAN PUBLIC SERVICE COMMISSION In the matter of DTE ELECTRIC COMPANY’S ) application for the regulatory reviews, revisions, ) determinations, and/or approvals necessary for ) Case No. U-20851 to fully comply with Public Act 295 of 2008 )
AFFIDAVIT OF DAVID B. HARWOOD IN SUPPORT OF DTE ELECTRIC COMPANY’S APPLICATION FOR APPROVAL OF THE AUGUST 2020 AMENDED
RENEWABLE ENERGY PLAN
STATE OF MICHIGAN ) ) COUNTY OF WAYNE )
David B. Harwood, being first duly sworn, deposes and says:
1. My title is Director of Renewable Energy Strategy for DTE Electric Company
(“DTE Electric” or the “Company”). I graduated from the University of Michigan in 1983 with a
Bachelor of Science Degree in Chemical Engineering. In 2001, I received a Master of Business
Administration Degree from Baker College. I began my career at DTE Energy in 1983 as a power
plant engineer responsible for water chemistry and environmental processes. After approximately
ten years of plant experience with increasing levels of leadership responsibility, I led Company
asset acquisition teams responsible for power plant valuations and participation in numerous utility
power plant auctions during an era of utility generation divestitures in the East and Midwest in the
late 1990’s. I was appointed Director of Generation Optimization in 2000, a new organization

2
within the Company responsible for generation reliability planning, generation capital budget and
projects, long-term resource planning, and optimization of wholesale market participation before
and during the implementation the Midcontinent Independent System Operator (MISO). I
subsequently held Director level positions in Planning and Strategy, Generation Engineering,
Nuclear Development, and Major Enterprise Projects. In 2013, I was appointed Director of
Renewable Energy responsible for Renewable Portfolio Standard (RPS) compliance under 2008
PA 295 (as amended by 2016 PA 342), renewable project development, commercial contracts,
regulatory filings, and day to day operation and maintenance of the Company’s renewable energy
fleet. Currently, my role is focused on Renewable Energy strategy including RPS compliance,
additional renewable supply planning, and contracting projects for RPS compliance, voluntary
renewable programs and the Company’s net zero carbon goals. I sponsored testimony before the
Michigan Public Service Commission (MPSC or Commission) in General Rate Case No. U-15244
and Renewable Energy Reconciliation Case No. U-17632. I also sponsored testimony in the
Company’s 2020 Renewable Energy Plan (REP) Case No. U-18232, filed March 31, 2020.
2. I am sponsoring the following attachments, which were prepared by me or under
my supervision:
Attachment Description
1 Renewable Energy Plan Overview
2 Renewable Energy Plan Summary
3 DTE Electric Owned Renewable Energy Facilities Generation
4 RECs/ACECs from Renewable Energy & Associated Cost For Use in
2016 PA 342 Activities for the Period 2016-2029

3
5 Solar Assumptions for Future Builds
3. With this filing, DTE Electric is seeking ex parte approval of the 2020 August
Amended Renewable Energy Plan (REP). The purpose of this amendment is to incorporate the
projects that will supply MIGreenPower demand supported by Witness Calka in the concurrently-
filed VGP Case No. U-20713 – and reflect the resulting changes to the REP plan. This 2020 August
Amended REP includes the changes approved in the July 9, 2020 order in Case No. U-18232. This
2020 August Amended REP still shows that the Company expects to be in compliance with the
Act’s renewable energy credit (REC) standards through 2029 and, as shown in Attachment 2, it
does not change or increase the Renewable Energy Plan Surcharge (REPS) or recovery
mechanism.
4. The Company’s August 2020 Amended REP proposal includes the portfolio of all
approved assets in the previously approved plan. The Company also proposes two Company-
owned solar parks totaling approximately 320MW, and one solar PPA of approximately 100 MW,
all with 2022 Commercial Operation dates and based on actual bid pricing, as a result of the
Company-issued 2019 requests for proposal (RFP). In addition to the 420 MW proposed for 2022,
the Company proposes a 61.9 MW generic solar build for 2023, a 182.8 MW generic solar build
for 2024 and a 131.7 MW generic solar build for 2025. The revised portfolio of assets provides for
the forecasted voluntary green pricing programs demand as outlined in the concurrently-filed VGP
Case No. U-20713.
5. This 2020 August Amended REP does not change any of the assets or forecast for
compliance, thus it still shows that the Company expects to generate or purchase RECs to satisfy

4
the Act’s REC standards through 2029.
6. The changes being incorporated into this August 2020 Amended REP impact the
Plan’s forecasted total revenue requirement, VGP subscribed generation and revenue, incremental
cost of compliance, and regulatory liability ending balance as shown in Attachment 1 and 2. The
total estimated revenue requirement including VGP projects for years 2020 through August 2029
is approximately $5,466 million, due to the additional VGP projects added. The VGP subscribed
generation increased by the total generation of the new VGP projects added and as a result, the
forecasted revenue from Voluntary Green Pricing Programs increased to approximately $1,060
million for years 2020 through August 2029. The total estimated incremental cost of compliance
for years 2020 through August 2029 is approximately $34 million. The new estimated regulatory
liability ending balance in August 2029 is approximately $27 million.
7. This Plan includes all previously approved VGP assets that supply the Company’s
voluntary green pricing program under Rider 17 and Rider 19 and includes the six VGP assets the
Company proposes in this Plan. As per the build plan supported by Witness Calka in the
concurrently-filed VGP Case No. U-20713 the Company will need 420 MW in 2022, 61.9 MW in
2023, 182.8 MW in 2024 and 131.7 MW in 2025 to support the forecasted demand for
MIGreenPower. The Company has identified three projects from the Company-issued 2019 RFPs
to supply the 2022 demand, while the 2023-2025 demand is modeled as generic solar builds.
8. Subscribed portions of the approved assets attributable to MIGreenPower have
been subtracted from the REP and the revenue from those subscriptions is shown on line 34 of
Attachment 2. Revenue from the subscribed assets is shown in the incremental cost of compliance
as one of the costs recovered to offset the revenue requirement. These costs are calculated based
5
on the actual or projected subscription fee for the VGP program. No VGP assets will utilize the
transfer price mechanism proposed and approved in the July 9, 2020 order in Case No 18232.
Subscribed portions of the VGP programs are incremental to the REP and the associated RECs are
retired on behalf of subscribers. Consistent with the July 2019 Order in Case No 18232, the Isabella
I and II, Fairbanks and the three new proposed VGP project contracts are all modeled at the
prevailing return on equity for the Company due to the assumption and forecast that these assets
will be fully subscribed under MIGreenPower.
9. The Company’s August 2020 Amended REP runs through August 2029 and is
based on the Company’s best estimates and forecasts regarding a wide range of factors. As shown
in Attachment 5, this plan makes assumptions on future capacity factor and installed cost for the
new VGP projects added. All new VGP projects and resources included in this 2020 Amended
REP filing are new solar farms in the Plan. The plan proposes three solar farms in 2022 that are
approximately 420 MW (two Company-owned and one PPA), one approximately 62 MW solar
farm in 2023, one approximately 183 MW solar farm in 2024 and one approximately 132 MW
solar farm in 2025. Of the two 2022 Company-owned assets, one is a 120 MW facility with an
NCF of 23.5%, installed cost of approximately $1321/kW and an estimated levelized price
between $51-$54/MWh. The other 2022 Company owned asset is a 200 MW facility with an NCF
of 23.8%, installed cost of approximately $1,293/kW and an estimated levelized price between
$48-$51/MWh. For the 2023, 2024, and 2025 generic solar builds, the Company assumed an NCF
of 23.9% based on the average NCF of all 2021 and 2022 solar assets already approved or being
proposed with this plan. The estimated installed costs for the 2023 generic solar build is
approximately $1312/kW, based on applying the 2019 NREL ATB Solar Chicago (med) CAPEX

6
growth rate between 2022 and 2023, to the average installed cost for the two 2022 proposed solar
assets ($1307/kW). This method was also used for the 2024 and 2025 generic solar assets, resulting
in an approximately $1316/kW and $1320/kW installed cost accordingly. The Company has also
assumed that the 2023 project will qualify for 30% ITC while all 2024 and later solar projects will
qualify for 10% ITC which supports the higher estimated levelized price for the 2024 and 2025
generic solar projects. All other assumptions are consistent with the previously approved Plan.
10. For all Company-owned and PPA projects (wind and solar) that are operational or
have been approved as of the time of the filing, the forward-looking capacity factor projections are
consistent with the portions of the Plan that were approved in the MPSC’s July 9, 2020 order in
Case U-18232, which were based on historical performance of the existing farms and projected
for approved but not yet operational projects.
11. The Company has modeled all future generic build for VGP as Company-owned,
tax equity financed, assets in this plan. Additionally, based on the Company’s forecasts described
above, solar is the most cost effective way to supply the demand of the voluntary green pricing
programs. Therefore, the Company has modeled primarily solar energy assets to meet this
demand. Changes in these forecasts could impact which technology is the most prudent means to
meet this demand. This was done for simplicity’s sake only and does not necessarily reflect the
actual ownership structure for any future project. All future projects will be determined via
competitive bidding process. The Company will continue to competitively bid all major contracts
for renewable energy assets, and the bid process will be audited by the Commission Staff for
prudency.
12. Based on my experience and the above determinations, it is in DTE Electric’s as

7
well as its customers’ best interest for the Commission to approve the Company’s August 2020
Amended Renewable Energy Plan and grant the Company’s related requests.
Further, Affiant sayeth not.
________________________________ David B. Harwood Subscribed and sworn to before me this 31st day of August 2020. ___________________________ Estella R. Branson, Notary Public Oakland County, Michigan My Commission Expires: 10-26-2023 Acting in Wayne County

Michigan Public Service Commission Case No.: U-20851DTE Electric Company Attachment: 1
2016 PA 342 Renewable Energy Plan - August 2020 Amended REP Affiant: D. B. HarwoodRenewable Energy Plan Overview Page: 1 of 2
(a) (b) (c) (d) (e) (f) (g) (h) (i) (j) (k) (l) (m) (n)
LineNo. RECs Percent RECs Percent RECs Percent RECs Percent RECs Percent RECs Percent RECs Percent1 Technology Mix (1)2 Wind 2,880,662 75.96% 2,777,840 72.15% 3,193,396 76.29% 3,711,891 79.59% 3,834,556 80.08% 4,378,656 77.21% 4,378,656 77.17%3 Owned 1,499,083 39.53% 1,459,134 37.90% 1,814,198 43.34% 2,284,746 48.99% 2,407,412 50.28% 2,951,511 52.05% 2,951,511 52.02%4 Purchased 1,381,579 36.43% 1,318,706 34.25% 1,379,198 32.95% 1,427,145 30.60% 1,427,145 29.80% 1,427,145 25.17% 1,427,145 25.15%5 Solar 82,485 2.18% 93,711 2.43% 87,406 2.09% 68,412 1.47% 49,274 1.03% 225,540 3.98% 312,176 5.50%6 Owned 68,680 1.81% 80,055 2.08% 73,860 1.76% 54,973 1.18% 30,301 0.63% 37,477 0.66% 37,289 0.66%7 Purchased 13,805 0.36% 13,656 0.35% 13,546 0.32% 13,438 0.29% 18,973 0.40% 188,063 3.32% 274,887 4.84%8 Biomass 113,187 2.98% 122,769 3.19% 122,768 2.93% 117,628 2.52% 117,306 2.45% 117,306 2.07% 117,306 2.07%9 Owned 0 0.00% 0 0.00% 0 0.00% 0 0.00% 0 0.00% 0 0.00% 0 0.00%10 Purchased 113,187 2.98% 122,769 3.19% 122,768 2.93% 117,628 2.52% 117,306 2.45% 117,306 2.07% 117,306 2.07%11 Steam 0 0.00% 0 0.00% 0 0.00% 0 0.00% 0 0.00% 0 0.00% 0 0.00%12 Owned 0 0.00% 0 0.00% 0 0.00% 0 0.00% 0 0.00% 0 0.00% 0 0.00%13 Purchased 0 0.00% 0 0.00% 0 0.00% 0 0.00% 0 0.00% 0 0.00% 0 0.00%14 Geothermal 0 0.00% 0 0.00% 0 0.00% 0 0.00% 0 0.00% 0 0.00% 0 0.00%15 Owned 0 0.00% 0 0.00% 0 0.00% 0 0.00% 0 0.00% 0 0.00% 0 0.00%16 Purchased 0 0.00% 0 0.00% 0 0.00% 0 0.00% 0 0.00% 0 0.00% 0 0.00%17 Municipal Solid Waste 181,880 4.80% 122,932 3.19% 22,386 0.53% 0 0.00% 0 0.00% 0 0.00% 0 0.00%18 Owned 0 0.00% 0 0.00% 0 0.00% 0 0.00% 0 0.00% 0 0.00% 0 0.00%19 Purchased 181,880 4.80% 122,932 3.19% 22,386 0.53% 0 0.00% 0 0.00% 0 0.00% 0 0.00%20 Landfill Gas 300,471 7.92% 305,531 7.94% 318,458 7.61% 315,930 6.77% 315,787 6.59% 315,787 5.57% 315,787 5.57%21 Owned 0 0.00% 0 0.00% 0 0.00% 0 0.00% 0 0.00% 0 0.00% 0 0.00%22 Purchased 300,471 7.92% 305,531 7.94% 318,458 7.61% 315,930 6.77% 315,787 6.59% 315,787 5.57% 315,787 5.57%23 Hydroelectric 20,387 0.54% 14,668 0.38% 18,444 0.44% 18,913 0.41% 21,412 0.45% 21,412 0.38% 21,412 0.38%24 Owned 0 0.00% 0 0.00% 0 0.00% 0 0.00% 0 0.00% 0 0.00% 0 0.00%25 Purchased 20,387 0.54% 14,668 0.38% 18,444 0.44% 18,913 0.41% 21,412 0.45% 21,412 0.38% 21,412 0.38%26 Incentive 213,066 5.62% 412,534 10.72% 423,083 10.11% 430,842 9.24% 450,035 9.40% 612,115 10.79% 528,492 9.31%27 Owned 148,625 3.92% 358,332 9.31% 355,094 8.48% 364,052 7.81% 382,283 7.98% 520,691 9.18% 424,913 7.49%28 Purchased 64,441 1.70% 54,202 1.41% 67,990 1.62% 66,790 1.43% 67,751 1.41% 91,424 1.61% 103,579 1.83%29 Other 0 0.00% 0 0.00% 0 0.00% 0 0.00% 0 0.00% 0 0.00% 0 0.00%30 Owned 0 0.00% 0 0.00% 0 0.00% 0 0.00% 0 0.00% 0 0.00% 0 0.00%31 Purchased 0 0.00% 0 0.00% 0 0.00% 0 0.00% 0 0.00% 0 0.00% 0 0.00%32 Total 3,792,138 100.00% 3,849,984 100.00% 4,185,942 100.00% 4,663,615 100.00% 4,788,371 100.00% 5,670,816 100.00% 5,673,829 100.00%33
3435 RECs Percent RECs Percent RECs Percent RECs Percent RECs Percent RECs Percent RECs Percent36 Program Type37 PURPA 452,307 96% 389,904 94% 308,890 88% 282,770 63% 285,269 18% 285,269 17% 285,269 12%38 Net Metering (used for compliance) 13,805 3% 13,656 3% 13,546 4% 13,438 3% 13,331 1% 13,224 1% 13,118 1%39 Feed-in Tariffs 0 0% 0 0% 0 0% 0 0% 0 0% 0 0% 0 0%40 Community Solar 0 0% 0 0% 0 0% 0 0% 0 0% 0 0% 0 0%41 Other (VGPs) 5,352 1% 13,088 3% 27,158 8% 154,975 34% 1,311,753 81% 1,393,638 82% 2,009,741 87%42 Total 471,464 100% 416,648 100% 349,594 100% 451,183 100% 1,610,353 100% 1,692,131 100% 2,308,128 100%
(1) Excludes Voluntary Pricing Programs
20222017 2018 2019 2020 2021 2023
2017 2018 2019 2020 2021 2022 2023

Michigan Public Service CommissionDTE Electric Company2016 PA 342 Renewable Energy Plan - August 2020 Amended REP
Renewable Energy Plan Overview
LineNo.1 Technology Mix (1)2 Wind3 Owned4 Purchased5 Solar6 Owned7 Purchased8 Biomass9 Owned10 Purchased11 Steam12 Owned13 Purchased14 Geothermal15 Owned16 Purchased17 Municipal Solid Waste18 Owned19 Purchased20 Landfill Gas21 Owned22 Purchased23 Hydroelectric24 Owned25 Purchased26 Incentive27 Owned28 Purchased29 Other30 Owned31 Purchased32 Total33
343536 Program Type37 PURPA38 Net Metering (used for compliance)39 Feed-in Tariffs40 Community Solar41 Other (VGPs)42 Total
(1) Excludes Voluntary Pricing Programs
Case No.: U-20851Attachment: 1
Affiant: D. B. HarwoodPage: 2 of 2
(o) (p) (q) (r) (s) (t) (u) (v) (w) (x) (y) (z)
RECs Percent RECs Percent RECs Percent RECs Percent RECs Percent RECs Percent
4,390,858 78.51% 4,378,656 79.36% 4,378,656 79.39% 4,378,656 79.43% 4,390,858 79.49% 2,894,104 79.47%2,959,803 52.92% 2,951,511 53.49% 2,951,511 53.51% 2,951,511 53.54% 2,959,803 53.58% 1,942,674 53.35%1,431,055 25.59% 1,427,145 25.87% 1,427,145 25.87% 1,427,145 25.89% 1,431,055 25.91% 951,430 26.13%
310,677 5.55% 308,984 5.60% 307,400 5.57% 305,825 5.55% 304,357 5.51% 202,618 5.56%37,204 0.67% 36,917 0.67% 36,733 0.67% 36,549 0.66% 36,466 0.66% 24,123 0.66%
273,473 4.89% 272,066 4.93% 270,667 4.91% 269,276 4.88% 267,891 4.85% 178,495 4.90%117,628 2.10% 117,306 2.13% 117,306 2.13% 117,306 2.13% 117,628 2.13% 78,204 2.15%
0 0.00% 0 0.00% 0 0.00% 0 0.00% 0 0.00% 0 0.00%117,628 2.10% 117,306 2.13% 117,306 2.13% 117,306 2.13% 117,628 2.13% 78,204 2.15%
0 0.00% 0 0.00% 0 0.00% 0 0.00% 0 0.00% 0 0.00%0 0.00% 0 0.00% 0 0.00% 0 0.00% 0 0.00% 0 0.00%0 0.00% 0 0.00% 0 0.00% 0 0.00% 0 0.00% 0 0.00%0 0.00% 0 0.00% 0 0.00% 0 0.00% 0 0.00% 0 0.00%0 0.00% 0 0.00% 0 0.00% 0 0.00% 0 0.00% 0 0.00%0 0.00% 0 0.00% 0 0.00% 0 0.00% 0 0.00% 0 0.00%0 0.00% 0 0.00% 0 0.00% 0 0.00% 0 0.00% 0 0.00%0 0.00% 0 0.00% 0 0.00% 0 0.00% 0 0.00% 0 0.00%0 0.00% 0 0.00% 0 0.00% 0 0.00% 0 0.00% 0 0.00%
281,555 5.03% 281,412 5.10% 281,412 5.10% 281,412 5.11% 281,555 5.10% 187,608 5.15%0 0.00% 0 0.00% 0 0.00% 0 0.00% 0 0.00% 0 0.00%
281,555 5.03% 281,412 5.10% 281,412 5.10% 281,412 5.11% 281,555 5.10% 187,608 5.15%21,412 0.38% 21,412 0.39% 21,412 0.39% 21,412 0.39% 21,412 0.39% 8,527 0.23%
0 0.00% 0 0.00% 0 0.00% 0 0.00% 0 0.00% 0 0.00%21,412 0.38% 21,412 0.39% 21,412 0.39% 21,412 0.39% 21,412 0.39% 8,527 0.23%
470,937 8.42% 409,598 7.42% 409,512 7.42% 407,811 7.40% 407,862 7.38% 270,493 7.43%373,754 6.68% 312,654 5.67% 312,764 5.67% 311,258 5.65% 311,461 5.64% 206,794 5.68%97,182 1.74% 96,944 1.76% 96,748 1.75% 96,553 1.75% 96,401 1.75% 63,699 1.75%
0 0.00% 0 0.00% 0 0.00% 0 0.00% 0 0.00% 0 0.00%0 0.00% 0 0.00% 0 0.00% 0 0.00% 0 0.00% 0 0.00%0 0.00% 0 0.00% 0 0.00% 0 0.00% 0 0.00% 0 0.00%
5,593,066 100.00% 5,517,368 100.00% 5,515,698 100.00% 5,512,422 100.00% 5,523,670 100.00% 3,641,555 100.00%
RECs Percent RECs Percent RECs Percent RECs Percent RECs Percent RECs Percent
250,894 10% 250,894 9% 250,894 8% 250,894 8% 250,894 8% 161,515 8%13,013 1% 12,909 0% 12,806 0% 12,703 0% 12,602 0% 9,153 0%
0 0% 0 0% 0 0% 0 0% 0 0% 0 0%0 0% 0 0% 0 0% 0 0% 0 0% 0 0%
2,161,873 89% 2,523,707 91% 2,768,845 91% 2,761,351 91% 2,761,233 91% 1,855,982 92%2,425,780 100% 2,787,510 100% 3,032,545 100% 3,024,948 100% 3,024,728 100% 2,026,651 100%
20292024 2025 2026 2027 2028
2027 2028 20292024 2025 2026

Michigan Public Service Commission Case No.: U-20851DTE Electric Company Attachment: 2
2016 PA 342 Renewable Energy Plan - August 2020 Amended REP Affiant: D. B. HarwoodRenewable Energy Plan Summary Page: 1 of 2
(a) (b) (c) (d) (e) (f) (g) (h)
LineNo. 2016 2017 2018 2019 2020 2021 2022
1 Sales and Requirement Calculation Source2 Method: Weather Normalized or 3 Year Average3 If Selected Weather Normalized:4 Prior Year Sales to Retail Customers B-23 MBL Column (i) 42,397,343 41,482,439 40,755,451 5 Prior Year Weather Normalization Factor 0.98 1.00 1.00 6 Prior Year Weather Normalized Sales (Row Number 4 * 5) B-23 MBL Column (i) 41,694,757 41,482,439 40,755,451 7 If Selected 3 Year Average:8 Current Retail Sales to Retail Customers9 3 Year Average of Retail Sales
10
RPS Required Energy Credits (For 2017 and 2018 enter the same amount as 2015 requirement in MIRECS, for 2019 and 2020 enter 12.5% of row 6 or
9, for 2021 enter 15% of row 6 or 9) Calculated 4,244,832 4,244,832 5,299,668 5,211,845 6,222,366 6,113,318 11 Energy Credits12 Energy Credit Beginning Balance Row 21 7,708,845 7,805,244 7,778,349 6,673,607 6,125,377 4,691,382 13 Energy Credits Obtained through Generation/BOT ATT-4 DBH +WP-4 DBH (IRECs) 1,968,951 1,994,765 2,246,023 2,703,772 2,819,996 3,509,679 14 Energy Credits Obtained through PPA ATT-4 DBH+WP-4 DBH (IRECs) 2,061,709 1,937,638 1,929,244 1,946,404 1,955,044 2,147,913 15 Energy Credits Obtained through REC Purchases ATT-4 DBH line 7 310,571 285,534 19,659 13,438 13,331 13,224 16 Plus: Energy Credit Obtained (Row 13 + 14 + 15) Calculated 4,341,231 4,217,936 4,194,926 4,663,615 4,788,371 5,670,816 17 Less: Energy Credits Sold 0 0 0 0 0 018 Available Energy Credits (Row 12 + 16 + 17) Calculated 12,050,076 12,023,181 11,973,275 11,337,221 10,913,747 10,362,197 19 Compliance Requirement (Row 10) Calculated 4,244,832 4,244,832 5,299,668 5,211,845 6,222,366 6,113,318 20 Less: Energy Credit Expiration 0 0 0 0 0 021 Energy Credit Ending Balance (Row 18 - 19 - 20) Calculated 7,708,845 7,805,244 7,778,349 6,673,607 6,125,377 4,691,382 4,248,880 22 Revenue Requirement23 Cost of Renewable Energy Generation/BOT ATT-2 TWL line 22 - lines 14 & 15 183,304,476$ 169,154,803$ 209,707,956$ 262,019,400$ 351,484,294$ 410,412,838$ 24 Cost of Renewable Energy PPA ATT-2 TWL line 14 102,416,375$ 100,528,754$ 105,081,841$ 107,922,326$ 108,489,687$ 115,950,748$ 25 Cost of Renewable Energy Credit Purchases ATT-2 TWL line 15 13,726,405$ 9,735,674$ 9,312,111$ 6,264,285$ 5,291,319$ 3,199,482$ 26 Costs of Administration of Renewable Energy Plan ATT-1 PDK line 2 444,366$ 455,475$ 466,862$ 478,534$ 490,497$ 502,759$ 27 Less: Revenue Obtained from Renewable Energy Sales (non-retail)28 Cost of Payments to Tax Equity Partnership(s) ATT 1 TWL line 6 2,890,364$
29Total Revenue Requirement for Renewable Energy Plan (Row 23 + 24 + 25 + 26 - 27) Calculated 299,891,622$ 279,874,706$ 324,568,770$ 376,684,546$ 465,755,797$ 532,956,191$
30 Cost Recovery 31 Forecasted Transfer Price per MWh ATT-9 MJR line 90/line 89 66.19$ 66.83$ 65.96$ 63.73$ 70.44$ 67.87$ 32 MWh of Renewable Energy ATT-9 MJR line 89 3,112,959.69 3,033,890.68 3,440,422.00 3,936,564.61 4,039,736.53 4,760,208.09 33 Amount Recovered through the PSCR (Row 30 * 31) Calculated 206,053,741$ 202,749,705$ 226,939,671$ 250,894,808$ 284,539,461$ 323,072,244$ 34 Federal Tax Impacts (including PTC/ITC/TCJA Remeasurement) (1) ATT-1 TWL line 10, 11, and 22 59,360,764$ 47,693,339$ 61,802,050$ 84,714,578$ 128,302,682$ 135,194,353$
35 Revenue from Voluntary Green Pricing Programs (2) ATT-1 TWL line 14 and 17 385,344$ 942,330$ 1,955,376$ 9,104,185$ 67,560,918$ 72,211,038$ 36 Cash Distributions from Tax Equity Partnership(s) ATT 1 TWL line 20 -$ 37 Incremental Cost of Compliance (Row 28 - 32) Calculated 34,091,772$ 28,489,332$ 33,871,673$ 31,970,974$ (14,647,264)$ 2,478,557$ 38 Non-Volumetric Surcharge Meter (or customer) Forecast 39 Residential ATT-5 TWL Column (b) 2,003,509 2,012,612 2,021,345 2,030,479 40 Secondary ATT-5 TWL Column (c) 201,654 203,144 204,230 205,067 41 Primary ATT-5 TWL Column (d) 2,929 2,915 2,825 2,651 42 Total (Row 35 + 36 + 37) Calculated 2,208,092 2,218,670 2,228,400 2,238,197 43 Planned Surcharge Revenue44 Residential -$ -$ -$ -$ 45 Secondary -$ -$ -$ -$ 46 Primary -$ -$ -$ -$ 47 Total (Row 40 + 41 + 42) -$ -$ -$ -$ 48 Year-End Regulatory Liability Balance49 Current Year Regulatory Liability Balance (Row 43 - 33) Calculated (34,091,772)$ (28,489,332)$ (33,871,673)$ (31,970,974)$ 14,647,264$ (2,478,557)$
50Forecasted Ending Balance Prior to Current Year Interest (Row 48 for prior year + Row 45 of current year) Calculated 110,912,629$ 83,912,793$ 52,191,023$ 21,920,049$ 37,334,818$ 35,464,284$
51 Carrying Charges (short-term interest) ATT-3 TWL line 7 1,489,495$ 2,149,903$ 1,700,000$ 767,505$ 608,023$ 743,223$ 52 Total Balance (Row 46 + 47) (2) Calculated 145,004,402$ 112,402,125$ 86,062,696$ 53,891,023$ 22,687,554$ 37,942,841$ 36,207,507$ 53 Cumulative Megawatts by Year 54 DTE Owned Wind 451 451 612 1236 1461 146155 DTE Owned Solar 65 65 65 65 75 395
(1) Tax Impacts added to accurately reflect Incremental Cost of Compliance calculation(2) VGP revenue included in cost recovery per MCL 460.1047 Section 2(b)(vi)

Michigan Public Service CommissionDTE Electric Company
2016 PA 342 Renewable Energy Plan - August 2020 Amended REPRenewable Energy Plan Summary
(a)
LineNo.
1 Sales and Requirement Calculation2 Method: Weather Normalized or 3 Year Average3 If Selected Weather Normalized:4 Prior Year Sales to Retail Customers5 Prior Year Weather Normalization Factor6 Prior Year Weather Normalized Sales (Row Number 4 * 5)7 If Selected 3 Year Average:8 Current Retail Sales to Retail Customers9 3 Year Average of Retail Sales
10
RPS Required Energy Credits (For 2017 and 2018 enter the same amount as 2015 requirement in MIRECS, for 2019 and 2020 enter 12.5% of row 6 or
9, for 2021 enter 15% of row 6 or 9)
11 Energy Credits12 Energy Credit Beginning Balance13 Energy Credits Obtained through Generation/BOT14 Energy Credits Obtained through PPA15 Energy Credits Obtained through REC Purchases16 Plus: Energy Credit Obtained (Row 13 + 14 + 15)17 Less: Energy Credits Sold18 Available Energy Credits (Row 12 + 16 + 17)19 Compliance Requirement (Row 10)20 Less: Energy Credit Expiration21 Energy Credit Ending Balance (Row 18 - 19 - 20)
22 Revenue Requirement23 Cost of Renewable Energy Generation/BOT 24 Cost of Renewable Energy PPA25 Cost of Renewable Energy Credit Purchases26 Costs of Administration of Renewable Energy Plan27 Less: Revenue Obtained from Renewable Energy Sales (non-retail)28 Cost of Payments to Tax Equity Partnership(s)
29Total Revenue Requirement for Renewable Energy Plan (Row 23 + 24 + 25 + 26 - 27)
30 Cost Recovery 31 Forecasted Transfer Price per MWh32 MWh of Renewable Energy33 Amount Recovered through the PSCR (Row 30 * 31)34 Federal Tax Impacts (including PTC/ITC/TCJA Remeasurement) (1)
35 Revenue from Voluntary Green Pricing Programs (2)36 Cash Distributions from Tax Equity Partnership(s)37 Incremental Cost of Compliance (Row 28 - 32)
38 Non-Volumetric Surcharge Meter (or customer) Forecast 39 Residential40 Secondary41 Primary42 Total (Row 35 + 36 + 37)43 Planned Surcharge Revenue44 Residential45 Secondary46 Primary47 Total (Row 40 + 41 + 42)
48 Year-End Regulatory Liability Balance49 Current Year Regulatory Liability Balance (Row 43 - 33)
50Forecasted Ending Balance Prior to Current Year Interest (Row 48 for prior year + Row 45 of current year)
51 Carrying Charges (short-term interest)52 Total Balance (Row 46 + 47) (2)53 Cumulative Megawatts by Year 54 DTE Owned Wind55 DTE Owned Solar
(1) Tax Impacts added to accurately reflect Incremental Cost of Compliance calculation(2) VGP revenue included in cost recovery per MCL 460.1047 Section 2(b)(vi)
Case No.: U-20851Attachment: 2
Affiant: D. B. HarwoodPage: 2 of 2
(i) (j) (k) (l) (m) (n) (o)
2023 2024 2025 2026 2027 2028 2029
40,290,180 40,050,007 39,800,188 39,575,013 39,331,636 39,177,944 26,021,099 1.00 1.00 1.00 1.00 1.00 1.00 1.00
40,290,180 40,050,007 39,800,188 39,575,013 39,331,636 39,177,944 26,021,099
6,043,527 6,007,501 5,970,028 5,936,252 5,899,745 5,876,692 3,903,165
4,248,880 3,879,182 3,464,747 3,012,087 2,591,533 2,204,210 1,851,189 3,413,713 3,370,762 3,301,083 3,301,008 3,299,319 3,307,730 2,173,591 2,246,998 2,209,291 2,203,376 2,201,885 2,200,400 2,203,339 1,458,811
13,118 13,013 12,909 12,806 12,703 12,602 9,153 5,673,829 5,593,066 5,517,368 5,515,698 5,512,422 5,523,670 3,641,555
0 0 0 0 0 0 09,922,709 9,472,248 8,982,115 8,527,785 8,103,955 7,727,880 5,492,744 6,043,527 6,007,501 5,970,028 5,936,252 5,899,745 5,876,692 3,903,165
0 0 0 0 0 0 03,879,182 3,464,747 3,012,087 2,591,533 2,204,210 1,851,189 1,589,579
424,342,059$ 429,265,860$ 435,996,575$ 433,205,689$ 422,807,810$ 411,785,465$ 267,040,410$ 121,268,669$ 122,126,292$ 121,982,546$ 122,141,133$ 122,302,223$ 122,765,720$ 81,746,290$
1,912,628$ 1,079,753$ 797,956$ 704,202$ 654,844$ 620,238$ 386,272$ 515,328$ 528,212$ 541,417$ 554,952$ 568,826$ 583,047$ 398,415$
35,094,331$ 43,399,512$ 66,137,947$ 81,520,250$ 81,112,649$ 80,928,201$ 53,535,700$
583,133,014$ 596,399,628$ 625,456,440$ 638,126,227$ 627,446,352$ 616,682,671$ 403,107,087$
68.73$ 72.82$ 70.46$ 69.65$ 68.41$ 63.76$ 64.24$ 4,846,949.99 4,858,221.81 4,843,966.89 4,842,486.52 4,841,013.55 4,852,313.03 3,200,393.11 333,123,595$ 353,783,625$ 341,301,609$ 337,287,701$ 331,155,133$ 309,398,049$ 205,601,336$ 125,736,861$ 109,259,595$ 107,085,417$ 107,158,776$ 100,930,800$ 104,747,891$ 58,412,150$
105,319,826$ 113,420,096$ 136,113,650$ 151,661,668$ 151,252,040$ 151,242,939$ 102,092,613$ 16,500,966$ 20,782,927$ 34,872,822$ 45,145,595$ 45,874,160$ 46,139,207$ 30,720,536$ 2,451,765$ (846,615)$ 6,082,942$ (3,127,513)$ (1,765,782)$ 5,154,585$ 6,280,452$
2,037,730 2,043,846 2,049,738 2,056,636 2,064,257 2,070,865 2,076,021 205,855 206,520 207,161 207,911 208,739 209,458 210,018
2,634 2,618 2,601 2,585 2,569 2,552 2,536 2,246,219 2,252,985 2,259,501 2,267,132 2,275,565 2,282,875 2,288,575
-$ -$ -$ -$ -$ -$ -$ -$ -$ -$ -$ -$ -$ -$ -$ -$ -$ -$ -$ -$ -$ -$ -$ -$ -$ -$ -$ -$
(2,451,765)$ 846,615$ (6,082,942)$ 3,127,513$ 1,765,782$ (5,154,585)$ (6,280,452)$
33,755,742$ 35,310,793$ 29,934,385$ 33,729,814$ 36,147,151$ 31,706,712$ 26,120,603$ 708,436$ 706,534$ 667,915$ 651,556$ 714,146$ 694,343$ 393,917$
34,464,178$ 36,017,327$ 30,602,301$ 34,381,370$ 36,861,297$ 32,401,054$ 26,514,519$
1461 1461 1461 1461 1461 1461 1461457 640 772 772 772 772 772

Michigan Public Service Commission Case No.: U-20851DTE Electric Company Attachment: 3
2016 PA 342 Renewable Energy Plan - August 2020 Amended REP Affiant: D. B. HarwoodDTE Electric Owned Renewable Energy Facilities Generation Page: 1 of 2
(a) (b) (c) (d) (e) (f) (g) (h) (i)
Line Actual Actual Actual PreliminaryNo. 2016 2017 2018 2019 2020 2021
1 DTE Electric Owned2 Gratiot County Wind Installed Capacity MW 102 102 102 102 102 102 3 Generation 1,000 MWh 254 261 240 253 257 256
4 Thumb Wind Parks Installed Capacity MW 110.4 110.4 110.4 110.4 110.4 110.4 5 Generation 1,000 MWh 406 418 410 415 413 412
6 Echo Wind Park Installed Capacity MW 112.0 112.0 112.0 112.0 112.0 112.0 7 Generation 1,000 MWh 387 395 392 391 393 392
8 Brookfield Wind Park Installed Capacity MW 74.8 74.8 74.8 74.8 74.8 74.8 9 Generation 1,000 MWh 261 258 251 255 259 258
10 Pinnebog Wind Build Installed Capacity MW 51.0 51.0 51.0 51.0 51.0 51.0 11 Generation 1,000 MWh 13 170 173 173 172 171
12 Pine River Wind Park Installed Capacity MW - - - 161.3 161.3 161.3 13 Generation 1,000 MWh - - - 341 425 424
14 Polaris Wind Park Installed Capacity MW - - - - 168.6 168.6 15 Generation 1,000 MWh - - - - 399 502
16 Fairbanks Wind Park - 2020 Installed Capacity MW - - - - 72.5 72.5 17 Generation 1,000 MWh - - - - 52 248
18 Isabella I - 2020 Installed Capacity MW - - - - 197.4 197.4 19 Generation 1,000 MWh - - - - 20 488
20 Isabella II - 2020 Installed Capacity MW - - - - 186.1 186.1 21 Generation 1,000 MWh - - - - 19 460
22 Meridian Wind Park - 2021 Installed Capacity MW - - - - - 224.9 23 Generation 1,000 MWh - - - - - 51
24 MIGreenPower Subscribed Wind Subscribed Capacity MW - (0.8) (1.9) (4.0) (9.5) (17.4) 25 Subscribed Generation 1,000 MWh - (3) (7) (14) (32) (58)
26 VGP Subscribed Wind Subscribed Capacity MW - - - - (456.0) (456.0) 27 Subscribed Generation 1,000 MWh - - - - (91) (1,195)
28 DTE Solar Currents Installed Capacity MW 13.1 13.1 13.1 13.1 13.1 13.1 29 (~13.75MW) Generation 1,000 MWh 15 17 16 16 16 16
30 DTE Solar Currents Installed Capacity MW 1.2 1.2 1.2 1.2 1.2 1.2 31 (~1.25MW) Generation 1,000 MWh 2 1 1 2 2 2
32 Demille/Turrill/O'Shea Utility-Scale Solar Installed Capacity MW - 50.3 50.3 50.3 50.3 50.3 33 Generation 1,000 MWh - 53 69 70 69 69
34 2020 Future Solar Pilot Installed Capacity MW - - - - 0.8 0.8 35 Generation 1,000 MWh - - - - 0 1
36 2021 Future Solar Pilot Installed Capacity MW - - - - - 10.0 37 Generation 1,000 MWh - - - - - 2
38 2022 Solar Build (1) Installed Capacity MW - - - - - - 39 Generation 1,000 MWh - - - - - -
40 2022 Solar Build (2) Installed Capacity MW - - - - - - 41 Generation 1,000 MWh - - - - - -
42 2023 Solar Build (1) Installed Capacity MW - - - - - - 43 Generation 1,000 MWh - - - - - -
44 2024 Solar Build (1) Installed Capacity MW - - - - - - 45 Generation 1,000 MWh - - - - - -
46 2025 Solar Build (1) Installed Capacity MW - - - - - - 47 Generation 1,000 MWh - - - - - -
48 2026 Solar Build (1) Installed Capacity MW - - - - - - 49 Generation 1,000 MWh - - - - - -
50 2027 Solar Build (1) Installed Capacity MW - - - - - - 51 Generation 1,000 MWh - - - - - -
52 2028 Solar Build (1) Installed Capacity MW - - - - - - 53 Generation 1,000 MWh - - - - - -
54 2029 Solar Build (1) Installed Capacity MW - - - - - - 55 Generation 1,000 MWh - - - - - -
48 MIGreenPower Subscribed Solar Subscribed Capacity MW - (2.5) (4.8) (9.8) (23.1) (42.8) 49 Subscribed Generation 1,000 MWh - (3) (7) (14) (32) (58)
50 VGP Subscribed Solar Subscribed Capacity MW - - - - - - 51 Subscribed Generation 1,000 MWh - - - - - -
52 Total Wind Generation (excluding VGPs) 1,000 MWh 1,321 1,499 1,459 1,814 2,285 2,407 53 Total Solar Generation (excluding VGPs) 1,000 MWh 16 69 80 74 55 30 54 Total Generation (excluding VGPs) 1,000 MWh 1,337 1,568 1,539 1,888 2,340 2,438

Michigan Public Service CommissionDTE Electric Company
2016 PA 342 Renewable Energy Plan - August 2020 Amended REPDTE Electric Owned Renewable Energy Facilities Generation
(a) (b) (c)
LineNo.
1 DTE Electric Owned2 Gratiot County Wind Installed Capacity MW3 Generation 1,000 MWh
4 Thumb Wind Parks Installed Capacity MW5 Generation 1,000 MWh
6 Echo Wind Park Installed Capacity MW7 Generation 1,000 MWh
8 Brookfield Wind Park Installed Capacity MW9 Generation 1,000 MWh
10 Pinnebog Wind Build Installed Capacity MW11 Generation 1,000 MWh
12 Pine River Wind Park Installed Capacity MW13 Generation 1,000 MWh
14 Polaris Wind Park Installed Capacity MW15 Generation 1,000 MWh
16 Fairbanks Wind Park - 2020 Installed Capacity MW17 Generation 1,000 MWh
18 Isabella I - 2020 Installed Capacity MW19 Generation 1,000 MWh
20 Isabella II - 2020 Installed Capacity MW21 Generation 1,000 MWh
22 Meridian Wind Park - 2021 Installed Capacity MW23 Generation 1,000 MWh
24 MIGreenPower Subscribed Wind Subscribed Capacity MW25 Subscribed Generation 1,000 MWh
26 VGP Subscribed Wind Subscribed Capacity MW27 Subscribed Generation 1,000 MWh
28 DTE Solar Currents Installed Capacity MW29 (~13.75MW) Generation 1,000 MWh
30 DTE Solar Currents Installed Capacity MW31 (~1.25MW) Generation 1,000 MWh
32 Demille/Turrill/O'Shea Utility-Scale Solar Installed Capacity MW33 Generation 1,000 MWh
34 2020 Future Solar Pilot Installed Capacity MW35 Generation 1,000 MWh
36 2021 Future Solar Pilot Installed Capacity MW37 Generation 1,000 MWh
38 2022 Solar Build (1) Installed Capacity MW39 Generation 1,000 MWh
40 2022 Solar Build (2) Installed Capacity MW41 Generation 1,000 MWh
42 2023 Solar Build (1) Installed Capacity MW43 Generation 1,000 MWh
44 2024 Solar Build (1) Installed Capacity MW45 Generation 1,000 MWh
46 2025 Solar Build (1) Installed Capacity MW47 Generation 1,000 MWh
48 2026 Solar Build (1) Installed Capacity MW49 Generation 1,000 MWh
50 2027 Solar Build (1) Installed Capacity MW51 Generation 1,000 MWh
52 2028 Solar Build (1) Installed Capacity MW53 Generation 1,000 MWh
54 2029 Solar Build (1) Installed Capacity MW55 Generation 1,000 MWh
48 MIGreenPower Subscribed Solar Subscribed Capacity MW49 Subscribed Generation 1,000 MWh
50 VGP Subscribed Solar Subscribed Capacity MW51 Subscribed Generation 1,000 MWh
52 Total Wind Generation (excluding VGPs) 1,000 MWh53 Total Solar Generation (excluding VGPs) 1,000 MWh54 Total Generation (excluding VGPs) 1,000 MWh
Case No.: U-20851Attachment: 3
Affiant: D. B. HarwoodPage: 2 of 2
(j) (k) (l) (m) (n) (o) (p) (q)
2022 2023 2024 2025 2026 2027 2028 2029
102 102 102 102 102 102 102 102 256 256 257 256 256 256 257 171
110.4 110.4 110.4 110.4 110.4 110.4 110.4 110.4 412 412 413 412 412 412 413 275
112.0 112.0 112.0 112.0 112.0 112.0 112.0 112.0 392 392 393 392 392 392 393 261
74.8 74.8 74.8 74.8 74.8 74.8 74.8 74.8 258 258 259 258 258 258 259 172
51.0 51.0 51.0 51.0 51.0 51.0 51.0 51.0 171 171 172 171 171 171 172 114
161.3 161.3 161.3 161.3 161.3 161.3 161.3 161.3 424 424 425 424 424 424 425 283
168.6 168.6 168.6 168.6 168.6 168.6 168.6 168.6 502 502 504 502 502 502 504 335
72.5 72.5 72.5 72.5 72.5 72.5 72.5 72.5 248 248 248 248 248 248 248 165
197.4 197.4 197.4 197.4 197.4 197.4 197.4 197.4 488 488 489 488 488 488 489 325
186.1 186.1 186.1 186.1 186.1 186.1 186.1 186.1 460 460 461 460 460 460 461 306
224.9 224.9 224.9 224.9 224.9 224.9 224.9 224.9 612 612 613 612 612 612 613 408
(22.3) (22.3) (22.3) (22.3) (22.3) (22.3) (22.3) (33.5) (75) (75) (75) (75) (75) (75) (75) (75)
(456.0) (456.0) (456.0) (456.0) (456.0) (456.0) (456.0) (456.0) (1,195) (1,195) (1,198) (1,195) (1,195) (1,195) (1,198) (797)
13.1 13.1 13.1 13.1 13.1 13.1 13.1 13.1 16 16 16 15 15 15 15 10
1.2 1.2 1.2 1.2 1.2 1.2 1.2 1.2 2 2 2 2 1 1 1 1
50.3 50.3 50.3 50.3 50.3 50.3 50.3 50.3 68 68 68 67 67 67 67 44
0.8 0.8 0.8 0.8 0.8 0.8 0.8 0.8 1 1 1 1 1 1 1 1
10.0 10.0 10.0 10.0 10.0 10.0 10.0 10.0 19 19 19 19 19 19 19 12
120.0 120.0 120.0 120.0 120.0 120.0 120.0 120.0 20.6 246.1 245.6 243.7 242.4 241.2 240.7 159.2
200.0 200.0 200.0 200.0 200.0 200.0 200.0 200.0 34.7 414.9 413.9 410.8 408.7 406.7 405.7 268.4
- 61.9 61.9 61.9 61.9 61.9 61.9 61.9 - 10.8 129.3 128.3 127.7 127.1 126.8 83.9
- - 182.8 182.8 182.8 182.8 182.8 182.8 - - 32.0 380.7 378.8 376.9 376.1 248.8
- - - 131.7 131.7 131.7 131.7 131.7 - - - 23.0 274.3 272.9 272.3 180.1
- - - - - - - - - - - - - - - -
- - - - - - - - - - - - - - - -
- - - - - - - - - - - - - - - -
- - - - - - - - - - - - - - - -
(50.3) (50.3) (50.3) (50.3) (50.3) (50.3) (50.3) (50.3) (68) (68) (68) (67) (67) (67) (67) (44)
(320.0) (381.9) (564.7) (696.4) (696.4) (696.4) (696.4) (696.4) (55) (672) (821) (1,186) (1,432) (1,425) (1,422) (940)
2,952 2,952 2,960 2,952 2,952 2,952 2,960 1,943 37 37 37 37 37 37 36 24
2,989 2,989 2,997 2,988 2,988 2,988 2,996 1,967

Michigan Public Service Commission Case No.: U-20851DTE Electric Company Attachment: 4
2016 PA 342 Renewable Energy Plan - August 2020 Amended REP Affiant: D. B. HarwoodRECs/ACECs from Renewable Energy & Advanced Cleaner Energy & Page: 1 of 4Associated Cost For Use in 2016 PA 342 Activities for the Period 2016-2029
(a) (b) (c) (d) (e) (f) (g)
Line Actual Actual Actual PreliminaryNo. 2016 2017 2018 2019 2020 2021
1 Beginning Balance of RECs 1,000 RECs 7,877 7,709 7,805 7,733 6,628 6,080 23 Beginning Balance of ACECs 1,000 ACECs 0 - - - - - 45 PURPA RECs (less non-jurisdictional) 1,000 RECs 436 452 390 309 283 285 67 Purchase of RECs (REC-only Contracts) 1,000 RECs 305 311 286 20 13 13 89 Purchase of RECs (PPA Contracts) 1,000 RECs 1,530 1,545 1,494 1,552 1,597 1,602 10 11 Generation of RECs 1,000 RECs 1,337 1,566 1,552 1,888 2,340 2,438 1213 Generation of ACECs 1,000 ACECs - - - - - - 1415 Michigan Incentive RECs 1,000 RECs 364 390 413 423 431 450 1617 Transferred GreenCurrents RECs 1,000 RECs - - - - - - 1819 Total Available RECs 1,000 RECs 11,849 11,972 11,939 11,925 11,292 10,868 2021 Total Available ACECs 1,000 ACECs 0 - - - - - 2223 Expected RECs to be Consumed 1,000 RECs (4,140) (4,167) (4,206) (5,297) (5,212) (6,222) 2425 Expected ACECs to be Consumed 1,000 ACECs - - - - - - 2627 Expired RECs 1,000 RECs - - - - - - 2829 Expired ACECs 1,000 ACECs - - - - - - 3031 Ending REC Balance 1,000 RECs 7,709 7,805 7,733 6,628 6,080 4,646 3233 Ending ACEC Balance 1,000 ACECs 0 - - - - - 3435 Beginning Balance of EOCs 1,000 EOCs/RECs 105 78 84 3 - - 3637 Transferred Energy Optimization Credits 1,000 EOCs/RECs 78 186 3 - - - 3839 Expected EOCs to be Consumed 1,000 EOCs/RECs (105) (78) (84) (3) - - 4041 Excess EOCs 1,000 EOCs/RECs - - - - - - 4243 Ending Balance EOCs 1,000 EOCs/RECs 78 186 3 - - -

Michigan Public Service CommissionDTE Electric Company
2016 PA 342 Renewable Energy Plan - August 2020 Amended REPRECs/ACECs from Renewable Energy & Advanced Cleaner Energy &Associated Cost For Use in 2016 PA 342 Activities for the Period 2016-2029
(a)
LineNo.
1 Beginning Balance of RECs 1,000 RECs23 Beginning Balance of ACECs 1,000 ACECs45 PURPA RECs (less non-jurisdictional) 1,000 RECs67 Purchase of RECs (REC-only Contracts) 1,000 RECs89 Purchase of RECs (PPA Contracts) 1,000 RECs10 11 Generation of RECs 1,000 RECs1213 Generation of ACECs 1,000 ACECs1415 Michigan Incentive RECs 1,000 RECs1617 Transferred GreenCurrents RECs 1,000 RECs1819 Total Available RECs 1,000 RECs2021 Total Available ACECs 1,000 ACECs2223 Expected RECs to be Consumed 1,000 RECs2425 Expected ACECs to be Consumed 1,000 ACECs2627 Expired RECs 1,000 RECs2829 Expired ACECs 1,000 ACECs3031 Ending REC Balance 1,000 RECs3233 Ending ACEC Balance 1,000 ACECs3435 Beginning Balance of EOCs 1,000 EOCs/RECs3637 Transferred Energy Optimization Credits 1,000 EOCs/RECs3839 Expected EOCs to be Consumed 1,000 EOCs/RECs4041 Excess EOCs 1,000 EOCs/RECs4243 Ending Balance EOCs 1,000 EOCs/RECs
Case No.: U-20851Attachment: 4
Affiant: D. B. HarwoodPage: 2 of 4
-1
(h) (i) (j) (k) (l) (m) (n) (o)
2022 2023 2024 2025 2026 2027 2028 2029
4,646 4,203 3,834 3,419 2,967 2,546 2,159 1,806
- - - - - - - -
285 285 251 251 251 251 251 162
13 13 13 13 13 13 13 9
1,771 1,858 1,861 1,856 1,854 1,853 1,856 1,234
2,989 2,989 2,997 2,988 2,988 2,988 2,996 1,967
- - - - - - - -
612 528 471 410 410 408 408 270
- - - - - - - -
10,317 9,877 9,427 8,937 8,482 8,058 7,682 5,447
- - - - - - - -
(6,113) (6,044) (6,008) (5,970) (5,936) (5,900) (5,877) (3,903)
- - - - - - - -
- - - - - - - -
- - - - - - - -
4,203 3,834 3,419 2,967 2,546 2,159 1,806 1,544
- - - - - - - - 3,834 3,419 2,967 2,546 2,159 1,806 1,544
- - - - - - - -
- - - - - - - -
- - - - - - - -
- - - - - - - -
- - - - - - - -

Michigan Public Service Commission Case No.: U-20851DTE Electric Company Attachment: 4
2016 PA 342 Renewable Energy Plan - August 2020 Amended REP Affiant: D. B. HarwoodRECs/ACECs from Renewable Energy & Advanced Cleaner Energy & Page: 3 of 4Associated Cost For Use in 2016 PA 342 Activities for the Period 2016-2029
(a) (b) (c) (d) (e) (f) (g)Actual Actual Actual
Line No. 2016 2017 2018 2019 2020 20211 Beginning Balance of RECs $Mil 37.7$ 29.4$ 23.5$ 20.6$ 13.8$ 9.8$ 23 Beginning Balance of ACECs $Mil -$ -$ -$ -$ -$ -$ 45 PURPA RECs (less non-jurisdictional) $Mil -$ -$ -$ -$ -$ -$ 67 Purchase of RECs (REC-only Contracts) $Mil 4.1$ 4.0$ 3.8$ 0.7$ 0.7$ 0.7$ 89 Generation of RECs $Mil -$ -$ -$ -$ -$ -$
1011 Generation of ACECs $Mil -$ -$ -$ -$ -$ -$ 1213 Michigan Incentive RECs $Mil -$ -$ -$ -$ -$ -$ 1415 Transferred GreenCurrents RECs $Mil -$ -$ -$ -$ -$ -$ 1617 Purchase of RECs (PPA Contracts) $Mil 4.5$ 3.8$ 3.1$ 1.8$ 1.6$ 1.2$ 18 19 Generation of RECs $Mil -$ -$ -$ -$ -$ -$ 2021 Total Available RECs & ACECs $Mil 46.2$ 37.2$ 30.3$ 23.1$ 16.1$ 11.7$ 2223 Expected RECs & ACECs to be Consumed $Mil (16.8)$ (13.7)$ (9.7)$ (9.3)$ (6.3)$ (5.3)$ 2425 Ending Balance $Mil 29.4$ 23.5$ 20.6$ 13.8$ 9.8$ 6.4$ 2627 Total Average Cost of Available RECs & ACECs $/REC 3.82$ 3.01$ 2.67$ 2.08$ 1.62$ 1.38$

Michigan Public Service CommissionDTE Electric Company
2016 PA 342 Renewable Energy Plan - August 2020 Amended REPRECs/ACECs from Renewable Energy & Advanced Cleaner Energy &Associated Cost For Use in 2016 PA 342 Activities for the Period 2016-2029
(a)
Line No.1 Beginning Balance of RECs $Mil23 Beginning Balance of ACECs $Mil45 PURPA RECs (less non-jurisdictional) $Mil67 Purchase of RECs (REC-only Contracts) $Mil89 Generation of RECs $Mil
1011 Generation of ACECs $Mil1213 Michigan Incentive RECs $Mil1415 Transferred GreenCurrents RECs $Mil1617 Purchase of RECs (PPA Contracts) $Mil18 19 Generation of RECs $Mil2021 Total Available RECs & ACECs $Mil2223 Expected RECs & ACECs to be Consumed $Mil2425 Ending Balance $Mil2627 Total Average Cost of Available RECs & ACECs $/REC
Case No.: U-20851Attachment: 4
Affiant: D. B. HarwoodPage: 4 of 4
(h) (i) (j) (k) (l) (m) (n) (o)
2022 2023 2024 2025 2026 2027 2028 20296.4$ 4.7$ 3.9$ 3.5$ 3.4$ 3.3$ 3.3$ 3.3$
-$ -$ -$ -$ -$ -$ -$ -$
-$ -$ -$ -$ -$ -$ -$ -$
0.7$ 0.7$ 0.7$ 0.7$ 0.7$ 0.7$ 0.7$ 0.5$
-$ -$ -$ -$ -$ -$ -$ -$
-$ -$ -$ -$ -$ -$ -$ -$
-$ -$ -$ -$ -$ -$ -$ -$
-$ -$ -$ -$ -$ -$ -$ -$
0.8$ 0.4$ -$ -$ -$ -$ -$ -$
-$ -$ -$ -$ -$ -$ -$ -$
7.9$ 5.8$ 4.6$ 4.2$ 4.0$ 4.0$ 4.0$ 3.8$
(3.2)$ (1.9)$ (1.1)$ (0.8)$ (0.7)$ (0.7)$ (0.6)$ (0.4)$
4.7$ 3.9$ 3.5$ 3.4$ 3.3$ 3.3$ 3.3$ 3.4$
1.12$ 1.02$ 1.02$ 1.13$ 1.30$ 1.53$ 1.85$ 2.22$

Michigan Public Service Commission Case No.: U-20851DTE Electric Company Attachment: 5
2016 PA 342 Renewable Energy Plan - August 2020 Amended REP Affiant: D. B. HarwoodSolar Assumptions for Future Builds Page: 1 of 1
(a) (b) (c) (d) (e)
LineNo. Online Year 2022 2023 2024 20251 Installed Cost ($/kW) 1,307$ 1,312$ 1,316$ 1,320$ 2 Capacity Factor (%) 23.9% 23.9% 23.9% 23.9%

1
STATE OF MICHIGAN
BEFORE THE MICHIGAN PUBLIC SERVICE COMMISSION In the matter of DTE ELECTRIC COMPANY’S ) application for the regulatory reviews, revisions, ) determinations, and/or approvals necessary for ) Case No. U-20851 to fully comply with Public Act 295 of 2008 )
AFFIDAVIT OF PATRICK D. KAUFFMAN IN SUPPORT OF DTE ELECTRIC COMPANY’S APPLICATION FOR APPROVAL OF THE AUGUST 2020 AMENDED
RENEWABLE ENERGY PLAN
STATE OF MICHIGAN ) ) COUNTY OF WAYNE )
Patrick D. Kauffman, being first duly sworn, deposes and says:
1. My title is Principal Supervisor for the Renewable Energy group, which includes
the 2008 PA 295 and 2016 PA 342 Renewable Energy activities of DTE Electric Company (“DTE
Electric” or the “Company”). I graduated from The University of Notre Dame in 1989 with a
Bachelor of Arts Degree in Economics. In 1991, I received a Master of Business Administration
degree in Finance from Michigan State University. After obtaining my Master’s degree from
Michigan State University in the spring of 1991, I was employed by General Motors Corporation
and held several positions there until 1999. My responsibilities included financial analysis and
reporting, budgeting and forecasting, business case development, and accounting.
2. I began my career at DTE Energy in 1999, as Supervisor of Forecasting, Budgeting
and Corporate Reporting in the Controller’s Organization. I held several positions of increasing

2
responsibilities within the Controller’s Organization including Gross Margin Analysis, Detroit
Edison Financial Planning and Analysis, Budgeting, Forecasting and Reporting, and Corporate
Support. In 2008, I transferred to Regulatory Affairs and was a Case Manager for Gas Cost
Recovery and Power Supply Cost Recovery cases. In 2010, I transferred back to the Controller’s
Organization and was responsible for benefits forecasting and reporting. In 2013, I obtained the
position of Principal Financial Analyst responsible for forecasting and reporting for the Nuclear
Generation organization. In August 2016, I was appointed to my current position. I have sponsored
testimony in the following cases:
U-15417-R 2008 Power Supply Cost Recovery Reconciliation
U-18242 Reconciliation of the DTE Electric 2016 REP Program
U-18232 2018 Amended REP
U-20172 Reconciliation of the DTE Electric 2017 REP Program
U-20484 Reconciliation of the DTE Electric 2018 REP Program
U-20723 Reconciliation of the DTE Electric 2019 REP Program
U-18232 2020 Amended REP Plan
3. The purpose of my affidavit and supporting attachments in this August 2020
Amended REP filing is to incorporate the impact of including the Company’s voluntary green
pricing (VGP) projects in DTE Electric’s REP plan. In so doing I explain the Company’s resulting
projected Renewable Energy capital, O&M, and other expenses associated with implementing the
Company’s Commission-approved 2008 PA 295 and 2016 PA 342 Renewable Energy Plan (REP)
and to outline key accounting practices related to DTE Electric’s August 2020 Amended REP.
4. I am sponsoring the following attachments, which were prepared by me or under
my supervision:

3
Attachment Description
1 Expense Elements of Incremental Cost of Compliance
2 Rate Base Financial Data
3 Production Tax Credits
4 Return On Equity
5. The line items shown on Attachment 1, Expense Elements of Incremental Cost of
Compliance include the following:
a. Line 1 - Total Royalty and Easement Payments are the ongoing contractual
payments to land grantors in areas where wind parks have been completed.
b. Line 2 - Administrative Expense is the ongoing incremental program
administrative expenses associated with the Renewable Energy Plan primarily related to
commercial and regulatory activities related to administering the Plan.
c. Line 3 - O&M Expense (MPSC Accounts 920, 921, 923, and 553) are the
ongoing incremental program administrative expenses associated with the Renewable Energy Plan
and related expenses associated with the cost of maintaining solar and wind assets. Included in
this total are the MIREC fees paid for tracking of the Renewable Energy Credits (REC) in the
database.
d. Line 4 - Insurance Expense is the calculated payments for protection of
property for wind and solar programs. The REP assumes that annual insurance costs represent
approximately 0.075% of the capital equipment costs, which is consistent with the Company's
experience related to other utility capital investment.
e. Line 5 - Property Tax Expense is discussed in Company Affiant Ms.

4
Wisniewski’s testimony.
f. Line 6 - Miscellaneous Other Power is the Coke Oven Gas Expense
recorded related to the purchase of Coke Oven Gas used to create Advanced Cleaner Energy
Credits (ACECs). The company stopped purchasing Coke oven gas in 2013.
g. Line 7 - Book Depreciation represents the depreciation recorded on the
Company’s books associated with Plant in Service assets for the Renewable Energy Plan based on
balances as of the commercial operation date of these assets. The September 26, 2014 order in
Case No. U-16991 revised depreciation rates for the wind and solar REP plant, effective upon
issuance of a final Commission order in the next REP Plan case. The next case (U-17793) was
filed June 2, 2015. The U-17793 plan was approved by a Commission order dated November 5,
2015. In that order the Commission made the U-16991 depreciation rates effective December 1,
2015. As a result, the Company was using the interim rates of 4.24% for wind and 5.26% for solar
until December 1, 2015. Starting in December of 2015, the revised rates of 3.71% for wind and
4.93% for solar were applied. The next case (U-18150) was approved by a Commission order
dated December 6, 2018. Starting in June of 2019, the revised rates of 3.71% for wind and 4.80%
for solar are applied.
h. Line 8 - Interest Received from ITC Holdings Corp represents interest
received on sums advanced to ITC for construction of interconnection facilities and/or network
upgrades to the transmission system owned by ITC (which sums will be reimbursed to DTE
Electric upon its generation facilities being interconnected to the ITC facilities). The interest
received is credited to the incremental cost of compliance to offset the working capital costs
associated with carrying a balance receivable from ITC.
6. The line items shown on Attachment 2, Rate Base Financial Data include the

5
following:
a. Plant in Service, shown on lines 1 through 5, is comprised of the cost of
completed solar and wind projects that have been placed in service.
b. Depreciation Reserve, shown on lines 7 through 10, is the accumulated book
depreciation associated with the depreciation of the Company’s 2008 PA 295 and 2016 PA 342
Renewable Energy program plant in service.
c. Construction Work in Progress (CWIP), shown on lines 12 through 17,
represents the costs related to erecting wind and solar assets. As they are completed, project costs
are moved from CWIP to plant in service.
d. The REC Inventory Balance, shown on lines 19 through 22, contains the
dollar value of renewable energy credits that are part of the Company’s 2008 PA 295 as amended
by 2016 PA 342 Renewable Energy program.
7. The production tax credit is calculated by multiplying the eligible in-service
megawatt hours by the tax credit rate to get the production tax credit amounts. The production tax
credit rate is the product of the IRS 2019 PTC rate of 2.5 cents per kilowatt hour and an assumed
2% inflation factor in 2020 through 2029. The IRS has not updated the PTC rate every year but
has updated periodically to approximate a 2% increase. This same periodic increase is utilized in
Attachment 3. The calculated tax credit amount is then grossed up for taxes. Since tax credits are
post tax adjustments, in order to include them in the pre-tax incremental cost of compliance, they
must be grossed up (increased) for taxes. This gross up decreases the revenue requirement
included in the REP Surcharge and ensures DTE Electric doesn’t earn above its authorized return
for this item when the credits are applied to net income. Production tax credits are used to reduce
the incremental cost of compliance on Affiant Lacey’s Attachment 1, line 10. The tax credits

6
reduce the REP cost of compliance effective upon the in-service date of the eligible assets.
8. The line items shown on Attachment 4, Return on Equity (ROE) Calculation
include the following:
a. Line 1 – This is the authorized 11.0% ROE for assets required for
compliance for the 2008 PA 295 as amended by 2016 PA 342 Renewable Energy program.
b. Line 2 – In the order dated July 18, 2019 in Case No. U-18232, the
Commission noted that the company shall use the Commission-approved ROE, rather than the
REP-approved ROE for any portions of the Fairbanks, Isabella I, or Isabella II projects that are
used to supply the Large Customer-Voluntary Green Program (LC-VGP) instead of RPS needs.
This is the 9.9% ROE for LC-VGP assets per the Commission order.
c. Line 3 – This is the weighted average ROE for REP compliance assets and
LC-VGP rate assets. The weighted average ROE is calculated by weighting the REP compliance
simplified rate base (Line 12) and the LC-VGP simplified rate base (Line 21) with their respective
ROEs. The weighted average ROE is utilized by Witness Lacey in his Attachment 3 (pg. 1) to
calculate the Pre-Tax Rate of Return.
d. Lines 12 and 21 – These lines represent the compliance simplified rate base
(Line 12) and the LC-VGP simplified rate base (Line 21) which are calculated by subtracting the
deferred federal taxes related to plant depreciation (Lines 11 and 20) from net plant (Lines 10 and
19).
9. I have provided Affiant Lacey with Line 6 of his Attachment 1 Incremental Cost of
Compliance, Total Payment to Tax Equity Partnership(s), which represents the payments for the
purchase of the electricity, capacity and RECs generated by the project owned by the Tax Equity
Partnership. I have also provided witness Lacey with Line 20 of his Attachment 1 Incremental
7
Cost of Compliance, Total Cash Distribution from Tax Equity Partnership(s), which represents the
cash distributions (operating profits of the project) allocated to DTE Electric by the Tax Equity
Partnership.
10. DTE Electric is currently using the accounting practices outlined in Case No. U-
18232 for its approved, amended REP program.
11. Based upon my knowledge and experience, the Company’s projected Renewable
Energy capital, O&M, other expenses, and accounting practices associated with implementing the
Company’s August 2020 Amended REP incorporating DTE Electric’s VGP build plan are
reasonable and prudent and I recommend the Commission approve DTE Electric’s August 2020
Amended Renewable Energy Plan.
Further, Affiant sayeth not.
________________________________ Patrick D. Kauffman Subscribed and sworn to before me this 31st day of August 2020. ___________________________ Estella R. Branson, Notary Public Oakland County, Michigan My Commission Expires: 10-26-2023 Acting in Wayne County

Michigan Public Service Commission Case No.: U-20851DTE Electric Company Attachment: 1
2016 PA 342 Renewable Energy Plan - August 2020 Amended REP Affiant: P. D. KauffmanExpense Elements of Incremental Cost of Compliance Page: 1 of 1
(a) (b) (c) (d) (e) (f) (g) (h) (i)
LineNo. Units 2016 2017 2018 2019 2020 2021 2022
1 Total Royalty and Easement Payments $Mil 3.9 4.1 2.7 7.9 7.8 11.0 12.7
2 Administrative Expense $Mil 0.4 0.4 0.5 0.5 0.5 0.5 0.5
3 O&M-MPSC Accts. 553, 920, 921, 923 $Mil 20.1 22.1 22.3 27.9 35.7 42.7 48.5
4 Insurance Expense $Mil 0.7 0.7 0.8 0.8 1.1 1.5 1.7
5 Property Tax $Mil 9.3 9.4 6.8 11.4 10.1 12.5 17.7
6 Miscellaneous Other Power: Coke Oven Gas Expense $Mil 0.0 0.0 0.0 0.0 0.0 0.0 0.0
7 Book Depreciation $Mil 40.0 44.1 46.4 52.1 75.3 101.6 115.3
8 Interest Received from ITC Holdings Corp. $Mil 0.0 0.0 0.0 0.0 0.0 0.0 0.0
Units 2023 2024 2025 2026 2027 2028 2029
9 Total Royalty and Easement Payments $Mil 13.0 13.3 13.7 14.0 14.4 14.7 10.1
10 Administrative Expense $Mil 0.5 0.5 0.5 0.6 0.6 0.6 0.4
11 O&M-MPSC Accts. 553, 920, 921, 923 $Mil 49.8 51.0 52.2 53.5 54.9 56.3 38.4
12 Insurance Expense $Mil 1.8 1.9 2.0 2.0 2.0 2.0 1.4
13 Property Tax $Mil 17.9 16.8 15.7 14.7 13.6 12.6 7.7
14 Miscellaneous Other Power: Coke Oven Gas Expense $Mil 0.0 0.0 0.0 0.0 0.0 0.0 0.0
15 Book Depreciation $Mil 123.2 128.6 135.4 138.7 139.6 140.6 94.3
16 Interest Received from ITC Holdings Corp. $Mil 0.0 0.0 0.0 0.0 0.0 0.0 0.0

Michigan Public Service Commission Case No.: U-20851DTE Electric Company Attachment: 2
2016 PA 342 Renewable Energy Plan - August 2020 Amended REP Affiant: P. D. KauffmanRate Base Financial Data Page: 1 of 2($ Millions)
(a) (b) (c) (d) (e) (f) (g) (h)
Actual Actual Actual PreliminaryLineNo. Description 2016 2017 2018 2019 2020 2021 2022
1 Plant in Service2 Beginning Balance 956.9 1,086.3 1,188.9 1,190.2 1,460.4 2,471.7 2,868.4 3 In Service Amounts 129.4 113.6 8.2 272.7 1,011.3 396.7 267.4 4 Ending Balance 1,086.3 1,188.9 1,190.2 1,460.4 2,471.7 2,868.4 3,135.8 5 Average Balance 968.0 1,123.6 1,190.5 1,398.4 1,966.1 2,670.1 3,002.1 67 Depreciation Reserve8 Beginning Balance 106.9 145.7 178.3 217.9 265.4 340.7 442.3 9 Ending Balance 145.7 178.3 217.9 265.4 340.7 442.3 557.6
10 Average Balance 125.8 162.8 197.5 242.0 303.1 391.5 500.0 1112 Construction Work in Progress13 Beginning Balance 84.3 94.8 34.0 281.8 88.4 150.0 (0.0) 14 Transfer to Plant In Service (129.4) (113.6) (8.2) (272.7) (1,011.3) (396.7) (267.4) 15 Plus: Additions 139.9 52.8 256.0 79.3 1,072.9 246.7 267.4 16 Ending Balance 94.8 34.0 281.8 88.4 150.0 (0.0) (0.0) 17 Average Balance 129.5 74.0 73.1 119.4 119.2 75.0 (0.0) 1819 REC/ACEC Inventory (1)20 Net RECs/ACECs Transferred to Inventory (10.6) (5.9) (2.9) (6.8) (4.0) (3.4) (1.7) 21 Ending Balance 29.4 23.5 20.6 13.8 9.8 6.4 4.7 22 Average Balance 39.6 30.9 24.8 19.8 11.8 8.1 5.6 2324 ITC Holdings Corp. A/R / (Apex Account Payable)25 Beginning Balance 4.6 4.6 (0.0) 5.5 2.4 (427.3) (0.0) 26 Additions - (4.6) 5.5 (3.1) (429.7) 427.3 - 27 Ending Balance 4.6 (0.0) 5.5 2.4 (427.3) (0.0) (0.0) 28 Average Balance 4.6 0.4 0.8 3.6 (212.5) (213.7) (0.0)
(1) Provided by witness Harwood on Exhibit A-4
Large Customer Voluntary Green Program LineNo. Description
2016 2017 2018 2019 2020 2021 2022
1 Plant in Service
2 Beginning Balance - - - - - 728.1 729.1 3 In Service Amounts - - - - 728.1 1.0 248.9 4 Ending Balance - - - - 728.1 729.1 978.0 5 Average Balance - - - - 364.1 728.6 853.6
67 Depreciation Reserve
8 Beginning Balance - - - - - 13.5 40.5 9 Ending Balance - - - - 13.5 40.5 72.2
10 Average Balance - - - - 6.8 27.0 56.4 1112 Construction Work in Progress
13 Beginning Balance - - - - 40.3 - - 14 Transfer to Plant In Service - - - - (40.3) (1.0) (248.9) 15 Plus: Additions - - - 40.3 - 1.0 248.9 16 Ending Balance - - - 40.3 - - - 17 Average Balance - - - 20.2 20.2 - -
ComplianceLineNo. Description
2016 2017 2018 2019 2020 2021 2022
1 Plant in Service
2 Beginning Balance 956.9 1,086.3 1,188.9 1,190.2 1,460.4 1,743.6 2,139.3 3 In Service Amounts 129.4 113.6 8.2 272.7 283.2 395.7 18.5 4 Ending Balance 1,086.3 1,188.9 1,190.2 1,460.4 1,743.6 2,139.3 2,157.8 5 Average Balance 968.0 1,123.6 1,190.5 1,398.4 1,602.0 1,941.5 2,148.5 67 Depreciation Reserve
8 Beginning Balance 106.9 145.7 178.3 217.9 265.4 327.2 401.8 9 Ending Balance 145.7 178.3 217.9 265.4 327.2 401.8 485.4
10 Average Balance 125.8 162.8 197.5 242.0 296.3 364.5 443.6 1112 Construction Work in Progress
13 Beginning Balance 84.3 94.8 34.0 281.8 48.1 150.0 (0.0) 14 Transfer to Plant In Service (129.4) (113.6) (8.2) (272.7) (971.0) (395.7) (18.5) 15 Plus: Additions 139.9 52.8 256.0 39.0 1,072.9 245.7 18.5
16 Ending Balance 94.8 34.0 281.8 48.1 150.0 (0.0) (0.0) 17 Average Balance 129.5 74.0 73.1 99.3 99.0 75.0 (0.0)

Michigan Public Service CommissionDTE Electric Company2016 PA 342 Renewable Energy Plan - August 2020 Amended REP
Rate Base Financial Data($ Millions)
(a)
LineNo. Description
1 Plant in Service2 Beginning Balance3 In Service Amounts 4 Ending Balance5 Average Balance67 Depreciation Reserve8 Beginning Balance9 Ending Balance
10 Average Balance1112 Construction Work in Progress13 Beginning Balance14 Transfer to Plant In Service15 Plus: Additions16 Ending Balance17 Average Balance1819 REC/ACEC Inventory (1)20 Net RECs/ACECs Transferred to Inventory21 Ending Balance22 Average Balance2324 ITC Holdings Corp. A/R / (Apex Account Payable)25 Beginning Balance26 Additions27 Ending Balance28 Average Balance
(1) Provided by witness Harwood on Exhibit A-4
Large Customer Voluntary Green Program LineNo. Description
1 Plant in Service
2 Beginning Balance
3 In Service Amounts
4 Ending Balance
5 Average Balance
67 Depreciation Reserve
8 Beginning Balance
9 Ending Balance
10 Average Balance
1112 Construction Work in Progress
13 Beginning Balance
14 Transfer to Plant In Service
15 Plus: Additions
16 Ending Balance
17 Average Balance
ComplianceLineNo. Description
1 Plant in Service
2 Beginning Balance
3 In Service Amounts
4 Ending Balance
5 Average Balance
67 Depreciation Reserve
8 Beginning Balance
9 Ending Balance
10 Average Balance
1112 Construction Work in Progress
13 Beginning Balance
14 Transfer to Plant In Service
15 Plus: Additions
16 Ending Balance
17 Average Balance
Case No.: U-20851Attachment: 2
Affiant: P. D. KauffmanPage: 2 of 2
(i) (j) (k) (l) (m) (n) (o)
2023 2024 2025 2026 2027 2028 2029
3,135.8 3,204.8 3,370.3 3,496.3 3,521.1 3,546.0 3,570.8 68.9 165.5 126.0 24.8 24.9 24.8 26.1
3,204.8 3,370.3 3,496.3 3,521.1 3,546.0 3,570.8 3,597.0 3,170.3 3,287.5 3,433.3 3,508.7 3,533.6 3,558.4 3,583.9
557.6 680.8 809.4 944.8 1,083.5 1,223.1 1,363.7 680.8 809.4 944.8 1,083.5 1,223.1 1,363.7 1,458.0 619.2 745.1 877.1 1,014.1 1,153.3 1,293.4 1,410.9
(0.0) (0.0) (0.0) (0.0) (0.0) (0.0) (0.0) (68.9) (165.5) (126.0) (24.8) (24.9) (24.8) (26.1) 68.9 165.5 126.0 24.8 24.9 24.8 26.1 (0.0) (0.0) (0.0) (0.0) (0.0) (0.0) (0.0) (0.0) (0.0) (0.0) (0.0) (0.0) (0.0) (0.0)
(0.8) (0.4) (0.1) (0.0) 0.0 0.0 0.1 3.9 3.5 3.4 3.3 3.3 3.3 3.4 4.3 3.7 3.4 3.3 3.3 3.3 3.4
(0.0) (0.0) (0.0) (0.0) (0.0) (0.0) (0.0) - - - - - - -
(0.0) (0.0) (0.0) (0.0) (0.0) (0.0) (0.0) (0.0) (0.0) (0.0) (0.0) (0.0) (0.0) (0.0)
2023 2024 2025 2026 2027 2028 2029
978.0 1,027.5 1,171.8 1,276.1 1,276.7 1,276.7 1,276.7 49.4 144.4 104.3 0.6 - - -
1,027.5 1,171.8 1,276.1 1,276.7 1,276.7 1,276.7 1,276.7 1,002.8 1,099.7 1,224.0 1,276.4 1,276.7 1,276.7 1,276.7
72.2 109.7 151.8 199.9 250.5 301.1 351.7 109.7 151.8 199.9 250.5 301.1 351.7 385.5
90.9 130.7 175.8 225.2 275.8 326.4 368.6
- - - - - - - (49.4) (144.4) (104.3) (0.6) - - - 49.4 144.4 104.3 0.6 - - - - - - - - - - - - - - - - -
2023 2024 2025 2026 2027 2028 2029
2,157.8 2,177.3 2,198.4 2,220.2 2,244.4 2,269.3 2,294.1 19.5 21.2 21.8 24.2 24.9 24.8 26.1
2,177.3 2,198.4 2,220.2 2,244.4 2,269.3 2,294.1 2,320.2 2,167.5 2,187.9 2,209.3 2,232.3 2,256.8 2,281.7 2,307.2
485.4 571.1 657.6 744.9 833.0 922.0 1,011.9 571.1 657.6 744.9 833.0 922.0 1,011.9 1,072.5 528.3 614.4 701.2 788.9 877.5 967.0 1,042.2
(0.0) (0.0) (0.0) (0.0) (0.0) (0.0) (0.0) (19.5) (21.2) (21.8) (24.2) (24.9) (24.8) (26.1) 19.5 21.2 21.8 24.2 24.9 24.8 26.1
(0.0) (0.0) (0.0) (0.0) (0.0) (0.0) (0.0) (0.0) (0.0) (0.0) (0.0) (0.0) (0.0) (0.0)

Michigan Public Service Commission Case No.: U-20851DTE Electric Company Attachment: 3
2016 PA 342 Renewable Energy Plan - August 2020 Amended REP Affiant: P. D. KauffmanProduction Tax Credits Page: 1 of 1($ Millions, except where noted)
(a) (b) (c) (d) (e) (f) (g) (h) (i) (j) (k) (l) (m) (n) (o)
LineNo. Description 2016 2017 2018 2019 2020 2021 2022 2023 2024 2025 2026 2027 2028 2029
1 Production Tax Credits2 Qualifying Generation (MWh) 1,320,520 1,501,749 1,465,678 1,827,777 2,407,878 3,647,552 3,828,086 3,428,586 2,957,906 2,781,543 2,781,543 2,610,249 2,617,400 1,457,568 3 PTC Rate ($/MWh) 23.00 24.00 24.00 25.00 25.00 25.00 25.00 26.00 26.00 27.00 27.00 27.00 28.00 28.00 4 Wind Production Tax Credits Net 30.4 36.0 35.2 45.7 60.2 91.2 95.7 89.1 76.9 75.1 75.1 70.5 73.3 40.8 5 Reduction to Incremental Cost Of Compliance Grossed Up 49.8 59.1 47.5 60.8 81.2 123.1 129.2 120.3 103.8 101.4 101.4 95.1 98.9 55.1

Michigan Public Service Commission Case No.: U-20851DTE Electric Company Attachment: 4
2016 PA 342 Renewable Energy Plan - August 2020 Amended REP Affiant: P.D. KauffmanReturn on Equity Calculation Page: 1 of 1($ Millions, except where noted)
(a) (b) (c) (d) (e) (f) (g) (h) (i) (j) (k) (l)
LineNo. Description
2019 2020 2021 2022 2023 2024 2025 2026 2027 2028 2029
1 REP Compliance Return 11.00% 11.00% 11.00% 11.00% 11.00% 11.00% 11.00% 11.00% 11.00% 11.00% 11.00%
2 Authorized Voluntary Return 10.00% 9.93% 9.90% 9.90% 9.90% 9.90% 9.90% 9.90% 9.90% 9.90% 9.90%
3 Weighted Average Return on Equity 10.98% 10.76% 10.67% 10.67% 10.63% 10.61% 10.58% 10.57% 10.58% 10.58% 10.57%
4
5 Compliance
6 Plant in Service 1,398.4 1,602.0 1,941.5 2,148.5 2,167.5 2,187.9 2,209.3 2,232.3 2,256.8 2,281.7 2,307.2
7 CWIP 99.3 99.0 75.0 (0.0) (0.0) (0.0) (0.0) (0.0) (0.0) (0.0) (0.0)
8 Gross Plant 1,497.7 1,701.1 2,016.5 2,148.5 2,167.5 2,187.8 2,209.3 2,232.3 2,256.8 2,281.7 2,307.1
9 Accumulated Depreciation (242.0) (296.3) (364.5) (443.6) (528.3) (614.4) (701.2) (788.9) (877.5) (967.0) (1,042.2)
10 Net Plant 1,255.7 1,404.7 1,652.0 1,704.9 1,639.2 1,573.5 1,508.1 1,443.4 1,379.3 1,314.7 1,264.9
11 Deferred Federal Tax (140.7) (140.6) (112.1) (83.7) (56.3) (33.8) (33.0) (34.0) (44.5) (63.6) (110.4)
12 Simplified Rate Base 1,114.9 1,264.1 1,539.8 1,621.2 1,582.9 1,539.7 1,475.0 1,409.4 1,334.8 1,251.1 1,154.5
13
14 Authorized Large Customer Voluntary
15 Plant in Service - 364.1 728.6 853.6 1,002.8 1,099.7 1,224.0 1,276.4 1,276.7 1,276.7 1,276.7
16 CWIP 20.2 20.2 - - - - - - - - -
17 Gross Plant 20.2 384.2 728.6 853.6 1,002.8 1,099.7 1,224.0 1,276.4 1,276.7 1,276.7 1,276.7
18 Accumulated Depreciation - (6.8) (27.0) (56.4) (90.9) (130.7) (175.8) (225.2) (275.8) (326.4) (368.6)
19 Net Plant 20.2 377.4 701.6 797.2 911.8 968.9 1,048.1 1,051.2 1,000.9 950.3 908.1
20 Deferred Federal Tax - (14.8) (52.8) (88.3) (111.6) (132.7) (149.2) (159.4) (166.3) (170.6) (172.5)
21 Simplified Rate Base 20.2 362.6 648.7 708.9 800.2 836.2 898.9 891.8 834.6 779.7 735.6
22
23 Deferred Federal Tax Calculation (140.7) (155.4) (165.0) (172.0) (167.9) (166.5) (182.3) (193.4) (210.8) (234.2) (282.9)
24 B-27 SLW Deferred Tax (140.8) (155.4) (164.9) (172.0) (167.9) (166.5) (182.2) (193.4) (210.8) (234.2) (282.9)
25 0.0 (0.0) (0.0) (0.0) (0.0) (0.0) (0.0) (0.0) (0.0) (0.0) (0.0)

1
STATE OF MICHIGAN
BEFORE THE MICHIGAN PUBLIC SERVICE COMMISSION In the matter of DTE ELECTRIC COMPANY’S ) application for the regulatory reviews, revisions, ) determinations, and/or approvals necessary for ) Case No. U-20851 to fully comply with Public Act 295 of 2008 )
AFFIDAVIT OF THOMAS W. LACEY IN SUPPORT OF DTE ELECTRIC
COMPANY’S APPLICATION FOR APPROVAL OF THE AUGUST 2020 AMENDED RENEWABLE ENERGY PLAN
STATE OF MICHIGAN ) ` COUNTY OF WAYNE )
Thomas W. Lacey, being first duly sworn, deposes and says:
1. My title is Principal Financial Analyst in the Revenue Requirements Department
of the Regulatory Affairs Organization. I received a Bachelor of Science Degree in Accounting
from Michigan State University in 1981 and a Masters in Business Administration from Wayne
State University in 1992. From 1982 to 2001, I was employed by ANR Pipeline Company (ANR)
in the Rates and Regulatory Affairs department. I had several positions of increasing
responsibilities within the Rates area, ultimately rising to the position of Senior Rates Analyst.
During my nineteen years with ANR, I worked on numerous rate proceedings and filings before
the Federal Energy Regulatory Commission (FERC) including rate cases (FERC Docket Nos.
RP82-80, RP83-79, RP86-169, RP89-161, RS92-1, and RP94-43). My work was primarily in the
2
areas of cost-of-service and rate design. In 2002, I joined DTE as a Financial Analyst in the Load
Research department of Regulatory Affairs. I worked in Load Research until December 2005. My
responsibilities within Load Research included extensive work on the 2003 Michigan Consolidated
Gas Company (MichCon) rate case (U-13898) and The Detroit Edison Company (Detroit Edison)
rate filings. In December 2005, I accepted my current position. As a Principal Financial Analyst,
my responsibilities include the preparation of revenue requirements, cost of service and rate
design, testimony, exhibits and workpapers, in cases for both DTE Electric and DTE Gas. I am
also responsible for managing certain MPSC filings such as DTE Electric’s Renewable Energy
Plan (REP) case (U-17993) and DTE Electric’s most recent depreciation case (U-18150).
2. I have sponsored testimony in numerous cases before the Michigan Public Service
Commission (MPSC or Commission). In addition, I sponsored testimony before FERC, in ANR’s
general rate case in FERC Docket No. RP94-43.3.
3. The purpose of my affidavit is to present the incremental cost of compliance
calculation resulting from incorporating the Company’s voluntary green pricing (VGP) program
build plan into DTE Electric’s Commission-approved Renewable Energy Plan (REP) based on the
information, costs, and REP surcharge revenues associated with DTE Electric’s August 2020
Amended REP that were supplied to me and are supported in this application by DTE Electric
Affiants Mr. Harwood, Mr. Kauffman, Mr. Rivard, and Ms. Wisniewski. I am also supporting the
pre-tax cost of capital that I use to calculate the return on rate base, and the calculation of interest
on regulatory liabilities.
4. I am sponsoring the following attachments, which were prepared by me or under
my supervision:
3
Attachment Description
1 Incremental Cost of Compliance Summary
2 Revenue Requirement
3 Interest on Regulatory Liability
4 Pre-Tax Rate of Return and Revenue Conversion Factors
5 Actual and Forecast Meter Counts by Class – 2016 through 2029
5. The calculation of incremental cost of compliance that I support in this proceeding
is performed in the same manner as it was in the Company’s Commission-approved REP plan filed
March 31, 2020 (Case No. U-18232), and approved in the Commission’s July 9, 2020 order.
6. Attachment 1 displays the incremental cost of compliance calculation. The
attachment is arranged in three sections to match the language contained in MCL 460.1047 that
describes the components of the incremental cost of compliance. Attachment 1 displays the gross
sum of the costs described in MCL 460.1047(2)(a), the revenues/credits to be subtracted described
in MCL 460.1047(2)(b) and carrying costs on regulatory assets described in MCL 460.1047(3). It
should be noted that several of these lines or subcomponents described within a line have zero
values but are included on the attachment for completeness and possible future use.
7. Attachment 1, line 2 addresses subparts (i, ii, iii, and iv) of MCL 460.1047(2)(a)
and consists of Capital, Operating and Maintenance (O&M), Return on Equity (ROE), Financing,
Interconnect, and Ancillary service costs. Line 3 addresses subpart (v)(A) and consists of costs of
renewable energy credits (RECs) or advanced cleaner energy credits (ACECs) purchases. Line 4
addresses subpart (v)(B) and consists of costs of contracts described under former MCL
460.1033(1) (i.e., estimated third party purchase power agreements (PPAs) charges). Line 5
addresses subpart (vi) and consists of state and federal government actions related to renewable

4
energy (presently zero). Line 6 addresses total payments to Tax Equity Partners, as further
explained in the affidavit of Affiant Kauffman. Line 7 shows the sum of lines 1 through 6, DTE
Electric’s 2008 PA 295, as amended by 2016 PA 342, REP Gross Revenue Requirement. Line 9
addresses subpart (i) of MCL 460.1047(2)(b) and consists of revenue from the sale of
environmental attributes (i.e., REC sales) (presently zero). Lines 10 and 11 address subpart (iii)
and consist of tax credits to promote renewable energy (e.g., production tax credits (PTC), tax
benefits of solar grants and solar investment tax credits (ITC)). Line 12 addresses subpart (iv) and
consists of costs subject to recovery through the Power Supply Cost Recovery (PSCR). Affiant
Rivard supplies these costs. Line 13 addresses subpart (v) and consists of revenue from wholesale
renewable energy sales (presently zero). Lines 14-19 addresses subpart (vi) consists of additional
revenue as determined by the Commission, which consists of MIGreenPower and the planned VGP
subscription revenue, credit and PSCR reimbursement of the credit, which Affiants Rivard and
Harwood address. Line 20 addresses total cash distributions from Tax Equity Partnership, as
further explained in the affidavit of Affiant Kauffman. Line 21 addresses subpart (vii) and consists
of revenue recovered in rates for renewable energy costs included in MCL 460.1047(2)(a)
(presently proposed to be zero). Line 22 is for the amortization of the Regulatory Liability
associated with the TCJA supported by Affiant Wisniewski. Line 24 is a subtotal of all subtractions
(lines 8 through 22). Line 25 is the net of lines 7 and 24 and is the incremental cost of compliance
prior to adding interest.
8. Line 26 is the interest on regulatory liabilities that I calculate on Attachment 3
pursuant to MCL 460.1047(2)(a)(ii) and the applicable interest rate [the average short-term
borrowing rate available to the electric provider (in this instance DTE Electric) during the
appropriate period] is specified in MCL 460.1047(3). Line 27 contains the carrying charges for

5
regulatory assets that is described in MCL 460.1047(3) and is presently zero. Line 29 shows the
total incremental cost of compliance for the years 2016 through 2029.
9. MCL 460.1049 requires annual REP reconciliation proceedings. Years for which
the Commission has issued a final order in a REP reconciliation filing approving the actual REP
costs (i.e., reconciled years) will typically not be included in any amended plans subsequently filed
by the Company. The August 2020 Amended REP will carry forward the approved balances and
start with the year 2016. The most recent approved REP reconciliation case was filed on June 25,
2019 in Case No. U-20484 for the plan year 2018. An order was issued in that case on February
6, 2020.
10. Attachment 2 titled “Revenue Requirement” includes the calculation of average net
rate base and gross revenue requirements. Line 10, average net rate base, is comprised of the
following components: Plant in Service, Construction Work in Progress (CWIP), Accumulated
Depreciation Reserve, REC/ACEC inventory, International Transmission Company (ITC)
Accounts Receivable, and Accumulated Deferred Income Taxes. Line 22, gross revenue
requirement, is comprised of the following cost components: Pre-Tax Return on Net Rate Base,
PPA Purchased Power, RECs and ACECs consumed, O&M, Royalty Payments, Depreciation,
Property Taxes, Insurance, and Interest Received from ITC Holdings Corp.
11. In addition to the pre-tax cost of capital that I calculated on Attachment 4, I relied
upon information supplied by Affiants Kauffman, Rivard, Wisniewski and Harwood. Specifically,
Affiant Kauffman provided the Blended ROE, O&M, Royalty Payments, Depreciation, Property
Taxes, Insurance, Interest Received from ITC Holdings Corp., the average Plant-In-Service,
CWIP, Depreciation Reserve, and ITC Holdings Corp. Accounts Receivable. Affiant Wisniewski
provided deferred taxes. Affiant Harwood supplied the RECs/ACECs consumed. He also
6
provided renewable power expense and REC/ACEC purchases and consumption expense to
Affiant Kauffman who in turn supplied me with the average REC/ACEC inventory balances.
Affiant Rivard supplied the PPA Purchased Power.
12. Traditionally in Michigan, rate base is comprised of Plant-In-Service less
Depreciation Reserve plus CWIP, Working Capital, and Future Use. REP rate base in this case
follows the traditional definition used in general rate cases but is adjusted to reflect the impacts of
accumulated deferred income taxes and prepaid taxes.
13. Consistent with the treatment of accumulated pre-paid and deferred income taxes
used in DTE Electric’s original Commission-approved 2008 PA 295 REP, accumulated pre-paid
and deferred income taxes are included as part of rate base determination because, unlike in general
rate cases, they have not been included in the development of the 2008 PA 295, as amended by
2016 PA 342, REP’s Pre-tax Rate of Return. Therefore, these income taxes must be considered
as part of rate base in order to accurately determine the REP’s required pre-tax return. This REP
rate base treatment for taxes is required to match the pre-tax weighted average cost of permanent
capital that is used to calculate the return on rate base. Absent this tax adjustment to each year’s
REP rate base, it would be necessary to calculate a rate of return for each year to reflect the effects
of changes in zero cost capital that result from pre-paid and deferred income taxes.
14. The June 2, 2009 Order in MPSC Case No. U-15806 indicated uncollectible
expenses reflected in the original proposed 2008 PA 295 REP would be addressed in the
Company’s next general rate case. Therefore, uncollectible expenses are excluded from this
August 2020 Amended REP. The Commission in its June 2, 2009 Commission Order in Case No.
U-15806, page 22 indicated that Net Equity Costs Due to Imputed Debt would be considered at

7
the time of PPA approval. In subsequent Commission Orders1 approving PPAs the Commission
indicated that requests for imputed debt-related cost recovery would be handled in general rate
cases. Therefore, Net Equity Costs Due to Imputed Debt are also excluded from this August 2020
Amended REP.
15. Attachment 3 titled “Interest on Regulatory Liability” shows the calculation of the
average regulatory liability balance and the interest on that balance. Line 1 of Attachment 3
contains the REP Surcharge (a/k/a Revenue Recovery Mechanism surcharge) revenue, which is
zero given the surcharge is currently, and is proposed to remain, at zero. Line 2 contains the
incremental cost of compliance from Attachment 1, line 29. Line 3 contains the regulatory liability
increase or (decrease) for each year and is the result of subtracting the incremental cost of
compliance in line 2 from the REP surcharge revenues in line 1. Line 4 is the regulatory liability
ending balance for each year and is the sum of the prior year ending balance and the current year
change from line 3. Line 5 is the average regulatory liability that is used to calculate line 6, the
interest on the average liability balance. I use average short-term interest rates that I confirmed
with DTE Energy’s Treasury department to calculate the interest on the average regulatory
liability. The short-term interest rates are as follows: 0.85% for 2016 1.16% for 2017, 2.17% for
2018, 2.39% for 2019, 2.0% for 2020 through 2029. In accordance with MCL 460.1047(2)(a)(ii),
the interest on the regulatory liability is subtracted from the cost of compliance and the result is
displayed on Attachment 1, line 29.
16. In Attachment A to the December 4, 2008 Temporary Order in Case No. U-15800,
the Commission stated “Recovery to include the authorized rate of return on equity, which will
remain fixed at the rate of return and debt to equity ratio that was in effect in base rates when the
1 September 14, 2010 Commission Order in Case No. U-15806, page 6 and October 31, 2012 Commission Order in Case No. U-16582, page 7.
8
renewable plan was approved (MCL 460.1047 (1)).” In Exhibit A to the August 23, 2017 Order
in Case No. U-18409, the Commission includes the same directive. However, as required by the
Commission in its July 18, 2019, Order, the Company’s current approved (U-20561) return on
equity (ROE) is utilized for certain assets, which results in “blended ROE,” as more fully explained
by Affiant Kauffman.
17. For the years 2016-2018, I used the annual pre-tax rate of return approved in annual
REP reconciliation filings approved by the MPSC filed in cases U-18242 (2016), U-20172 (2017)
and U-20484 (2018).
18. For the years 2019-2029, I used the pre-tax rate of return shown on Line 10 of
Attachment 4 titled “Pre-Tax Rate of Return,” page 1 of 3. This pre-tax rate of return includes the
blended rate of return on equity calculated by Affiant Kauffman on his Attachment 4, and the debt
to equity ratio that was authorized at the time DTE Electric’s Original REP was approved and is
based on the December 23, 2008 order in Case No. U-15244.2 The long-term debt component of
the rate of return is calculated using the actual cost of debt for 2019 that was supplied to me by the
DTE Treasury department For the years 2020-2029 I used the debt approved in DTE Electric’s
most recent general rate case, Case U-20561. The revenue conversion factors are calculated in
columns (a) and (b), Attachment 4, page 3 of 3, and reflect Michigan Corporate Income tax3 and
Federal Income tax rates. The Michigan Corporate Income tax used in this case is 5.88% because
DTE Electric applies an apportionment factor to account for business conducted outside of the
State of Michigan. The long-term debt component of the rate of return, for the years 2020-2029
2 The December 23, 2008 Order in MPSC Case No. U-15244 at page 15 approves a long-term debt rate of 5.76% and at page 21 approves a rate of return on equity of 11.0%. 3 On May 25, 2011, Governor Rick Snyder signed into law 2011 Public Act 38, that replaces the MBT and Gross Receipts tax with a flat 6% Michigan Corporate Income Tax, effective January 1, 2012.

9
is calculated using the 4.22% cost of debt that was approved in the May 8, 2020 Order in Case No.
U-20561.4
19. There are two different equity revenue multipliers derived within the pages of
Attachment 4. The need for multiple equity revenue multipliers is driven by the different tax rates
in effect for different periods within the plan. Generally, the overall revenue multiplier derived on
Attachment 3 is a multiplication factor that I use to convert the after-tax return on equity
component to its pre-tax equivalent. Revenue collected to cover a Utility’s equity return is subject
to Michigan income tax, municipal taxes, and federal income tax.
20. I have not included an Allowance for Funds Used During Construction (AFUDC)
offset in the REP revenue requirement calculation. As supported by Affiant Kauffman, I have
included average CWIP in rate base thus allowing for immediate recognition of financing costs in
the incremental cost of compliance and eliminating the need for an AFUDC accrual.
21. Most likely there will be ongoing costs of compliance after the 20-year REP period
ends. As shown on Attachment 2 the Company projects that it will continue to have an ongoing
revenue requirement associated with its REP at the end of the 20-year REP period. Unless these
costs are completely offset by the subtractions described in MCL 460.1047(2)(b), there will be
ongoing costs of compliance after the 20-year REP period ends.
22. Attachment 5 provides the Company’s actual (2016-2018) and forecast (2019 –
2029) retail customer meter counts by class, which are required pursuant to the Commission’s
filing requirements established in the August 23, 2017 Order issued in Case No. U-18409 (see
Exhibit A pages 2 and 8 attached to Order).
23. The starting point for determining the number of meters was a current forecast of
4 The May 8, 2020 Order in MPSC Case No. U-20561 at page 171 approves a long-term debt rate of 4.22%.

10
the number of bundled customers provided on Exhibit B-26 of the Amended REP Plan filed March
31, 2020 (Case No. U-18232), sponsored by Company Witness Mr. Leuker. To translate the
bundled customer counts to meter counts, I multiplied the customer counts by the average number
of meters per customer for each class. The Company performed an analysis to determine the
relationship between customer counts and customer meters by class (Commercial Secondary,
Commercial / Industrial Primary), using historical billing data. The customer to meter ratio (as
shown below) is the same as used in DTE Electric’s Energy Waste Reduction Plan Filing (U-
20373), which was approved by the Commission on March 5, 2020. Since Witness Leuker shows
street lighting customers on a separate line on his Exhibit B-23 of the Amended REP Plan filed
March 31, 2020 (Case No. U-18232), I have added these customer counts to the bundled
commercial secondary customer counts in order to determine the total bundled commercial
secondary customer count. In addition, the bundled commercial secondary customer counts from
Witness Leuker’s March 2020 Case No. U-18232 testimony and exhibits do not include the
Company’s pumping customers, as these customers are excluded from paying the REPS surcharge
pursuant to PA342, Section 3(g). The Company determined the following meter to customer
ratios:
Residential = 1.0 meter per customer
Commercial Secondary = 1.0 meters per customer
Commercial & Industrial Primary = 1.20 meters per customer.
24. Based upon my knowledge and experience, the Company’s incremental cost of
compliance calculation resulting from incorporating the Company’s voluntary green pricing
(VGP) program build plan into DTE Electric’s Commission-approved Renewable Energy Plan
(REP) based on the information, costs, and REP surcharge revenues associated with DTE

11
Electric’s August 2020 Amended REP is reasonable and prudent and I recommend that the
Commission approve DTE Electric’s August 2020 Amended Renewable Energy Plan.
Further, Affiant sayeth not.
________________________________ Thomas W. Lacey Subscribed and sworn to before me this 31st day of August 2020. ___________________________ Estella R. Branson, Notary Public Oakland County, Michigan My Commission Expires: 10-26-2023 Acting in Wayne County

Michigan Public Service Commission Case No.: U-20851DTE Electric Company Attachment: 1
2016 PA 342 Renewable Energy Plan - August 2020 Amended REP Witness: T. W. Lacey
Incremental Cost of Compliance Summary Page: 1 of 2
for the Period 2016 to 2029($ Millions)
(a) (b) (c) (d) (e) (f) (g) (h) (i)
Line As FiledNo. MCL 460.1047 Description 2016 2017 2018 2019 2020 2021 20221 (2)(a) Sum of Costs:2 (i,ii,iii,iv) Capital, O&M, ROE, Financing, Interconnect & Ancillary 174.9 184.3 169.0 210.2 262.5 352.0 410.9 3 (v)(A) Expected RECs & ACECs to be Consumed 16.8 13.7 9.7 9.3 6.3 5.3 3.2 4 (v)(B) Costs of Contracts under Sec 33(1) - Estimated PPA Charges 100.0 102.4 100.5 105.1 107.9 108.5 116.0 5 (vi) State & Federal Government Actions Related to Renewable Energy - - - - - - - 6 Total Payment to Tax Equity Partnership(s) - - - - - - 2.9
7 Subtotal of Costs (Gross Revenue Requirement) 291.7 300.4 279.3 324.6 376.7 465.8 533.0 8 (2)(b) Subtractions from the Sum of Costs:9 (i) Revenue from the Sale of Environmental Attributes - REC Sales - - - - - - -
10 (iii) Tax Credits to Promote Renewable Energy - PTC 49.8 59.1 47.5 60.8 81.2 123.1 129.2 11 (iii) Tax Benefit of Solar Grants / Investment Tax Credit 0.3 0.3 0.2 0.5 0.7 2.2 2.2 12 (iv) Cost Recovered under the PSCR (Transfer Expense) 188.9 206.0 202.8 226.9 250.9 284.5 323.1 13 (v) Revenue From Wholesale Renewable Energy Sales - - - - - - - 14 (vi) VGP Subscription Revenue - - - - 4.5 59.1 61.9 15 (vi) VGP Subscription Credit - - - - (2.8) (38.1) (43.7) 16 (vi) VGP Subscription Credit (PSCR reimbursement) - - - - 2.8 38.1 43.7 17 (vi) MiGreenPower Subscription Revenue - 0.4 0.9 2.0 4.6 8.4 10.3 18 (vi) MiGreenPower Subscription Credit - (0.2) (0.5) (1.1) (2.5) (4.7) (5.7) 19 (vi) MiGreenPower Subscription Credit (PSCR reimbursement) - 0.2 0.5 1.1 2.5 4.7 5.7 20 Total Cash Distribution from Tax Equity Partnership(s) - - - - - - - 21 (vii) Revenues Recovered in Rates for Renewable Energy Costs Included in 2(a) - - - - - - - 22 Tax Cuts and Jobs Act of 2017 - Regulatory Liability Amortization - - - 0.5 2.7 3.0 3.8
2324 Subtotal of Subtractions 239.0 265.8 251.4 290.7 344.7 480.4 530.5 25 Subtotal - Prior to Interest on Regulatory Liabilities 52.7 34.6 27.9 33.9 32.0 (14.6) 2.5 26 (2)(a)(ii) Interest on Regulatory Liabilities @ Short Term Interest Rate 1.1 1.5 2.1 1.7 0.8 0.6 0.7 27 (3) Carrying Charges for Regulatory Assets @ Pre-tax Cost of Capital - - - - - - - 2829 Total Incremental Cost of Compliance 51.6 33.1 25.7 32.2 31.2 (15.3) 1.7
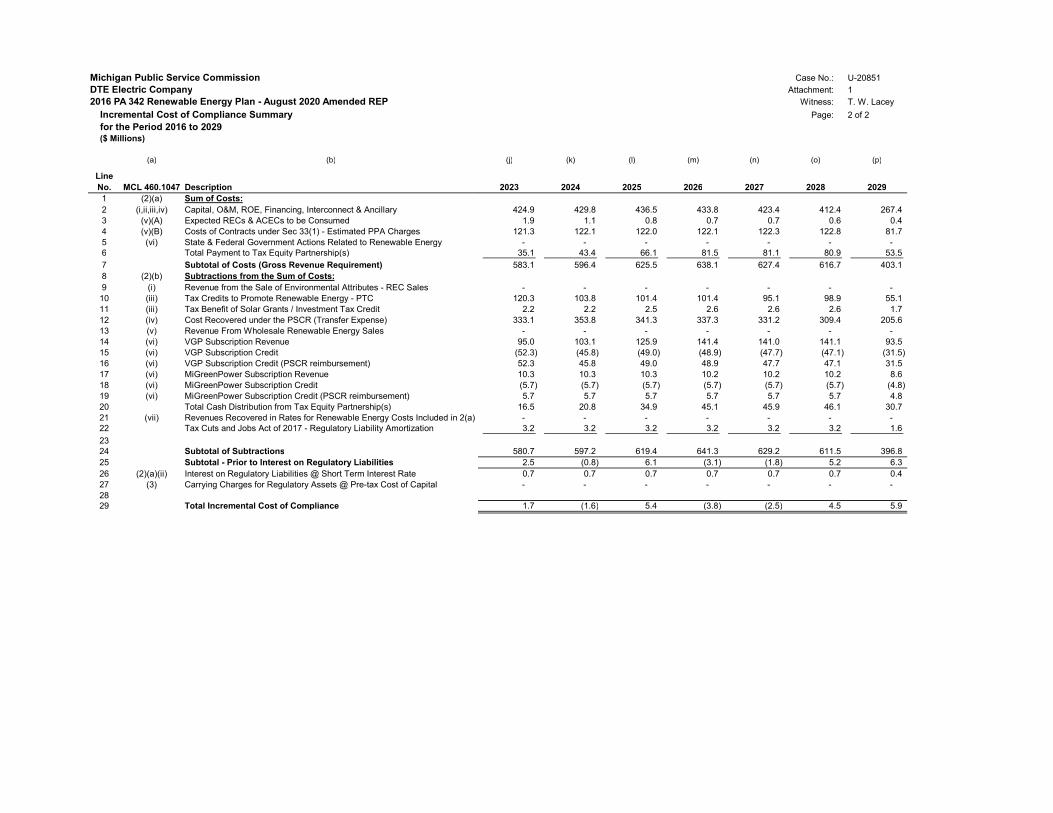
Michigan Public Service CommissionDTE Electric Company
2016 PA 342 Renewable Energy Plan - August 2020 Amended REPIncremental Cost of Compliance Summaryfor the Period 2016 to 2029($ Millions)
(a) (b)
LineNo. MCL 460.1047 Description1 (2)(a) Sum of Costs:2 (i,ii,iii,iv) Capital, O&M, ROE, Financing, Interconnect & Ancillary3 (v)(A) Expected RECs & ACECs to be Consumed4 (v)(B) Costs of Contracts under Sec 33(1) - Estimated PPA Charges5 (vi) State & Federal Government Actions Related to Renewable Energy6 Total Payment to Tax Equity Partnership(s)
7 Subtotal of Costs (Gross Revenue Requirement)8 (2)(b) Subtractions from the Sum of Costs:9 (i) Revenue from the Sale of Environmental Attributes - REC Sales
10 (iii) Tax Credits to Promote Renewable Energy - PTC11 (iii) Tax Benefit of Solar Grants / Investment Tax Credit12 (iv) Cost Recovered under the PSCR (Transfer Expense)13 (v) Revenue From Wholesale Renewable Energy Sales14 (vi) VGP Subscription Revenue 15 (vi) VGP Subscription Credit16 (vi) VGP Subscription Credit (PSCR reimbursement)17 (vi) MiGreenPower Subscription Revenue18 (vi) MiGreenPower Subscription Credit19 (vi) MiGreenPower Subscription Credit (PSCR reimbursement)20 Total Cash Distribution from Tax Equity Partnership(s)21 (vii) Revenues Recovered in Rates for Renewable Energy Costs Included in 2(a)22 Tax Cuts and Jobs Act of 2017 - Regulatory Liability Amortization
2324 Subtotal of Subtractions25 Subtotal - Prior to Interest on Regulatory Liabilities26 (2)(a)(ii) Interest on Regulatory Liabilities @ Short Term Interest Rate27 (3) Carrying Charges for Regulatory Assets @ Pre-tax Cost of Capital2829 Total Incremental Cost of Compliance
Case No.: U-20851Attachment: 1
Witness: T. W. Lacey
Page: 2 of 2
(j) (k) (l) (m) (n) (o) (p)
2023 2024 2025 2026 2027 2028 2029
424.9 429.8 436.5 433.8 423.4 412.4 267.4 1.9 1.1 0.8 0.7 0.7 0.6 0.4
121.3 122.1 122.0 122.1 122.3 122.8 81.7 - - - - - - -
35.1 43.4 66.1 81.5 81.1 80.9 53.5
583.1 596.4 625.5 638.1 627.4 616.7 403.1
- - - - - - - 120.3 103.8 101.4 101.4 95.1 98.9 55.1
2.2 2.2 2.5 2.6 2.6 2.6 1.7 333.1 353.8 341.3 337.3 331.2 309.4 205.6
- - - - - - - 95.0 103.1 125.9 141.4 141.0 141.1 93.5
(52.3) (45.8) (49.0) (48.9) (47.7) (47.1) (31.5) 52.3 45.8 49.0 48.9 47.7 47.1 31.5 10.3 10.3 10.3 10.2 10.2 10.2 8.6 (5.7) (5.7) (5.7) (5.7) (5.7) (5.7) (4.8) 5.7 5.7 5.7 5.7 5.7 5.7 4.8
16.5 20.8 34.9 45.1 45.9 46.1 30.7 - - - - - - - 3.2 3.2 3.2 3.2 3.2 3.2 1.6
580.7 597.2 619.4 641.3 629.2 611.5 396.8 2.5 (0.8) 6.1 (3.1) (1.8) 5.2 6.3 0.7 0.7 0.7 0.7 0.7 0.7 0.4 - - - - - - -
1.7 (1.6) 5.4 (3.8) (2.5) 4.5 5.9
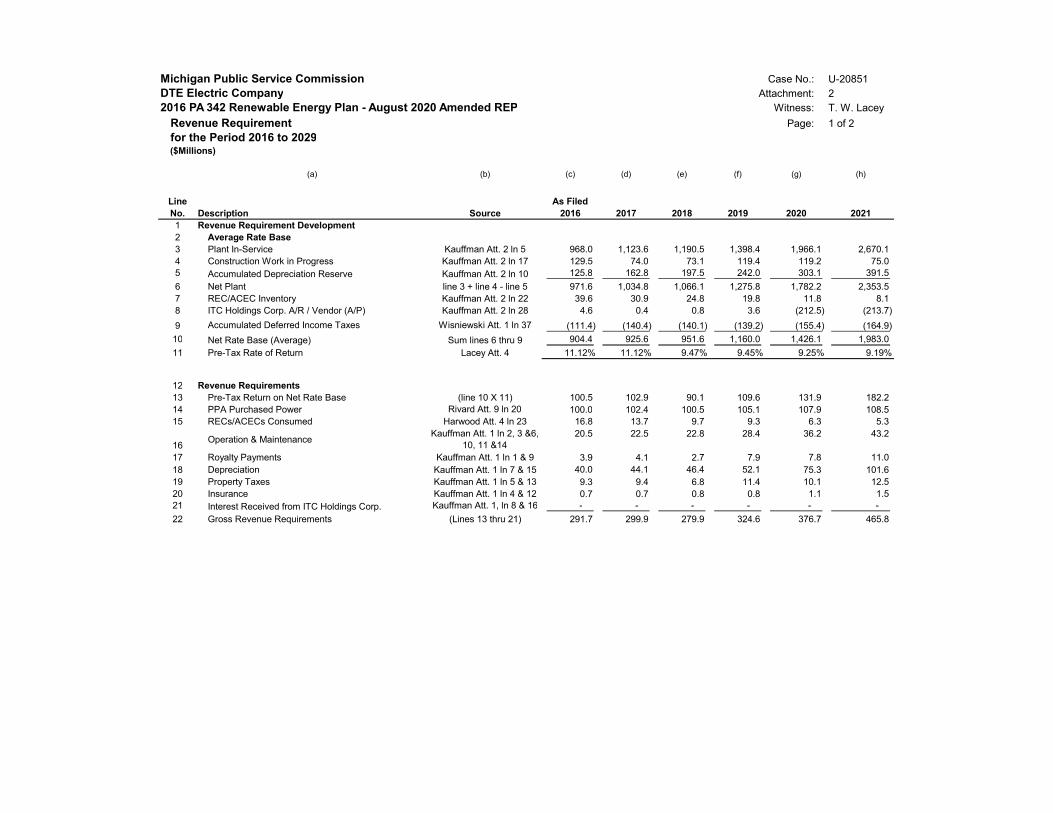
Michigan Public Service Commission Case No.: U-20851DTE Electric Company Attachment: 2
2016 PA 342 Renewable Energy Plan - August 2020 Amended REP Witness: T. W. Lacey
Revenue Requirement Page: 1 of 2for the Period 2016 to 2029($Millions)
(a) (b) (c) (d) (e) (f) (g) (h)
Line As FiledNo. Description Source 2016 2017 2018 2019 2020 20211 Revenue Requirement Development2 Average Rate Base3 Plant In-Service Kauffman Att. 2 ln 5 968.0 1,123.6 1,190.5 1,398.4 1,966.1 2,670.1 4 Construction Work in Progress Kauffman Att. 2 ln 17 129.5 74.0 73.1 119.4 119.2 75.0 5 Accumulated Depreciation Reserve Kauffman Att. 2 ln 10 125.8 162.8 197.5 242.0 303.1 391.5
6 Net Plant line 3 + line 4 - line 5 971.6 1,034.8 1,066.1 1,275.8 1,782.2 2,353.5 7 REC/ACEC Inventory Kauffman Att. 2 ln 22 39.6 30.9 24.8 19.8 11.8 8.1 8 ITC Holdings Corp. A/R / Vendor (A/P) Kauffman Att. 2 ln 28 4.6 0.4 0.8 3.6 (212.5) (213.7)
9 Accumulated Deferred Income Taxes Wisniewski Att. 1 ln 37 (111.4) (140.4) (140.1) (139.2) (155.4) (164.9)
10 Net Rate Base (Average) Sum lines 6 thru 9 904.4 925.6 951.6 1,160.0 1,426.1 1,983.0
11 Pre-Tax Rate of Return Lacey Att. 4 11.12% 11.12% 9.47% 9.45% 9.25% 9.19%
12 Revenue Requirements13 Pre-Tax Return on Net Rate Base (line 10 X 11) 100.5 102.9 90.1 109.6 131.9 182.2 14 PPA Purchased Power Rivard Att. 9 ln 20 100.0 102.4 100.5 105.1 107.9 108.5 15 RECs/ACECs Consumed Harwood Att. 4 ln 23 16.8 13.7 9.7 9.3 6.3 5.3
16Operation & Maintenance
Kauffman Att. 1 ln 2, 3 &6, 10, 11 &14
20.5 22.5 22.8 28.4 36.2 43.2
17 Royalty Payments Kauffman Att. 1 ln 1 & 9 3.9 4.1 2.7 7.9 7.8 11.0 18 Depreciation Kauffman Att. 1 ln 7 & 15 40.0 44.1 46.4 52.1 75.3 101.6 19 Property Taxes Kauffman Att. 1 ln 5 & 13 9.3 9.4 6.8 11.4 10.1 12.5 20 Insurance Kauffman Att. 1 ln 4 & 12 0.7 0.7 0.8 0.8 1.1 1.5 21 Interest Received from ITC Holdings Corp. Kauffman Att. 1, ln 8 & 16 - - - - - -
22 Gross Revenue Requirements (Lines 13 thru 21) 291.7 299.9 279.9 324.6 376.7 465.8

Michigan Public Service CommissionDTE Electric Company
2016 PA 342 Renewable Energy Plan - August 2020 Amended REPRevenue Requirementfor the Period 2016 to 2029($Millions)
(a) (b)
LineNo. Description Source1 Revenue Requirement Development2 Average Rate Base3 Plant In-Service Kauffman Att. 2 ln 54 Construction Work in Progress Kauffman Att. 2 ln 175 Accumulated Depreciation Reserve Kauffman Att. 2 ln 106 Net Plant line 3 + line 4 - line 57 REC/ACEC Inventory Kauffman Att. 2 ln 228 ITC Holdings Corp. A/R / Vendor (A/P) Kauffman Att. 2 ln 28
9 Accumulated Deferred Income Taxes Wisniewski Att. 1 ln 37
10 Net Rate Base (Average) Sum lines 6 thru 911 Pre-Tax Rate of Return Lacey Att. 4
12 Revenue Requirements13 Pre-Tax Return on Net Rate Base (line 10 X 11)14 PPA Purchased Power Rivard Att. 9 ln 2015 RECs/ACECs Consumed Harwood Att. 4 ln 23
16Operation & Maintenance
Kauffman Att. 1 ln 2, 3 &6, 10, 11 &14
17 Royalty Payments Kauffman Att. 1 ln 1 & 918 Depreciation Kauffman Att. 1 ln 7 & 1519 Property Taxes Kauffman Att. 1 ln 5 & 1320 Insurance Kauffman Att. 1 ln 4 & 1221 Interest Received from ITC Holdings Corp. Kauffman Att. 1, ln 8 & 16
22 Gross Revenue Requirements (Lines 13 thru 21)
Case No.: U-20851Attachment: 2
Witness: T. W. Lacey
Page: 2 of 2
(i) (j) (k) (l) (m) (n) (o) (p)
2022 2023 2024 2025 2026 2027 2028 2029
3,002.1 3,170.3 3,287.5 3,433.3 3,508.7 3,533.6 3,558.4 3,583.9 (0.0) (0.0) (0.0) (0.0) (0.0) (0.0) (0.0) (0.0)
500.0 619.2 745.1 877.1 1,014.1 1,153.3 1,293.4 1,410.9
2,502.1 2,551.1 2,542.4 2,556.2 2,494.6 2,380.2 2,265.0 2,173.0 5.6 4.3 3.7 3.4 3.3 3.3 3.3 3.4
(0.0) (0.0) (0.0) (0.0) (0.0) (0.0) (0.0) (0.0)
(172.0) (167.9) (166.5) (182.2) (193.4) (210.8) (234.2) (282.9)
2,335.6 2,387.4 2,379.5 2,377.3 2,304.5 2,172.7 2,034.1 1,893.5
9.18% 9.16% 9.15% 9.13% 9.12% 9.13% 9.13% 9.12%
214.5 218.7 217.7 217.0 210.2 198.3 185.6 115.1 116.0 121.3 122.1 122.0 122.1 122.3 122.8 81.7
3.2 1.9 1.1 0.8 0.7 0.7 0.6 0.4 49.0 50.3 51.5 52.8 54.1 55.4 56.8 38.8
12.7 13.0 13.3 13.7 14.0 14.4 14.7 10.1 115.3 123.2 128.6 135.4 138.7 139.6 140.6 94.3 17.7 17.9 16.8 15.7 14.7 13.6 12.6 7.7 1.7 1.8 1.9 2.0 2.0 2.0 2.0 1.4 - - - - - - - -
530.1 548.0 553.0 559.3 556.6 546.3 535.8 349.6

Michigan Public Service Commission Case No.: U-20851DTE Electric Company Attachment: 3
2016 PA 342 Renewable Energy Plan - August 2020 Amended REP Witness: T. W. LaceyInterest On Regulatory Liability Page: 1 of 1for the Period 2016 to 2029($Millions)
(a) (b) (c) (d) (e) (f) (g) (h) (i)
Line As FiledNo. Description Source 2016 2017 2018 2019 2020 2021 2022
1 Surcharge Revenue N/A 0.0 - - - - - - 2 Incremental Cost of Compliance Lacey Att. 1 ln 29 51.6 33.1 25.7 32.2 31.2 (15.3) 1.7
3 Regulatory Liability - Increase / (Decrease) line 1 - line 2 (51.6) (33.1) (25.7) (32.2) (31.2) 15.3 (1.7) 4 Regulatory Liability Ending Balance Prior Yr End + Cur. Yr Change 145.0 111.9 86.1 54.0 22.8 38.0 36.3 5 Average Regulatory Liability [Prior Yr End + Cur. Yr End]/2 170.8 128.4 99.0 70.1 38.4 30.4 37.2 6 Short Term Interest Rate Treasury 0.85% 1.16% 2.17% 2.39% 2.00% 2.00% 2.00%7 Interest on Avg Reg Liability line 5 x line 6 1.1 1.5 2.1 1.7 0.8 0.6 0.7
LineNo. Description Source 2023 2024 2025 2026 2027 2028 2029
1 Surcharge Revenue N/A - - - - - - - 2 Incremental Cost of Compliance Lacey Att. 1 ln 29 1.7 (1.6) 5.4 (3.8) (2.5) 4.5 5.9
3 Regulatory Liability - Increase / (Decrease) line 1 - line 2 (1.7) 1.6 (5.4) 3.8 2.5 (4.5) (5.9) 4 Regulatory Liability Ending Balance Prior Yr End + Cur. Yr Change 34.6 36.1 30.7 34.5 36.9 32.5 26.6 5 Average Regulatory Liability [Prior Yr End + Cur. Yr End]/2 35.4 35.3 33.4 32.6 35.7 34.7 29.5 6 Short Term Interest Rate Treasury 2.00% 2.00% 2.00% 2.00% 2.00% 2.00% 2.00%7 Interest on Avg Reg Liability line 5 x line 6 0.7 0.7 0.7 0.7 0.7 0.7 0.4
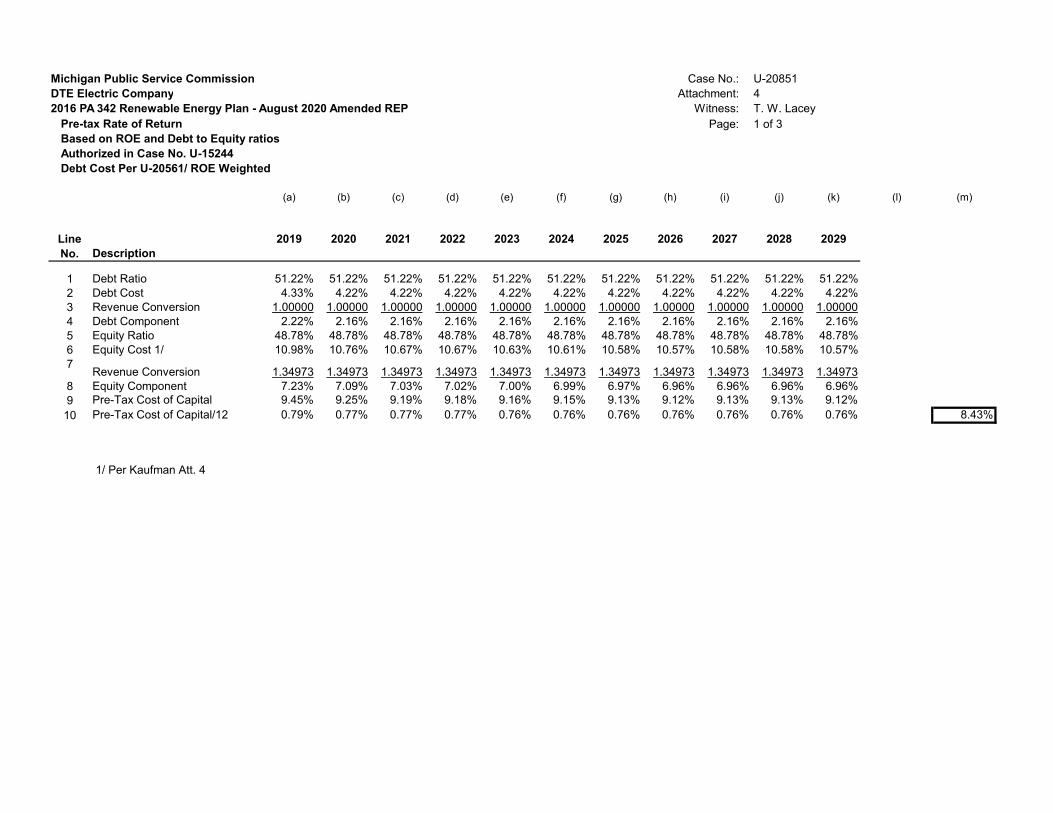
Michigan Public Service Commission Case No.: U-20851DTE Electric Company Attachment: 4
2016 PA 342 Renewable Energy Plan - August 2020 Amended REP Witness: T. W. LaceyPre-tax Rate of Return Page: 1 of 3Based on ROE and Debt to Equity ratios Authorized in Case No. U-15244Debt Cost Per U-20561/ ROE Weighted
(a) (b) (c) (d) (e) (f) (g) (h) (i) (j) (k) (l) (m)
LineNo. Description
2019 2020 2021 2022 2023 2024 2025 2026 2027 2028 2029
1 Debt Ratio 51.22% 51.22% 51.22% 51.22% 51.22% 51.22% 51.22% 51.22% 51.22% 51.22% 51.22%2 Debt Cost 4.33% 4.22% 4.22% 4.22% 4.22% 4.22% 4.22% 4.22% 4.22% 4.22% 4.22%3 Revenue Conversion 1.00000 1.00000 1.00000 1.00000 1.00000 1.00000 1.00000 1.00000 1.00000 1.00000 1.000004 Debt Component 2.22% 2.16% 2.16% 2.16% 2.16% 2.16% 2.16% 2.16% 2.16% 2.16% 2.16%5 Equity Ratio 48.78% 48.78% 48.78% 48.78% 48.78% 48.78% 48.78% 48.78% 48.78% 48.78% 48.78%6 Equity Cost 1/ 10.98% 10.76% 10.67% 10.67% 10.63% 10.61% 10.58% 10.57% 10.58% 10.58% 10.57%7
Revenue Conversion 1.34973 1.34973 1.34973 1.34973 1.34973 1.34973 1.34973 1.34973 1.34973 1.34973 1.349738 Equity Component 7.23% 7.09% 7.03% 7.02% 7.00% 6.99% 6.97% 6.96% 6.96% 6.96% 6.96%9 Pre-Tax Cost of Capital 9.45% 9.25% 9.19% 9.18% 9.16% 9.15% 9.13% 9.12% 9.13% 9.13% 9.12%
10 Pre-Tax Cost of Capital/12 0.79% 0.77% 0.77% 0.77% 0.76% 0.76% 0.76% 0.76% 0.76% 0.76% 0.76% 8.43%
1/ Per Kaufman Att. 4

Michigan Public Service Commission Case No.: U-20851DTE Electric Company Attachment: 4
2016 PA 342 Renewable Energy Plan - August 2020 Amended REP Witness: T. W. LaceyRevenue Conversion Factors & Effective Tax Rate Page: 2 of 3
(a) (b) (c) (d)
2018-2029
LineNo. Revenue Conversion Factor
DebtConversion
Percent
EquityConversion
Percent
DebtConversion
Percent
EquityConversion
Percent
1 Base 100.00% 100.00% 100.00% 100.00%2 MCIT Income Tax 1/ 5.88% 5.82%3 Municipal Tax Base (L1 - L2) 100.00% 94.12% 100.00% 94.18%4 Municipal Tax Rate 1/ 0.34% 0.33%5 FIT Base (L4 - L5) 100.00% 93.78% 100.00% 93.85%6 FIT Rate 1/ 21.00% 35.00%7 FIT Tax (L5 x L6) 0.00% 19.69% 0.00% 32.85%8 Income (L5 - L7) 100.00% 74.09% 100.00% 61.00%9 Revenue Multiplier (L1 / L8) 1.0000 1.3497 1.0000 1.6393
10 Cumulative Effective Tax Rate (1 - line 8, col b) 25.91% 39.00%
1/ Provided by DTE Tax Department
Revenue Conversion Factors
2017

Michigan Public Service Commission Case No.: U-20851DTE Electric Company Attachment: 4
2016 PA 342 Renewable Energy Plan - August 2020 Amended REP Affiant: T. W. LaceyPre-Tax Rate of Return and Revenue Conversion Factors Page: 3 of 3Based on Authorized ROE and Debt to Equity ratios Authorized in Case No. U-15244 and U-20561, Debt Cost from U-20561
(a) (b) (c) (d) (e) (f) (g) (h) (i) (j)
LineNo. Ratio Cost
RegulatedRoR
RevenueConversion
Pre TaxRoR Ratio Cost
RegulatedRoR
RevenueConversion
Pre TaxRoR
1 Debt 51.22% 4.22% 2.161% 1.0000 2.161% 51.22% 4.22% 2.161% 1.0000 2.161%2 Equity 48.78% 11.00% 1/ 5.366% 1.3497 7.242% 48.78% 9.90% 2/ 4.829% 1.3497 6.518%3 100.00% 7.53% 9.40% 100.00% 6.99% 8.68%
1/ ROE of 11.00% authorized in U-15244 2/ ROE of 9.90% authorized in U-20561
Revenue Conversion Factor
DebtConversion
Percent
EquityConversion
Percent
DebtConversion
Percent
EquityConversion
Percent
4 Base 100.00% 100.00% 100.00% 100.00%5 MCIT Income Tax 5.88% 5.82%6 Municipal Tax Base (L4 - L5) 100.00% 94.12% 100.00% 94.18%7 Municipal Tax Rate 0.34% 0.33%
8 FIT Base (L6 - L7) 100.00% 93.78% 100.00% 93.85%9 FIT Rate 21.00% 35.00%
10 FIT Tax (L8 x L9) 0.00% 19.69% 0.00% 32.85%
11 Income (L8 - L10) 100.00% 74.09% 100.00% 61.00%
12 Revenue Multiplier (L4 / L11) 1.0000 1.3497 1.0000 1.6393
13 Effective Tax Rate (L4 - L11) 25.91% 39.00%
2016-20172018-2029
Pre-Tax Rate of Return and Revenue Conversion Factors

Michigan Public Service Commission Case No.: U-20851DTE Electric Company Attachment: 5
2016 PA 342 Renewable Energy Plan - August 2020 Amended REP Affiant: T. W. LaceyActual and Forecast Meter Counts by Class Page: 1 of 1
(a) (b) (c) (d)
LINE NO. YEAR RESIDENTIAL
COMMERCIAL SECONDARY
COMMERCIAL / INDUSTRIAL
PRIMARY
1 2016 1,966,635 198,890 2,9702 2017 1,978,200 199,953 2,9373 2018 1,991,840 200,766 2,9404 2019 2,003,509 201,654 2,9295 2020 2,012,612 203,144 2,9156 2021 2,021,345 204,230 2,8257 2022 2,030,479 205,067 2,6518 2023 2,037,730 205,855 2,6349 2024 2,043,846 206,520 2,61810 2025 2,049,738 207,161 2,60111 2026 2,056,636 207,911 2,58512 2027 2,064,257 208,739 2,56913 2028 2,070,865 209,458 2,55214 2029 2,076,021 210,018 2,536
Ratio of meters per customer class:Residential 1.0Commercial Secondary 1.0Commercial & Industrial Primary 1.2
BUNDLED CUSTOMER METERS BY CLASS

1
STATE OF MICHIGAN
BEFORE THE MICHIGAN PUBLIC SERVICE COMMISSION In the matter of DTE ELECTRIC COMPANY’S ) application for the regulatory reviews, revisions, ) determinations, and/or approvals necessary for ) Case No. U-20851 to fully comply with Public Act 295 of 2008 )
AFFIDAVIT OF MARCUS J. RIVARD IN SUPPORT OF DTE ELECTRIC COMPANY’S APPLICATION FOR APPROVAL OF THE AUGUST 2020 AMENDED
RENEWABLE ENERGY PLAN
STATE OF MICHIGAN ) ) COUNTY OF WAYNE )
Marcus J. Rivard, being first duly sworn, deposes and says:
1. My title is Principal Market Engineer in the Power Supply Systems & Modeling
team within the Generation Optimization department. I received a Bachelor of Science Degree in
Nuclear Engineering from the University of Michigan in 2010. In 2015, I received a Master of
Business Administration Degree from the University of Toledo. Additionally, I have attended
Utility Rate School hosted by the National Association of Regulatory Utility Commissioners
(NARUC) and the Institute of Public Utilities at Michigan State University. In 2010, I was hired
by DTE Energy as an Associate Engineer at Fermi II nuclear generating station and worked in the
System Engineering department. In that role, I supported the safe and economical operation of the
nuclear plant by tracking, trending, and troubleshooting plant system operations as the primary
subject matter expert on several plant safety systems. I also ensured plant processes and

2
procedures for maintenance and operational activities remained in compliance with Code of
Federal Regulation standards in positions of increasing responsibility within System Engineering.
In 2015, I transferred to my current position in the Generation Optimization department as a
Principal Market Engineer. My current responsibilities include developing forecasts of Company
generation asset performance, including renewable energy facilities, to support internal Company
budget forecasts as well as Power Supply Cost Recovery (PSCR) cases proceedings before the
Michigan Public Commission (hereafter Commission or MPSC). I also perform analysis and
develop strategies to optimize Company generation assets within the wholesale power market.
This includes the planning and procurement of capacity resources to meet reliability requirements
for DTE Electric customers. My role also includes advocacy with MISO and MISO stakeholders
to ensure fair and favorable outcomes for DTE Electric customer affordability and reliability. I
sponsored testimony in the following MPSC cases:
U-18232 DTE Electric’s Amended Renewable Energy Plan
U-18242 DTE Electric’s 2016 Renewable Energy Plan Reconciliation
U-20172 DTE Electric’s 2017 Renewable Energy Plan Reconciliation
U-20484 DTE Electric’s 2018 Renewable Energy Plan Reconciliation
U-20527 DTE Electric’s 2020 Power Supply Cost Recovery Plan
U-20723 DTE Electric’s 2019 Renewable Energy Plan Reconciliation
2. With this filing, I present the Company’s transfer prices for the Company’s 2008
PA 295, as amended by 2016 PA 342, Renewable Energy Contracts and Company-owned
Renewable Energy Systems as well as the projected renewable energy generation expense for the
Company for years 2019 through 2029, which will be transferred for recovery through the
Company’s PSCR mechanism that results from incorporating DTE Electric’s Voluntary Green
3
Pricing (VGP) program build plan into its existing Commission-approved Renewable Energy Plan
(REP).
3. I am sponsoring the following attachments, which were prepared by me or under
my supervision:
Attachment Description
1 U-15806 Transfer Prices
2 2012 MPSC Staff Transfer Prices
3 2014 MPSC Staff Transfer Prices
4 2015 MPSC Staff Transfer Prices
5 2016 MPSC Staff Transfer Prices
6 2018 MPSC Staff Transfer Prices
7 2019 MPSC Staff Transfer Prices
8 2020 Proposed 2020 MPSC Staff Transfer Prices (Schedules A1, A2, A3)
9 PSCR Transfer Expense
Attachments 1, 2, 3, 4, 5, 6, and 7 present the Company’s Commission-approved transfer prices
for the Company’s 2008 PA 295 Renewable Energy Contracts and Company-owned Renewable
Energy Systems. Attachment 8 presents the Company’s proposed 2020 Transfer Prices.
Attachment 9 identifies each Renewable Energy Contract and Company-owned Renewable
Energy System with their associated transfer prices, as well as the forecasted volume and expense
of VGP programs, to provide a projection of the renewable energy expense that will be recovered
through the PSCR mechanism.
4. The Company’s proposed 2020 Transfer Prices as presented in Attachment 8,
Schedule A1, are based on a projection of the total cost of a natural gas combined cycle gas turbine
4
(CCGT) unit which was developed by the MPSC Staff and filed in Case No. U-15800 on March
11, 2020. The basis for these transfer prices is the levelized cost of energy (LCOE) of a CCGT
for the base year 2022, shown on Attachment 8, Schedule A2, with a levelized natural gas price
calculated from the U.S. Energy Information Administration’s projection of natural gas prices at
the Henry Hub, shown on Attachment 8, Schedule A3.
5. The CCGT plant assumptions used by the MPSC Staff in Case No. U-15800 differ
in operating characteristics and projection of natural gas prices from the Blue Water Energy Center
(BWEC) plant that was approved in the Company’s Certificate of Necessity application (MPSC
Case No. U-18419). Consequently, the MPSC Staff’s CCGT LCOE calculation assumptions differ
from the Company’s projected LCOE of the BWEC plant and therefore would not be
representative of the Company’s avoided cost of capacity and energy. However, the assumptions
and calculations used by Staff to develop the LCOE of a generic CCGT plant and the associated
transfer price schedule are comparable to those used in previous renewable energy case
proceedings that have been approved by the Commission. The Company has reviewed the MPSC
Staff’s transfer price methodology, including the levelized cost calculation variables, and finds it
to be reasonable for the purpose of determining the transfer price schedule.
6. Historically, the Renewable Energy generated by Company-owned Renewable
Energy Systems has been recovered through the PSCR process at the lesser of the approved
transfer price or LCOE projected for the specific Company-owned Renewable Energy System at
the time the construction contracts were approved by the Commission. The transfer prices the
Commission approves for each 2008 PA 295 and 2016 PA 342 Renewable Energy Contract and
Company-owned Renewable Energy System are established for the life of the contract or project.
Doing so ensures that the economic viability of projects that have been committed to will not be
5
jeopardized by transfer prices that change in future years.
7. In the July 9, 2020 Order in DTE Electric’s Amended REP Plan Case No. U-18232,
the Commission authorized the Company to transfer to the PSCR up to the approved Transfer
Price, not limited by LCOE, for Company-owned Renewable Energy Systems in order to maintain
a sufficient regulatory liability account balance. In this August 2020 Amended REP Plan, the
Company has utilized this same PSCR transfer price mechanism for certain Company-owned wind
assets to maintain a projected regulatory liability balance of at least $20 million for each forecast
year 2021 through 2029.
8. As discussed, Attachment 9 provides a projection of the renewable energy expense
that will be recovered through the PSCR mechanism. The forecasted volume and expense of VGP
programs, referred to in Attachment 9 as MIGreenPower Subscribed Wind/Solar and VGP
Subscribed Wind/Solar, are carved out of the total Generation and PSCR Transfer Expense as these
expenses are borne by VGP customers rather than the Company’s PSCR customers. The projected
Company-owned generation volumes from Witness Harwood’s Attachment 3 are used along with
projected power purchase agreement (PPA) volumes and each project’s associated transfer prices
to determine the projected PSCR expense in each year.
10. Based upon my knowledge and experience, the Company’s transfer prices for the
Company’s 2008 PA 295, as amended by 2016 PA 342, Renewable Energy Contracts and
Company-owned Renewable Energy Systems as well as the projected renewable energy generation
expense for the Company for years 2019 through 2029, which will be transferred for recovery
through the Company’s PSCR mechanism that results from incorporating DTE Electric’s VGP
program build plan into its existing Commission-approved REP is reasonable and prudent. I
recommend that the Commission approve DTE Electric’s August 2020 Amended Renewable
6
Energy Plan.
Further, Affiant sayeth not.
________________________________ Marcus J. Rivard Subscribed and sworn to before me this 31st day of August 2020. ___________________________ Estella R. Branson, Notary Public Oakland County, Michigan My Commission Expires: 10-26-2023 Acting in Wayne County
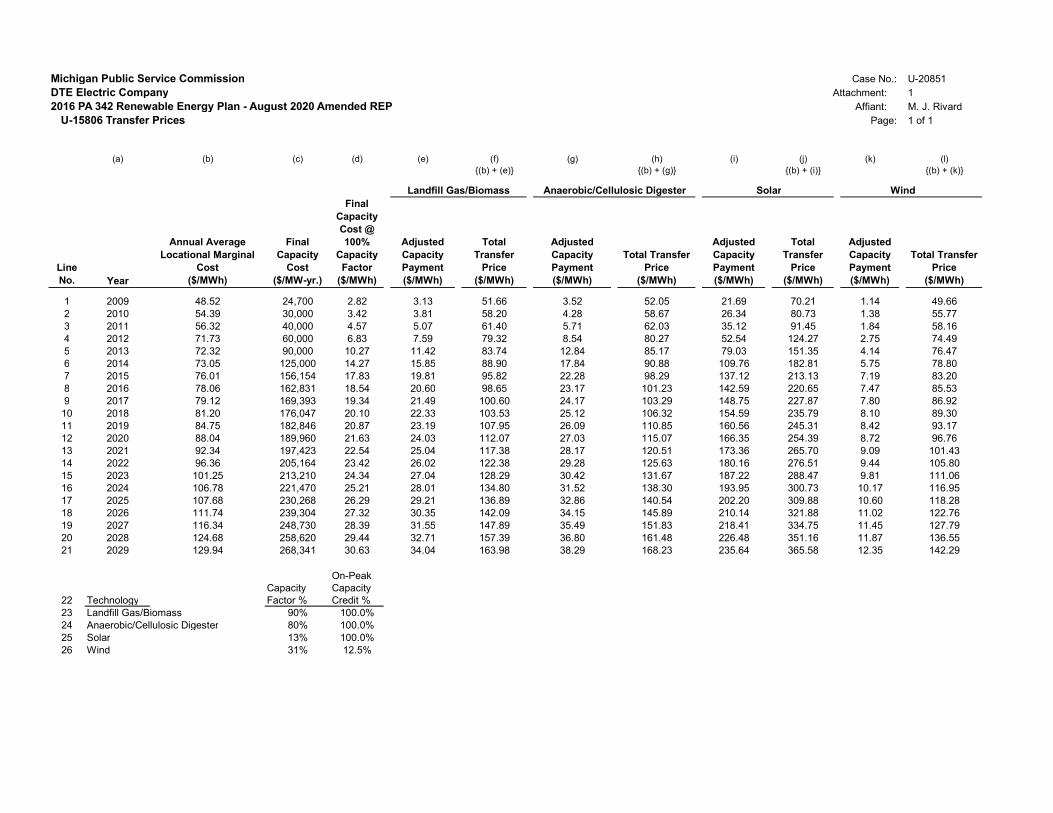
Michigan Public Service Commission Case No.: U-20851DTE Electric Company Attachment: 1
2016 PA 342 Renewable Energy Plan - August 2020 Amended REP Affiant: M. J. Rivard U-15806 Transfer Prices Page: 1 of 1
(a) (b) (c) (d) (e) (f) (g) (h) (i) (j) (k) (l){(b) + (e)} {(b) + (g)} {(b) + (i)} {(b) + (k)}
Landfill Gas/Biomass Anaerobic/Cellulosic Digester Solar Wind
Line No. Year
Annual Average Locational Marginal
Cost($/MWh)
Final Capacity
Cost($/MW-yr.)
Final Capacity Cost @ 100%
Capacity Factor
($/MWh)
Adjusted Capacity Payment($/MWh)
Total Transfer
Price($/MWh)
Adjusted Capacity Payment($/MWh)
Total Transfer Price
($/MWh)
Adjusted Capacity Payment($/MWh)
Total Transfer
Price($/MWh)
Adjusted Capacity Payment($/MWh)
Total Transfer Price
($/MWh)
1 2009 48.52 24,700 2.82 3.13 51.66 3.52 52.05 21.69 70.21 1.14 49.662 2010 54.39 30,000 3.42 3.81 58.20 4.28 58.67 26.34 80.73 1.38 55.773 2011 56.32 40,000 4.57 5.07 61.40 5.71 62.03 35.12 91.45 1.84 58.164 2012 71.73 60,000 6.83 7.59 79.32 8.54 80.27 52.54 124.27 2.75 74.495 2013 72.32 90,000 10.27 11.42 83.74 12.84 85.17 79.03 151.35 4.14 76.476 2014 73.05 125,000 14.27 15.85 88.90 17.84 90.88 109.76 182.81 5.75 78.807 2015 76.01 156,154 17.83 19.81 95.82 22.28 98.29 137.12 213.13 7.19 83.208 2016 78.06 162,831 18.54 20.60 98.65 23.17 101.23 142.59 220.65 7.47 85.539 2017 79.12 169,393 19.34 21.49 100.60 24.17 103.29 148.75 227.87 7.80 86.92
10 2018 81.20 176,047 20.10 22.33 103.53 25.12 106.32 154.59 235.79 8.10 89.3011 2019 84.75 182,846 20.87 23.19 107.95 26.09 110.85 160.56 245.31 8.42 93.1712 2020 88.04 189,960 21.63 24.03 112.07 27.03 115.07 166.35 254.39 8.72 96.7613 2021 92.34 197,423 22.54 25.04 117.38 28.17 120.51 173.36 265.70 9.09 101.4314 2022 96.36 205,164 23.42 26.02 122.38 29.28 125.63 180.16 276.51 9.44 105.8015 2023 101.25 213,210 24.34 27.04 128.29 30.42 131.67 187.22 288.47 9.81 111.0616 2024 106.78 221,470 25.21 28.01 134.80 31.52 138.30 193.95 300.73 10.17 116.9517 2025 107.68 230,268 26.29 29.21 136.89 32.86 140.54 202.20 309.88 10.60 118.2818 2026 111.74 239,304 27.32 30.35 142.09 34.15 145.89 210.14 321.88 11.02 122.7619 2027 116.34 248,730 28.39 31.55 147.89 35.49 151.83 218.41 334.75 11.45 127.7920 2028 124.68 258,620 29.44 32.71 157.39 36.80 161.48 226.48 351.16 11.87 136.5521 2029 129.94 268,341 30.63 34.04 163.98 38.29 168.23 235.64 365.58 12.35 142.29
22 TechnologyCapacity Factor %
On-Peak Capacity Credit %
23 Landfill Gas/Biomass 90% 100.0%24 Anaerobic/Cellulosic Digester 80% 100.0%25 Solar 13% 100.0%26 Wind 31% 12.5%

Michigan Public Service Commission Case No.: U-20851
DTE Electric Company Attachment: 2
2016 PA 342 Renewable Energy Plan - August 2020 Amended REP Affiant: M. J. Rivard
2012 MPSC Staff Transfer Prices Page: 1 of 1
(a) (b) (c) (d)
Line No. Year
MPSC Staff 2012 Transfer Price - Fixed Cost
($/MWh)
MPSC Staff 2012 Transfer Price
- Variable Cost($/MWh)
2012 MPSC Staff Transfer Price
($/MWh)
1 2013 29.13 35.49 64.622 2014 29.65 38.22 67.873 2015 30.16 40.99 71.164 2016 30.34 41.68 72.025 2017 30.31 40.89 71.206 2018 30.29 41.81 72.097 2019 30.29 43.17 73.468 2020 30.30 44.05 74.349 2021 30.49 45.25 75.75
10 2022 30.70 46.56 77.2611 2023 30.88 47.93 78.8112 2024 31.12 49.44 80.5613 2025 31.35 50.96 82.3114 2026 31.58 52.11 83.6915 2027 31.78 52.77 84.5616 2028 32.01 54.05 86.0617 2029 32.21 55.45 87.66

Michigan Public Service Commission Case No.: U-20851
DTE Electric Company Attachment: 3
2016 PA 342 Renewable Energy Plan - August 2020 Amended REP Affiant: M. J. Rivard
2014 MPSC Staff Transfer Prices Page: 1 of 1
(a) (b) (c) (d)
Line No. Year
MPSC Staff 2014 Transfer Price - Fixed Cost
($/MWh)
MPSC Staff 2014 Transfer Price
- Variable Cost($/MWh)
2014 MPSC Staff Transfer Price
($/MWh)
1 2014 31.19 38.93 70.122 2015 31.59 38.50 70.093 2016 32.03 38.37 70.404 2017 32.44 39.56 71.995 2018 32.74 41.16 73.896 2019 33.03 41.05 74.087 2020 33.37 40.64 74.018 2021 33.81 42.85 76.669 2022 34.30 44.19 78.49
10 2023 34.81 45.13 79.9411 2024 35.29 45.62 80.9112 2025 35.80 47.00 82.8013 2026 36.33 49.00 85.3314 2027 36.84 50.14 86.9815 2028 37.33 51.36 88.6916 2029 37.81 52.61 90.41

Michigan Public Service Commission Case No.: U-20851
DTE Electric Company Attachment: 4
2016 PA 342 Renewable Energy Plan - August 2020 Amended REP Affiant: M. J. Rivard
2015 MPSC Staff Transfer Prices Page: 1 of 1
(a) (b) (c) (d)
Line No. Year
MPSC Staff 2015 Transfer Price - Fixed Cost
($/MWh)
MPSC Staff 2015 Transfer Price
- Variable Cost($/MWh)
2015 MPSC Staff Transfer Price
($/MWh)
1 2015 32.06 36.21 68.272 2016 32.61 36.79 69.403 2017 33.61 38.91 72.524 2018 34.52 40.55 75.075 2019 35.27 42.17 77.446 2020 36.04 43.33 79.377 2021 36.75 43.75 80.508 2022 37.33 44.31 81.649 2023 37.91 45.59 83.50
10 2024 38.43 46.28 84.7211 2025 39.01 47.70 86.7112 2026 39.56 48.72 88.2813 2027 40.18 49.85 90.0214 2028 40.81 51.87 92.6815 2029 41.38 53.17 94.55

Michigan Public Service Commission Case No.: U-20851
DTE Electric Company Attachment: 5
2016 PA 342 Renewable Energy Plan - August 2020 Amended REP Affiant: M. J. Rivard
2016 MPSC Staff Transfer Prices Page: 1 of 1
(a) (b) (c) (d)
Line No. Year
MPSC Staff 2016 Transfer Price - Fixed Cost
($/MWh)
MPSC Staff 2016 Transfer Price
- Variable Cost($/MWh)
2016 MPSC Staff Transfer Price
($/MWh)
1 2016 33.21 38.58 71.802 2017 34.01 40.61 74.623 2018 35.19 42.77 77.964 2019 36.15 44.49 80.645 2020 37.01 45.94 82.956 2021 37.77 47.97 85.757 2022 38.49 50.26 88.758 2023 39.07 50.87 89.949 2024 39.59 52.04 91.63
10 2025 40.07 53.41 93.4811 2026 40.48 54.07 94.5612 2027 40.92 55.63 96.5513 2028 41.34 56.82 98.1614 2029 41.77 58.11 99.88
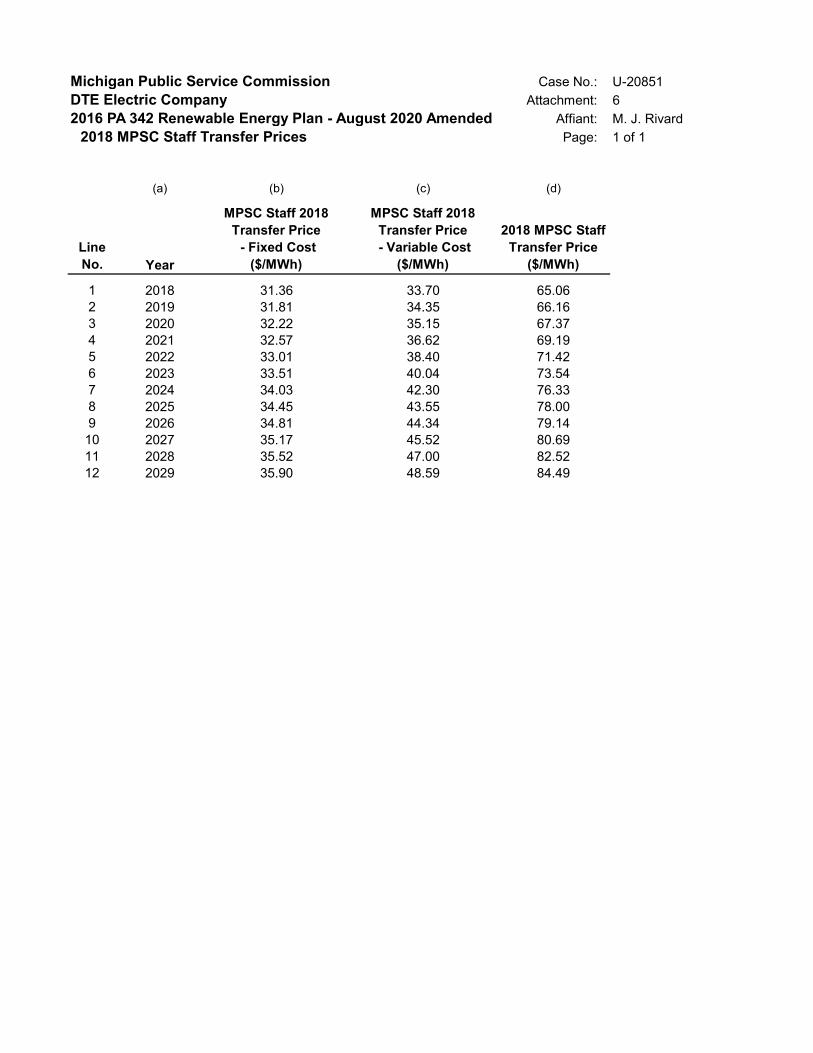
Michigan Public Service Commission Case No.: U-20851
DTE Electric Company Attachment: 6
2016 PA 342 Renewable Energy Plan - August 2020 Amended REP Affiant: M. J. Rivard
2018 MPSC Staff Transfer Prices Page: 1 of 1
(a) (b) (c) (d)
Line No. Year
MPSC Staff 2018 Transfer Price - Fixed Cost
($/MWh)
MPSC Staff 2018 Transfer Price
- Variable Cost($/MWh)
2018 MPSC Staff Transfer Price
($/MWh)
1 2018 31.36 33.70 65.062 2019 31.81 34.35 66.163 2020 32.22 35.15 67.374 2021 32.57 36.62 69.195 2022 33.01 38.40 71.426 2023 33.51 40.04 73.547 2024 34.03 42.30 76.338 2025 34.45 43.55 78.009 2026 34.81 44.34 79.14
10 2027 35.17 45.52 80.6911 2028 35.52 47.00 82.5212 2029 35.90 48.59 84.49

Michigan Public Service Commission Case No.: U-20851
DTE Electric Company Attachment: 7
2016 PA 342 Renewable Energy Plan - August 2020 Amended REP Affiant: M. J. Rivard
2019 MPSC Staff Transfer Prices Page: 1 of 1
(a) (b) (c) (d)
Line No. Year
MPSC Staff 2019 Transfer Price - Fixed Cost
($/MWh)
MPSC Staff 2019 Transfer Price
- Variable Cost($/MWh)
2019 MPSC Staff Transfer Price
($/MWh)
1 2019 31.99 30.25 62.232 2020 32.39 30.77 63.163 2021 32.71 31.87 64.584 2022 33.10 33.34 66.445 2023 33.62 35.20 68.826 2024 34.20 37.50 71.707 2025 34.73 38.78 73.528 2026 35.32 39.82 75.149 2027 35.94 41.37 77.31
10 2028 36.62 43.34 79.9611 2029 37.35 46.17 83.52

Michigan Public Service Commission Case No.: U-20851
DTE Electric Company Attachment: 8
2016 PA 342 Renewable Energy Plan - August 2020 Amended REP Schedule: A1
2020 MPSC Staff Transfer Prices Affiant: M.J. Rivard
Page: 1 of 1
( a ) ( b ) ( c ) ( d )
Line No. Year
MPSC Staff 2020 Transfer Price - Fixed Cost
($/MWh)
MPSC Staff 2020 Transfer Price
- Variable Cost($/MWh)
DTE Electric Proposed / 2020
MPSC Staff Transfer Price
($/MWh)1 2020 32.28 23.99 56.272 2021 32.55 25.22 57.773 2022 33.04 26.16 59.214 2023 33.59 27.27 60.865 2024 34.24 29.40 63.646 2025 34.95 30.76 65.717 2026 35.72 31.90 67.618 2027 36.48 33.45 69.949 2028 37.24 35.36 72.6010 2029 37.97 37.49 75.45

Michigan Public Service Commission Case No.: U-20851
DTE Electric Company Attachment: 8
2016 PA 342 Renewable Energy Plan - August 2020 Amended REP Schedule: A2
2020 MPSC Staff Combined Cycle Levelized Cost Affiant: M.J. Rivard
Page: 1 of 1
( a ) ( b ) ( c ) ( d ) ( e ) ( f )Line No.1 Levelized Cost Calculation23 NGCC notes4 Capacity MW 400 MW5 Loading Factor 71.00% The % of time the unit would be dispatched if available
6 Equivalent Avail. 87.00%The % of time the unit would be available for dispatch. A combination of FOR and planned outages
7 Capacity Factor 61.77% (Loading Factor)(Equivalent Availability)8 Heat Rate Btu/kWh 6719 BTU/kWh9 Fuel Cost $/MBtu $3.91 $ per thousand BTU
10 Total Cost MM no AFUDC $518.108 MM11 AFUDC $70.84 MM12 Total Cost MM $588.952 MM13 Fixed Charge Rate 11.59% % used to calculate fixed cost recovery component14 Fixed O&M $/kW $14.62 $/kW15 Annual Lev. Fixed Cost MM $68.26 MM16 Total Annual Lev. Fixed Cost MM $74.11 MM17 Fixed Cost $/kWh 0.0342 $/kWh18 Fuel Cost $/kWh 0.0263 $/kWh19 Var. O&M $/kWh 0.0031 $/kWh20 Total Var. Cost 0.0294 $/kWh21 Total Cost $/kWh 0.06364 $/kWh22232425 AFUDC Total Overnight Cost (MM) in 2020 $ Inflation Rate Cumulative Finance Rate26 Year GCC $489.117 2% 6.56%27 1 5% 24 24.94 24.94 1.6428 2 30% 147 152.66 177.61 11.6529 3 35% 171 181.67 359.28 23.5730 4 30% 147 158.83 518.11 33.9931 1 489 518.108 70.8432
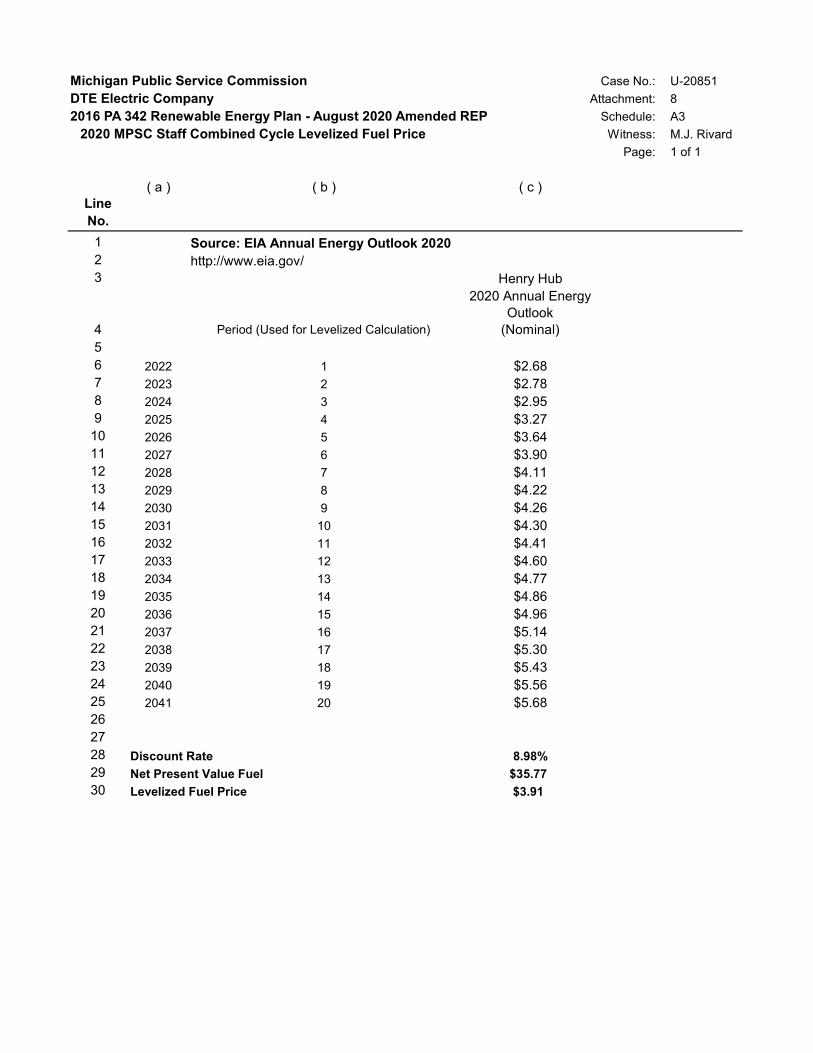
Michigan Public Service Commission Case No.: U-20851
DTE Electric Company Attachment: 8
2016 PA 342 Renewable Energy Plan - August 2020 Amended REP Schedule: A3
2020 MPSC Staff Combined Cycle Levelized Fuel Price Witness: M.J. Rivard
Page: 1 of 1
( a ) ( b ) ( c )Line No.
1 Source: EIA Annual Energy Outlook 20202 http://www.eia.gov/3 Henry Hub
4 Period (Used for Levelized Calculation)
2020 Annual Energy Outlook
(Nominal)56 2022 1 $2.687 2023 2 $2.788 2024 3 $2.959 2025 4 $3.27
10 2026 5 $3.6411 2027 6 $3.9012 2028 7 $4.1113 2029 8 $4.2214 2030 9 $4.2615 2031 10 $4.3016 2032 11 $4.4117 2033 12 $4.6018 2034 13 $4.7719 2035 14 $4.8620 2036 15 $4.9621 2037 16 $5.1422 2038 17 $5.3023 2039 18 $5.4324 2040 19 $5.5625 2041 20 $5.68262728 Discount Rate 8.98%29 Net Present Value Fuel $35.7730 Levelized Fuel Price $3.91

Michigan Public Service Commission Case No.: U-20851DTE Electric Company Attachment: 9
2016 PA 342 Renewable Energy Plan - August 2020 Amended REP Witness: M. J. RivardPSCR Transfer Expense Page: 1 of 4
(a) (b) (c) (d) (e) (f) (g) (h) (i) (j)Line Actual Actual Actual Actual Actual Actual Actual Actual Actual Actual PreliminaryNo. 2009 2010 2011 2012 2013 2014 2015 2016 2017 2018 2019 2020 2021 2022
PPAs1 L'Anse Warden Generation 1,000 MWh - 44.4 112.1 124.8 118.1 118.3 118.2 95.4 113.2 122.8 122.8 117.6 117.3 117.3 2 U-15806 Transfer Price Transfer Amount to PSCR $Mil -$ 2.6$ 6.9$ 9.9$ 9.9$ 10.5$ 11.3$ 9.4$ 11.4$ 12.5$ 12.5$ 12.0$ 12.0$ 12.0$
3 Blue Water Generation 1,000 MWh - - 3.9 27.3 26.4 24.7 22.6 24.4 24.4 28.0 25.6 25.6 25.5 25.5 4 U-15806 Transfer Price Transfer Amount to PSCR $Mil -$ -$ 0.2$ 2.2$ 2.2$ 2.2$ 2.2$ 2.4$ 2.4$ 2.8$ 2.5$ 2.5$ 2.5$ 2.5$
5 WM Renewable Generation 1,000 MWh - - 8.9 26.1 26.5 26.9 24.3 26.0 26.1 25.2 24.8 26.5 26.4 26.4 6 U-15806 Transfer Price Transfer Amount to PSCR $Mil -$ -$ 0.5$ 2.1$ 2.2$ 2.3$ 2.1$ 2.2$ 2.2$ 2.1$ 2.1$ 2.3$ 2.2$ 2.2$
7 Stoney Corners Generation 1,000 MWh 1.7 39.2 80.0 74.0 81.2 84.6 85.4 80.9 78.4 76.7 77.5 81.8 81.8 81.8 8 U-15806 Transfer Price Transfer Amount to PSCR $Mil 0.1$ 2.2$ 4.7 5.5 6.2 6.7 7.1$ 6.9$ 6.8$ 6.9$ 7.2$ 7.9$ 8.3$ 8.7$
9 Gratiot Generation 1,000 MWh - - - 226.2 287.5 295.9 304.5 284.1 291.5 268.7 282.6 293.0 293.0 293.0 10 U-15806 Transfer Price Transfer Amount to PSCR $Mil -$ -$ -$ 16.8$ 22.0$ 23.3$ 25.3$ 24.3$ 25.3$ 24.0$ 25.8$ 26.8$ 26.8$ 26.8$
11 Tuscola Bay Wind Generation 1,000 MWh - - - 42.1 364.3 371.0 377.8 362.4 355.0 345.8 377.6 368.9 368.9 368.9 12 U-15806 Transfer Price Transfer Amount to PSCR $Mil -$ -$ -$ 2.0$ 22.2$ 22.6$ 23.0$ 22.1$ 21.6$ 21.1$ 23.0$ 22.5$ 22.5$ 22.5$
13 Tuscola Wind II Generation 1,000 MWh - - - - 45.2 316.4 322.8 312.7 312.7 292.6 315.7 325.2 325.2 325.2 14 2012 MPSC Staff Transfer Prices Transfer Amount to PSCR $Mil -$ -$ -$ -$ 1.4$ 15.0$ 15.9$ 15.4$ 15.4$ 14.4$ 15.5$ 16.0$ 16.0$ 16.0$
15 Pheasant Run Generation 1,000 MWh - - - - 25.0 344.8 266.8 264.6 266.0 259.7 254.8 275.8 275.8 275.8 16 2012 MPSC Staff Transfer Prices Transfer Amount to PSCR $Mil -$ -$ -$ -$ 0.8$ 15.9$ 13.1$ 13.0$ 13.1$ 12.8$ 12.5$ 13.6$ 13.6$ 13.6$
17 Big Turtle Generation 1,000 MWh - - - - - 3.2 77.0 79.4 78.0 75.1 70.9 82.4 82.4 82.4 18 2012 MPSC Staff Transfer Prices Transfer Amount to PSCR $Mil -$ -$ -$ -$ -$ 0.2$ 4.1$ 4.2$ 4.1$ 4.0$ 3.8$ 4.4$ 4.4$ 4.4$
19 Assembly Generation 1,000 MWh - - - - - - - - - - - - 5.6 162.3 20 2019 MPSC Staff Transfer Prices Transfer Amount to PSCR $Mil -$ -$ -$ -$ -$ -$ -$ -$ -$ -$ -$ -$ 0.2$ 6.7$
21 Riverfork Generation 1,000 MWh - - - - - - - - - - - - - 12.5
22 2019 MPSC Staff Transfer Prices Transfer Amount to PSCR $Mil -$ -$ -$ -$ -$ -$ -$ -$ -$ -$ -$ -$ -$ 0.5$
23 2022 Solar PPA Generation 1,000 MWh - - - - - - - - - - - - - 34.2
24 2019 MPSC Staff Transfer Prices Transfer Amount to PSCR $Mil -$ -$ -$ -$ -$ -$ -$ -$ -$ -$ -$ -$ -$ 1.8$
25 VGP Subscribed Solar Generation 1,000 MWh - - - - - - - - - - - - - (34.2)
26 2019 MPSC Staff Transfer Prices Transfer Amount to PSCR $Mil -$ -$ -$ -$ -$ -$ -$ -$ -$ -$ -$ -$ -$ (1.6)$
27 Generation - PPA 1,000 MWh 1.7 83.6 204.8 520.4 974.2 1,585.9 1,599.4 1,529.8 1,545.2 1,494.7 1,552.4 1,596.8 1,602.0 1,771.2 28 PSCR Transfer Expense - PPA $Mil 0.1$ 4.8$ 12.3$ 38.5$ 66.9$ 98.6$ 104.1$ 99.9$ 102.4$ 100.5$ 105.1$ 107.9$ 108.5$ 116.0$

Michigan Public Service CommissionDTE Electric Company
2016 PA 342 Renewable Energy Plan - August 2020 Amended REPPSCR Transfer Expense
(a) (b) (c)LineNo.
PPAs1 L'Anse Warden Generation 1,000 MWh2 U-15806 Transfer Price Transfer Amount to PSCR $Mil
3 Blue Water Generation 1,000 MWh4 U-15806 Transfer Price Transfer Amount to PSCR $Mil
5 WM Renewable Generation 1,000 MWh6 U-15806 Transfer Price Transfer Amount to PSCR $Mil
7 Stoney Corners Generation 1,000 MWh8 U-15806 Transfer Price Transfer Amount to PSCR $Mil
9 Gratiot Generation 1,000 MWh10 U-15806 Transfer Price Transfer Amount to PSCR $Mil
11 Tuscola Bay Wind Generation 1,000 MWh12 U-15806 Transfer Price Transfer Amount to PSCR $Mil
13 Tuscola Wind II Generation 1,000 MWh14 2012 MPSC Staff Transfer Prices Transfer Amount to PSCR $Mil
15 Pheasant Run Generation 1,000 MWh16 2012 MPSC Staff Transfer Prices Transfer Amount to PSCR $Mil
17 Big Turtle Generation 1,000 MWh18 2012 MPSC Staff Transfer Prices Transfer Amount to PSCR $Mil
19 Assembly Generation 1,000 MWh20 2019 MPSC Staff Transfer Prices Transfer Amount to PSCR $Mil
21 Riverfork Generation 1,000 MWh
22 2019 MPSC Staff Transfer Prices Transfer Amount to PSCR $Mil
23 2022 Solar PPA Generation 1,000 MWh
24 2019 MPSC Staff Transfer Prices Transfer Amount to PSCR $Mil
25 VGP Subscribed Solar Generation 1,000 MWh
26 2019 MPSC Staff Transfer Prices Transfer Amount to PSCR $Mil
27 Generation - PPA 1,000 MWh28 PSCR Transfer Expense - PPA $Mil
Case No.: U-20851Attachment: 9
Witness: M. J. RivardPage: 2 of 4
(k) (l) (m) (n) (o) (p) (q)
2023 2024 2025 2026 2027 2028 2029
117.3 117.6 117.3 117.3 117.3 117.6 78.2 12.0$ 12.0$ 12.0$ 12.0$ 12.0$ 12.0$ 8.0$
25.5 25.6 25.5 25.5 25.5 25.6 17.0 2.5$ 2.5$ 2.5$ 2.5$ 2.5$ 2.5$ 1.7$
26.4 26.5 26.4 26.4 26.4 26.5 17.6 2.2$ 2.3$ 2.2$ 2.2$ 2.2$ 2.3$ 1.5$
81.8 82.1 81.8 81.8 81.8 82.1 54.6 9.1$ 9.5$ 9.5$ 9.5$ 9.5$ 9.5$ 6.3$
293.0 293.8 293.0 293.0 293.0 293.8 195.3 26.8$ 26.9$ 26.8$ 26.8$ 26.8$ 26.9$ 17.9$
368.9 369.9 368.9 368.9 368.9 369.9 245.9 22.5$ 22.5$ 22.5$ 22.5$ 22.5$ 22.5$ 15.0$
325.2 326.1 325.2 325.2 325.2 326.1 216.8 16.0$ 16.1$ 16.0$ 16.0$ 16.0$ 16.1$ 10.7$
275.8 276.6 275.8 275.8 275.8 276.6 183.9 13.6$ 13.6$ 13.6$ 13.6$ 13.6$ 13.6$ 9.1$
82.4 82.7 82.4 82.4 82.4 82.7 55.0 4.4$ 4.4$ 4.4$ 4.4$ 4.4$ 4.4$ 2.9$
161.5 160.7 159.9 159.1 158.3 157.5 104.5 6.7$ 6.8$ 6.9$ 7.0$ 7.1$ 7.2$ 4.9$
100.3 99.8 99.3 98.8 98.3 97.8 64.9 4.3$ 4.4$ 4.4$ 4.5$ 4.6$ 4.6$ 3.1$
273.5 272.1 270.7 269.4 268.0 266.7 176.9 14.3$ 14.3$ 14.2$ 14.1$ 14.1$ 14.0$ 9.3$
(273.5) (272.1) (270.7) (269.4) (268.0) (266.7) (176.9) (13.2)$ (13.1)$ (13.0)$ (13.0)$ (12.9)$ (12.9)$ (8.5)$
1,858.1 1,861.2 1,855.5 1,854.2 1,853.0 1,856.0 1,233.6 121.3$ 122.1$ 122.0$ 122.1$ 122.3$ 122.8$ 81.7$

Michigan Public Service Commission Case No.: U-20851DTE Electric Company Attachment: 9
2016 PA 342 Renewable Energy Plan - August 2020 Amended REP Witness: M. J. RivardPSCR Transfer Expense Page: 3 of 4
(a) (b) (c) (d) (e) (f) (g) (h) (i) (j)Line Actual Actual Actual Actual Actual Actual Actual Actual Actual Actual PreliminaryNo. 2009 2010 2011 2012 2013 2014 2015 2016 2017 2018 2019 2020 2021 2022
DTE Electric Owned29 Gratiot County Wind Generation 1,000 MWh - - 3.0 236.0 254.8 264.2 272.6 253.7 260.8 239.9 252.8 256.5 255.8 255.8 30 U-15806 Transfer Price Transfer Amount to PSCR $Mil - - 0.2$ 17.6$ 19.5$ 20.8$ 22.7$ 21.7$ 22.7$ 21.4$ 23.6$ 24.1$ 25.9$ 27.1$
31 Thumb Wind Parks Generation 1,000 MWh - - - 15.1 388.1 400.4 412.3 406.3 418.1 410.1 414.5 413.2 412.0 412.0 32 U-15806 Transfer Price Transfer Amount to PSCR $Mil - - - 1.1$ 24.9$ 25.6$ 26.4$ 27.0$ 27.8$ 27.3$ 27.6$ 27.5$ 41.8$ 43.6$
33 Echo Wind Park Generation 1,000 MWh - - - - 2.6 192.9 394.3 386.8 394.8 391.7 391.4 392.7 391.6 391.6 34 2012 MPSC Staff Transfer Prices Transfer Amount to PSCR $Mil - - - - 0.1$ 10.8$ 22.1$ 22.6$ 23.1$ 22.9$ 22.9$ 23.0$ 29.7$ 30.3$
35 Brookfield Wind Park Generation 1,000 MWh - - - - - 90.0 265.9 260.6 258.2 251.1 255.2 258.8 258.1 258.1 36 2012 MPSC Staff Transfer Prices Transfer Amount to PSCR $Mil - - - - - 4.4$ 13.1$ 13.5$ 13.4$ 13.0$ 13.2$ 13.4$ 19.5$ 19.9$
37 Pinnebog Wind Park Generation 1,000 MWh - - - - - - - 13.1 169.9 172.8 172.7 171.8 171.3 171.3 38 2014 MPSC Staff Transfer Prices Transfer Amount to PSCR $Mil - - - - - - - 0.7$ 9.3$ 9.5$ 9.5$ 9.4$ 9.4$ 9.4$
39 Pine River Wind Park Generation 1,000 MWh - - - - - - - - - - 341.1 425.1 423.9 423.9 40 2015 MPSC Staff Transfer Prices Transfer Amount to PSCR $Mil - - - - - - - - - - 17.7$ 22.1$ 22.0$ 22.0$
41 Polaris Wind Park Generation 1,000 MWh - - - - - - - - - - - 399 502 502 42 2016 MPSC Staff Transfer Prices Transfer Amount to PSCR $Mil - - - - - - - - - - - 18.3$ 23.1$ 23.1$
43 Fairbanks Wind Park Generation 1,000 MWh - - - - - - - - - - - 52 248 248 44 2018 MPSC Staff Transfer Prices Transfer Amount to PSCR $Mil - - - - - - - - - - - 2.3$ 11.2$ 11.2$
45 Isabella Wind Park I Generation 1,000 MWh - - - - - - - - - - - 20 488 488 46 2018 MPSC Staff Transfer Prices Transfer Amount to PSCR $Mil - - - - - - - - - - - 1.0$ 24.7$ 24.7$
47 Isabella Wind Park II Generation 1,000 MWh - - - - - - - - - - - 19 460 460 48 2018 MPSC Staff Transfer Prices Transfer Amount to PSCR $Mil - - - - - - - - - - - 1.0$ 23.3$ 23.3$
49 Meridian Wind Park Generation 1,000 MWh - - - - - - - - - - - - 51 612 50 2019 MPSC Staff Transfer Prices Transfer Amount to PSCR $Mil - - - - - - - - - - - - 2.5$ 30.0$
51 MIGreenPower Subscribed Wind Subscribed Generation 1,000 MWh - - - - - - - - (3) (7) (14) (31.8) (58) (75) 52 2014 MPSC Staff Transfer Prices Transfer Amount to PSCR $Mil - - - - - - - - (0.1)$ (0.4)$ (0.7)$ (1.7)$ (3.2)$ (4.1)$
53 VGP Subscribed Wind Subscribed Generation 1,000 MWh - - - - - - - - - - - (91.3) (1,194.9) (1,194.9) 54 Transfer Amount to PSCR $Mil - - - - - - - - - - - (4.3)$ (59.1)$ (59.1)$
55 DTE SolarCurrents (~13.75MW) Generation 1,000 MWh - - 1.5 3.1 5.4 8.6 11.2 14.8 16.8 16.0 15.8 15.9 15.8 15.7 56 U-15806 Transfer Price Transfer Amount to PSCR $Mil - - 0.1$ 0.4$ 0.8$ 1.6$ 2.4$ 3.3$ 3.8$ 3.8$ 3.9$ 4.0$ 4.2$ 4.3$
57 DTE SolarCurrents (~1.25MW) Generation 1,000 MWh - - - - - - 0.6 1.5 1.5 1.4 1.9 1.5 1.5 1.5 58 2012 MPSC Staff Transfer Price Transfer Amount to PSCR $Mil - - - - - - 0.0$ 0.1$ 0.1$ 0.1$ 0.1$ 0.1$ 0.1$ 0.1$
59 Demille/Turrill/O'Shea Utility-Scale Solar Generation 1,000 MWh - - - - - - - - 53.1 69.1 69.7 69.3 68.7 68.4 60 2014 MPSC Staff Transfer Prices Transfer Amount to PSCR $Mil - - - - - - - - 3.8$ 5.1$ 5.2$ 5.1$ 5.3$ 5.4$
61 2020 Future Solar Pilot Generation 1,000 MWh - - - - - - - - - - - 0.1 1.1 1.1 62 2019 MPSC Staff Transfer Prices Transfer Amount to PSCR $Mil - - - - - - - - - - - 0.0$ 0.1$ 0.1$
63 2021 Future Solar Pilot Generation 1,000 MWh - - - - - - - - - - - - 1.6 19.2 64 2019 MPSC Staff Transfer Prices Transfer Amount to PSCR $Mil - - - - - - - - - - - - 0.1$ 1.3$
65 2022 Solar Build (1) Generation 1,000 MWh - - - - - - - - - - - - - 20.6 66 2019 MPSC Staff Transfer Prices Transfer Amount to PSCR $Mil - - - - - - - - - - - - - 1.1$
67 2022 Solar Build (2) Generation 1,000 MWh - - - - - - - - - - - - - 34.7 68 2019 MPSC Staff Transfer Prices Transfer Amount to PSCR $Mil - - - - - - - - - - - - - 1.8$
69 2023 Solar Build (1) Generation 1,000 MWh - - - - - - - - - - - - - - 70 2019 MPSC Staff Transfer Prices Transfer Amount to PSCR $Mil - - - - - - - - - - - - - -
71 2024 Solar Build (1) Generation 1,000 MWh - - - - - - - - - - - - - - 72 2019 MPSC Staff Transfer Prices Transfer Amount to PSCR $Mil - - - - - - - - - - - - - -
73 2025 Solar Build (1) Generation 1,000 MWh - - - - - - - - - - - - - - 74 2019 MPSC Staff Transfer Prices Transfer Amount to PSCR $Mil - - - - - - - - - - - - - -
75 2026 Solar Build (1) Generation 1,000 MWh - - - - - - - - - - - - - - 76 2019 MPSC Staff Transfer Prices Transfer Amount to PSCR $Mil - - - - - - - - - - - - - -
77 2027 Solar Build (1) Generation 1,000 MWh - - - - - - - - - - - - - - 78 2019 MPSC Staff Transfer Prices Transfer Amount to PSCR $Mil - - - - - - - - - - - - - -
79 2028 Solar Build (1) Generation 1,000 MWh - - - - - - - - - - - - - - 80 2019 MPSC Staff Transfer Prices Transfer Amount to PSCR $Mil - - - - - - - - - - - - - -
81 2029 Solar Build (1) Generation 1,000 MWh - - - - - - - - - - - - - - 82 2019 MPSC Staff Transfer Prices Transfer Amount to PSCR $Mil - - - - - - - - - - - - - -
83 MIGreenPower Subscribed Solar Subscribed Generation 1,000 MWh - - - - - - - - (2.7) (6.5) (13.6) (31.8) (58.4) (68.4) 84 2014 MPSC Staff Transfer Prices Transfer Amount to PSCR $Mil - - - - - - - - (0.2)$ (0.5)$ (1.0)$ (2.4)$ (4.5)$ (5.4)$
85 VGP Subscribed Solar Subscribed Generation 1,000 MWh - - - - - - - - - - - - - (55.4) 86 Transfer Amount to PSCR $Mil - - - - - - - - - - - - - (2.9)$
87 Generation - Owned (excluding VGPs) 1,000 MWh - - 4.4 254.3 651.0 956.1 1,356.9 1,336.8 1,567.8 1,539.2 1,888.1 2,339.7 2,437.7 2,989.0 88 PSCR Transfer Expense - Owned $Mil -$ -$ 0.3$ 19.1$ 45.3$ 63.2$ 86.7$ 88.9$ 103.6$ 102.2$ 121.9$ 143.0$ 176.0$ 207.1$
89 Total Generation (excluding VGPs) 1,000 MWh 1.7 83.6 209.3 774.7 1,625.2 2,542.0 2,956.2 2,866.7 3,113.0 3,033.9 3,440.4 3,936.6 4,039.7 4,760.2 90 Total PSCR Transfer Expense $Mil 0.1$ 4.8$ 12.6$ 57.6$ 112.3$ 161.9$ 190.8$ 188.9$ 206.1$ 202.7$ 226.9$ 250.9$ 284.5$ 323.1$

Michigan Public Service CommissionDTE Electric Company
2016 PA 342 Renewable Energy Plan - August 2020 Amended REPPSCR Transfer Expense
(a) (b) (c)LineNo.
DTE Electric Owned29 Gratiot County Wind Generation 1,000 MWh30 U-15806 Transfer Price Transfer Amount to PSCR $Mil
31 Thumb Wind Parks Generation 1,000 MWh32 U-15806 Transfer Price Transfer Amount to PSCR $Mil
33 Echo Wind Park Generation 1,000 MWh34 2012 MPSC Staff Transfer Prices Transfer Amount to PSCR $Mil
35 Brookfield Wind Park Generation 1,000 MWh36 2012 MPSC Staff Transfer Prices Transfer Amount to PSCR $Mil
37 Pinnebog Wind Park Generation 1,000 MWh38 2014 MPSC Staff Transfer Prices Transfer Amount to PSCR $Mil
39 Pine River Wind Park Generation 1,000 MWh40 2015 MPSC Staff Transfer Prices Transfer Amount to PSCR $Mil
41 Polaris Wind Park Generation 1,000 MWh42 2016 MPSC Staff Transfer Prices Transfer Amount to PSCR $Mil
43 Fairbanks Wind Park Generation 1,000 MWh44 2018 MPSC Staff Transfer Prices Transfer Amount to PSCR $Mil
45 Isabella Wind Park I Generation 1,000 MWh46 2018 MPSC Staff Transfer Prices Transfer Amount to PSCR $Mil
47 Isabella Wind Park II Generation 1,000 MWh48 2018 MPSC Staff Transfer Prices Transfer Amount to PSCR $Mil
49 Meridian Wind Park Generation 1,000 MWh50 2019 MPSC Staff Transfer Prices Transfer Amount to PSCR $Mil
51 MIGreenPower Subscribed Wind Subscribed Generation 1,000 MWh52 2014 MPSC Staff Transfer Prices Transfer Amount to PSCR $Mil
53 VGP Subscribed Wind Subscribed Generation 1,000 MWh54 Transfer Amount to PSCR $Mil
55 DTE SolarCurrents (~13.75MW) Generation 1,000 MWh56 U-15806 Transfer Price Transfer Amount to PSCR $Mil
57 DTE SolarCurrents (~1.25MW) Generation 1,000 MWh58 2012 MPSC Staff Transfer Price Transfer Amount to PSCR $Mil
59 Demille/Turrill/O'Shea Utility-Scale Solar Generation 1,000 MWh60 2014 MPSC Staff Transfer Prices Transfer Amount to PSCR $Mil
61 2020 Future Solar Pilot Generation 1,000 MWh62 2019 MPSC Staff Transfer Prices Transfer Amount to PSCR $Mil
63 2021 Future Solar Pilot Generation 1,000 MWh64 2019 MPSC Staff Transfer Prices Transfer Amount to PSCR $Mil
65 2022 Solar Build (1) Generation 1,000 MWh66 2019 MPSC Staff Transfer Prices Transfer Amount to PSCR $Mil
67 2022 Solar Build (2) Generation 1,000 MWh68 2019 MPSC Staff Transfer Prices Transfer Amount to PSCR $Mil
69 2023 Solar Build (1) Generation 1,000 MWh70 2019 MPSC Staff Transfer Prices Transfer Amount to PSCR $Mil
71 2024 Solar Build (1) Generation 1,000 MWh72 2019 MPSC Staff Transfer Prices Transfer Amount to PSCR $Mil
73 2025 Solar Build (1) Generation 1,000 MWh74 2019 MPSC Staff Transfer Prices Transfer Amount to PSCR $Mil
75 2026 Solar Build (1) Generation 1,000 MWh76 2019 MPSC Staff Transfer Prices Transfer Amount to PSCR $Mil
77 2027 Solar Build (1) Generation 1,000 MWh78 2019 MPSC Staff Transfer Prices Transfer Amount to PSCR $Mil
79 2028 Solar Build (1) Generation 1,000 MWh80 2019 MPSC Staff Transfer Prices Transfer Amount to PSCR $Mil
81 2029 Solar Build (1) Generation 1,000 MWh82 2019 MPSC Staff Transfer Prices Transfer Amount to PSCR $Mil
83 MIGreenPower Subscribed Solar Subscribed Generation 1,000 MWh84 2014 MPSC Staff Transfer Prices Transfer Amount to PSCR $Mil
85 VGP Subscribed Solar Subscribed Generation 1,000 MWh86 Transfer Amount to PSCR $Mil
87 Generation - Owned (excluding VGPs) 1,000 MWh88 PSCR Transfer Expense - Owned $Mil
89 Total Generation (excluding VGPs) 1,000 MWh90 Total PSCR Transfer Expense $Mil
Case No.: U-20851Attachment: 9
Witness: M. J. RivardPage: 4 of 4
(k) (l) (m) (n) (o) (p) (q)
2023 2024 2025 2026 2027 2028 2029
255.8 256.5 255.8 255.8 255.8 256.5 170.6 28.4$ 30.0$ 30.3$ 31.4$ 32.7$ 35.0$ 24.3$
412.0 413.2 412.0 412.0 412.0 413.2 274.7 45.8$ 48.3$ 48.7$ 50.6$ 52.7$ 27.5$ 18.3$
391.6 392.7 391.6 391.6 391.6 392.7 261.1 30.9$ 31.6$ 32.2$ 32.8$ 22.9$ 23.0$ 15.3$
258.1 258.8 258.1 258.1 258.1 258.8 172.0 20.3$ 20.8$ 21.2$ 13.4$ 13.4$ 13.4$ 8.9$
171.3 171.8 171.3 171.3 171.3 171.8 114.2 9.4$ 9.4$ 9.4$ 9.4$ 9.4$ 9.4$ 6.3$
423.9 425.1 423.9 423.9 423.9 425.1 282.6 22.0$ 36.0$ 22.0$ 22.0$ 22.0$ 22.1$ 14.7$
502 504 502 502 502 504 335 23.1$ 23.2$ 23.1$ 23.1$ 23.1$ 23.2$ 15.4$
248 248 248 248 248 248 165 11.2$ 11.2$ 11.2$ 11.2$ 11.2$ 11.2$ 7.5$
488 489 488 488 488 489 325 24.7$ 24.7$ 24.7$ 24.7$ 24.7$ 24.7$ 16.5$
460 461 460 460 460 461 306 23.3$ 23.3$ 23.3$ 23.3$ 23.3$ 23.3$ 15.5$
612 613 612 612 612 613 408 30.0$ 30.1$ 30.0$ 30.0$ 30.0$ 30.1$ 20.0$
(75) (75) (75) (75) (75) (75) (75) (4.1)$ (4.1)$ (4.1)$ (4.1)$ (4.1)$ (4.1)$ (4.1)$
(1,194.9) (1,198.2) (1,194.9) (1,194.9) (1,194.9) (1,198.2) (796.6) (59.1)$ (59.3)$ (59.1)$ (59.1)$ (59.1)$ (59.3)$ (39.4)$
15.6 15.6 15.5 15.4 15.3 15.3 10.1 4.5$ 4.7$ 4.8$ 5.0$ 5.1$ 5.4$ 3.7$
1.5 1.5 1.5 1.5 1.5 1.5 1.0 0.1$ 0.1$ 0.1$ 0.1$ 0.1$ 0.1$ 0.1$
68.1 67.9 67.4 67.0 66.7 66.5 44.0 5.4$ 5.5$ 5.6$ 5.7$ 5.8$ 5.9$ 4.0$
1.1 1.1 1.1 1.0 1.0 1.0 0.7 0.1$ 0.1$ 0.1$ 0.1$ 0.1$ 0.1$ 0.1$
19.1 19.0 18.9 18.8 18.7 18.7 12.3 1.3$ 1.4$ 1.4$ 1.4$ 1.4$ 1.5$ 1.0$
246.1 245.6 243.7 242.4 241.2 240.7 159.2 13.3$ 13.3$ 13.2$ 13.1$ 13.0$ 13.0$ 8.6$
414.9 413.9 410.8 408.7 406.7 405.7 268.4 21.1$ 21.0$ 20.9$ 20.8$ 20.7$ 20.6$ 13.6$
10.8 129.3 128.3 127.7 127.1 126.8 83.9 0.6$ 6.9$ 6.9$ 6.8$ 6.8$ 6.8$ 4.5$
- 32.0 380.7 378.8 376.9 376.1 248.8 - 2.0$ 23.6$ 23.5$ 23.4$ 23.3$ 15.4$
- - 23.0 274.3 272.9 272.3 180.1 - - 1.4$ 17.1$ 17.0$ 17.0$ 11.2$
- - - - - - - - - - -$ -$ -$ -$
- - - - - - - - - - - -$ -$ -$
- - - - - - - - - - - - -$ -$
- - - - - - - - - - - - - -$
(68.1) (67.9) (67.4) (67.0) (66.7) (66.5) (44.0) (5.4)$ (5.5)$ (5.6)$ (5.7)$ (5.8)$ (5.9)$ (4.0)$
(671.8) (820.8) (1,186.4) (1,431.9) (1,424.8) (1,421.5) (940.4) (35.0)$ (43.2)$ (66.0)$ (81.3)$ (80.9)$ (80.7)$ (53.4)$
2,988.8 2,997.0 2,988.4 2,988.2 2,988.1 2,996.3 1,966.8 211.9$ 231.7$ 219.3$ 215.1$ 208.9$ 186.6$ 123.9$
4,846.9 4,858.2 4,844.0 4,842.5 4,841.0 4,852.3 3,200.4 333.1$ 353.8$ 341.3$ 337.3$ 331.2$ 309.4$ 205.6$
1
STATE OF MICHIGAN
BEFORE THE MICHIGAN PUBLIC SERVICE COMMISSION In the matter of DTE ELECTRIC COMPANY’S ) application for the regulatory reviews, revisions, ) determinations, and/or approvals necessary for ) Case No. U-20851 to fully comply with Public Act 295 of 2008 )
AFFIDAVIT OF SHERRI L. WISNIEWSKI IN SUPPORT OF DTE ELECTRIC COMPANY’S APPLICATION FOR APPROVAL OF THE AUGUST 2020 AMENDED
RENEWABLE ENERGY PLAN
STATE OF MICHIGAN ) ) COUNTY OF WAYNE )
Sherri L. Wisniewski, being first duly sworn, deposes and says:
1. My title is Director of Tax Operations. I received a Bachelor of Business
Administration Degree from Western Michigan University in 1993 and a Master of Business
Administration from the University of Michigan in 1998. I have been with DTE Energy Company
in the Tax Department since 1996. As the Director of Tax Operations, I am responsible for tax
accounting, tax forecasting, and regulatory tax.
2. I have sponsored testimony in numerous cases before the Michigan Public Service
Commission (MPSC or Commission).
3. The purpose of my affidavit is to incorporate the impacts to deferred taxes,
investment tax credits, and property taxes resulting from including the tax equity structure related
to the Company-owned Volunteer Green Program (“VGP”) assets set forth in Mr. Harwood’s
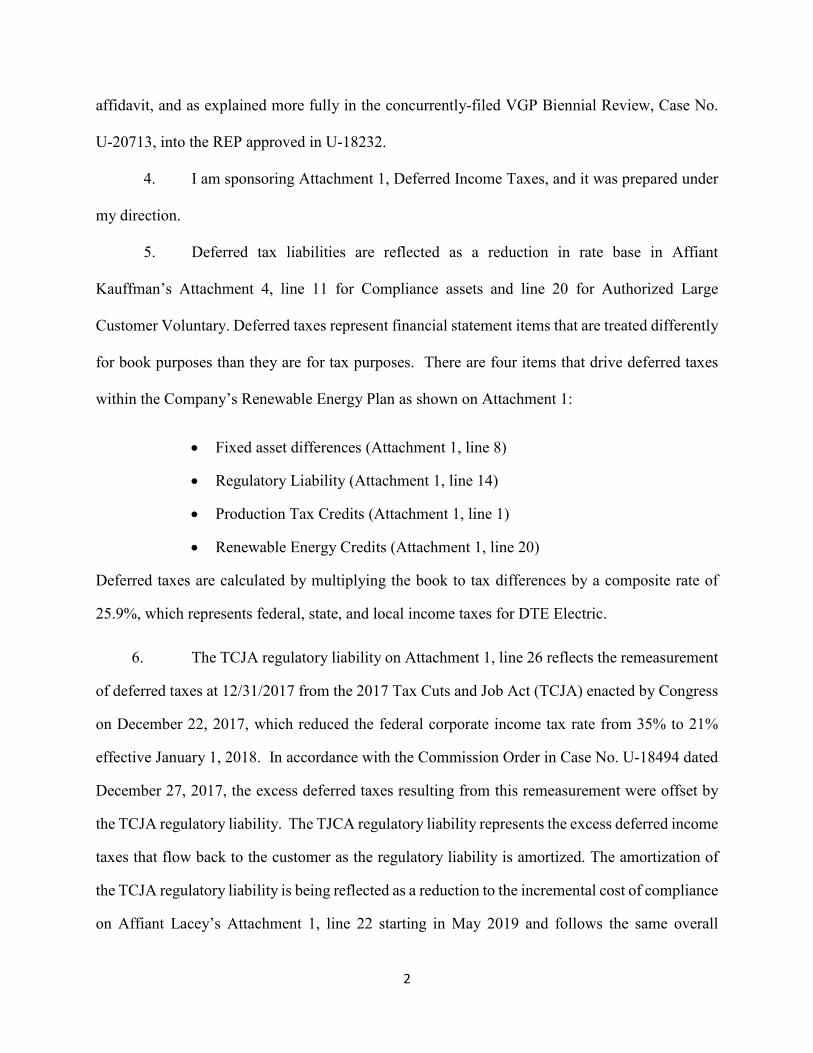
2
affidavit, and as explained more fully in the concurrently-filed VGP Biennial Review, Case No.
U-20713, into the REP approved in U-18232.
4. I am sponsoring Attachment 1, Deferred Income Taxes, and it was prepared under
my direction.
5. Deferred tax liabilities are reflected as a reduction in rate base in Affiant
Kauffman’s Attachment 4, line 11 for Compliance assets and line 20 for Authorized Large
Customer Voluntary. Deferred taxes represent financial statement items that are treated differently
for book purposes than they are for tax purposes. There are four items that drive deferred taxes
within the Company’s Renewable Energy Plan as shown on Attachment 1:
• Fixed asset differences (Attachment 1, line 8)
• Regulatory Liability (Attachment 1, line 14)
• Production Tax Credits (Attachment 1, line 1)
• Renewable Energy Credits (Attachment 1, line 20)
Deferred taxes are calculated by multiplying the book to tax differences by a composite rate of
25.9%, which represents federal, state, and local income taxes for DTE Electric.
6. The TCJA regulatory liability on Attachment 1, line 26 reflects the remeasurement
of deferred taxes at 12/31/2017 from the 2017 Tax Cuts and Job Act (TCJA) enacted by Congress
on December 22, 2017, which reduced the federal corporate income tax rate from 35% to 21%
effective January 1, 2018. In accordance with the Commission Order in Case No. U-18494 dated
December 27, 2017, the excess deferred taxes resulting from this remeasurement were offset by
the TCJA regulatory liability. The TJCA regulatory liability represents the excess deferred income
taxes that flow back to the customer as the regulatory liability is amortized. The amortization of
the TCJA regulatory liability is being reflected as a reduction to the incremental cost of compliance
on Affiant Lacey’s Attachment 1, line 22 starting in May 2019 and follows the same overall

3
methodology approved in the Commission’s May 2, 2019 order in Case No. U-20162. Since the
amortization of the TCJA regulatory liability is post tax adjustments, in order to include it in the
pre-tax incremental cost of compliance, it must be grossed up (increased) for taxes. This gross up
decreases the revenue requirement included in the Renewable Energy Plan Surcharge and ensures
DTE Electric does not earn above its authorized return for this amortization.
7. Based on current law, DTE Electric can earn an Investment Tax Credit (ITC) for a
portion of the expenditures made in placing solar energy property in service. The ITC for solar
energy property is determined by multiplying the applicable solar tax credit percentage by the ITC-
eligible basis of the solar energy property placed in service during that year. The ITC is recorded
in an accumulated deferred investment tax credit account and amortized as a reduction to expense
over the book life of the assets under the normalization rules issued by the Internal Revenue
Service. The accumulated deferred investment tax credit account will be reflected as a source of
financing in the REP capital structure, and the cost of capital assigned to the accumulated deferred
investment tax credit will be equal to the weighted cost of capital excluding the ITC. This ensures
there is no impact to the program’s rate of return or total capital structure. ITCs reduce the
incremental cost of compliance as they are amortized over the book life of the assets. The
amortization of ITC begins the year in which DTE Electric can utilize the ITC to reduce income
taxes payable on a tax return. The reduction to the incremental cost of compliance for ITCs is
shown on Company Affiant Mr. Lacey’s Attachment 1 line 11. The ITC amount on Mr. Lacey’s
Attachment 1, line 11, is calculated by taking the amortization of the ITC and grossing it up. Since
the amortization of the ITC is post tax adjustments, in order to include them in the pre-tax
incremental cost of compliance, they must be grossed up (increased) for taxes. This gross up
decreases the revenue requirement included in the Renewable Energy Plan Surcharge and ensures
DTE Electric does not earn above its authorized return for this item when the credits are applied
to net income.

4
11. Property tax liability represents the amount of property taxes payable to local
governments, whereas property tax expense refers to the amount of property taxes deducted for
book purposes. Property tax liability is calculated by multiplying the forecasted taxable value of
the ending plant in service and CWIP by the historical composite millage rate. The property tax
liability is expensed over a two-year period, with the liability of each year being expensed 39%
the current year and 61% the subsequent year. The property tax expense is shown on Affiant
Kauffman’s Attachment 1, line 5 which is carried to Affiant Lacey’s Attachment 2, line 19.
12. Based upon my knowledge and experience, the impacts to deferred taxes,
investment tax credits, and property taxes resulting from including the tax equity structure related
to Company-owned VGP solar assets into the REP approved in U-18232 are reasonable and
prudent and I recommend that the Commission approve the Company’s August 2020 Amended
Renewable Energy Plan reflecting these impacts.
Further, Affiant sayeth not.
________________________________ Sherri L. Wisniewski Subscribed and sworn to before me this 31st day of August 2020. ___________________________ Estella R. Branson, Notary Public Oakland County, Michigan My Commission Expires: 10-26-2023 Acting in Wayne County

Michigan Public Service Commission Case No.: U-20851
DTE Electric Company Attachment: 1
2016 PA 342 Renewable Energy Plan - August 2020 Amended REP Affiant: S. L. Wisniewski
Tax Credits & Deferred Income Taxes Page: 1 of 2($ Millions, except where noted)
(a) (b) (c) (d) (e) (f) (g)As Filed As Filed As Filed As Filed
LineNo. Description 2016 2017 2018 2019 2020 2021
1 Deferred Tax Asset - PTC 2 Beginning Balance 30.9 61.3 97.3 132.5 146.7 187.9 3 Generated 30.4 36.0 35.2 45.7 60.2 91.2 4 Utilized - - - (31.5) (19.0) (12.0) 5 Ending Balance 61.3 97.3 132.5 146.7 187.9 267.1 6 Average Balance 46.1 79.3 114.9 139.6 167.3 227.5 78 Deferred Tax Liability - Plant 9 Beginning Balance (206.4) (244.3) (193.7) (207.2) (222.5) (277.6)
10 Book / Tax Timing Difference (Note 1) (37.9) (46.2) (13.5) (15.4) (55.0) (84.5) 11 Re-measurement Adjustment 96.8 - 12 Ending Balance (244.3) (193.7) (207.2) (222.5) (277.6) (362.1) 13 Average Balance (225.4) (219.0) (200.4) (214.9) (250.1) (319.8)
14 Deferred Tax Asset - Reg. Liability 15 Beginning Balance 76.7 57.1 29.5 22.9 14.6 7.4 16 Reg Liability Activity (19.6) (12.9) (6.6) (8.2) (8.1) 4.0 17 Re-measurement Adjustment (14.7) 0.9 18 Ending Balance 57.1 29.5 22.9 14.6 7.4 11.4 19 Average Balance 66.9 43.3 26.2 18.8 11.0 9.4
20 Deferred Tax Asset - Renewable Energy Credits21 Beginning Balance (6.1) (4.7) (0.8) (1.7) (2.1) (2.1) 22 Renewable Energy Credit Activity 1.4 3.4 (0.9) (0.4) 23 Re-measurement Adjustment 0.4 24 Ending Balance (4.7) (0.8) (1.7) (2.1) (2.1) (2.1) 25 Average Balance (5.4) (2.8) (1.3) (1.9) (2.1) (2.1)
26 TCJA Tax Regulatory Liability 27 Beginning Balance - (82.5) (82.5) (82.2) (81.0) 28 Amortization - 0.4 2.0 2.2 29 Re-measurement Adjustment - (82.5) - - (0.9) 30 Ending Balance - (82.5) (82.5) (82.2) (81.0) (78.8) 31 Average Balance - (41.3) (82.5) (82.4) (81.6) (79.9)
32 Total Deferred Taxes - Ending Balance (130.6) (150.3) (136.1) (145.5) (165.4) (164.5)
33 Total Average Deferred Taxes - Rate Base (117.8) (140.4) (143.2) (140.8) (155.4) (164.9)
34 Note 135 Tax Depreciation - Compliance 131.5 122.0 103.7 110.6 159.6 219.5 36 Tax Depreciation - Authorized Voluntary - - - - 127.9 206.1 37 Book Depreciation 40.0 44.1 46.4 52.1 75.3 101.6 38 Difference (91.5) (77.9) (57.3) (58.5) (212.2) (324.0) 39 Effective Tax Rate 39.0% 39.0% 25.9% 25.9% 25.9% 25.9%40 Deferred Tax (Expense) / Income (35.7) (30.4) (14.8) (15.2) (55.0) (84.0) 41 Deferred Taxes - Other Adjustments (2.2) (15.8) 1.3 (0.2) (0.1) (0.5) 42 Deferred Tax Activity - Plant (37.9) (46.2) (13.5) (15.4) (55.0) (84.5)
(0) (0) 0 - - -
Before AfterDeferred Tax Liability Tax Reform Tax ReformDeferred Tax Liability (150.3) (67.7) Tax Reform Regulatory Liability - (82.5)
Total Deferred Tax Liability (150.3) (150.3) -
Composite Tax Rate 39.0% 39.0% 25.9% 25.9% 25.9% 25.9%
1/ Deferred Tax Asset & Liability balances at 12/31/2017 was re-measured to reflect the impact of the 2017 Tax Cut and Job Act (TCJA) as follows:

Michigan Public Service Commission
DTE Electric Company 2016 PA 342 Renewable Energy Plan - August 2020 Amended REP
Tax Credits & Deferred Income Taxes($ Millions, except where noted)
(a)
LineNo. Description
1 Deferred Tax Asset - PTC2 Beginning Balance3 Generated4 Utilized5 Ending Balance6 Average Balance78 Deferred Tax Liability - Plant 9 Beginning Balance
10 Book / Tax Timing Difference (Note 1)11 Re-measurement Adjustment 12 Ending Balance13 Average Balance
14 Deferred Tax Asset - Reg. Liability 15 Beginning Balance16 Reg Liability Activity17 Re-measurement Adjustment 18 Ending Balance19 Average Balance
20 Deferred Tax Asset - Renewable Energy Credits21 Beginning Balance22 Renewable Energy Credit Activity23 Re-measurement Adjustment 24 Ending Balance25 Average Balance
26 TCJA Tax Regulatory Liability 27 Beginning Balance28 Amortization29 Re-measurement Adjustment 30 Ending Balance31 Average Balance
32 Total Deferred Taxes - Ending Balance
33 Total Average Deferred Taxes - Rate Base
34 Note 135 Tax Depreciation - Compliance36 Tax Depreciation - Authorized Voluntary37 Book Depreciation38 Difference39 Effective Tax Rate40 Deferred Tax (Expense) / Income41 Deferred Taxes - Other Adjustments42 Deferred Tax Activity - Plant
Deferred Tax LiabilityDeferred Tax LiabilityTax Reform Regulatory Liability Total Deferred Tax Liability
Composite Tax Rate
1/ Deferred Tax Asset & Liability balances at 12/31/2017 was re-measured to reflect the impact of the 2017 Tax Cut and Job Act (TCJA) as follows:
Case No.:
Attachment:
Affiant:Page:
(h) (i) (j) (k) (l) (m) (n) (o)
2022 2023 2024 2025 2026 2027 2028 2029
267.1 305.5 363.4 365.3 364.2 347.1 311.8 274.9 95.7 89.1 76.9 75.1 75.1 70.5 73.3 40.8
(57.2) (31.3) (75.1) (76.2) (92.2) (105.8) (110.2) (120.7) 305.5 363.4 365.3 364.2 347.1 311.8 274.9 195.0 286.3 334.5 364.3 364.7 355.6 329.4 293.3 234.9
(362.1) (418.0) (454.5) (479.6) (490.6) (488.0) (479.5) (466.9) (55.9) (36.6) (25.1) (11.0) 2.6 8.6 12.6 5.5
(418.0) (454.5) (479.6) (490.6) (488.0) (479.5) (466.9) (461.4) (390.0) (436.3) (467.1) (485.1) (489.3) (483.8) (473.2) (464.1)
11.4 10.9 10.5 10.9 9.5 10.5 11.1 10.0 (0.4) (0.5) 0.4 (1.4) 1.0 0.6 (1.2) (1.5)
10.9 10.5 10.9 9.5 10.5 11.1 10.0 8.4 11.2 10.7 10.7 10.2 10.0 10.8 10.5 9.2
(2.1) (2.1) (2.1) (2.1) (2.1) (2.1) (2.1) (2.1)
(2.1) (2.1) (2.1) (2.1) (2.1) (2.1) (2.1) (2.1) (2.1) (2.1) (2.1) (2.1) (2.1) (2.1) (2.1) (2.1)
(78.8) (75.9) (73.6) (71.2) (68.8) (66.4) (64.0) (61.6) 2.8 2.4 2.4 2.4 2.4 2.4 2.4 1.6
(75.9) (73.6) (71.2) (68.8) (66.4) (64.0) (61.6) (60.0) (77.4) (74.8) (72.4) (70.0) (67.6) (65.2) (62.8) (60.8)
(179.5) (156.3) (176.7) (187.8) (198.9) (222.6) (245.7) (320.0)
(172.0) (167.9) (166.5) (182.2) (193.4) (210.8) (234.2) (282.9)
203.9 141.7 105.2 80.1 49.2 31.7 32.5 33.4 126.5 122.5 120.0 97.7 79.4 74.9 59.5 39.7 115.3 123.2 128.6 135.4 138.7 139.6 140.6 94.3
(215.1) (141.0) (96.6) (42.5) 10.1 33.0 48.5 21.3 25.9% 25.9% 25.9% 25.9% 25.9% 25.9% 25.9% 25.9%(55.7) (36.5) (25.0) (11.0) 2.6 8.6 12.6 5.5
(0.2) (0.0) (0.0) (0.0) - - - - (55.9) (36.6) (25.1) (11.0) 2.6 8.6 12.6 5.5
- - - - 0 - - -
25.9% 25.9% 25.9% 25.9% 25.9% 25.9% 25.9% 25.9%
2 of 2
U-20851
1
S. L. Wisniewski
STATE OF MICHIGAN
BEFORE THE MICHIGAN PUBLIC SERVICE COMMISSION
In the matter of DTE ELECTRIC COMPANY’S ) application for the regulatory reviews, revisions, ) determinations, and/or approvals necessary for ) Case No. U-20851 to fully comply with Public Act 295 of 2008 )
PROOF OF SERVICE STATE OF MICHIGAN ) ) ss. COUNTY OF WAYNE )
ESTELLA R. BRANSON, being duly sworn, deposes and says that on the 31st day of
August, 2020, she served a copy of the DTE Electric Company’s Ex Parte Application and
Affidavits of David B. Harwood, Patrick D. Kauffman, Thomas W. Lacey, Marcus J. Rivard, and
Sherri L. Wisniewski, via electronic mail upon the persons referred to in the attached service list.
______ ESTELLA R. BRANSON
Subscribed and sworn to before me this 31st day of August, 2020 Karyn B. Kazyaka, Notary Public Macomb County, Michigan My Commission Expires: 7-21-2023 Acting in Wayne County

MPSC Case No. U-20561 Page 1
ENVIRONMENTAL LAW & POLICY CENTER; VOTE SOLAR; THE ECOLOGY CENTER;SOLAR ENERGY INDUSTRIES ASSOCIATION Margrethe Kearney 1514 Wealthy Street SE, Suite 256 Grand Rapids, MI 49506 [email protected] GERONIMO ENERGY Timothy J. Lundgren Laura Chappell Varnum LLP 201 N. Washington Square, Suite 910 Lansing, MI 48933 [email protected] [email protected] GREAT LAKES RENEWABLE ENERGY ASSOCIATION Don L. Keskey Brian W. Coyer Public Law Resource Center PLLC University Office Place 333 Albert Avenue, Suite 425 East Lansing, MI 48823 [email protected] [email protected] MICHIGAN ATTORNEY GENERAL Joel King Assistant Attorney General G. Mennen Williams Bldg. 525 W. Ottawa Street, 6th Floor P.O. Box 30755 Lansing, MI 48909 [email protected] [email protected]
NRDC Christopher M. Bzdok Lydia Barbara-Riley Olson, Bzdok & Howard, P.C. 420 East Front Street Traverse City, MI 49686 [email protected] [email protected] [email protected] [email protected] [email protected] MPSC STAFF Amit T. Singh Spencer A. Sattler 7109 West Saginaw Hwy, 3rd Floor Lansing, MI 48917 [email protected] [email protected] PINE GATE RENEWABLES LLC Jennifer Utter Heston Fraser Trebilcock Davis & Dunlap, P.C. 124 W. Allegan Street, Ste. 1000 Lansing, MI 48933 [email protected] SOULARDARITY Nick Leonard Executive Director Great Lakes Environmental Law Center 4444 Second Avenue Detroit, MI 48201 [email protected] Robert A. Weinstock Mark N. Templeton Rebecca J. Boyd 6020 South University Avenue Chicago, IL 60637 [email protected] [email protected] [email protected]